
CoinsProbe
3.5k Posts

CoinsProbe
 Square Verified+
Report
Block User
Coinsprobe is the leading cryptocurrency platform that provides the latest news, breakouts, price predictions, airdrops, events, and ICO presales.
1 Following
9.8K+ Followers
12.7K+ Liked
Posts
·
--
Article
SOL Hits 200-Day MA as RSI Enters Oversold — Two Classic Dip Signals AlignKey Highlights
SOL is trading at $90.07, down 5.28% in 24 hours, as price touches the 200-Day Moving Average on the daily chartRSI has entered oversold territory simultaneously — a dual-signal confluence flagged by an analyst who called this setup on Oct 7, 2026Solana's ecosystem shows $5.32B TVL and $71.34M in 7-day fees per DeFiLlama — no fundamental deterioration behind the -22.79% correctionSOL spot ETFs recorded 5 consecutive outflow days totaling $11.9M — institutional redemptions a contributing factor to the decline
Solana is trading at $90.07, down 5.28% in the past 24 hours and sitting on one of the most closely watched technical levels in its current structure: the 200-Day Moving Average. When the daily RSI simultaneously enters oversold territory at the same level, it creates the kind of confluence that has historically separated recoverable dips from genuine trend breaks.
An analyst flagged both conditions simultaneously on the 1D chart, noting that SOL has hit the 200-Day MA with RSI now in oversold territory — a setup he previously highlighted on October 7, 2026 as “the dip you want to buy.” The two signals arriving together on the daily timeframe are not coincidental — they reflect simultaneous price exhaustion and momentum depletion at a structurally significant level.
Signal 1 — The 200-Day Moving Average: Where Long-Term Trend Meets Price
The 200-Day Moving Average is not an oscillator and carries no directional bias — it is a smoothed representation of the average closing price across the prior 200 sessions. What makes it significant is institutional and algorithmic recognition: it is the most widely tracked trend-health benchmark across equities, commodities, and crypto. When price touches it after an extended decline, it represents a potential equilibrium test between buyers who define long-term trend as intact and sellers who believe trend has broken.
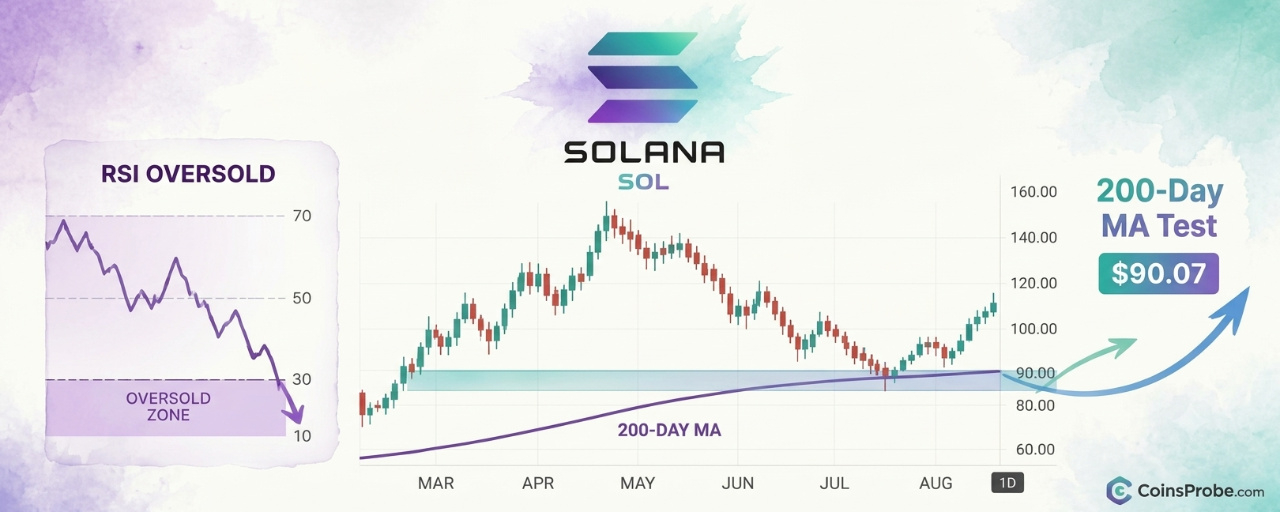
The 1D chart shows SOL’s current price at $90.07 sitting directly at the EMA200, with price also confirmed above the MA200 — meaning the two moving average variants are fractionally separated with price at the upper (EMA200) boundary. The chart also shows a shaded support rectangle near the current price level, indicating a demand zone coinciding with this moving average test. A -22.79% annotation on the chart captures the magnitude of the decline from the recent high into this support zone — a correction steep enough to trigger oversold conditions on the momentum oscillator.
SOL/USDT Chart Analysis | Source: @CryptoBullet1 (X)
Critically, this is not the first time SOL has tested this configuration. The asset has previously used 200-Day MA touches as staging areas for recovery moves. For context on the broader recovery potential, prior analysis noted that SOL’s cup-and-handle structure was projecting a bounce toward $145 — a target that only remains viable if the current support holds.
Signal 2 — RSI Oversold: Momentum Exhaustion, Not a Direction Call
The Relative Strength Index measures the speed and magnitude of recent price changes on a 0–100 scale. Readings below 30 are classified as oversold — not a prediction that price will rise, but a quantitative statement that selling pressure has become statistically extreme relative to recent history. The chart’s RSI panel shows a “Bear Div” label printed on the chart, indicating that prior to the current decline, RSI was making lower highs while price made higher highs — a bearish divergence that the chart correctly anticipated the pullback that followed.
Now, with RSI having entered oversold territory during the decline, the divergence has resolved. The current oversold reading means the momentum that drove the -22.79% correction has reached an intensity that has historically preceded at minimum a relief bounce. Combined with the 200-Day MA test, the two signals address different dimensions of the same setup: the MA addresses where price is structurally, and the RSI addresses how hard it has been sold to get there.
On-Chain and ETF Context — Fundamental Backdrop
The technical setup is occurring against a measurable fundamental backdrop. DeFiLlama data shows Solana’s ecosystem carrying $5.32B in total value locked, with $2.20B in 24-hour DEX volume and $9.64M in 24-hour fees generated. Weekly fees across the seven-day window reached $71.34M — a figure that reflects continued network utilization even during the price correction. These are not metrics consistent with a chain in fundamental distress.
The ETF picture is less supportive in the near term. Data via SoSoValue shows $SOL spot ETFs recorded a daily net outflow of $1.2M on November 5, 2026, with five consecutive outflow days totaling $11.9M over the prior week. Total ETF net assets stand at $1.33B against $1.47B in cumulative net inflows since launch — meaning the product is marginally underwater relative to aggregate inflows, which explains some of the near-term selling pressure. This ETF outflow context is worth holding alongside the technical signals: the dip is real, and institutional redemption pressure has been a contributing factor.
The macro calendar adds another variable. Nonfarm Payrolls were due November 6 — the same day this analysis was published — with CPI following on November 10 and PPI on November 13. Risk assets including crypto have historically responded to labor and inflation data prints, and a hotter-than-expected jobs number could extend selling pressure before any technical bounce materializes. The RSI and 200-Day MA signals flag exhaustion of the existing move — they do not insulate SOL from new macro-driven downside if macro data surprises to the upside.
It is also worth noting the broader context around Solana’s ecosystem sell pressure. Prior reporting tracked Pump.fun’s sustained SOL sales to Kraken totaling $875.5M — a persistent supply-side pressure that has been a structural feature of Solana’s market, separate from broader sentiment.
What the Two Signals Together Say — And What They Don’t
The 200-Day MA and RSI oversold reading are non-directional in isolation. Together, they construct a specific conditional picture: price has declined -22.79% into a historically recognized support structure while momentum has reached statistical exhaustion. This configuration has preceded recoveries. It has also preceded continuations lower when macro conditions or project-specific catalysts overrode technical support.
What the signals confirm: the dip has been severe enough to exhaust momentum at a structurally significant moving average. What they do not confirm: that the dip is over. The bear divergence that the RSI panel labeled on the prior high correctly anticipated the decline — the current oversold reading is the resolution of that divergence, not an automatic buy trigger.
What to watch for continuation: a daily close back above the EMA200 with RSI recovering above 30 would be the minimum technical confirmation that the support has held. Without that close, the current price position remains a test, not a confirmed bounce. The prior analysis on this structure had identified a potential for deeper pullback before the next rally — the current 200-Day MA test is precisely the kind of level where that call gets resolved one way or the other.
SOL’s $5.32B TVL, $71.34M in weekly fees, and $2.20B in daily DEX volume establish that the network is functioning. The price at $90.07 is a technical event, not a fundamental collapse. But the ETF outflows, Nonfarm Payrolls timing, and unresolved macro uncertainty mean the two signals flag a setup — they do not guarantee an outcome. Watch the daily close at the EMA200 near $90 as the first confirmation level traders need to see hold.
Disclaimer: The views and analysis presented in this article are for informational purposes only and reflect the author’s perspective, not financial advice. Technical patterns and indicators discussed are subject to market volatility and may or may not yield the anticipated results. Investors are advised to exercise caution, conduct independent research, and make decisions aligned with their individual risk tolerance.
SOL Hits 200-Day MA as RSI Enters Oversold — Two Classic Dip Signals Align
Key Highlights
SOL is trading at $90.07, down 5.28% in 24 hours, as price touches the 200-Day Moving Average on the daily chartRSI has entered oversold territory simultaneously — a dual-signal confluence flagged by an analyst who called this setup on Oct 7, 2026Solana's ecosystem shows $5.32B TVL and $71.34M in 7-day fees per DeFiLlama — no fundamental deterioration behind the -22.79% correctionSOL spot ETFs recorded 5 consecutive outflow days totaling $11.9M — institutional redemptions a contributing factor to the decline
Solana is trading at $90.07, down 5.28% in the past 24 hours and sitting on one of the most closely watched technical levels in its current structure: the 200-Day Moving Average. When the daily RSI simultaneously enters oversold territory at the same level, it creates the kind of confluence that has historically separated recoverable dips from genuine trend breaks.
An analyst flagged both conditions simultaneously on the 1D chart, noting that SOL has hit the 200-Day MA with RSI now in oversold territory — a setup he previously highlighted on October 7, 2026 as “the dip you want to buy.” The two signals arriving together on the daily timeframe are not coincidental — they reflect simultaneous price exhaustion and momentum depletion at a structurally significant level.
Signal 1 — The 200-Day Moving Average: Where Long-Term Trend Meets Price
The 200-Day Moving Average is not an oscillator and carries no directional bias — it is a smoothed representation of the average closing price across the prior 200 sessions. What makes it significant is institutional and algorithmic recognition: it is the most widely tracked trend-health benchmark across equities, commodities, and crypto. When price touches it after an extended decline, it represents a potential equilibrium test between buyers who define long-term trend as intact and sellers who believe trend has broken.
The 1D chart shows SOL’s current price at $90.07 sitting directly at the EMA200, with price also confirmed above the MA200 — meaning the two moving average variants are fractionally separated with price at the upper (EMA200) boundary. The chart also shows a shaded support rectangle near the current price level, indicating a demand zone coinciding with this moving average test. A -22.79% annotation on the chart captures the magnitude of the decline from the recent high into this support zone — a correction steep enough to trigger oversold conditions on the momentum oscillator.
SOL/USDT Chart Analysis | Source: @CryptoBullet1 (X)
Critically, this is not the first time SOL has tested this configuration. The asset has previously used 200-Day MA touches as staging areas for recovery moves. For context on the broader recovery potential, prior analysis noted that SOL’s cup-and-handle structure was projecting a bounce toward $145 — a target that only remains viable if the current support holds.
Signal 2 — RSI Oversold: Momentum Exhaustion, Not a Direction Call
The Relative Strength Index measures the speed and magnitude of recent price changes on a 0–100 scale. Readings below 30 are classified as oversold — not a prediction that price will rise, but a quantitative statement that selling pressure has become statistically extreme relative to recent history. The chart’s RSI panel shows a “Bear Div” label printed on the chart, indicating that prior to the current decline, RSI was making lower highs while price made higher highs — a bearish divergence that the chart correctly anticipated the pullback that followed.
Now, with RSI having entered oversold territory during the decline, the divergence has resolved. The current oversold reading means the momentum that drove the -22.79% correction has reached an intensity that has historically preceded at minimum a relief bounce. Combined with the 200-Day MA test, the two signals address different dimensions of the same setup: the MA addresses where price is structurally, and the RSI addresses how hard it has been sold to get there.
On-Chain and ETF Context — Fundamental Backdrop
The technical setup is occurring against a measurable fundamental backdrop. DeFiLlama data shows Solana’s ecosystem carrying $5.32B in total value locked, with $2.20B in 24-hour DEX volume and $9.64M in 24-hour fees generated. Weekly fees across the seven-day window reached $71.34M — a figure that reflects continued network utilization even during the price correction. These are not metrics consistent with a chain in fundamental distress.
The ETF picture is less supportive in the near term. Data via SoSoValue shows $SOL spot ETFs recorded a daily net outflow of $1.2M on November 5, 2026, with five consecutive outflow days totaling $11.9M over the prior week. Total ETF net assets stand at $1.33B against $1.47B in cumulative net inflows since launch — meaning the product is marginally underwater relative to aggregate inflows, which explains some of the near-term selling pressure. This ETF outflow context is worth holding alongside the technical signals: the dip is real, and institutional redemption pressure has been a contributing factor.
The macro calendar adds another variable. Nonfarm Payrolls were due November 6 — the same day this analysis was published — with CPI following on November 10 and PPI on November 13. Risk assets including crypto have historically responded to labor and inflation data prints, and a hotter-than-expected jobs number could extend selling pressure before any technical bounce materializes. The RSI and 200-Day MA signals flag exhaustion of the existing move — they do not insulate SOL from new macro-driven downside if macro data surprises to the upside.
It is also worth noting the broader context around Solana’s ecosystem sell pressure. Prior reporting tracked Pump.fun’s sustained SOL sales to Kraken totaling $875.5M — a persistent supply-side pressure that has been a structural feature of Solana’s market, separate from broader sentiment.
What the Two Signals Together Say — And What They Don’t
The 200-Day MA and RSI oversold reading are non-directional in isolation. Together, they construct a specific conditional picture: price has declined -22.79% into a historically recognized support structure while momentum has reached statistical exhaustion. This configuration has preceded recoveries. It has also preceded continuations lower when macro conditions or project-specific catalysts overrode technical support.
What the signals confirm: the dip has been severe enough to exhaust momentum at a structurally significant moving average. What they do not confirm: that the dip is over. The bear divergence that the RSI panel labeled on the prior high correctly anticipated the decline — the current oversold reading is the resolution of that divergence, not an automatic buy trigger.
What to watch for continuation: a daily close back above the EMA200 with RSI recovering above 30 would be the minimum technical confirmation that the support has held. Without that close, the current price position remains a test, not a confirmed bounce. The prior analysis on this structure had identified a potential for deeper pullback before the next rally — the current 200-Day MA test is precisely the kind of level where that call gets resolved one way or the other.
SOL’s $5.32B TVL, $71.34M in weekly fees, and $2.20B in daily DEX volume establish that the network is functioning. The price at $90.07 is a technical event, not a fundamental collapse. But the ETF outflows, Nonfarm Payrolls timing, and unresolved macro uncertainty mean the two signals flag a setup — they do not guarantee an outcome. Watch the daily close at the EMA200 near $90 as the first confirmation level traders need to see hold.
Disclaimer: The views and analysis presented in this article are for informational purposes only and reflect the author’s perspective, not financial advice. Technical patterns and indicators discussed are subject to market volatility and may or may not yield the anticipated results. Investors are advised to exercise caution, conduct independent research, and make decisions aligned with their individual risk tolerance.
SOL is trading at $90.07, down 5.28% in 24 hours, as price touches the 200-Day Moving Average on the daily chartRSI has entered oversold territory simultaneously — a dual-signal confluence flagged by an analyst who called this setup on Oct 7, 2026Solana's ecosystem shows $5.32B TVL and $71.34M in 7-day fees per DeFiLlama — no fundamental deterioration behind the -22.79% correctionSOL spot ETFs recorded 5 consecutive outflow days totaling $11.9M — institutional redemptions a contributing factor to the decline
Solana is trading at $90.07, down 5.28% in the past 24 hours and sitting on one of the most closely watched technical levels in its current structure: the 200-Day Moving Average. When the daily RSI simultaneously enters oversold territory at the same level, it creates the kind of confluence that has historically separated recoverable dips from genuine trend breaks.
An analyst flagged both conditions simultaneously on the 1D chart, noting that SOL has hit the 200-Day MA with RSI now in oversold territory — a setup he previously highlighted on October 7, 2026 as “the dip you want to buy.” The two signals arriving together on the daily timeframe are not coincidental — they reflect simultaneous price exhaustion and momentum depletion at a structurally significant level.
Signal 1 — The 200-Day Moving Average: Where Long-Term Trend Meets Price
The 200-Day Moving Average is not an oscillator and carries no directional bias — it is a smoothed representation of the average closing price across the prior 200 sessions. What makes it significant is institutional and algorithmic recognition: it is the most widely tracked trend-health benchmark across equities, commodities, and crypto. When price touches it after an extended decline, it represents a potential equilibrium test between buyers who define long-term trend as intact and sellers who believe trend has broken.
The 1D chart shows SOL’s current price at $90.07 sitting directly at the EMA200, with price also confirmed above the MA200 — meaning the two moving average variants are fractionally separated with price at the upper (EMA200) boundary. The chart also shows a shaded support rectangle near the current price level, indicating a demand zone coinciding with this moving average test. A -22.79% annotation on the chart captures the magnitude of the decline from the recent high into this support zone — a correction steep enough to trigger oversold conditions on the momentum oscillator.
SOL/USDT Chart Analysis | Source: @CryptoBullet1 (X)
Critically, this is not the first time SOL has tested this configuration. The asset has previously used 200-Day MA touches as staging areas for recovery moves. For context on the broader recovery potential, prior analysis noted that SOL’s cup-and-handle structure was projecting a bounce toward $145 — a target that only remains viable if the current support holds.
Signal 2 — RSI Oversold: Momentum Exhaustion, Not a Direction Call
The Relative Strength Index measures the speed and magnitude of recent price changes on a 0–100 scale. Readings below 30 are classified as oversold — not a prediction that price will rise, but a quantitative statement that selling pressure has become statistically extreme relative to recent history. The chart’s RSI panel shows a “Bear Div” label printed on the chart, indicating that prior to the current decline, RSI was making lower highs while price made higher highs — a bearish divergence that the chart correctly anticipated the pullback that followed.
Now, with RSI having entered oversold territory during the decline, the divergence has resolved. The current oversold reading means the momentum that drove the -22.79% correction has reached an intensity that has historically preceded at minimum a relief bounce. Combined with the 200-Day MA test, the two signals address different dimensions of the same setup: the MA addresses where price is structurally, and the RSI addresses how hard it has been sold to get there.
On-Chain and ETF Context — Fundamental Backdrop
The technical setup is occurring against a measurable fundamental backdrop. DeFiLlama data shows Solana’s ecosystem carrying $5.32B in total value locked, with $2.20B in 24-hour DEX volume and $9.64M in 24-hour fees generated. Weekly fees across the seven-day window reached $71.34M — a figure that reflects continued network utilization even during the price correction. These are not metrics consistent with a chain in fundamental distress.
The ETF picture is less supportive in the near term. Data via SoSoValue shows $SOL spot ETFs recorded a daily net outflow of $1.2M on November 5, 2026, with five consecutive outflow days totaling $11.9M over the prior week. Total ETF net assets stand at $1.33B against $1.47B in cumulative net inflows since launch — meaning the product is marginally underwater relative to aggregate inflows, which explains some of the near-term selling pressure. This ETF outflow context is worth holding alongside the technical signals: the dip is real, and institutional redemption pressure has been a contributing factor.
The macro calendar adds another variable. Nonfarm Payrolls were due November 6 — the same day this analysis was published — with CPI following on November 10 and PPI on November 13. Risk assets including crypto have historically responded to labor and inflation data prints, and a hotter-than-expected jobs number could extend selling pressure before any technical bounce materializes. The RSI and 200-Day MA signals flag exhaustion of the existing move — they do not insulate SOL from new macro-driven downside if macro data surprises to the upside.
It is also worth noting the broader context around Solana’s ecosystem sell pressure. Prior reporting tracked Pump.fun’s sustained SOL sales to Kraken totaling $875.5M — a persistent supply-side pressure that has been a structural feature of Solana’s market, separate from broader sentiment.
What the Two Signals Together Say — And What They Don’t
The 200-Day MA and RSI oversold reading are non-directional in isolation. Together, they construct a specific conditional picture: price has declined -22.79% into a historically recognized support structure while momentum has reached statistical exhaustion. This configuration has preceded recoveries. It has also preceded continuations lower when macro conditions or project-specific catalysts overrode technical support.
What the signals confirm: the dip has been severe enough to exhaust momentum at a structurally significant moving average. What they do not confirm: that the dip is over. The bear divergence that the RSI panel labeled on the prior high correctly anticipated the decline — the current oversold reading is the resolution of that divergence, not an automatic buy trigger.
What to watch for continuation: a daily close back above the EMA200 with RSI recovering above 30 would be the minimum technical confirmation that the support has held. Without that close, the current price position remains a test, not a confirmed bounce. The prior analysis on this structure had identified a potential for deeper pullback before the next rally — the current 200-Day MA test is precisely the kind of level where that call gets resolved one way or the other.
SOL’s $5.32B TVL, $71.34M in weekly fees, and $2.20B in daily DEX volume establish that the network is functioning. The price at $90.07 is a technical event, not a fundamental collapse. But the ETF outflows, Nonfarm Payrolls timing, and unresolved macro uncertainty mean the two signals flag a setup — they do not guarantee an outcome. Watch the daily close at the EMA200 near $90 as the first confirmation level traders need to see hold.
Disclaimer: The views and analysis presented in this article are for informational purposes only and reflect the author’s perspective, not financial advice. Technical patterns and indicators discussed are subject to market volatility and may or may not yield the anticipated results. Investors are advised to exercise caution, conduct independent research, and make decisions aligned with their individual risk tolerance.
121
·
--
Article
NEAR Prints TD Sequential '9' Buy Signal After a 39% DropKey Highlights
NEAR is trading at $3.70 — down 26.08% in 30 days — after a 39.42% decline from the October $6.00 highTD Sequential '9' buy signal printed on the daily chart at $3.72 — the same indicator that called the top via Sequential Aggressive 13 on October 12First rebound target is $4.30; setup resistance trendline sits at $4.80 — a close above $4.30 is needed to validate the thesis
$NEAR Protocol is trading at $3.70 — down 6.23% in 24 hours, 13.20% over seven days, and 26.08% over the past 30 days — with a market cap of $4.85 billion. After shedding 39.42% from its October peak of $6.00 to a dotted support reference near $3.72, the daily chart has now printed a TD Sequential “9” buy signal. That is the same indicator that called the top of the prior move before the correction began.
An analyst who covers momentum signals on the NEAR daily chart flagged the setup on November 6, 2026, writing: “While the broader market remains under pressure, the TD Sequential has flashed a buy signal on $NEAR daily chart. This indicator recently anticipated a major trend shift. On October 12, it flashed a Sequential Aggressive 13” — a signal that preceded the 39.42% decline from $6.00 to $3.63. The same framework is now reading exhaustion to the downside.
The TD Sequential — What It Actually Measures
The TD Sequential counts nine consecutive daily closes in the same direction to identify momentum exhaustion — not a price level, not a support zone. A “9” buy signal means the market has closed lower for nine consecutive bars, reaching a statistical state where selling momentum is typically spent. It is a non-directional counter at its core: it marks exhaustion, not guaranteed reversal. The analyst’s prior application of this same indicator on NEAR was the Sequential Aggressive 13 on October 12 — a sell-side exhaustion count that correctly front-ran the 39.42% decline. The signal now appearing is the mirror-image count on the downside.
NEAR Protocol Daily Chart Analysis | Source: @alicharts (X)
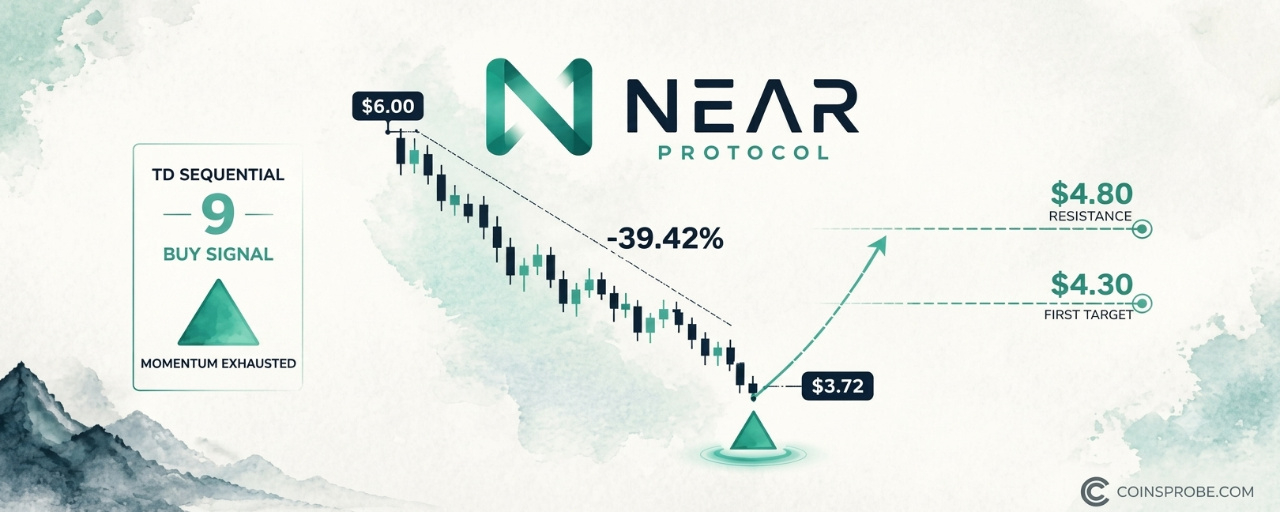
On the daily chart, the “9” count has completed with a small triangle (▲) printed beneath the most recent candles, with price sitting at the $3.72 horizontal dotted reference line — the level that marks the floor of the entire October–November decline. The chart labels visible across the decline: $6.00, $5.40, $4.80, $4.20, $3.72, $3.40 — a cascade of approximately $0.60 steps marking the structured nature of the selloff. The pattern status at time of writing is PATTERN STILL FORMING: the buy signal has printed, but no confirmed upside breakout above resistance is yet visible on the daily timeframe.
The Prior Signal — What It Said and What Followed
To assess the current signal, context from the prior count is essential. On October 12, the TD Sequential registered a Sequential Aggressive 13 — an extended exhaustion count that flags trend termination after a prolonged momentum run. NEAR was trading near $6.00 at that point. The 39.42% decline to $3.63 followed directly. That signal was not a coincidence — it was a measured count reaching its terminal state at the peak of a momentum move. The analyst’s credibility on this asset stems from that prior call. The current “9” count is a standard exhaustion signal, one step below the Aggressive 13 in intensity, but applied at what appears to be the structural low of the same correction the prior signal warned of.
NEAR had seen a dramatic run earlier in the cycle. Those interested in the protocol-level catalysts that drove the asset higher can review the full breakdown of the four catalysts behind NEAR’s 30-day 120% rally. The technical context also includes a key structural development: NEAR clearing four-year resistance and holding the backtest on the monthly chart — a level that now represents the broader structural framework within which this daily signal is occurring.
Targets — $4.30 and $4.80
The analyst identifies two levels for a potential rebound from the current buy signal. The first target is $4.30 — a recovery of approximately 16% from current price. The second level is the setup resistance trendline near $4.80, which represents the descending trendline that capped every rally attempt during the October–November correction. At $4.80, the asset would have recovered roughly 29.7% from the $3.70 print — returning to the zone where the decline began accelerating in late October.
These are rebound targets within the existing downtrend structure, not breakout targets. The $4.80 trendline resistance is the level that would need to be cleared with a sustained close above it to transition from “rebound” to “trend reversal” territory. At time of writing, that outcome has not occurred and no chart confirmation of such a breakout exists.
On-Chain Fundamentals — NEAR’s Protocol State
DeFiLlama data shows NEAR’s ecosystem TVL at $177.14 million, with 24-hour DEX volume of $140.18 million and seven-day DEX volume of $972.61 million — indicating that trading activity on-chain remains substantial even as price has corrected. Seven-day fees total $1.62 million. The 24-hour revenue figure is negligible at $0.0K, which reflects NEAR’s fee-distribution structure rather than zero protocol activity. For context on institutional participation, the Bitwise NEAR ETF launched on NYSE Arca earlier this year with $35.5 million in day-one inflows — a structural demand channel that did not exist in prior cycles.
The macro backdrop adds a layer of caution: Nonfarm Payrolls data dropped on November 6 — the same day this signal printed — with CPI due November 10 and PPI on November 13. Risk assets, including NEAR, remain sensitive to macro data in this environment. The broader market context the analyst referenced — “while the broader market remains under pressure” — aligns with this macro calendar. Any sustained rebound from the TD Sequential buy signal will need to contend with the macro data flow over the next two weeks.
What the Signal Says — and What It Doesn’t
The TD Sequential “9” buy signal confirms one thing with precision: downside momentum has reached a mathematically exhausted state after nine consecutive lower closes. It does not confirm that the bottom is in. It does not project magnitude of any rebound. It does not eliminate the possibility that price consolidates at current levels before the next directional move.
The prior Sequential Aggressive 13 sell signal was followed immediately by a clean directional move — but that was a stronger, extended count. The current “9” is the standard version, which carries a lower historical completion rate than the Aggressive 13. One reply to the original post noted that the $4.30 first target depends on whether this count produces a flip — or a repeat of the prior exhaustion without a sustained recovery. That is the honest framing.
What to watch for continuation: a daily close above $4.30 would validate the rebound thesis and open the path toward the $4.80 trendline. What to watch for invalidation: a daily close materially below $3.63 — the prior low cited in the analyst’s research — would indicate the exhaustion count failed and the downtrend is extending.
The TD Sequential has a documented two-for-two track record on this specific NEAR move: the Aggressive 13 sell at $6.00 caught the top; the “9” buy at $3.72 is now flagging the potential bottom. Whether that becomes three-for-three will be answered at $4.30 and $4.80 in sessions ahead.
Disclaimer: The views and analysis presented in this article are for informational purposes only and reflect the author’s perspective, not financial advice. Technical patterns and indicators discussed are subject to market volatility and may or may not yield the anticipated results. Investors are advised to exercise caution, conduct independent research, and make decisions aligned with their individual risk tolerance.
NEAR Prints TD Sequential '9' Buy Signal After a 39% Drop
Key Highlights
NEAR is trading at $3.70 — down 26.08% in 30 days — after a 39.42% decline from the October $6.00 highTD Sequential '9' buy signal printed on the daily chart at $3.72 — the same indicator that called the top via Sequential Aggressive 13 on October 12First rebound target is $4.30; setup resistance trendline sits at $4.80 — a close above $4.30 is needed to validate the thesis
$NEAR Protocol is trading at $3.70 — down 6.23% in 24 hours, 13.20% over seven days, and 26.08% over the past 30 days — with a market cap of $4.85 billion. After shedding 39.42% from its October peak of $6.00 to a dotted support reference near $3.72, the daily chart has now printed a TD Sequential “9” buy signal. That is the same indicator that called the top of the prior move before the correction began.
An analyst who covers momentum signals on the NEAR daily chart flagged the setup on November 6, 2026, writing: “While the broader market remains under pressure, the TD Sequential has flashed a buy signal on $NEAR daily chart. This indicator recently anticipated a major trend shift. On October 12, it flashed a Sequential Aggressive 13” — a signal that preceded the 39.42% decline from $6.00 to $3.63. The same framework is now reading exhaustion to the downside.
The TD Sequential — What It Actually Measures
The TD Sequential counts nine consecutive daily closes in the same direction to identify momentum exhaustion — not a price level, not a support zone. A “9” buy signal means the market has closed lower for nine consecutive bars, reaching a statistical state where selling momentum is typically spent. It is a non-directional counter at its core: it marks exhaustion, not guaranteed reversal. The analyst’s prior application of this same indicator on NEAR was the Sequential Aggressive 13 on October 12 — a sell-side exhaustion count that correctly front-ran the 39.42% decline. The signal now appearing is the mirror-image count on the downside.
NEAR Protocol Daily Chart Analysis | Source: @alicharts (X)
On the daily chart, the “9” count has completed with a small triangle (▲) printed beneath the most recent candles, with price sitting at the $3.72 horizontal dotted reference line — the level that marks the floor of the entire October–November decline. The chart labels visible across the decline: $6.00, $5.40, $4.80, $4.20, $3.72, $3.40 — a cascade of approximately $0.60 steps marking the structured nature of the selloff. The pattern status at time of writing is PATTERN STILL FORMING: the buy signal has printed, but no confirmed upside breakout above resistance is yet visible on the daily timeframe.
The Prior Signal — What It Said and What Followed
To assess the current signal, context from the prior count is essential. On October 12, the TD Sequential registered a Sequential Aggressive 13 — an extended exhaustion count that flags trend termination after a prolonged momentum run. NEAR was trading near $6.00 at that point. The 39.42% decline to $3.63 followed directly. That signal was not a coincidence — it was a measured count reaching its terminal state at the peak of a momentum move. The analyst’s credibility on this asset stems from that prior call. The current “9” count is a standard exhaustion signal, one step below the Aggressive 13 in intensity, but applied at what appears to be the structural low of the same correction the prior signal warned of.
NEAR had seen a dramatic run earlier in the cycle. Those interested in the protocol-level catalysts that drove the asset higher can review the full breakdown of the four catalysts behind NEAR’s 30-day 120% rally. The technical context also includes a key structural development: NEAR clearing four-year resistance and holding the backtest on the monthly chart — a level that now represents the broader structural framework within which this daily signal is occurring.
Targets — $4.30 and $4.80
The analyst identifies two levels for a potential rebound from the current buy signal. The first target is $4.30 — a recovery of approximately 16% from current price. The second level is the setup resistance trendline near $4.80, which represents the descending trendline that capped every rally attempt during the October–November correction. At $4.80, the asset would have recovered roughly 29.7% from the $3.70 print — returning to the zone where the decline began accelerating in late October.
These are rebound targets within the existing downtrend structure, not breakout targets. The $4.80 trendline resistance is the level that would need to be cleared with a sustained close above it to transition from “rebound” to “trend reversal” territory. At time of writing, that outcome has not occurred and no chart confirmation of such a breakout exists.
On-Chain Fundamentals — NEAR’s Protocol State
DeFiLlama data shows NEAR’s ecosystem TVL at $177.14 million, with 24-hour DEX volume of $140.18 million and seven-day DEX volume of $972.61 million — indicating that trading activity on-chain remains substantial even as price has corrected. Seven-day fees total $1.62 million. The 24-hour revenue figure is negligible at $0.0K, which reflects NEAR’s fee-distribution structure rather than zero protocol activity. For context on institutional participation, the Bitwise NEAR ETF launched on NYSE Arca earlier this year with $35.5 million in day-one inflows — a structural demand channel that did not exist in prior cycles.
The macro backdrop adds a layer of caution: Nonfarm Payrolls data dropped on November 6 — the same day this signal printed — with CPI due November 10 and PPI on November 13. Risk assets, including NEAR, remain sensitive to macro data in this environment. The broader market context the analyst referenced — “while the broader market remains under pressure” — aligns with this macro calendar. Any sustained rebound from the TD Sequential buy signal will need to contend with the macro data flow over the next two weeks.
What the Signal Says — and What It Doesn’t
The TD Sequential “9” buy signal confirms one thing with precision: downside momentum has reached a mathematically exhausted state after nine consecutive lower closes. It does not confirm that the bottom is in. It does not project magnitude of any rebound. It does not eliminate the possibility that price consolidates at current levels before the next directional move.
The prior Sequential Aggressive 13 sell signal was followed immediately by a clean directional move — but that was a stronger, extended count. The current “9” is the standard version, which carries a lower historical completion rate than the Aggressive 13. One reply to the original post noted that the $4.30 first target depends on whether this count produces a flip — or a repeat of the prior exhaustion without a sustained recovery. That is the honest framing.
What to watch for continuation: a daily close above $4.30 would validate the rebound thesis and open the path toward the $4.80 trendline. What to watch for invalidation: a daily close materially below $3.63 — the prior low cited in the analyst’s research — would indicate the exhaustion count failed and the downtrend is extending.
The TD Sequential has a documented two-for-two track record on this specific NEAR move: the Aggressive 13 sell at $6.00 caught the top; the “9” buy at $3.72 is now flagging the potential bottom. Whether that becomes three-for-three will be answered at $4.30 and $4.80 in sessions ahead.
Disclaimer: The views and analysis presented in this article are for informational purposes only and reflect the author’s perspective, not financial advice. Technical patterns and indicators discussed are subject to market volatility and may or may not yield the anticipated results. Investors are advised to exercise caution, conduct independent research, and make decisions aligned with their individual risk tolerance.
NEAR is trading at $3.70 — down 26.08% in 30 days — after a 39.42% decline from the October $6.00 highTD Sequential '9' buy signal printed on the daily chart at $3.72 — the same indicator that called the top via Sequential Aggressive 13 on October 12First rebound target is $4.30; setup resistance trendline sits at $4.80 — a close above $4.30 is needed to validate the thesis
$NEAR Protocol is trading at $3.70 — down 6.23% in 24 hours, 13.20% over seven days, and 26.08% over the past 30 days — with a market cap of $4.85 billion. After shedding 39.42% from its October peak of $6.00 to a dotted support reference near $3.72, the daily chart has now printed a TD Sequential “9” buy signal. That is the same indicator that called the top of the prior move before the correction began.
An analyst who covers momentum signals on the NEAR daily chart flagged the setup on November 6, 2026, writing: “While the broader market remains under pressure, the TD Sequential has flashed a buy signal on $NEAR daily chart. This indicator recently anticipated a major trend shift. On October 12, it flashed a Sequential Aggressive 13” — a signal that preceded the 39.42% decline from $6.00 to $3.63. The same framework is now reading exhaustion to the downside.
The TD Sequential — What It Actually Measures
The TD Sequential counts nine consecutive daily closes in the same direction to identify momentum exhaustion — not a price level, not a support zone. A “9” buy signal means the market has closed lower for nine consecutive bars, reaching a statistical state where selling momentum is typically spent. It is a non-directional counter at its core: it marks exhaustion, not guaranteed reversal. The analyst’s prior application of this same indicator on NEAR was the Sequential Aggressive 13 on October 12 — a sell-side exhaustion count that correctly front-ran the 39.42% decline. The signal now appearing is the mirror-image count on the downside.
NEAR Protocol Daily Chart Analysis | Source: @alicharts (X)
On the daily chart, the “9” count has completed with a small triangle (▲) printed beneath the most recent candles, with price sitting at the $3.72 horizontal dotted reference line — the level that marks the floor of the entire October–November decline. The chart labels visible across the decline: $6.00, $5.40, $4.80, $4.20, $3.72, $3.40 — a cascade of approximately $0.60 steps marking the structured nature of the selloff. The pattern status at time of writing is PATTERN STILL FORMING: the buy signal has printed, but no confirmed upside breakout above resistance is yet visible on the daily timeframe.
The Prior Signal — What It Said and What Followed
To assess the current signal, context from the prior count is essential. On October 12, the TD Sequential registered a Sequential Aggressive 13 — an extended exhaustion count that flags trend termination after a prolonged momentum run. NEAR was trading near $6.00 at that point. The 39.42% decline to $3.63 followed directly. That signal was not a coincidence — it was a measured count reaching its terminal state at the peak of a momentum move. The analyst’s credibility on this asset stems from that prior call. The current “9” count is a standard exhaustion signal, one step below the Aggressive 13 in intensity, but applied at what appears to be the structural low of the same correction the prior signal warned of.
NEAR had seen a dramatic run earlier in the cycle. Those interested in the protocol-level catalysts that drove the asset higher can review the full breakdown of the four catalysts behind NEAR’s 30-day 120% rally. The technical context also includes a key structural development: NEAR clearing four-year resistance and holding the backtest on the monthly chart — a level that now represents the broader structural framework within which this daily signal is occurring.
Targets — $4.30 and $4.80
The analyst identifies two levels for a potential rebound from the current buy signal. The first target is $4.30 — a recovery of approximately 16% from current price. The second level is the setup resistance trendline near $4.80, which represents the descending trendline that capped every rally attempt during the October–November correction. At $4.80, the asset would have recovered roughly 29.7% from the $3.70 print — returning to the zone where the decline began accelerating in late October.
These are rebound targets within the existing downtrend structure, not breakout targets. The $4.80 trendline resistance is the level that would need to be cleared with a sustained close above it to transition from “rebound” to “trend reversal” territory. At time of writing, that outcome has not occurred and no chart confirmation of such a breakout exists.
On-Chain Fundamentals — NEAR’s Protocol State
DeFiLlama data shows NEAR’s ecosystem TVL at $177.14 million, with 24-hour DEX volume of $140.18 million and seven-day DEX volume of $972.61 million — indicating that trading activity on-chain remains substantial even as price has corrected. Seven-day fees total $1.62 million. The 24-hour revenue figure is negligible at $0.0K, which reflects NEAR’s fee-distribution structure rather than zero protocol activity. For context on institutional participation, the Bitwise NEAR ETF launched on NYSE Arca earlier this year with $35.5 million in day-one inflows — a structural demand channel that did not exist in prior cycles.
The macro backdrop adds a layer of caution: Nonfarm Payrolls data dropped on November 6 — the same day this signal printed — with CPI due November 10 and PPI on November 13. Risk assets, including NEAR, remain sensitive to macro data in this environment. The broader market context the analyst referenced — “while the broader market remains under pressure” — aligns with this macro calendar. Any sustained rebound from the TD Sequential buy signal will need to contend with the macro data flow over the next two weeks.
What the Signal Says — and What It Doesn’t
The TD Sequential “9” buy signal confirms one thing with precision: downside momentum has reached a mathematically exhausted state after nine consecutive lower closes. It does not confirm that the bottom is in. It does not project magnitude of any rebound. It does not eliminate the possibility that price consolidates at current levels before the next directional move.
The prior Sequential Aggressive 13 sell signal was followed immediately by a clean directional move — but that was a stronger, extended count. The current “9” is the standard version, which carries a lower historical completion rate than the Aggressive 13. One reply to the original post noted that the $4.30 first target depends on whether this count produces a flip — or a repeat of the prior exhaustion without a sustained recovery. That is the honest framing.
What to watch for continuation: a daily close above $4.30 would validate the rebound thesis and open the path toward the $4.80 trendline. What to watch for invalidation: a daily close materially below $3.63 — the prior low cited in the analyst’s research — would indicate the exhaustion count failed and the downtrend is extending.
The TD Sequential has a documented two-for-two track record on this specific NEAR move: the Aggressive 13 sell at $6.00 caught the top; the “9” buy at $3.72 is now flagging the potential bottom. Whether that becomes three-for-three will be answered at $4.30 and $4.80 in sessions ahead.
Disclaimer: The views and analysis presented in this article are for informational purposes only and reflect the author’s perspective, not financial advice. Technical patterns and indicators discussed are subject to market volatility and may or may not yield the anticipated results. Investors are advised to exercise caution, conduct independent research, and make decisions aligned with their individual risk tolerance.
505
·
--
Article
XRP Social Sentiment Hits Lowest Since July — A Contrarian Buy Signal?Key Highlights
XRP is trading at $1.18 — down 9.43% in 24 hours — with social sentiment at its lowest Santiment reading since July 2026An analyst identifies the crowd's extreme bearish positioning as a contrarian constructive signal, with an inverse H&S pattern developingXRP spot ETFs recorded five consecutive outflow days with $1.0M in net outflows per SoSoValue — institutional positioning mirrors bearish crowd sentiment
XRP is trading at $1.18 — down 9.43% in the past 24 hours — with its market cap sitting at approximately $74.96 billion. The selloff has pushed social sentiment to its lowest reading since July 2026, a development that one analyst sees not as confirmation of further downside, but as a contrarian signal that the crowd has gotten ahead of itself.
An analyst flagged the sentiment collapse on November 6, 2026, noting that XRP’s social sentiment — tracked by Santiment — has crossed decisively below the zero line, approaching the −0.03 lower bound on the oscillator. The analyst’s conclusion, shared with their audience, was direct: “The crowd is becoming increasingly bearish on $XRP… But from a contrarian perspective, this could actually be constructive.” The same analyst had previously flagged the setup in a five-part thread titled “TIME TO BUY XRP BEFORE THE BREAKOUT.”
Signal — Social Sentiment at the Lowest Reading Since July
The Santiment social sentiment metric aggregates the ratio of bullish-to-bearish mentions across crypto social platforms into a normalized score. A reading above zero reflects net bullish crowd positioning; a reading below zero reflects net bearish positioning. The further below zero, the more lopsided the bearish consensus — which, from a contrarian standpoint, means fewer remaining sellers and a crowd that is already positioned for a move lower.
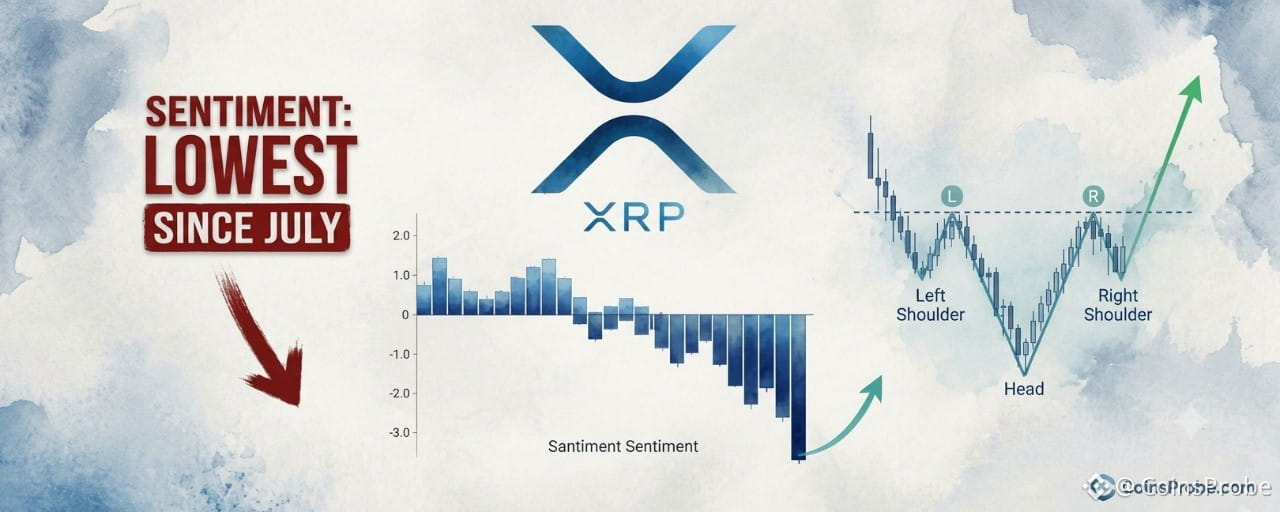
According to the Santiment chart shared by the analyst, XRP’s sentiment bars have reversed sharply from mildly positive to deeply negative in recent sessions, with the most recent bar being the longest downward bar in the visible window. The reading is now at or approaching the −0.03 lower axis — the most extreme negative reading on the chart and the lowest sentiment level recorded since July 2026.
XRP Social Sentiment Analysis | Source: @alicharts (X)
The contrarian logic is straightforward: when sentiment reaches a multi-month negative extreme, the bearish trade is crowded. The crowd has not yet recognized the structural setup developing on the chart — meaning any bullish position is not yet overcrowded, which is precisely the environment where reversals tend to originate.
It is worth noting what this signal does not confirm. The sentiment reading alone provides no price target, no support level, and no specific timing. It is a crowd-positioning indicator — it tells you where sentiment is, not where price will go. The analyst is explicit that this is a contrarian read, not a directional price prediction with a defined level attached.
Inverse Head and Shoulders — The Pattern Developing Beneath the Bearish Noise
The analyst notes that alongside the sentiment extreme, XRP appears to be developing a potential inverse head-and-shoulders bottom pattern. An inverse head-and-shoulders is a classic reversal formation: three troughs where the middle trough (the head) is the lowest, flanked by two higher troughs (the shoulders), with a neckline connecting the peaks between them. A confirmed breakout above the neckline typically signals a trend reversal from bearish to bullish.
The analyst’s prior thread — posted November 5, 2026 — described this as the basis for a pre-breakout entry thesis. No specific neckline price, shoulder levels, or price target were stated in the available text, so none will be invented here. What the analyst did state is that the pattern is developing and that the current sentiment extreme makes the setup more, not less, compelling — because a crowd this negative is unlikely to be positioned for an upside break.
The combination of a price pattern developing and sentiment at a multi-month negative extreme is the structural argument. The crowd is bearish. The chart is forming a potential bottom. Those two data points rarely coexist at the start of a sustained decline — they more commonly mark its end.
ETF Context — Outflow Pressure Adds to the Setup
XRP spot ETF data from SoSoValue adds institutional-level context. As of November 5, 2026, the XRP spot ETF complex reported zero daily net inflow, with the past five trading days showing net outflows of $1.0 million — five consecutive outflow days. Total ETF net assets stand at $1.41 billion, against a cumulative net inflow of $1.81 billion since launch. Daily trading volume was $22.3 million.
The ETF outflow data mirrors the social sentiment story: institutional and retail positioning has leaned bearish. That the recent market drop in XRP has coincided with broader macro stress — including the broader market disruption following the Bitcoin Fear & Greed index falling to 30 after the Binance hack, and the $6.3B Binance exploit — suggests much of the sentiment damage is macro-driven rather than XRP-specific. That distinction matters for the contrarian thesis: if the selloff is externally sourced rather than a reflection of XRP-specific deterioration, the sentiment extreme becomes less informative about fundamental trajectory and more informative about short-term crowd behavior.
Upcoming macro data — CPI on November 9, Initial Jobless Claims on November 11, and PPI on November 12 — will determine whether macro pressure on the broader digital asset market persists or eases. Any macro relief would remove one of the headwinds currently compressing XRP sentiment.
What the Contrarian Signal Says — And What It Doesn’t
The sentiment read from Santiment, corroborated by five consecutive ETF outflow days, confirms one thing with precision: the crowd is overwhelmingly positioned bearish on XRP at this moment. Historically, multi-month sentiment lows of this nature have more often preceded periods of price stabilization or recovery than continued acceleration lower — because the aggressive sellers have already sold.
What it does not say: it is not a timing signal. It does not name a bottom. It does not confirm that the inverse head-and-shoulders pattern will complete, that the neckline will break, or that a specific price target is in play. The analyst stopped short of attaching any numeric level to the trade — and so does this analysis.
What to watch: the inverse head-and-shoulders pattern requires a neckline break with volume to become a confirmed signal. Until that break occurs, the pattern remains developing. The sentiment extreme provides context for why the setup is worth watching — not a trigger in itself.
At $1.18, $XRP is down sharply. The crowd is as bearish as it has been since July. A structural reversal pattern is developing beneath the noise. Those three facts together define the setup. Whether the pattern delivers its implied breakout is what the coming sessions will answer.
Disclaimer: The views and analysis presented in this article are for informational purposes only and reflect the author’s perspective, not financial advice. Technical patterns and indicators discussed are subject to market volatility and may or may not yield the anticipated results. Investors are advised to exercise caution, conduct independent research, and make decisions aligned with their individual risk tolerance.
XRP Social Sentiment Hits Lowest Since July — A Contrarian Buy Signal?
Key Highlights
XRP is trading at $1.18 — down 9.43% in 24 hours — with social sentiment at its lowest Santiment reading since July 2026An analyst identifies the crowd's extreme bearish positioning as a contrarian constructive signal, with an inverse H&S pattern developingXRP spot ETFs recorded five consecutive outflow days with $1.0M in net outflows per SoSoValue — institutional positioning mirrors bearish crowd sentiment
XRP is trading at $1.18 — down 9.43% in the past 24 hours — with its market cap sitting at approximately $74.96 billion. The selloff has pushed social sentiment to its lowest reading since July 2026, a development that one analyst sees not as confirmation of further downside, but as a contrarian signal that the crowd has gotten ahead of itself.
An analyst flagged the sentiment collapse on November 6, 2026, noting that XRP’s social sentiment — tracked by Santiment — has crossed decisively below the zero line, approaching the −0.03 lower bound on the oscillator. The analyst’s conclusion, shared with their audience, was direct: “The crowd is becoming increasingly bearish on $XRP … But from a contrarian perspective, this could actually be constructive.” The same analyst had previously flagged the setup in a five-part thread titled “TIME TO BUY XRP BEFORE THE BREAKOUT.”
Signal — Social Sentiment at the Lowest Reading Since July
The Santiment social sentiment metric aggregates the ratio of bullish-to-bearish mentions across crypto social platforms into a normalized score. A reading above zero reflects net bullish crowd positioning; a reading below zero reflects net bearish positioning. The further below zero, the more lopsided the bearish consensus — which, from a contrarian standpoint, means fewer remaining sellers and a crowd that is already positioned for a move lower.
According to the Santiment chart shared by the analyst, XRP’s sentiment bars have reversed sharply from mildly positive to deeply negative in recent sessions, with the most recent bar being the longest downward bar in the visible window. The reading is now at or approaching the −0.03 lower axis — the most extreme negative reading on the chart and the lowest sentiment level recorded since July 2026.
XRP Social Sentiment Analysis | Source: @alicharts (X)
The contrarian logic is straightforward: when sentiment reaches a multi-month negative extreme, the bearish trade is crowded. The crowd has not yet recognized the structural setup developing on the chart — meaning any bullish position is not yet overcrowded, which is precisely the environment where reversals tend to originate.
It is worth noting what this signal does not confirm. The sentiment reading alone provides no price target, no support level, and no specific timing. It is a crowd-positioning indicator — it tells you where sentiment is, not where price will go. The analyst is explicit that this is a contrarian read, not a directional price prediction with a defined level attached.
Inverse Head and Shoulders — The Pattern Developing Beneath the Bearish Noise
The analyst notes that alongside the sentiment extreme, XRP appears to be developing a potential inverse head-and-shoulders bottom pattern. An inverse head-and-shoulders is a classic reversal formation: three troughs where the middle trough (the head) is the lowest, flanked by two higher troughs (the shoulders), with a neckline connecting the peaks between them. A confirmed breakout above the neckline typically signals a trend reversal from bearish to bullish.
The analyst’s prior thread — posted November 5, 2026 — described this as the basis for a pre-breakout entry thesis. No specific neckline price, shoulder levels, or price target were stated in the available text, so none will be invented here. What the analyst did state is that the pattern is developing and that the current sentiment extreme makes the setup more, not less, compelling — because a crowd this negative is unlikely to be positioned for an upside break.
The combination of a price pattern developing and sentiment at a multi-month negative extreme is the structural argument. The crowd is bearish. The chart is forming a potential bottom. Those two data points rarely coexist at the start of a sustained decline — they more commonly mark its end.
ETF Context — Outflow Pressure Adds to the Setup
XRP spot ETF data from SoSoValue adds institutional-level context. As of November 5, 2026, the XRP spot ETF complex reported zero daily net inflow, with the past five trading days showing net outflows of $1.0 million — five consecutive outflow days. Total ETF net assets stand at $1.41 billion, against a cumulative net inflow of $1.81 billion since launch. Daily trading volume was $22.3 million.
The ETF outflow data mirrors the social sentiment story: institutional and retail positioning has leaned bearish. That the recent market drop in XRP has coincided with broader macro stress — including the broader market disruption following the Bitcoin Fear & Greed index falling to 30 after the Binance hack, and the $6.3B Binance exploit — suggests much of the sentiment damage is macro-driven rather than XRP-specific. That distinction matters for the contrarian thesis: if the selloff is externally sourced rather than a reflection of XRP-specific deterioration, the sentiment extreme becomes less informative about fundamental trajectory and more informative about short-term crowd behavior.
Upcoming macro data — CPI on November 9, Initial Jobless Claims on November 11, and PPI on November 12 — will determine whether macro pressure on the broader digital asset market persists or eases. Any macro relief would remove one of the headwinds currently compressing XRP sentiment.
What the Contrarian Signal Says — And What It Doesn’t
The sentiment read from Santiment, corroborated by five consecutive ETF outflow days, confirms one thing with precision: the crowd is overwhelmingly positioned bearish on XRP at this moment. Historically, multi-month sentiment lows of this nature have more often preceded periods of price stabilization or recovery than continued acceleration lower — because the aggressive sellers have already sold.
What it does not say: it is not a timing signal. It does not name a bottom. It does not confirm that the inverse head-and-shoulders pattern will complete, that the neckline will break, or that a specific price target is in play. The analyst stopped short of attaching any numeric level to the trade — and so does this analysis.
What to watch: the inverse head-and-shoulders pattern requires a neckline break with volume to become a confirmed signal. Until that break occurs, the pattern remains developing. The sentiment extreme provides context for why the setup is worth watching — not a trigger in itself.
At $1.18, $XRP is down sharply. The crowd is as bearish as it has been since July. A structural reversal pattern is developing beneath the noise. Those three facts together define the setup. Whether the pattern delivers its implied breakout is what the coming sessions will answer.
Disclaimer: The views and analysis presented in this article are for informational purposes only and reflect the author’s perspective, not financial advice. Technical patterns and indicators discussed are subject to market volatility and may or may not yield the anticipated results. Investors are advised to exercise caution, conduct independent research, and make decisions aligned with their individual risk tolerance.
XRP is trading at $1.18 — down 9.43% in 24 hours — with social sentiment at its lowest Santiment reading since July 2026An analyst identifies the crowd's extreme bearish positioning as a contrarian constructive signal, with an inverse H&S pattern developingXRP spot ETFs recorded five consecutive outflow days with $1.0M in net outflows per SoSoValue — institutional positioning mirrors bearish crowd sentiment
XRP is trading at $1.18 — down 9.43% in the past 24 hours — with its market cap sitting at approximately $74.96 billion. The selloff has pushed social sentiment to its lowest reading since July 2026, a development that one analyst sees not as confirmation of further downside, but as a contrarian signal that the crowd has gotten ahead of itself.
An analyst flagged the sentiment collapse on November 6, 2026, noting that XRP’s social sentiment — tracked by Santiment — has crossed decisively below the zero line, approaching the −0.03 lower bound on the oscillator. The analyst’s conclusion, shared with their audience, was direct: “The crowd is becoming increasingly bearish on $XRP … But from a contrarian perspective, this could actually be constructive.” The same analyst had previously flagged the setup in a five-part thread titled “TIME TO BUY XRP BEFORE THE BREAKOUT.”
Signal — Social Sentiment at the Lowest Reading Since July
The Santiment social sentiment metric aggregates the ratio of bullish-to-bearish mentions across crypto social platforms into a normalized score. A reading above zero reflects net bullish crowd positioning; a reading below zero reflects net bearish positioning. The further below zero, the more lopsided the bearish consensus — which, from a contrarian standpoint, means fewer remaining sellers and a crowd that is already positioned for a move lower.
According to the Santiment chart shared by the analyst, XRP’s sentiment bars have reversed sharply from mildly positive to deeply negative in recent sessions, with the most recent bar being the longest downward bar in the visible window. The reading is now at or approaching the −0.03 lower axis — the most extreme negative reading on the chart and the lowest sentiment level recorded since July 2026.
XRP Social Sentiment Analysis | Source: @alicharts (X)
The contrarian logic is straightforward: when sentiment reaches a multi-month negative extreme, the bearish trade is crowded. The crowd has not yet recognized the structural setup developing on the chart — meaning any bullish position is not yet overcrowded, which is precisely the environment where reversals tend to originate.
It is worth noting what this signal does not confirm. The sentiment reading alone provides no price target, no support level, and no specific timing. It is a crowd-positioning indicator — it tells you where sentiment is, not where price will go. The analyst is explicit that this is a contrarian read, not a directional price prediction with a defined level attached.
Inverse Head and Shoulders — The Pattern Developing Beneath the Bearish Noise
The analyst notes that alongside the sentiment extreme, XRP appears to be developing a potential inverse head-and-shoulders bottom pattern. An inverse head-and-shoulders is a classic reversal formation: three troughs where the middle trough (the head) is the lowest, flanked by two higher troughs (the shoulders), with a neckline connecting the peaks between them. A confirmed breakout above the neckline typically signals a trend reversal from bearish to bullish.
The analyst’s prior thread — posted November 5, 2026 — described this as the basis for a pre-breakout entry thesis. No specific neckline price, shoulder levels, or price target were stated in the available text, so none will be invented here. What the analyst did state is that the pattern is developing and that the current sentiment extreme makes the setup more, not less, compelling — because a crowd this negative is unlikely to be positioned for an upside break.
The combination of a price pattern developing and sentiment at a multi-month negative extreme is the structural argument. The crowd is bearish. The chart is forming a potential bottom. Those two data points rarely coexist at the start of a sustained decline — they more commonly mark its end.
ETF Context — Outflow Pressure Adds to the Setup
XRP spot ETF data from SoSoValue adds institutional-level context. As of November 5, 2026, the XRP spot ETF complex reported zero daily net inflow, with the past five trading days showing net outflows of $1.0 million — five consecutive outflow days. Total ETF net assets stand at $1.41 billion, against a cumulative net inflow of $1.81 billion since launch. Daily trading volume was $22.3 million.
The ETF outflow data mirrors the social sentiment story: institutional and retail positioning has leaned bearish. That the recent market drop in XRP has coincided with broader macro stress — including the broader market disruption following the Bitcoin Fear & Greed index falling to 30 after the Binance hack, and the $6.3B Binance exploit — suggests much of the sentiment damage is macro-driven rather than XRP-specific. That distinction matters for the contrarian thesis: if the selloff is externally sourced rather than a reflection of XRP-specific deterioration, the sentiment extreme becomes less informative about fundamental trajectory and more informative about short-term crowd behavior.
Upcoming macro data — CPI on November 9, Initial Jobless Claims on November 11, and PPI on November 12 — will determine whether macro pressure on the broader digital asset market persists or eases. Any macro relief would remove one of the headwinds currently compressing XRP sentiment.
What the Contrarian Signal Says — And What It Doesn’t
The sentiment read from Santiment, corroborated by five consecutive ETF outflow days, confirms one thing with precision: the crowd is overwhelmingly positioned bearish on XRP at this moment. Historically, multi-month sentiment lows of this nature have more often preceded periods of price stabilization or recovery than continued acceleration lower — because the aggressive sellers have already sold.
What it does not say: it is not a timing signal. It does not name a bottom. It does not confirm that the inverse head-and-shoulders pattern will complete, that the neckline will break, or that a specific price target is in play. The analyst stopped short of attaching any numeric level to the trade — and so does this analysis.
What to watch: the inverse head-and-shoulders pattern requires a neckline break with volume to become a confirmed signal. Until that break occurs, the pattern remains developing. The sentiment extreme provides context for why the setup is worth watching — not a trigger in itself.
At $1.18, $XRP is down sharply. The crowd is as bearish as it has been since July. A structural reversal pattern is developing beneath the noise. Those three facts together define the setup. Whether the pattern delivers its implied breakout is what the coming sessions will answer.
Disclaimer: The views and analysis presented in this article are for informational purposes only and reflect the author’s perspective, not financial advice. Technical patterns and indicators discussed are subject to market volatility and may or may not yield the anticipated results. Investors are advised to exercise caution, conduct independent research, and make decisions aligned with their individual risk tolerance.
2
903
·
--
Article
Bitcoin Retreats to $75,522 as Spot Demand Fails to Support $80K Recoveryey Highlights
Bitcoin is at $75,522 — down 6.28% in 24 hours — after a failed recovery above $80,000CryptoQuant analyst @xwinfinance: "spot buying has not recovered enough to support a sustainable uptrend"11,003 BTC left exchanges on Nov. 5; large-wallet accumulation turned positive — but ETF flows and stablecoin liquidity remain weakWatch $73,000 — loss of this level removes the final structural case for near-term recovery
Bitcoin is trading at $75,522 — down 6.28% in 24 hours and carrying a market cap of $1.52 trillion — after a recovery above $80,000 collapsed without confirmation from the one metric that actually matters: spot demand. The futures market offered a temporary reprieve. The spot market did not follow. That divergence, according to a CryptoQuant analyst, is precisely why the rebound failed.
An analyst publishing under the handle @xwinfinance on CryptoQuant’s Quicktake platform identified the structural gap that ended the $80K recovery. In their words: “The key issue is still spot demand. Futures positioning improved temporarily, but spot buying has not recovered enough to support a sustainable uptrend.” This is not a technical observation about a single candle — it is a diagnosis of the demand structure underlying the entire recovery attempt.
BTC Exchange Outflows | Source: @cryptoquant_com (X)
Why Futures Cannot Carry a Sustainable Rally Alone
The distinction between futures-driven and spot-driven price moves matters because they carry fundamentally different durability. Futures positioning can shift in hours — driven by leverage, funding rate arbitrage, or short-covering. Spot demand reflects genuine buyers who are acquiring and removing BTC from circulation. When spot demand is absent, any futures-led rally is structurally unsupported: it can lift price, but it cannot hold it.
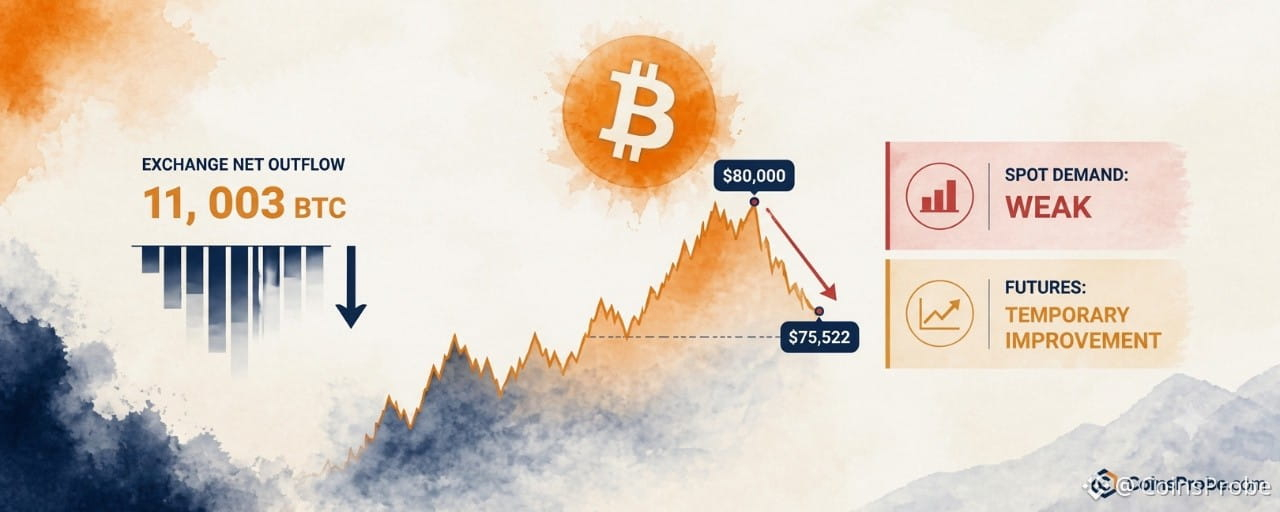
This is exactly what the chart data shows. According to the CryptoQuant analysis, exchange outflows registered approximately 11,003 BTC leaving exchanges on November 5 — a constructive signal in isolation. The 60-day accumulation metric for wallets holding more than 10,000 BTC also turned positive over the same period. These are real signals. But they exist alongside a contradicting data point: retail-sized BTC inflows to Binance rose sharply, suggesting that shorter-term holders — the cohort most likely to sell into strength — may still be under distribution pressure.
The Three Metrics That Must Recover Together
The analyst’s framework is explicit. For a durable rebound, three conditions must converge simultaneously — not sequentially:
Spot demand must recover from its current suppressed stateETF flows must reverse from their current weekly weaknessStablecoin liquidity must rebuild — it has not recovered as of the time of publication
ETF flows are a particularly important variable here. Spot Bitcoin ETF flows represent institutionally-sourced spot demand — the exact category of buying that the market is currently missing. When ETF flows are weak on a weekly basis, as they are now, it compounds the absence of organic spot buying. Stablecoin liquidity acts as dry powder: without sufficient stablecoin supply ready to convert into BTC, the market lacks the fuel for sustained upside even when sentiment improves.
None of these three metrics has shown the simultaneous recovery needed to validate a new leg higher. This, in the analyst’s framing, means the burden of proof remains entirely on the bulls.
The $73,000–$76,000 Zone: The Structural Pivot
With BTC currently at $75,522, the market is sitting inside the support zone the CryptoQuant analyst identifies as the near-term pivot: $73,000–$76,000. This is the range that must hold for any recovery thesis to remain structurally intact. The analyst’s framing is deliberate: “Can BTC hold the $73,000–$76,000 support zone?” — posed as an open question, not a prediction.
The macro context matters here. According to the CryptoQuant report, BTC’s pullback from $80,000 coincided with a sharp sell-off in U.S. tech and AI stocks — a correlation that underscores how intertwined Bitcoin’s near-term moves have become with risk-asset sentiment. When equity markets de-risk, the spot demand that should be the foundation of a crypto rally often retreats in parallel. This dynamic reinforces why spot demand is the analyst’s primary focus rather than derivatives positioning. For more on how Bitcoin’s on-chain structure has evolved through this period, see Bitcoin Bottom Is In — Short-Term Holder Realized Price Confirms Local Floor and Bitcoin Tests Trader Realized Price — The Level That Flips From Support to Resistance.
What the On-Chain Data Says — And What It Doesn’t
The 11,003 BTC exchange outflow on November 5 and the positive turn in the large-wallet accumulation metric are constructive data points — but the analyst is careful not to overweight them. Selling pressure may be easing. That is not the same as buying pressure building. A market where sellers step back is different from a market where new buyers step in. The former creates a floor; the latter creates a rally.
Retail inflows to Binance rising sharply is the signal that complicates the outflow narrative. If the wallets receiving BTC from exchanges are retail-sized accounts that entered at higher prices, the exchange outflow metric is not capturing genuine accumulation by conviction holders — it may be capturing distribution to weaker hands. The analyst flags this explicitly as a reason why the near-term demand picture remains mixed. See also: Bitcoin Is Higher 1 Year After Every Midterm — But the Sample Size Is 4 for context on how macro cycles interact with Bitcoin’s demand structure.
The Analyst’s Verdict
The CryptoQuant analysis reaches a clear conclusion without offering a directional price target. Selling pressure is easing — that is acknowledged. But “a durable rebound still needs new buyers.” Those new buyers must arrive through the spot market, through ETF inflows, and supported by recovered stablecoin liquidity. Until all three are present and confirmed together, any price recovery will face the same structural ceiling that ended the $80,000 attempt.
At $75,522, Bitcoin is at the lower end of the support zone the analyst is monitoring. Whether that zone holds — and whether spot demand, ETF flows, and stablecoin liquidity recover in time to defend it — is the only question that matters in the sessions ahead. Watch $73,000 as the level whose loss would remove the final structural argument for a near-term recovery.
Disclaimer: The views and analysis presented in this article are for informational purposes only and reflect the author’s perspective, not financial advice. Technical patterns and indicators discussed are subject to market volatility and may or may not yield the anticipated results. Investors are advised to exercise caution, conduct independent research, and make decisions aligned with their individual risk tolerance.
Bitcoin Retreats to $75,522 as Spot Demand Fails to Support $80K Recovery
ey Highlights
Bitcoin is at $75,522 — down 6.28% in 24 hours — after a failed recovery above $80,000CryptoQuant analyst @xwinfinance: "spot buying has not recovered enough to support a sustainable uptrend"11,003 BTC left exchanges on Nov. 5; large-wallet accumulation turned positive — but ETF flows and stablecoin liquidity remain weakWatch $73,000 — loss of this level removes the final structural case for near-term recovery
Bitcoin is trading at $75,522 — down 6.28% in 24 hours and carrying a market cap of $1.52 trillion — after a recovery above $80,000 collapsed without confirmation from the one metric that actually matters: spot demand. The futures market offered a temporary reprieve. The spot market did not follow. That divergence, according to a CryptoQuant analyst, is precisely why the rebound failed.
An analyst publishing under the handle @xwinfinance on CryptoQuant’s Quicktake platform identified the structural gap that ended the $80K recovery. In their words: “The key issue is still spot demand. Futures positioning improved temporarily, but spot buying has not recovered enough to support a sustainable uptrend.” This is not a technical observation about a single candle — it is a diagnosis of the demand structure underlying the entire recovery attempt.
BTC Exchange Outflows | Source: @cryptoquant_com (X)
Why Futures Cannot Carry a Sustainable Rally Alone
The distinction between futures-driven and spot-driven price moves matters because they carry fundamentally different durability. Futures positioning can shift in hours — driven by leverage, funding rate arbitrage, or short-covering. Spot demand reflects genuine buyers who are acquiring and removing BTC from circulation. When spot demand is absent, any futures-led rally is structurally unsupported: it can lift price, but it cannot hold it.
This is exactly what the chart data shows. According to the CryptoQuant analysis, exchange outflows registered approximately 11,003 BTC leaving exchanges on November 5 — a constructive signal in isolation. The 60-day accumulation metric for wallets holding more than 10,000 BTC also turned positive over the same period. These are real signals. But they exist alongside a contradicting data point: retail-sized BTC inflows to Binance rose sharply, suggesting that shorter-term holders — the cohort most likely to sell into strength — may still be under distribution pressure.
The Three Metrics That Must Recover Together
The analyst’s framework is explicit. For a durable rebound, three conditions must converge simultaneously — not sequentially:
Spot demand must recover from its current suppressed stateETF flows must reverse from their current weekly weaknessStablecoin liquidity must rebuild — it has not recovered as of the time of publication
ETF flows are a particularly important variable here. Spot Bitcoin ETF flows represent institutionally-sourced spot demand — the exact category of buying that the market is currently missing. When ETF flows are weak on a weekly basis, as they are now, it compounds the absence of organic spot buying. Stablecoin liquidity acts as dry powder: without sufficient stablecoin supply ready to convert into BTC, the market lacks the fuel for sustained upside even when sentiment improves.
None of these three metrics has shown the simultaneous recovery needed to validate a new leg higher. This, in the analyst’s framing, means the burden of proof remains entirely on the bulls.
The $73,000–$76,000 Zone: The Structural Pivot
With BTC currently at $75,522, the market is sitting inside the support zone the CryptoQuant analyst identifies as the near-term pivot: $73,000–$76,000. This is the range that must hold for any recovery thesis to remain structurally intact. The analyst’s framing is deliberate: “Can BTC hold the $73,000–$76,000 support zone?” — posed as an open question, not a prediction.
The macro context matters here. According to the CryptoQuant report, BTC’s pullback from $80,000 coincided with a sharp sell-off in U.S. tech and AI stocks — a correlation that underscores how intertwined Bitcoin’s near-term moves have become with risk-asset sentiment. When equity markets de-risk, the spot demand that should be the foundation of a crypto rally often retreats in parallel. This dynamic reinforces why spot demand is the analyst’s primary focus rather than derivatives positioning. For more on how Bitcoin’s on-chain structure has evolved through this period, see Bitcoin Bottom Is In — Short-Term Holder Realized Price Confirms Local Floor and Bitcoin Tests Trader Realized Price — The Level That Flips From Support to Resistance.
What the On-Chain Data Says — And What It Doesn’t
The 11,003 BTC exchange outflow on November 5 and the positive turn in the large-wallet accumulation metric are constructive data points — but the analyst is careful not to overweight them. Selling pressure may be easing. That is not the same as buying pressure building. A market where sellers step back is different from a market where new buyers step in. The former creates a floor; the latter creates a rally.
Retail inflows to Binance rising sharply is the signal that complicates the outflow narrative. If the wallets receiving BTC from exchanges are retail-sized accounts that entered at higher prices, the exchange outflow metric is not capturing genuine accumulation by conviction holders — it may be capturing distribution to weaker hands. The analyst flags this explicitly as a reason why the near-term demand picture remains mixed. See also: Bitcoin Is Higher 1 Year After Every Midterm — But the Sample Size Is 4 for context on how macro cycles interact with Bitcoin’s demand structure.
The Analyst’s Verdict
The CryptoQuant analysis reaches a clear conclusion without offering a directional price target. Selling pressure is easing — that is acknowledged. But “a durable rebound still needs new buyers.” Those new buyers must arrive through the spot market, through ETF inflows, and supported by recovered stablecoin liquidity. Until all three are present and confirmed together, any price recovery will face the same structural ceiling that ended the $80,000 attempt.
At $75,522, Bitcoin is at the lower end of the support zone the analyst is monitoring. Whether that zone holds — and whether spot demand, ETF flows, and stablecoin liquidity recover in time to defend it — is the only question that matters in the sessions ahead. Watch $73,000 as the level whose loss would remove the final structural argument for a near-term recovery.
Disclaimer: The views and analysis presented in this article are for informational purposes only and reflect the author’s perspective, not financial advice. Technical patterns and indicators discussed are subject to market volatility and may or may not yield the anticipated results. Investors are advised to exercise caution, conduct independent research, and make decisions aligned with their individual risk tolerance.
Bitcoin is at $75,522 — down 6.28% in 24 hours — after a failed recovery above $80,000CryptoQuant analyst @xwinfinance: "spot buying has not recovered enough to support a sustainable uptrend"11,003 BTC left exchanges on Nov. 5; large-wallet accumulation turned positive — but ETF flows and stablecoin liquidity remain weakWatch $73,000 — loss of this level removes the final structural case for near-term recovery
Bitcoin is trading at $75,522 — down 6.28% in 24 hours and carrying a market cap of $1.52 trillion — after a recovery above $80,000 collapsed without confirmation from the one metric that actually matters: spot demand. The futures market offered a temporary reprieve. The spot market did not follow. That divergence, according to a CryptoQuant analyst, is precisely why the rebound failed.
An analyst publishing under the handle @xwinfinance on CryptoQuant’s Quicktake platform identified the structural gap that ended the $80K recovery. In their words: “The key issue is still spot demand. Futures positioning improved temporarily, but spot buying has not recovered enough to support a sustainable uptrend.” This is not a technical observation about a single candle — it is a diagnosis of the demand structure underlying the entire recovery attempt.
BTC Exchange Outflows | Source: @cryptoquant_com (X)
Why Futures Cannot Carry a Sustainable Rally Alone
The distinction between futures-driven and spot-driven price moves matters because they carry fundamentally different durability. Futures positioning can shift in hours — driven by leverage, funding rate arbitrage, or short-covering. Spot demand reflects genuine buyers who are acquiring and removing BTC from circulation. When spot demand is absent, any futures-led rally is structurally unsupported: it can lift price, but it cannot hold it.
This is exactly what the chart data shows. According to the CryptoQuant analysis, exchange outflows registered approximately 11,003 BTC leaving exchanges on November 5 — a constructive signal in isolation. The 60-day accumulation metric for wallets holding more than 10,000 BTC also turned positive over the same period. These are real signals. But they exist alongside a contradicting data point: retail-sized BTC inflows to Binance rose sharply, suggesting that shorter-term holders — the cohort most likely to sell into strength — may still be under distribution pressure.
The Three Metrics That Must Recover Together
The analyst’s framework is explicit. For a durable rebound, three conditions must converge simultaneously — not sequentially:
Spot demand must recover from its current suppressed stateETF flows must reverse from their current weekly weaknessStablecoin liquidity must rebuild — it has not recovered as of the time of publication
ETF flows are a particularly important variable here. Spot Bitcoin ETF flows represent institutionally-sourced spot demand — the exact category of buying that the market is currently missing. When ETF flows are weak on a weekly basis, as they are now, it compounds the absence of organic spot buying. Stablecoin liquidity acts as dry powder: without sufficient stablecoin supply ready to convert into BTC, the market lacks the fuel for sustained upside even when sentiment improves.
None of these three metrics has shown the simultaneous recovery needed to validate a new leg higher. This, in the analyst’s framing, means the burden of proof remains entirely on the bulls.
The $73,000–$76,000 Zone: The Structural Pivot
With BTC currently at $75,522, the market is sitting inside the support zone the CryptoQuant analyst identifies as the near-term pivot: $73,000–$76,000. This is the range that must hold for any recovery thesis to remain structurally intact. The analyst’s framing is deliberate: “Can BTC hold the $73,000–$76,000 support zone?” — posed as an open question, not a prediction.
The macro context matters here. According to the CryptoQuant report, BTC’s pullback from $80,000 coincided with a sharp sell-off in U.S. tech and AI stocks — a correlation that underscores how intertwined Bitcoin’s near-term moves have become with risk-asset sentiment. When equity markets de-risk, the spot demand that should be the foundation of a crypto rally often retreats in parallel. This dynamic reinforces why spot demand is the analyst’s primary focus rather than derivatives positioning. For more on how Bitcoin’s on-chain structure has evolved through this period, see Bitcoin Bottom Is In — Short-Term Holder Realized Price Confirms Local Floor and Bitcoin Tests Trader Realized Price — The Level That Flips From Support to Resistance.
What the On-Chain Data Says — And What It Doesn’t
The 11,003 BTC exchange outflow on November 5 and the positive turn in the large-wallet accumulation metric are constructive data points — but the analyst is careful not to overweight them. Selling pressure may be easing. That is not the same as buying pressure building. A market where sellers step back is different from a market where new buyers step in. The former creates a floor; the latter creates a rally.
Retail inflows to Binance rising sharply is the signal that complicates the outflow narrative. If the wallets receiving BTC from exchanges are retail-sized accounts that entered at higher prices, the exchange outflow metric is not capturing genuine accumulation by conviction holders — it may be capturing distribution to weaker hands. The analyst flags this explicitly as a reason why the near-term demand picture remains mixed. See also: Bitcoin Is Higher 1 Year After Every Midterm — But the Sample Size Is 4 for context on how macro cycles interact with Bitcoin’s demand structure.
The Analyst’s Verdict
The CryptoQuant analysis reaches a clear conclusion without offering a directional price target. Selling pressure is easing — that is acknowledged. But “a durable rebound still needs new buyers.” Those new buyers must arrive through the spot market, through ETF inflows, and supported by recovered stablecoin liquidity. Until all three are present and confirmed together, any price recovery will face the same structural ceiling that ended the $80,000 attempt.
At $75,522, Bitcoin is at the lower end of the support zone the analyst is monitoring. Whether that zone holds — and whether spot demand, ETF flows, and stablecoin liquidity recover in time to defend it — is the only question that matters in the sessions ahead. Watch $73,000 as the level whose loss would remove the final structural argument for a near-term recovery.
Disclaimer: The views and analysis presented in this article are for informational purposes only and reflect the author’s perspective, not financial advice. Technical patterns and indicators discussed are subject to market volatility and may or may not yield the anticipated results. Investors are advised to exercise caution, conduct independent research, and make decisions aligned with their individual risk tolerance.
1
156
·
--

Article
ETH Smart Trader With 100% Win Rate Opens $45.3M Long After Market DropKey Highlights
ETH smart trader at 0xe813...6d74 opens 25x long on 20,277 ETH ($45.3M) at avg entry $2,221.97 — already up $252K unrealizedWallet holds 100% win rate across 10 prior trades with $6.32M in total realized profit per LookonchainLiquidation price set at $1,128.00 — watch $2,200 as near-term invalidation and $2,282 as first profit target
Ethereum is trading at approximately $2,233.80 at the time of writing, navigating a volatile session shaped by forced liquidations and whale-driven deleveraging following the Binance hack. The token had declined toward the $2,280 range before this position was opened, with broader risk-off pressure from technology-stock selling compounding crypto market stress. On-chain signals had already flagged downside risk toward $2,000 as ETH weakened through the session.
The Move:
A perpetuals trader tracked at wallet 0xe813…6d74 opened a 25x leveraged long on 20,277.1195 ETH — a position valued at $45,307,195.81 — with an average entry price of $2,221.97. The trade was flagged by Lookonchain, which noted the wallet has achieved a 100% win rate across all 10 of its prior completed trades, accumulating $6.32 million in realized profit. The position carries a liquidation price of $1,128.00, with $1,812,287.83 posted as margin.
At the time of the Lookonchain alert, the trade showed an unrealized profit of $252,016.26 (+13.91% ROE), with the mark price at $2,233.80. The two most recent closed trades — both ETH longs executed on October 30 — returned +$374,507.56 and +$579,468.37 respectively, with combined fees of over $54,000, underscoring the scale this trader operates at.
ETH Smart Trader With 100% Win Rate Opens $45.3M Long After | Source: @lookonchain (Telegram)
ETH Smart Trader With 100% Win Rate Opens $45.3M L | Source: @lookonchain (Telegram)
What This Signals:
The entry at $2,221.97 was timed directly after ETH’s decline — a deliberate buy-the-dip structure rather than a momentum chase. On-chain analysts interpret a 25x leveraged long of this magnitude, opened into weakness by a wallet with a documented perfect track record, as a high-conviction directional bet that the dip is exhausted near current levels. The liquidation price of $1,128.00 gives the position roughly 49% of downside buffer from entry before margin is wiped — suggesting this trader is not operating on a razor-thin stop.
The critical level to watch on the upside is $2,282, which aligns with the closing prices of the two most recent profitable trades and represents the zone where this wallet has previously taken profit. On the downside, a sustained break below $2,200 would pressure the position’s unrealized gains, though the liquidation threshold remains well below current price action. It is worth noting that the broader context is adversarial: a separate whale reportedly closed over $100 million in ETH longs and flipped to a 30,000 ETH short in the same session, creating significant directional tension in the market.
The wallet at 0xe813…6d74 has closed zero positions from this current trade — meaning the full $45.3M remains active and exposed. Confirmation of the bullish thesis would come from ETH reclaiming and holding above $2,280, the zone where this trader’s prior longs were exited profitably.
Any addition to the position size or reduction of leverage would signal growing or fading conviction respectively, both trackable in real time via the Hyperbot trader dashboard. The 10-trade unbeaten record has drawn significant community attention — but it also means this is the trade that breaks the streak or extends it. Watch $2,200 as the near-term invalidation zone and $2,282 as the first meaningful profit target based on this wallet’s documented exit history.
Disclaimer: The views and analysis presented in this article are for informational purposes only and reflect the author’s perspective, not financial advice. Technical patterns and indicators discussed are subject to market volatility and may or may not yield the anticipated results. Investors are advised to exercise caution, conduct independent research, and make decisions aligned with their individual risk tolerance.
ETH Smart Trader With 100% Win Rate Opens $45.3M Long After Market Drop
Key Highlights
ETH smart trader at 0xe813...6d74 opens 25x long on 20,277 ETH ($45.3M) at avg entry $2,221.97 — already up $252K unrealizedWallet holds 100% win rate across 10 prior trades with $6.32M in total realized profit per LookonchainLiquidation price set at $1,128.00 — watch $2,200 as near-term invalidation and $2,282 as first profit target
Ethereum is trading at approximately $2,233.80 at the time of writing, navigating a volatile session shaped by forced liquidations and whale-driven deleveraging following the Binance hack. The token had declined toward the $2,280 range before this position was opened, with broader risk-off pressure from technology-stock selling compounding crypto market stress. On-chain signals had already flagged downside risk toward $2,000 as ETH weakened through the session.
The Move:
A perpetuals trader tracked at wallet 0xe813…6d74 opened a 25x leveraged long on 20,277.1195 ETH — a position valued at $45,307,195.81 — with an average entry price of $2,221.97. The trade was flagged by Lookonchain, which noted the wallet has achieved a 100% win rate across all 10 of its prior completed trades, accumulating $6.32 million in realized profit. The position carries a liquidation price of $1,128.00, with $1,812,287.83 posted as margin.
At the time of the Lookonchain alert, the trade showed an unrealized profit of $252,016.26 (+13.91% ROE), with the mark price at $2,233.80. The two most recent closed trades — both ETH longs executed on October 30 — returned +$374,507.56 and +$579,468.37 respectively, with combined fees of over $54,000, underscoring the scale this trader operates at.
ETH Smart Trader With 100% Win Rate Opens $45.3M Long After | Source: @lookonchain (Telegram)
ETH Smart Trader With 100% Win Rate Opens $45.3M L | Source: @lookonchain (Telegram)
What This Signals:
The entry at $2,221.97 was timed directly after ETH’s decline — a deliberate buy-the-dip structure rather than a momentum chase. On-chain analysts interpret a 25x leveraged long of this magnitude, opened into weakness by a wallet with a documented perfect track record, as a high-conviction directional bet that the dip is exhausted near current levels. The liquidation price of $1,128.00 gives the position roughly 49% of downside buffer from entry before margin is wiped — suggesting this trader is not operating on a razor-thin stop.
The critical level to watch on the upside is $2,282, which aligns with the closing prices of the two most recent profitable trades and represents the zone where this wallet has previously taken profit. On the downside, a sustained break below $2,200 would pressure the position’s unrealized gains, though the liquidation threshold remains well below current price action. It is worth noting that the broader context is adversarial: a separate whale reportedly closed over $100 million in ETH longs and flipped to a 30,000 ETH short in the same session, creating significant directional tension in the market.
The wallet at 0xe813…6d74 has closed zero positions from this current trade — meaning the full $45.3M remains active and exposed. Confirmation of the bullish thesis would come from ETH reclaiming and holding above $2,280, the zone where this trader’s prior longs were exited profitably.
Any addition to the position size or reduction of leverage would signal growing or fading conviction respectively, both trackable in real time via the Hyperbot trader dashboard. The 10-trade unbeaten record has drawn significant community attention — but it also means this is the trade that breaks the streak or extends it. Watch $2,200 as the near-term invalidation zone and $2,282 as the first meaningful profit target based on this wallet’s documented exit history.
Disclaimer: The views and analysis presented in this article are for informational purposes only and reflect the author’s perspective, not financial advice. Technical patterns and indicators discussed are subject to market volatility and may or may not yield the anticipated results. Investors are advised to exercise caution, conduct independent research, and make decisions aligned with their individual risk tolerance.
ETH smart trader at 0xe813...6d74 opens 25x long on 20,277 ETH ($45.3M) at avg entry $2,221.97 — already up $252K unrealizedWallet holds 100% win rate across 10 prior trades with $6.32M in total realized profit per LookonchainLiquidation price set at $1,128.00 — watch $2,200 as near-term invalidation and $2,282 as first profit target
Ethereum is trading at approximately $2,233.80 at the time of writing, navigating a volatile session shaped by forced liquidations and whale-driven deleveraging following the Binance hack. The token had declined toward the $2,280 range before this position was opened, with broader risk-off pressure from technology-stock selling compounding crypto market stress. On-chain signals had already flagged downside risk toward $2,000 as ETH weakened through the session.
The Move:
A perpetuals trader tracked at wallet 0xe813…6d74 opened a 25x leveraged long on 20,277.1195 ETH — a position valued at $45,307,195.81 — with an average entry price of $2,221.97. The trade was flagged by Lookonchain, which noted the wallet has achieved a 100% win rate across all 10 of its prior completed trades, accumulating $6.32 million in realized profit. The position carries a liquidation price of $1,128.00, with $1,812,287.83 posted as margin.
At the time of the Lookonchain alert, the trade showed an unrealized profit of $252,016.26 (+13.91% ROE), with the mark price at $2,233.80. The two most recent closed trades — both ETH longs executed on October 30 — returned +$374,507.56 and +$579,468.37 respectively, with combined fees of over $54,000, underscoring the scale this trader operates at.
ETH Smart Trader With 100% Win Rate Opens $45.3M Long After | Source: @lookonchain (Telegram)
ETH Smart Trader With 100% Win Rate Opens $45.3M L | Source: @lookonchain (Telegram)
What This Signals:
The entry at $2,221.97 was timed directly after ETH’s decline — a deliberate buy-the-dip structure rather than a momentum chase. On-chain analysts interpret a 25x leveraged long of this magnitude, opened into weakness by a wallet with a documented perfect track record, as a high-conviction directional bet that the dip is exhausted near current levels. The liquidation price of $1,128.00 gives the position roughly 49% of downside buffer from entry before margin is wiped — suggesting this trader is not operating on a razor-thin stop.
The critical level to watch on the upside is $2,282, which aligns with the closing prices of the two most recent profitable trades and represents the zone where this wallet has previously taken profit. On the downside, a sustained break below $2,200 would pressure the position’s unrealized gains, though the liquidation threshold remains well below current price action. It is worth noting that the broader context is adversarial: a separate whale reportedly closed over $100 million in ETH longs and flipped to a 30,000 ETH short in the same session, creating significant directional tension in the market.
The wallet at 0xe813…6d74 has closed zero positions from this current trade — meaning the full $45.3M remains active and exposed. Confirmation of the bullish thesis would come from ETH reclaiming and holding above $2,280, the zone where this trader’s prior longs were exited profitably.
Any addition to the position size or reduction of leverage would signal growing or fading conviction respectively, both trackable in real time via the Hyperbot trader dashboard. The 10-trade unbeaten record has drawn significant community attention — but it also means this is the trade that breaks the streak or extends it. Watch $2,200 as the near-term invalidation zone and $2,282 as the first meaningful profit target based on this wallet’s documented exit history.
Disclaimer: The views and analysis presented in this article are for informational purposes only and reflect the author’s perspective, not financial advice. Technical patterns and indicators discussed are subject to market volatility and may or may not yield the anticipated results. Investors are advised to exercise caution, conduct independent research, and make decisions aligned with their individual risk tolerance.
1
125
·
--
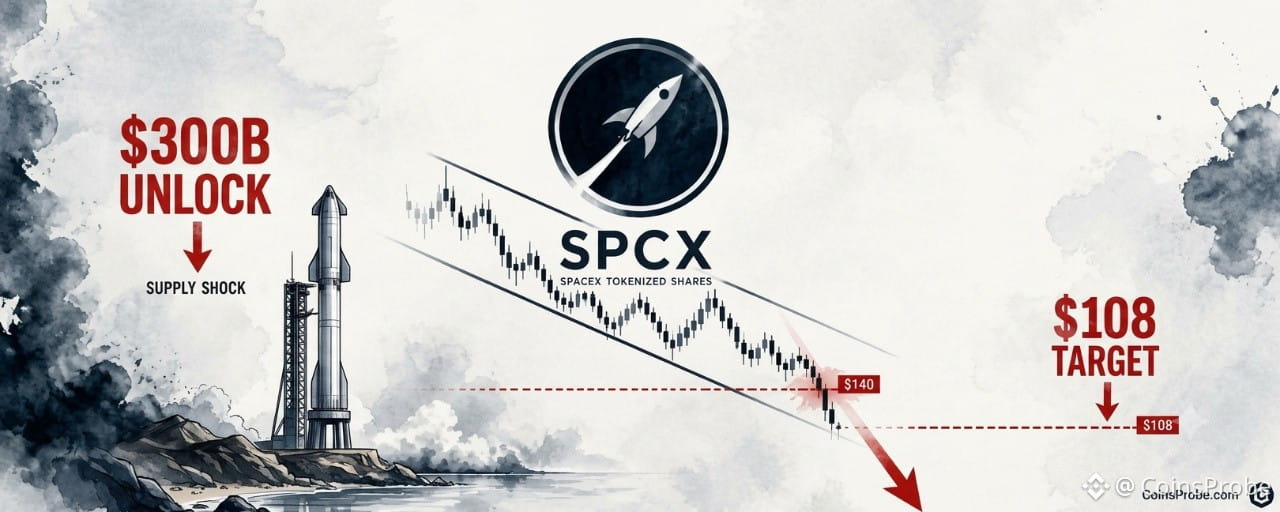
Article
SPCX Breaks Channel Support — $300B Unlock Sends Price Toward $108Key Highlights
SPCX trades near $122.64 after breaking the $140 mid-range channel support in November 2024~2 billion SPCX shares unlocked in October alone — representing over $300B in newly available supply per analystAnalyst downside target is $108, the next labeled support below current price on the daily chart
SpaceX’s tokenized shares are under severe selling pressure. SPCX is currently trading near $122.64, having broken below the $140 mid-range support level of its parallel channel — a breakdown that one analyst says is being driven by one of the largest share unlock events in recent memory.
An analyst identifying the move flags that nearly 2 billion SPCX shares were unlocked in October alone, representing more than $300 billion in newly available supply. The core thesis is straightforward: that volume of newly unlocked stock creates structural selling pressure that technical support levels cannot absorb. The price is now targeting $108 — the next major support below the broken zone.
SPCX Daily Chart Analysis | Source: @alicharts (X)
The $300 Billion Supply Shock — Why This Breakdown Is Structural
Share unlocks are not speculative events — they are contractual. When locked shares become freely tradeable, holders who received them at pre-unlock valuations gain the ability to sell. At scale, the effect is mechanical: supply increases faster than demand can absorb it, and prices move to find a new clearing level.
In October, approximately 2 billion SPCX shares entered the market in this way. At current price levels near $122.64, that unlock represents roughly $245 billion in newly liquid stock — and the analyst’s $300 billion figure implies the unlock was priced at higher valuations, reinforcing the magnitude of the supply addition. For context on how SpaceX’s equity position interacts with broader asset markets, the potential implications of a SpaceX-Tesla merger and what it could mean for Bitcoin treasuries has been covered separately.
This is not a sentiment-driven selloff. It is supply-side arithmetic arriving at a fixed date. The parallel channel structure that had contained SPCX’s price action since the August peak provided technical reference points, but the mid-range support at $140 was unable to hold against the volume of sellers that the unlock introduced. The $140 level has now been decisively broken, and SPCX is trading roughly 12.4% below it at $122.64.
The Chart: From $172 Peak to Broken Support
The daily chart shared by the analyst documents the full price trajectory from August through early November 2024. SPCX peaked near $172 in August, then entered a sharp downtrend before staging a rounded consolidation and partial recovery through September and October — an inverted-U recovery pattern that ultimately failed. November brought a sharp resumption of the downtrend, with price breaking cleanly below $155, then $140, to reach the current level near $122.64.
The chart identifies $108 as the next significant support level below current price. With the $140 zone now acting as overhead resistance rather than support, and no intermediate level labeled between $122.64 and $108, the analyst’s downside target represents a further decline of approximately 12% from current levels. The structure of the chart — a failed recovery followed by accelerating breakdown — does not suggest stabilization is imminent without a clear catalyst to absorb supply.
Key Levels: What the Price Action Shows
Three levels define the current structure:
$140 — Prior mid-range channel support, now broken. Reclaiming this level on a closing basis would be the minimum condition to argue the breakdown is false.$122.64 — Current price. The asset is in open air between broken support and the next labeled floor.$108 — The analyst’s stated downside target and the next identifiable support on the daily chart.
Above current price, $155 and $172 represent prior structural levels that now function as resistance in any recovery attempt. Neither is in immediate play while the $108 target remains unresolved. Separately, Tesla’s own technical structure has been breaking out — a contrast worth noting given the two companies’ intertwined narratives.
Is This Confined to SPCX?
The unlock mechanism is specific to SPCX’s share structure — it is not a macro crypto or equity event. The $300 billion in newly unlocked supply is a SPCX-specific calendar event, not a reflection of broader market conditions. That specificity is what makes the analyst’s argument credible: the catalyst is named, dated, and quantified. It is not a sentiment read or a derivative of Bitcoin’s price action.
What it does share with broader tokenized equity dynamics is the question of liquidity depth. Tokenized shares of private companies operate in thinner markets than their publicly traded counterparts. When a supply event of this magnitude hits a thinner market, price discovery moves faster and further than it might in a deep-liquidity venue. The $140 support breaking with apparent conviction, rather than holding for multiple sessions, is consistent with that dynamic.
SPCX’s breakdown also arrives against the backdrop of elevated attention on Elon Musk-affiliated assets — the intersection of crypto and Musk-linked narratives has been a recurring market theme — though the analyst’s thesis here is explicitly supply-side, not narrative-driven.
SPCX has broken the $140 channel support on the back of a $300 billion share unlock in October. The current price of $122.64 sits in unstructured territory between broken support and the $108 target the analyst identifies as the next floor. No labeled level exists between here and $108. Watch $140 — a sustained close back above that level would be the first signal that the supply overhang is being absorbed. Until then, the path of least resistance points to $108.
Disclaimer: The views and analysis presented in this article are for informational purposes only and reflect the author’s perspective, not financial advice. Technical patterns and indicators discussed are subject to market volatility and may or may not yield the anticipated results. Investors are advised to exercise caution, conduct independent research, and make decisions aligned with their individual risk tolerance.
SPCX Breaks Channel Support — $300B Unlock Sends Price Toward $108
Key Highlights
SPCX trades near $122.64 after breaking the $140 mid-range channel support in November 2024~2 billion SPCX shares unlocked in October alone — representing over $300B in newly available supply per analystAnalyst downside target is $108, the next labeled support below current price on the daily chart
SpaceX’s tokenized shares are under severe selling pressure. SPCX is currently trading near $122.64, having broken below the $140 mid-range support level of its parallel channel — a breakdown that one analyst says is being driven by one of the largest share unlock events in recent memory.
An analyst identifying the move flags that nearly 2 billion SPCX shares were unlocked in October alone, representing more than $300 billion in newly available supply. The core thesis is straightforward: that volume of newly unlocked stock creates structural selling pressure that technical support levels cannot absorb. The price is now targeting $108 — the next major support below the broken zone.
SPCX Daily Chart Analysis | Source: @alicharts (X)
The $300 Billion Supply Shock — Why This Breakdown Is Structural
Share unlocks are not speculative events — they are contractual. When locked shares become freely tradeable, holders who received them at pre-unlock valuations gain the ability to sell. At scale, the effect is mechanical: supply increases faster than demand can absorb it, and prices move to find a new clearing level.
In October, approximately 2 billion SPCX shares entered the market in this way. At current price levels near $122.64, that unlock represents roughly $245 billion in newly liquid stock — and the analyst’s $300 billion figure implies the unlock was priced at higher valuations, reinforcing the magnitude of the supply addition. For context on how SpaceX’s equity position interacts with broader asset markets, the potential implications of a SpaceX-Tesla merger and what it could mean for Bitcoin treasuries has been covered separately.
This is not a sentiment-driven selloff. It is supply-side arithmetic arriving at a fixed date. The parallel channel structure that had contained SPCX’s price action since the August peak provided technical reference points, but the mid-range support at $140 was unable to hold against the volume of sellers that the unlock introduced. The $140 level has now been decisively broken, and SPCX is trading roughly 12.4% below it at $122.64.
The Chart: From $172 Peak to Broken Support
The daily chart shared by the analyst documents the full price trajectory from August through early November 2024. SPCX peaked near $172 in August, then entered a sharp downtrend before staging a rounded consolidation and partial recovery through September and October — an inverted-U recovery pattern that ultimately failed. November brought a sharp resumption of the downtrend, with price breaking cleanly below $155, then $140, to reach the current level near $122.64.
The chart identifies $108 as the next significant support level below current price. With the $140 zone now acting as overhead resistance rather than support, and no intermediate level labeled between $122.64 and $108, the analyst’s downside target represents a further decline of approximately 12% from current levels. The structure of the chart — a failed recovery followed by accelerating breakdown — does not suggest stabilization is imminent without a clear catalyst to absorb supply.
Key Levels: What the Price Action Shows
Three levels define the current structure:
$140 — Prior mid-range channel support, now broken. Reclaiming this level on a closing basis would be the minimum condition to argue the breakdown is false.$122.64 — Current price. The asset is in open air between broken support and the next labeled floor.$108 — The analyst’s stated downside target and the next identifiable support on the daily chart.
Above current price, $155 and $172 represent prior structural levels that now function as resistance in any recovery attempt. Neither is in immediate play while the $108 target remains unresolved. Separately, Tesla’s own technical structure has been breaking out — a contrast worth noting given the two companies’ intertwined narratives.
Is This Confined to SPCX?
The unlock mechanism is specific to SPCX’s share structure — it is not a macro crypto or equity event. The $300 billion in newly unlocked supply is a SPCX-specific calendar event, not a reflection of broader market conditions. That specificity is what makes the analyst’s argument credible: the catalyst is named, dated, and quantified. It is not a sentiment read or a derivative of Bitcoin’s price action.
What it does share with broader tokenized equity dynamics is the question of liquidity depth. Tokenized shares of private companies operate in thinner markets than their publicly traded counterparts. When a supply event of this magnitude hits a thinner market, price discovery moves faster and further than it might in a deep-liquidity venue. The $140 support breaking with apparent conviction, rather than holding for multiple sessions, is consistent with that dynamic.
SPCX’s breakdown also arrives against the backdrop of elevated attention on Elon Musk-affiliated assets — the intersection of crypto and Musk-linked narratives has been a recurring market theme — though the analyst’s thesis here is explicitly supply-side, not narrative-driven.
SPCX has broken the $140 channel support on the back of a $300 billion share unlock in October. The current price of $122.64 sits in unstructured territory between broken support and the $108 target the analyst identifies as the next floor. No labeled level exists between here and $108. Watch $140 — a sustained close back above that level would be the first signal that the supply overhang is being absorbed. Until then, the path of least resistance points to $108.
Disclaimer: The views and analysis presented in this article are for informational purposes only and reflect the author’s perspective, not financial advice. Technical patterns and indicators discussed are subject to market volatility and may or may not yield the anticipated results. Investors are advised to exercise caution, conduct independent research, and make decisions aligned with their individual risk tolerance.
SPCX trades near $122.64 after breaking the $140 mid-range channel support in November 2024~2 billion SPCX shares unlocked in October alone — representing over $300B in newly available supply per analystAnalyst downside target is $108, the next labeled support below current price on the daily chart
SpaceX’s tokenized shares are under severe selling pressure. SPCX is currently trading near $122.64, having broken below the $140 mid-range support level of its parallel channel — a breakdown that one analyst says is being driven by one of the largest share unlock events in recent memory.
An analyst identifying the move flags that nearly 2 billion SPCX shares were unlocked in October alone, representing more than $300 billion in newly available supply. The core thesis is straightforward: that volume of newly unlocked stock creates structural selling pressure that technical support levels cannot absorb. The price is now targeting $108 — the next major support below the broken zone.
SPCX Daily Chart Analysis | Source: @alicharts (X)
The $300 Billion Supply Shock — Why This Breakdown Is Structural
Share unlocks are not speculative events — they are contractual. When locked shares become freely tradeable, holders who received them at pre-unlock valuations gain the ability to sell. At scale, the effect is mechanical: supply increases faster than demand can absorb it, and prices move to find a new clearing level.
In October, approximately 2 billion SPCX shares entered the market in this way. At current price levels near $122.64, that unlock represents roughly $245 billion in newly liquid stock — and the analyst’s $300 billion figure implies the unlock was priced at higher valuations, reinforcing the magnitude of the supply addition. For context on how SpaceX’s equity position interacts with broader asset markets, the potential implications of a SpaceX-Tesla merger and what it could mean for Bitcoin treasuries has been covered separately.
This is not a sentiment-driven selloff. It is supply-side arithmetic arriving at a fixed date. The parallel channel structure that had contained SPCX’s price action since the August peak provided technical reference points, but the mid-range support at $140 was unable to hold against the volume of sellers that the unlock introduced. The $140 level has now been decisively broken, and SPCX is trading roughly 12.4% below it at $122.64.
The Chart: From $172 Peak to Broken Support
The daily chart shared by the analyst documents the full price trajectory from August through early November 2024. SPCX peaked near $172 in August, then entered a sharp downtrend before staging a rounded consolidation and partial recovery through September and October — an inverted-U recovery pattern that ultimately failed. November brought a sharp resumption of the downtrend, with price breaking cleanly below $155, then $140, to reach the current level near $122.64.
The chart identifies $108 as the next significant support level below current price. With the $140 zone now acting as overhead resistance rather than support, and no intermediate level labeled between $122.64 and $108, the analyst’s downside target represents a further decline of approximately 12% from current levels. The structure of the chart — a failed recovery followed by accelerating breakdown — does not suggest stabilization is imminent without a clear catalyst to absorb supply.
Key Levels: What the Price Action Shows
Three levels define the current structure:
$140 — Prior mid-range channel support, now broken. Reclaiming this level on a closing basis would be the minimum condition to argue the breakdown is false.$122.64 — Current price. The asset is in open air between broken support and the next labeled floor.$108 — The analyst’s stated downside target and the next identifiable support on the daily chart.
Above current price, $155 and $172 represent prior structural levels that now function as resistance in any recovery attempt. Neither is in immediate play while the $108 target remains unresolved. Separately, Tesla’s own technical structure has been breaking out — a contrast worth noting given the two companies’ intertwined narratives.
Is This Confined to SPCX?
The unlock mechanism is specific to SPCX’s share structure — it is not a macro crypto or equity event. The $300 billion in newly unlocked supply is a SPCX-specific calendar event, not a reflection of broader market conditions. That specificity is what makes the analyst’s argument credible: the catalyst is named, dated, and quantified. It is not a sentiment read or a derivative of Bitcoin’s price action.
What it does share with broader tokenized equity dynamics is the question of liquidity depth. Tokenized shares of private companies operate in thinner markets than their publicly traded counterparts. When a supply event of this magnitude hits a thinner market, price discovery moves faster and further than it might in a deep-liquidity venue. The $140 support breaking with apparent conviction, rather than holding for multiple sessions, is consistent with that dynamic.
SPCX’s breakdown also arrives against the backdrop of elevated attention on Elon Musk-affiliated assets — the intersection of crypto and Musk-linked narratives has been a recurring market theme — though the analyst’s thesis here is explicitly supply-side, not narrative-driven.
SPCX has broken the $140 channel support on the back of a $300 billion share unlock in October. The current price of $122.64 sits in unstructured territory between broken support and the $108 target the analyst identifies as the next floor. No labeled level exists between here and $108. Watch $140 — a sustained close back above that level would be the first signal that the supply overhang is being absorbed. Until then, the path of least resistance points to $108.
Disclaimer: The views and analysis presented in this article are for informational purposes only and reflect the author’s perspective, not financial advice. Technical patterns and indicators discussed are subject to market volatility and may or may not yield the anticipated results. Investors are advised to exercise caution, conduct independent research, and make decisions aligned with their individual risk tolerance.
259
·
--

Article
INJ Jumps as Nasdaq Approves Listing of Canary Staked INJ ETF Under Ticker INJCKey Highlights
Nasdaq approved the listing of the Canary Staked INJ ETF under ticker INJC, the first U.S.-listed staked product for Injective.The fund targets staking at least 90% of its INJ holdings and reinvests rewards, with a 1.10% annual sponsor fee.Trading remains pending until the S-1 registration statement becomes effective with the SEC.
Injective (INJ) surged more than 8.5% to trade around $8.26 on November 5 after Nasdaq approved the listing of the Canary Staked INJ ETF, the first U.S.-listed staked product for Injective’s native token, according to a Form 8-A filed by Canary Capital on November 3, 2026. The fund will trade under the ticker INJC.
The product is designed to hold spot INJ while targeting staking of at least 90% of its holdings under normal conditions. Staking rewards are intended to be reinvested into the fund rather than distributed as cash. Public trading cannot begin until the separate S-1 registration statement becomes effective with the SEC.
Canary Staked INJ ETF | Source: @injective (X)
Structure and Fees
Per Canary’s latest amended S-1 (filed October 23, 2026):
Primary objective: Price exposure to INJ held by the trust, less expenses.Secondary objective: Earn additional INJ through staking on the Injective proof-of-stake network.Staking target: At least 90% of INJ under normal circumstances. A portion remains unstaked to manage redemptions and expenses.Unbonding period: 21 days once tokens are undelegated. During this window, tokens cannot be transferred and do not earn rewards.Custodian: BitGo (controls private keys for both staked and unstaked INJ).Sponsor fee: 1.10% annually of the trust’s INJ holdings.Staking fees: Aggregate fees to the staking provider, sponsor, and custodian are capped at 30% of rewards. The trust is expected to retain 70%, which is generally restaked.
The Injective Foundation has committed to an initial seed purchase of up to $15 million in shares, paid in INJ.
Context vs. Existing Spot ETFs
Unlike pure spot products that simply track price, INJC is structured as a staked ETF. This approach is already present in several U.S. spot SOL and AVAX products (for example, certain Bitwise and Grayscale staking versions), but it will be the first such product specifically for INJ.
The distinction matters for two reasons:
Shareholders receive the combined effect of INJ price movement plus net staking yield inside a brokerage account.A large percentage of the fund’s INJ will be locked in the unbonding process at any given time, which affects liquidity management.
Current Status and Next Steps
Nasdaq’s listing approval covers the exchange listing of the shares. It does not make the S-1 effective or authorize share sales. Canary filed Form 8-A on November 3 confirming the Nasdaq listing application was approved under the INJC ticker. Trading remains pending the effectiveness of the registration statement and any final operational readiness.
INJ was trading near $8.15–$8.20 as of early November 5, 2026, with a market capitalization of approximately $815–$820 million. The token remains well below its March 2024 all-time high of roughly $52.62.
This listing moves INJ one step closer to regulated U.S. brokerage access with built-in staking yield. Actual launch timing still depends on the SEC clearing the S-1.
Disclaimer: The views and analysis presented in this article are for informational purposes only and reflect the author’s perspective, not financial advice. Technical patterns and indicators discussed are subject to market volatility and may or may not yield the anticipated results. Investors are advised to exercise caution, conduct independent research, and make decisions aligned with their individual risk tolerance.
INJ Jumps as Nasdaq Approves Listing of Canary Staked INJ ETF Under Ticker INJC
Key Highlights
Nasdaq approved the listing of the Canary Staked INJ ETF under ticker INJC, the first U.S.-listed staked product for Injective.The fund targets staking at least 90% of its INJ holdings and reinvests rewards, with a 1.10% annual sponsor fee.Trading remains pending until the S-1 registration statement becomes effective with the SEC.
Injective (INJ) surged more than 8.5% to trade around $8.26 on November 5 after Nasdaq approved the listing of the Canary Staked INJ ETF, the first U.S.-listed staked product for Injective’s native token, according to a Form 8-A filed by Canary Capital on November 3, 2026. The fund will trade under the ticker INJC.
The product is designed to hold spot INJ while targeting staking of at least 90% of its holdings under normal conditions. Staking rewards are intended to be reinvested into the fund rather than distributed as cash. Public trading cannot begin until the separate S-1 registration statement becomes effective with the SEC.
Canary Staked INJ ETF | Source: @injective (X)
Structure and Fees
Per Canary’s latest amended S-1 (filed October 23, 2026):
Primary objective: Price exposure to INJ held by the trust, less expenses.Secondary objective: Earn additional INJ through staking on the Injective proof-of-stake network.Staking target: At least 90% of INJ under normal circumstances. A portion remains unstaked to manage redemptions and expenses.Unbonding period: 21 days once tokens are undelegated. During this window, tokens cannot be transferred and do not earn rewards.Custodian: BitGo (controls private keys for both staked and unstaked INJ).Sponsor fee: 1.10% annually of the trust’s INJ holdings.Staking fees: Aggregate fees to the staking provider, sponsor, and custodian are capped at 30% of rewards. The trust is expected to retain 70%, which is generally restaked.
The Injective Foundation has committed to an initial seed purchase of up to $15 million in shares, paid in INJ.
Context vs. Existing Spot ETFs
Unlike pure spot products that simply track price, INJC is structured as a staked ETF. This approach is already present in several U.S. spot SOL and AVAX products (for example, certain Bitwise and Grayscale staking versions), but it will be the first such product specifically for INJ.
The distinction matters for two reasons:
Shareholders receive the combined effect of INJ price movement plus net staking yield inside a brokerage account.A large percentage of the fund’s INJ will be locked in the unbonding process at any given time, which affects liquidity management.
Current Status and Next Steps
Nasdaq’s listing approval covers the exchange listing of the shares. It does not make the S-1 effective or authorize share sales. Canary filed Form 8-A on November 3 confirming the Nasdaq listing application was approved under the INJC ticker. Trading remains pending the effectiveness of the registration statement and any final operational readiness.
INJ was trading near $8.15–$8.20 as of early November 5, 2026, with a market capitalization of approximately $815–$820 million. The token remains well below its March 2024 all-time high of roughly $52.62.
This listing moves INJ one step closer to regulated U.S. brokerage access with built-in staking yield. Actual launch timing still depends on the SEC clearing the S-1.
Disclaimer: The views and analysis presented in this article are for informational purposes only and reflect the author’s perspective, not financial advice. Technical patterns and indicators discussed are subject to market volatility and may or may not yield the anticipated results. Investors are advised to exercise caution, conduct independent research, and make decisions aligned with their individual risk tolerance.
Nasdaq approved the listing of the Canary Staked INJ ETF under ticker INJC, the first U.S.-listed staked product for Injective.The fund targets staking at least 90% of its INJ holdings and reinvests rewards, with a 1.10% annual sponsor fee.Trading remains pending until the S-1 registration statement becomes effective with the SEC.
Injective (INJ) surged more than 8.5% to trade around $8.26 on November 5 after Nasdaq approved the listing of the Canary Staked INJ ETF, the first U.S.-listed staked product for Injective’s native token, according to a Form 8-A filed by Canary Capital on November 3, 2026. The fund will trade under the ticker INJC.
The product is designed to hold spot INJ while targeting staking of at least 90% of its holdings under normal conditions. Staking rewards are intended to be reinvested into the fund rather than distributed as cash. Public trading cannot begin until the separate S-1 registration statement becomes effective with the SEC.
Canary Staked INJ ETF | Source: @injective (X)
Structure and Fees
Per Canary’s latest amended S-1 (filed October 23, 2026):
Primary objective: Price exposure to INJ held by the trust, less expenses.Secondary objective: Earn additional INJ through staking on the Injective proof-of-stake network.Staking target: At least 90% of INJ under normal circumstances. A portion remains unstaked to manage redemptions and expenses.Unbonding period: 21 days once tokens are undelegated. During this window, tokens cannot be transferred and do not earn rewards.Custodian: BitGo (controls private keys for both staked and unstaked INJ).Sponsor fee: 1.10% annually of the trust’s INJ holdings.Staking fees: Aggregate fees to the staking provider, sponsor, and custodian are capped at 30% of rewards. The trust is expected to retain 70%, which is generally restaked.
The Injective Foundation has committed to an initial seed purchase of up to $15 million in shares, paid in INJ.
Context vs. Existing Spot ETFs
Unlike pure spot products that simply track price, INJC is structured as a staked ETF. This approach is already present in several U.S. spot SOL and AVAX products (for example, certain Bitwise and Grayscale staking versions), but it will be the first such product specifically for INJ.
The distinction matters for two reasons:
Shareholders receive the combined effect of INJ price movement plus net staking yield inside a brokerage account.A large percentage of the fund’s INJ will be locked in the unbonding process at any given time, which affects liquidity management.
Current Status and Next Steps
Nasdaq’s listing approval covers the exchange listing of the shares. It does not make the S-1 effective or authorize share sales. Canary filed Form 8-A on November 3 confirming the Nasdaq listing application was approved under the INJC ticker. Trading remains pending the effectiveness of the registration statement and any final operational readiness.
INJ was trading near $8.15–$8.20 as of early November 5, 2026, with a market capitalization of approximately $815–$820 million. The token remains well below its March 2024 all-time high of roughly $52.62.
This listing moves INJ one step closer to regulated U.S. brokerage access with built-in staking yield. Actual launch timing still depends on the SEC clearing the S-1.
Disclaimer: The views and analysis presented in this article are for informational purposes only and reflect the author’s perspective, not financial advice. Technical patterns and indicators discussed are subject to market volatility and may or may not yield the anticipated results. Investors are advised to exercise caution, conduct independent research, and make decisions aligned with their individual risk tolerance.
478
·
--
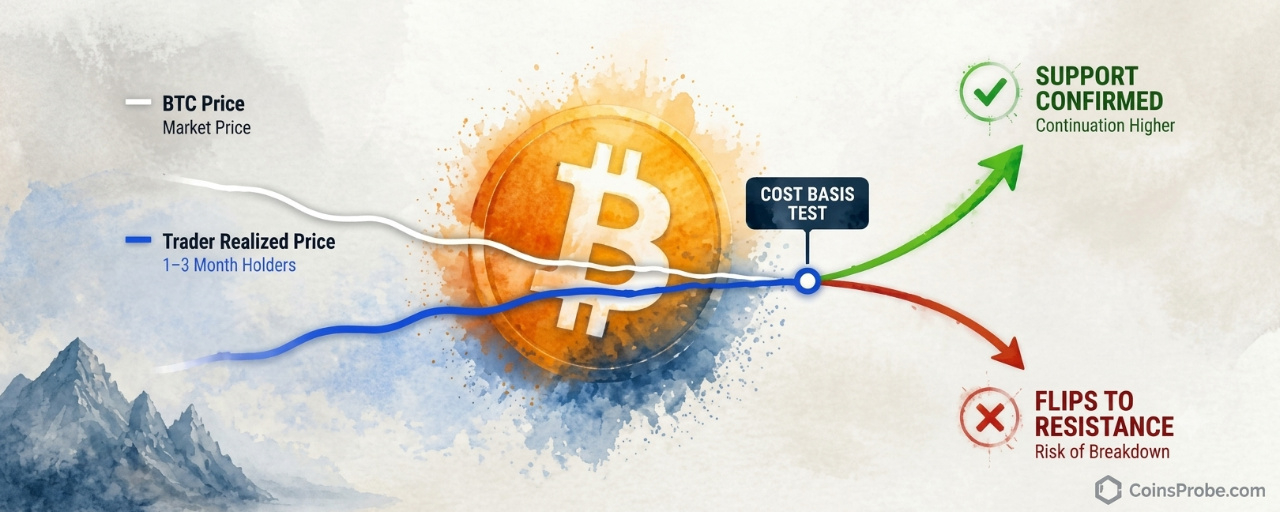
Article
Bitcoin Tests Trader Realized Price — The Level That Flips From Support to ResistanceKey Highlights
Bitcoin is trading at $78,264 (+2.03%) and has converged with the Trader Realized Price — the average cost basis of BTC moved on-chain in the past 1–3 monthsCryptoQuant analyst: if BTC holds and moves away, recent participants' cost basis is confirmed as support; a break below flips it to resistanceSpot Bitcoin ETFs saw $115.6M net outflow on Nov 3, with 3 consecutive outflow days totaling $1.0B — IBIT led with $95.0M in outflows per SoSoValueKey forward risk: CPI data releases November 9; markets price 83.2% probability of a December FOMC rate hike per SoSoValue
Bitcoin is trading at approximately $78,264 — up 2.03% in the past 24 hours — but the number that matters most right now is not on the price ticker. It is on-chain. According to a CryptoQuant Quicktake published on November 4, 2026, Bitcoin has converged almost exactly with its Trader Realized Price, an on-chain level that has historically acted as either a critical support floor or a hard resistance ceiling — depending entirely on which side of it price settles.
An on-chain analyst publishing through CryptoQuant identifies this convergence as the most consequential test of the current correction. “If BTC successfully holds around the Trader Realized Price and begins to move away from it again, it would suggest that the average cost basis of recent participants is still functioning as support,” the analyst writes in the full CryptoQuant Quicktake note. The framing is deliberate: this is not a declaration of a bottom. It is a framework for reading what the market’s reaction at this level will tell us about where pressure comes from next.
What the Trader Realized Price Actually Measures
The Trader Realized Price is not a moving average. It is not a trendline drawn on a chart. It is an on-chain derived metric that represents the average acquisition price of Bitcoin that last moved on-chain between one and three months ago. In other words: it is the average cost basis of relatively recent market participants — the cohort that bought within the past quarter and has not yet moved their coins again.
That definition carries a specific implication. When Bitcoin trades above this level, the recent-buyer cohort sits in unrealized profit. Pullbacks toward the Trader Realized Price in that environment tend to attract support — buyers near breakeven have little incentive to sell, and others see the dip as a re-entry near a known cost cluster. When Bitcoin trades below this level, the same cohort moves into unrealized loss. The cost basis that previously attracted buyers now becomes a ceiling: traders waiting to exit at breakeven provide supply every time price attempts a recovery toward that level.
That dual nature — support above, resistance below — is precisely what makes the current test significant. Price and cost basis have met. The reaction from here will distinguish between two structurally different outcomes.
Bitcoin Trader On-Chain Realized Price Bands Analysis | Source: @cryptoquant_com (X)
The Current Test — What the Chart Shows
The on-chain chart shared by CryptoQuant spans approximately January 2023 through late 2026 and plots Bitcoin’s price alongside the Trader Realized Price in blue. Both lines trended upward together from early 2023 through mid-2025, then both declined and converged at the chart’s right edge. At the time of writing, the white price line is touching and fluctuating directly around the blue Trader Realized Price line. The test is ongoing — no confirmed hold above or breakdown below has yet occurred. This is an active, unresolved test at a historically significant level.
The chart’s visual message reinforces the analyst’s written note precisely: price and cost basis are meeting. What happens next is the question the market is currently answering in real time.
Why the Outcome Here Is Binary
The CryptoQuant analyst is explicit that this level does not guarantee a bottom. The interesting question, as stated in the published note, is whether the market can actually defend it. The analyst lays out both interpretations with equal weight:
If price holds and moves away: The average cost basis of recent participants is confirmed as support. The correction found buyers at a logical on-chain level. Upside continuation becomes the structural read.
If price breaks below and fails to reclaim: Recent market participants move increasingly into unrealized losses. The Trader Realized Price transitions from a support reference to a resistance reference. Sellers who bought in the past one-to-three months will use any recovery toward that level as a breakeven exit — adding supply into any bounce.
That transition — from support to resistance — is not theoretical. It is the documented historical behavior of this metric. According to the CryptoQuant note, once price loses the Trader Realized Price and fails to reclaim it, the same cost basis can later become resistance as traders use a return to breakeven as an opportunity to exit. The mechanism is straightforward: unrealized loss creates incentive to sell into recovery, not hold through it.
ETF Flows Add Context to the Pressure
The on-chain test does not exist in a vacuum. Spot Bitcoin ETF data via SoSoValue shows a $115.6M net outflow on the latest trading day (November 3, 2026), with three consecutive outflow days totaling a net $1.0 billion over the past five sessions. IBIT led outflows at $95.0M, while FBTC recorded a modest $6.8M inflow. Total ETF net assets stand at $99.16B against a cumulative net inflow of $56.47B since launch.
The ETF outflow streak is relevant context here: institutional selling pressure through the ETF wrapper is one structural reason Bitcoin has converged downward toward the Trader Realized Price rather than bouncing from above it. Strategy (MSTR) continues to accumulate — adding 811 BTC for $65.5M most recently, bringing total holdings to 849,327 BTC — but that corporate buying has not been sufficient to absorb the institutional outflow trend over the past week.
Separately, markets are currently pricing an 83.2% probability of a rate hike at the December 9 FOMC meeting, per SoSoValue data. A tightening macro backdrop — rising rate expectations combined with ETF outflows — creates the external pressure environment within which this on-chain test is occurring. For context on how Bitcoin has historically navigated macro inflection points, see Bitcoin’s 2026 Midterm Anomaly — +20.4% Pre-Vote, 4/4 Post-Vote Gains and Bitcoin Is Higher 1 Year After Every Midterm — But the Sample Size Is 4.
CPI data drops November 9, followed by PPI on November 12 and Retail Sales on November 16. Any upside inflation surprise would reinforce rate-hike expectations and intensify the pressure on risk assets — including at exactly the level Bitcoin is currently testing.
What Confirmation Requires
The analyst does not name a specific price level in dollar terms as the Trader Realized Price — the metric is dynamic and updates with on-chain activity. What the note does specify is the behavioral confirmation required for each scenario:
For the support thesis to be confirmed: Bitcoin must hold around the Trader Realized Price and begin to move away from it with momentum. A flat hold at the level without directional separation does not confirm support — it prolongs the test.
For the resistance thesis to become operative: Price must break below the Trader Realized Price and fail to reclaim it on a subsequent recovery attempt. The failure to reclaim — not just the break — is what converts the level from support to resistance in the analyst’s framework.
Upcoming macro data releases this week — particularly CPI on November 9 — represent a near-term catalyst that could force resolution of this test in either direction.
Bullish Scenario
Bitcoin holds the Trader Realized Price and begins printing higher closes above it. The recent-participant cohort remains in unrealized profit, removing breakeven selling pressure. The on-chain structure reads as a corrective pullback finding support at a logical cost-basis level, with the path of least resistance shifting upward.
Bearish Scenario
Bitcoin breaks below the Trader Realized Price and fails to reclaim it on a recovery attempt. The recent-participant cohort moves into unrealized loss. Every subsequent bounce toward the Trader Realized Price generates breakeven selling pressure from that cohort — turning a former support cluster into a resistance ceiling. The structural read shifts to distribution, not accumulation.
The Trader Realized Price is the single most important on-chain level Bitcoin is facing right now. Price and the average cost basis of recent market participants have converged — a collision that, per CryptoQuant’s published analysis, has historically resolved in one of two structurally opposite ways. Three consecutive days of ETF outflows totaling $1.0 billion, an 83.2% market-implied probability of a December rate hike, and CPI data due November 9 all frame the external environment. The on-chain test is active and unresolved. Watch whether Bitcoin can hold and separate from the Trader Realized Price — or whether it breaks below and returns to test it from underneath.
Disclaimer: The views and analysis presented in this article are for informational purposes only and reflect the author’s perspective, not financial advice. Technical patterns and indicators discussed are subject to market volatility and may or may not yield the anticipated results. Investors are advised to exercise caution, conduct independent research, and make decisions aligned with their individual risk tolerance.
Bitcoin Tests Trader Realized Price — The Level That Flips From Support to Resistance
Key Highlights
Bitcoin is trading at $78,264 (+2.03%) and has converged with the Trader Realized Price — the average cost basis of BTC moved on-chain in the past 1–3 monthsCryptoQuant analyst: if BTC holds and moves away, recent participants' cost basis is confirmed as support; a break below flips it to resistanceSpot Bitcoin ETFs saw $115.6M net outflow on Nov 3, with 3 consecutive outflow days totaling $1.0B — IBIT led with $95.0M in outflows per SoSoValueKey forward risk: CPI data releases November 9; markets price 83.2% probability of a December FOMC rate hike per SoSoValue
Bitcoin is trading at approximately $78,264 — up 2.03% in the past 24 hours — but the number that matters most right now is not on the price ticker. It is on-chain. According to a CryptoQuant Quicktake published on November 4, 2026, Bitcoin has converged almost exactly with its Trader Realized Price, an on-chain level that has historically acted as either a critical support floor or a hard resistance ceiling — depending entirely on which side of it price settles.
An on-chain analyst publishing through CryptoQuant identifies this convergence as the most consequential test of the current correction. “If BTC successfully holds around the Trader Realized Price and begins to move away from it again, it would suggest that the average cost basis of recent participants is still functioning as support,” the analyst writes in the full CryptoQuant Quicktake note. The framing is deliberate: this is not a declaration of a bottom. It is a framework for reading what the market’s reaction at this level will tell us about where pressure comes from next.
What the Trader Realized Price Actually Measures
The Trader Realized Price is not a moving average. It is not a trendline drawn on a chart. It is an on-chain derived metric that represents the average acquisition price of Bitcoin that last moved on-chain between one and three months ago. In other words: it is the average cost basis of relatively recent market participants — the cohort that bought within the past quarter and has not yet moved their coins again.
That definition carries a specific implication. When Bitcoin trades above this level, the recent-buyer cohort sits in unrealized profit. Pullbacks toward the Trader Realized Price in that environment tend to attract support — buyers near breakeven have little incentive to sell, and others see the dip as a re-entry near a known cost cluster. When Bitcoin trades below this level, the same cohort moves into unrealized loss. The cost basis that previously attracted buyers now becomes a ceiling: traders waiting to exit at breakeven provide supply every time price attempts a recovery toward that level.
That dual nature — support above, resistance below — is precisely what makes the current test significant. Price and cost basis have met. The reaction from here will distinguish between two structurally different outcomes.
Bitcoin Trader On-Chain Realized Price Bands Analysis | Source: @cryptoquant_com (X)
The Current Test — What the Chart Shows
The on-chain chart shared by CryptoQuant spans approximately January 2023 through late 2026 and plots Bitcoin’s price alongside the Trader Realized Price in blue. Both lines trended upward together from early 2023 through mid-2025, then both declined and converged at the chart’s right edge. At the time of writing, the white price line is touching and fluctuating directly around the blue Trader Realized Price line. The test is ongoing — no confirmed hold above or breakdown below has yet occurred. This is an active, unresolved test at a historically significant level.
The chart’s visual message reinforces the analyst’s written note precisely: price and cost basis are meeting. What happens next is the question the market is currently answering in real time.
Why the Outcome Here Is Binary
The CryptoQuant analyst is explicit that this level does not guarantee a bottom. The interesting question, as stated in the published note, is whether the market can actually defend it. The analyst lays out both interpretations with equal weight:
If price holds and moves away: The average cost basis of recent participants is confirmed as support. The correction found buyers at a logical on-chain level. Upside continuation becomes the structural read.
If price breaks below and fails to reclaim: Recent market participants move increasingly into unrealized losses. The Trader Realized Price transitions from a support reference to a resistance reference. Sellers who bought in the past one-to-three months will use any recovery toward that level as a breakeven exit — adding supply into any bounce.
That transition — from support to resistance — is not theoretical. It is the documented historical behavior of this metric. According to the CryptoQuant note, once price loses the Trader Realized Price and fails to reclaim it, the same cost basis can later become resistance as traders use a return to breakeven as an opportunity to exit. The mechanism is straightforward: unrealized loss creates incentive to sell into recovery, not hold through it.
ETF Flows Add Context to the Pressure
The on-chain test does not exist in a vacuum. Spot Bitcoin ETF data via SoSoValue shows a $115.6M net outflow on the latest trading day (November 3, 2026), with three consecutive outflow days totaling a net $1.0 billion over the past five sessions. IBIT led outflows at $95.0M, while FBTC recorded a modest $6.8M inflow. Total ETF net assets stand at $99.16B against a cumulative net inflow of $56.47B since launch.
The ETF outflow streak is relevant context here: institutional selling pressure through the ETF wrapper is one structural reason Bitcoin has converged downward toward the Trader Realized Price rather than bouncing from above it. Strategy (MSTR) continues to accumulate — adding 811 BTC for $65.5M most recently, bringing total holdings to 849,327 BTC — but that corporate buying has not been sufficient to absorb the institutional outflow trend over the past week.
Separately, markets are currently pricing an 83.2% probability of a rate hike at the December 9 FOMC meeting, per SoSoValue data. A tightening macro backdrop — rising rate expectations combined with ETF outflows — creates the external pressure environment within which this on-chain test is occurring. For context on how Bitcoin has historically navigated macro inflection points, see Bitcoin’s 2026 Midterm Anomaly — +20.4% Pre-Vote, 4/4 Post-Vote Gains and Bitcoin Is Higher 1 Year After Every Midterm — But the Sample Size Is 4.
CPI data drops November 9, followed by PPI on November 12 and Retail Sales on November 16. Any upside inflation surprise would reinforce rate-hike expectations and intensify the pressure on risk assets — including at exactly the level Bitcoin is currently testing.
What Confirmation Requires
The analyst does not name a specific price level in dollar terms as the Trader Realized Price — the metric is dynamic and updates with on-chain activity. What the note does specify is the behavioral confirmation required for each scenario:
For the support thesis to be confirmed: Bitcoin must hold around the Trader Realized Price and begin to move away from it with momentum. A flat hold at the level without directional separation does not confirm support — it prolongs the test.
For the resistance thesis to become operative: Price must break below the Trader Realized Price and fail to reclaim it on a subsequent recovery attempt. The failure to reclaim — not just the break — is what converts the level from support to resistance in the analyst’s framework.
Upcoming macro data releases this week — particularly CPI on November 9 — represent a near-term catalyst that could force resolution of this test in either direction.
Bullish Scenario
Bitcoin holds the Trader Realized Price and begins printing higher closes above it. The recent-participant cohort remains in unrealized profit, removing breakeven selling pressure. The on-chain structure reads as a corrective pullback finding support at a logical cost-basis level, with the path of least resistance shifting upward.
Bearish Scenario
Bitcoin breaks below the Trader Realized Price and fails to reclaim it on a recovery attempt. The recent-participant cohort moves into unrealized loss. Every subsequent bounce toward the Trader Realized Price generates breakeven selling pressure from that cohort — turning a former support cluster into a resistance ceiling. The structural read shifts to distribution, not accumulation.
The Trader Realized Price is the single most important on-chain level Bitcoin is facing right now. Price and the average cost basis of recent market participants have converged — a collision that, per CryptoQuant’s published analysis, has historically resolved in one of two structurally opposite ways. Three consecutive days of ETF outflows totaling $1.0 billion, an 83.2% market-implied probability of a December rate hike, and CPI data due November 9 all frame the external environment. The on-chain test is active and unresolved. Watch whether Bitcoin can hold and separate from the Trader Realized Price — or whether it breaks below and returns to test it from underneath.
Disclaimer: The views and analysis presented in this article are for informational purposes only and reflect the author’s perspective, not financial advice. Technical patterns and indicators discussed are subject to market volatility and may or may not yield the anticipated results. Investors are advised to exercise caution, conduct independent research, and make decisions aligned with their individual risk tolerance.
Bitcoin is trading at $78,264 (+2.03%) and has converged with the Trader Realized Price — the average cost basis of BTC moved on-chain in the past 1–3 monthsCryptoQuant analyst: if BTC holds and moves away, recent participants' cost basis is confirmed as support; a break below flips it to resistanceSpot Bitcoin ETFs saw $115.6M net outflow on Nov 3, with 3 consecutive outflow days totaling $1.0B — IBIT led with $95.0M in outflows per SoSoValueKey forward risk: CPI data releases November 9; markets price 83.2% probability of a December FOMC rate hike per SoSoValue
Bitcoin is trading at approximately $78,264 — up 2.03% in the past 24 hours — but the number that matters most right now is not on the price ticker. It is on-chain. According to a CryptoQuant Quicktake published on November 4, 2026, Bitcoin has converged almost exactly with its Trader Realized Price, an on-chain level that has historically acted as either a critical support floor or a hard resistance ceiling — depending entirely on which side of it price settles.
An on-chain analyst publishing through CryptoQuant identifies this convergence as the most consequential test of the current correction. “If BTC successfully holds around the Trader Realized Price and begins to move away from it again, it would suggest that the average cost basis of recent participants is still functioning as support,” the analyst writes in the full CryptoQuant Quicktake note. The framing is deliberate: this is not a declaration of a bottom. It is a framework for reading what the market’s reaction at this level will tell us about where pressure comes from next.
What the Trader Realized Price Actually Measures
The Trader Realized Price is not a moving average. It is not a trendline drawn on a chart. It is an on-chain derived metric that represents the average acquisition price of Bitcoin that last moved on-chain between one and three months ago. In other words: it is the average cost basis of relatively recent market participants — the cohort that bought within the past quarter and has not yet moved their coins again.
That definition carries a specific implication. When Bitcoin trades above this level, the recent-buyer cohort sits in unrealized profit. Pullbacks toward the Trader Realized Price in that environment tend to attract support — buyers near breakeven have little incentive to sell, and others see the dip as a re-entry near a known cost cluster. When Bitcoin trades below this level, the same cohort moves into unrealized loss. The cost basis that previously attracted buyers now becomes a ceiling: traders waiting to exit at breakeven provide supply every time price attempts a recovery toward that level.
That dual nature — support above, resistance below — is precisely what makes the current test significant. Price and cost basis have met. The reaction from here will distinguish between two structurally different outcomes.
Bitcoin Trader On-Chain Realized Price Bands Analysis | Source: @cryptoquant_com (X)
The Current Test — What the Chart Shows
The on-chain chart shared by CryptoQuant spans approximately January 2023 through late 2026 and plots Bitcoin’s price alongside the Trader Realized Price in blue. Both lines trended upward together from early 2023 through mid-2025, then both declined and converged at the chart’s right edge. At the time of writing, the white price line is touching and fluctuating directly around the blue Trader Realized Price line. The test is ongoing — no confirmed hold above or breakdown below has yet occurred. This is an active, unresolved test at a historically significant level.
The chart’s visual message reinforces the analyst’s written note precisely: price and cost basis are meeting. What happens next is the question the market is currently answering in real time.
Why the Outcome Here Is Binary
The CryptoQuant analyst is explicit that this level does not guarantee a bottom. The interesting question, as stated in the published note, is whether the market can actually defend it. The analyst lays out both interpretations with equal weight:
If price holds and moves away: The average cost basis of recent participants is confirmed as support. The correction found buyers at a logical on-chain level. Upside continuation becomes the structural read.
If price breaks below and fails to reclaim: Recent market participants move increasingly into unrealized losses. The Trader Realized Price transitions from a support reference to a resistance reference. Sellers who bought in the past one-to-three months will use any recovery toward that level as a breakeven exit — adding supply into any bounce.
That transition — from support to resistance — is not theoretical. It is the documented historical behavior of this metric. According to the CryptoQuant note, once price loses the Trader Realized Price and fails to reclaim it, the same cost basis can later become resistance as traders use a return to breakeven as an opportunity to exit. The mechanism is straightforward: unrealized loss creates incentive to sell into recovery, not hold through it.
ETF Flows Add Context to the Pressure
The on-chain test does not exist in a vacuum. Spot Bitcoin ETF data via SoSoValue shows a $115.6M net outflow on the latest trading day (November 3, 2026), with three consecutive outflow days totaling a net $1.0 billion over the past five sessions. IBIT led outflows at $95.0M, while FBTC recorded a modest $6.8M inflow. Total ETF net assets stand at $99.16B against a cumulative net inflow of $56.47B since launch.
The ETF outflow streak is relevant context here: institutional selling pressure through the ETF wrapper is one structural reason Bitcoin has converged downward toward the Trader Realized Price rather than bouncing from above it. Strategy (MSTR) continues to accumulate — adding 811 BTC for $65.5M most recently, bringing total holdings to 849,327 BTC — but that corporate buying has not been sufficient to absorb the institutional outflow trend over the past week.
Separately, markets are currently pricing an 83.2% probability of a rate hike at the December 9 FOMC meeting, per SoSoValue data. A tightening macro backdrop — rising rate expectations combined with ETF outflows — creates the external pressure environment within which this on-chain test is occurring. For context on how Bitcoin has historically navigated macro inflection points, see Bitcoin’s 2026 Midterm Anomaly — +20.4% Pre-Vote, 4/4 Post-Vote Gains and Bitcoin Is Higher 1 Year After Every Midterm — But the Sample Size Is 4.
CPI data drops November 9, followed by PPI on November 12 and Retail Sales on November 16. Any upside inflation surprise would reinforce rate-hike expectations and intensify the pressure on risk assets — including at exactly the level Bitcoin is currently testing.
What Confirmation Requires
The analyst does not name a specific price level in dollar terms as the Trader Realized Price — the metric is dynamic and updates with on-chain activity. What the note does specify is the behavioral confirmation required for each scenario:
For the support thesis to be confirmed: Bitcoin must hold around the Trader Realized Price and begin to move away from it with momentum. A flat hold at the level without directional separation does not confirm support — it prolongs the test.
For the resistance thesis to become operative: Price must break below the Trader Realized Price and fail to reclaim it on a subsequent recovery attempt. The failure to reclaim — not just the break — is what converts the level from support to resistance in the analyst’s framework.
Upcoming macro data releases this week — particularly CPI on November 9 — represent a near-term catalyst that could force resolution of this test in either direction.
Bullish Scenario
Bitcoin holds the Trader Realized Price and begins printing higher closes above it. The recent-participant cohort remains in unrealized profit, removing breakeven selling pressure. The on-chain structure reads as a corrective pullback finding support at a logical cost-basis level, with the path of least resistance shifting upward.
Bearish Scenario
Bitcoin breaks below the Trader Realized Price and fails to reclaim it on a recovery attempt. The recent-participant cohort moves into unrealized loss. Every subsequent bounce toward the Trader Realized Price generates breakeven selling pressure from that cohort — turning a former support cluster into a resistance ceiling. The structural read shifts to distribution, not accumulation.
The Trader Realized Price is the single most important on-chain level Bitcoin is facing right now. Price and the average cost basis of recent market participants have converged — a collision that, per CryptoQuant’s published analysis, has historically resolved in one of two structurally opposite ways. Three consecutive days of ETF outflows totaling $1.0 billion, an 83.2% market-implied probability of a December rate hike, and CPI data due November 9 all frame the external environment. The on-chain test is active and unresolved. Watch whether Bitcoin can hold and separate from the Trader Realized Price — or whether it breaks below and returns to test it from underneath.
Disclaimer: The views and analysis presented in this article are for informational purposes only and reflect the author’s perspective, not financial advice. Technical patterns and indicators discussed are subject to market volatility and may or may not yield the anticipated results. Investors are advised to exercise caution, conduct independent research, and make decisions aligned with their individual risk tolerance.
92
·
--
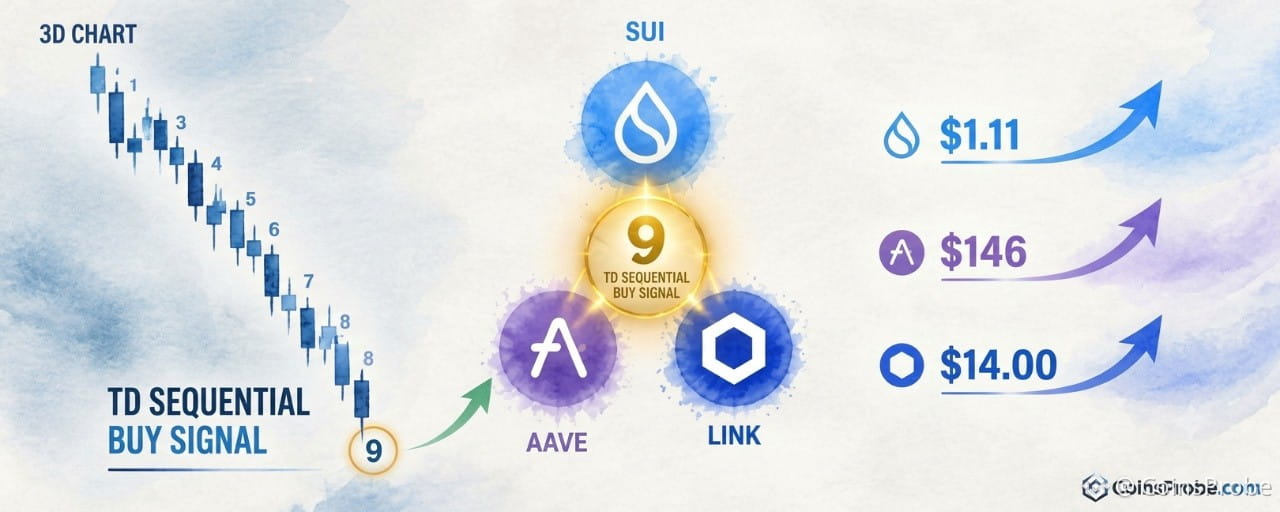
Article
SUI, AAVE, and LINK Flash TD Sequential Buy Signals on 3-Day ChartsKey Highlights
SUI trades at $0.9130 (+6.06% 24h, -26.69% 30d) after printing a TD Sequential 9 buy signal on the 3-day chart per @alichartsAll three altcoins — SUI, AAVE ($127.55), and LINK ($11.11) — printed simultaneous 3-day TD Sequential exhaustion counts in one analyst threadSUI must close above $0.90 on the 3-day chart to open targets at $1.11 then $1.20; AAVE watches $146; LINK watches $12.50
Three altcoins are printing simultaneous exhaustion signals on their 3-day charts — and one analyst is watching all three at once. SUI is currently trading at $0.9130, up 6.06% in the past 24 hours, but down 26.69% over the past 30 days, with a market cap of approximately $3.78 billion. The TD Sequential buy signal — a momentum exhaustion indicator — has just completed its nine-count on SUI’s 3-day chart, flagging a potential trend reversal at a critical price zone.
An analyst identifying as @alicharts published a five-part thread on November 4, 2026, flagging identical TD Sequential buy signals across SUI, AAVE, and Chainlink on the same timeframe. “The TD Sequential has flashed a buy signal on the 3-day chart, suggesting a rebound could be near,” the analyst wrote of SUI. The same exhaustion structure has appeared across all three assets within the same analytical window — a convergence that is statistically uncommon and structurally significant. This follows a broader pattern: ETH, SOL, and ADA flashed identical 3-day TD Sequential buy signals in a prior cycle, underscoring how this indicator tends to cluster across altcoins during broad downtrend exhaustion phases.
What the TD Sequential Actually Measures
The TD Sequential is a momentum exhaustion indicator, not a price-level tool. It counts nine consecutive candlestick closes in the same direction — lower closes for a buy signal — to identify when a trending move has statistically overextended itself. The “9” print is not a prediction of reversal; it is a flag that the directional move has used up its momentum budget. The market then either reverses, consolidates, or continues with significantly reduced force. The signal is most reliable on higher timeframes. A 3-day chart signal carries more structural weight than a 4-hour or daily signal because each candle represents 72 hours of price discovery.
Signal 1 — SUI: $0.90 Is the Line
SUI has completed a TD Sequential 9 buy signal on its 3-day chart after a sustained descending sequence from above $1.40 toward the current $0.9130 area. The 3-day chart shows a clear downtrend, with the exhaustion count completing near the dashed $0.897 price marker. The signal is present — but price remains at the resistance threshold, not above it.
SUI 3-Day Chart Analysis | Source: @alicharts (X) Markets Desk
The analyst identifies $0.90 as the immediate resistance level to clear. A confirmed close above $0.90 on the 3-day chart would open a path toward $1.11 as the first target, followed by the setup resistance trendline near $1.20. At current pricing of $0.9130, SUI is marginally above the $0.897 chart marker but has not yet produced a confirmed 3-day close above $0.90. The pattern is still forming — no breakout has been confirmed on this chart.
Signal 2 — AAVE: Below Support, But Exhaustion Flashing
AAVE’s setup carries a more complex structure. Two TD Sequential “9” signals appear on the 3-day chart: one bearish count (marked with a downward arrow at a prior high) and a fresh bullish count (upward arrow at the current low near $127.55). The chart also shows a horizontal rectangular box drawn across the chart — price has broken below the lower boundary of that structure, confirming a breakdown below support.
AAVE 3-Day Chart Analysis | Source: @alicharts (X)
This creates a nuanced read: price is in breakdown territory (below the drawn box), but the TD Sequential is simultaneously flagging selling exhaustion. The analyst is watching for buying pressure to materialize, with an initial rebound target of $146. A move through $146 would open the path toward the next level. The breakdown context means the signal requires confirmation through price action — not just the count completion — before it can be acted on with conviction.
Signal 3 — LINK: Exhaustion at $11.11
Chainlink completes the trio. The 3-day LINK chart shows a prior TD Sequential sell signal (9-count with downward arrow) that marked an earlier high, followed by a prolonged bearish sequence. At the current low near $11.11, a fresh TD Sequential buy signal has printed — count “9” with an upward triangle, followed by candle “1” beginning the new sequence.
LINK 3-Day Chart Analysis | Source: @alicharts (X)
Price sits at the $11.11 dashed level, well below the $12.50 axis marker and significantly beneath prior resistance near $14.00. The pattern is still forming — count “1” has just appeared, meaning the reversal structure is in its earliest phase. No upside breakout has been confirmed. The analyst’s framework on LINK mirrors SUI and AAVE: exhaustion is present, but price must follow through.
Why Three Simultaneous Signals Matter
Isolated TD Sequential signals occur regularly across individual assets. Three assets printing the same 3-day exhaustion count at the same time — during a period of broad altcoin weakness, with SUI down 26.69% over 30 days — is a different category of observation. It suggests the selling pressure across mid-cap altcoins has reached a collective exhaustion point rather than a single-asset technical event. The TOTAL2 wave structure context matters here: if the broader altcoin market is approaching a macro inflection, these simultaneous signals would arrive at the structurally correct moment.
That said, simultaneous signals are not simultaneous confirmations. Each asset requires its own price action to validate the exhaustion read. The signal says the downtrend has counted out — it does not say when the reversal begins, or how large it will be. Stablecoin liquidity conditions will also determine whether the buying pressure needed to validate these signals is available in the market.
Levels That Define Each Setup
Asset Current Price Key Resistance Target 1 Target 2 SUI $0.9130 $0.90 (3-day close) $1.11 $1.20 trendline $AAVE $127.55 Box lower boundary $146 Not specified LINK $11.11 $12.50 $14.00 zone Not specified
Levels per @alicharts thread, November 4, 2026
Three altcoins, one timeframe, one indicator, three simultaneous exhaustion prints. The TD Sequential has flagged that the sellers on $SUI , AAVE, and $LINK have counted out on the 3-day chart — but the burden of proof now falls on the buyers. For SUI, that proof arrives at a confirmed 3-day close above $0.90. For AAVE, it requires buying pressure to absorb the breakdown and push price back toward $146. For LINK, it means holding $11.11 and beginning the first meaningful recovery candle above $12.50. Watch $0.90 on SUI — that is the first domino.
Disclaimer: The views and analysis presented in this article are for informational purposes only and reflect the author’s perspective, not financial advice. Technical patterns and indicators discussed are subject to market volatility and may or may not yield the anticipated results. Investors are advised to exercise caution, conduct independent research, and make decisions aligned with their individual risk tolerance.
SUI, AAVE, and LINK Flash TD Sequential Buy Signals on 3-Day Charts
Key Highlights
SUI trades at $0.9130 (+6.06% 24h, -26.69% 30d) after printing a TD Sequential 9 buy signal on the 3-day chart per @alichartsAll three altcoins — SUI, AAVE ($127.55), and LINK ($11.11) — printed simultaneous 3-day TD Sequential exhaustion counts in one analyst threadSUI must close above $0.90 on the 3-day chart to open targets at $1.11 then $1.20; AAVE watches $146; LINK watches $12.50
Three altcoins are printing simultaneous exhaustion signals on their 3-day charts — and one analyst is watching all three at once. SUI is currently trading at $0.9130, up 6.06% in the past 24 hours, but down 26.69% over the past 30 days, with a market cap of approximately $3.78 billion. The TD Sequential buy signal — a momentum exhaustion indicator — has just completed its nine-count on SUI’s 3-day chart, flagging a potential trend reversal at a critical price zone.
An analyst identifying as @alicharts published a five-part thread on November 4, 2026, flagging identical TD Sequential buy signals across SUI, AAVE, and Chainlink on the same timeframe. “The TD Sequential has flashed a buy signal on the 3-day chart, suggesting a rebound could be near,” the analyst wrote of SUI. The same exhaustion structure has appeared across all three assets within the same analytical window — a convergence that is statistically uncommon and structurally significant. This follows a broader pattern: ETH, SOL, and ADA flashed identical 3-day TD Sequential buy signals in a prior cycle, underscoring how this indicator tends to cluster across altcoins during broad downtrend exhaustion phases.
What the TD Sequential Actually Measures
The TD Sequential is a momentum exhaustion indicator, not a price-level tool. It counts nine consecutive candlestick closes in the same direction — lower closes for a buy signal — to identify when a trending move has statistically overextended itself. The “9” print is not a prediction of reversal; it is a flag that the directional move has used up its momentum budget. The market then either reverses, consolidates, or continues with significantly reduced force. The signal is most reliable on higher timeframes. A 3-day chart signal carries more structural weight than a 4-hour or daily signal because each candle represents 72 hours of price discovery.
Signal 1 — SUI: $0.90 Is the Line
SUI has completed a TD Sequential 9 buy signal on its 3-day chart after a sustained descending sequence from above $1.40 toward the current $0.9130 area. The 3-day chart shows a clear downtrend, with the exhaustion count completing near the dashed $0.897 price marker. The signal is present — but price remains at the resistance threshold, not above it.
SUI 3-Day Chart Analysis | Source: @alicharts (X) Markets Desk
The analyst identifies $0.90 as the immediate resistance level to clear. A confirmed close above $0.90 on the 3-day chart would open a path toward $1.11 as the first target, followed by the setup resistance trendline near $1.20. At current pricing of $0.9130, SUI is marginally above the $0.897 chart marker but has not yet produced a confirmed 3-day close above $0.90. The pattern is still forming — no breakout has been confirmed on this chart.
Signal 2 — AAVE: Below Support, But Exhaustion Flashing
AAVE’s setup carries a more complex structure. Two TD Sequential “9” signals appear on the 3-day chart: one bearish count (marked with a downward arrow at a prior high) and a fresh bullish count (upward arrow at the current low near $127.55). The chart also shows a horizontal rectangular box drawn across the chart — price has broken below the lower boundary of that structure, confirming a breakdown below support.
AAVE 3-Day Chart Analysis | Source: @alicharts (X)
This creates a nuanced read: price is in breakdown territory (below the drawn box), but the TD Sequential is simultaneously flagging selling exhaustion. The analyst is watching for buying pressure to materialize, with an initial rebound target of $146. A move through $146 would open the path toward the next level. The breakdown context means the signal requires confirmation through price action — not just the count completion — before it can be acted on with conviction.
Signal 3 — LINK: Exhaustion at $11.11
Chainlink completes the trio. The 3-day LINK chart shows a prior TD Sequential sell signal (9-count with downward arrow) that marked an earlier high, followed by a prolonged bearish sequence. At the current low near $11.11, a fresh TD Sequential buy signal has printed — count “9” with an upward triangle, followed by candle “1” beginning the new sequence.
LINK 3-Day Chart Analysis | Source: @alicharts (X)
Price sits at the $11.11 dashed level, well below the $12.50 axis marker and significantly beneath prior resistance near $14.00. The pattern is still forming — count “1” has just appeared, meaning the reversal structure is in its earliest phase. No upside breakout has been confirmed. The analyst’s framework on LINK mirrors SUI and AAVE: exhaustion is present, but price must follow through.
Why Three Simultaneous Signals Matter
Isolated TD Sequential signals occur regularly across individual assets. Three assets printing the same 3-day exhaustion count at the same time — during a period of broad altcoin weakness, with SUI down 26.69% over 30 days — is a different category of observation. It suggests the selling pressure across mid-cap altcoins has reached a collective exhaustion point rather than a single-asset technical event. The TOTAL2 wave structure context matters here: if the broader altcoin market is approaching a macro inflection, these simultaneous signals would arrive at the structurally correct moment.
That said, simultaneous signals are not simultaneous confirmations. Each asset requires its own price action to validate the exhaustion read. The signal says the downtrend has counted out — it does not say when the reversal begins, or how large it will be. Stablecoin liquidity conditions will also determine whether the buying pressure needed to validate these signals is available in the market.
Levels That Define Each Setup
Asset Current Price Key Resistance Target 1 Target 2 SUI $0.9130 $0.90 (3-day close) $1.11 $1.20 trendline $AAVE $127.55 Box lower boundary $146 Not specified LINK $11.11 $12.50 $14.00 zone Not specified
Levels per @alicharts thread, November 4, 2026
Three altcoins, one timeframe, one indicator, three simultaneous exhaustion prints. The TD Sequential has flagged that the sellers on $SUI , AAVE, and $LINK have counted out on the 3-day chart — but the burden of proof now falls on the buyers. For SUI, that proof arrives at a confirmed 3-day close above $0.90. For AAVE, it requires buying pressure to absorb the breakdown and push price back toward $146. For LINK, it means holding $11.11 and beginning the first meaningful recovery candle above $12.50. Watch $0.90 on SUI — that is the first domino.
Disclaimer: The views and analysis presented in this article are for informational purposes only and reflect the author’s perspective, not financial advice. Technical patterns and indicators discussed are subject to market volatility and may or may not yield the anticipated results. Investors are advised to exercise caution, conduct independent research, and make decisions aligned with their individual risk tolerance.
SUI trades at $0.9130 (+6.06% 24h, -26.69% 30d) after printing a TD Sequential 9 buy signal on the 3-day chart per @alichartsAll three altcoins — SUI, AAVE ($127.55), and LINK ($11.11) — printed simultaneous 3-day TD Sequential exhaustion counts in one analyst threadSUI must close above $0.90 on the 3-day chart to open targets at $1.11 then $1.20; AAVE watches $146; LINK watches $12.50
Three altcoins are printing simultaneous exhaustion signals on their 3-day charts — and one analyst is watching all three at once. SUI is currently trading at $0.9130, up 6.06% in the past 24 hours, but down 26.69% over the past 30 days, with a market cap of approximately $3.78 billion. The TD Sequential buy signal — a momentum exhaustion indicator — has just completed its nine-count on SUI’s 3-day chart, flagging a potential trend reversal at a critical price zone.
An analyst identifying as @alicharts published a five-part thread on November 4, 2026, flagging identical TD Sequential buy signals across SUI, AAVE, and Chainlink on the same timeframe. “The TD Sequential has flashed a buy signal on the 3-day chart, suggesting a rebound could be near,” the analyst wrote of SUI. The same exhaustion structure has appeared across all three assets within the same analytical window — a convergence that is statistically uncommon and structurally significant. This follows a broader pattern: ETH, SOL, and ADA flashed identical 3-day TD Sequential buy signals in a prior cycle, underscoring how this indicator tends to cluster across altcoins during broad downtrend exhaustion phases.
What the TD Sequential Actually Measures
The TD Sequential is a momentum exhaustion indicator, not a price-level tool. It counts nine consecutive candlestick closes in the same direction — lower closes for a buy signal — to identify when a trending move has statistically overextended itself. The “9” print is not a prediction of reversal; it is a flag that the directional move has used up its momentum budget. The market then either reverses, consolidates, or continues with significantly reduced force. The signal is most reliable on higher timeframes. A 3-day chart signal carries more structural weight than a 4-hour or daily signal because each candle represents 72 hours of price discovery.
Signal 1 — SUI: $0.90 Is the Line
SUI has completed a TD Sequential 9 buy signal on its 3-day chart after a sustained descending sequence from above $1.40 toward the current $0.9130 area. The 3-day chart shows a clear downtrend, with the exhaustion count completing near the dashed $0.897 price marker. The signal is present — but price remains at the resistance threshold, not above it.
SUI 3-Day Chart Analysis | Source: @alicharts (X) Markets Desk
The analyst identifies $0.90 as the immediate resistance level to clear. A confirmed close above $0.90 on the 3-day chart would open a path toward $1.11 as the first target, followed by the setup resistance trendline near $1.20. At current pricing of $0.9130, SUI is marginally above the $0.897 chart marker but has not yet produced a confirmed 3-day close above $0.90. The pattern is still forming — no breakout has been confirmed on this chart.
Signal 2 — AAVE: Below Support, But Exhaustion Flashing
AAVE’s setup carries a more complex structure. Two TD Sequential “9” signals appear on the 3-day chart: one bearish count (marked with a downward arrow at a prior high) and a fresh bullish count (upward arrow at the current low near $127.55). The chart also shows a horizontal rectangular box drawn across the chart — price has broken below the lower boundary of that structure, confirming a breakdown below support.
AAVE 3-Day Chart Analysis | Source: @alicharts (X)
This creates a nuanced read: price is in breakdown territory (below the drawn box), but the TD Sequential is simultaneously flagging selling exhaustion. The analyst is watching for buying pressure to materialize, with an initial rebound target of $146. A move through $146 would open the path toward the next level. The breakdown context means the signal requires confirmation through price action — not just the count completion — before it can be acted on with conviction.
Signal 3 — LINK: Exhaustion at $11.11
Chainlink completes the trio. The 3-day LINK chart shows a prior TD Sequential sell signal (9-count with downward arrow) that marked an earlier high, followed by a prolonged bearish sequence. At the current low near $11.11, a fresh TD Sequential buy signal has printed — count “9” with an upward triangle, followed by candle “1” beginning the new sequence.
LINK 3-Day Chart Analysis | Source: @alicharts (X)
Price sits at the $11.11 dashed level, well below the $12.50 axis marker and significantly beneath prior resistance near $14.00. The pattern is still forming — count “1” has just appeared, meaning the reversal structure is in its earliest phase. No upside breakout has been confirmed. The analyst’s framework on LINK mirrors SUI and AAVE: exhaustion is present, but price must follow through.
Why Three Simultaneous Signals Matter
Isolated TD Sequential signals occur regularly across individual assets. Three assets printing the same 3-day exhaustion count at the same time — during a period of broad altcoin weakness, with SUI down 26.69% over 30 days — is a different category of observation. It suggests the selling pressure across mid-cap altcoins has reached a collective exhaustion point rather than a single-asset technical event. The TOTAL2 wave structure context matters here: if the broader altcoin market is approaching a macro inflection, these simultaneous signals would arrive at the structurally correct moment.
That said, simultaneous signals are not simultaneous confirmations. Each asset requires its own price action to validate the exhaustion read. The signal says the downtrend has counted out — it does not say when the reversal begins, or how large it will be. Stablecoin liquidity conditions will also determine whether the buying pressure needed to validate these signals is available in the market.
Levels That Define Each Setup
Asset Current Price Key Resistance Target 1 Target 2 SUI $0.9130 $0.90 (3-day close) $1.11 $1.20 trendline $AAVE $127.55 Box lower boundary $146 Not specified LINK $11.11 $12.50 $14.00 zone Not specified
Levels per @alicharts thread, November 4, 2026
Three altcoins, one timeframe, one indicator, three simultaneous exhaustion prints. The TD Sequential has flagged that the sellers on $SUI , AAVE, and $LINK have counted out on the 3-day chart — but the burden of proof now falls on the buyers. For SUI, that proof arrives at a confirmed 3-day close above $0.90. For AAVE, it requires buying pressure to absorb the breakdown and push price back toward $146. For LINK, it means holding $11.11 and beginning the first meaningful recovery candle above $12.50. Watch $0.90 on SUI — that is the first domino.
Disclaimer: The views and analysis presented in this article are for informational purposes only and reflect the author’s perspective, not financial advice. Technical patterns and indicators discussed are subject to market volatility and may or may not yield the anticipated results. Investors are advised to exercise caution, conduct independent research, and make decisions aligned with their individual risk tolerance.
2
362
·
--
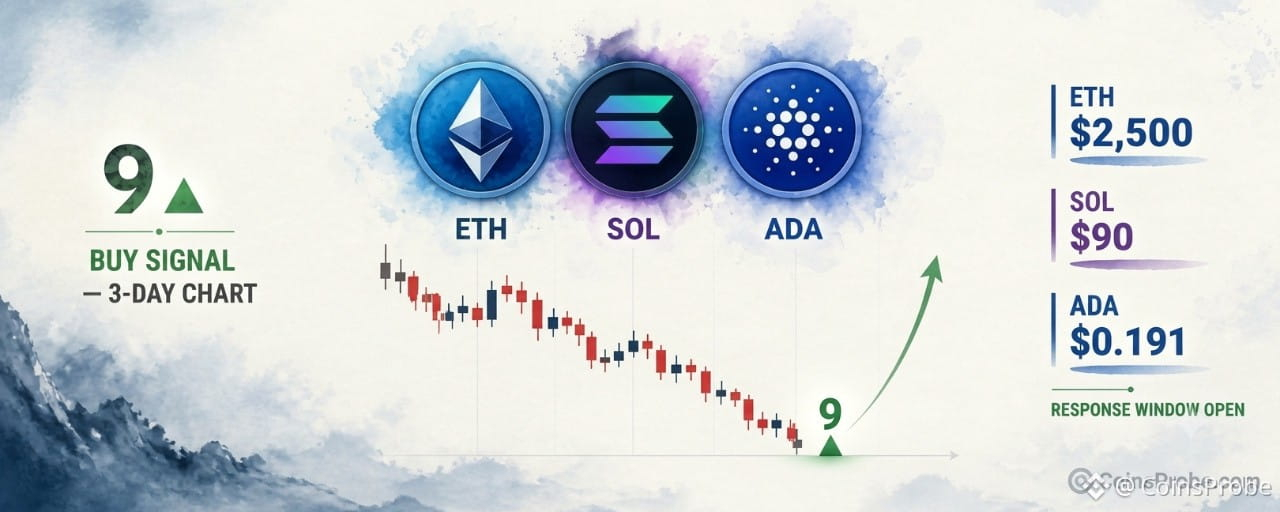
Article
ETH, SOL, and ADA Flash TD Sequential Buy Signals on 3-Day ChartsKey Highlights
ETH fell 22.64% from $2,806 to $2,171 — TD Sequential buy signal now active on the 3-day chartSOL dropped 27.31% from $124.89 to $90.78 — signal valid only if $90 holds as supportADA prints both a TD Sequential 9 and S13 simultaneously at $0.191 — double exhaustion signalETH spot ETFs logged 5 consecutive outflow days totaling $507.9M — institutional flows not yet confirming
Ethereum is trading at approximately $2,293.42 — up 2.32% in the past 24 hours — with a market cap of $280.2 billion, after suffering a 22.64% correction from $2,806 to a low of $2,171. The TD Sequential has now printed a buy signal on the 3-day chart, a momentum exhaustion indicator that flags when a sustained directional move has statistically run its course.
An analyst, posting as part of a five-tweet thread on November 3, 2026, identified this buy signal simultaneously across three major altcoins — Ethereum, Solana, and Cardano — each having completed a TD Sequential count on the 3-day timeframe following sharp declines. The thread presents a convergent technical case: three separate assets, three separate corrections, one identical exhaustion signal firing at the same time.
What the TD Sequential Actually Measures
The TD Sequential is not a price-level indicator. It does not measure support, resistance, or volume. It counts nine consecutive candles each closing lower than the candle four periods prior — identifying when a directional move has become statistically exhausted, not when buyers have confirmed control. A “9” buy signal means the selling sequence has completed its full count. It is a non-directional exhaustion marker: it says the trend is tired, not that the reversal has begun. The “1” count that follows the signal marks the opening of the response window — the period in which buyers must step in to validate the signal.
Signal 1 — Ethereum: 22.64% Decline, Buy Signal at $2,292
Ethereum fell 22.64% from a high of $2,806 to a low of $2,171 across the correction window. The 3-day chart now shows a completed TD Sequential “9” buy signal at the recent low, with a “1” count candle forming immediately after — the opening of the response window. The chart’s dashed reference line sits at $2,292, consistent with the current trading price at time of writing.
ETH 3-Day Chart Analysis (@alicharts) | Source: @alicharts (X)
The analyst identifies two upside reference levels contingent on buying pressure materializing. The first target is $2,500 — an initial rebound objective. Breaking $2,500 with conviction would then expose the setup resistance trendline near $2,700. These levels are conditional: they require buying pressure to emerge from the signal zone, not a guarantee of its arrival. The pattern remains still forming — no reversal breakout has been confirmed.
ETH spot ETF data from SoSoValue adds a layer of caution. The latest trading session recorded a net outflow of $85.3 million, extending a streak of five consecutive outflow days totaling $507.9 million in net redemptions. $ETH alone accounted for $74.4 million of the latest daily outflow. Institutional flows have not yet pivoted — a condition the TD Sequential signal alone cannot resolve. DeFiLlama data shows Ethereum’s TVL at $43.91 billion, with 24-hour DEX volume at $1.86 billion and 7-day fees of $159.41 million, confirming the network remains operationally active despite the price correction.
Signal 2 — Solana: 27.31% Decline, Buy Signal at $93.48
Solana has dropped 27.31% from $124.89 to a low of $90.78. The 3-day chart shows the TD Sequential count progression — labeled 6, A13, 9, 1 — marking a sustained bearish sequence now reaching exhaustion. The chart’s dashed reference line sits at $93.48, with a wick extending toward the $84 zone on the chart’s lower boundary.
SOL 3-Day Chart Analysis | Source: @alicharts (X)
The analyst’s condition for the SOL setup is explicit: the signal is contingent on $90 holding as support. If the $90 level fails to hold, the TD Sequential signal loses its structural foundation. The pattern is still forming — the “1” count has appeared but the full setup has not yet completed, and no breakout above resistance has occurred. The $90 level is the line between a consolidation-at-lows setup and a continued breakdown.
Signal 3 — Cardano: TD Sequential 9 and S13 Firing Simultaneously
Cardano’s 3-day chart presents the most concentrated signal of the three. At the recent low, the chart shows two TD Sequential exhaustion markers appearing at the same price zone: a “9” count with a triangle marker and an “S13” (Sequential 13) triangle below — two separate exhaustion counts completing simultaneously. The dashed reference line sits at $0.191, with chart price levels spanning $0.17 at the lower boundary to $0.28 above.
ADA 3-Day Chart Analysis | Source: @alicharts (X)
The S13 is a secondary confirmation within the TD Sequential system — it fires when the extended countdown also reaches exhaustion, reinforcing the “9” signal. Having both appear on the same 3-day candle is a compressed double-signal. The pattern remains still forming, with price sitting at the signal zone and no breakout above resistance confirmed.
Macro Headwinds the Signal Cannot Offset
FOMC rate outlook data from SoSoValue introduces a macro variable the TD Sequential does not account for. Markets are currently pricing a 77.1% probability of a rate hike at the December 9, 2026 FOMC meeting — moving the federal funds rate from 3.75%–4.00% to 4.00%–4.25%. For the January 27, 2027 meeting, cumulative hike probability reaches 83.2%. A tightening rate environment historically compresses risk asset multiples, and altcoins have historically been sensitive to liquidity conditions. Upcoming macro data releases — Nonfarm Payrolls on November 6, CPI on November 10, and PPI on November 13 — each carry the potential to shift those probabilities materially in either direction. The TD Sequential signals flag technical exhaustion. They do not absorb macro shocks.
For broader context on how macro cycles interact with crypto timing, the analysis of Bitcoin’s midterm election signal — 4-for-4 with a +63% median 12-month return is relevant background on how calendar-driven signals interact with broader crypto cycles.
Three Signals, One Window — What Confirmation Requires
Three altcoins printing the same exhaustion signal within the same timeframe is not coincidental — it reflects a synchronized correction across the altcoin complex, and a synchronized statistical exhaustion of that correction. But the TD Sequential is a timing signal, not a purchase signal. Confirmation requires buyers to respond within the response window. For ETH, that means reclaiming $2,500 to open the path toward $2,700. For SOL, it requires $90 holding and buying volume emerging above $93.48. For ADA, it requires a sustained close above the $0.191 signal zone.
None of these conditions have been met yet. The signals have fired. The response window is open. The next three to six 3-day candles across all three assets will determine whether this is an exhaustion reversal or a continuation after a brief pause.
Watch $2,500 on ETH, $90 on $SOL , and $0.191 on $ADA — these are the levels that separate signal validation from signal failure.
Disclaimer: The views and analysis presented in this article are for informational purposes only and reflect the author’s perspective, not financial advice. Technical patterns and indicators discussed are subject to market volatility and may or may not yield the anticipated results. Investors are advised to exercise caution, conduct independent research, and make decisions aligned with their individual risk tolerance.
ETH, SOL, and ADA Flash TD Sequential Buy Signals on 3-Day Charts
Key Highlights
ETH fell 22.64% from $2,806 to $2,171 — TD Sequential buy signal now active on the 3-day chartSOL dropped 27.31% from $124.89 to $90.78 — signal valid only if $90 holds as supportADA prints both a TD Sequential 9 and S13 simultaneously at $0.191 — double exhaustion signalETH spot ETFs logged 5 consecutive outflow days totaling $507.9M — institutional flows not yet confirming
Ethereum is trading at approximately $2,293.42 — up 2.32% in the past 24 hours — with a market cap of $280.2 billion, after suffering a 22.64% correction from $2,806 to a low of $2,171. The TD Sequential has now printed a buy signal on the 3-day chart, a momentum exhaustion indicator that flags when a sustained directional move has statistically run its course.
An analyst, posting as part of a five-tweet thread on November 3, 2026, identified this buy signal simultaneously across three major altcoins — Ethereum, Solana, and Cardano — each having completed a TD Sequential count on the 3-day timeframe following sharp declines. The thread presents a convergent technical case: three separate assets, three separate corrections, one identical exhaustion signal firing at the same time.
What the TD Sequential Actually Measures
The TD Sequential is not a price-level indicator. It does not measure support, resistance, or volume. It counts nine consecutive candles each closing lower than the candle four periods prior — identifying when a directional move has become statistically exhausted, not when buyers have confirmed control. A “9” buy signal means the selling sequence has completed its full count. It is a non-directional exhaustion marker: it says the trend is tired, not that the reversal has begun. The “1” count that follows the signal marks the opening of the response window — the period in which buyers must step in to validate the signal.
Signal 1 — Ethereum: 22.64% Decline, Buy Signal at $2,292
Ethereum fell 22.64% from a high of $2,806 to a low of $2,171 across the correction window. The 3-day chart now shows a completed TD Sequential “9” buy signal at the recent low, with a “1” count candle forming immediately after — the opening of the response window. The chart’s dashed reference line sits at $2,292, consistent with the current trading price at time of writing.
ETH 3-Day Chart Analysis (@alicharts) | Source: @alicharts (X)
The analyst identifies two upside reference levels contingent on buying pressure materializing. The first target is $2,500 — an initial rebound objective. Breaking $2,500 with conviction would then expose the setup resistance trendline near $2,700. These levels are conditional: they require buying pressure to emerge from the signal zone, not a guarantee of its arrival. The pattern remains still forming — no reversal breakout has been confirmed.
ETH spot ETF data from SoSoValue adds a layer of caution. The latest trading session recorded a net outflow of $85.3 million, extending a streak of five consecutive outflow days totaling $507.9 million in net redemptions. $ETH alone accounted for $74.4 million of the latest daily outflow. Institutional flows have not yet pivoted — a condition the TD Sequential signal alone cannot resolve. DeFiLlama data shows Ethereum’s TVL at $43.91 billion, with 24-hour DEX volume at $1.86 billion and 7-day fees of $159.41 million, confirming the network remains operationally active despite the price correction.
Signal 2 — Solana: 27.31% Decline, Buy Signal at $93.48
Solana has dropped 27.31% from $124.89 to a low of $90.78. The 3-day chart shows the TD Sequential count progression — labeled 6, A13, 9, 1 — marking a sustained bearish sequence now reaching exhaustion. The chart’s dashed reference line sits at $93.48, with a wick extending toward the $84 zone on the chart’s lower boundary.
SOL 3-Day Chart Analysis | Source: @alicharts (X)
The analyst’s condition for the SOL setup is explicit: the signal is contingent on $90 holding as support. If the $90 level fails to hold, the TD Sequential signal loses its structural foundation. The pattern is still forming — the “1” count has appeared but the full setup has not yet completed, and no breakout above resistance has occurred. The $90 level is the line between a consolidation-at-lows setup and a continued breakdown.
Signal 3 — Cardano: TD Sequential 9 and S13 Firing Simultaneously
Cardano’s 3-day chart presents the most concentrated signal of the three. At the recent low, the chart shows two TD Sequential exhaustion markers appearing at the same price zone: a “9” count with a triangle marker and an “S13” (Sequential 13) triangle below — two separate exhaustion counts completing simultaneously. The dashed reference line sits at $0.191, with chart price levels spanning $0.17 at the lower boundary to $0.28 above.
ADA 3-Day Chart Analysis | Source: @alicharts (X)
The S13 is a secondary confirmation within the TD Sequential system — it fires when the extended countdown also reaches exhaustion, reinforcing the “9” signal. Having both appear on the same 3-day candle is a compressed double-signal. The pattern remains still forming, with price sitting at the signal zone and no breakout above resistance confirmed.
Macro Headwinds the Signal Cannot Offset
FOMC rate outlook data from SoSoValue introduces a macro variable the TD Sequential does not account for. Markets are currently pricing a 77.1% probability of a rate hike at the December 9, 2026 FOMC meeting — moving the federal funds rate from 3.75%–4.00% to 4.00%–4.25%. For the January 27, 2027 meeting, cumulative hike probability reaches 83.2%. A tightening rate environment historically compresses risk asset multiples, and altcoins have historically been sensitive to liquidity conditions. Upcoming macro data releases — Nonfarm Payrolls on November 6, CPI on November 10, and PPI on November 13 — each carry the potential to shift those probabilities materially in either direction. The TD Sequential signals flag technical exhaustion. They do not absorb macro shocks.
For broader context on how macro cycles interact with crypto timing, the analysis of Bitcoin’s midterm election signal — 4-for-4 with a +63% median 12-month return is relevant background on how calendar-driven signals interact with broader crypto cycles.
Three Signals, One Window — What Confirmation Requires
Three altcoins printing the same exhaustion signal within the same timeframe is not coincidental — it reflects a synchronized correction across the altcoin complex, and a synchronized statistical exhaustion of that correction. But the TD Sequential is a timing signal, not a purchase signal. Confirmation requires buyers to respond within the response window. For ETH, that means reclaiming $2,500 to open the path toward $2,700. For SOL, it requires $90 holding and buying volume emerging above $93.48. For ADA, it requires a sustained close above the $0.191 signal zone.
None of these conditions have been met yet. The signals have fired. The response window is open. The next three to six 3-day candles across all three assets will determine whether this is an exhaustion reversal or a continuation after a brief pause.
Watch $2,500 on ETH, $90 on $SOL , and $0.191 on $ADA — these are the levels that separate signal validation from signal failure.
Disclaimer: The views and analysis presented in this article are for informational purposes only and reflect the author’s perspective, not financial advice. Technical patterns and indicators discussed are subject to market volatility and may or may not yield the anticipated results. Investors are advised to exercise caution, conduct independent research, and make decisions aligned with their individual risk tolerance.
ETH fell 22.64% from $2,806 to $2,171 — TD Sequential buy signal now active on the 3-day chartSOL dropped 27.31% from $124.89 to $90.78 — signal valid only if $90 holds as supportADA prints both a TD Sequential 9 and S13 simultaneously at $0.191 — double exhaustion signalETH spot ETFs logged 5 consecutive outflow days totaling $507.9M — institutional flows not yet confirming
Ethereum is trading at approximately $2,293.42 — up 2.32% in the past 24 hours — with a market cap of $280.2 billion, after suffering a 22.64% correction from $2,806 to a low of $2,171. The TD Sequential has now printed a buy signal on the 3-day chart, a momentum exhaustion indicator that flags when a sustained directional move has statistically run its course.
An analyst, posting as part of a five-tweet thread on November 3, 2026, identified this buy signal simultaneously across three major altcoins — Ethereum, Solana, and Cardano — each having completed a TD Sequential count on the 3-day timeframe following sharp declines. The thread presents a convergent technical case: three separate assets, three separate corrections, one identical exhaustion signal firing at the same time.
What the TD Sequential Actually Measures
The TD Sequential is not a price-level indicator. It does not measure support, resistance, or volume. It counts nine consecutive candles each closing lower than the candle four periods prior — identifying when a directional move has become statistically exhausted, not when buyers have confirmed control. A “9” buy signal means the selling sequence has completed its full count. It is a non-directional exhaustion marker: it says the trend is tired, not that the reversal has begun. The “1” count that follows the signal marks the opening of the response window — the period in which buyers must step in to validate the signal.
Signal 1 — Ethereum: 22.64% Decline, Buy Signal at $2,292
Ethereum fell 22.64% from a high of $2,806 to a low of $2,171 across the correction window. The 3-day chart now shows a completed TD Sequential “9” buy signal at the recent low, with a “1” count candle forming immediately after — the opening of the response window. The chart’s dashed reference line sits at $2,292, consistent with the current trading price at time of writing.
ETH 3-Day Chart Analysis (@alicharts) | Source: @alicharts (X)
The analyst identifies two upside reference levels contingent on buying pressure materializing. The first target is $2,500 — an initial rebound objective. Breaking $2,500 with conviction would then expose the setup resistance trendline near $2,700. These levels are conditional: they require buying pressure to emerge from the signal zone, not a guarantee of its arrival. The pattern remains still forming — no reversal breakout has been confirmed.
ETH spot ETF data from SoSoValue adds a layer of caution. The latest trading session recorded a net outflow of $85.3 million, extending a streak of five consecutive outflow days totaling $507.9 million in net redemptions. $ETH alone accounted for $74.4 million of the latest daily outflow. Institutional flows have not yet pivoted — a condition the TD Sequential signal alone cannot resolve. DeFiLlama data shows Ethereum’s TVL at $43.91 billion, with 24-hour DEX volume at $1.86 billion and 7-day fees of $159.41 million, confirming the network remains operationally active despite the price correction.
Signal 2 — Solana: 27.31% Decline, Buy Signal at $93.48
Solana has dropped 27.31% from $124.89 to a low of $90.78. The 3-day chart shows the TD Sequential count progression — labeled 6, A13, 9, 1 — marking a sustained bearish sequence now reaching exhaustion. The chart’s dashed reference line sits at $93.48, with a wick extending toward the $84 zone on the chart’s lower boundary.
SOL 3-Day Chart Analysis | Source: @alicharts (X)
The analyst’s condition for the SOL setup is explicit: the signal is contingent on $90 holding as support. If the $90 level fails to hold, the TD Sequential signal loses its structural foundation. The pattern is still forming — the “1” count has appeared but the full setup has not yet completed, and no breakout above resistance has occurred. The $90 level is the line between a consolidation-at-lows setup and a continued breakdown.
Signal 3 — Cardano: TD Sequential 9 and S13 Firing Simultaneously
Cardano’s 3-day chart presents the most concentrated signal of the three. At the recent low, the chart shows two TD Sequential exhaustion markers appearing at the same price zone: a “9” count with a triangle marker and an “S13” (Sequential 13) triangle below — two separate exhaustion counts completing simultaneously. The dashed reference line sits at $0.191, with chart price levels spanning $0.17 at the lower boundary to $0.28 above.
ADA 3-Day Chart Analysis | Source: @alicharts (X)
The S13 is a secondary confirmation within the TD Sequential system — it fires when the extended countdown also reaches exhaustion, reinforcing the “9” signal. Having both appear on the same 3-day candle is a compressed double-signal. The pattern remains still forming, with price sitting at the signal zone and no breakout above resistance confirmed.
Macro Headwinds the Signal Cannot Offset
FOMC rate outlook data from SoSoValue introduces a macro variable the TD Sequential does not account for. Markets are currently pricing a 77.1% probability of a rate hike at the December 9, 2026 FOMC meeting — moving the federal funds rate from 3.75%–4.00% to 4.00%–4.25%. For the January 27, 2027 meeting, cumulative hike probability reaches 83.2%. A tightening rate environment historically compresses risk asset multiples, and altcoins have historically been sensitive to liquidity conditions. Upcoming macro data releases — Nonfarm Payrolls on November 6, CPI on November 10, and PPI on November 13 — each carry the potential to shift those probabilities materially in either direction. The TD Sequential signals flag technical exhaustion. They do not absorb macro shocks.
For broader context on how macro cycles interact with crypto timing, the analysis of Bitcoin’s midterm election signal — 4-for-4 with a +63% median 12-month return is relevant background on how calendar-driven signals interact with broader crypto cycles.
Three Signals, One Window — What Confirmation Requires
Three altcoins printing the same exhaustion signal within the same timeframe is not coincidental — it reflects a synchronized correction across the altcoin complex, and a synchronized statistical exhaustion of that correction. But the TD Sequential is a timing signal, not a purchase signal. Confirmation requires buyers to respond within the response window. For ETH, that means reclaiming $2,500 to open the path toward $2,700. For SOL, it requires $90 holding and buying volume emerging above $93.48. For ADA, it requires a sustained close above the $0.191 signal zone.
None of these conditions have been met yet. The signals have fired. The response window is open. The next three to six 3-day candles across all three assets will determine whether this is an exhaustion reversal or a continuation after a brief pause.
Watch $2,500 on ETH, $90 on $SOL , and $0.191 on $ADA — these are the levels that separate signal validation from signal failure.
Disclaimer: The views and analysis presented in this article are for informational purposes only and reflect the author’s perspective, not financial advice. Technical patterns and indicators discussed are subject to market volatility and may or may not yield the anticipated results. Investors are advised to exercise caution, conduct independent research, and make decisions aligned with their individual risk tolerance.
323
·
--
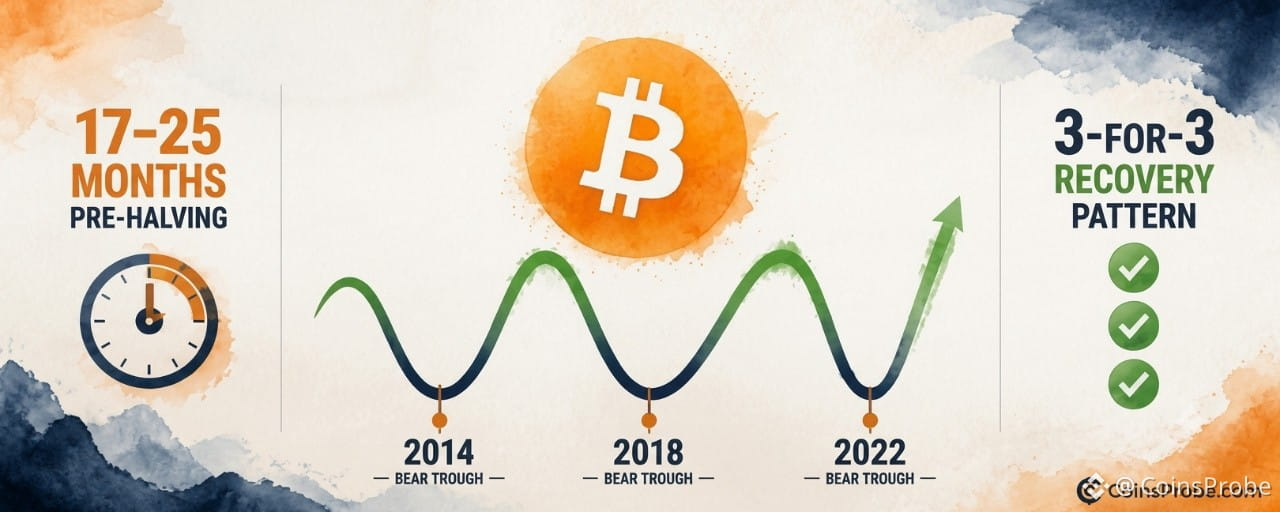
Article
Bitcoin's 17–25 Month Pre-Halving Window: Why Midterms Don't Drive the CycleKey Highlights
Bitcoin trades at $77,673 (+1.52a% 24h) with its 1-year rolling return still below zero per CryptoQuant's chartCryptoQuant: every midterm weakness in 2014, 2018, and 2022 fell within the 17–25 month pre-halving window — recoveries followed all threePattern is still forming — no breakout above the zero-return line confirmed yet; recovery thesis requires that crossover as first structural signal
Bitcoin is trading at $77,673 — up 1.52% in the past 24 hours — and sitting inside what CryptoQuant identifies as one of the most historically consistent phases of its four-year cycle: the 17–25 month window before a halving, immediately following the post-peak crash. The correlation has appeared in every bear market cycle on record. And it has nothing to do with elections.
In a note published November 3, 2026, CryptoQuant’s official account drew a direct line between midterm market weakness and Bitcoin’s broader cycle structure. The conclusion: “Every midterm fell 17–25 months before a halving, just after the post-peak crash. 2014, 2018 and 2022 all came after a bear market. That stretch has tended to recover, election or not. So ‘after midterms’ really means ‘this phase of the cycle.'” The midterm correlation is not a cause — it is a coincidence of timing that keeps landing inside the same pre-halving recovery window.
The 17–25 Month Pre-Halving Window — Three Instances, One Pattern
Bitcoin has completed three full cycles with observable post-peak bear markets: 2014, 2018, and 2022. In each case, the deepest drawdown phase occurred within the 17–25 month window preceding the next halving. Each bear market was followed by a recovery — not because an election concluded, but because that specific phase of Bitcoin’s supply-emission cycle had reached exhaustion.
Cycle Bear Market Halving Months Before Halving Outcome 2014 Bear Market July 2016 ~17–25 months Recovery followed 2018 Bear Market May 2020 ~17–25 months Recovery followed 2022 Bear Market April 2024 ~17–25 months Recovery followed
Source: CryptoQuant (@cryptoquant_com, X)
Three-for-three. Each bear market trough resolved into a recovery phase that began before — not after — the halving itself. The halving does not cause the recovery; the depletion of sell-side pressure during the post-peak crash phase creates the structural conditions for it.
The 1-Year Rolling Return Chart — Where Bitcoin Stands Now
CryptoQuant’s chart tracks Bitcoin’s 1-year rolling return from approximately 2010 through mid-2025, plotted on a logarithmic scale. The chart shows cyclical oscillation between green (positive return) and red (negative return) phases, with labeled peaks at 16.77x (~2011), 1.37x (~2015), 1.46x (~2019), and 1.81x (~2023). Each green spike is followed by a sharp collapse into red territory — the bear phase — before the next expansion cycle begins.
Bitcoin 1-Year Rolling Return Analysis | Source: @cryptoquant_com (X)
As of late 2025, the chart shows Bitcoin’s 1-year rolling return is below the zero line — in red, negative return territory. This is the same position Bitcoin occupied during the 2014, 2018, and 2022 bear troughs before each subsequent recovery. No breakout above the zero line has been confirmed as of this reading. The pattern is still forming. What the chart establishes is structural position: Bitcoin is in the phase that has historically preceded recovery, not in one that has confirmed it.
Why “After Midterms” Is a Mislabel
The conventional framing — that Bitcoin recovers after U.S. midterm elections — has circulated in crypto markets for years. CryptoQuant’s analysis dismantles the causal logic: midterms fall in November every two years, and Bitcoin’s halving cycle runs approximately 48 months. The overlap between November midterms and the 17–25 month pre-halving window is not by design. It is arithmetic. The two cycles happen to intersect during this phase of Bitcoin’s supply schedule.
The implication is significant. If the recovery were election-driven, it would be dependent on political outcomes. If it is cycle-driven, it is dependent on Bitcoin’s own supply mechanics — specifically, the reduction in miner selling pressure and the accumulation behavior that tends to precede halving events. That distinction separates a thesis that could fail (election-dependent) from one with structural backing (halving-cycle-dependent). For more on where the current cycle stands relative to prior bear phases, see Bitcoin Is in the Disbelief Phase — On-Chain Data Says the Bottom Is In.
What the Pattern Says — And What It Doesn’t
What it says: Bitcoin’s post-midterm weakness in 2014, 2018, and 2022 occurred within the 17–25 month pre-halving window. Each instance was followed by a recovery before the next halving. The current moment in November 2026 sits inside a comparable window relative to a future halving date.
What it doesn’t say: CryptoQuant’s note contains no price targets, no specific support levels, and no timeline for when the recovery begins. The 1-year rolling return chart shows Bitcoin still below the zero line — meaning no confirmation of recovery has printed yet. A three-instance dataset carries pattern value but not statistical certainty.
What to watch for continuation: The 1-year rolling return crossing back above the zero line on the chart CryptoQuant published would be the first structural confirmation that the negative return phase has resolved. Until that occurs, the pattern is a framework — not a signal. Context from recent price action is worth noting: Bitcoin’s rebound recently stalled at $76,800, underlining that the recovery, if it follows the historical template, has not yet asserted itself in price.
The Halving Cycle as the Actual Driver
What makes CryptoQuant’s framing analytically useful is that it replaces a vague macro narrative (elections are good for Bitcoin) with a specific structural one (Bitcoin’s supply cycle creates recurring recovery windows). The 17–25 month pre-halving range is not an approximation — it is the documented timing of every bear market trough in Bitcoin’s tracked history. Miners, who front-load distribution after a peak and reduce sell pressure as the halving approaches, are one mechanical explanation. Accumulation by longer-term holders during the negative return phase is another.
The post-midterm data has been covered in detail previously: Bitcoin post-midterm drops have hit −49.7%, yet one year later the median recovery reached +45.8%. The CryptoQuant framing explains why: by one year post-midterm, Bitcoin is typically 5–13 months closer to its halving — well inside the structural recovery window.
At $77,673, Bitcoin is trading inside this window. The 1-year rolling return is negative. The halving cycle clock is running. Whether the pattern extends to a fourth instance will be visible first in that rolling return crossing the zero line — not in an election result.
Watch the 1-year rolling return above zero as the first structural confirmation that the current pre-halving recovery phase has begun.
Disclaimer: The views and analysis presented in this article are for informational purposes only and reflect the author’s perspective, not financial advice. Technical patterns and indicators discussed are subject to market volatility and may or may not yield the anticipated results. Investors are advised to exercise caution, conduct independent research, and make decisions aligned with their individual risk tolerance.
Bitcoin's 17–25 Month Pre-Halving Window: Why Midterms Don't Drive the Cycle
Key Highlights
Bitcoin trades at $77,673 (+1.52a% 24h) with its 1-year rolling return still below zero per CryptoQuant's chartCryptoQuant: every midterm weakness in 2014, 2018, and 2022 fell within the 17–25 month pre-halving window — recoveries followed all threePattern is still forming — no breakout above the zero-return line confirmed yet; recovery thesis requires that crossover as first structural signal
Bitcoin is trading at $77,673 — up 1.52% in the past 24 hours — and sitting inside what CryptoQuant identifies as one of the most historically consistent phases of its four-year cycle: the 17–25 month window before a halving, immediately following the post-peak crash. The correlation has appeared in every bear market cycle on record. And it has nothing to do with elections.
In a note published November 3, 2026, CryptoQuant’s official account drew a direct line between midterm market weakness and Bitcoin’s broader cycle structure. The conclusion: “Every midterm fell 17–25 months before a halving, just after the post-peak crash. 2014, 2018 and 2022 all came after a bear market. That stretch has tended to recover, election or not. So ‘after midterms’ really means ‘this phase of the cycle.'” The midterm correlation is not a cause — it is a coincidence of timing that keeps landing inside the same pre-halving recovery window.
The 17–25 Month Pre-Halving Window — Three Instances, One Pattern
Bitcoin has completed three full cycles with observable post-peak bear markets: 2014, 2018, and 2022. In each case, the deepest drawdown phase occurred within the 17–25 month window preceding the next halving. Each bear market was followed by a recovery — not because an election concluded, but because that specific phase of Bitcoin’s supply-emission cycle had reached exhaustion.
Cycle Bear Market Halving Months Before Halving Outcome 2014 Bear Market July 2016 ~17–25 months Recovery followed 2018 Bear Market May 2020 ~17–25 months Recovery followed 2022 Bear Market April 2024 ~17–25 months Recovery followed
Source: CryptoQuant (@cryptoquant_com, X)
Three-for-three. Each bear market trough resolved into a recovery phase that began before — not after — the halving itself. The halving does not cause the recovery; the depletion of sell-side pressure during the post-peak crash phase creates the structural conditions for it.
The 1-Year Rolling Return Chart — Where Bitcoin Stands Now
CryptoQuant’s chart tracks Bitcoin’s 1-year rolling return from approximately 2010 through mid-2025, plotted on a logarithmic scale. The chart shows cyclical oscillation between green (positive return) and red (negative return) phases, with labeled peaks at 16.77x (~2011), 1.37x (~2015), 1.46x (~2019), and 1.81x (~2023). Each green spike is followed by a sharp collapse into red territory — the bear phase — before the next expansion cycle begins.
Bitcoin 1-Year Rolling Return Analysis | Source: @cryptoquant_com (X)
As of late 2025, the chart shows Bitcoin’s 1-year rolling return is below the zero line — in red, negative return territory. This is the same position Bitcoin occupied during the 2014, 2018, and 2022 bear troughs before each subsequent recovery. No breakout above the zero line has been confirmed as of this reading. The pattern is still forming. What the chart establishes is structural position: Bitcoin is in the phase that has historically preceded recovery, not in one that has confirmed it.
Why “After Midterms” Is a Mislabel
The conventional framing — that Bitcoin recovers after U.S. midterm elections — has circulated in crypto markets for years. CryptoQuant’s analysis dismantles the causal logic: midterms fall in November every two years, and Bitcoin’s halving cycle runs approximately 48 months. The overlap between November midterms and the 17–25 month pre-halving window is not by design. It is arithmetic. The two cycles happen to intersect during this phase of Bitcoin’s supply schedule.
The implication is significant. If the recovery were election-driven, it would be dependent on political outcomes. If it is cycle-driven, it is dependent on Bitcoin’s own supply mechanics — specifically, the reduction in miner selling pressure and the accumulation behavior that tends to precede halving events. That distinction separates a thesis that could fail (election-dependent) from one with structural backing (halving-cycle-dependent). For more on where the current cycle stands relative to prior bear phases, see Bitcoin Is in the Disbelief Phase — On-Chain Data Says the Bottom Is In.
What the Pattern Says — And What It Doesn’t
What it says: Bitcoin’s post-midterm weakness in 2014, 2018, and 2022 occurred within the 17–25 month pre-halving window. Each instance was followed by a recovery before the next halving. The current moment in November 2026 sits inside a comparable window relative to a future halving date.
What it doesn’t say: CryptoQuant’s note contains no price targets, no specific support levels, and no timeline for when the recovery begins. The 1-year rolling return chart shows Bitcoin still below the zero line — meaning no confirmation of recovery has printed yet. A three-instance dataset carries pattern value but not statistical certainty.
What to watch for continuation: The 1-year rolling return crossing back above the zero line on the chart CryptoQuant published would be the first structural confirmation that the negative return phase has resolved. Until that occurs, the pattern is a framework — not a signal. Context from recent price action is worth noting: Bitcoin’s rebound recently stalled at $76,800, underlining that the recovery, if it follows the historical template, has not yet asserted itself in price.
The Halving Cycle as the Actual Driver
What makes CryptoQuant’s framing analytically useful is that it replaces a vague macro narrative (elections are good for Bitcoin) with a specific structural one (Bitcoin’s supply cycle creates recurring recovery windows). The 17–25 month pre-halving range is not an approximation — it is the documented timing of every bear market trough in Bitcoin’s tracked history. Miners, who front-load distribution after a peak and reduce sell pressure as the halving approaches, are one mechanical explanation. Accumulation by longer-term holders during the negative return phase is another.
The post-midterm data has been covered in detail previously: Bitcoin post-midterm drops have hit −49.7%, yet one year later the median recovery reached +45.8%. The CryptoQuant framing explains why: by one year post-midterm, Bitcoin is typically 5–13 months closer to its halving — well inside the structural recovery window.
At $77,673, Bitcoin is trading inside this window. The 1-year rolling return is negative. The halving cycle clock is running. Whether the pattern extends to a fourth instance will be visible first in that rolling return crossing the zero line — not in an election result.
Watch the 1-year rolling return above zero as the first structural confirmation that the current pre-halving recovery phase has begun.
Disclaimer: The views and analysis presented in this article are for informational purposes only and reflect the author’s perspective, not financial advice. Technical patterns and indicators discussed are subject to market volatility and may or may not yield the anticipated results. Investors are advised to exercise caution, conduct independent research, and make decisions aligned with their individual risk tolerance.
Bitcoin trades at $77,673 (+1.52a% 24h) with its 1-year rolling return still below zero per CryptoQuant's chartCryptoQuant: every midterm weakness in 2014, 2018, and 2022 fell within the 17–25 month pre-halving window — recoveries followed all threePattern is still forming — no breakout above the zero-return line confirmed yet; recovery thesis requires that crossover as first structural signal
Bitcoin is trading at $77,673 — up 1.52% in the past 24 hours — and sitting inside what CryptoQuant identifies as one of the most historically consistent phases of its four-year cycle: the 17–25 month window before a halving, immediately following the post-peak crash. The correlation has appeared in every bear market cycle on record. And it has nothing to do with elections.
In a note published November 3, 2026, CryptoQuant’s official account drew a direct line between midterm market weakness and Bitcoin’s broader cycle structure. The conclusion: “Every midterm fell 17–25 months before a halving, just after the post-peak crash. 2014, 2018 and 2022 all came after a bear market. That stretch has tended to recover, election or not. So ‘after midterms’ really means ‘this phase of the cycle.'” The midterm correlation is not a cause — it is a coincidence of timing that keeps landing inside the same pre-halving recovery window.
The 17–25 Month Pre-Halving Window — Three Instances, One Pattern
Bitcoin has completed three full cycles with observable post-peak bear markets: 2014, 2018, and 2022. In each case, the deepest drawdown phase occurred within the 17–25 month window preceding the next halving. Each bear market was followed by a recovery — not because an election concluded, but because that specific phase of Bitcoin’s supply-emission cycle had reached exhaustion.
Cycle Bear Market Halving Months Before Halving Outcome 2014 Bear Market July 2016 ~17–25 months Recovery followed 2018 Bear Market May 2020 ~17–25 months Recovery followed 2022 Bear Market April 2024 ~17–25 months Recovery followed
Source: CryptoQuant (@cryptoquant_com, X)
Three-for-three. Each bear market trough resolved into a recovery phase that began before — not after — the halving itself. The halving does not cause the recovery; the depletion of sell-side pressure during the post-peak crash phase creates the structural conditions for it.
The 1-Year Rolling Return Chart — Where Bitcoin Stands Now
CryptoQuant’s chart tracks Bitcoin’s 1-year rolling return from approximately 2010 through mid-2025, plotted on a logarithmic scale. The chart shows cyclical oscillation between green (positive return) and red (negative return) phases, with labeled peaks at 16.77x (~2011), 1.37x (~2015), 1.46x (~2019), and 1.81x (~2023). Each green spike is followed by a sharp collapse into red territory — the bear phase — before the next expansion cycle begins.
Bitcoin 1-Year Rolling Return Analysis | Source: @cryptoquant_com (X)
As of late 2025, the chart shows Bitcoin’s 1-year rolling return is below the zero line — in red, negative return territory. This is the same position Bitcoin occupied during the 2014, 2018, and 2022 bear troughs before each subsequent recovery. No breakout above the zero line has been confirmed as of this reading. The pattern is still forming. What the chart establishes is structural position: Bitcoin is in the phase that has historically preceded recovery, not in one that has confirmed it.
Why “After Midterms” Is a Mislabel
The conventional framing — that Bitcoin recovers after U.S. midterm elections — has circulated in crypto markets for years. CryptoQuant’s analysis dismantles the causal logic: midterms fall in November every two years, and Bitcoin’s halving cycle runs approximately 48 months. The overlap between November midterms and the 17–25 month pre-halving window is not by design. It is arithmetic. The two cycles happen to intersect during this phase of Bitcoin’s supply schedule.
The implication is significant. If the recovery were election-driven, it would be dependent on political outcomes. If it is cycle-driven, it is dependent on Bitcoin’s own supply mechanics — specifically, the reduction in miner selling pressure and the accumulation behavior that tends to precede halving events. That distinction separates a thesis that could fail (election-dependent) from one with structural backing (halving-cycle-dependent). For more on where the current cycle stands relative to prior bear phases, see Bitcoin Is in the Disbelief Phase — On-Chain Data Says the Bottom Is In.
What the Pattern Says — And What It Doesn’t
What it says: Bitcoin’s post-midterm weakness in 2014, 2018, and 2022 occurred within the 17–25 month pre-halving window. Each instance was followed by a recovery before the next halving. The current moment in November 2026 sits inside a comparable window relative to a future halving date.
What it doesn’t say: CryptoQuant’s note contains no price targets, no specific support levels, and no timeline for when the recovery begins. The 1-year rolling return chart shows Bitcoin still below the zero line — meaning no confirmation of recovery has printed yet. A three-instance dataset carries pattern value but not statistical certainty.
What to watch for continuation: The 1-year rolling return crossing back above the zero line on the chart CryptoQuant published would be the first structural confirmation that the negative return phase has resolved. Until that occurs, the pattern is a framework — not a signal. Context from recent price action is worth noting: Bitcoin’s rebound recently stalled at $76,800, underlining that the recovery, if it follows the historical template, has not yet asserted itself in price.
The Halving Cycle as the Actual Driver
What makes CryptoQuant’s framing analytically useful is that it replaces a vague macro narrative (elections are good for Bitcoin) with a specific structural one (Bitcoin’s supply cycle creates recurring recovery windows). The 17–25 month pre-halving range is not an approximation — it is the documented timing of every bear market trough in Bitcoin’s tracked history. Miners, who front-load distribution after a peak and reduce sell pressure as the halving approaches, are one mechanical explanation. Accumulation by longer-term holders during the negative return phase is another.
The post-midterm data has been covered in detail previously: Bitcoin post-midterm drops have hit −49.7%, yet one year later the median recovery reached +45.8%. The CryptoQuant framing explains why: by one year post-midterm, Bitcoin is typically 5–13 months closer to its halving — well inside the structural recovery window.
At $77,673, Bitcoin is trading inside this window. The 1-year rolling return is negative. The halving cycle clock is running. Whether the pattern extends to a fourth instance will be visible first in that rolling return crossing the zero line — not in an election result.
Watch the 1-year rolling return above zero as the first structural confirmation that the current pre-halving recovery phase has begun.
Disclaimer: The views and analysis presented in this article are for informational purposes only and reflect the author’s perspective, not financial advice. Technical patterns and indicators discussed are subject to market volatility and may or may not yield the anticipated results. Investors are advised to exercise caution, conduct independent research, and make decisions aligned with their individual risk tolerance.
199
·
--
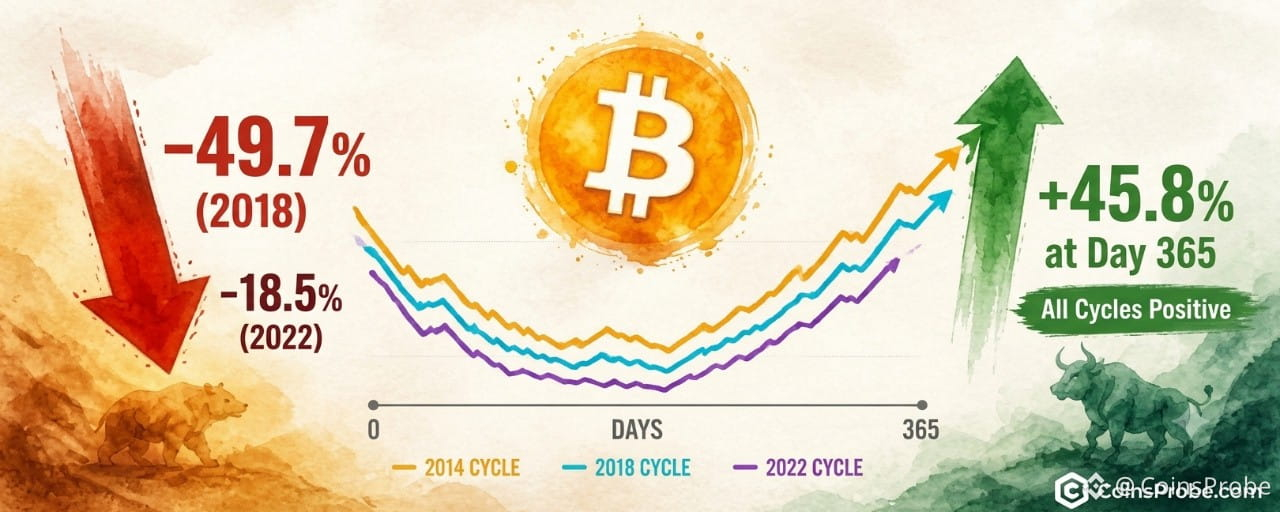
Article
Bitcoin Post-Midterm Drops Hit 49.7% — Yet One Year Later, +45.8%Key Highlights
Bitcoin trades at $77,786 (+1.64% 24h) as CryptoQuant overlays three post-midterm BTC cyclesDeepest midterm drops: −49.7% (2018), −39.8% (2014), −18.5% (2022 FTX week) — all recovered positive by day 3652018 cycle, the worst drawdown of the three, ended +45.8% one year after the midterm lowKey demand level to watch: $76,800 — where Bitcoin's last recovery attempt stalled
Bitcoin is trading at $77,786 — up 1.64% in the past 24 hours — as a CryptoQuant analysis resurfaces one of the most uncomfortable facts about midterm-year Bitcoin cycles: the recovery was never clean, and the deepest pain often preceded the largest gains.
An analyst at CryptoQuant published a chart overlaying Bitcoin’s post-midterm drawdown trajectories across three separate cycles — 2014, 2018, and 2022 — measured in days from the cycle’s midterm low. The finding is stark: every cycle produced a severe near-term decline before staging a full-year recovery, with all three lines ultimately closing above the zero baseline by the end of the 365-day window.
The Drawdowns — Exactly How Bad Each Cycle Got
The chart does not smooth the data. Each cycle’s sharpest drop is labeled explicitly, and the numbers are severe. In 2018, Bitcoin fell −49.7% within approximately six weeks of the midterm reference point. In 2014, the drawdown reached −39.8% within roughly ten weeks. The 2022 cycle recorded the shallowest initial drop at −18.5% — but that two-week window coincided directly with the FTX collapse, one of the most concentrated bouts of forced selling in crypto’s history.
Bitcoin Post-Midterm Drops Analysis | Source: @cryptoquant_com (X)
What the chart also shows is the shape of recovery: all three cycles follow a U/J-shaped trajectory. The 2018 cycle dips deepest and recovers most aggressively. The 2022 cycle shows the shallowest initial drop but a steady grind higher. The 2014 cycle traces a prolonged mid-range consolidation before eventually crossing back above zero. By day 365, every line is positive.
The 2018 Case — The Hardest Drop, the Strongest Full-Year Result
The most important data point in the CryptoQuant analysis is the 2018 outcome. Despite the −49.7% drawdown in the first six weeks — a drop that would have felt catastrophic to anyone holding at the top — Bitcoin ended the full 12-month window up +45.8% from the midterm low. That is not a marginal recovery. It is a complete regime reversal in the same calendar year.
This matters because 2018 is the cycle most investors cite when discussing Bitcoin bear markets. The FUD was peak severity. The narrative was that crypto was finished. The on-chain reality, as CryptoQuant’s historical overlay now shows, was that the worst drawdown preceded the best outcome among the three cycles charted.
It is worth placing current market conditions in this framework. Bitcoin has been flagged by on-chain analysts as sitting in the disbelief phase, a stage historically associated with bottoming behavior rather than trend continuation to the downside. The CryptoQuant midterm cycle data adds a structural layer to that observation: post-midterm periods have never, across three cycles, failed to produce a positive 12-month return from the drawdown low.
What the Chart Confirms — and What It Does Not
The CryptoQuant analysis makes three things clear. First, post-midterm drawdowns are a documented feature of Bitcoin’s cycle, not an anomaly. Second, the depth of that drawdown has not historically predicted the direction of the 12-month outcome — 2018’s worst drop produced a positive full-year return. Third, all three cycles reached their lowest point well before the halfway mark of the 365-day window, meaning the second half of each cycle was characterized by recovery rather than continued decline.
What the analysis does not state is a price target, a support level, or a projection for the current cycle. CryptoQuant presents this as historical context, not a forward model. The 2026 midterm cycle may diverge — no three-cycle sample guarantees a fourth outcome. What it does establish is a base rate: across every comparable historical window, Bitcoin recovered above its midterm reference level within one year.
Stablecoin liquidity conditions also remain a factor worth monitoring. Recent data has shown stablecoin market cap under pressure, which historically constrains the velocity of recovery rallies. And on the demand side, Bitcoin’s recent rebound faded at $76,800 amid weak demand signals — a reminder that the historical pattern provides context, not a guarantee of trajectory.
Three Cycles, One Consistent Outcome
Across 2014, 2018, and 2022, the post-midterm playbook for Bitcoin has been identical in structure: sharp early pain, prolonged uncertainty, full-year recovery. The magnitude differs — 2018’s −49.7% dwarfs 2022’s −18.5% — but the directional outcome does not. All three cycles closed positive at the 365-day mark.
At $77,786, Bitcoin is trading in the zone where prior cycles have historically established the foundation for that recovery. The CryptoQuant data does not say the bottom is confirmed today. What it says is that in every comparable cycle, the investors who exited during the sharp early drawdown missed the full-year return. The 2018 cycle, the most painful of the three, produced +45.8% for those who held through it.
The level to watch remains $76,800, where demand last stalled. A sustained reclaim of that zone with volume would begin to replicate the recovery trajectories visible across all three historical cycles in the CryptoQuant overlay.
Disclaimer: The views and analysis presented in this article are for informational purposes only and reflect the author’s perspective, not financial advice. Technical patterns and indicators discussed are subject to market volatility and may or may not yield the anticipated results. Investors are advised to exercise caution, conduct independent research, and make decisions aligned with their individual risk tolerance.
Bitcoin Post-Midterm Drops Hit 49.7% — Yet One Year Later, +45.8%
Key Highlights
Bitcoin trades at $77,786 (+1.64% 24h) as CryptoQuant overlays three post-midterm BTC cyclesDeepest midterm drops: −49.7% (2018), −39.8% (2014), −18.5% (2022 FTX week) — all recovered positive by day 3652018 cycle, the worst drawdown of the three, ended +45.8% one year after the midterm lowKey demand level to watch: $76,800 — where Bitcoin's last recovery attempt stalled
Bitcoin is trading at $77,786 — up 1.64% in the past 24 hours — as a CryptoQuant analysis resurfaces one of the most uncomfortable facts about midterm-year Bitcoin cycles: the recovery was never clean, and the deepest pain often preceded the largest gains.
An analyst at CryptoQuant published a chart overlaying Bitcoin’s post-midterm drawdown trajectories across three separate cycles — 2014, 2018, and 2022 — measured in days from the cycle’s midterm low. The finding is stark: every cycle produced a severe near-term decline before staging a full-year recovery, with all three lines ultimately closing above the zero baseline by the end of the 365-day window.
The Drawdowns — Exactly How Bad Each Cycle Got
The chart does not smooth the data. Each cycle’s sharpest drop is labeled explicitly, and the numbers are severe. In 2018, Bitcoin fell −49.7% within approximately six weeks of the midterm reference point. In 2014, the drawdown reached −39.8% within roughly ten weeks. The 2022 cycle recorded the shallowest initial drop at −18.5% — but that two-week window coincided directly with the FTX collapse, one of the most concentrated bouts of forced selling in crypto’s history.
Bitcoin Post-Midterm Drops Analysis | Source: @cryptoquant_com (X)
What the chart also shows is the shape of recovery: all three cycles follow a U/J-shaped trajectory. The 2018 cycle dips deepest and recovers most aggressively. The 2022 cycle shows the shallowest initial drop but a steady grind higher. The 2014 cycle traces a prolonged mid-range consolidation before eventually crossing back above zero. By day 365, every line is positive.
The 2018 Case — The Hardest Drop, the Strongest Full-Year Result
The most important data point in the CryptoQuant analysis is the 2018 outcome. Despite the −49.7% drawdown in the first six weeks — a drop that would have felt catastrophic to anyone holding at the top — Bitcoin ended the full 12-month window up +45.8% from the midterm low. That is not a marginal recovery. It is a complete regime reversal in the same calendar year.
This matters because 2018 is the cycle most investors cite when discussing Bitcoin bear markets. The FUD was peak severity. The narrative was that crypto was finished. The on-chain reality, as CryptoQuant’s historical overlay now shows, was that the worst drawdown preceded the best outcome among the three cycles charted.
It is worth placing current market conditions in this framework. Bitcoin has been flagged by on-chain analysts as sitting in the disbelief phase, a stage historically associated with bottoming behavior rather than trend continuation to the downside. The CryptoQuant midterm cycle data adds a structural layer to that observation: post-midterm periods have never, across three cycles, failed to produce a positive 12-month return from the drawdown low.
What the Chart Confirms — and What It Does Not
The CryptoQuant analysis makes three things clear. First, post-midterm drawdowns are a documented feature of Bitcoin’s cycle, not an anomaly. Second, the depth of that drawdown has not historically predicted the direction of the 12-month outcome — 2018’s worst drop produced a positive full-year return. Third, all three cycles reached their lowest point well before the halfway mark of the 365-day window, meaning the second half of each cycle was characterized by recovery rather than continued decline.
What the analysis does not state is a price target, a support level, or a projection for the current cycle. CryptoQuant presents this as historical context, not a forward model. The 2026 midterm cycle may diverge — no three-cycle sample guarantees a fourth outcome. What it does establish is a base rate: across every comparable historical window, Bitcoin recovered above its midterm reference level within one year.
Stablecoin liquidity conditions also remain a factor worth monitoring. Recent data has shown stablecoin market cap under pressure, which historically constrains the velocity of recovery rallies. And on the demand side, Bitcoin’s recent rebound faded at $76,800 amid weak demand signals — a reminder that the historical pattern provides context, not a guarantee of trajectory.
Three Cycles, One Consistent Outcome
Across 2014, 2018, and 2022, the post-midterm playbook for Bitcoin has been identical in structure: sharp early pain, prolonged uncertainty, full-year recovery. The magnitude differs — 2018’s −49.7% dwarfs 2022’s −18.5% — but the directional outcome does not. All three cycles closed positive at the 365-day mark.
At $77,786, Bitcoin is trading in the zone where prior cycles have historically established the foundation for that recovery. The CryptoQuant data does not say the bottom is confirmed today. What it says is that in every comparable cycle, the investors who exited during the sharp early drawdown missed the full-year return. The 2018 cycle, the most painful of the three, produced +45.8% for those who held through it.
The level to watch remains $76,800, where demand last stalled. A sustained reclaim of that zone with volume would begin to replicate the recovery trajectories visible across all three historical cycles in the CryptoQuant overlay.
Disclaimer: The views and analysis presented in this article are for informational purposes only and reflect the author’s perspective, not financial advice. Technical patterns and indicators discussed are subject to market volatility and may or may not yield the anticipated results. Investors are advised to exercise caution, conduct independent research, and make decisions aligned with their individual risk tolerance.
Bitcoin trades at $77,786 (+1.64% 24h) as CryptoQuant overlays three post-midterm BTC cyclesDeepest midterm drops: −49.7% (2018), −39.8% (2014), −18.5% (2022 FTX week) — all recovered positive by day 3652018 cycle, the worst drawdown of the three, ended +45.8% one year after the midterm lowKey demand level to watch: $76,800 — where Bitcoin's last recovery attempt stalled
Bitcoin is trading at $77,786 — up 1.64% in the past 24 hours — as a CryptoQuant analysis resurfaces one of the most uncomfortable facts about midterm-year Bitcoin cycles: the recovery was never clean, and the deepest pain often preceded the largest gains.
An analyst at CryptoQuant published a chart overlaying Bitcoin’s post-midterm drawdown trajectories across three separate cycles — 2014, 2018, and 2022 — measured in days from the cycle’s midterm low. The finding is stark: every cycle produced a severe near-term decline before staging a full-year recovery, with all three lines ultimately closing above the zero baseline by the end of the 365-day window.
The Drawdowns — Exactly How Bad Each Cycle Got
The chart does not smooth the data. Each cycle’s sharpest drop is labeled explicitly, and the numbers are severe. In 2018, Bitcoin fell −49.7% within approximately six weeks of the midterm reference point. In 2014, the drawdown reached −39.8% within roughly ten weeks. The 2022 cycle recorded the shallowest initial drop at −18.5% — but that two-week window coincided directly with the FTX collapse, one of the most concentrated bouts of forced selling in crypto’s history.
Bitcoin Post-Midterm Drops Analysis | Source: @cryptoquant_com (X)
What the chart also shows is the shape of recovery: all three cycles follow a U/J-shaped trajectory. The 2018 cycle dips deepest and recovers most aggressively. The 2022 cycle shows the shallowest initial drop but a steady grind higher. The 2014 cycle traces a prolonged mid-range consolidation before eventually crossing back above zero. By day 365, every line is positive.
The 2018 Case — The Hardest Drop, the Strongest Full-Year Result
The most important data point in the CryptoQuant analysis is the 2018 outcome. Despite the −49.7% drawdown in the first six weeks — a drop that would have felt catastrophic to anyone holding at the top — Bitcoin ended the full 12-month window up +45.8% from the midterm low. That is not a marginal recovery. It is a complete regime reversal in the same calendar year.
This matters because 2018 is the cycle most investors cite when discussing Bitcoin bear markets. The FUD was peak severity. The narrative was that crypto was finished. The on-chain reality, as CryptoQuant’s historical overlay now shows, was that the worst drawdown preceded the best outcome among the three cycles charted.
It is worth placing current market conditions in this framework. Bitcoin has been flagged by on-chain analysts as sitting in the disbelief phase, a stage historically associated with bottoming behavior rather than trend continuation to the downside. The CryptoQuant midterm cycle data adds a structural layer to that observation: post-midterm periods have never, across three cycles, failed to produce a positive 12-month return from the drawdown low.
What the Chart Confirms — and What It Does Not
The CryptoQuant analysis makes three things clear. First, post-midterm drawdowns are a documented feature of Bitcoin’s cycle, not an anomaly. Second, the depth of that drawdown has not historically predicted the direction of the 12-month outcome — 2018’s worst drop produced a positive full-year return. Third, all three cycles reached their lowest point well before the halfway mark of the 365-day window, meaning the second half of each cycle was characterized by recovery rather than continued decline.
What the analysis does not state is a price target, a support level, or a projection for the current cycle. CryptoQuant presents this as historical context, not a forward model. The 2026 midterm cycle may diverge — no three-cycle sample guarantees a fourth outcome. What it does establish is a base rate: across every comparable historical window, Bitcoin recovered above its midterm reference level within one year.
Stablecoin liquidity conditions also remain a factor worth monitoring. Recent data has shown stablecoin market cap under pressure, which historically constrains the velocity of recovery rallies. And on the demand side, Bitcoin’s recent rebound faded at $76,800 amid weak demand signals — a reminder that the historical pattern provides context, not a guarantee of trajectory.
Three Cycles, One Consistent Outcome
Across 2014, 2018, and 2022, the post-midterm playbook for Bitcoin has been identical in structure: sharp early pain, prolonged uncertainty, full-year recovery. The magnitude differs — 2018’s −49.7% dwarfs 2022’s −18.5% — but the directional outcome does not. All three cycles closed positive at the 365-day mark.
At $77,786, Bitcoin is trading in the zone where prior cycles have historically established the foundation for that recovery. The CryptoQuant data does not say the bottom is confirmed today. What it says is that in every comparable cycle, the investors who exited during the sharp early drawdown missed the full-year return. The 2018 cycle, the most painful of the three, produced +45.8% for those who held through it.
The level to watch remains $76,800, where demand last stalled. A sustained reclaim of that zone with volume would begin to replicate the recovery trajectories visible across all three historical cycles in the CryptoQuant overlay.
Disclaimer: The views and analysis presented in this article are for informational purposes only and reflect the author’s perspective, not financial advice. Technical patterns and indicators discussed are subject to market volatility and may or may not yield the anticipated results. Investors are advised to exercise caution, conduct independent research, and make decisions aligned with their individual risk tolerance.
253
·
--
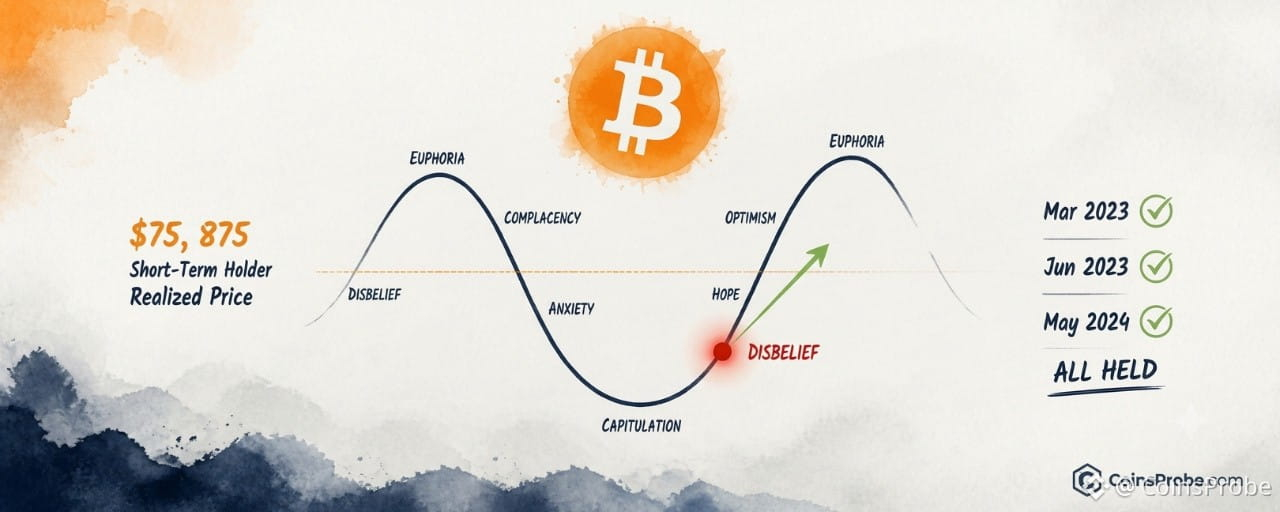
Article
Bitcoin Is in the Disbelief Phase — On-Chain Data Says the Bottom Is InKey Highlights
Bitcoin tested $76,195 against short-term holder realized price of $75,875 — a gap of just $320 or 0.4%Same on-chain threshold marked local bottoms in Mar 2023 ($19,979), Jun 2023 ($25,130), and May 2024 ($58,325)Analyst maps current sentiment to the Disbelief phase — historically the optimal entry zone before sustained uptrends$75,875 is the critical level: a sustained close below invalidates the bottom thesis
Bitcoin is holding above a critical on-chain threshold after testing $76,195 — and one analyst argues the market’s reflexive skepticism is itself the signal. When retail and short-term participants dismiss a recovery as just another failed rally, that collective disbelief has historically marked the beginning of sustained uptrends, not their end.
An on-chain analyst identifying as @alicharts posted on November 4, 2026: “Disbelief: This rally will fail like the others.” — a caption that quotes the prevailing sentiment, not his own view. The analyst is mapping current market psychology to the Disbelief phase of the classic market cycle: the stage where early recovery moves are dismissed as noise before a durable bull run takes hold. His on-chain anchor for this call is the short-term holder realized price, currently sitting at $75,875.
Analysis: Market Cycle Psychology Chart | Source: @alicharts (X)
What the Short-Term Holder Realized Price Actually Measures
The short-term holder realized price is the average acquisition cost of all Bitcoin held by wallets that received coins within the past 155 days. It is not a moving average of market price — it is a cost-basis metric. When spot price dips to or below this level, short-term holders are, on aggregate, underwater. That underwater condition historically triggers panic selling, liquidations, and capitulation — which is precisely why it has repeatedly functioned as a local bottom marker rather than a breakdown trigger.
At the November 4 test, Bitcoin touched $76,195 against a short-term holder realized price of $75,875 — a gap of just $320, or roughly 0.4%. The price tested the zone and held. That dynamic — testing the realized price without closing below it — is the specific pattern the analyst is flagging.
BTC Daily Chart | Source: @alicharts (X)
Three Prior Instances Where This Signal Marked the Bottom
This is not the first time Bitcoin has tested the short-term holder realized price and recovered. The analyst’s research identifies three comparable historical instances:
Date Spot Price at Test Short-Term Holder Realized Price Gap March 2023 $19,979 $19,794 +$185 (~0.9%) June 2023 $25,130 $25,600 −$470 (brief undercut) May 2024 $58,325 $58,570 −$245 (brief undercut) November 2026 $76,195 $75,875 +$320 (~0.4%)
Source: @alicharts (X), November 4, 2026
In each prior case, the test of the short-term holder realized price — whether a brief undercut or a close hold — preceded an uptrend resumption. The brief undercuts in June 2023 and May 2024 did not invalidate the signal; they resolved quickly and prices recovered above the level within days. The November 2026 test held above the level on the initial touch.
Why “Disbelief” Is a Technically Meaningful Label
The Disbelief phase sits at a specific position on the market cycle psychology curve: immediately after the capitulation trough, as price begins recovering, but before sentiment has shifted. At this stage, participants who bought near the top are still nursing losses, media coverage remains negative, and each rally attempt is framed as a dead-cat bounce. The analyst’s chart maps current sentiment explicitly to this zone — highlighted in red on the cycle diagram as the area of maximum skepticism.
The structural reason Disbelief is an opportunity rather than a warning: when the majority of market participants expect failure, their positioning reflects that — meaning they are already underexposed or short. Any sustained upward move forces reactive re-entry, amplifying the rally rather than dampening it. This is the mechanical feedback loop the analyst is describing when he quotes the dominant narrative back at the market.
It’s also worth noting that Bitcoin’s prior rebound faded at $76,800, and separately, stablecoin market cap recently hit a one-year low — both of which help explain why sentiment has remained compressed even as on-chain cost-basis levels suggest a floor is forming.
The Level That Matters — $75,875
The short-term holder realized price at $75,875 is the operative threshold. The analyst’s call is built around price holding above this level — not a subjective trendline or a manually drawn support zone, but a calculated aggregate cost basis derived from actual on-chain transaction data.
A sustained daily close below $75,875 would shift the signal’s interpretation: it would mean short-term holders are, on aggregate, in loss — a condition that historically precedes accelerated selling as holders capitulate to cut losses. That would reframe the current test from “Disbelief bottom” to “breakdown through support,” invalidating the analyst’s thesis.
Conversely, every session that closes above $75,875 adds time-weight to the thesis that the zone absorbed the sell pressure and held.
What the Signal Confirms — And What It Doesn’t
The short-term holder realized price test confirms: on-chain cost-basis support absorbed a $76,195 spot test without capitulation, matching the structural setup seen at three prior local bottoms.
What it does not confirm: a specific price target, a rally magnitude, or a timeline. The March 2023, June 2023, and May 2024 instances all preceded recoveries, but the magnitude of those recoveries varied substantially based on macro conditions and broader market structure. The analyst’s call is a regime identification — Disbelief bottom — not a price projection.
What to watch for continuation: Bitcoin needs to hold daily closes above $75,875 and begin establishing higher lows above that level. A reclaim of recent resistance in the $80,000–$82,000 range would shift the signal from “bottom identified” to “uptrend confirmed.”
Bullish Scenario
Bitcoin holds $75,875 on a closing basis, begins printing higher lows above the short-term holder realized price, and reclaims the $80,000–$82,000 range — consistent with the recovery path seen after the March 2023, June 2023, and May 2024 comparable tests. Sentiment completing the rotation from Disbelief toward early Belief would confirm the cycle positioning.
Bearish Scenario
A sustained daily close below $75,875 would push short-term holders into aggregate loss, historically triggering accelerated selling. That outcome would invalidate the Disbelief bottom thesis and reopen the capitulation phase of the cycle — the stage the analyst currently believes is behind us.
Three instances — March 2023, June 2023, May 2024 — all share one structural feature with the current setup: Bitcoin tested its short-term holder realized price, sentiment was at peak skepticism, and each was followed by an uptrend resumption. The November 2026 test touched $76,195 against a realized price of $75,875 and held. Whether this becomes the fourth confirmed instance or the first failed one will be determined by whether $75,875 holds on a closing basis in the sessions ahead.
Disclaimer: The views and analysis presented in this article are for informational purposes only and reflect the author’s perspective, not financial advice. Technical patterns and indicators discussed are subject to market volatility and may or may not yield the anticipated results. Investors are advised to exercise caution, conduct independent research, and make decisions aligned with their individual risk tolerance.
Bitcoin Is in the Disbelief Phase — On-Chain Data Says the Bottom Is In
Key Highlights
Bitcoin tested $76,195 against short-term holder realized price of $75,875 — a gap of just $320 or 0.4%Same on-chain threshold marked local bottoms in Mar 2023 ($19,979), Jun 2023 ($25,130), and May 2024 ($58,325)Analyst maps current sentiment to the Disbelief phase — historically the optimal entry zone before sustained uptrends$75,875 is the critical level: a sustained close below invalidates the bottom thesis
Bitcoin is holding above a critical on-chain threshold after testing $76,195 — and one analyst argues the market’s reflexive skepticism is itself the signal. When retail and short-term participants dismiss a recovery as just another failed rally, that collective disbelief has historically marked the beginning of sustained uptrends, not their end.
An on-chain analyst identifying as @alicharts posted on November 4, 2026: “Disbelief: This rally will fail like the others.” — a caption that quotes the prevailing sentiment, not his own view. The analyst is mapping current market psychology to the Disbelief phase of the classic market cycle: the stage where early recovery moves are dismissed as noise before a durable bull run takes hold. His on-chain anchor for this call is the short-term holder realized price, currently sitting at $75,875.
Analysis: Market Cycle Psychology Chart | Source: @alicharts (X)
What the Short-Term Holder Realized Price Actually Measures
The short-term holder realized price is the average acquisition cost of all Bitcoin held by wallets that received coins within the past 155 days. It is not a moving average of market price — it is a cost-basis metric. When spot price dips to or below this level, short-term holders are, on aggregate, underwater. That underwater condition historically triggers panic selling, liquidations, and capitulation — which is precisely why it has repeatedly functioned as a local bottom marker rather than a breakdown trigger.
At the November 4 test, Bitcoin touched $76,195 against a short-term holder realized price of $75,875 — a gap of just $320, or roughly 0.4%. The price tested the zone and held. That dynamic — testing the realized price without closing below it — is the specific pattern the analyst is flagging.
BTC Daily Chart | Source: @alicharts (X)
Three Prior Instances Where This Signal Marked the Bottom
This is not the first time Bitcoin has tested the short-term holder realized price and recovered. The analyst’s research identifies three comparable historical instances:
Date Spot Price at Test Short-Term Holder Realized Price Gap March 2023 $19,979 $19,794 +$185 (~0.9%) June 2023 $25,130 $25,600 −$470 (brief undercut) May 2024 $58,325 $58,570 −$245 (brief undercut) November 2026 $76,195 $75,875 +$320 (~0.4%)
Source: @alicharts (X), November 4, 2026
In each prior case, the test of the short-term holder realized price — whether a brief undercut or a close hold — preceded an uptrend resumption. The brief undercuts in June 2023 and May 2024 did not invalidate the signal; they resolved quickly and prices recovered above the level within days. The November 2026 test held above the level on the initial touch.
Why “Disbelief” Is a Technically Meaningful Label
The Disbelief phase sits at a specific position on the market cycle psychology curve: immediately after the capitulation trough, as price begins recovering, but before sentiment has shifted. At this stage, participants who bought near the top are still nursing losses, media coverage remains negative, and each rally attempt is framed as a dead-cat bounce. The analyst’s chart maps current sentiment explicitly to this zone — highlighted in red on the cycle diagram as the area of maximum skepticism.
The structural reason Disbelief is an opportunity rather than a warning: when the majority of market participants expect failure, their positioning reflects that — meaning they are already underexposed or short. Any sustained upward move forces reactive re-entry, amplifying the rally rather than dampening it. This is the mechanical feedback loop the analyst is describing when he quotes the dominant narrative back at the market.
It’s also worth noting that Bitcoin’s prior rebound faded at $76,800, and separately, stablecoin market cap recently hit a one-year low — both of which help explain why sentiment has remained compressed even as on-chain cost-basis levels suggest a floor is forming.
The Level That Matters — $75,875
The short-term holder realized price at $75,875 is the operative threshold. The analyst’s call is built around price holding above this level — not a subjective trendline or a manually drawn support zone, but a calculated aggregate cost basis derived from actual on-chain transaction data.
A sustained daily close below $75,875 would shift the signal’s interpretation: it would mean short-term holders are, on aggregate, in loss — a condition that historically precedes accelerated selling as holders capitulate to cut losses. That would reframe the current test from “Disbelief bottom” to “breakdown through support,” invalidating the analyst’s thesis.
Conversely, every session that closes above $75,875 adds time-weight to the thesis that the zone absorbed the sell pressure and held.
What the Signal Confirms — And What It Doesn’t
The short-term holder realized price test confirms: on-chain cost-basis support absorbed a $76,195 spot test without capitulation, matching the structural setup seen at three prior local bottoms.
What it does not confirm: a specific price target, a rally magnitude, or a timeline. The March 2023, June 2023, and May 2024 instances all preceded recoveries, but the magnitude of those recoveries varied substantially based on macro conditions and broader market structure. The analyst’s call is a regime identification — Disbelief bottom — not a price projection.
What to watch for continuation: Bitcoin needs to hold daily closes above $75,875 and begin establishing higher lows above that level. A reclaim of recent resistance in the $80,000–$82,000 range would shift the signal from “bottom identified” to “uptrend confirmed.”
Bullish Scenario
Bitcoin holds $75,875 on a closing basis, begins printing higher lows above the short-term holder realized price, and reclaims the $80,000–$82,000 range — consistent with the recovery path seen after the March 2023, June 2023, and May 2024 comparable tests. Sentiment completing the rotation from Disbelief toward early Belief would confirm the cycle positioning.
Bearish Scenario
A sustained daily close below $75,875 would push short-term holders into aggregate loss, historically triggering accelerated selling. That outcome would invalidate the Disbelief bottom thesis and reopen the capitulation phase of the cycle — the stage the analyst currently believes is behind us.
Three instances — March 2023, June 2023, May 2024 — all share one structural feature with the current setup: Bitcoin tested its short-term holder realized price, sentiment was at peak skepticism, and each was followed by an uptrend resumption. The November 2026 test touched $76,195 against a realized price of $75,875 and held. Whether this becomes the fourth confirmed instance or the first failed one will be determined by whether $75,875 holds on a closing basis in the sessions ahead.
Disclaimer: The views and analysis presented in this article are for informational purposes only and reflect the author’s perspective, not financial advice. Technical patterns and indicators discussed are subject to market volatility and may or may not yield the anticipated results. Investors are advised to exercise caution, conduct independent research, and make decisions aligned with their individual risk tolerance.
Bitcoin tested $76,195 against short-term holder realized price of $75,875 — a gap of just $320 or 0.4%Same on-chain threshold marked local bottoms in Mar 2023 ($19,979), Jun 2023 ($25,130), and May 2024 ($58,325)Analyst maps current sentiment to the Disbelief phase — historically the optimal entry zone before sustained uptrends$75,875 is the critical level: a sustained close below invalidates the bottom thesis
Bitcoin is holding above a critical on-chain threshold after testing $76,195 — and one analyst argues the market’s reflexive skepticism is itself the signal. When retail and short-term participants dismiss a recovery as just another failed rally, that collective disbelief has historically marked the beginning of sustained uptrends, not their end.
An on-chain analyst identifying as @alicharts posted on November 4, 2026: “Disbelief: This rally will fail like the others.” — a caption that quotes the prevailing sentiment, not his own view. The analyst is mapping current market psychology to the Disbelief phase of the classic market cycle: the stage where early recovery moves are dismissed as noise before a durable bull run takes hold. His on-chain anchor for this call is the short-term holder realized price, currently sitting at $75,875.
Analysis: Market Cycle Psychology Chart | Source: @alicharts (X)
What the Short-Term Holder Realized Price Actually Measures
The short-term holder realized price is the average acquisition cost of all Bitcoin held by wallets that received coins within the past 155 days. It is not a moving average of market price — it is a cost-basis metric. When spot price dips to or below this level, short-term holders are, on aggregate, underwater. That underwater condition historically triggers panic selling, liquidations, and capitulation — which is precisely why it has repeatedly functioned as a local bottom marker rather than a breakdown trigger.
At the November 4 test, Bitcoin touched $76,195 against a short-term holder realized price of $75,875 — a gap of just $320, or roughly 0.4%. The price tested the zone and held. That dynamic — testing the realized price without closing below it — is the specific pattern the analyst is flagging.
BTC Daily Chart | Source: @alicharts (X)
Three Prior Instances Where This Signal Marked the Bottom
This is not the first time Bitcoin has tested the short-term holder realized price and recovered. The analyst’s research identifies three comparable historical instances:
Date Spot Price at Test Short-Term Holder Realized Price Gap March 2023 $19,979 $19,794 +$185 (~0.9%) June 2023 $25,130 $25,600 −$470 (brief undercut) May 2024 $58,325 $58,570 −$245 (brief undercut) November 2026 $76,195 $75,875 +$320 (~0.4%)
Source: @alicharts (X), November 4, 2026
In each prior case, the test of the short-term holder realized price — whether a brief undercut or a close hold — preceded an uptrend resumption. The brief undercuts in June 2023 and May 2024 did not invalidate the signal; they resolved quickly and prices recovered above the level within days. The November 2026 test held above the level on the initial touch.
Why “Disbelief” Is a Technically Meaningful Label
The Disbelief phase sits at a specific position on the market cycle psychology curve: immediately after the capitulation trough, as price begins recovering, but before sentiment has shifted. At this stage, participants who bought near the top are still nursing losses, media coverage remains negative, and each rally attempt is framed as a dead-cat bounce. The analyst’s chart maps current sentiment explicitly to this zone — highlighted in red on the cycle diagram as the area of maximum skepticism.
The structural reason Disbelief is an opportunity rather than a warning: when the majority of market participants expect failure, their positioning reflects that — meaning they are already underexposed or short. Any sustained upward move forces reactive re-entry, amplifying the rally rather than dampening it. This is the mechanical feedback loop the analyst is describing when he quotes the dominant narrative back at the market.
It’s also worth noting that Bitcoin’s prior rebound faded at $76,800, and separately, stablecoin market cap recently hit a one-year low — both of which help explain why sentiment has remained compressed even as on-chain cost-basis levels suggest a floor is forming.
The Level That Matters — $75,875
The short-term holder realized price at $75,875 is the operative threshold. The analyst’s call is built around price holding above this level — not a subjective trendline or a manually drawn support zone, but a calculated aggregate cost basis derived from actual on-chain transaction data.
A sustained daily close below $75,875 would shift the signal’s interpretation: it would mean short-term holders are, on aggregate, in loss — a condition that historically precedes accelerated selling as holders capitulate to cut losses. That would reframe the current test from “Disbelief bottom” to “breakdown through support,” invalidating the analyst’s thesis.
Conversely, every session that closes above $75,875 adds time-weight to the thesis that the zone absorbed the sell pressure and held.
What the Signal Confirms — And What It Doesn’t
The short-term holder realized price test confirms: on-chain cost-basis support absorbed a $76,195 spot test without capitulation, matching the structural setup seen at three prior local bottoms.
What it does not confirm: a specific price target, a rally magnitude, or a timeline. The March 2023, June 2023, and May 2024 instances all preceded recoveries, but the magnitude of those recoveries varied substantially based on macro conditions and broader market structure. The analyst’s call is a regime identification — Disbelief bottom — not a price projection.
What to watch for continuation: Bitcoin needs to hold daily closes above $75,875 and begin establishing higher lows above that level. A reclaim of recent resistance in the $80,000–$82,000 range would shift the signal from “bottom identified” to “uptrend confirmed.”
Bullish Scenario
Bitcoin holds $75,875 on a closing basis, begins printing higher lows above the short-term holder realized price, and reclaims the $80,000–$82,000 range — consistent with the recovery path seen after the March 2023, June 2023, and May 2024 comparable tests. Sentiment completing the rotation from Disbelief toward early Belief would confirm the cycle positioning.
Bearish Scenario
A sustained daily close below $75,875 would push short-term holders into aggregate loss, historically triggering accelerated selling. That outcome would invalidate the Disbelief bottom thesis and reopen the capitulation phase of the cycle — the stage the analyst currently believes is behind us.
Three instances — March 2023, June 2023, May 2024 — all share one structural feature with the current setup: Bitcoin tested its short-term holder realized price, sentiment was at peak skepticism, and each was followed by an uptrend resumption. The November 2026 test touched $76,195 against a realized price of $75,875 and held. Whether this becomes the fourth confirmed instance or the first failed one will be determined by whether $75,875 holds on a closing basis in the sessions ahead.
Disclaimer: The views and analysis presented in this article are for informational purposes only and reflect the author’s perspective, not financial advice. Technical patterns and indicators discussed are subject to market volatility and may or may not yield the anticipated results. Investors are advised to exercise caution, conduct independent research, and make decisions aligned with their individual risk tolerance.
210
·
--
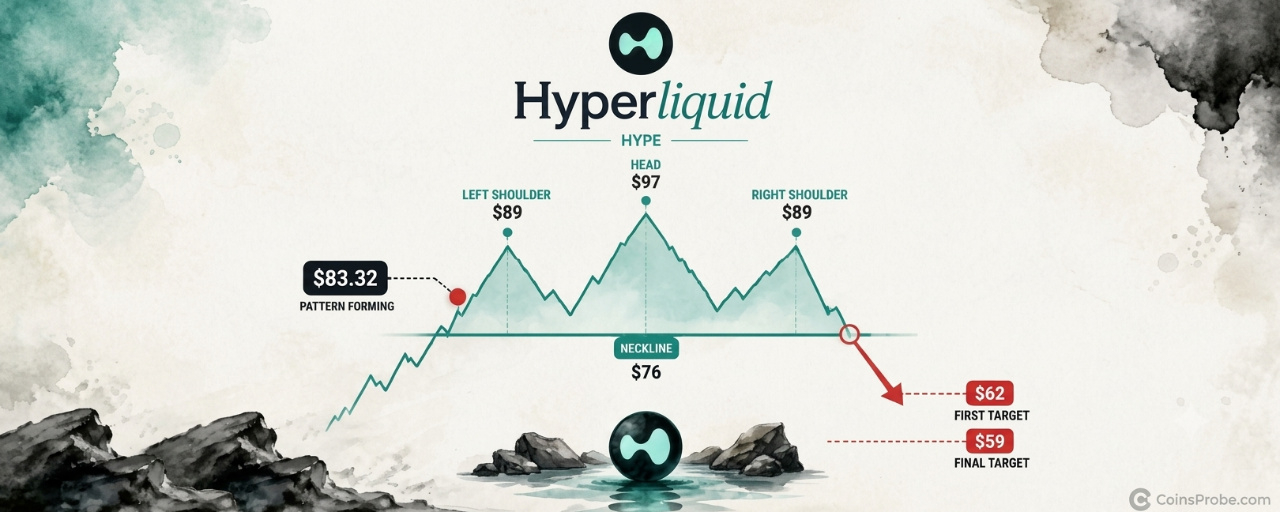
Article
Is HYPE Forming a Head-and-Shoulders Top? $76 Neckline Is the LineKey Highlights
HYPE is trading at $83.32 — forming a head-and-shoulders top on the 12-hour chart with a 22% correction impliedNeckline zone: $76–$78; confirmation requires a sustained 12-hour close below that level per the analystHyperliquid protocol shows $8.11B TVL and $84.78M in 30-day fees per DeFiLlama — fundamentals remain intact
Hyperliquid’s $HYPE token is trading at approximately $83.32 on the 12-hour chart — sitting below its recent peak near $89 and well below the cycle high near $97, in a technical structure that one analyst identifies as a textbook head-and-shoulders reversal. The pattern, if confirmed, implies a 22% correction from current levels.
A crypto analyst flagged the developing formation on November 2, 2026, outlining a precise setup: a sustained 12-hour close below the $76–$78 neckline triggers the pattern, with a first target at $62 and a final downside objective at $59. Crucially, the analyst is not anticipating the breakdown — the note is explicit that no position is warranted until the neckline gives way. As the analyst states: “Confirmation: A sustained 12-hour close below the $76–$78 neckline.”
The Pattern — Head-and-Shoulders on the 12-Hour Chart
The head-and-shoulders is among the most widely recognized reversal formations in technical analysis. It requires three sequential peaks — a left shoulder, a higher central peak (the head), and a lower right shoulder — with a horizontal neckline connecting the troughs between them. The setup becomes a confirmed breakdown only when price closes below that neckline with sustained conviction, not on an intraday wick.
On HYPE’s 12-hour chart spanning mid-September through early November, the structure is clearly formed: a Left Shoulder, a Head near the $97 region, and a Right Shoulder near $89. The neckline is drawn near $76. At the time of the analyst’s flag, HYPE is printing at $83.32 — above the neckline but below both the right shoulder and the head. The pattern is still forming. No breakdown has been confirmed yet.
HYPE 12HR Chart Analysis | Source: @alicharts (X)
The measured move from head to neckline projects approximately 22% of downside below $76, which lands near $59 — consistent with the analyst’s stated final target. The intermediate stop at $62 represents the first zone of interest if sellers accelerate.
The Two Levels That Decide Everything
The analyst’s framework reduces to a binary: the $76–$78 neckline holds, or it doesn’t.
A sustained 12-hour close below $76 — not an intraday pierce, not a wick — is the stated confirmation. That distinction matters. Neckline fakeouts are common in head-and-shoulders setups; a candle body close is the only signal the analyst is treating as actionable. If that break occurs, the first target is $62, followed by $59 as the full measured-move destination.
On the upside, the analyst identifies recovery above the right shoulder high — near $89 — as the invalidation condition. A reclaim of that level would structurally negate the right shoulder formation and shift the pattern’s interpretation. Between $83 and $89, the structure remains ambiguous: the pattern is forming, but neither thesis is confirmed.
On-Chain Context — $8.11B TVL, $84.78M in 30-Day Fees
The technical setup exists against a backdrop of exceptional protocol fundamentals. Hyperliquid’s on-chain data, per DeFiLlama as of November 3, 2026, shows $8.11B in total value locked, $181.92M in 24-hour DEX volume, and $3.20M in 24-hour fees. Over the trailing 30 days, the protocol generated $84.78M in fees on $4.15B in DEX volume — metrics that reflect genuine user activity, not speculative positioning alone.
This matters for interpreting the technical pattern. A head-and-shoulders top in a protocol with contracting fundamentals is a straightforward distribution thesis. In HYPE’s case, the on-chain engine remains running — which means the pattern’s resolution is driven by market structure and sentiment, not fundamental deterioration. The ICE and trade.xyz partnership that drove HYPE’s 16.7% surge earlier this cycle reflects genuine demand for the protocol. Whether that demand translates into price support at the neckline is the question the chart will answer.
It is also worth noting that five whales opened $52.7M in HYPE long positions on Hyperliquid Perps — a data point that, in combination with the analyst’s bearish chart setup, creates a tension between large leveraged longs and a deteriorating technical structure. If the neckline cracks, those leveraged positions face forced liquidation, which can accelerate the move to $62 faster than the measured-move math alone would suggest.
Macro Calendar — November Data Releases Add Volatility Risk
The timing of this setup overlaps with a dense macro calendar. Nonfarm Payrolls release November 6, CPI on November 10, and PPI on November 13 — three sequential macro prints within a two-week window. Any risk-off shock from these releases could provide the external catalyst that tips HYPE’s price below the $76–$78 zone, converting a technically forming pattern into a confirmed breakdown. Conversely, a strong risk-on reaction could provide the bid that invalidates the right shoulder entirely.
Bearish Scenario — Neckline Breaks at $76
A sustained 12-hour candle close below $76 confirms the head-and-shoulders. First target: $62. Final measured-move target: $59. Leveraged long liquidations between $76 and $62 could compress that range’s duration significantly.
Bullish Scenario — Recovery Above $89
A reclaim of the right shoulder high near $89 structurally invalidates the right shoulder of the pattern. That move would shift the chart back to a range-bound interpretation rather than a topping formation. The analyst explicitly names this as the invalidation condition.
HYPE’s 12-hour head-and-shoulders is a clearly formed, technically valid setup — but it remains unconfirmed at $83.32. The analyst has drawn the line at $76–$78: a sustained close below that level is the only trigger for the $62 and $59 targets. Above $89, the pattern is invalidated. Everything between those two levels is noise. Watch the $76 neckline on the 12-hour chart — that is where the thesis resolves.
Disclaimer: The views and analysis presented in this article are for informational purposes only and reflect the author’s perspective, not financial advice. Technical patterns and indicators discussed are subject to market volatility and may or may not yield the anticipated results. Investors are advised to exercise caution, conduct independent research, and make decisions aligned with their individual risk tolerance.
Is HYPE Forming a Head-and-Shoulders Top? $76 Neckline Is the Line
Key Highlights
HYPE is trading at $83.32 — forming a head-and-shoulders top on the 12-hour chart with a 22% correction impliedNeckline zone: $76–$78; confirmation requires a sustained 12-hour close below that level per the analystHyperliquid protocol shows $8.11B TVL and $84.78M in 30-day fees per DeFiLlama — fundamentals remain intact
Hyperliquid’s $HYPE token is trading at approximately $83.32 on the 12-hour chart — sitting below its recent peak near $89 and well below the cycle high near $97, in a technical structure that one analyst identifies as a textbook head-and-shoulders reversal. The pattern, if confirmed, implies a 22% correction from current levels.
A crypto analyst flagged the developing formation on November 2, 2026, outlining a precise setup: a sustained 12-hour close below the $76–$78 neckline triggers the pattern, with a first target at $62 and a final downside objective at $59. Crucially, the analyst is not anticipating the breakdown — the note is explicit that no position is warranted until the neckline gives way. As the analyst states: “Confirmation: A sustained 12-hour close below the $76–$78 neckline.”
The Pattern — Head-and-Shoulders on the 12-Hour Chart
The head-and-shoulders is among the most widely recognized reversal formations in technical analysis. It requires three sequential peaks — a left shoulder, a higher central peak (the head), and a lower right shoulder — with a horizontal neckline connecting the troughs between them. The setup becomes a confirmed breakdown only when price closes below that neckline with sustained conviction, not on an intraday wick.
On HYPE’s 12-hour chart spanning mid-September through early November, the structure is clearly formed: a Left Shoulder, a Head near the $97 region, and a Right Shoulder near $89. The neckline is drawn near $76. At the time of the analyst’s flag, HYPE is printing at $83.32 — above the neckline but below both the right shoulder and the head. The pattern is still forming. No breakdown has been confirmed yet.
HYPE 12HR Chart Analysis | Source: @alicharts (X)
The measured move from head to neckline projects approximately 22% of downside below $76, which lands near $59 — consistent with the analyst’s stated final target. The intermediate stop at $62 represents the first zone of interest if sellers accelerate.
The Two Levels That Decide Everything
The analyst’s framework reduces to a binary: the $76–$78 neckline holds, or it doesn’t.
A sustained 12-hour close below $76 — not an intraday pierce, not a wick — is the stated confirmation. That distinction matters. Neckline fakeouts are common in head-and-shoulders setups; a candle body close is the only signal the analyst is treating as actionable. If that break occurs, the first target is $62, followed by $59 as the full measured-move destination.
On the upside, the analyst identifies recovery above the right shoulder high — near $89 — as the invalidation condition. A reclaim of that level would structurally negate the right shoulder formation and shift the pattern’s interpretation. Between $83 and $89, the structure remains ambiguous: the pattern is forming, but neither thesis is confirmed.
On-Chain Context — $8.11B TVL, $84.78M in 30-Day Fees
The technical setup exists against a backdrop of exceptional protocol fundamentals. Hyperliquid’s on-chain data, per DeFiLlama as of November 3, 2026, shows $8.11B in total value locked, $181.92M in 24-hour DEX volume, and $3.20M in 24-hour fees. Over the trailing 30 days, the protocol generated $84.78M in fees on $4.15B in DEX volume — metrics that reflect genuine user activity, not speculative positioning alone.
This matters for interpreting the technical pattern. A head-and-shoulders top in a protocol with contracting fundamentals is a straightforward distribution thesis. In HYPE’s case, the on-chain engine remains running — which means the pattern’s resolution is driven by market structure and sentiment, not fundamental deterioration. The ICE and trade.xyz partnership that drove HYPE’s 16.7% surge earlier this cycle reflects genuine demand for the protocol. Whether that demand translates into price support at the neckline is the question the chart will answer.
It is also worth noting that five whales opened $52.7M in HYPE long positions on Hyperliquid Perps — a data point that, in combination with the analyst’s bearish chart setup, creates a tension between large leveraged longs and a deteriorating technical structure. If the neckline cracks, those leveraged positions face forced liquidation, which can accelerate the move to $62 faster than the measured-move math alone would suggest.
Macro Calendar — November Data Releases Add Volatility Risk
The timing of this setup overlaps with a dense macro calendar. Nonfarm Payrolls release November 6, CPI on November 10, and PPI on November 13 — three sequential macro prints within a two-week window. Any risk-off shock from these releases could provide the external catalyst that tips HYPE’s price below the $76–$78 zone, converting a technically forming pattern into a confirmed breakdown. Conversely, a strong risk-on reaction could provide the bid that invalidates the right shoulder entirely.
Bearish Scenario — Neckline Breaks at $76
A sustained 12-hour candle close below $76 confirms the head-and-shoulders. First target: $62. Final measured-move target: $59. Leveraged long liquidations between $76 and $62 could compress that range’s duration significantly.
Bullish Scenario — Recovery Above $89
A reclaim of the right shoulder high near $89 structurally invalidates the right shoulder of the pattern. That move would shift the chart back to a range-bound interpretation rather than a topping formation. The analyst explicitly names this as the invalidation condition.
HYPE’s 12-hour head-and-shoulders is a clearly formed, technically valid setup — but it remains unconfirmed at $83.32. The analyst has drawn the line at $76–$78: a sustained close below that level is the only trigger for the $62 and $59 targets. Above $89, the pattern is invalidated. Everything between those two levels is noise. Watch the $76 neckline on the 12-hour chart — that is where the thesis resolves.
Disclaimer: The views and analysis presented in this article are for informational purposes only and reflect the author’s perspective, not financial advice. Technical patterns and indicators discussed are subject to market volatility and may or may not yield the anticipated results. Investors are advised to exercise caution, conduct independent research, and make decisions aligned with their individual risk tolerance.
HYPE is trading at $83.32 — forming a head-and-shoulders top on the 12-hour chart with a 22% correction impliedNeckline zone: $76–$78; confirmation requires a sustained 12-hour close below that level per the analystHyperliquid protocol shows $8.11B TVL and $84.78M in 30-day fees per DeFiLlama — fundamentals remain intact
Hyperliquid’s $HYPE token is trading at approximately $83.32 on the 12-hour chart — sitting below its recent peak near $89 and well below the cycle high near $97, in a technical structure that one analyst identifies as a textbook head-and-shoulders reversal. The pattern, if confirmed, implies a 22% correction from current levels.
A crypto analyst flagged the developing formation on November 2, 2026, outlining a precise setup: a sustained 12-hour close below the $76–$78 neckline triggers the pattern, with a first target at $62 and a final downside objective at $59. Crucially, the analyst is not anticipating the breakdown — the note is explicit that no position is warranted until the neckline gives way. As the analyst states: “Confirmation: A sustained 12-hour close below the $76–$78 neckline.”
The Pattern — Head-and-Shoulders on the 12-Hour Chart
The head-and-shoulders is among the most widely recognized reversal formations in technical analysis. It requires three sequential peaks — a left shoulder, a higher central peak (the head), and a lower right shoulder — with a horizontal neckline connecting the troughs between them. The setup becomes a confirmed breakdown only when price closes below that neckline with sustained conviction, not on an intraday wick.
On HYPE’s 12-hour chart spanning mid-September through early November, the structure is clearly formed: a Left Shoulder, a Head near the $97 region, and a Right Shoulder near $89. The neckline is drawn near $76. At the time of the analyst’s flag, HYPE is printing at $83.32 — above the neckline but below both the right shoulder and the head. The pattern is still forming. No breakdown has been confirmed yet.
HYPE 12HR Chart Analysis | Source: @alicharts (X)
The measured move from head to neckline projects approximately 22% of downside below $76, which lands near $59 — consistent with the analyst’s stated final target. The intermediate stop at $62 represents the first zone of interest if sellers accelerate.
The Two Levels That Decide Everything
The analyst’s framework reduces to a binary: the $76–$78 neckline holds, or it doesn’t.
A sustained 12-hour close below $76 — not an intraday pierce, not a wick — is the stated confirmation. That distinction matters. Neckline fakeouts are common in head-and-shoulders setups; a candle body close is the only signal the analyst is treating as actionable. If that break occurs, the first target is $62, followed by $59 as the full measured-move destination.
On the upside, the analyst identifies recovery above the right shoulder high — near $89 — as the invalidation condition. A reclaim of that level would structurally negate the right shoulder formation and shift the pattern’s interpretation. Between $83 and $89, the structure remains ambiguous: the pattern is forming, but neither thesis is confirmed.
On-Chain Context — $8.11B TVL, $84.78M in 30-Day Fees
The technical setup exists against a backdrop of exceptional protocol fundamentals. Hyperliquid’s on-chain data, per DeFiLlama as of November 3, 2026, shows $8.11B in total value locked, $181.92M in 24-hour DEX volume, and $3.20M in 24-hour fees. Over the trailing 30 days, the protocol generated $84.78M in fees on $4.15B in DEX volume — metrics that reflect genuine user activity, not speculative positioning alone.
This matters for interpreting the technical pattern. A head-and-shoulders top in a protocol with contracting fundamentals is a straightforward distribution thesis. In HYPE’s case, the on-chain engine remains running — which means the pattern’s resolution is driven by market structure and sentiment, not fundamental deterioration. The ICE and trade.xyz partnership that drove HYPE’s 16.7% surge earlier this cycle reflects genuine demand for the protocol. Whether that demand translates into price support at the neckline is the question the chart will answer.
It is also worth noting that five whales opened $52.7M in HYPE long positions on Hyperliquid Perps — a data point that, in combination with the analyst’s bearish chart setup, creates a tension between large leveraged longs and a deteriorating technical structure. If the neckline cracks, those leveraged positions face forced liquidation, which can accelerate the move to $62 faster than the measured-move math alone would suggest.
Macro Calendar — November Data Releases Add Volatility Risk
The timing of this setup overlaps with a dense macro calendar. Nonfarm Payrolls release November 6, CPI on November 10, and PPI on November 13 — three sequential macro prints within a two-week window. Any risk-off shock from these releases could provide the external catalyst that tips HYPE’s price below the $76–$78 zone, converting a technically forming pattern into a confirmed breakdown. Conversely, a strong risk-on reaction could provide the bid that invalidates the right shoulder entirely.
Bearish Scenario — Neckline Breaks at $76
A sustained 12-hour candle close below $76 confirms the head-and-shoulders. First target: $62. Final measured-move target: $59. Leveraged long liquidations between $76 and $62 could compress that range’s duration significantly.
Bullish Scenario — Recovery Above $89
A reclaim of the right shoulder high near $89 structurally invalidates the right shoulder of the pattern. That move would shift the chart back to a range-bound interpretation rather than a topping formation. The analyst explicitly names this as the invalidation condition.
HYPE’s 12-hour head-and-shoulders is a clearly formed, technically valid setup — but it remains unconfirmed at $83.32. The analyst has drawn the line at $76–$78: a sustained close below that level is the only trigger for the $62 and $59 targets. Above $89, the pattern is invalidated. Everything between those two levels is noise. Watch the $76 neckline on the 12-hour chart — that is where the thesis resolves.
Disclaimer: The views and analysis presented in this article are for informational purposes only and reflect the author’s perspective, not financial advice. Technical patterns and indicators discussed are subject to market volatility and may or may not yield the anticipated results. Investors are advised to exercise caution, conduct independent research, and make decisions aligned with their individual risk tolerance.
333
·
--

Article
Pi Network Ships Developer Platform Updates Ahead of Its First Ecosystem SummitKey Highlights
On October 31, Pi Network announced updates to its Developer Portal, BlockExplorer, SoloHost, and PiVerify.A new SoloHost skill lets AI tools like Claude Code or Cursor generate packaging configs from a public Docker image, helping apps reach Pi’s 420,000+ Nodes.PiVerify also added face uniqueness and multi-liveness checks for third-party clients, who pay in Pi.
Pi Network has released a series of technical updates aimed at reducing friction for developers building on the platform. The official
@PiCoreTeam account highlighted the changes on October 31, noting improvements to the Developer Portal, BlockExplorer, SoloHost, and PiVerify. These updates come as the project prepares for its first-ever Ecosystem Summit, scheduled for November 17–19.The Core Team said the changes “reduce barriers to building on Pi, expand utility for Pioneers, and support preparations for the upcoming Ecosystem Summit.”
Pi Developer Technical Updates | Source: @PiCoreTeam (X)
Developer Portal: One Place for App Configuration
Pi redesigned the Developer Portal to simplify app setup and management. The old onboarding checklist is replaced by a dedicated App Configuration section that consolidates domains, API keys, app wallets, and privacy information.
The portal also gives clearer navigation to Pi Sign-In, Ecosystem Listing, PiNet, and the Pi Ad Network. The aim is to make integrating Pi authentication, payments, and ecosystem discovery easier for new builders.
Developer-Portal Interface | Source: @PiCoreTeam (X)
BlockExplorer Adds Historical Prices for Testnet Tokens
Pi BlockExplorer now tracks historical prices for Launchpad Testnet tokens such as SLICE, priced against Test-Pi. The same tracking is expected to extend to Mainnet tokens once that functionality is released.
The feature builds on earlier Launchpad updates that added in-app price charts and explained how liquidity pool swaps affect token prices. According to the Pi blog, proceeds from token launches go into a liquidity pool with the ecosystem token rather than to the issuing project. The data is publicly viewable on BlockExplorer without a Pi Browser or account.
These are Testnet tokens only and will not migrate to Mainnet.
SoloHost: AI-Assisted App Packaging
A new skill in the public SoloHost GitHub repository lets developers use AI coding assistants to prepare existing apps for publication on Pi Desktop. Previously, developers had to write the configuration files by hand.
Step What happens 1 Developer provides a public Docker image 2 The AI assistant generatesdocker-compose.ymlandconfig_options.yml 3 The assistant validates both files 4 Developer submits the packaged app for publication
This lowers the barrier for bringing self-hosted software to Pi Desktop, which can be distributed across more than 420,000 Nodes. It continues the direction covered in our Pi Desktop rename and SoloHost app ranking analysis, and it follows the OpenClaw and Atlassian MCP Server additions to SoloHost.
PiVerify: Face Uniqueness and Multiple Liveness Checks
PiVerify is expanding its third-party identity verification to include:
Face uniqueness checks, which help businesses detect potential duplicate identitiesMultiple liveness checks, which allow further verification after an initial identity confirmation
Both build on capabilities already used in Pi’s own KYC system, which we covered in our KYC fixes for over 900,000 Pioneers. Third-party clients pay in Pi for these services. The Core Team says this creates additional token utility while extending real-human verification beyond the Pi ecosystem.
Other Updates in the Window
Pi Desktop 0.6.4 (October 22): Users can now reach locally hosted SoloHost apps through Pi Browser without opening ports on home routers. The release also adds stronger app protections that validate file and network access at publishing, installation, and startup, limiting what apps can reach on the host machine.
Ecosystem Summit (November 17-19): Pi’s first Ecosystem Summit is a three-day online event focused on the developer platform, ecosystem building, and utility creation. The agenda includes platform and feature announcements, developer tool demos, partner and community app showcases, developer conversations, and a new hackathon. Details on the agenda and how to watch are expected closer to the date.
What It Does and Does Not Mean
These updates address practical barriers: app configuration, packaging, token visibility, and identity verification. As covered in our developer tools and docs hub analysis, Pi has been building this layer through 2026.
The release does not announce new Mainnet tokens, a PI supply change, or an exchange listing. Whether it produces more apps and real usage will show in developer adoption after the Summit.
Bottom Line
Pi is using the run-up to November 17 to show it has lowered the cost of building, with a simpler portal, AI-assisted packaging, public token price data, and paid identity checks. The Summit is where those tools get their first showcase.
Disclaimer: The views and analysis presented in this article are for informational purposes only and reflect the author’s perspective, not financial advice. Technical patterns and indicators discussed are subject to market volatility and may or may not yield the anticipated results. Investors are advised to exercise caution, conduct independent research, and make decisions aligned with their individual risk tolerance.
Pi Network Ships Developer Platform Updates Ahead of Its First Ecosystem Summit
Key Highlights
On October 31, Pi Network announced updates to its Developer Portal, BlockExplorer, SoloHost, and PiVerify.A new SoloHost skill lets AI tools like Claude Code or Cursor generate packaging configs from a public Docker image, helping apps reach Pi’s 420,000+ Nodes.PiVerify also added face uniqueness and multi-liveness checks for third-party clients, who pay in Pi.
Pi Network has released a series of technical updates aimed at reducing friction for developers building on the platform. The official
@PiCoreTeam account highlighted the changes on October 31, noting improvements to the Developer Portal, BlockExplorer, SoloHost, and PiVerify. These updates come as the project prepares for its first-ever Ecosystem Summit, scheduled for November 17–19.The Core Team said the changes “reduce barriers to building on Pi, expand utility for Pioneers, and support preparations for the upcoming Ecosystem Summit.”
Pi Developer Technical Updates | Source: @PiCoreTeam (X)
Developer Portal: One Place for App Configuration
Pi redesigned the Developer Portal to simplify app setup and management. The old onboarding checklist is replaced by a dedicated App Configuration section that consolidates domains, API keys, app wallets, and privacy information.
The portal also gives clearer navigation to Pi Sign-In, Ecosystem Listing, PiNet, and the Pi Ad Network. The aim is to make integrating Pi authentication, payments, and ecosystem discovery easier for new builders.
Developer-Portal Interface | Source: @PiCoreTeam (X)
BlockExplorer Adds Historical Prices for Testnet Tokens
Pi BlockExplorer now tracks historical prices for Launchpad Testnet tokens such as SLICE, priced against Test-Pi. The same tracking is expected to extend to Mainnet tokens once that functionality is released.
The feature builds on earlier Launchpad updates that added in-app price charts and explained how liquidity pool swaps affect token prices. According to the Pi blog, proceeds from token launches go into a liquidity pool with the ecosystem token rather than to the issuing project. The data is publicly viewable on BlockExplorer without a Pi Browser or account.
These are Testnet tokens only and will not migrate to Mainnet.
SoloHost: AI-Assisted App Packaging
A new skill in the public SoloHost GitHub repository lets developers use AI coding assistants to prepare existing apps for publication on Pi Desktop. Previously, developers had to write the configuration files by hand.
Step What happens 1 Developer provides a public Docker image 2 The AI assistant generatesdocker-compose.ymlandconfig_options.yml 3 The assistant validates both files 4 Developer submits the packaged app for publication
This lowers the barrier for bringing self-hosted software to Pi Desktop, which can be distributed across more than 420,000 Nodes. It continues the direction covered in our Pi Desktop rename and SoloHost app ranking analysis, and it follows the OpenClaw and Atlassian MCP Server additions to SoloHost.
PiVerify: Face Uniqueness and Multiple Liveness Checks
PiVerify is expanding its third-party identity verification to include:
Face uniqueness checks, which help businesses detect potential duplicate identitiesMultiple liveness checks, which allow further verification after an initial identity confirmation
Both build on capabilities already used in Pi’s own KYC system, which we covered in our KYC fixes for over 900,000 Pioneers. Third-party clients pay in Pi for these services. The Core Team says this creates additional token utility while extending real-human verification beyond the Pi ecosystem.
Other Updates in the Window
Pi Desktop 0.6.4 (October 22): Users can now reach locally hosted SoloHost apps through Pi Browser without opening ports on home routers. The release also adds stronger app protections that validate file and network access at publishing, installation, and startup, limiting what apps can reach on the host machine.
Ecosystem Summit (November 17-19): Pi’s first Ecosystem Summit is a three-day online event focused on the developer platform, ecosystem building, and utility creation. The agenda includes platform and feature announcements, developer tool demos, partner and community app showcases, developer conversations, and a new hackathon. Details on the agenda and how to watch are expected closer to the date.
What It Does and Does Not Mean
These updates address practical barriers: app configuration, packaging, token visibility, and identity verification. As covered in our developer tools and docs hub analysis, Pi has been building this layer through 2026.
The release does not announce new Mainnet tokens, a PI supply change, or an exchange listing. Whether it produces more apps and real usage will show in developer adoption after the Summit.
Bottom Line
Pi is using the run-up to November 17 to show it has lowered the cost of building, with a simpler portal, AI-assisted packaging, public token price data, and paid identity checks. The Summit is where those tools get their first showcase.
Disclaimer: The views and analysis presented in this article are for informational purposes only and reflect the author’s perspective, not financial advice. Technical patterns and indicators discussed are subject to market volatility and may or may not yield the anticipated results. Investors are advised to exercise caution, conduct independent research, and make decisions aligned with their individual risk tolerance.
On October 31, Pi Network announced updates to its Developer Portal, BlockExplorer, SoloHost, and PiVerify.A new SoloHost skill lets AI tools like Claude Code or Cursor generate packaging configs from a public Docker image, helping apps reach Pi’s 420,000+ Nodes.PiVerify also added face uniqueness and multi-liveness checks for third-party clients, who pay in Pi.
Pi Network has released a series of technical updates aimed at reducing friction for developers building on the platform. The official
@PiCoreTeam account highlighted the changes on October 31, noting improvements to the Developer Portal, BlockExplorer, SoloHost, and PiVerify. These updates come as the project prepares for its first-ever Ecosystem Summit, scheduled for November 17–19.The Core Team said the changes “reduce barriers to building on Pi, expand utility for Pioneers, and support preparations for the upcoming Ecosystem Summit.”
Pi Developer Technical Updates | Source: @PiCoreTeam (X)
Developer Portal: One Place for App Configuration
Pi redesigned the Developer Portal to simplify app setup and management. The old onboarding checklist is replaced by a dedicated App Configuration section that consolidates domains, API keys, app wallets, and privacy information.
The portal also gives clearer navigation to Pi Sign-In, Ecosystem Listing, PiNet, and the Pi Ad Network. The aim is to make integrating Pi authentication, payments, and ecosystem discovery easier for new builders.
Developer-Portal Interface | Source: @PiCoreTeam (X)
BlockExplorer Adds Historical Prices for Testnet Tokens
Pi BlockExplorer now tracks historical prices for Launchpad Testnet tokens such as SLICE, priced against Test-Pi. The same tracking is expected to extend to Mainnet tokens once that functionality is released.
The feature builds on earlier Launchpad updates that added in-app price charts and explained how liquidity pool swaps affect token prices. According to the Pi blog, proceeds from token launches go into a liquidity pool with the ecosystem token rather than to the issuing project. The data is publicly viewable on BlockExplorer without a Pi Browser or account.
These are Testnet tokens only and will not migrate to Mainnet.
SoloHost: AI-Assisted App Packaging
A new skill in the public SoloHost GitHub repository lets developers use AI coding assistants to prepare existing apps for publication on Pi Desktop. Previously, developers had to write the configuration files by hand.
Step What happens 1 Developer provides a public Docker image 2 The AI assistant generatesdocker-compose.ymlandconfig_options.yml 3 The assistant validates both files 4 Developer submits the packaged app for publication
This lowers the barrier for bringing self-hosted software to Pi Desktop, which can be distributed across more than 420,000 Nodes. It continues the direction covered in our Pi Desktop rename and SoloHost app ranking analysis, and it follows the OpenClaw and Atlassian MCP Server additions to SoloHost.
PiVerify: Face Uniqueness and Multiple Liveness Checks
PiVerify is expanding its third-party identity verification to include:
Face uniqueness checks, which help businesses detect potential duplicate identitiesMultiple liveness checks, which allow further verification after an initial identity confirmation
Both build on capabilities already used in Pi’s own KYC system, which we covered in our KYC fixes for over 900,000 Pioneers. Third-party clients pay in Pi for these services. The Core Team says this creates additional token utility while extending real-human verification beyond the Pi ecosystem.
Other Updates in the Window
Pi Desktop 0.6.4 (October 22): Users can now reach locally hosted SoloHost apps through Pi Browser without opening ports on home routers. The release also adds stronger app protections that validate file and network access at publishing, installation, and startup, limiting what apps can reach on the host machine.
Ecosystem Summit (November 17-19): Pi’s first Ecosystem Summit is a three-day online event focused on the developer platform, ecosystem building, and utility creation. The agenda includes platform and feature announcements, developer tool demos, partner and community app showcases, developer conversations, and a new hackathon. Details on the agenda and how to watch are expected closer to the date.
What It Does and Does Not Mean
These updates address practical barriers: app configuration, packaging, token visibility, and identity verification. As covered in our developer tools and docs hub analysis, Pi has been building this layer through 2026.
The release does not announce new Mainnet tokens, a PI supply change, or an exchange listing. Whether it produces more apps and real usage will show in developer adoption after the Summit.
Bottom Line
Pi is using the run-up to November 17 to show it has lowered the cost of building, with a simpler portal, AI-assisted packaging, public token price data, and paid identity checks. The Summit is where those tools get their first showcase.
Disclaimer: The views and analysis presented in this article are for informational purposes only and reflect the author’s perspective, not financial advice. Technical patterns and indicators discussed are subject to market volatility and may or may not yield the anticipated results. Investors are advised to exercise caution, conduct independent research, and make decisions aligned with their individual risk tolerance.
321
·
--
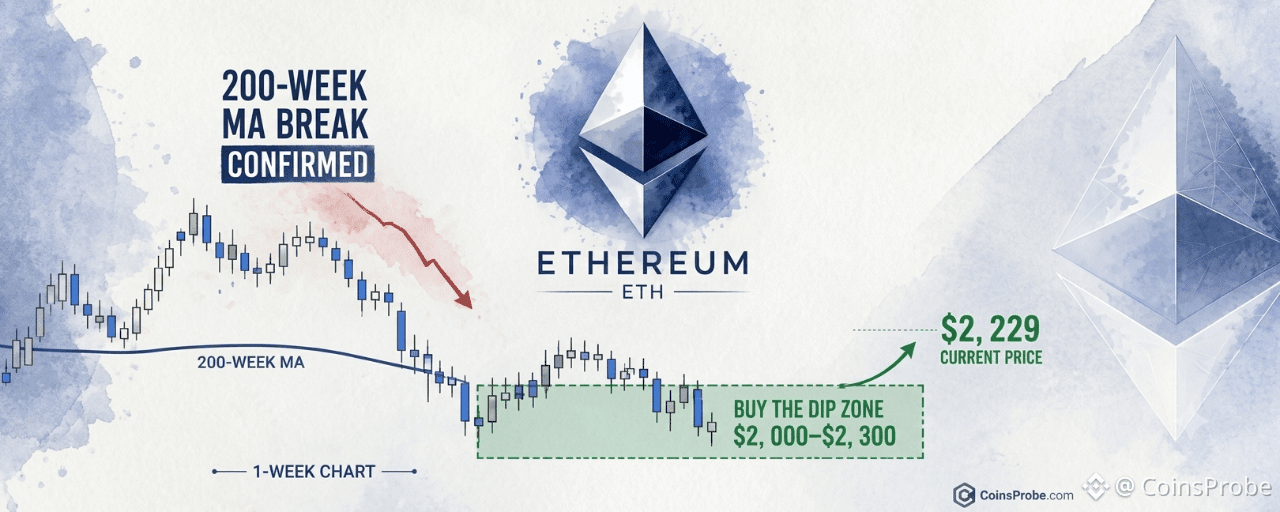
Article
ETH Enters 'Buy The Dip' Zone — $2,000–$2,300 After 200-Week MA BreakKey Highlights
ETH is trading at $2,229.55 — down 5.65% in 24h — inside the $2,000–$2,300 buy zone flagged by analyst CryptoBullet1Loss of the 200-Week Moving Average on the weekly chart confirmed mid-term correction; Fibonacci 0.382–0.618 band maps to the $2,000–$2,300 accumulation zoneSpot ETH ETFs logged $105.5M in net outflows on Oct 29 — fourth consecutive outflow dayWatch $2,000 — a weekly close below invalidates the entire dip-buying zone identified on the 1-week chart
Ethereum is trading at $2,229.55 — down 5.65% in the past 24 hours — and has now entered a pre-identified accumulation zone that one crypto analyst flagged eleven days ago as the critical dip-buying window for this cycle.
The setup belongs to an analyst who goes by the handle CryptoBullet1 on X. On October 19, 2026, the analyst published a 1-week ETH/USDT chart flagging a loss of the 200-Week Moving Average as confirmation of a mid-term correction — and simultaneously identified $2,000–$2,300 as the “Buy The Dip” zone to watch. On October 30, with ETH trading inside that exact range, the analyst posted a single-line confirmation: “$ETH has entered my ‘Buy The Dip’ Zone”
The 200-Week MA Break — What It Confirmed and What It Set Up
The 200-Week Moving Average is one of the most widely tracked long-term trend filters in crypto markets. A sustained weekly close below it is not a routine pullback event — it has historically coincided with mid-cycle corrections of significant depth. The analyst’s October 19 note treated the break explicitly as “mid-term correction confirmed,” not as a bear market call. The distinction matters: the same note immediately identified a recovery zone, which is a structurally different posture from a breakdown thesis.
The weekly chart shared by the analyst shows an Elliott Wave corrective structure. The impulse sequence — waves (1) through (5) — completed at a prior cycle high, and the current price action represents the correction phase. The analyst has drawn a green “buy zone” rectangle covering the Fibonacci 0.382–0.618 retracement band, which on the weekly chart corresponds to the $2,000–$2,300 range. With ETH at $2,229.55 at time of writing, price is sitting inside that green zone.
ETH/USDT Weekly | Source: @CryptoBullet1 (X)
ETF Outflows Add Near-Term Pressure
The macro context around this dip is not favorable in the short run. Spot Ethereum ETF data via SoSoValue shows a daily net outflow of $105.5M on October 29, extending a streak of four consecutive outflow days. The five-day net outflow totals $271.3M. ETHA led the redemptions at $71.7M, while FETH was the sole fund registering inflows at $2.9M. Total ETF net assets stand at $13.98B against cumulative net inflows of $12.44B since launch — meaning the product category is still net positive but losing institutional ground in the near term.
These outflows are consistent with the price behavior the analyst anticipated. A 200-Week MA break accompanied by ETF redemptions creates the exact kind of forced selling that compresses price into accumulation zones — which is precisely what this setup requires to function. For context on how ETH has been trading relative to broader crypto rebound targets, see BTC, ETH, XRP Rebound Targets: $86,500, $2,700, and $1.55 in Focus.
On-Chain Fundamentals: The Floor the Price Is Sitting On
DeFiLlama data shows Ethereum’s network fundamentals remain intact despite the price drawdown. Total Value Locked on Ethereum stands at $42.89B. The network generated $58.07M in fees over the past 24 hours and $114.14M over the past seven days. DEX volume over the last 24 hours reached $6.24B, with a seven-day total of $13.12B. These are not the metrics of a chain losing adoption — they are the metrics of a chain whose token is temporarily repriced below its activity levels.
The macro backdrop adds another layer of caution. FOMC rate outlook data via SoSoValue shows markets pricing a 76.1% probability of a 25 bp hike to the 4.00%–4.25% target rate at the December 9 FOMC meeting. With CPI data due November 10 and PMI prints arriving November 1–3, the next two weeks carry macro event risk that could extend the sell-off — or provide the catalyst for stabilization inside the $2,000–$2,300 zone.
What the Signal Says — and What It Doesn’t
The analyst’s call is zone-based, not level-based. The stated accumulation window is $2,000–$2,300 — a 300-point wide band on the weekly chart. ETH at $2,229.55 is 1.3% above the midpoint of that zone ($2,150) and 11.4% above the bottom of the zone ($2,000). The analyst has not published a recovery target, a reclaim timeline, or an invalidation level beyond the $2,000 floor implied by the zone’s lower boundary. There are no additional price levels in the source material.
What the signal confirms with certainty: the correction that began when ETH lost the 200-Week MA has compressed price into the pre-identified Fibonacci retracement window. What it does not confirm: the timing or magnitude of any recovery from this zone. The Elliott Wave structure shown on the weekly chart suggests the correction is in a mature phase — but wave counts are probabilistic, not deterministic.
For historical context on large ETH wallet activity that often coincides with zone entries like this, see Mysterious Whale Swaps 229 BTC for 7,469.8 ETH in a $19.1M Rotation.
The Level That Matters
The analyst’s zone has a floor at $2,000. That is the number. A weekly close below $2,000 would place ETH outside the entire Fibonacci retracement band the analyst identified as the dip-buying window — and would structurally invalidate the setup. As long as ETH holds above $2,000 on a weekly closing basis, the correction thesis remains within the parameters the analyst outlined on October 19.
Ethereum is trading at $2,229.55 inside a pre-mapped accumulation zone. The 200-Week MA break confirmed the correction. The Fibonacci 0.382–0.618 band defined the landing zone. ETF outflows and macro event risk keep near-term pressure elevated. The number every participant in this setup is watching is $2,000 — the floor of the analyst’s zone, and the level that determines whether the dip-buying thesis remains structurally intact.
Disclaimer: The views and analysis presented in this article are for informational purposes only and reflect the author’s perspective, not financial advice. Technical patterns and indicators discussed are subject to market volatility and may or may not yield the anticipated results. Investors are advised to exercise caution, conduct independent research, and make decisions aligned with their individual risk tolerance.
ETH Enters 'Buy The Dip' Zone — $2,000–$2,300 After 200-Week MA Break
Key Highlights
ETH is trading at $2,229.55 — down 5.65% in 24h — inside the $2,000–$2,300 buy zone flagged by analyst CryptoBullet1Loss of the 200-Week Moving Average on the weekly chart confirmed mid-term correction; Fibonacci 0.382–0.618 band maps to the $2,000–$2,300 accumulation zoneSpot ETH ETFs logged $105.5M in net outflows on Oct 29 — fourth consecutive outflow dayWatch $2,000 — a weekly close below invalidates the entire dip-buying zone identified on the 1-week chart
Ethereum is trading at $2,229.55 — down 5.65% in the past 24 hours — and has now entered a pre-identified accumulation zone that one crypto analyst flagged eleven days ago as the critical dip-buying window for this cycle.
The setup belongs to an analyst who goes by the handle CryptoBullet1 on X. On October 19, 2026, the analyst published a 1-week ETH/USDT chart flagging a loss of the 200-Week Moving Average as confirmation of a mid-term correction — and simultaneously identified $2,000–$2,300 as the “Buy The Dip” zone to watch. On October 30, with ETH trading inside that exact range, the analyst posted a single-line confirmation: “$ETH has entered my ‘Buy The Dip’ Zone”
The 200-Week MA Break — What It Confirmed and What It Set Up
The 200-Week Moving Average is one of the most widely tracked long-term trend filters in crypto markets. A sustained weekly close below it is not a routine pullback event — it has historically coincided with mid-cycle corrections of significant depth. The analyst’s October 19 note treated the break explicitly as “mid-term correction confirmed,” not as a bear market call. The distinction matters: the same note immediately identified a recovery zone, which is a structurally different posture from a breakdown thesis.
The weekly chart shared by the analyst shows an Elliott Wave corrective structure. The impulse sequence — waves (1) through (5) — completed at a prior cycle high, and the current price action represents the correction phase. The analyst has drawn a green “buy zone” rectangle covering the Fibonacci 0.382–0.618 retracement band, which on the weekly chart corresponds to the $2,000–$2,300 range. With ETH at $2,229.55 at time of writing, price is sitting inside that green zone.
ETH/USDT Weekly | Source: @CryptoBullet1 (X)
ETF Outflows Add Near-Term Pressure
The macro context around this dip is not favorable in the short run. Spot Ethereum ETF data via SoSoValue shows a daily net outflow of $105.5M on October 29, extending a streak of four consecutive outflow days. The five-day net outflow totals $271.3M. ETHA led the redemptions at $71.7M, while FETH was the sole fund registering inflows at $2.9M. Total ETF net assets stand at $13.98B against cumulative net inflows of $12.44B since launch — meaning the product category is still net positive but losing institutional ground in the near term.
These outflows are consistent with the price behavior the analyst anticipated. A 200-Week MA break accompanied by ETF redemptions creates the exact kind of forced selling that compresses price into accumulation zones — which is precisely what this setup requires to function. For context on how ETH has been trading relative to broader crypto rebound targets, see BTC, ETH, XRP Rebound Targets: $86,500, $2,700, and $1.55 in Focus.
On-Chain Fundamentals: The Floor the Price Is Sitting On
DeFiLlama data shows Ethereum’s network fundamentals remain intact despite the price drawdown. Total Value Locked on Ethereum stands at $42.89B. The network generated $58.07M in fees over the past 24 hours and $114.14M over the past seven days. DEX volume over the last 24 hours reached $6.24B, with a seven-day total of $13.12B. These are not the metrics of a chain losing adoption — they are the metrics of a chain whose token is temporarily repriced below its activity levels.
The macro backdrop adds another layer of caution. FOMC rate outlook data via SoSoValue shows markets pricing a 76.1% probability of a 25 bp hike to the 4.00%–4.25% target rate at the December 9 FOMC meeting. With CPI data due November 10 and PMI prints arriving November 1–3, the next two weeks carry macro event risk that could extend the sell-off — or provide the catalyst for stabilization inside the $2,000–$2,300 zone.
What the Signal Says — and What It Doesn’t
The analyst’s call is zone-based, not level-based. The stated accumulation window is $2,000–$2,300 — a 300-point wide band on the weekly chart. ETH at $2,229.55 is 1.3% above the midpoint of that zone ($2,150) and 11.4% above the bottom of the zone ($2,000). The analyst has not published a recovery target, a reclaim timeline, or an invalidation level beyond the $2,000 floor implied by the zone’s lower boundary. There are no additional price levels in the source material.
What the signal confirms with certainty: the correction that began when ETH lost the 200-Week MA has compressed price into the pre-identified Fibonacci retracement window. What it does not confirm: the timing or magnitude of any recovery from this zone. The Elliott Wave structure shown on the weekly chart suggests the correction is in a mature phase — but wave counts are probabilistic, not deterministic.
For historical context on large ETH wallet activity that often coincides with zone entries like this, see Mysterious Whale Swaps 229 BTC for 7,469.8 ETH in a $19.1M Rotation.
The Level That Matters
The analyst’s zone has a floor at $2,000. That is the number. A weekly close below $2,000 would place ETH outside the entire Fibonacci retracement band the analyst identified as the dip-buying window — and would structurally invalidate the setup. As long as ETH holds above $2,000 on a weekly closing basis, the correction thesis remains within the parameters the analyst outlined on October 19.
Ethereum is trading at $2,229.55 inside a pre-mapped accumulation zone. The 200-Week MA break confirmed the correction. The Fibonacci 0.382–0.618 band defined the landing zone. ETF outflows and macro event risk keep near-term pressure elevated. The number every participant in this setup is watching is $2,000 — the floor of the analyst’s zone, and the level that determines whether the dip-buying thesis remains structurally intact.
Disclaimer: The views and analysis presented in this article are for informational purposes only and reflect the author’s perspective, not financial advice. Technical patterns and indicators discussed are subject to market volatility and may or may not yield the anticipated results. Investors are advised to exercise caution, conduct independent research, and make decisions aligned with their individual risk tolerance.
ETH is trading at $2,229.55 — down 5.65% in 24h — inside the $2,000–$2,300 buy zone flagged by analyst CryptoBullet1Loss of the 200-Week Moving Average on the weekly chart confirmed mid-term correction; Fibonacci 0.382–0.618 band maps to the $2,000–$2,300 accumulation zoneSpot ETH ETFs logged $105.5M in net outflows on Oct 29 — fourth consecutive outflow dayWatch $2,000 — a weekly close below invalidates the entire dip-buying zone identified on the 1-week chart
Ethereum is trading at $2,229.55 — down 5.65% in the past 24 hours — and has now entered a pre-identified accumulation zone that one crypto analyst flagged eleven days ago as the critical dip-buying window for this cycle.
The setup belongs to an analyst who goes by the handle CryptoBullet1 on X. On October 19, 2026, the analyst published a 1-week ETH/USDT chart flagging a loss of the 200-Week Moving Average as confirmation of a mid-term correction — and simultaneously identified $2,000–$2,300 as the “Buy The Dip” zone to watch. On October 30, with ETH trading inside that exact range, the analyst posted a single-line confirmation: “$ETH has entered my ‘Buy The Dip’ Zone”
The 200-Week MA Break — What It Confirmed and What It Set Up
The 200-Week Moving Average is one of the most widely tracked long-term trend filters in crypto markets. A sustained weekly close below it is not a routine pullback event — it has historically coincided with mid-cycle corrections of significant depth. The analyst’s October 19 note treated the break explicitly as “mid-term correction confirmed,” not as a bear market call. The distinction matters: the same note immediately identified a recovery zone, which is a structurally different posture from a breakdown thesis.
The weekly chart shared by the analyst shows an Elliott Wave corrective structure. The impulse sequence — waves (1) through (5) — completed at a prior cycle high, and the current price action represents the correction phase. The analyst has drawn a green “buy zone” rectangle covering the Fibonacci 0.382–0.618 retracement band, which on the weekly chart corresponds to the $2,000–$2,300 range. With ETH at $2,229.55 at time of writing, price is sitting inside that green zone.
ETH/USDT Weekly | Source: @CryptoBullet1 (X)
ETF Outflows Add Near-Term Pressure
The macro context around this dip is not favorable in the short run. Spot Ethereum ETF data via SoSoValue shows a daily net outflow of $105.5M on October 29, extending a streak of four consecutive outflow days. The five-day net outflow totals $271.3M. ETHA led the redemptions at $71.7M, while FETH was the sole fund registering inflows at $2.9M. Total ETF net assets stand at $13.98B against cumulative net inflows of $12.44B since launch — meaning the product category is still net positive but losing institutional ground in the near term.
These outflows are consistent with the price behavior the analyst anticipated. A 200-Week MA break accompanied by ETF redemptions creates the exact kind of forced selling that compresses price into accumulation zones — which is precisely what this setup requires to function. For context on how ETH has been trading relative to broader crypto rebound targets, see BTC, ETH, XRP Rebound Targets: $86,500, $2,700, and $1.55 in Focus.
On-Chain Fundamentals: The Floor the Price Is Sitting On
DeFiLlama data shows Ethereum’s network fundamentals remain intact despite the price drawdown. Total Value Locked on Ethereum stands at $42.89B. The network generated $58.07M in fees over the past 24 hours and $114.14M over the past seven days. DEX volume over the last 24 hours reached $6.24B, with a seven-day total of $13.12B. These are not the metrics of a chain losing adoption — they are the metrics of a chain whose token is temporarily repriced below its activity levels.
The macro backdrop adds another layer of caution. FOMC rate outlook data via SoSoValue shows markets pricing a 76.1% probability of a 25 bp hike to the 4.00%–4.25% target rate at the December 9 FOMC meeting. With CPI data due November 10 and PMI prints arriving November 1–3, the next two weeks carry macro event risk that could extend the sell-off — or provide the catalyst for stabilization inside the $2,000–$2,300 zone.
What the Signal Says — and What It Doesn’t
The analyst’s call is zone-based, not level-based. The stated accumulation window is $2,000–$2,300 — a 300-point wide band on the weekly chart. ETH at $2,229.55 is 1.3% above the midpoint of that zone ($2,150) and 11.4% above the bottom of the zone ($2,000). The analyst has not published a recovery target, a reclaim timeline, or an invalidation level beyond the $2,000 floor implied by the zone’s lower boundary. There are no additional price levels in the source material.
What the signal confirms with certainty: the correction that began when ETH lost the 200-Week MA has compressed price into the pre-identified Fibonacci retracement window. What it does not confirm: the timing or magnitude of any recovery from this zone. The Elliott Wave structure shown on the weekly chart suggests the correction is in a mature phase — but wave counts are probabilistic, not deterministic.
For historical context on large ETH wallet activity that often coincides with zone entries like this, see Mysterious Whale Swaps 229 BTC for 7,469.8 ETH in a $19.1M Rotation.
The Level That Matters
The analyst’s zone has a floor at $2,000. That is the number. A weekly close below $2,000 would place ETH outside the entire Fibonacci retracement band the analyst identified as the dip-buying window — and would structurally invalidate the setup. As long as ETH holds above $2,000 on a weekly closing basis, the correction thesis remains within the parameters the analyst outlined on October 19.
Ethereum is trading at $2,229.55 inside a pre-mapped accumulation zone. The 200-Week MA break confirmed the correction. The Fibonacci 0.382–0.618 band defined the landing zone. ETF outflows and macro event risk keep near-term pressure elevated. The number every participant in this setup is watching is $2,000 — the floor of the analyst’s zone, and the level that determines whether the dip-buying thesis remains structurally intact.
Disclaimer: The views and analysis presented in this article are for informational purposes only and reflect the author’s perspective, not financial advice. Technical patterns and indicators discussed are subject to market volatility and may or may not yield the anticipated results. Investors are advised to exercise caution, conduct independent research, and make decisions aligned with their individual risk tolerance.
1.6k
·
--
Partly True
Article
Why Is HYPE Surging? ICE and trade.xyz Partnership Behind the RallyKey Highlights
HYPE surges 16.7% on $2.44B volume after ICE and trade.xyz confirm CFTC-regulated 24/7 perps on Hyperliquid infrastructurePayward (Kraken) separately disclosed intent to become first CFTC-regulated HIP-3* deployer on October 26 — two institutional confirmations in 72 hoursHyperliquid TVL stands at $8.62B with $80.44M in 30-day fees per DeFiLlama — fundamentals precede the partnership catalystCFTC approval remains pending — delay or denial is the primary risk that could unwind the 16.7% premium
$HYPE is up 16.7% in 24 hours — trading at approximately $94.31 with a market cap of $22.6 billion and $2.44 billion in volume — after Intercontinental Exchange (ICE) and trade.xyz announced plans to deploy US-regulated 24/7 perpetual futures markets directly on Hyperliquid’s infrastructure. This is not a speculative pump. It is the market pricing in a concrete institutional on-ramp: one of the world’s largest exchange operators choosing Hyperliquid as its onchain settlement layer for CFTC-regulated derivatives.
The announcement came via the official HyperliquidX account on October 29, 2026, confirming that ICE and trade.xyz plan to build US-regulated perpetual futures markets covering equities, indices, commodities, FX, and crypto on Hyperliquid infrastructure — subject to CFTC approval. The deal did not arrive in isolation. Three days earlier, on October 26, Payward — the parent company of Kraken — announced its intention to become the first CFTC-regulated deployer on HIP-3* markets using the same Hyperliquid stack, with Bitnomial as DCM/DCO and NinjaTrader Clearing as FCM.
The Core Catalyst — ICE Selects Hyperliquid as Infrastructure Layer
Intercontinental Exchange operates some of the most liquid derivatives markets on earth — NYSE, ICE Futures, and a global network of regulated venues. The decision by ICE and trade.xyz to build on Hyperliquid is not a branding arrangement. It is an infrastructure selection: the onchain engine that clears and settles their regulated perps will run on Hyperliquid’s blockchain.
The product scope is broad: perpetual futures across equities, indices, commodities, FX, and crypto — asset classes that have never before been accessible on a decentralized exchange to US retail under a CFTC-regulated wrapper. That is the structural shift the market is pricing.
Hyperliquid’s architecture is designed for exactly this use case. Under the HIP-3* framework, deployers retain full control over their markets, clearing, and compliance obligations. Hyperliquid functions as a neutral infrastructure layer — analogous to how AWS hosts financial applications without controlling the financial product. ICE and trade.xyz bring the regulatory license; Hyperliquid provides the onchain rails. Deployments are independent, meaning existing HIP-3 markets remain unchanged while new US-regulated markets are built in parallel.
A Three-Day Accumulation of Institutional Signals
The ICE announcement is the headline, but the structural significance is amplified by its sequencing. In the span of 72 hours, Hyperliquid received two separate institutional confirmations of its regulated infrastructure strategy:
October 26: Payward (Kraken) discloses intent to become the first CFTC-regulated HIP-3* deployer, with Bitnomial as exchange operator and NinjaTrader Clearing as FCM.October 29: ICE and trade.xyz confirm partnership to deploy US-regulated 24/7 perps across equities, indices, commodities, FX, and crypto.
Two of the most credible names in regulated finance — in three days. This is not coincidence. It is market structure: multiple incumbents independently arriving at the same infrastructure conclusion.
This follows a pattern of growing institutional confidence in the protocol. Earlier this month, five whales opened $52.7M in HYPE long positions on Hyperliquid perps, and the protocol has previously executed a significant supply reduction — burning 4.99% of HYPE supply, removing $3.89 billion permanently.
The Fundamentals Behind the Price — DeFiLlama Data
The partnership news lands on top of an already productive protocol. DeFiLlama data as of October 29, 2026 shows Hyperliquid carrying $8.62 billion in TVL, $107.27 million in 24-hour DEX volume, and $2.93 million in 24-hour fees. Over 30 days, the protocol has generated $80.44 million in fees on $3.67 billion in DEX volume — numbers that reflect genuine, sustained utilization rather than a one-day spike.
Metric Value TVL $8.62B 24h DEX Volume $107.27M 7d DEX Volume $710.49M 30d DEX Volume $3.67B 24h Fees $2.93M 30d Fees $80.44M
HYPE On-Chain Data | Source: DeFiLlama · October 29, 2026
The 24-hour trading volume of $2.44 billion in HYPE itself — against a $22.6 billion market cap — indicates serious conviction behind this move, not a thin-volume headline reaction.
Why This Is Structurally Different From a Standard Partnership Announcement
Most partnership announcements in crypto involve integration of a token into a wallet, a data feed, or a branding arrangement. This is categorically different. ICE is selecting Hyperliquid as the settlement infrastructure for regulated derivative contracts that will be sold to US institutions and retail under CFTC oversight. The regulatory wrapper is not marketing — it is the mechanism that allows US persons to access perpetual futures on equities, commodities, and FX through a CFTC-licensed product built on Hyperliquid rails.
Standard Partnership ICE + trade.xyz on Hyperliquid Token listed on partner platform Hyperliquid chosen as clearing infrastructure Branding / co-marketing CFTC-regulated products built on HIP-3* framework Adds users to ecosystem Opens US institutional capital to onchain perps Deployer has no regulatory license ICE operates NYSE and ICE Futures globally Speculative upside Contractual infrastructure dependency
Partnership Comparison | CoinsProbe
The Key Risk — CFTC Approval Is Not Guaranteed
The announcement is subject to CFTC approval. That qualifier is material. CFTC regulatory processes involve comment periods, rulebook reviews, and discretionary agency decisions — any of which can delay or deny the deployment. The market is currently pricing the probability of approval, not its certainty. If CFTC approval is delayed or denied for ICE or trade.xyz, the structural thesis weakens and HYPE’s valuation must be re-marked accordingly.
Additionally, HIP-3 deployments operate independently — ICE and trade.xyz retain full control and responsibility for their markets. Hyperliquid does not control the product or its compliance outcome. That separation protects the base protocol but also means Hyperliquid’s revenue and TVL impact from these deployments depends entirely on deployer execution.
Macro data releases add near-term context: ISM Manufacturing PMI drops November 1, ISM Non-Manufacturing PMI on November 3, and CPI on November 9, per SoSoValue. Risk-sensitive assets including HYPE will face this macro backdrop over the next two weeks.
Bullish Scenario
CFTC approval proceeds for ICE and/or trade.xyz deployments, bringing regulated US volume onto Hyperliquid rails. Protocol fees and TVL expand beyond current $8.62B. Payward (Kraken) deployment follows as first mover. Each confirmed deployment directly increases demand for Hyperliquid’s infrastructure, compounding the institutional thesis.
Bearish Scenario
CFTC delays or denies approval for HIP-3* regulated deployments. The structural thesis partially unwinds. The 16.7% premium built on institutional optionality compresses back toward pre-announcement levels. Watch for any CFTC statement or extended review period as the key risk trigger.
Intercontinental Exchange choosing Hyperliquid as the infrastructure layer for US-regulated perpetual futures — covering equities, indices, commodities, FX, and crypto — is one of the most consequential infrastructure decisions in decentralized finance to date. The 16.7% move on $2.44 billion in volume reflects the market’s assessment that CFTC approval is probable, not guaranteed. At $8.62 billion in TVL and $80.44 million in 30-day fees, the protocol’s existing fundamentals are not speculative.
The ICE and Kraken announcements add a regulatory legitimacy layer that, if fully approved, positions Hyperliquid as the onchain settlement infrastructure for US institutional derivatives — a market measured in trillions. Watch CFTC approval status as the single variable that either confirms or resets this thesis entirely.
Disclaimer: The views and analysis presented in this article are for informational purposes only and reflect the author’s perspective, not financial advice. Technical patterns and indicators discussed are subject to market volatility and may or may not yield the anticipated results. Investors are advised to exercise caution, conduct independent research, and make decisions aligned with their individual risk tolerance.
Why Is HYPE Surging? ICE and trade.xyz Partnership Behind the Rally
Key Highlights
HYPE surges 16.7% on $2.44B volume after ICE and trade.xyz confirm CFTC-regulated 24/7 perps on Hyperliquid infrastructurePayward (Kraken) separately disclosed intent to become first CFTC-regulated HIP-3* deployer on October 26 — two institutional confirmations in 72 hoursHyperliquid TVL stands at $8.62B with $80.44M in 30-day fees per DeFiLlama — fundamentals precede the partnership catalystCFTC approval remains pending — delay or denial is the primary risk that could unwind the 16.7% premium
$HYPE is up 16.7% in 24 hours — trading at approximately $94.31 with a market cap of $22.6 billion and $2.44 billion in volume — after Intercontinental Exchange (ICE) and trade.xyz announced plans to deploy US-regulated 24/7 perpetual futures markets directly on Hyperliquid’s infrastructure. This is not a speculative pump. It is the market pricing in a concrete institutional on-ramp: one of the world’s largest exchange operators choosing Hyperliquid as its onchain settlement layer for CFTC-regulated derivatives.
The announcement came via the official HyperliquidX account on October 29, 2026, confirming that ICE and trade.xyz plan to build US-regulated perpetual futures markets covering equities, indices, commodities, FX, and crypto on Hyperliquid infrastructure — subject to CFTC approval. The deal did not arrive in isolation. Three days earlier, on October 26, Payward — the parent company of Kraken — announced its intention to become the first CFTC-regulated deployer on HIP-3* markets using the same Hyperliquid stack, with Bitnomial as DCM/DCO and NinjaTrader Clearing as FCM.
The Core Catalyst — ICE Selects Hyperliquid as Infrastructure Layer
Intercontinental Exchange operates some of the most liquid derivatives markets on earth — NYSE, ICE Futures, and a global network of regulated venues. The decision by ICE and trade.xyz to build on Hyperliquid is not a branding arrangement. It is an infrastructure selection: the onchain engine that clears and settles their regulated perps will run on Hyperliquid’s blockchain.
The product scope is broad: perpetual futures across equities, indices, commodities, FX, and crypto — asset classes that have never before been accessible on a decentralized exchange to US retail under a CFTC-regulated wrapper. That is the structural shift the market is pricing.
Hyperliquid’s architecture is designed for exactly this use case. Under the HIP-3* framework, deployers retain full control over their markets, clearing, and compliance obligations. Hyperliquid functions as a neutral infrastructure layer — analogous to how AWS hosts financial applications without controlling the financial product. ICE and trade.xyz bring the regulatory license; Hyperliquid provides the onchain rails. Deployments are independent, meaning existing HIP-3 markets remain unchanged while new US-regulated markets are built in parallel.
A Three-Day Accumulation of Institutional Signals
The ICE announcement is the headline, but the structural significance is amplified by its sequencing. In the span of 72 hours, Hyperliquid received two separate institutional confirmations of its regulated infrastructure strategy:
October 26: Payward (Kraken) discloses intent to become the first CFTC-regulated HIP-3* deployer, with Bitnomial as exchange operator and NinjaTrader Clearing as FCM.October 29: ICE and trade.xyz confirm partnership to deploy US-regulated 24/7 perps across equities, indices, commodities, FX, and crypto.
Two of the most credible names in regulated finance — in three days. This is not coincidence. It is market structure: multiple incumbents independently arriving at the same infrastructure conclusion.
This follows a pattern of growing institutional confidence in the protocol. Earlier this month, five whales opened $52.7M in HYPE long positions on Hyperliquid perps, and the protocol has previously executed a significant supply reduction — burning 4.99% of HYPE supply, removing $3.89 billion permanently.
The Fundamentals Behind the Price — DeFiLlama Data
The partnership news lands on top of an already productive protocol. DeFiLlama data as of October 29, 2026 shows Hyperliquid carrying $8.62 billion in TVL, $107.27 million in 24-hour DEX volume, and $2.93 million in 24-hour fees. Over 30 days, the protocol has generated $80.44 million in fees on $3.67 billion in DEX volume — numbers that reflect genuine, sustained utilization rather than a one-day spike.
Metric Value TVL $8.62B 24h DEX Volume $107.27M 7d DEX Volume $710.49M 30d DEX Volume $3.67B 24h Fees $2.93M 30d Fees $80.44M
HYPE On-Chain Data | Source: DeFiLlama · October 29, 2026
The 24-hour trading volume of $2.44 billion in HYPE itself — against a $22.6 billion market cap — indicates serious conviction behind this move, not a thin-volume headline reaction.
Why This Is Structurally Different From a Standard Partnership Announcement
Most partnership announcements in crypto involve integration of a token into a wallet, a data feed, or a branding arrangement. This is categorically different. ICE is selecting Hyperliquid as the settlement infrastructure for regulated derivative contracts that will be sold to US institutions and retail under CFTC oversight. The regulatory wrapper is not marketing — it is the mechanism that allows US persons to access perpetual futures on equities, commodities, and FX through a CFTC-licensed product built on Hyperliquid rails.
Standard Partnership ICE + trade.xyz on Hyperliquid Token listed on partner platform Hyperliquid chosen as clearing infrastructure Branding / co-marketing CFTC-regulated products built on HIP-3* framework Adds users to ecosystem Opens US institutional capital to onchain perps Deployer has no regulatory license ICE operates NYSE and ICE Futures globally Speculative upside Contractual infrastructure dependency
Partnership Comparison | CoinsProbe
The Key Risk — CFTC Approval Is Not Guaranteed
The announcement is subject to CFTC approval. That qualifier is material. CFTC regulatory processes involve comment periods, rulebook reviews, and discretionary agency decisions — any of which can delay or deny the deployment. The market is currently pricing the probability of approval, not its certainty. If CFTC approval is delayed or denied for ICE or trade.xyz, the structural thesis weakens and HYPE’s valuation must be re-marked accordingly.
Additionally, HIP-3 deployments operate independently — ICE and trade.xyz retain full control and responsibility for their markets. Hyperliquid does not control the product or its compliance outcome. That separation protects the base protocol but also means Hyperliquid’s revenue and TVL impact from these deployments depends entirely on deployer execution.
Macro data releases add near-term context: ISM Manufacturing PMI drops November 1, ISM Non-Manufacturing PMI on November 3, and CPI on November 9, per SoSoValue. Risk-sensitive assets including HYPE will face this macro backdrop over the next two weeks.
Bullish Scenario
CFTC approval proceeds for ICE and/or trade.xyz deployments, bringing regulated US volume onto Hyperliquid rails. Protocol fees and TVL expand beyond current $8.62B. Payward (Kraken) deployment follows as first mover. Each confirmed deployment directly increases demand for Hyperliquid’s infrastructure, compounding the institutional thesis.
Bearish Scenario
CFTC delays or denies approval for HIP-3* regulated deployments. The structural thesis partially unwinds. The 16.7% premium built on institutional optionality compresses back toward pre-announcement levels. Watch for any CFTC statement or extended review period as the key risk trigger.
Intercontinental Exchange choosing Hyperliquid as the infrastructure layer for US-regulated perpetual futures — covering equities, indices, commodities, FX, and crypto — is one of the most consequential infrastructure decisions in decentralized finance to date. The 16.7% move on $2.44 billion in volume reflects the market’s assessment that CFTC approval is probable, not guaranteed. At $8.62 billion in TVL and $80.44 million in 30-day fees, the protocol’s existing fundamentals are not speculative.
The ICE and Kraken announcements add a regulatory legitimacy layer that, if fully approved, positions Hyperliquid as the onchain settlement infrastructure for US institutional derivatives — a market measured in trillions. Watch CFTC approval status as the single variable that either confirms or resets this thesis entirely.
Disclaimer: The views and analysis presented in this article are for informational purposes only and reflect the author’s perspective, not financial advice. Technical patterns and indicators discussed are subject to market volatility and may or may not yield the anticipated results. Investors are advised to exercise caution, conduct independent research, and make decisions aligned with their individual risk tolerance.
HYPE surges 16.7% on $2.44B volume after ICE and trade.xyz confirm CFTC-regulated 24/7 perps on Hyperliquid infrastructurePayward (Kraken) separately disclosed intent to become first CFTC-regulated HIP-3* deployer on October 26 — two institutional confirmations in 72 hoursHyperliquid TVL stands at $8.62B with $80.44M in 30-day fees per DeFiLlama — fundamentals precede the partnership catalystCFTC approval remains pending — delay or denial is the primary risk that could unwind the 16.7% premium
$HYPE is up 16.7% in 24 hours — trading at approximately $94.31 with a market cap of $22.6 billion and $2.44 billion in volume — after Intercontinental Exchange (ICE) and trade.xyz announced plans to deploy US-regulated 24/7 perpetual futures markets directly on Hyperliquid’s infrastructure. This is not a speculative pump. It is the market pricing in a concrete institutional on-ramp: one of the world’s largest exchange operators choosing Hyperliquid as its onchain settlement layer for CFTC-regulated derivatives.
The announcement came via the official HyperliquidX account on October 29, 2026, confirming that ICE and trade.xyz plan to build US-regulated perpetual futures markets covering equities, indices, commodities, FX, and crypto on Hyperliquid infrastructure — subject to CFTC approval. The deal did not arrive in isolation. Three days earlier, on October 26, Payward — the parent company of Kraken — announced its intention to become the first CFTC-regulated deployer on HIP-3* markets using the same Hyperliquid stack, with Bitnomial as DCM/DCO and NinjaTrader Clearing as FCM.
The Core Catalyst — ICE Selects Hyperliquid as Infrastructure Layer
Intercontinental Exchange operates some of the most liquid derivatives markets on earth — NYSE, ICE Futures, and a global network of regulated venues. The decision by ICE and trade.xyz to build on Hyperliquid is not a branding arrangement. It is an infrastructure selection: the onchain engine that clears and settles their regulated perps will run on Hyperliquid’s blockchain.
The product scope is broad: perpetual futures across equities, indices, commodities, FX, and crypto — asset classes that have never before been accessible on a decentralized exchange to US retail under a CFTC-regulated wrapper. That is the structural shift the market is pricing.
Hyperliquid’s architecture is designed for exactly this use case. Under the HIP-3* framework, deployers retain full control over their markets, clearing, and compliance obligations. Hyperliquid functions as a neutral infrastructure layer — analogous to how AWS hosts financial applications without controlling the financial product. ICE and trade.xyz bring the regulatory license; Hyperliquid provides the onchain rails. Deployments are independent, meaning existing HIP-3 markets remain unchanged while new US-regulated markets are built in parallel.
A Three-Day Accumulation of Institutional Signals
The ICE announcement is the headline, but the structural significance is amplified by its sequencing. In the span of 72 hours, Hyperliquid received two separate institutional confirmations of its regulated infrastructure strategy:
October 26: Payward (Kraken) discloses intent to become the first CFTC-regulated HIP-3* deployer, with Bitnomial as exchange operator and NinjaTrader Clearing as FCM.October 29: ICE and trade.xyz confirm partnership to deploy US-regulated 24/7 perps across equities, indices, commodities, FX, and crypto.
Two of the most credible names in regulated finance — in three days. This is not coincidence. It is market structure: multiple incumbents independently arriving at the same infrastructure conclusion.
This follows a pattern of growing institutional confidence in the protocol. Earlier this month, five whales opened $52.7M in HYPE long positions on Hyperliquid perps, and the protocol has previously executed a significant supply reduction — burning 4.99% of HYPE supply, removing $3.89 billion permanently.
The Fundamentals Behind the Price — DeFiLlama Data
The partnership news lands on top of an already productive protocol. DeFiLlama data as of October 29, 2026 shows Hyperliquid carrying $8.62 billion in TVL, $107.27 million in 24-hour DEX volume, and $2.93 million in 24-hour fees. Over 30 days, the protocol has generated $80.44 million in fees on $3.67 billion in DEX volume — numbers that reflect genuine, sustained utilization rather than a one-day spike.
Metric Value TVL $8.62B 24h DEX Volume $107.27M 7d DEX Volume $710.49M 30d DEX Volume $3.67B 24h Fees $2.93M 30d Fees $80.44M
HYPE On-Chain Data | Source: DeFiLlama · October 29, 2026
The 24-hour trading volume of $2.44 billion in HYPE itself — against a $22.6 billion market cap — indicates serious conviction behind this move, not a thin-volume headline reaction.
Why This Is Structurally Different From a Standard Partnership Announcement
Most partnership announcements in crypto involve integration of a token into a wallet, a data feed, or a branding arrangement. This is categorically different. ICE is selecting Hyperliquid as the settlement infrastructure for regulated derivative contracts that will be sold to US institutions and retail under CFTC oversight. The regulatory wrapper is not marketing — it is the mechanism that allows US persons to access perpetual futures on equities, commodities, and FX through a CFTC-licensed product built on Hyperliquid rails.
Standard Partnership ICE + trade.xyz on Hyperliquid Token listed on partner platform Hyperliquid chosen as clearing infrastructure Branding / co-marketing CFTC-regulated products built on HIP-3* framework Adds users to ecosystem Opens US institutional capital to onchain perps Deployer has no regulatory license ICE operates NYSE and ICE Futures globally Speculative upside Contractual infrastructure dependency
Partnership Comparison | CoinsProbe
The Key Risk — CFTC Approval Is Not Guaranteed
The announcement is subject to CFTC approval. That qualifier is material. CFTC regulatory processes involve comment periods, rulebook reviews, and discretionary agency decisions — any of which can delay or deny the deployment. The market is currently pricing the probability of approval, not its certainty. If CFTC approval is delayed or denied for ICE or trade.xyz, the structural thesis weakens and HYPE’s valuation must be re-marked accordingly.
Additionally, HIP-3 deployments operate independently — ICE and trade.xyz retain full control and responsibility for their markets. Hyperliquid does not control the product or its compliance outcome. That separation protects the base protocol but also means Hyperliquid’s revenue and TVL impact from these deployments depends entirely on deployer execution.
Macro data releases add near-term context: ISM Manufacturing PMI drops November 1, ISM Non-Manufacturing PMI on November 3, and CPI on November 9, per SoSoValue. Risk-sensitive assets including HYPE will face this macro backdrop over the next two weeks.
Bullish Scenario
CFTC approval proceeds for ICE and/or trade.xyz deployments, bringing regulated US volume onto Hyperliquid rails. Protocol fees and TVL expand beyond current $8.62B. Payward (Kraken) deployment follows as first mover. Each confirmed deployment directly increases demand for Hyperliquid’s infrastructure, compounding the institutional thesis.
Bearish Scenario
CFTC delays or denies approval for HIP-3* regulated deployments. The structural thesis partially unwinds. The 16.7% premium built on institutional optionality compresses back toward pre-announcement levels. Watch for any CFTC statement or extended review period as the key risk trigger.
Intercontinental Exchange choosing Hyperliquid as the infrastructure layer for US-regulated perpetual futures — covering equities, indices, commodities, FX, and crypto — is one of the most consequential infrastructure decisions in decentralized finance to date. The 16.7% move on $2.44 billion in volume reflects the market’s assessment that CFTC approval is probable, not guaranteed. At $8.62 billion in TVL and $80.44 million in 30-day fees, the protocol’s existing fundamentals are not speculative.
The ICE and Kraken announcements add a regulatory legitimacy layer that, if fully approved, positions Hyperliquid as the onchain settlement infrastructure for US institutional derivatives — a market measured in trillions. Watch CFTC approval status as the single variable that either confirms or resets this thesis entirely.
Disclaimer: The views and analysis presented in this article are for informational purposes only and reflect the author’s perspective, not financial advice. Technical patterns and indicators discussed are subject to market volatility and may or may not yield the anticipated results. Investors are advised to exercise caution, conduct independent research, and make decisions aligned with their individual risk tolerance.
HYPE+2,45%
ICEUS-0,88%
866
·
--
Partly True
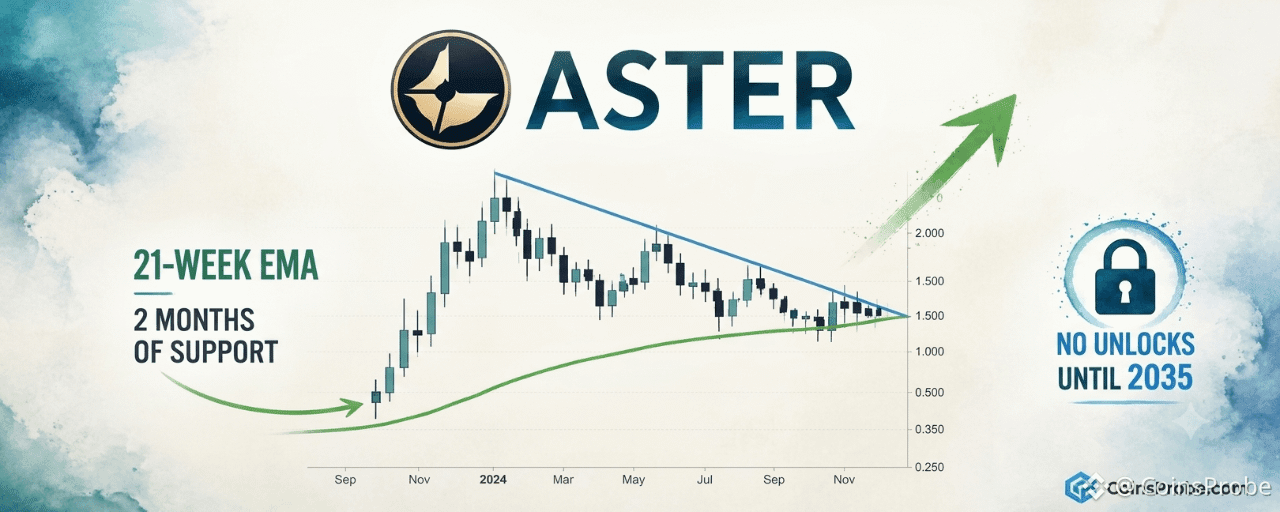
Article
ASTER Holds 21-Week EMA for 2 Months — No Unlocks Until 2035Key Highlights
ASTER trading at $0.7147, holding the 21-Week EMA as support for two consecutive months per @CryptoBullet1No significant token unlock events scheduled until 2035 — eliminating near-term dilution sell pressurePattern still forming: weekly close above descending resistance trendline is the confirmation trigger; 21-Week EMA near $0.7147 is the invalidation line
$ASTER is trading at approximately $0.7147, consolidating beneath a descending resistance trendline while holding the 21-Week Exponential Moving Average as support — a structure that analyst @CryptoBullet1 identifies as a compelling watch setup. The combination of two months of EMA defense and a near-zero near-term unlock schedule is what separates this consolidation from ordinary sideways action.
In a post dated October 29, 2026, crypto analyst @CryptoBullet1 flagged the setup directly: “I’m watching $ASTER here. I like that it’s been holding the 21-Week EMA as Support for 2 months now. No significant token unlocks until 2035.” The note is brief but structurally precise — it combines a technical anchor (the EMA) with a supply-side fundamental (unlock schedule) that removes one of the most common reasons an asset fails to sustain a breakout.
Signal 1 — 21-Week EMA Held as Support for Two Consecutive Months
The 21-Week EMA is a medium-term trend filter commonly used to separate assets in recovering uptrends from those in distribution phases. It is not an oscillator — it does not measure momentum or overbought conditions. It tracks the average closing price across the past 21 weeks, weighted toward recent closes, giving it a curved, dynamic quality that responds to sustained price behavior rather than short-term noise.
What @CryptoBullet1 highlights is not a single touch of the EMA — it is two months of continuous price defense at that level. Every weekly close for approximately eight consecutive weeks has occurred at or above the 21-Week EMA. That is the market’s way of stating that sellers at current levels are being absorbed. A single wick into EMA support is noise. Two months of sustained holds is structure.
ASTER/USDT Weekly Chart Analysis | Source: @CryptoBullet1 (X)
The weekly chart shows price consolidating beneath a descending resistance trendline that has been in place since ASTER’s prior high. The EMA21 curves upward beneath price, acting as a rising floor. The pattern is still forming — no breakout above the descending trendline has been confirmed — but the setup is one of compression: price is being squeezed between rising EMA support below and descending resistance above. The projected resolution, as annotated on the chart, points sharply higher into 2027 if resistance yields.
Signal 2 — No Significant Token Unlocks Until 2035
Token unlocks are one of the most predictable sources of forced sell pressure in crypto markets. When a project has scheduled vesting events — for team allocations, early investors, or ecosystem grants — those recipients frequently sell at unlock, creating overhead supply regardless of market conditions or fundamentals.
@CryptoBullet1’s note states explicitly: no significant token unlocks until 2035. That is approximately nine years of supply-side clarity. For an asset currently consolidating beneath resistance, the absence of scheduled unlock pressure means any breakout attempt does not face an embedded calendar headwind. Buyers do not need to price in dilution risk. The float at current levels is stable.
This is structurally different from the typical mid-cap altcoin setup, where a bullish technical pattern exists simultaneously with a six- or twelve-month unlock cliff that caps the rally. Here, the technical setup and the supply schedule are aligned rather than in conflict. For context on how unlock schedules interact with price action in other assets, see our analysis on AVAX’s long-term support retest and liquidity structure.
The Combined Setup — Compression With Structural Tailwinds
Individually, each signal has limited predictive power. An asset holding its EMA for two months could simply be in slow bleed. An asset with no unlocks until 2035 could still see its float sold aggressively by existing holders. But together, these two signals describe a specific condition: an asset holding technical structure without the supply-side pressure that typically prevents breakouts from sustaining.
The weekly chart confirms the compression structure is intact. Price at $0.7147 remains below the descending resistance trendline, with the 21-Week EMA curving upward beneath it. The pattern requires a confirmed weekly close above the descending trendline to shift from forming to resolved. Until that close materializes, the setup is a watch — not a confirmed breakout.
The engagement data on @CryptoBullet1’s post — 6,400 views with 33 likes and 6 replies — reflects early-stage attention rather than crowded consensus. Setups that attract broad agreement at formation rarely deliver the upside they advertise. This one has not yet attracted that crowd, which is consistent with the pattern still being in its compression phase.
Bullish Scenario
A sustained weekly close above the descending resistance trendline — currently converging near the $0.75–$0.85 zone based on chart structure — would confirm a breakout from two months of EMA-supported compression. With no unlock pressure through 2035, any momentum that develops post-breakout faces minimal structural supply headwind, consistent with the chart’s projected trajectory toward higher levels in 2027.
Bearish Scenario
A weekly close below the 21-Week EMA — currently near $0.7147 — would invalidate two months of support structure and shift the pattern from compression to breakdown. Loss of the EMA on a weekly closing basis is the line @CryptoBullet1’s thesis requires to remain intact.
ASTER’s setup is defined by two months of 21-Week EMA support and no meaningful supply unlock events through 2035 — a combination that removes two of the most common failure modes for altcoin breakout setups. The descending resistance trendline remains intact, the pattern has not yet resolved, and a sustained weekly close above resistance is the confirmation event the chart requires. The 21-Week EMA near $0.7147 is the line traders are watching to the downside.
Disclaimer: The views and analysis presented in this article are for informational purposes only and reflect the author’s perspective, not financial advice. Technical patterns and indicators discussed are subject to market volatility and may or may not yield the anticipated results. Investors are advised to exercise caution, conduct independent research, and make decisions aligned with their individual risk tolerance.
ASTER Holds 21-Week EMA for 2 Months — No Unlocks Until 2035
Key Highlights
ASTER trading at $0.7147, holding the 21-Week EMA as support for two consecutive months per @CryptoBullet1No significant token unlock events scheduled until 2035 — eliminating near-term dilution sell pressurePattern still forming: weekly close above descending resistance trendline is the confirmation trigger; 21-Week EMA near $0.7147 is the invalidation line
$ASTER is trading at approximately $0.7147, consolidating beneath a descending resistance trendline while holding the 21-Week Exponential Moving Average as support — a structure that analyst @CryptoBullet1 identifies as a compelling watch setup. The combination of two months of EMA defense and a near-zero near-term unlock schedule is what separates this consolidation from ordinary sideways action.
In a post dated October 29, 2026, crypto analyst @CryptoBullet1 flagged the setup directly: “I’m watching $ASTER here. I like that it’s been holding the 21-Week EMA as Support for 2 months now. No significant token unlocks until 2035.” The note is brief but structurally precise — it combines a technical anchor (the EMA) with a supply-side fundamental (unlock schedule) that removes one of the most common reasons an asset fails to sustain a breakout.
Signal 1 — 21-Week EMA Held as Support for Two Consecutive Months
The 21-Week EMA is a medium-term trend filter commonly used to separate assets in recovering uptrends from those in distribution phases. It is not an oscillator — it does not measure momentum or overbought conditions. It tracks the average closing price across the past 21 weeks, weighted toward recent closes, giving it a curved, dynamic quality that responds to sustained price behavior rather than short-term noise.
What @CryptoBullet1 highlights is not a single touch of the EMA — it is two months of continuous price defense at that level. Every weekly close for approximately eight consecutive weeks has occurred at or above the 21-Week EMA. That is the market’s way of stating that sellers at current levels are being absorbed. A single wick into EMA support is noise. Two months of sustained holds is structure.
ASTER/USDT Weekly Chart Analysis | Source: @CryptoBullet1 (X)
The weekly chart shows price consolidating beneath a descending resistance trendline that has been in place since ASTER’s prior high. The EMA21 curves upward beneath price, acting as a rising floor. The pattern is still forming — no breakout above the descending trendline has been confirmed — but the setup is one of compression: price is being squeezed between rising EMA support below and descending resistance above. The projected resolution, as annotated on the chart, points sharply higher into 2027 if resistance yields.
Signal 2 — No Significant Token Unlocks Until 2035
Token unlocks are one of the most predictable sources of forced sell pressure in crypto markets. When a project has scheduled vesting events — for team allocations, early investors, or ecosystem grants — those recipients frequently sell at unlock, creating overhead supply regardless of market conditions or fundamentals.
@CryptoBullet1’s note states explicitly: no significant token unlocks until 2035. That is approximately nine years of supply-side clarity. For an asset currently consolidating beneath resistance, the absence of scheduled unlock pressure means any breakout attempt does not face an embedded calendar headwind. Buyers do not need to price in dilution risk. The float at current levels is stable.
This is structurally different from the typical mid-cap altcoin setup, where a bullish technical pattern exists simultaneously with a six- or twelve-month unlock cliff that caps the rally. Here, the technical setup and the supply schedule are aligned rather than in conflict. For context on how unlock schedules interact with price action in other assets, see our analysis on AVAX’s long-term support retest and liquidity structure.
The Combined Setup — Compression With Structural Tailwinds
Individually, each signal has limited predictive power. An asset holding its EMA for two months could simply be in slow bleed. An asset with no unlocks until 2035 could still see its float sold aggressively by existing holders. But together, these two signals describe a specific condition: an asset holding technical structure without the supply-side pressure that typically prevents breakouts from sustaining.
The weekly chart confirms the compression structure is intact. Price at $0.7147 remains below the descending resistance trendline, with the 21-Week EMA curving upward beneath it. The pattern requires a confirmed weekly close above the descending trendline to shift from forming to resolved. Until that close materializes, the setup is a watch — not a confirmed breakout.
The engagement data on @CryptoBullet1’s post — 6,400 views with 33 likes and 6 replies — reflects early-stage attention rather than crowded consensus. Setups that attract broad agreement at formation rarely deliver the upside they advertise. This one has not yet attracted that crowd, which is consistent with the pattern still being in its compression phase.
Bullish Scenario
A sustained weekly close above the descending resistance trendline — currently converging near the $0.75–$0.85 zone based on chart structure — would confirm a breakout from two months of EMA-supported compression. With no unlock pressure through 2035, any momentum that develops post-breakout faces minimal structural supply headwind, consistent with the chart’s projected trajectory toward higher levels in 2027.
Bearish Scenario
A weekly close below the 21-Week EMA — currently near $0.7147 — would invalidate two months of support structure and shift the pattern from compression to breakdown. Loss of the EMA on a weekly closing basis is the line @CryptoBullet1’s thesis requires to remain intact.
ASTER’s setup is defined by two months of 21-Week EMA support and no meaningful supply unlock events through 2035 — a combination that removes two of the most common failure modes for altcoin breakout setups. The descending resistance trendline remains intact, the pattern has not yet resolved, and a sustained weekly close above resistance is the confirmation event the chart requires. The 21-Week EMA near $0.7147 is the line traders are watching to the downside.
Disclaimer: The views and analysis presented in this article are for informational purposes only and reflect the author’s perspective, not financial advice. Technical patterns and indicators discussed are subject to market volatility and may or may not yield the anticipated results. Investors are advised to exercise caution, conduct independent research, and make decisions aligned with their individual risk tolerance.
ASTER trading at $0.7147, holding the 21-Week EMA as support for two consecutive months per @CryptoBullet1No significant token unlock events scheduled until 2035 — eliminating near-term dilution sell pressurePattern still forming: weekly close above descending resistance trendline is the confirmation trigger; 21-Week EMA near $0.7147 is the invalidation line
$ASTER is trading at approximately $0.7147, consolidating beneath a descending resistance trendline while holding the 21-Week Exponential Moving Average as support — a structure that analyst @CryptoBullet1 identifies as a compelling watch setup. The combination of two months of EMA defense and a near-zero near-term unlock schedule is what separates this consolidation from ordinary sideways action.
In a post dated October 29, 2026, crypto analyst @CryptoBullet1 flagged the setup directly: “I’m watching $ASTER here. I like that it’s been holding the 21-Week EMA as Support for 2 months now. No significant token unlocks until 2035.” The note is brief but structurally precise — it combines a technical anchor (the EMA) with a supply-side fundamental (unlock schedule) that removes one of the most common reasons an asset fails to sustain a breakout.
Signal 1 — 21-Week EMA Held as Support for Two Consecutive Months
The 21-Week EMA is a medium-term trend filter commonly used to separate assets in recovering uptrends from those in distribution phases. It is not an oscillator — it does not measure momentum or overbought conditions. It tracks the average closing price across the past 21 weeks, weighted toward recent closes, giving it a curved, dynamic quality that responds to sustained price behavior rather than short-term noise.
What @CryptoBullet1 highlights is not a single touch of the EMA — it is two months of continuous price defense at that level. Every weekly close for approximately eight consecutive weeks has occurred at or above the 21-Week EMA. That is the market’s way of stating that sellers at current levels are being absorbed. A single wick into EMA support is noise. Two months of sustained holds is structure.
ASTER/USDT Weekly Chart Analysis | Source: @CryptoBullet1 (X)
The weekly chart shows price consolidating beneath a descending resistance trendline that has been in place since ASTER’s prior high. The EMA21 curves upward beneath price, acting as a rising floor. The pattern is still forming — no breakout above the descending trendline has been confirmed — but the setup is one of compression: price is being squeezed between rising EMA support below and descending resistance above. The projected resolution, as annotated on the chart, points sharply higher into 2027 if resistance yields.
Signal 2 — No Significant Token Unlocks Until 2035
Token unlocks are one of the most predictable sources of forced sell pressure in crypto markets. When a project has scheduled vesting events — for team allocations, early investors, or ecosystem grants — those recipients frequently sell at unlock, creating overhead supply regardless of market conditions or fundamentals.
@CryptoBullet1’s note states explicitly: no significant token unlocks until 2035. That is approximately nine years of supply-side clarity. For an asset currently consolidating beneath resistance, the absence of scheduled unlock pressure means any breakout attempt does not face an embedded calendar headwind. Buyers do not need to price in dilution risk. The float at current levels is stable.
This is structurally different from the typical mid-cap altcoin setup, where a bullish technical pattern exists simultaneously with a six- or twelve-month unlock cliff that caps the rally. Here, the technical setup and the supply schedule are aligned rather than in conflict. For context on how unlock schedules interact with price action in other assets, see our analysis on AVAX’s long-term support retest and liquidity structure.
The Combined Setup — Compression With Structural Tailwinds
Individually, each signal has limited predictive power. An asset holding its EMA for two months could simply be in slow bleed. An asset with no unlocks until 2035 could still see its float sold aggressively by existing holders. But together, these two signals describe a specific condition: an asset holding technical structure without the supply-side pressure that typically prevents breakouts from sustaining.
The weekly chart confirms the compression structure is intact. Price at $0.7147 remains below the descending resistance trendline, with the 21-Week EMA curving upward beneath it. The pattern requires a confirmed weekly close above the descending trendline to shift from forming to resolved. Until that close materializes, the setup is a watch — not a confirmed breakout.
The engagement data on @CryptoBullet1’s post — 6,400 views with 33 likes and 6 replies — reflects early-stage attention rather than crowded consensus. Setups that attract broad agreement at formation rarely deliver the upside they advertise. This one has not yet attracted that crowd, which is consistent with the pattern still being in its compression phase.
Bullish Scenario
A sustained weekly close above the descending resistance trendline — currently converging near the $0.75–$0.85 zone based on chart structure — would confirm a breakout from two months of EMA-supported compression. With no unlock pressure through 2035, any momentum that develops post-breakout faces minimal structural supply headwind, consistent with the chart’s projected trajectory toward higher levels in 2027.
Bearish Scenario
A weekly close below the 21-Week EMA — currently near $0.7147 — would invalidate two months of support structure and shift the pattern from compression to breakdown. Loss of the EMA on a weekly closing basis is the line @CryptoBullet1’s thesis requires to remain intact.
ASTER’s setup is defined by two months of 21-Week EMA support and no meaningful supply unlock events through 2035 — a combination that removes two of the most common failure modes for altcoin breakout setups. The descending resistance trendline remains intact, the pattern has not yet resolved, and a sustained weekly close above resistance is the confirmation event the chart requires. The 21-Week EMA near $0.7147 is the line traders are watching to the downside.
Disclaimer: The views and analysis presented in this article are for informational purposes only and reflect the author’s perspective, not financial advice. Technical patterns and indicators discussed are subject to market volatility and may or may not yield the anticipated results. Investors are advised to exercise caution, conduct independent research, and make decisions aligned with their individual risk tolerance.
716
·
--
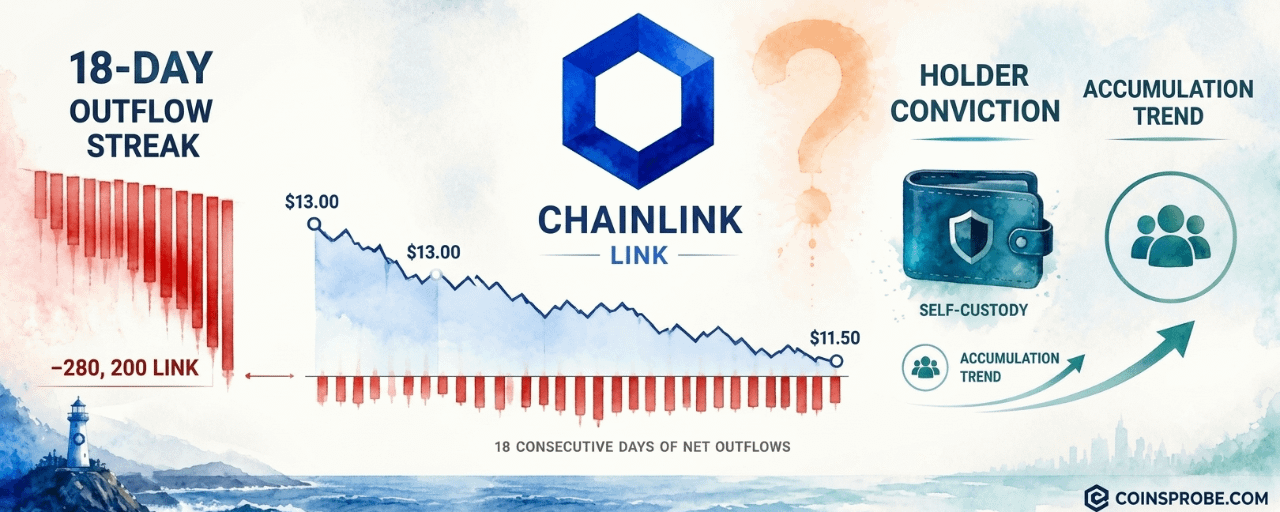
Article
Chainlink 18-Day Binance Outflow Streak — Conviction Beneath the CorrectionKey Highlights
LINK is trading at $11.60 (−1.22% 24h) after declining from ~$13 over the past 18 days18 consecutive days of net LINK outflows from Binance, latest reading −280,200 LINK — per CryptoQuant analyst MorenoDV_A large 8.7M LINK net inflow preceded the streak — partial redistribution of that deposit may account for some outflowsConstructive signal requires continued outflows AND price stabilization; LINK making lower lows keeps this pre-confirmation
Chainlink is trading at $11.60 — down 1.22% in the past 24 hours — with a market cap of approximately $8.9 billion. While the price chart looks bearish, having declined from roughly $13 to $11.50 over the past three weeks, one on-chain metric tells a structurally different story: for 18 consecutive days, LINK has been leaving Binance on net — not entering it.
The divergence was flagged by CryptoQuant analyst MorenoDV_ (@MorenoDV_) in a Quicktake published October 28, 2026. His observation: “Chainlink’s price is retreating, yet LINK continues to leave Binance.”
That sentence carries more weight than it appears to at first read. When an asset falls in price while exchange supply simultaneously contracts, the two forces are working against each other — and one of them represents a deliberate, sustained behavioral decision by holders.
The Outflow Signal — 18 Days, 280,200 LINK on Net
Exchange netflow measures the difference between tokens deposited to and withdrawn from an exchange over a given period. A persistent negative netflow — what the chart labels as -280,200 LINK on the most recent reading — means more LINK is being withdrawn than deposited. That is supply leaving the tradeable pool.
According to MorenoDV_’s CryptoQuant Quicktake, the streak spans 18 consecutive days of net outflows from Binance. During this same window, LINK’s price declined from approximately $13 to roughly $11.50. The critical detail is not any single day’s reading — it is the consistency. As the analyst notes: “The consistency of the withdrawals is more informative than any single daily reading: this is a sustained pattern rather than an isolated transfer.”
Chainlink (LINK) Exchange Netflow | Source: @cryptoquant_com (X)
The chart covering August 3 through late October shows the netflow bars turning predominantly red — indicating net outflows — from around October 10 onward, coinciding almost exactly with the price decline from peak levels near $15 in early October. Price is currently positioned below that October peak resistance zone, at the $11.5 level marked on the right axis of the chart.
What the Outflows Likely Mean — And What They Don’t
Two behavioral explanations are most consistent with the data. First, investors who purchased LINK during the correction may be moving tokens into external self-custody — accepting short-term price volatility in exchange for longer-term exposure without the counterparty risk of leaving assets on an exchange. Second, existing holders may be withdrawing LINK they no longer intend to trade actively, reducing exchange-available supply as a byproduct of conviction rather than urgency.
Both interpretations point toward the same structural conclusion: the actors withdrawing LINK are not primarily sellers. Sellers deposit to exchanges; they do not withdraw from them. The 18-day outflow streak means the marginal behavior of LINK holders has leaned toward custody, not liquidation.
However, MorenoDV_ is explicit about what the data cannot confirm: “Withdrawals reveal where tokens are moving, not why. Transfers to other venues, custody changes, or wallet reorganizations remain possible. The chart cannot establish who is accumulating or whether these movements represent fresh purchases.” That is an important constraint. Outflows narrow the probability distribution of holder intent — they do not prove accumulation.
There is also a sequencing consideration the analyst flags directly. A large net inflow of roughly 8.7 million LINK preceded the current withdrawal streak. The subsequent outflows may partly represent the redistribution of that earlier deposit — meaning a portion of the 18-day outflow could reflect position management by whoever deposited the 8.7M LINK, rather than entirely new accumulation. This is the kind of analytical nuance that separates exchange flow data from a clean buy signal.
Supply Shift Without Price Confirmation — The Incomplete Picture
The honest read of the data is this: a supply shift is underway on Binance, but price has continued declining regardless. As MorenoDV_ states directly in his note: “Price has continued falling, showing that this supply shift has yet to translate into sustained buying strength.”
Exchange outflows reduce the available float for selling pressure over time — but they do not generate immediate buying demand. For the divergence to become a reversal signal rather than simply an early-stage setup, two things need to occur simultaneously: the outflow trend needs to continue, and spot demand needs to strengthen enough to absorb whatever sell pressure remains. The analyst identifies the specific condition: “The constructive signal would be continued withdrawals alongside price stabilization and stronger spot demand.”
If LINK continues making lower lows while outflows persist, the divergence remains an early indication of changing supply conditions — not confirmation of a market reversal. The on-chain data describes the supply side; the price chart describes the demand side. Right now, supply is tightening and demand has not responded.
This dynamic is not unique to LINK — a similar pattern in Bitcoin exchange flows was documented recently at Bitcoin Exchange Netflow Turns Positive for First Time Since September 21, illustrating how netflow reversals can precede — but not guarantee — price stabilization.
Fundamental Context — $1.97B TVL, $4.44M in 30-Day Fees
The on-chain behavioral signal sits against a fundamental backdrop that is not deteriorating. DeFiLlama data shows Chainlink’s ecosystem carrying $1.97 billion in TVL and generating $4.44 million in fees over the past 30 days. That fee base reflects active oracle consumption across DeFi protocols — Chainlink’s price feeds remain load-bearing infrastructure for lending, derivatives, and stablecoin systems across multiple chains.
Metric Value TVL $1.97B 24h Fees $4K 30d Fees $4.44M
LINK On-Chain Data | Source: DeFiLlama · October 29, 2026
On the institutional side, LINK spot ETF products tracked by SoSoValue show total net assets of $209.5 million and cumulative inflows of $179.2 million since launch — though the past five trading days logged zero net inflow. Daily ETF trading volume was $7.4 million as of October 28. The ETF data is neutral-to-quiet, neither adding to nor detracting from the on-chain outflow thesis.
Macro events on the calendar include ISM Manufacturing PMI on November 1 and CPI data on November 9. Risk-asset sensitivity to both prints is elevated given the current macro environment — either a hotter-than-expected inflation reading or a contraction in manufacturing could amplify LINK’s near-term price movement in either direction.
Bullish Scenario
If LINK stabilizes at or above current levels while the outflow streak extends beyond 18 days, the supply contraction on Binance begins to carry more weight as a signal. Spot demand returning to meet the reduced exchange float would be the mechanism for price recovery. The October high near $15 represents the prior peak resistance zone that would need to be reclaimed for the chart structure to turn constructive.
Bearish Scenario
If LINK continues printing lower lows through $11.50 and below while outflows persist, the divergence remains pre-confirmation — a potential early signal, not an active reversal. MorenoDV_ addresses this directly: in that scenario, the outflows are an early indication of changing supply conditions, not a market bottom. The demand side of the equation has not yet validated the supply-side data.
The 18-day Binance outflow streak is a meaningful behavioral signal — one that narrows the probability of indiscriminate selling by LINK holders. But CryptoQuant’s MorenoDV_ is precise about what it does and does not confirm: supply is leaving the exchange, motive remains inferred, and price has not yet responded. The constructive read requires continued outflows alongside price stabilization and stronger spot demand.
Watch whether LINK can hold $11.50 — that is the level where supply contraction meets demand. If it breaks further while outflows persist, the signal remains early-stage. If it stabilizes here with outflows intact, the divergence becomes a setup worth taking seriously.
Disclaimer: The views and analysis presented in this article are for informational purposes only and reflect the author’s perspective, not financial advice. Technical patterns and indicators discussed are subject to market volatility and may or may not yield the anticipated results. Investors are advised to exercise caution, conduct independent research, and make decisions aligned with their individual risk tolerance.
Chainlink 18-Day Binance Outflow Streak — Conviction Beneath the Correction
Key Highlights
LINK is trading at $11.60 (−1.22% 24h) after declining from ~$13 over the past 18 days18 consecutive days of net LINK outflows from Binance, latest reading −280,200 LINK — per CryptoQuant analyst MorenoDV_A large 8.7M LINK net inflow preceded the streak — partial redistribution of that deposit may account for some outflowsConstructive signal requires continued outflows AND price stabilization; LINK making lower lows keeps this pre-confirmation
Chainlink is trading at $11.60 — down 1.22% in the past 24 hours — with a market cap of approximately $8.9 billion. While the price chart looks bearish, having declined from roughly $13 to $11.50 over the past three weeks, one on-chain metric tells a structurally different story: for 18 consecutive days, LINK has been leaving Binance on net — not entering it.
The divergence was flagged by CryptoQuant analyst MorenoDV_ (@MorenoDV_) in a Quicktake published October 28, 2026. His observation: “Chainlink’s price is retreating, yet LINK continues to leave Binance.”
That sentence carries more weight than it appears to at first read. When an asset falls in price while exchange supply simultaneously contracts, the two forces are working against each other — and one of them represents a deliberate, sustained behavioral decision by holders.
The Outflow Signal — 18 Days, 280,200 LINK on Net
Exchange netflow measures the difference between tokens deposited to and withdrawn from an exchange over a given period. A persistent negative netflow — what the chart labels as -280,200 LINK on the most recent reading — means more LINK is being withdrawn than deposited. That is supply leaving the tradeable pool.
According to MorenoDV_’s CryptoQuant Quicktake, the streak spans 18 consecutive days of net outflows from Binance. During this same window, LINK’s price declined from approximately $13 to roughly $11.50. The critical detail is not any single day’s reading — it is the consistency. As the analyst notes: “The consistency of the withdrawals is more informative than any single daily reading: this is a sustained pattern rather than an isolated transfer.”
Chainlink (LINK) Exchange Netflow | Source: @cryptoquant_com (X)
The chart covering August 3 through late October shows the netflow bars turning predominantly red — indicating net outflows — from around October 10 onward, coinciding almost exactly with the price decline from peak levels near $15 in early October. Price is currently positioned below that October peak resistance zone, at the $11.5 level marked on the right axis of the chart.
What the Outflows Likely Mean — And What They Don’t
Two behavioral explanations are most consistent with the data. First, investors who purchased LINK during the correction may be moving tokens into external self-custody — accepting short-term price volatility in exchange for longer-term exposure without the counterparty risk of leaving assets on an exchange. Second, existing holders may be withdrawing LINK they no longer intend to trade actively, reducing exchange-available supply as a byproduct of conviction rather than urgency.
Both interpretations point toward the same structural conclusion: the actors withdrawing LINK are not primarily sellers. Sellers deposit to exchanges; they do not withdraw from them. The 18-day outflow streak means the marginal behavior of LINK holders has leaned toward custody, not liquidation.
However, MorenoDV_ is explicit about what the data cannot confirm: “Withdrawals reveal where tokens are moving, not why. Transfers to other venues, custody changes, or wallet reorganizations remain possible. The chart cannot establish who is accumulating or whether these movements represent fresh purchases.” That is an important constraint. Outflows narrow the probability distribution of holder intent — they do not prove accumulation.
There is also a sequencing consideration the analyst flags directly. A large net inflow of roughly 8.7 million LINK preceded the current withdrawal streak. The subsequent outflows may partly represent the redistribution of that earlier deposit — meaning a portion of the 18-day outflow could reflect position management by whoever deposited the 8.7M LINK, rather than entirely new accumulation. This is the kind of analytical nuance that separates exchange flow data from a clean buy signal.
Supply Shift Without Price Confirmation — The Incomplete Picture
The honest read of the data is this: a supply shift is underway on Binance, but price has continued declining regardless. As MorenoDV_ states directly in his note: “Price has continued falling, showing that this supply shift has yet to translate into sustained buying strength.”
Exchange outflows reduce the available float for selling pressure over time — but they do not generate immediate buying demand. For the divergence to become a reversal signal rather than simply an early-stage setup, two things need to occur simultaneously: the outflow trend needs to continue, and spot demand needs to strengthen enough to absorb whatever sell pressure remains. The analyst identifies the specific condition: “The constructive signal would be continued withdrawals alongside price stabilization and stronger spot demand.”
If LINK continues making lower lows while outflows persist, the divergence remains an early indication of changing supply conditions — not confirmation of a market reversal. The on-chain data describes the supply side; the price chart describes the demand side. Right now, supply is tightening and demand has not responded.
This dynamic is not unique to LINK — a similar pattern in Bitcoin exchange flows was documented recently at Bitcoin Exchange Netflow Turns Positive for First Time Since September 21, illustrating how netflow reversals can precede — but not guarantee — price stabilization.
Fundamental Context — $1.97B TVL, $4.44M in 30-Day Fees
The on-chain behavioral signal sits against a fundamental backdrop that is not deteriorating. DeFiLlama data shows Chainlink’s ecosystem carrying $1.97 billion in TVL and generating $4.44 million in fees over the past 30 days. That fee base reflects active oracle consumption across DeFi protocols — Chainlink’s price feeds remain load-bearing infrastructure for lending, derivatives, and stablecoin systems across multiple chains.
Metric Value TVL $1.97B 24h Fees $4K 30d Fees $4.44M
LINK On-Chain Data | Source: DeFiLlama · October 29, 2026
On the institutional side, LINK spot ETF products tracked by SoSoValue show total net assets of $209.5 million and cumulative inflows of $179.2 million since launch — though the past five trading days logged zero net inflow. Daily ETF trading volume was $7.4 million as of October 28. The ETF data is neutral-to-quiet, neither adding to nor detracting from the on-chain outflow thesis.
Macro events on the calendar include ISM Manufacturing PMI on November 1 and CPI data on November 9. Risk-asset sensitivity to both prints is elevated given the current macro environment — either a hotter-than-expected inflation reading or a contraction in manufacturing could amplify LINK’s near-term price movement in either direction.
Bullish Scenario
If LINK stabilizes at or above current levels while the outflow streak extends beyond 18 days, the supply contraction on Binance begins to carry more weight as a signal. Spot demand returning to meet the reduced exchange float would be the mechanism for price recovery. The October high near $15 represents the prior peak resistance zone that would need to be reclaimed for the chart structure to turn constructive.
Bearish Scenario
If LINK continues printing lower lows through $11.50 and below while outflows persist, the divergence remains pre-confirmation — a potential early signal, not an active reversal. MorenoDV_ addresses this directly: in that scenario, the outflows are an early indication of changing supply conditions, not a market bottom. The demand side of the equation has not yet validated the supply-side data.
The 18-day Binance outflow streak is a meaningful behavioral signal — one that narrows the probability of indiscriminate selling by LINK holders. But CryptoQuant’s MorenoDV_ is precise about what it does and does not confirm: supply is leaving the exchange, motive remains inferred, and price has not yet responded. The constructive read requires continued outflows alongside price stabilization and stronger spot demand.
Watch whether LINK can hold $11.50 — that is the level where supply contraction meets demand. If it breaks further while outflows persist, the signal remains early-stage. If it stabilizes here with outflows intact, the divergence becomes a setup worth taking seriously.
Disclaimer: The views and analysis presented in this article are for informational purposes only and reflect the author’s perspective, not financial advice. Technical patterns and indicators discussed are subject to market volatility and may or may not yield the anticipated results. Investors are advised to exercise caution, conduct independent research, and make decisions aligned with their individual risk tolerance.
LINK is trading at $11.60 (−1.22% 24h) after declining from ~$13 over the past 18 days18 consecutive days of net LINK outflows from Binance, latest reading −280,200 LINK — per CryptoQuant analyst MorenoDV_A large 8.7M LINK net inflow preceded the streak — partial redistribution of that deposit may account for some outflowsConstructive signal requires continued outflows AND price stabilization; LINK making lower lows keeps this pre-confirmation
Chainlink is trading at $11.60 — down 1.22% in the past 24 hours — with a market cap of approximately $8.9 billion. While the price chart looks bearish, having declined from roughly $13 to $11.50 over the past three weeks, one on-chain metric tells a structurally different story: for 18 consecutive days, LINK has been leaving Binance on net — not entering it.
The divergence was flagged by CryptoQuant analyst MorenoDV_ (@MorenoDV_) in a Quicktake published October 28, 2026. His observation: “Chainlink’s price is retreating, yet LINK continues to leave Binance.”
That sentence carries more weight than it appears to at first read. When an asset falls in price while exchange supply simultaneously contracts, the two forces are working against each other — and one of them represents a deliberate, sustained behavioral decision by holders.
The Outflow Signal — 18 Days, 280,200 LINK on Net
Exchange netflow measures the difference between tokens deposited to and withdrawn from an exchange over a given period. A persistent negative netflow — what the chart labels as -280,200 LINK on the most recent reading — means more LINK is being withdrawn than deposited. That is supply leaving the tradeable pool.
According to MorenoDV_’s CryptoQuant Quicktake, the streak spans 18 consecutive days of net outflows from Binance. During this same window, LINK’s price declined from approximately $13 to roughly $11.50. The critical detail is not any single day’s reading — it is the consistency. As the analyst notes: “The consistency of the withdrawals is more informative than any single daily reading: this is a sustained pattern rather than an isolated transfer.”
Chainlink (LINK) Exchange Netflow | Source: @cryptoquant_com (X)
The chart covering August 3 through late October shows the netflow bars turning predominantly red — indicating net outflows — from around October 10 onward, coinciding almost exactly with the price decline from peak levels near $15 in early October. Price is currently positioned below that October peak resistance zone, at the $11.5 level marked on the right axis of the chart.
What the Outflows Likely Mean — And What They Don’t
Two behavioral explanations are most consistent with the data. First, investors who purchased LINK during the correction may be moving tokens into external self-custody — accepting short-term price volatility in exchange for longer-term exposure without the counterparty risk of leaving assets on an exchange. Second, existing holders may be withdrawing LINK they no longer intend to trade actively, reducing exchange-available supply as a byproduct of conviction rather than urgency.
Both interpretations point toward the same structural conclusion: the actors withdrawing LINK are not primarily sellers. Sellers deposit to exchanges; they do not withdraw from them. The 18-day outflow streak means the marginal behavior of LINK holders has leaned toward custody, not liquidation.
However, MorenoDV_ is explicit about what the data cannot confirm: “Withdrawals reveal where tokens are moving, not why. Transfers to other venues, custody changes, or wallet reorganizations remain possible. The chart cannot establish who is accumulating or whether these movements represent fresh purchases.” That is an important constraint. Outflows narrow the probability distribution of holder intent — they do not prove accumulation.
There is also a sequencing consideration the analyst flags directly. A large net inflow of roughly 8.7 million LINK preceded the current withdrawal streak. The subsequent outflows may partly represent the redistribution of that earlier deposit — meaning a portion of the 18-day outflow could reflect position management by whoever deposited the 8.7M LINK, rather than entirely new accumulation. This is the kind of analytical nuance that separates exchange flow data from a clean buy signal.
Supply Shift Without Price Confirmation — The Incomplete Picture
The honest read of the data is this: a supply shift is underway on Binance, but price has continued declining regardless. As MorenoDV_ states directly in his note: “Price has continued falling, showing that this supply shift has yet to translate into sustained buying strength.”
Exchange outflows reduce the available float for selling pressure over time — but they do not generate immediate buying demand. For the divergence to become a reversal signal rather than simply an early-stage setup, two things need to occur simultaneously: the outflow trend needs to continue, and spot demand needs to strengthen enough to absorb whatever sell pressure remains. The analyst identifies the specific condition: “The constructive signal would be continued withdrawals alongside price stabilization and stronger spot demand.”
If LINK continues making lower lows while outflows persist, the divergence remains an early indication of changing supply conditions — not confirmation of a market reversal. The on-chain data describes the supply side; the price chart describes the demand side. Right now, supply is tightening and demand has not responded.
This dynamic is not unique to LINK — a similar pattern in Bitcoin exchange flows was documented recently at Bitcoin Exchange Netflow Turns Positive for First Time Since September 21, illustrating how netflow reversals can precede — but not guarantee — price stabilization.
Fundamental Context — $1.97B TVL, $4.44M in 30-Day Fees
The on-chain behavioral signal sits against a fundamental backdrop that is not deteriorating. DeFiLlama data shows Chainlink’s ecosystem carrying $1.97 billion in TVL and generating $4.44 million in fees over the past 30 days. That fee base reflects active oracle consumption across DeFi protocols — Chainlink’s price feeds remain load-bearing infrastructure for lending, derivatives, and stablecoin systems across multiple chains.
Metric Value TVL $1.97B 24h Fees $4K 30d Fees $4.44M
LINK On-Chain Data | Source: DeFiLlama · October 29, 2026
On the institutional side, LINK spot ETF products tracked by SoSoValue show total net assets of $209.5 million and cumulative inflows of $179.2 million since launch — though the past five trading days logged zero net inflow. Daily ETF trading volume was $7.4 million as of October 28. The ETF data is neutral-to-quiet, neither adding to nor detracting from the on-chain outflow thesis.
Macro events on the calendar include ISM Manufacturing PMI on November 1 and CPI data on November 9. Risk-asset sensitivity to both prints is elevated given the current macro environment — either a hotter-than-expected inflation reading or a contraction in manufacturing could amplify LINK’s near-term price movement in either direction.
Bullish Scenario
If LINK stabilizes at or above current levels while the outflow streak extends beyond 18 days, the supply contraction on Binance begins to carry more weight as a signal. Spot demand returning to meet the reduced exchange float would be the mechanism for price recovery. The October high near $15 represents the prior peak resistance zone that would need to be reclaimed for the chart structure to turn constructive.
Bearish Scenario
If LINK continues printing lower lows through $11.50 and below while outflows persist, the divergence remains pre-confirmation — a potential early signal, not an active reversal. MorenoDV_ addresses this directly: in that scenario, the outflows are an early indication of changing supply conditions, not a market bottom. The demand side of the equation has not yet validated the supply-side data.
The 18-day Binance outflow streak is a meaningful behavioral signal — one that narrows the probability of indiscriminate selling by LINK holders. But CryptoQuant’s MorenoDV_ is precise about what it does and does not confirm: supply is leaving the exchange, motive remains inferred, and price has not yet responded. The constructive read requires continued outflows alongside price stabilization and stronger spot demand.
Watch whether LINK can hold $11.50 — that is the level where supply contraction meets demand. If it breaks further while outflows persist, the signal remains early-stage. If it stabilizes here with outflows intact, the divergence becomes a setup worth taking seriously.
Disclaimer: The views and analysis presented in this article are for informational purposes only and reflect the author’s perspective, not financial advice. Technical patterns and indicators discussed are subject to market volatility and may or may not yield the anticipated results. Investors are advised to exercise caution, conduct independent research, and make decisions aligned with their individual risk tolerance.
138
·
--
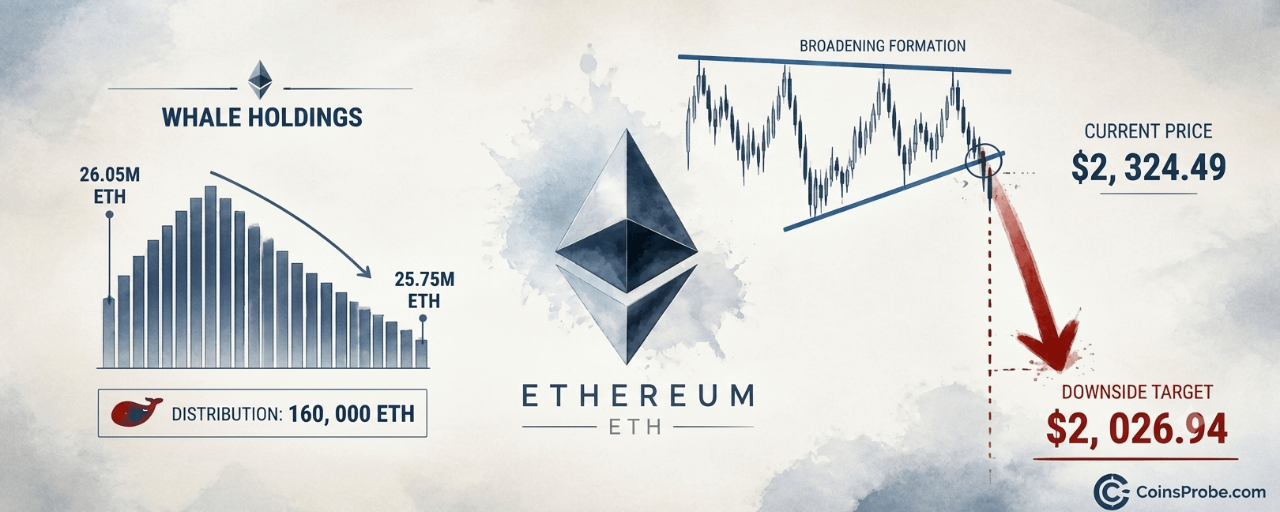
Article
Why Is ETH Falling? Three On-Chain Signals Point to $2,000Key Highlights
ETH trades at $2,324.49 (-1.76%) after rejection at $2,400 on October 28 — breakdown confirmed below $2,385.23Whales sold ~160,000 ETH ($348M) in days as $100B volume spike collapsed immediately — classic distribution fakeout per @alichartsExchange balances rose 100,000 ETH ($240M) to 6.03M ETH while ETF outflows hit $276.4M over 5 daysDaily chart broadening formation breakdown targets $2,026.94 — next key level per Martinez's analysis
Ethereum is trading at $2,324.49 — down 1.76% in the last 24 hours — with a market cap of $284.3 billion. The weakness is not random. Three simultaneous on-chain signals are pointing in the same direction: a volume fakeout at $2,400, active whale distribution, and a confirmed chart pattern breakdown — all converging on a downside target of $2,000.
Crypto analyst Ali Martinez (@alicharts) published a six-part thread on October 29, 2026, documenting each signal with precision. His conclusion: the rejection at $2,400 was not a consolidation — it was a distribution event. “Whale holdings may help explain the weakness,” Martinez notes in the thread, pointing to coordinated selling that preceded the price slide.
Signal 1 — The $100B Volume Fakeout
As Ethereum approached $2,400 on October 28, on-chain transaction volume surged past $100 billion in a single day — a reading that appeared, on its surface, to signal explosive demand. It did not. Price was rejected at $2,400 and slid back below $2,300 within the same session. By October 29, volume had collapsed back toward baseline levels near the $1 billion range.
This is the textbook structure of a volume fakeout: a spike that attracts buyers, followed by immediate distribution into that liquidity. The surge past $100B did not reflect sustained buyer conviction — it reflected the moment large holders needed to offload size. The volume appeared; the price did not hold. That divergence is the signal.
ETH Transaction Volume Analysis | Source: @alicharts (X)
Signal 2 — Whale Distribution: 160,000 ETH Sold in Days
Santiment data flagged by Martinez shows that large ETH holders reduced their positions by approximately 160,000 ETH — worth more than $348 million — over the days surrounding the $2,400 rejection. The chart shows a clear inverted-V pattern in whale holdings: a peak around October 26, followed by a sustained decline through October 28–29, with the most recent readings approaching the 25.75 million ETH level on the y-axis.
This is not passive selling. The timing — concentrated around the exact price level where volume spiked — suggests coordinated distribution into retail buying pressure. When whales reduce positions at resistance, they are not exiting because they are wrong. They are exiting because they believe the level will not hold. It did not.
ETH Held by Whales | Source: @alicharts (X)
Signal 3 — Exchange Balances Rise by 100,000 ETH ($240M)
Simultaneously, Ethereum held on exchanges increased by approximately 100,000 ETH — worth roughly $240 million — over the same five-day window (April 25–29). Exchange balance moved from approximately 5.92 million ETH to 6.03 million ETH, with the highest reading recorded on October 29. The trend is still forming, with no reversal confirmed at the latest data point.
Rising exchange balances are a direct supply-side signal. ETH transferred to exchanges is ETH positioned to be sold. Combined with the 160,000 ETH in active whale distribution, the market is currently absorbing more than $588 million in combined selling pressure — whale offloading plus exchange-ready supply — concentrated in a matter of days.
ETH Exchange Balance | Source: @alicharts (X)
The Chart Confirms It — Ascending Broadening Formation Breakdown
The daily chart shared by Martinez reveals a right-angled ascending broadening formation — a pattern defined by a flat upper horizontal resistance and a rising lower trendline. Price broke downward through the rising base trendline, then continued declining through multiple horizontal support levels. The $2,385.23 support has been lost. The current price, marked at $2,310.73 on the chart, sits below both $2,385.23 and $2,469.78. The breakdown is confirmed.
Martinez identifies $2,026.94 as the next significant level, represented on the chart with a directional marker below current price. This level aligns with the pattern’s measured projection and the $2,000 downside target that emerges from the combination of broken structure, rising exchange supply, and whale distribution. Ethereum has crossed 3.8 billion total transactions on-chain per Chainspect data — the network is active, but activity has not translated into price support.
ETH Daily Chart | Source: @alicharts (X)
ETF Flows Confirm Institutional Exit
Spot Ethereum ETF data from SoSoValue reinforces the on-chain picture. As of October 28, 2026, ETH spot ETFs recorded a daily net outflow of $21.4 million, extending a streak of three consecutive outflow days. Over the past five trading sessions, net outflows total $276.4 million across four of five days. ETHA, the largest fund with $7.45 billion in AUM, posted the heaviest single-day outflow at $44.8 million. Only FETH recorded an inflow — $18.8 million — insufficient to offset the broader trend.
Total ETF net assets stand at $14.27 billion against $12.55 billion in cumulative net inflows since launch, a spread that has compressed as redemptions accelerate. Institutional participants are not buying the $2,400 rejection — they are reducing exposure into it. For context on smart money positioning, one notable exception: a ETH smart trader opened a $45.34M 25x long position prior to this move — that trade now faces significant pressure.
DeFiLlama Fundamentals — Strong Network, Weak Price Signal
Ethereum’s on-chain fundamentals, per DeFiLlama, remain intact: TVL at $45.88 billion, 24-hour DEX volume at $1.65 billion, and 24-hour fees at $9.97 million. These numbers reflect a functioning, heavily-used network. They do not, however, constitute a price catalyst in the current environment. Strong TVL did not prevent the $2,400 rejection. Strong fee generation did not stop the broadening formation from breaking down. Fundamentals set a floor for long-term value; they do not resolve near-term supply imbalances of the kind currently in motion.
Macro Backdrop — FOMC and Upcoming Data
The macro calendar adds further uncertainty. Markets currently price an 85.6% probability of the Federal Reserve holding rates at 4.00%–4.25% at the December 9, 2026 FOMC meeting, per SoSoValue. A hold is not inherently negative for risk assets, but it removes the catalyst of a rate cut from the near-term playbook. Key data releases in the coming days — ISM Manufacturing PMI on November 1, Services PMI on November 3, and CPI on November 9 — could shift that calculus. Any upside surprise in inflation data would weaken the case for policy easing and apply additional pressure on ETH.
Bearish Scenario — Continuation to $2,026
If ETH holds below $2,385.23 while exchange balances remain elevated above 6.03 million ETH, the pattern’s measured projection to $2,026.94 — and the broader $2,000 target — remains the primary directional read. A sustained close below $2,310.73 accelerates that timeline.
Bullish Scenario — Reclaim of $2,385
A confirmed daily close back above $2,385.23, accompanied by a reversal in exchange balances (ETH moving off exchanges) and stabilization in whale holdings above 26.05 million ETH, would invalidate the immediate bearish structure and open a retest of $2,469.78.
Three independent signals — a $100 billion volume fakeout at $2,400, 160,000 ETH in whale distribution worth $348 million, and 100,000 ETH in rising exchange supply worth $240 million — have converged simultaneously with a confirmed daily chart breakdown below $2,385.23. ETF outflows totaling $276.4 million over five days confirm the institutional read. Martinez’s downside target of $2,026.94 on the chart and the broader $2,000 level are the levels the market is now pricing toward. Watch $2,385.23 — a sustained daily reclaim there is the only near-term data point that disrupts the current bearish structure.
Disclaimer: The views and analysis presented in this article are for informational purposes only and reflect the author’s perspective, not financial advice. Technical patterns and indicators discussed are subject to market volatility and may or may not yield the anticipated results. Investors are advised to exercise caution, conduct independent research, and make decisions aligned with their individual risk tolerance.
Why Is ETH Falling? Three On-Chain Signals Point to $2,000
Key Highlights
ETH trades at $2,324.49 (-1.76%) after rejection at $2,400 on October 28 — breakdown confirmed below $2,385.23Whales sold ~160,000 ETH ($348M) in days as $100B volume spike collapsed immediately — classic distribution fakeout per @alichartsExchange balances rose 100,000 ETH ($240M) to 6.03M ETH while ETF outflows hit $276.4M over 5 daysDaily chart broadening formation breakdown targets $2,026.94 — next key level per Martinez's analysis
Ethereum is trading at $2,324.49 — down 1.76% in the last 24 hours — with a market cap of $284.3 billion. The weakness is not random. Three simultaneous on-chain signals are pointing in the same direction: a volume fakeout at $2,400, active whale distribution, and a confirmed chart pattern breakdown — all converging on a downside target of $2,000.
Crypto analyst Ali Martinez (@alicharts) published a six-part thread on October 29, 2026, documenting each signal with precision. His conclusion: the rejection at $2,400 was not a consolidation — it was a distribution event. “Whale holdings may help explain the weakness,” Martinez notes in the thread, pointing to coordinated selling that preceded the price slide.
Signal 1 — The $100B Volume Fakeout
As Ethereum approached $2,400 on October 28, on-chain transaction volume surged past $100 billion in a single day — a reading that appeared, on its surface, to signal explosive demand. It did not. Price was rejected at $2,400 and slid back below $2,300 within the same session. By October 29, volume had collapsed back toward baseline levels near the $1 billion range.
This is the textbook structure of a volume fakeout: a spike that attracts buyers, followed by immediate distribution into that liquidity. The surge past $100B did not reflect sustained buyer conviction — it reflected the moment large holders needed to offload size. The volume appeared; the price did not hold. That divergence is the signal.
ETH Transaction Volume Analysis | Source: @alicharts (X)
Signal 2 — Whale Distribution: 160,000 ETH Sold in Days
Santiment data flagged by Martinez shows that large ETH holders reduced their positions by approximately 160,000 ETH — worth more than $348 million — over the days surrounding the $2,400 rejection. The chart shows a clear inverted-V pattern in whale holdings: a peak around October 26, followed by a sustained decline through October 28–29, with the most recent readings approaching the 25.75 million ETH level on the y-axis.
This is not passive selling. The timing — concentrated around the exact price level where volume spiked — suggests coordinated distribution into retail buying pressure. When whales reduce positions at resistance, they are not exiting because they are wrong. They are exiting because they believe the level will not hold. It did not.
ETH Held by Whales | Source: @alicharts (X)
Signal 3 — Exchange Balances Rise by 100,000 ETH ($240M)
Simultaneously, Ethereum held on exchanges increased by approximately 100,000 ETH — worth roughly $240 million — over the same five-day window (April 25–29). Exchange balance moved from approximately 5.92 million ETH to 6.03 million ETH, with the highest reading recorded on October 29. The trend is still forming, with no reversal confirmed at the latest data point.
Rising exchange balances are a direct supply-side signal. ETH transferred to exchanges is ETH positioned to be sold. Combined with the 160,000 ETH in active whale distribution, the market is currently absorbing more than $588 million in combined selling pressure — whale offloading plus exchange-ready supply — concentrated in a matter of days.
ETH Exchange Balance | Source: @alicharts (X)
The Chart Confirms It — Ascending Broadening Formation Breakdown
The daily chart shared by Martinez reveals a right-angled ascending broadening formation — a pattern defined by a flat upper horizontal resistance and a rising lower trendline. Price broke downward through the rising base trendline, then continued declining through multiple horizontal support levels. The $2,385.23 support has been lost. The current price, marked at $2,310.73 on the chart, sits below both $2,385.23 and $2,469.78. The breakdown is confirmed.
Martinez identifies $2,026.94 as the next significant level, represented on the chart with a directional marker below current price. This level aligns with the pattern’s measured projection and the $2,000 downside target that emerges from the combination of broken structure, rising exchange supply, and whale distribution. Ethereum has crossed 3.8 billion total transactions on-chain per Chainspect data — the network is active, but activity has not translated into price support.
ETH Daily Chart | Source: @alicharts (X)
ETF Flows Confirm Institutional Exit
Spot Ethereum ETF data from SoSoValue reinforces the on-chain picture. As of October 28, 2026, ETH spot ETFs recorded a daily net outflow of $21.4 million, extending a streak of three consecutive outflow days. Over the past five trading sessions, net outflows total $276.4 million across four of five days. ETHA, the largest fund with $7.45 billion in AUM, posted the heaviest single-day outflow at $44.8 million. Only FETH recorded an inflow — $18.8 million — insufficient to offset the broader trend.
Total ETF net assets stand at $14.27 billion against $12.55 billion in cumulative net inflows since launch, a spread that has compressed as redemptions accelerate. Institutional participants are not buying the $2,400 rejection — they are reducing exposure into it. For context on smart money positioning, one notable exception: a ETH smart trader opened a $45.34M 25x long position prior to this move — that trade now faces significant pressure.
DeFiLlama Fundamentals — Strong Network, Weak Price Signal
Ethereum’s on-chain fundamentals, per DeFiLlama, remain intact: TVL at $45.88 billion, 24-hour DEX volume at $1.65 billion, and 24-hour fees at $9.97 million. These numbers reflect a functioning, heavily-used network. They do not, however, constitute a price catalyst in the current environment. Strong TVL did not prevent the $2,400 rejection. Strong fee generation did not stop the broadening formation from breaking down. Fundamentals set a floor for long-term value; they do not resolve near-term supply imbalances of the kind currently in motion.
Macro Backdrop — FOMC and Upcoming Data
The macro calendar adds further uncertainty. Markets currently price an 85.6% probability of the Federal Reserve holding rates at 4.00%–4.25% at the December 9, 2026 FOMC meeting, per SoSoValue. A hold is not inherently negative for risk assets, but it removes the catalyst of a rate cut from the near-term playbook. Key data releases in the coming days — ISM Manufacturing PMI on November 1, Services PMI on November 3, and CPI on November 9 — could shift that calculus. Any upside surprise in inflation data would weaken the case for policy easing and apply additional pressure on ETH.
Bearish Scenario — Continuation to $2,026
If ETH holds below $2,385.23 while exchange balances remain elevated above 6.03 million ETH, the pattern’s measured projection to $2,026.94 — and the broader $2,000 target — remains the primary directional read. A sustained close below $2,310.73 accelerates that timeline.
Bullish Scenario — Reclaim of $2,385
A confirmed daily close back above $2,385.23, accompanied by a reversal in exchange balances (ETH moving off exchanges) and stabilization in whale holdings above 26.05 million ETH, would invalidate the immediate bearish structure and open a retest of $2,469.78.
Three independent signals — a $100 billion volume fakeout at $2,400, 160,000 ETH in whale distribution worth $348 million, and 100,000 ETH in rising exchange supply worth $240 million — have converged simultaneously with a confirmed daily chart breakdown below $2,385.23. ETF outflows totaling $276.4 million over five days confirm the institutional read. Martinez’s downside target of $2,026.94 on the chart and the broader $2,000 level are the levels the market is now pricing toward. Watch $2,385.23 — a sustained daily reclaim there is the only near-term data point that disrupts the current bearish structure.
Disclaimer: The views and analysis presented in this article are for informational purposes only and reflect the author’s perspective, not financial advice. Technical patterns and indicators discussed are subject to market volatility and may or may not yield the anticipated results. Investors are advised to exercise caution, conduct independent research, and make decisions aligned with their individual risk tolerance.
ETH trades at $2,324.49 (-1.76%) after rejection at $2,400 on October 28 — breakdown confirmed below $2,385.23Whales sold ~160,000 ETH ($348M) in days as $100B volume spike collapsed immediately — classic distribution fakeout per @alichartsExchange balances rose 100,000 ETH ($240M) to 6.03M ETH while ETF outflows hit $276.4M over 5 daysDaily chart broadening formation breakdown targets $2,026.94 — next key level per Martinez's analysis
Ethereum is trading at $2,324.49 — down 1.76% in the last 24 hours — with a market cap of $284.3 billion. The weakness is not random. Three simultaneous on-chain signals are pointing in the same direction: a volume fakeout at $2,400, active whale distribution, and a confirmed chart pattern breakdown — all converging on a downside target of $2,000.
Crypto analyst Ali Martinez (@alicharts) published a six-part thread on October 29, 2026, documenting each signal with precision. His conclusion: the rejection at $2,400 was not a consolidation — it was a distribution event. “Whale holdings may help explain the weakness,” Martinez notes in the thread, pointing to coordinated selling that preceded the price slide.
Signal 1 — The $100B Volume Fakeout
As Ethereum approached $2,400 on October 28, on-chain transaction volume surged past $100 billion in a single day — a reading that appeared, on its surface, to signal explosive demand. It did not. Price was rejected at $2,400 and slid back below $2,300 within the same session. By October 29, volume had collapsed back toward baseline levels near the $1 billion range.
This is the textbook structure of a volume fakeout: a spike that attracts buyers, followed by immediate distribution into that liquidity. The surge past $100B did not reflect sustained buyer conviction — it reflected the moment large holders needed to offload size. The volume appeared; the price did not hold. That divergence is the signal.
ETH Transaction Volume Analysis | Source: @alicharts (X)
Signal 2 — Whale Distribution: 160,000 ETH Sold in Days
Santiment data flagged by Martinez shows that large ETH holders reduced their positions by approximately 160,000 ETH — worth more than $348 million — over the days surrounding the $2,400 rejection. The chart shows a clear inverted-V pattern in whale holdings: a peak around October 26, followed by a sustained decline through October 28–29, with the most recent readings approaching the 25.75 million ETH level on the y-axis.
This is not passive selling. The timing — concentrated around the exact price level where volume spiked — suggests coordinated distribution into retail buying pressure. When whales reduce positions at resistance, they are not exiting because they are wrong. They are exiting because they believe the level will not hold. It did not.
ETH Held by Whales | Source: @alicharts (X)
Signal 3 — Exchange Balances Rise by 100,000 ETH ($240M)
Simultaneously, Ethereum held on exchanges increased by approximately 100,000 ETH — worth roughly $240 million — over the same five-day window (April 25–29). Exchange balance moved from approximately 5.92 million ETH to 6.03 million ETH, with the highest reading recorded on October 29. The trend is still forming, with no reversal confirmed at the latest data point.
Rising exchange balances are a direct supply-side signal. ETH transferred to exchanges is ETH positioned to be sold. Combined with the 160,000 ETH in active whale distribution, the market is currently absorbing more than $588 million in combined selling pressure — whale offloading plus exchange-ready supply — concentrated in a matter of days.
ETH Exchange Balance | Source: @alicharts (X)
The Chart Confirms It — Ascending Broadening Formation Breakdown
The daily chart shared by Martinez reveals a right-angled ascending broadening formation — a pattern defined by a flat upper horizontal resistance and a rising lower trendline. Price broke downward through the rising base trendline, then continued declining through multiple horizontal support levels. The $2,385.23 support has been lost. The current price, marked at $2,310.73 on the chart, sits below both $2,385.23 and $2,469.78. The breakdown is confirmed.
Martinez identifies $2,026.94 as the next significant level, represented on the chart with a directional marker below current price. This level aligns with the pattern’s measured projection and the $2,000 downside target that emerges from the combination of broken structure, rising exchange supply, and whale distribution. Ethereum has crossed 3.8 billion total transactions on-chain per Chainspect data — the network is active, but activity has not translated into price support.
ETH Daily Chart | Source: @alicharts (X)
ETF Flows Confirm Institutional Exit
Spot Ethereum ETF data from SoSoValue reinforces the on-chain picture. As of October 28, 2026, ETH spot ETFs recorded a daily net outflow of $21.4 million, extending a streak of three consecutive outflow days. Over the past five trading sessions, net outflows total $276.4 million across four of five days. ETHA, the largest fund with $7.45 billion in AUM, posted the heaviest single-day outflow at $44.8 million. Only FETH recorded an inflow — $18.8 million — insufficient to offset the broader trend.
Total ETF net assets stand at $14.27 billion against $12.55 billion in cumulative net inflows since launch, a spread that has compressed as redemptions accelerate. Institutional participants are not buying the $2,400 rejection — they are reducing exposure into it. For context on smart money positioning, one notable exception: a ETH smart trader opened a $45.34M 25x long position prior to this move — that trade now faces significant pressure.
DeFiLlama Fundamentals — Strong Network, Weak Price Signal
Ethereum’s on-chain fundamentals, per DeFiLlama, remain intact: TVL at $45.88 billion, 24-hour DEX volume at $1.65 billion, and 24-hour fees at $9.97 million. These numbers reflect a functioning, heavily-used network. They do not, however, constitute a price catalyst in the current environment. Strong TVL did not prevent the $2,400 rejection. Strong fee generation did not stop the broadening formation from breaking down. Fundamentals set a floor for long-term value; they do not resolve near-term supply imbalances of the kind currently in motion.
Macro Backdrop — FOMC and Upcoming Data
The macro calendar adds further uncertainty. Markets currently price an 85.6% probability of the Federal Reserve holding rates at 4.00%–4.25% at the December 9, 2026 FOMC meeting, per SoSoValue. A hold is not inherently negative for risk assets, but it removes the catalyst of a rate cut from the near-term playbook. Key data releases in the coming days — ISM Manufacturing PMI on November 1, Services PMI on November 3, and CPI on November 9 — could shift that calculus. Any upside surprise in inflation data would weaken the case for policy easing and apply additional pressure on ETH.
Bearish Scenario — Continuation to $2,026
If ETH holds below $2,385.23 while exchange balances remain elevated above 6.03 million ETH, the pattern’s measured projection to $2,026.94 — and the broader $2,000 target — remains the primary directional read. A sustained close below $2,310.73 accelerates that timeline.
Bullish Scenario — Reclaim of $2,385
A confirmed daily close back above $2,385.23, accompanied by a reversal in exchange balances (ETH moving off exchanges) and stabilization in whale holdings above 26.05 million ETH, would invalidate the immediate bearish structure and open a retest of $2,469.78.
Three independent signals — a $100 billion volume fakeout at $2,400, 160,000 ETH in whale distribution worth $348 million, and 100,000 ETH in rising exchange supply worth $240 million — have converged simultaneously with a confirmed daily chart breakdown below $2,385.23. ETF outflows totaling $276.4 million over five days confirm the institutional read. Martinez’s downside target of $2,026.94 on the chart and the broader $2,000 level are the levels the market is now pricing toward. Watch $2,385.23 — a sustained daily reclaim there is the only near-term data point that disrupts the current bearish structure.
Disclaimer: The views and analysis presented in this article are for informational purposes only and reflect the author’s perspective, not financial advice. Technical patterns and indicators discussed are subject to market volatility and may or may not yield the anticipated results. Investors are advised to exercise caution, conduct independent research, and make decisions aligned with their individual risk tolerance.
3
2
1.4k
Log in to explore more content
Join global crypto users on Binance Square
⚡️ Get latest and useful information about crypto.
💬 Trusted by the world’s largest crypto exchange.
👍 Discover real insights from verified creators.
Email / Phone number
Trending Topics
JobsReportRaisesHikeOdds
176,363 views
1,527 Discussing
TradFi News | US Adds 165,000 Jobs in October, More Than Double the 65,000 Forecast, as Unemployment Falls to 4.1%
Binance News
·27 Likes
·20.5k views
CPITestsDecemberRateOutlook
10 views
25 Discussing
BitcoinRebounds$75KAsChipsLead
15,579 views
184 Discussing