
Zerionix
407 Posts

Zerionix
Report
Block User
Crypto Researcher • Market Structure • Data > Hype • Daily updates → NFA
0 Following
11 Followers
65 Liked
Posts
·
--
Most people think liquidity is a number. You open a DEX, see a pool with millions of dollars in TVL, and naturally assume there is plenty of liquidity available for your trade. But that number doesn't tell you where the liquidity is, how deep it is at the price you need, or whether another pool somewhere else could give you better execution. That's the problem with fragmented liquidity. The same asset can exist across multiple pools and DEXs, each with different reserves and pricing. A trade that looks expensive on one platform might execute better somewhere else, not because the token suddenly became cheaper, but because you're interacting with a different piece of the market. This is where routing becomes important. Instead of making the user search through every pool manually, an aggregator can compare available liquidity sources and look for an executable route. On TON, this is where Omniston comes in, connecting liquidity across sources and handling routes that can span multiple pools. What I find interesting is how invisible this entire process is to the user. You enter the tokens, type the amount, and expect the interface to simply tell you the best outcome. But underneath that one quote is a much larger question: how much of the ecosystem's liquidity can your trade actually reach? That changes how I think about liquidity. It's not only about how much money is sitting inside DeFi. It's about how efficiently that liquidity can be found and used. Try a swap on STON.fi → https://app.ston.fi/swap $HYPE #BTC Price Analysis# #Altcoin Season#
Most people think liquidity is a number. You open a DEX, see a pool with millions of dollars in TVL, and naturally assume there is plenty of liquidity available for your trade. But that number doesn't tell you where the liquidity is, how deep it is at the price you need, or whether another pool somewhere else could give you better execution. That's the problem with fragmented liquidity. The same asset can exist across multiple pools and DEXs, each with different reserves and pricing. A trade that looks expensive on one platform might execute better somewhere else, not because the token suddenly became cheaper, but because you're interacting with a different piece of the market. This is where routing becomes important. Instead of making the user search through every pool manually, an aggregator can compare available liquidity sources and look for an executable route. On TON, this is where Omniston comes in, connecting liquidity across sources and handling routes that can span multiple pools. What I find interesting is how invisible this entire process is to the user. You enter the tokens, type the amount, and expect the interface to simply tell you the best outcome. But underneath that one quote is a much larger question: how much of the ecosystem's liquidity can your trade actually reach? That changes how I think about liquidity. It's not only about how much money is sitting inside DeFi. It's about how efficiently that liquidity can be found and used. Try a swap on STON.fi → https://app.ston.fi/swap $HYPE #BTC Price Analysis# #Altcoin Season#

22
·
--
Bitcoin Reserves on Binance Have Reached a Dangerous Level
Bitcoin is showing a strong recovery, but recent data suggests that profit taking may already be starting.
Binance’s total BTC reserve stands at 691,845 BTC, which is a medium term warning signal. The reserve has generally been rising since May, creating a cautious picture from the supply side. While BTC rallied in late August and early September, Binance’s reserves remained elevated. This divergence suggests that even if the rally continues, the risk of profit taking or a sharp pullback may be increasing.
Binance cross exchange transfer volume has also jumped to 284.76 BTC, up 138% daily. If transfer flows continue to increase while price weakens around a critical area, market volatility could rise. Previous major turquoise spikes on the chart have, at times, coincided with sharp price movements.
From a valuation perspective, however, Bitcoin is not showing an overheating signal yet.
NVT Golden Cross: 0.73 Historically, deeply negative NVT Golden Cross readings have appeared near market bottoms, while strong positive spikes have indicated greater overheating. At 0.73, the indicator is neither extremely low nor excessively high. It remains in a neutral to positive zone, with no clear overvaluation warning.
This does not mean BTC must rise from $77K. It simply suggests that the current pullback is not yet confirmed as a major valuation driven top by NVT.
The broader trend from the June lows remains upward. NVT is not overheated, and Binance’s reserve has seen a small decline over the past day.
However, Binance’s monthly reserve trend has risen significantly and remains elevated. BTC was rejected from the $82K–$83K area, while cross-exchange flows are picking up again.
For now, Bitcoin appears to be at a decision point around $77K. If short term selling pressure strengthens, the $72K–$74K zone could become the next target. #BTC Price Analysis# $BTC
Bitcoin Reserves on Binance Have Reached a Dangerous Level
Bitcoin is showing a strong recovery, but recent data suggests that profit taking may already be starting.
Binance’s total BTC reserve stands at 691,845 BTC, which is a medium term warning signal. The reserve has generally been rising since May, creating a cautious picture from the supply side. While BTC rallied in late August and early September, Binance’s reserves remained elevated. This divergence suggests that even if the rally continues, the risk of profit taking or a sharp pullback may be increasing.
Binance cross exchange transfer volume has also jumped to 284.76 BTC, up 138% daily. If transfer flows continue to increase while price weakens around a critical area, market volatility could rise. Previous major turquoise spikes on the chart have, at times, coincided with sharp price movements.
From a valuation perspective, however, Bitcoin is not showing an overheating signal yet.
NVT Golden Cross: 0.73 Historically, deeply negative NVT Golden Cross readings have appeared near market bottoms, while strong positive spikes have indicated greater overheating. At 0.73, the indicator is neither extremely low nor excessively high. It remains in a neutral to positive zone, with no clear overvaluation warning.
This does not mean BTC must rise from $77K. It simply suggests that the current pullback is not yet confirmed as a major valuation driven top by NVT.
The broader trend from the June lows remains upward. NVT is not overheated, and Binance’s reserve has seen a small decline over the past day.
However, Binance’s monthly reserve trend has risen significantly and remains elevated. BTC was rejected from the $82K–$83K area, while cross-exchange flows are picking up again.
For now, Bitcoin appears to be at a decision point around $77K. If short term selling pressure strengthens, the $72K–$74K zone could become the next target. #BTC Price Analysis# $BTC
Bitcoin is showing a strong recovery, but recent data suggests that profit taking may already be starting.
Binance’s total BTC reserve stands at 691,845 BTC, which is a medium term warning signal. The reserve has generally been rising since May, creating a cautious picture from the supply side. While BTC rallied in late August and early September, Binance’s reserves remained elevated. This divergence suggests that even if the rally continues, the risk of profit taking or a sharp pullback may be increasing.
Binance cross exchange transfer volume has also jumped to 284.76 BTC, up 138% daily. If transfer flows continue to increase while price weakens around a critical area, market volatility could rise. Previous major turquoise spikes on the chart have, at times, coincided with sharp price movements.
From a valuation perspective, however, Bitcoin is not showing an overheating signal yet.
NVT Golden Cross: 0.73 Historically, deeply negative NVT Golden Cross readings have appeared near market bottoms, while strong positive spikes have indicated greater overheating. At 0.73, the indicator is neither extremely low nor excessively high. It remains in a neutral to positive zone, with no clear overvaluation warning.
This does not mean BTC must rise from $77K. It simply suggests that the current pullback is not yet confirmed as a major valuation driven top by NVT.
The broader trend from the June lows remains upward. NVT is not overheated, and Binance’s reserve has seen a small decline over the past day.
However, Binance’s monthly reserve trend has risen significantly and remains elevated. BTC was rejected from the $82K–$83K area, while cross-exchange flows are picking up again.
For now, Bitcoin appears to be at a decision point around $77K. If short term selling pressure strengthens, the $72K–$74K zone could become the next target. #BTC Price Analysis# $BTC

27
·
--
You’ve probably seen Stoncat around the @ston_fi ecosystem as the mascot behind the memes, stickers and visuals. But there’s actually a whole system behind the character. Stoncat is an evolving NFT identity on TON, powered by GEMSTON. You start by minting a base Stoncat, then feed it GEMSTON to roll Purrks, which are the visual traits that make your cat unique. These can affect things like its body, face, clothes, background, hair, glasses and other accessories. You can then equip the traits you like through Dress up. And this is where it gets interesting. There are two different things to understand: Stage and Rarity. Your Stage depends on the total GEMSTON spent on that Stoncat. It progresses from Stray to Trained, Elite, Cosmic and eventually Mythic, with higher stages unlocking access to rarer Purrks. Your Rarity, however, comes from what your Stoncat is actually wearing. Equip better Purrks and your rarity score can increase through ranks like Paper, Hodl, Whale, Genesis, Diamond and Satoshi. So feeding GEMSTON doesn't simply mean “spend more = guaranteed rare NFT.” Each feed gives you one random Purrk, and higher spending can improve the odds and expand which traits can appear, but nothing guarantees a particular look or rarity. That makes Stoncat less like a static NFT collection and more like a little identity system you gradually build. 👉 Meet your Stoncat: https://stoncat.com/ #BTC Price Analysis# #Macro Insights# $BTC $ETH
You’ve probably seen Stoncat around the @ston_fi ecosystem as the mascot behind the memes, stickers and visuals. But there’s actually a whole system behind the character. Stoncat is an evolving NFT identity on TON, powered by GEMSTON. You start by minting a base Stoncat, then feed it GEMSTON to roll Purrks, which are the visual traits that make your cat unique. These can affect things like its body, face, clothes, background, hair, glasses and other accessories. You can then equip the traits you like through Dress up. And this is where it gets interesting. There are two different things to understand: Stage and Rarity. Your Stage depends on the total GEMSTON spent on that Stoncat. It progresses from Stray to Trained, Elite, Cosmic and eventually Mythic, with higher stages unlocking access to rarer Purrks. Your Rarity, however, comes from what your Stoncat is actually wearing. Equip better Purrks and your rarity score can increase through ranks like Paper, Hodl, Whale, Genesis, Diamond and Satoshi. So feeding GEMSTON doesn't simply mean “spend more = guaranteed rare NFT.” Each feed gives you one random Purrk, and higher spending can improve the odds and expand which traits can appear, but nothing guarantees a particular look or rarity. That makes Stoncat less like a static NFT collection and more like a little identity system you gradually build. 👉 Meet your Stoncat: https://stoncat.com/ #BTC Price Analysis# #Macro Insights# $BTC $ETH

37
·
--
Trump is now proposing a $5,000 “dividend” for U.S. adults if Republicans retain control of Congress, a plan that could cost more than $1T and would still need congressional approval. The 2020 comparison is interesting. When the first $1,200 stimulus checks went out, researchers found a measurable increase in Bitcoin buying. But the effect wasn't nearly as simple as “government sends money, Bitcoin goes up.” The study estimated stimulus payments increased Bitcoin trading volume by about 3.8% and Bitcoin’s price by roughly 0.6% during the disbursement period. So I wouldn't assume $1T automatically sends BTC into another 2020 style run. What matters is where that money actually goes. If households spend most of it, the impact could show up first in the broader economy. If a meaningful portion flows into stocks, crypto and other risk assets, then liquidity conditions could become much more interesting. But there’s a major counterargument. The U.S. is already dealing with inflation, rising debt and elevated Treasury yields. A huge fiscal injection could push inflation expectations higher and potentially force the Fed to stay tighter for longer. Personally, I think the BTC narrative is less about the headline $1T and more about the chain reaction. More disposable cash → more risk appetite → more liquidity → potentially more demand for BTC. But if inflation responds first, the Fed could easily kill that party. So I'm watching the liquidity story, not just the stimulus headline. Could $1T become the next major catalyst for $BTC ? Or could it actually create the conditions for another macro headache? #BTC Price Analysis# #Altcoin Season# #Meme Alpha#
Trump is now proposing a $5,000 “dividend” for U.S. adults if Republicans retain control of Congress, a plan that could cost more than $1T and would still need congressional approval. The 2020 comparison is interesting. When the first $1,200 stimulus checks went out, researchers found a measurable increase in Bitcoin buying. But the effect wasn't nearly as simple as “government sends money, Bitcoin goes up.” The study estimated stimulus payments increased Bitcoin trading volume by about 3.8% and Bitcoin’s price by roughly 0.6% during the disbursement period. So I wouldn't assume $1T automatically sends BTC into another 2020 style run. What matters is where that money actually goes. If households spend most of it, the impact could show up first in the broader economy. If a meaningful portion flows into stocks, crypto and other risk assets, then liquidity conditions could become much more interesting. But there’s a major counterargument. The U.S. is already dealing with inflation, rising debt and elevated Treasury yields. A huge fiscal injection could push inflation expectations higher and potentially force the Fed to stay tighter for longer. Personally, I think the BTC narrative is less about the headline $1T and more about the chain reaction. More disposable cash → more risk appetite → more liquidity → potentially more demand for BTC. But if inflation responds first, the Fed could easily kill that party. So I'm watching the liquidity story, not just the stimulus headline. Could $1T become the next major catalyst for $BTC ? Or could it actually create the conditions for another macro headache? #BTC Price Analysis# #Altcoin Season# #Meme Alpha#

50
·
--
Bitcoin is down 2.1% today, trading around $77K.
And yet, capital is still flowing into the Bitcoin ecosystem.
A Crypto Briefing report highlights more than $21B raised by Bitcoin focused companies during this bear market.
Price is struggling, sentiment is fragile, and BTC is still far below its cycle high. But investors are still willing to put billions behind companies building around Bitcoin.
Capital raising doesn't automatically mean those investors are bullish on BTC's short term price. Venture capital can have a much longer time horizon, and some of that money is going into infrastructure, treasury strategies and businesses that can survive regardless of where BTC trades next month.
A bear market is usually where weak narratives lose funding. If serious capital keeps backing Bitcoin related infrastructure while the asset itself is getting repriced lower, the market may be separating Bitcoin's long term adoption story from its short term price action.
But there is a catch.
$21B raised is not the same thing as $21B of immediate BTC buying pressure.
If that capital isn't ultimately creating demand for Bitcoin, the number sounds much more bullish than it actually is.
BTC is sitting around $77K after another sharp intraday decline.
So I'm watching two things.
Does fresh capital keep entering the Bitcoin ecosystem?
And more importantly, does that capital eventually translate into real BTC demand?
Because if the money keeps building while price is still weak, this bear market could be quietly laying the foundation for the next move.
The question is whether the market sees it before the price does.
$BTC #BTC Price Analysis# #Meme Alpha# #
Bitcoin is down 2.1% today, trading around $77K.
And yet, capital is still flowing into the Bitcoin ecosystem.
A Crypto Briefing report highlights more than $21B raised by Bitcoin focused companies during this bear market.
Price is struggling, sentiment is fragile, and BTC is still far below its cycle high. But investors are still willing to put billions behind companies building around Bitcoin.
Capital raising doesn't automatically mean those investors are bullish on BTC's short term price. Venture capital can have a much longer time horizon, and some of that money is going into infrastructure, treasury strategies and businesses that can survive regardless of where BTC trades next month.
A bear market is usually where weak narratives lose funding. If serious capital keeps backing Bitcoin related infrastructure while the asset itself is getting repriced lower, the market may be separating Bitcoin's long term adoption story from its short term price action.
But there is a catch.
$21B raised is not the same thing as $21B of immediate BTC buying pressure.
If that capital isn't ultimately creating demand for Bitcoin, the number sounds much more bullish than it actually is.
BTC is sitting around $77K after another sharp intraday decline.
So I'm watching two things.
Does fresh capital keep entering the Bitcoin ecosystem?
And more importantly, does that capital eventually translate into real BTC demand?
Because if the money keeps building while price is still weak, this bear market could be quietly laying the foundation for the next move.
The question is whether the market sees it before the price does.
$BTC #BTC Price Analysis# #Meme Alpha# #
And yet, capital is still flowing into the Bitcoin ecosystem.
A Crypto Briefing report highlights more than $21B raised by Bitcoin focused companies during this bear market.
Price is struggling, sentiment is fragile, and BTC is still far below its cycle high. But investors are still willing to put billions behind companies building around Bitcoin.
Capital raising doesn't automatically mean those investors are bullish on BTC's short term price. Venture capital can have a much longer time horizon, and some of that money is going into infrastructure, treasury strategies and businesses that can survive regardless of where BTC trades next month.
A bear market is usually where weak narratives lose funding. If serious capital keeps backing Bitcoin related infrastructure while the asset itself is getting repriced lower, the market may be separating Bitcoin's long term adoption story from its short term price action.
But there is a catch.
$21B raised is not the same thing as $21B of immediate BTC buying pressure.
If that capital isn't ultimately creating demand for Bitcoin, the number sounds much more bullish than it actually is.
BTC is sitting around $77K after another sharp intraday decline.
So I'm watching two things.
Does fresh capital keep entering the Bitcoin ecosystem?
And more importantly, does that capital eventually translate into real BTC demand?
Because if the money keeps building while price is still weak, this bear market could be quietly laying the foundation for the next move.
The question is whether the market sees it before the price does.
$BTC #BTC Price Analysis# #Meme Alpha# #

69
·
--
On August 26, TON processed around 9 million transactions, roughly double its typical 3–4 million daily load.
The trigger was a massive wave of DOGS activity, with millions of users generating transactions and cross-shard messages.
Then something interesting happened.
STONfi saw 19,000 swaps in the first hour after the DOGS liquidity pool launched.
Only 3,000 were processed.
The rest entered queues, with some users facing delays of up to three hours. Around half of those delayed swaps were eventually rejected because the execution could no longer satisfy the expected price, with funds refunded.
This wasn't simply a “DEX problem.”
It exposed how tightly DeFi execution is connected to blockchain architecture.
TON's protection mechanism prioritizes simpler transactions, while transactions containing multiple outgoing messages can be queued. Cross-shard activity adds another layer of pressure.
So when the network became congested, complex DEX transactions were naturally exposed.
STONfi eventually paused swaps for roughly 18 hours, while keeping liquidity operations active, until TON stabilized.
The interesting part is what comes next.
@ston_fi says it plans to:
→ Add transaction deadlines
→ Reduce messages in swap/refund transactions from 8 to 5
→ Deploy 16–64 additional routers across shards
→ Eventually move toward an architecture without central router contracts
That last part is particularly interesting.
Because resilience isn't just about surviving congestion.
It's about designing the DEX so that congestion in one part of the network doesn't become a problem everywhere.
The real lesson from this incident?
DEX infrastructure doesn't exist above the blockchain.
It inherits the blockchain's architecture, queues, messaging model and failure modes.
And when activity suddenly explodes, those assumptions get tested very quickly.
👉 Read the full Article:→https://blog.ston.fi/links/transaction-delays-on-ton/
👉 Explore →https://app.ston.fi/
$SOL
On August 26, TON processed around 9 million transactions, roughly double its typical 3–4 million daily load.
The trigger was a massive wave of DOGS activity, with millions of users generating transactions and cross-shard messages.
Then something interesting happened.
STONfi saw 19,000 swaps in the first hour after the DOGS liquidity pool launched.
Only 3,000 were processed.
The rest entered queues, with some users facing delays of up to three hours. Around half of those delayed swaps were eventually rejected because the execution could no longer satisfy the expected price, with funds refunded.
This wasn't simply a “DEX problem.”
It exposed how tightly DeFi execution is connected to blockchain architecture.
TON's protection mechanism prioritizes simpler transactions, while transactions containing multiple outgoing messages can be queued. Cross-shard activity adds another layer of pressure.
So when the network became congested, complex DEX transactions were naturally exposed.
STONfi eventually paused swaps for roughly 18 hours, while keeping liquidity operations active, until TON stabilized.
The interesting part is what comes next.
@ston_fi says it plans to:
→ Add transaction deadlines
→ Reduce messages in swap/refund transactions from 8 to 5
→ Deploy 16–64 additional routers across shards
→ Eventually move toward an architecture without central router contracts
That last part is particularly interesting.
Because resilience isn't just about surviving congestion.
It's about designing the DEX so that congestion in one part of the network doesn't become a problem everywhere.
The real lesson from this incident?
DEX infrastructure doesn't exist above the blockchain.
It inherits the blockchain's architecture, queues, messaging model and failure modes.
And when activity suddenly explodes, those assumptions get tested very quickly.
👉 Read the full Article:→https://blog.ston.fi/links/transaction-delays-on-ton/
👉 Explore →https://app.ston.fi/
$SOL
The trigger was a massive wave of DOGS activity, with millions of users generating transactions and cross-shard messages.
Then something interesting happened.
STONfi saw 19,000 swaps in the first hour after the DOGS liquidity pool launched.
Only 3,000 were processed.
The rest entered queues, with some users facing delays of up to three hours. Around half of those delayed swaps were eventually rejected because the execution could no longer satisfy the expected price, with funds refunded.
This wasn't simply a “DEX problem.”
It exposed how tightly DeFi execution is connected to blockchain architecture.
TON's protection mechanism prioritizes simpler transactions, while transactions containing multiple outgoing messages can be queued. Cross-shard activity adds another layer of pressure.
So when the network became congested, complex DEX transactions were naturally exposed.
STONfi eventually paused swaps for roughly 18 hours, while keeping liquidity operations active, until TON stabilized.
The interesting part is what comes next.
@ston_fi says it plans to:
→ Add transaction deadlines
→ Reduce messages in swap/refund transactions from 8 to 5
→ Deploy 16–64 additional routers across shards
→ Eventually move toward an architecture without central router contracts
That last part is particularly interesting.
Because resilience isn't just about surviving congestion.
It's about designing the DEX so that congestion in one part of the network doesn't become a problem everywhere.
The real lesson from this incident?
DEX infrastructure doesn't exist above the blockchain.
It inherits the blockchain's architecture, queues, messaging model and failure modes.
And when activity suddenly explodes, those assumptions get tested very quickly.
👉 Read the full Article:→https://blog.ston.fi/links/transaction-delays-on-ton/
👉 Explore →https://app.ston.fi/
$SOL

24
·
--
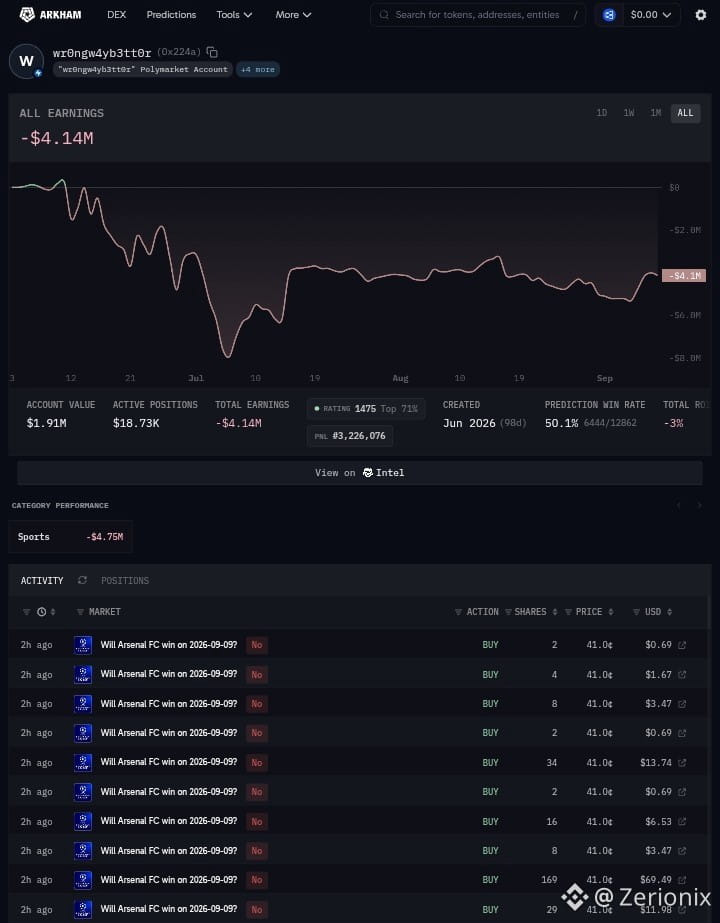
A 50% win rate just made me rethink what “winning” on Polymarket actually looks like. 👀
Arkham’s snapshot of one Polymarket wallet shows about $1.91M in account value, $18.73K in active positions and a reported $3.23M PNL.
But here’s the part that caught my attention.
The wallet’s prediction win rate is only 50.1%.
That’s basically a coin flip on the surface. Yet the numbers suggest there’s much more going on than simply being right more often than everyone else.
Prediction markets reward pricing, position sizing and knowing when to enter or exit. You can be wrong on half your predictions and still come out ahead if your winners are large enough and your losing positions are controlled.
And this is where I think people misunderstand Polymarket.
It isn’t necessarily about predicting everything correctly. It’s about finding situations where the market price looks wrong, then managing the position when reality starts moving toward your thesis.
There’s also a big warning here.
The screenshot shows negative total earnings of about $4.14M and negative ROI, so I wouldn’t blindly label this wallet a “genius trader” from the PNL figure alone. Arkham’s metrics can reflect different accounting periods and realized versus unrealized performance.
Personally, what interests me more is the behavior.
A wallet can survive a 50% hit rate if the edge is in the pricing and risk management.
So the real question isn’t “How often are you right?”
It’s “How much do you make when you’re right, and how much do you lose when you’re wrong?”
$BTC #BTC Price Analysis# $ETH
A 50% win rate just made me rethink what “winning” on Polymarket actually looks like. 👀
Arkham’s snapshot of one Polymarket wallet shows about $1.91M in account value, $18.73K in active positions and a reported $3.23M PNL.
But here’s the part that caught my attention.
The wallet’s prediction win rate is only 50.1%.
That’s basically a coin flip on the surface. Yet the numbers suggest there’s much more going on than simply being right more often than everyone else.
Prediction markets reward pricing, position sizing and knowing when to enter or exit. You can be wrong on half your predictions and still come out ahead if your winners are large enough and your losing positions are controlled.
And this is where I think people misunderstand Polymarket.
It isn’t necessarily about predicting everything correctly. It’s about finding situations where the market price looks wrong, then managing the position when reality starts moving toward your thesis.
There’s also a big warning here.
The screenshot shows negative total earnings of about $4.14M and negative ROI, so I wouldn’t blindly label this wallet a “genius trader” from the PNL figure alone. Arkham’s metrics can reflect different accounting periods and realized versus unrealized performance.
Personally, what interests me more is the behavior.
A wallet can survive a 50% hit rate if the edge is in the pricing and risk management.
So the real question isn’t “How often are you right?”
It’s “How much do you make when you’re right, and how much do you lose when you’re wrong?”
$BTC #BTC Price Analysis# $ETH
Arkham’s snapshot of one Polymarket wallet shows about $1.91M in account value, $18.73K in active positions and a reported $3.23M PNL.
But here’s the part that caught my attention.
The wallet’s prediction win rate is only 50.1%.
That’s basically a coin flip on the surface. Yet the numbers suggest there’s much more going on than simply being right more often than everyone else.
Prediction markets reward pricing, position sizing and knowing when to enter or exit. You can be wrong on half your predictions and still come out ahead if your winners are large enough and your losing positions are controlled.
And this is where I think people misunderstand Polymarket.
It isn’t necessarily about predicting everything correctly. It’s about finding situations where the market price looks wrong, then managing the position when reality starts moving toward your thesis.
There’s also a big warning here.
The screenshot shows negative total earnings of about $4.14M and negative ROI, so I wouldn’t blindly label this wallet a “genius trader” from the PNL figure alone. Arkham’s metrics can reflect different accounting periods and realized versus unrealized performance.
Personally, what interests me more is the behavior.
A wallet can survive a 50% hit rate if the edge is in the pricing and risk management.
So the real question isn’t “How often are you right?”
It’s “How much do you make when you’re right, and how much do you lose when you’re wrong?”
$BTC #BTC Price Analysis# $ETH
27
·
--
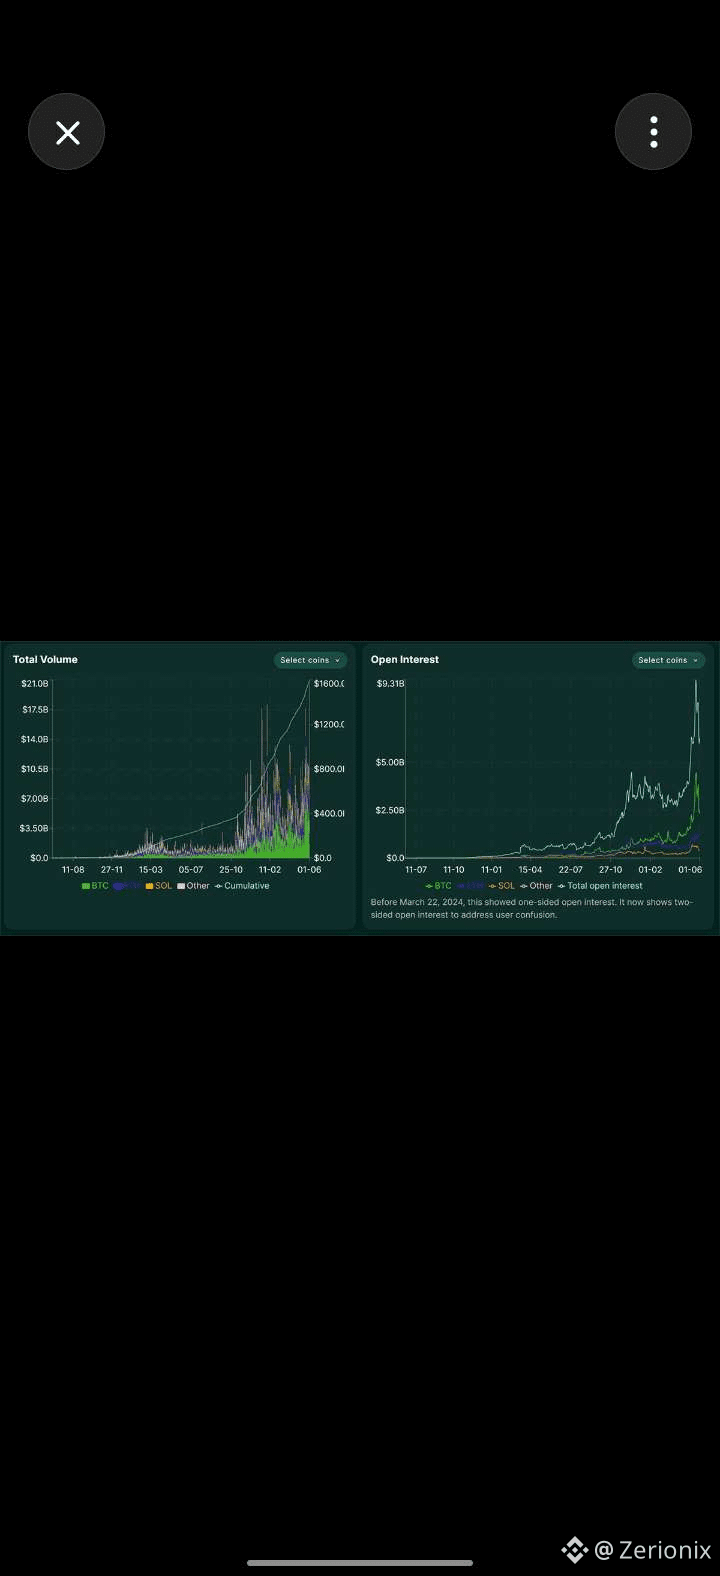
$14.3B in open interest on Hyperliquid.
That number is impressive. What makes it more interesting is where the growth is coming from.
Hyperliquid’s total OI is now within 3% of the level before the October 2025 liquidation event that wiped out roughly 56% of its OI in a single day.
But this time, the composition looks different.
HIP 3 helped drive the first leg of the recovery, growing to more than 34% of total OI in August. Yet over the past month, total OI added $3.57B while HIP 3 OI actually fell by $119M.
That means the recent expansion is increasingly coming from Hyperliquid’s core crypto perpetuals.
Personally, I think this matters more for HYPE than simply celebrating a new OI record.
Around 97% of fees from those core crypto perps flow into HYPE buybacks. So if crypto perp activity keeps expanding, there is a much more direct link between trading demand and token demand.
HYPE is already around $88 and at an all time high.
But this is where I get cautious.
Record OI also means record amounts of leverage sitting in the system. We have already seen what happens when Hyperliquid gets too crowded.
The bullish case is strong if OI keeps growing alongside real volume and fee generation.
The bearish case is simple too. If leverage outruns genuine demand, another violent flush can erase the narrative very quickly.
So I’m less interested in the $14.3B headline.
I want to see whether Hyperliquid can grow this time without rebuilding the same leverage imbalance that caused the last collapse.
That’s the real test.
$HYPE #BTC Price Analysis# #HYPE
$14.3B in open interest on Hyperliquid.
That number is impressive. What makes it more interesting is where the growth is coming from.
Hyperliquid’s total OI is now within 3% of the level before the October 2025 liquidation event that wiped out roughly 56% of its OI in a single day.
But this time, the composition looks different.
HIP 3 helped drive the first leg of the recovery, growing to more than 34% of total OI in August. Yet over the past month, total OI added $3.57B while HIP 3 OI actually fell by $119M.
That means the recent expansion is increasingly coming from Hyperliquid’s core crypto perpetuals.
Personally, I think this matters more for HYPE than simply celebrating a new OI record.
Around 97% of fees from those core crypto perps flow into HYPE buybacks. So if crypto perp activity keeps expanding, there is a much more direct link between trading demand and token demand.
HYPE is already around $88 and at an all time high.
But this is where I get cautious.
Record OI also means record amounts of leverage sitting in the system. We have already seen what happens when Hyperliquid gets too crowded.
The bullish case is strong if OI keeps growing alongside real volume and fee generation.
The bearish case is simple too. If leverage outruns genuine demand, another violent flush can erase the narrative very quickly.
So I’m less interested in the $14.3B headline.
I want to see whether Hyperliquid can grow this time without rebuilding the same leverage imbalance that caused the last collapse.
That’s the real test.
$HYPE #BTC Price Analysis# #HYPE
That number is impressive. What makes it more interesting is where the growth is coming from.
Hyperliquid’s total OI is now within 3% of the level before the October 2025 liquidation event that wiped out roughly 56% of its OI in a single day.
But this time, the composition looks different.
HIP 3 helped drive the first leg of the recovery, growing to more than 34% of total OI in August. Yet over the past month, total OI added $3.57B while HIP 3 OI actually fell by $119M.
That means the recent expansion is increasingly coming from Hyperliquid’s core crypto perpetuals.
Personally, I think this matters more for HYPE than simply celebrating a new OI record.
Around 97% of fees from those core crypto perps flow into HYPE buybacks. So if crypto perp activity keeps expanding, there is a much more direct link between trading demand and token demand.
HYPE is already around $88 and at an all time high.
But this is where I get cautious.
Record OI also means record amounts of leverage sitting in the system. We have already seen what happens when Hyperliquid gets too crowded.
The bullish case is strong if OI keeps growing alongside real volume and fee generation.
The bearish case is simple too. If leverage outruns genuine demand, another violent flush can erase the narrative very quickly.
So I’m less interested in the $14.3B headline.
I want to see whether Hyperliquid can grow this time without rebuilding the same leverage imbalance that caused the last collapse.
That’s the real test.
$HYPE #BTC Price Analysis# #HYPE

50
·
--
Robinhood Chain Just Hit $6M in Daily Fees
Robinhood Chain just recorded a $6M daily fee record, with weekly fees jumping from $1.4M to roughly $25M, the DEX volume also doubled to $12.4B.
Sounds bullish.
But here's the part I find more interesting:
Daily active accounts actually fell. So this isn't simply “more users = more activity.”
A huge chunk of the growth is being driven by Pons, whose token-launch activity has turned the chain into a serious fee machine.
That makes the numbers impressive… but also fragile.
If speculative trading cools down, does the revenue stay?
That's the real test for Robinhood Chain.
$PONS #ROBINHOOD
Robinhood Chain Just Hit $6M in Daily Fees
Robinhood Chain just recorded a $6M daily fee record, with weekly fees jumping from $1.4M to roughly $25M, the DEX volume also doubled to $12.4B.
Sounds bullish.
But here's the part I find more interesting:
Daily active accounts actually fell. So this isn't simply “more users = more activity.”
A huge chunk of the growth is being driven by Pons, whose token-launch activity has turned the chain into a serious fee machine.
That makes the numbers impressive… but also fragile.
If speculative trading cools down, does the revenue stay?
That's the real test for Robinhood Chain.
$PONS #ROBINHOOD
Robinhood Chain just recorded a $6M daily fee record, with weekly fees jumping from $1.4M to roughly $25M, the DEX volume also doubled to $12.4B.
Sounds bullish.
But here's the part I find more interesting:
Daily active accounts actually fell. So this isn't simply “more users = more activity.”
A huge chunk of the growth is being driven by Pons, whose token-launch activity has turned the chain into a serious fee machine.
That makes the numbers impressive… but also fragile.
If speculative trading cools down, does the revenue stay?
That's the real test for Robinhood Chain.
$PONS #ROBINHOOD


49
·
--
Can Pi Actually Recover?
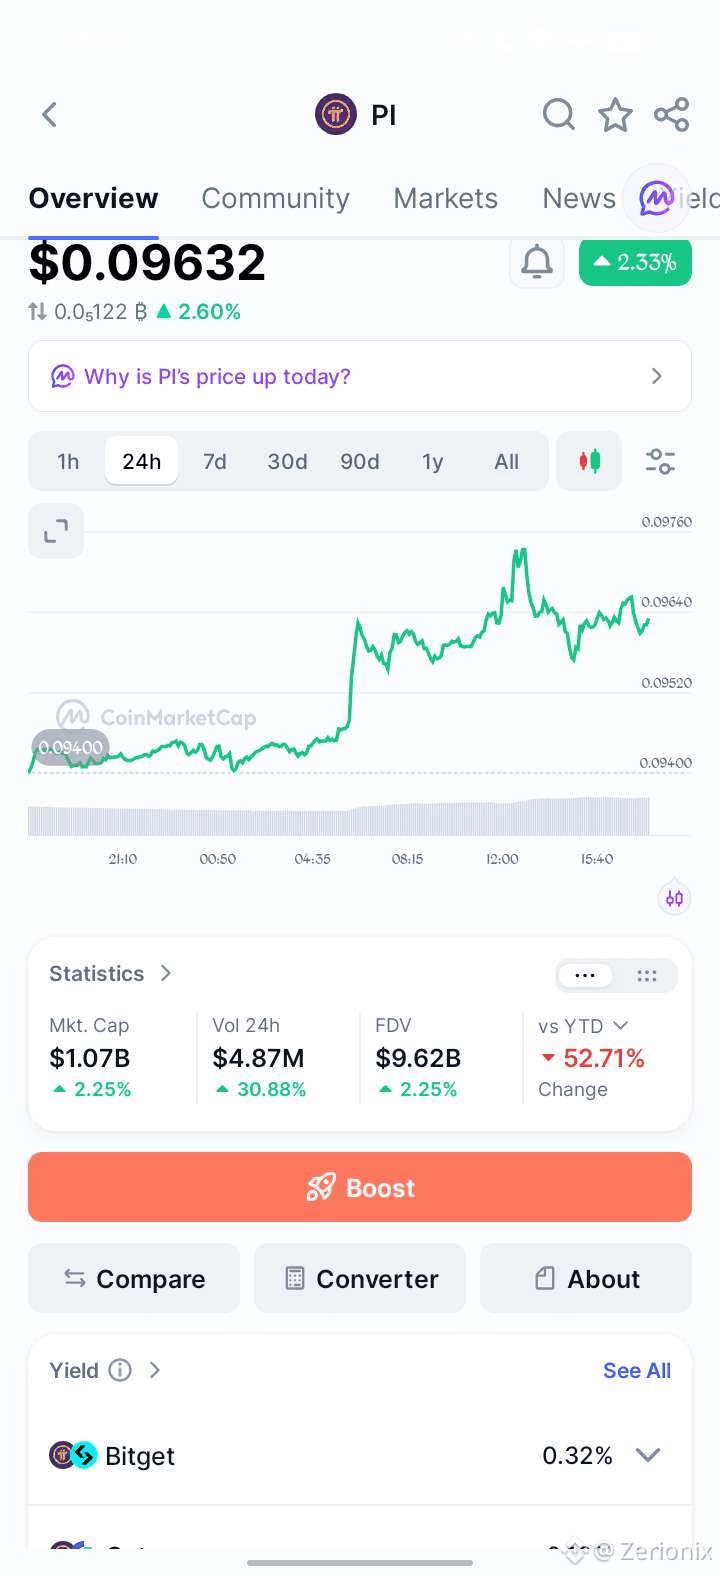
Pi is showing signs of life, trading around $0.096 and up roughly 2% today.
But I’m not ready to call this a recovery yet.
PI is still down about 97% from its 2025 peak, while continued token unlocks keep adding supply.
The bullish side? Protocol 27 is approaching, bringing AMM liquidity and expanded smart-contract functionality.
The problem is simple:
More utility means nothing if demand can't absorb the supply.
For me, the real confirmation isn't another 5% green candle.
It's sustained volume, stronger ecosystem usage and Pi breaking out of its long-term downtrend.
Can Pi actually recover?
Or is this just another bounce before the sellers return?
$PI #BTC Price Analysis# #Meme Alpha# #BNBChain#
Can Pi Actually Recover?
Pi is showing signs of life, trading around $0.096 and up roughly 2% today.
But I’m not ready to call this a recovery yet.
PI is still down about 97% from its 2025 peak, while continued token unlocks keep adding supply.
The bullish side? Protocol 27 is approaching, bringing AMM liquidity and expanded smart-contract functionality.
The problem is simple:
More utility means nothing if demand can't absorb the supply.
For me, the real confirmation isn't another 5% green candle.
It's sustained volume, stronger ecosystem usage and Pi breaking out of its long-term downtrend.
Can Pi actually recover?
Or is this just another bounce before the sellers return?
$PI #BTC Price Analysis# #Meme Alpha# #BNBChain#
Pi is showing signs of life, trading around $0.096 and up roughly 2% today.
But I’m not ready to call this a recovery yet.
PI is still down about 97% from its 2025 peak, while continued token unlocks keep adding supply.
The bullish side? Protocol 27 is approaching, bringing AMM liquidity and expanded smart-contract functionality.
The problem is simple:
More utility means nothing if demand can't absorb the supply.
For me, the real confirmation isn't another 5% green candle.
It's sustained volume, stronger ecosystem usage and Pi breaking out of its long-term downtrend.
Can Pi actually recover?
Or is this just another bounce before the sellers return?
$PI #BTC Price Analysis# #Meme Alpha# #BNBChain#
10
·
--
Solana’s RWA story is getting harder to ignore.
August alone brought tokenized money-market funds, equities, silver, high-yield credit, ETFs, AI agents… even a dinosaur fossil.
And tokenized equity supply hit a weekly ATH near $518M.
The bigger signal for me is the diversification.
This isn't just tokenized stocks anymore.
If institutions keep bringing different asset classes onchain, Solana could become more than a trading network — it could become part of the infrastructure for tokenized markets.
Now I’m watching whether this growth actually translates into deeper liquidity and real onchain usage. 🧐
$SOL #BTC Price Analysis# #Altcoin Season#
Solana’s RWA story is getting harder to ignore.
August alone brought tokenized money-market funds, equities, silver, high-yield credit, ETFs, AI agents… even a dinosaur fossil.
And tokenized equity supply hit a weekly ATH near $518M.
The bigger signal for me is the diversification.
This isn't just tokenized stocks anymore.
If institutions keep bringing different asset classes onchain, Solana could become more than a trading network — it could become part of the infrastructure for tokenized markets.
Now I’m watching whether this growth actually translates into deeper liquidity and real onchain usage. 🧐
$SOL #BTC Price Analysis# #Altcoin Season#
August alone brought tokenized money-market funds, equities, silver, high-yield credit, ETFs, AI agents… even a dinosaur fossil.
And tokenized equity supply hit a weekly ATH near $518M.
The bigger signal for me is the diversification.
This isn't just tokenized stocks anymore.
If institutions keep bringing different asset classes onchain, Solana could become more than a trading network — it could become part of the infrastructure for tokenized markets.
Now I’m watching whether this growth actually translates into deeper liquidity and real onchain usage. 🧐
$SOL #BTC Price Analysis# #Altcoin Season#
42
·
--
Crypto really has a way of turning politics into financial experiments.
Hunter Biden is preparing to launch $LAPTOP on Base, with a portion of the supply reportedly earmarked for wallets that lost money on Donald Trump’s $TRUMP memecoin.
So basically:
You bought $TRUMP and got wrecked…
Now you might qualify for Biden’s memecoin. 😭
Beyond the political trolling, the interesting part is the strategy.
$LAPTOP is turning an existing group of frustrated crypto users into its potential initial community.
Whether that creates real demand or just another short-lived memecoin cycle is the bigger question.
Crypto never runs out of plot twists.
#TRUMP
Crypto really has a way of turning politics into financial experiments.
Hunter Biden is preparing to launch $LAPTOP on Base, with a portion of the supply reportedly earmarked for wallets that lost money on Donald Trump’s $TRUMP memecoin.
So basically:
You bought $TRUMP and got wrecked…
Now you might qualify for Biden’s memecoin. 😭
Beyond the political trolling, the interesting part is the strategy.
$LAPTOP is turning an existing group of frustrated crypto users into its potential initial community.
Whether that creates real demand or just another short-lived memecoin cycle is the bigger question.
Crypto never runs out of plot twists.
#TRUMP
Hunter Biden is preparing to launch $LAPTOP on Base, with a portion of the supply reportedly earmarked for wallets that lost money on Donald Trump’s $TRUMP memecoin.
So basically:
You bought $TRUMP and got wrecked…
Now you might qualify for Biden’s memecoin. 😭
Beyond the political trolling, the interesting part is the strategy.
$LAPTOP is turning an existing group of frustrated crypto users into its potential initial community.
Whether that creates real demand or just another short-lived memecoin cycle is the bigger question.
Crypto never runs out of plot twists.
#TRUMP

35
·
--
Ever looked at a token trading at $1.00, made a swap, and wondered why your actual execution was noticeably worse?
The answer usually isn't that the DEX “changed the price.”
It comes down to how much liquidity is available and how your trade interacts with it.
A DEX doesn't guarantee the market price you see on a chart. Your trade is executed against available liquidity, so trade size + pool depth + pool imbalance can create price impact.
There’s also an important distinction between Price Impact and Slippage.
🔹 Price Impact is the effect your own trade has on the pool's price.
🔹 Slippage is the difference between the expected execution and what actually happens when the market or route changes before execution.
This is why two swaps of the same token can produce very different results.
Before confirming a swap, don't look only at the token's displayed price.
Check:
→ Estimated Amount
→ Price Impact
→ Minimum Received
→ Slippage tolerance
→ Available liquidity
→ Route being used
Minimum Received is particularly important because it defines the minimum amount you're willing to accept for a same-chain swap. If the execution can't meet that threshold, the swap should fail rather than settle below your accepted amount.
This is also where liquidity aggregation becomes useful.
Instead of manually checking different liquidity sources, Omniston can query connected sources and help find an available route across fragmented TON liquidity.
The bigger lesson?
The price on the screen is not the same thing as the price you can actually execute.
Always evaluate the executable amount, not just the ticker price.
Explore @ston_fi pools and understand the liquidity behind your swaps→https://app.ston.fi/pools
Learn more about DeFi mechanics→https://blog.ston.fi/
$ZEC #Meme Alpha# #Meme Alpha#
Ever looked at a token trading at $1.00, made a swap, and wondered why your actual execution was noticeably worse?
The answer usually isn't that the DEX “changed the price.”
It comes down to how much liquidity is available and how your trade interacts with it.
A DEX doesn't guarantee the market price you see on a chart. Your trade is executed against available liquidity, so trade size + pool depth + pool imbalance can create price impact.
There’s also an important distinction between Price Impact and Slippage.
🔹 Price Impact is the effect your own trade has on the pool's price.
🔹 Slippage is the difference between the expected execution and what actually happens when the market or route changes before execution.
This is why two swaps of the same token can produce very different results.
Before confirming a swap, don't look only at the token's displayed price.
Check:
→ Estimated Amount
→ Price Impact
→ Minimum Received
→ Slippage tolerance
→ Available liquidity
→ Route being used
Minimum Received is particularly important because it defines the minimum amount you're willing to accept for a same-chain swap. If the execution can't meet that threshold, the swap should fail rather than settle below your accepted amount.
This is also where liquidity aggregation becomes useful.
Instead of manually checking different liquidity sources, Omniston can query connected sources and help find an available route across fragmented TON liquidity.
The bigger lesson?
The price on the screen is not the same thing as the price you can actually execute.
Always evaluate the executable amount, not just the ticker price.
Explore @ston_fi pools and understand the liquidity behind your swaps→https://app.ston.fi/pools
Learn more about DeFi mechanics→https://blog.ston.fi/
$ZEC #Meme Alpha# #Meme Alpha#
The answer usually isn't that the DEX “changed the price.”
It comes down to how much liquidity is available and how your trade interacts with it.
A DEX doesn't guarantee the market price you see on a chart. Your trade is executed against available liquidity, so trade size + pool depth + pool imbalance can create price impact.
There’s also an important distinction between Price Impact and Slippage.
🔹 Price Impact is the effect your own trade has on the pool's price.
🔹 Slippage is the difference between the expected execution and what actually happens when the market or route changes before execution.
This is why two swaps of the same token can produce very different results.
Before confirming a swap, don't look only at the token's displayed price.
Check:
→ Estimated Amount
→ Price Impact
→ Minimum Received
→ Slippage tolerance
→ Available liquidity
→ Route being used
Minimum Received is particularly important because it defines the minimum amount you're willing to accept for a same-chain swap. If the execution can't meet that threshold, the swap should fail rather than settle below your accepted amount.
This is also where liquidity aggregation becomes useful.
Instead of manually checking different liquidity sources, Omniston can query connected sources and help find an available route across fragmented TON liquidity.
The bigger lesson?
The price on the screen is not the same thing as the price you can actually execute.
Always evaluate the executable amount, not just the ticker price.
Explore @ston_fi pools and understand the liquidity behind your swaps→https://app.ston.fi/pools
Learn more about DeFi mechanics→https://blog.ston.fi/
$ZEC #Meme Alpha# #Meme Alpha#

79
·
--
Arbitrum Still Has Serious Activity — But TVL Tells a Different Story
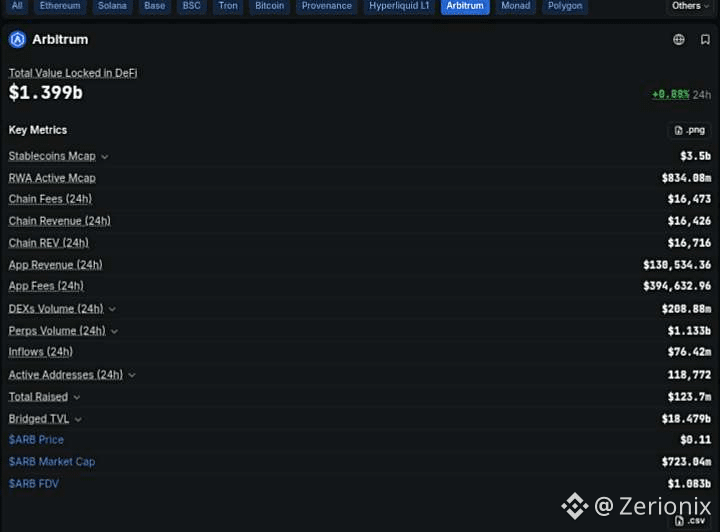
Arbitrum is processing significant activity, but its current numbers show an interesting divergence.
The network has around $1.4B in DeFi TVL, while stablecoins on the chain sit near $3.5B.
More importantly:
→ $1.13B in 24h perps volume
→ $208.9M in DEX volume
→ 118K active addresses
→ $76.4M in 24h inflows
→ $834M in RWA active market cap
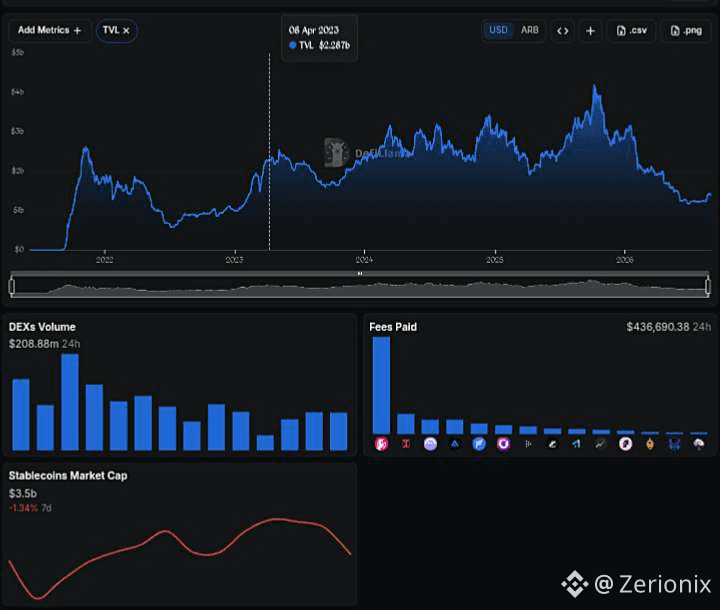
But look at the longer-term TVL chart.
Arbitrum's TVL once pushed above $4B, while today it's considerably lower.
That tells me the story isn't simply about whether people are using Arbitrum.
They clearly are.
The bigger question is whether that activity is translating into sticky capital and sustainable DeFi growth.
High perp volume can generate activity without necessarily creating long-term TVL.
Stablecoin liquidity and RWA adoption could be more important if Arbitrum wants to rebuild its capital base.
So I'm watching one thing:
Can Arbitrum turn today's activity into sustained TVL growth?
Because volume gets attention.
Sticky liquidity builds ecosystems.
#Arbitrum $ARB #BTC Price Analysis#
Arbitrum Still Has Serious Activity — But TVL Tells a Different Story
Arbitrum is processing significant activity, but its current numbers show an interesting divergence.
The network has around $1.4B in DeFi TVL, while stablecoins on the chain sit near $3.5B.
More importantly:
→ $1.13B in 24h perps volume
→ $208.9M in DEX volume
→ 118K active addresses
→ $76.4M in 24h inflows
→ $834M in RWA active market cap
But look at the longer-term TVL chart.
Arbitrum's TVL once pushed above $4B, while today it's considerably lower.
That tells me the story isn't simply about whether people are using Arbitrum.
They clearly are.
The bigger question is whether that activity is translating into sticky capital and sustainable DeFi growth.
High perp volume can generate activity without necessarily creating long-term TVL.
Stablecoin liquidity and RWA adoption could be more important if Arbitrum wants to rebuild its capital base.
So I'm watching one thing:
Can Arbitrum turn today's activity into sustained TVL growth?
Because volume gets attention.
Sticky liquidity builds ecosystems.
#Arbitrum $ARB #BTC Price Analysis#
Arbitrum is processing significant activity, but its current numbers show an interesting divergence.
The network has around $1.4B in DeFi TVL, while stablecoins on the chain sit near $3.5B.
More importantly:
→ $1.13B in 24h perps volume
→ $208.9M in DEX volume
→ 118K active addresses
→ $76.4M in 24h inflows
→ $834M in RWA active market cap
But look at the longer-term TVL chart.
Arbitrum's TVL once pushed above $4B, while today it's considerably lower.
That tells me the story isn't simply about whether people are using Arbitrum.
They clearly are.
The bigger question is whether that activity is translating into sticky capital and sustainable DeFi growth.
High perp volume can generate activity without necessarily creating long-term TVL.
Stablecoin liquidity and RWA adoption could be more important if Arbitrum wants to rebuild its capital base.
So I'm watching one thing:
Can Arbitrum turn today's activity into sustained TVL growth?
Because volume gets attention.
Sticky liquidity builds ecosystems.
#Arbitrum $ARB #BTC Price Analysis#
55
·
--
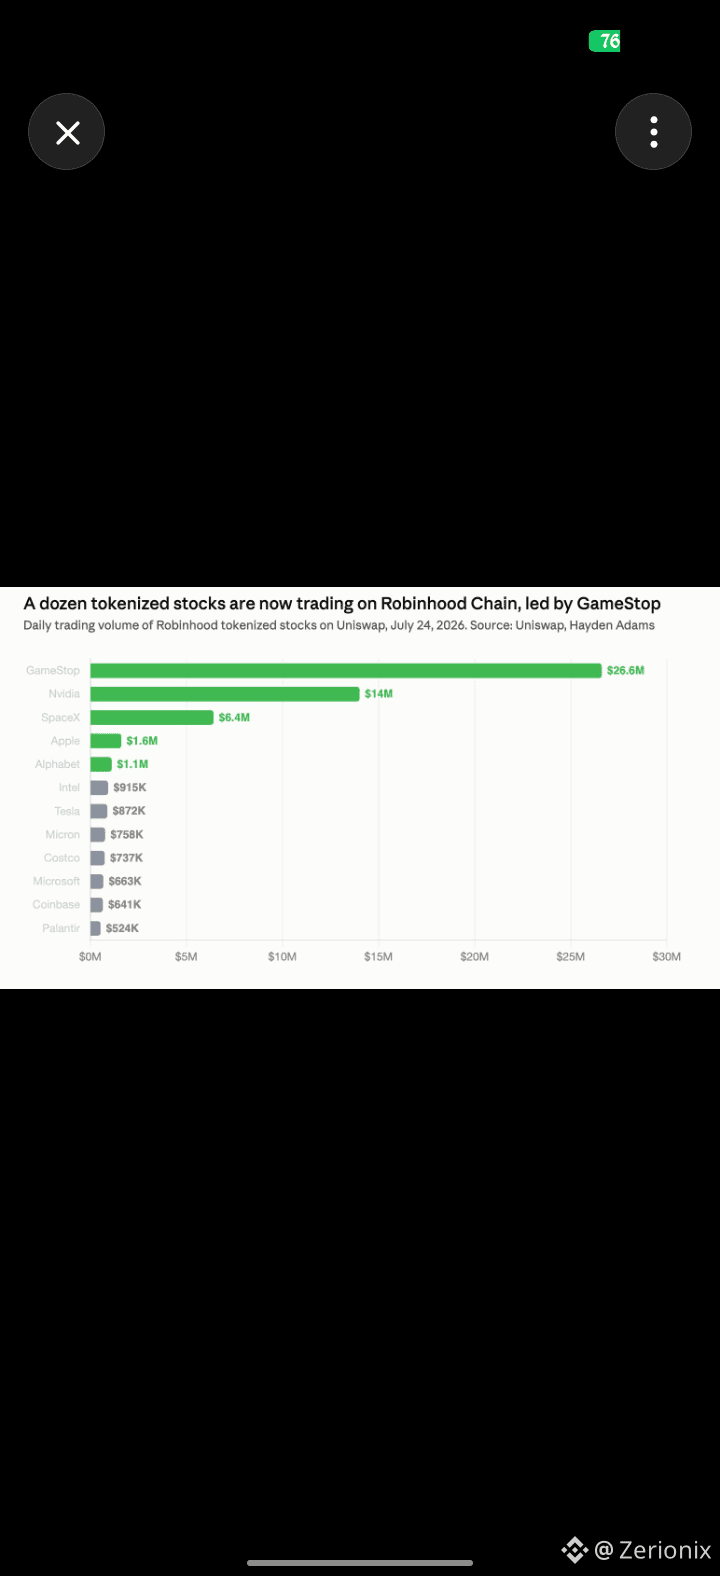
Composition of that revenue matters more than the headline.
Around 88% of the chain’s app revenue came from just three applications: GMGN, Pons and Uniswap. A large portion of the activity is connected to speculative token trading and launches.
Pons alone reportedly launched around 22,600 tokens on August 30, while the chain processed 5.52M transactions that day.
So yes, the activity is real.
But calling it broad RWA adoption would be premature.
Robinhood Chain is also building an RWA market, with tokenized stocks attracting thousands of holders and the RWA market cap reaching roughly $172M.
The interesting question is whether this activity can evolve beyond memecoin speculation and become sustainable demand for tokenized assets.
Revenue beating #Ethereum is impressive.
But where that revenue comes from is the real story.
#BTC Price Analysis# $ETH
Composition of that revenue matters more than the headline.
Around 88% of the chain’s app revenue came from just three applications: GMGN, Pons and Uniswap. A large portion of the activity is connected to speculative token trading and launches.
Pons alone reportedly launched around 22,600 tokens on August 30, while the chain processed 5.52M transactions that day.
So yes, the activity is real.
But calling it broad RWA adoption would be premature.
Robinhood Chain is also building an RWA market, with tokenized stocks attracting thousands of holders and the RWA market cap reaching roughly $172M.
The interesting question is whether this activity can evolve beyond memecoin speculation and become sustainable demand for tokenized assets.
Revenue beating #Ethereum is impressive.
But where that revenue comes from is the real story.
#BTC Price Analysis# $ETH
Around 88% of the chain’s app revenue came from just three applications: GMGN, Pons and Uniswap. A large portion of the activity is connected to speculative token trading and launches.
Pons alone reportedly launched around 22,600 tokens on August 30, while the chain processed 5.52M transactions that day.
So yes, the activity is real.
But calling it broad RWA adoption would be premature.
Robinhood Chain is also building an RWA market, with tokenized stocks attracting thousands of holders and the RWA market cap reaching roughly $172M.
The interesting question is whether this activity can evolve beyond memecoin speculation and become sustainable demand for tokenized assets.
Revenue beating #Ethereum is impressive.
But where that revenue comes from is the real story.
#BTC Price Analysis# $ETH
69
·
--
Pons just out-earned Jupiter and Axiom on a single day. The permissionless token launchpad on Robinhood Chain pulled in roughly $950K in protocol revenue in 24 hours. That put it ahead of Jupiter, Axiom Pro, and Polymarket, ranking somewhere around 7th–8th across all protocols. Pons launched alongside the new Arbitrum-based L2 in early July. Its model is straightforward: anyone can create a fixed-supply token that trades against WETH in locked pools. There is a small launch fee plus a 1% trading fee. Eighty percent of the protocol’s share of that revenue is routed into automated buybacks and burns of the native $PONS token. That mechanism has been working hard. On peak days Pons handled 60–66% of all token launches on the chain, facilitating 15,000–22,000 creations. Cumulative revenue is already in the tens of millions, with the last 30 days alone around $5M. The $PONS market cap swung from roughly $60M to nearly $400M in a week as activity and the buyback pressure scaled together. The same design that is driving the revenue also creates the main risk. When launch and trading volume stay elevated, the buybacks provide consistent demand and supply reduction. If activity cools, that pressure disappears just as quickly. The market-cap swing already shows how sensitive the token is to the underlying flow. For a platform that did not exist two months ago, the numbers are striking. Whether the revenue holds will depend on how long the Robinhood Chain token-creation wave lasts. #BTC Price Analysis# $BTC #Altcoin Season#
Pons just out-earned Jupiter and Axiom on a single day. The permissionless token launchpad on Robinhood Chain pulled in roughly $950K in protocol revenue in 24 hours. That put it ahead of Jupiter, Axiom Pro, and Polymarket, ranking somewhere around 7th–8th across all protocols. Pons launched alongside the new Arbitrum-based L2 in early July. Its model is straightforward: anyone can create a fixed-supply token that trades against WETH in locked pools. There is a small launch fee plus a 1% trading fee. Eighty percent of the protocol’s share of that revenue is routed into automated buybacks and burns of the native $PONS token. That mechanism has been working hard. On peak days Pons handled 60–66% of all token launches on the chain, facilitating 15,000–22,000 creations. Cumulative revenue is already in the tens of millions, with the last 30 days alone around $5M. The $PONS market cap swung from roughly $60M to nearly $400M in a week as activity and the buyback pressure scaled together. The same design that is driving the revenue also creates the main risk. When launch and trading volume stay elevated, the buybacks provide consistent demand and supply reduction. If activity cools, that pressure disappears just as quickly. The market-cap swing already shows how sensitive the token is to the underlying flow. For a platform that did not exist two months ago, the numbers are striking. Whether the revenue holds will depend on how long the Robinhood Chain token-creation wave lasts. #BTC Price Analysis# $BTC #Altcoin Season#
37
·
--
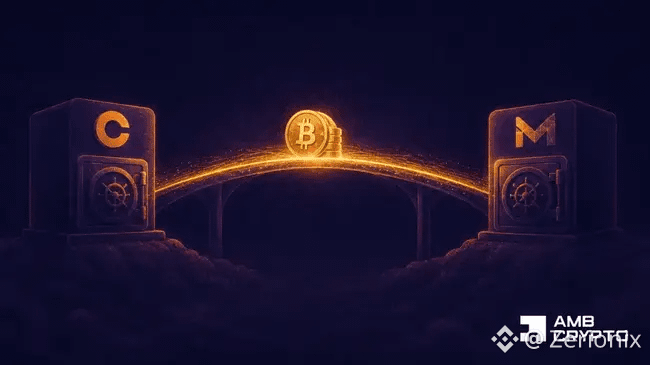
Metaplanet moved another 800 $BTC to Coinbase Prime. The sell-side chatter started immediately. The transfer was worth roughly $62 million. On-chain trackers flagged it moving from Metaplanet’s own wallets into Coinbase’s institutional platform. That kind of deposit always raises the same question: is this preparation to sell, or just custody and liquidity management? The transfer itself does not answer it. Coinbase Prime is used for trading, financing, and institutional custody. Moving coins there can precede a sale, an OTC deal, or simply better operational setup. Metaplanet has made similar large transfers in recent days without confirming any sales, and the company still reports holdings of around 43,000 BTC. Context matters. Bitcoin treasury companies as a group recently pushed combined holdings above $100 billion again. Metaplanet remains one of the larger ones, with an average cost basis near $96k. Its stock, however, has been under pressure — down sharply on the year, which shows that shareholders are still weighing dilution, financing risk, and Bitcoin price exposure more heavily than the growing treasury size. A $62 million transfer is large enough to notice but small relative to overall Bitcoin liquidity. It is not, on its own, a signal that a major corporate holder is exiting. Until there is clear evidence of coins hitting the market, the more neutral reading is the safer one: this looks like another custodial move inside a company that has been accumulating, not distributing. #BTC Price Analysis# #Altcoin Season#
Metaplanet moved another 800 $BTC to Coinbase Prime. The sell-side chatter started immediately. The transfer was worth roughly $62 million. On-chain trackers flagged it moving from Metaplanet’s own wallets into Coinbase’s institutional platform. That kind of deposit always raises the same question: is this preparation to sell, or just custody and liquidity management? The transfer itself does not answer it. Coinbase Prime is used for trading, financing, and institutional custody. Moving coins there can precede a sale, an OTC deal, or simply better operational setup. Metaplanet has made similar large transfers in recent days without confirming any sales, and the company still reports holdings of around 43,000 BTC. Context matters. Bitcoin treasury companies as a group recently pushed combined holdings above $100 billion again. Metaplanet remains one of the larger ones, with an average cost basis near $96k. Its stock, however, has been under pressure — down sharply on the year, which shows that shareholders are still weighing dilution, financing risk, and Bitcoin price exposure more heavily than the growing treasury size. A $62 million transfer is large enough to notice but small relative to overall Bitcoin liquidity. It is not, on its own, a signal that a major corporate holder is exiting. Until there is clear evidence of coins hitting the market, the more neutral reading is the safer one: this looks like another custodial move inside a company that has been accumulating, not distributing. #BTC Price Analysis# #Altcoin Season#
28
·
--
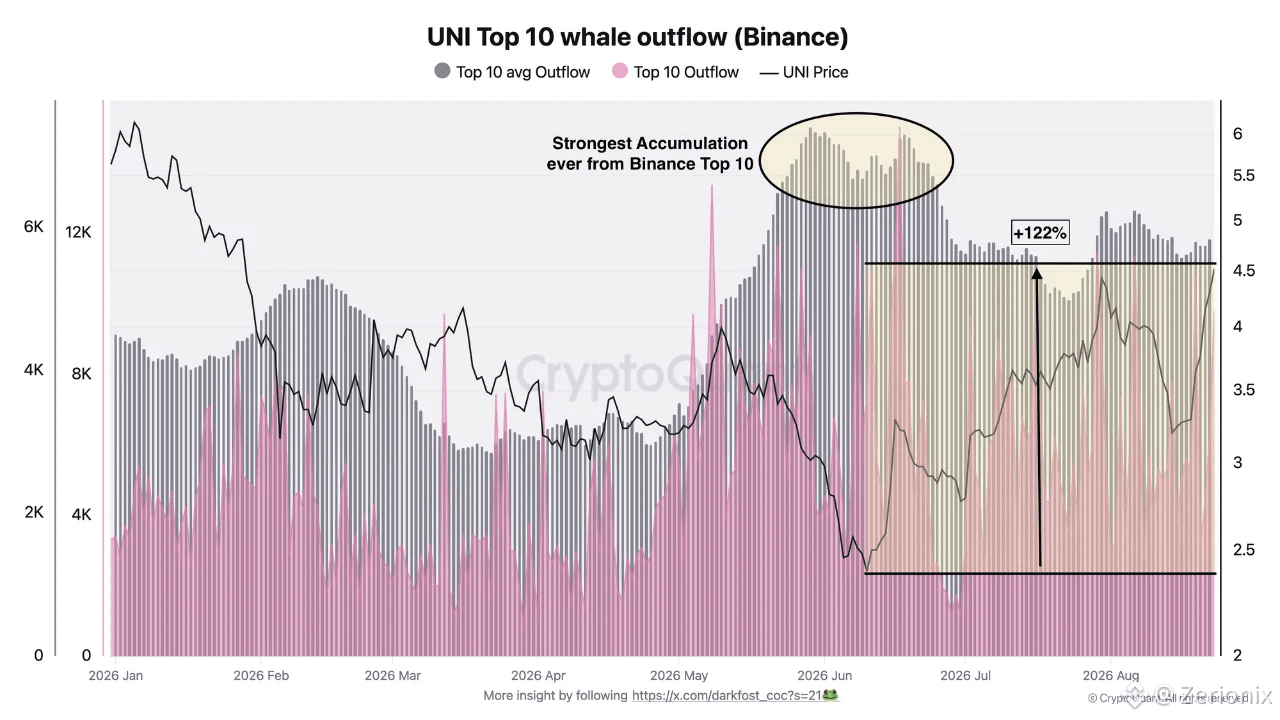
UNI is up 122% and the whale flow on Binance never really stopped. For months, the top 10 largest outflows of UNI from Binance have been elevated. That metric is a clean way to track whale-sized accumulation — these are the big tickets, not retail noise. On May 29 the 30-day average of those top-10 outflows hit a record, with roughly 7,400 UNI leaving the exchange each day. The pace nearly matched that level again on June 18 after a single day that saw more than 15,000 UNI exit in the largest transfers alone, the highest daily print of 2026. That period lined up with the start of the current move. UNI has since risen from $2.48 to around $5.14, a 122% advance. The flow is still active. The monthly average remains elevated at about 5,300 UNI leaving Binance per day through the largest transactions. That is only the top slice of activity; total demand is higher. As long as this pattern of large outflows continues, the supply pressure on the exchange stays reduced. The next clear technical reference sitting overhead is the weekly 200-day moving average near $7.80. Whether price gets there depends on whether the same demand that has been absorbing supply for months keeps showing up. For now, the on-chain signal has been consistent: larger players have been steadily pulling UNI off Binance while the price has been re-rating higher. $UNI #BNBChain# #Altcoin Season#
UNI is up 122% and the whale flow on Binance never really stopped. For months, the top 10 largest outflows of UNI from Binance have been elevated. That metric is a clean way to track whale-sized accumulation — these are the big tickets, not retail noise. On May 29 the 30-day average of those top-10 outflows hit a record, with roughly 7,400 UNI leaving the exchange each day. The pace nearly matched that level again on June 18 after a single day that saw more than 15,000 UNI exit in the largest transfers alone, the highest daily print of 2026. That period lined up with the start of the current move. UNI has since risen from $2.48 to around $5.14, a 122% advance. The flow is still active. The monthly average remains elevated at about 5,300 UNI leaving Binance per day through the largest transactions. That is only the top slice of activity; total demand is higher. As long as this pattern of large outflows continues, the supply pressure on the exchange stays reduced. The next clear technical reference sitting overhead is the weekly 200-day moving average near $7.80. Whether price gets there depends on whether the same demand that has been absorbing supply for months keeps showing up. For now, the on-chain signal has been consistent: larger players have been steadily pulling UNI off Binance while the price has been re-rating higher. $UNI #BNBChain# #Altcoin Season#
36
·
--
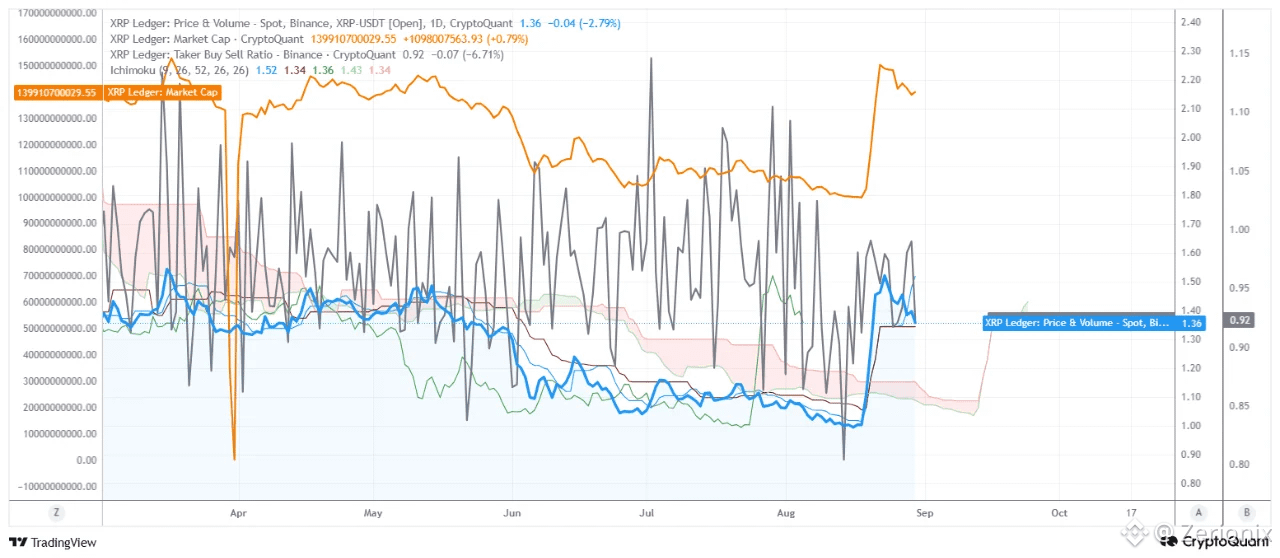
$XRP buyers are not in FOMO mode. Price recovered hard from around $1.00 to $1.50, then pulled back to roughly $1.36. The Taker Buy/Sell Ratio on Binance is sitting at 0.92. That means aggressive sellers are still outweighing aggressive buyers in the derivatives market, even after the bounce. A rising price with a ratio stuck below 1 is a useful signal. It suggests the move higher has not yet been driven by strong demand from the futures side. Profit-taking or residual short pressure is still present. Market cap tells a similar story. It ran from around $100B toward $150B before settling near $140B. The retracement is real, but XRP remains well above its prior low. The failure to push a clean new high after tagging $1.50 points to fading momentum rather than a full breakdown. Price is now approaching a key short-term decision zone around $1.35–$1.40 inside the Ichimoku structure. Holding this area keeps the recovery intact. Losing it with the taker ratio still below 1 would tilt the short-term bias toward sideways or modestly lower price action. The more constructive signal would be the Taker Buy/Sell Ratio moving back above 1. Historically, that shift has lined up with stronger continuation in XRP. Until that happens, the market is still working through the rebound rather than confirming full buyer control. #BTC Price Analysis# #Altcoin Season#
$XRP buyers are not in FOMO mode. Price recovered hard from around $1.00 to $1.50, then pulled back to roughly $1.36. The Taker Buy/Sell Ratio on Binance is sitting at 0.92. That means aggressive sellers are still outweighing aggressive buyers in the derivatives market, even after the bounce. A rising price with a ratio stuck below 1 is a useful signal. It suggests the move higher has not yet been driven by strong demand from the futures side. Profit-taking or residual short pressure is still present. Market cap tells a similar story. It ran from around $100B toward $150B before settling near $140B. The retracement is real, but XRP remains well above its prior low. The failure to push a clean new high after tagging $1.50 points to fading momentum rather than a full breakdown. Price is now approaching a key short-term decision zone around $1.35–$1.40 inside the Ichimoku structure. Holding this area keeps the recovery intact. Losing it with the taker ratio still below 1 would tilt the short-term bias toward sideways or modestly lower price action. The more constructive signal would be the Taker Buy/Sell Ratio moving back above 1. Historically, that shift has lined up with stronger continuation in XRP. Until that happens, the market is still working through the rebound rather than confirming full buyer control. #BTC Price Analysis# #Altcoin Season#
54
·
--
A new address just stacked ~$79M in Bitcoin buy orders below the market. According to TradingBeats monitoring, a recently created wallet placed 30 limit buy orders for BTC between $75,000 and $76,000. Total size: 1,046.78 BTC, roughly $79 million at the order prices. Each order is identical at ~34.9 $BTC . Bitcoin was trading near $78,700 at the time, so these bids sit 3.4% to 4.7% below the market. The address itself is only four days old. It received about $5.1 million, ran four short positions, and booked roughly $330k in profit. If these buy orders fill, it will be the wallet’s first long. Large resting bids this far below spot don’t guarantee a move to those levels, but they do show someone is prepared to absorb size if price revisits the mid-$75k zone. Worth watching whether the orders get filled, pulled, or adjusted as the market develops. #BTC Price Analysis# #Altcoin Season#
A new address just stacked ~$79M in Bitcoin buy orders below the market. According to TradingBeats monitoring, a recently created wallet placed 30 limit buy orders for BTC between $75,000 and $76,000. Total size: 1,046.78 BTC, roughly $79 million at the order prices. Each order is identical at ~34.9 $BTC . Bitcoin was trading near $78,700 at the time, so these bids sit 3.4% to 4.7% below the market. The address itself is only four days old. It received about $5.1 million, ran four short positions, and booked roughly $330k in profit. If these buy orders fill, it will be the wallet’s first long. Large resting bids this far below spot don’t guarantee a move to those levels, but they do show someone is prepared to absorb size if price revisits the mid-$75k zone. Worth watching whether the orders get filled, pulled, or adjusted as the market develops. #BTC Price Analysis# #Altcoin Season#
70
Log in to explore more content
Join global crypto users on Binance Square
⚡️ Get latest and useful information about crypto.
💬 Trusted by the world’s largest crypto exchange.
👍 Discover real insights from verified creators.
Email / Phone number
Trending Topics
CPIWatch
86.4M views
500,794 Discussing
Share & Win Traffic Reward in our Trending Hashtag Campaign
✨Topic: Will CPI Trigger Rate Hike?
👉How to Join:
Publish a short post or article with hashtag #CPIWatch
Create content based on the below two angles:
- Nonfarm payrolls beat expectations and CPI is around the corner, do you think the Fed will hike or hold the rate?
- Bullish or bearish? Share your take and showcase your stocks or gold trade/holdings with our trade sharing widget.
🚀Campaign Period:
- 2026-09-11 3:00 - 2026-09-12 9:00 UTC
🎁Reward:
- Qualified posts that comply with the above guidelines and contain more than 100 words will be reviewed and may receive a random traffic boost of 500 to 3,000 views. You will receive a notification from your feed secretary if your post is selected.
- Get a chance to have your article featured on Binance Square Official
Need ideas for your post? Visit the topic page #CPIWatch or the Square Guide on How to Post for Better Reach.
Binance Square Official
·367 Likes
·791.6k views
BitcoinFallsTo$77KAfterGoldenCross
823 views
37 Discussing
OracleJumpsOver6%OnEarningsBeat
3,912 views
201 Discussing