

alwahy7185
2.6k Posts

alwahy7185
Report
Block User
317 Following
471 Followers
913 Liked
Posts
All
Quotes
Videos
PINNED
·
--
Bearish
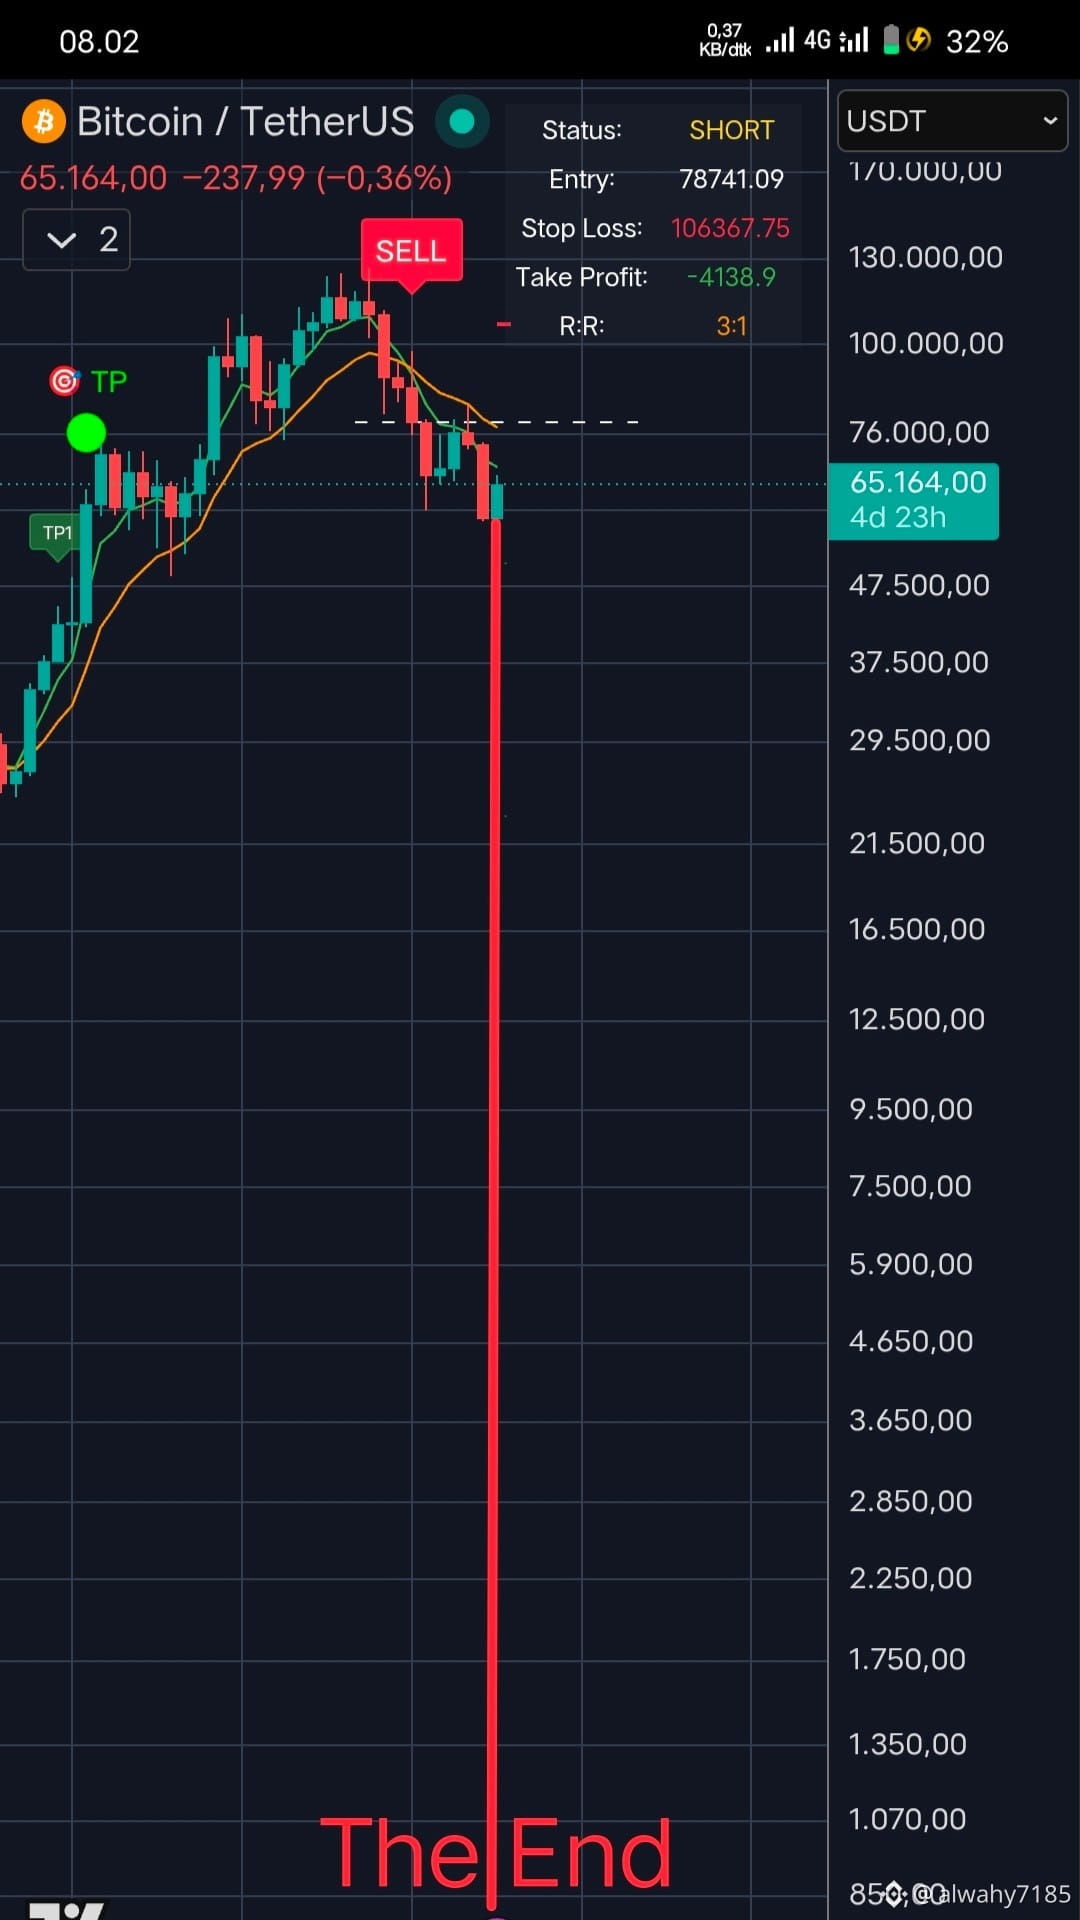
$BTC ⚠️1x24 hours Btc does not break 68k-70k — the longest bear market in history 2027-2037 to $850/Btc The End⚠️
{spot}(BTCUSDT)
$BTC ⚠️1x24 hours Btc does not break 68k-70k — the longest bear market in history 2027-2037 to $850/Btc The End⚠️
1
275
·
--
Bearish
$BTC 🚨BTCUSDT.P ENTRY SIGNAL (SMC Setup) 🚨
Based on the chart, BTC is currently under pressure below the trendline, with the price around 81,977. Here are two trading scenarios based on liquidity zones:
🔴 SHORT SETUP:
· Entry: Current area or a pullback to 82,329.
· Target (TP): 79,785 - 79,026 (Sweep of lower liquidity).
· Stop Loss (SL): 83,000+ (Above the supply zone).
🟢 LONG SETUP:
· Entry: Wait for the price to enter the Demand zone at 80,176.
· Target (TP): 83,179 - 83,980 (Fill the upper FVG gap).
· Stop Loss (SL): 79,700 (Below the demand zone).
Wait for price confirmation, stay disciplined, and always use risk management! 📉📈
(Note: Adjust the wording to suit your audience's preferences. Be sure to include a disclaimer that this is not financial advice.)
{future}(BTCUSDT)
$BTC 🚨BTCUSDT.P ENTRY SIGNAL (SMC Setup) 🚨
Based on the chart, BTC is currently under pressure below the trendline, with the price around 81,977. Here are two trading scenarios based on liquidity zones:
🔴 SHORT SETUP:
· Entry: Current area or a pullback to 82,329.
· Target (TP): 79,785 - 79,026 (Sweep of lower liquidity).
· Stop Loss (SL): 83,000+ (Above the supply zone).
🟢 LONG SETUP:
· Entry: Wait for the price to enter the Demand zone at 80,176.
· Target (TP): 83,179 - 83,980 (Fill the upper FVG gap).
· Stop Loss (SL): 79,700 (Below the demand zone).
Wait for price confirmation, stay disciplined, and always use risk management! 📉📈
(Note: Adjust the wording to suit your audience's preferences. Be sure to include a disclaimer that this is not financial advice.)
168
·
--
Bearish
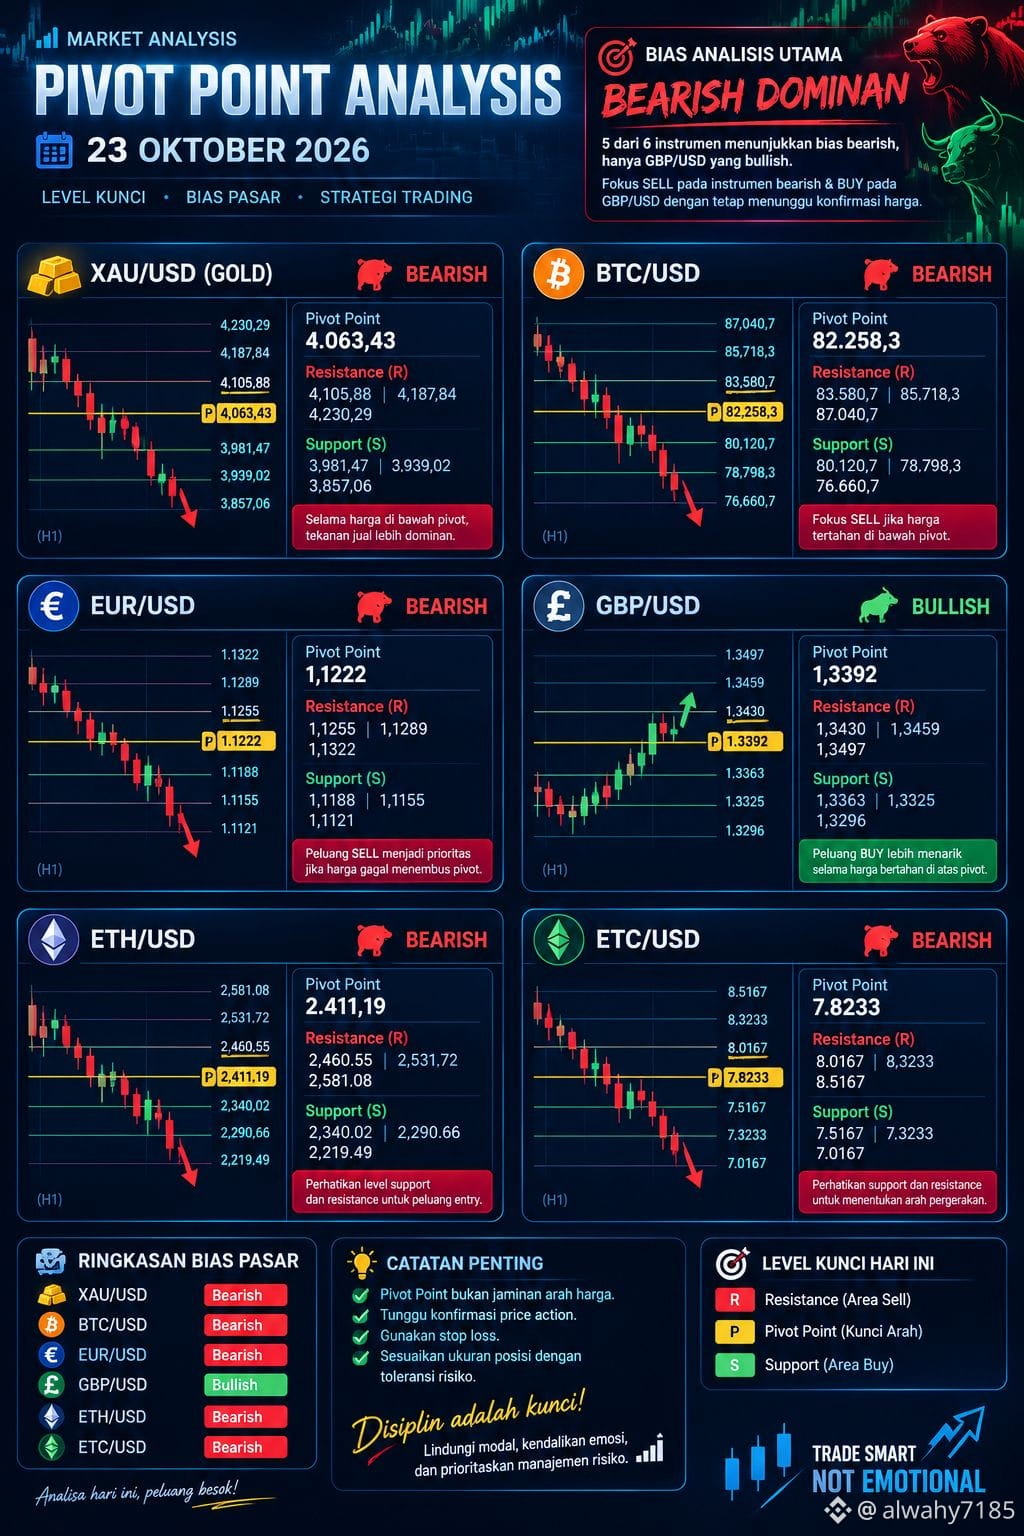
$BTC 📊 PIVOT POINT ANALYSIS 📅 Friday, October 23, 2026
🎯 MAIN ANALYSIS BIAS: PREDOMINANTLY BEARISH
Based on Pivot Point data, 5 of the 6 instruments show a bearish bias, while GBP/USD is the only instrument with a bullish bias. The main focus is to look for SELL opportunities on bearish instruments and BUY opportunities on the bullish instrument, while waiting for price confirmation.
🟡 XAU/USD — BEARISH Pivot 4.063,43. As long as the price stays below the pivot, selling pressure is dominant. Support: 3.981,47 | 3.939,02 | 3.857,06.
₿ BTC/USD — BEARISH Pivot 82.258,3. Focus on SELL if the price is held below the pivot. Support: 80.120,7 | 78.798,3 | 76.660,7.
💶 EUR/USD — BEARISH Pivot 1,1222. SELL opportunities take priority if the price fails to break above the pivot. Support: 1,1188 | 1,1155 | 1,1121.
💷 GBP/USD — BULLISH Pivot 1,3392. BUY opportunities are more attractive as long as the price holds above the pivot. Resistance: 1,3430 | 1,3459 | 1,3497.
🔷 ETH/USD — BEARISH Pivot 2.411,19. Watch support at 2.340,02 and resistance at 2.460,55.
💎 ETC/USD — BEARISH Pivot 7,8233. Watch support at 7,5167 and resistance at 8,0167.
⚠️ PRIORITIES: PRICE CONFIRMATION, STOP LOSS, AND RISK MANAGEMENT. Bias is not an automatic entry signal.
189
·
--
Bearish
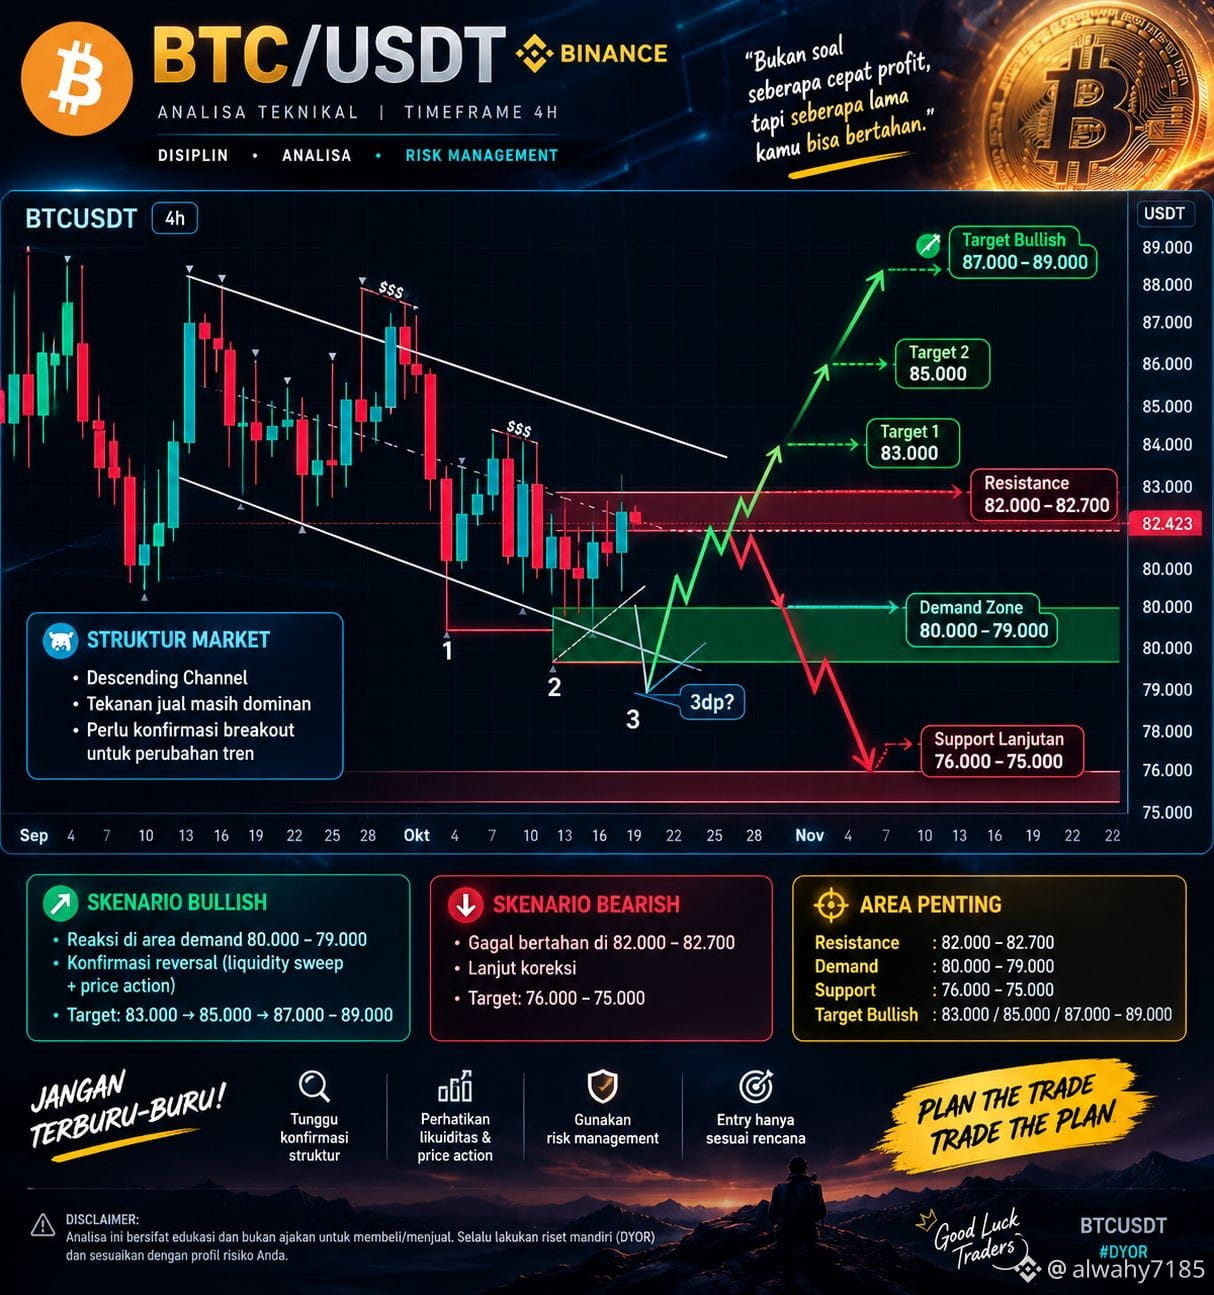
$BTC 🚨☠️🚨 is still moving within a bearish structure, with a descending channel pattern indicating that selling pressure has not fully subsided. 📉
The 83,000–83,700 area is an important resistance level to watch. If the price fails to break through and hold above this area, BTC could continue its correction toward the 80,000–79,000 demand zone.
An interesting scenario would be to wait for the price reaction at the demand zone. If a liquidity sweep and reversal confirmation form, a rebound toward 84,000, 85,000, and even 88,000–89,000–98,000 could be possible.
However, if demand fails to hold, bearish pressure could continue toward 76,000–75,000–68,000–65,000 (Buy-the-Dip Zone) for the long term 😄 🤙
🎯 Main focus: wait for confirmation of market structure, liquidity, and price action. Don't enter based on predictions alone. Risk management comes first.
Plan the trade, trade the plan.
1.2k
·
--
$BTC 📊 **BTC ANALYSIS | BUY THE DIP**
🎯 **BUY DIP ZONE**
- 81.500
- 80.500
- 77.700
🚀 **TARGET TAKE PROFIT**
- TP1: 86.900
- TP2: 88.100
- TP3: 90.500
⚠️ **RISK MANAGEMENT**
- Stop Loss / invalidation: 75.000
- Extreme downside scenario: 65.000
📌 Wait for price confirmation before entering. Manage your position size, avoid FOMO, and stick to your trading plan.
#Bitcoin #CryptoTrading #TechnicalAnalysis
120
·
--
Bearish
$BTC
{spot}(BTCUSDT)
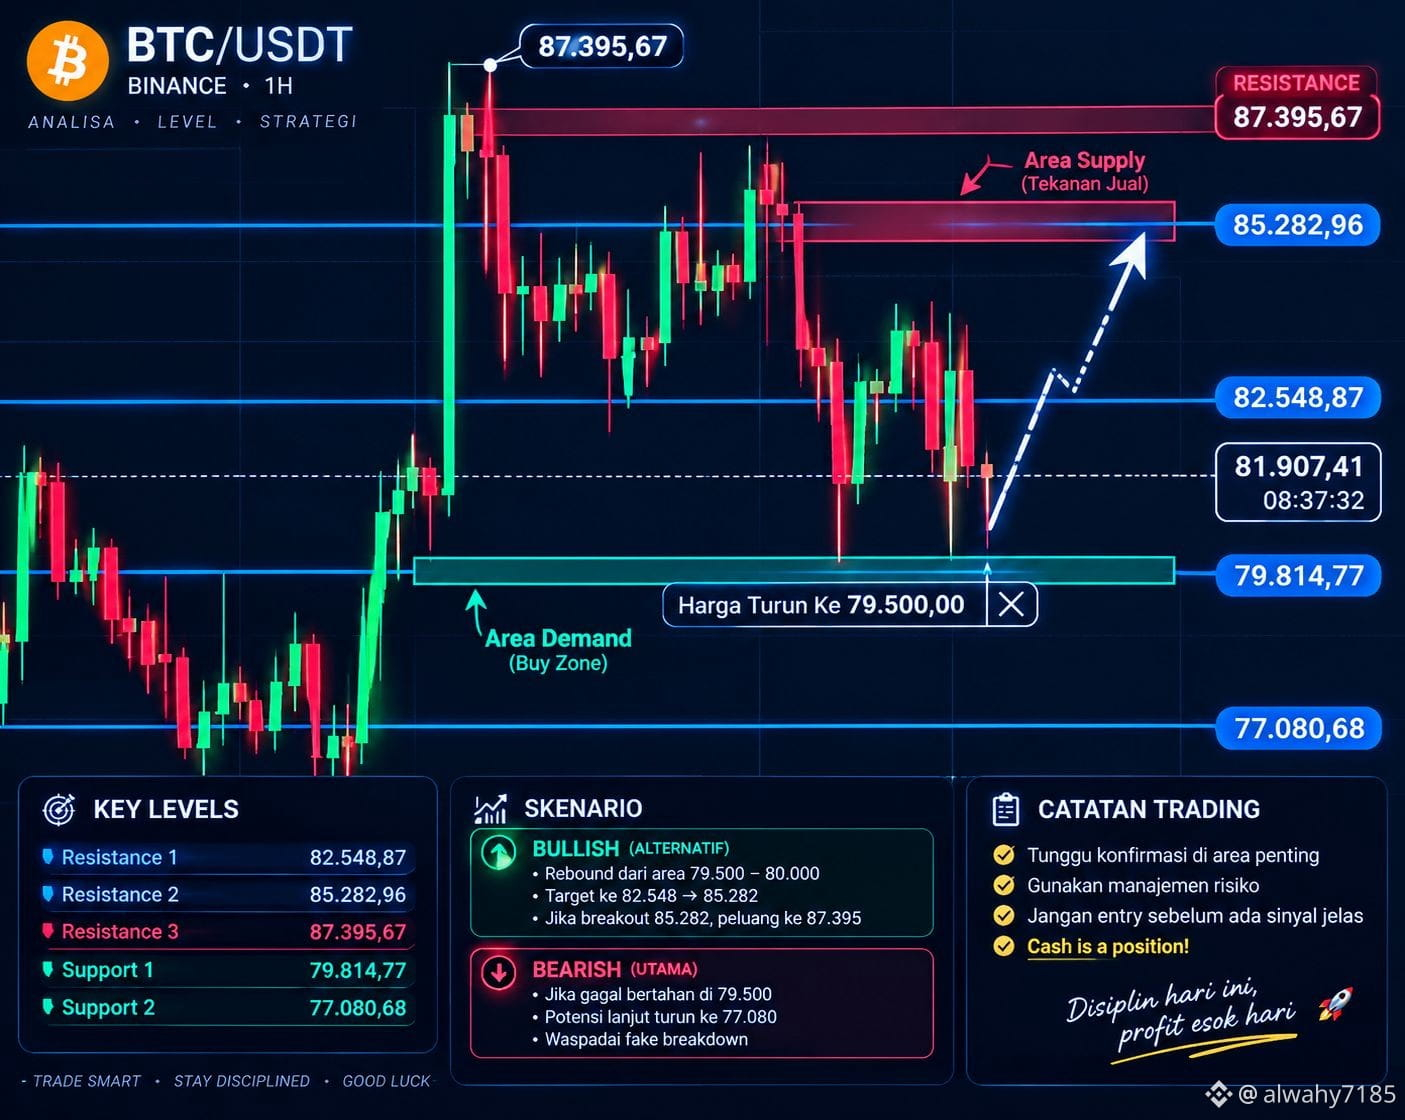
The current price is holding around 81.907. Our main focus is the Demand zone (Buy Zone) between 79.500 and 80.000. The primary scenario remains bearish. If the price fails to hold in this demand zone, there is a strong possibility of further downside toward Support 2 at 77.080. Watch out for a fake breakdown. However, if the price rebounds from the demand zone, the alternative bullish scenario could come into play. The first target is Resistance 1 at 82.548, followed by Resistance 2 at 85.282. If there is a solid breakout above 85.282, the price has a strong chance of continuing its uptrend toward Resistance 3 at 87.395. The key to successful trading right now is to wait for signal confirmation, apply strict risk management, and never enter a trade before there is a clear signal. Remember, cash is a position! Stay disciplined today for maximum profits tomorrow.
$BTC
The current price is holding around 81.907. Our main focus is the Demand zone (Buy Zone) between 79.500 and 80.000. The primary scenario remains bearish. If the price fails to hold in this demand zone, there is a strong possibility of further downside toward Support 2 at 77.080. Watch out for a fake breakdown. However, if the price rebounds from the demand zone, the alternative bullish scenario could come into play. The first target is Resistance 1 at 82.548, followed by Resistance 2 at 85.282. If there is a solid breakout above 85.282, the price has a strong chance of continuing its uptrend toward Resistance 3 at 87.395. The key to successful trading right now is to wait for signal confirmation, apply strict risk management, and never enter a trade before there is a clear signal. Remember, cash is a position! Stay disciplined today for maximum profits tomorrow.
The current price is holding around 81.907. Our main focus is the Demand zone (Buy Zone) between 79.500 and 80.000. The primary scenario remains bearish. If the price fails to hold in this demand zone, there is a strong possibility of further downside toward Support 2 at 77.080. Watch out for a fake breakdown. However, if the price rebounds from the demand zone, the alternative bullish scenario could come into play. The first target is Resistance 1 at 82.548, followed by Resistance 2 at 85.282. If there is a solid breakout above 85.282, the price has a strong chance of continuing its uptrend toward Resistance 3 at 87.395. The key to successful trading right now is to wait for signal confirmation, apply strict risk management, and never enter a trade before there is a clear signal. Remember, cash is a position! Stay disciplined today for maximum profits tomorrow.
246
·
--
Bullish
$BTC 🚀 **BTC TARGET FOR TODAY: $84.885–$85.288**
Bitcoin may test the **$84.885–$85.288** resistance zone today. However, this target remains a scenario, not a certainty. Traders should wait for price confirmation before making decisions.
📈 **BULLISH SCENARIO**
If BTC manages to break through the nearest resistance with increasing buying volume and holds above the breakout level, the chances of continuing upward toward $84.885–$85.288 increase.
📉 **ALTERNATIVE SCENARIO**
If the price is rejected at the resistance area, watch out for a correction and don’t rush to chase the price. Wait for confirmation of the market structure before deciding on an entry.
🎯 **TRADING STRATEGY**
✅ Monitor volume and breakout candles.
✅ Check for confirmation on the 4H and 1H timeframes.
✅ Set a stop loss before entering.
✅ Manage risk and avoid FOMO.
Remember, a price target does not guarantee profit. **Discipline is more important than prediction.** There’s no obligation to enter if the setup isn’t valid yet.
💡 *Cash is a position. Waiting and seeing is also a strategy.*
#Bitcoin #BTC #CryptoTrading #BTCAnalysis #TradingPlan
{spot}(BTCUSDT)
$BTC 🚀 **BTC TARGET FOR TODAY: $84.885–$85.288**
Bitcoin may test the **$84.885–$85.288** resistance zone today. However, this target remains a scenario, not a certainty. Traders should wait for price confirmation before making decisions.
📈 **BULLISH SCENARIO**
If BTC manages to break through the nearest resistance with increasing buying volume and holds above the breakout level, the chances of continuing upward toward $84.885–$85.288 increase.
📉 **ALTERNATIVE SCENARIO**
If the price is rejected at the resistance area, watch out for a correction and don’t rush to chase the price. Wait for confirmation of the market structure before deciding on an entry.
🎯 **TRADING STRATEGY**
✅ Monitor volume and breakout candles.
✅ Check for confirmation on the 4H and 1H timeframes.
✅ Set a stop loss before entering.
✅ Manage risk and avoid FOMO.
Remember, a price target does not guarantee profit. **Discipline is more important than prediction.** There’s no obligation to enter if the setup isn’t valid yet.
💡 *Cash is a position. Waiting and seeing is also a strategy.*
#Bitcoin #BTC #CryptoTrading #BTCAnalysis #TradingPlan
123
·
--
Bearish
$BTC 🚨 **BTC ANALYSIS | OCTOBER 13, 2026**
BTC is trading in the **$82,000–$83,000** range and remains under corrective pressure after falling from its peak of $87,197.
📉 Bearish Scenario:
If support at $82,000 breaks, BTC could fall to $80,000–$81,000. If selling pressure continues, the $77,000–$78,000 zone becomes the next target.
📈 Bullish Signals:
Whales have accumulated 16,010 BTC in 5 days, while BTC reserves on exchanges have declined. However, a bottom signal has not yet been confirmed.
⚠️ Main Risk:
Outflows from U.S. spot Bitcoin ETFs totaled around $679 million over the past week, indicating pressure from institutional investors.
🎯 **Strategy:**
- Traders: *Wait and see*; wait for confirmation.
- Investors: Consider dollar-cost averaging gradually in the $80,000–$83,000 zone.
- Bullish confirmation: BTC moves back above $84,500, accompanied by strong volume and ETF inflows.
**Remember: Cash is a position. Don’t rush to buy without confirmation.** Manage risk and keep capital ready for a possible further correction.
#CryptoTrading #AnalisisBTC
338
·
--
Bearish
$BTC Many investors today are overly euphoric about anticipating a new Bitcoin all-time high (ATH) in the 2027–2028 cycle. But they often forget that the road there is never smooth. In fact, the beginning of a true bear market is the most dangerous phase, and one that is often overlooked.
Let’s learn from historical data. In the previous cycle, Bitcoin plunged 84% from its December 2017 peak to its December 2018 bottom. This decline didn’t happen overnight; it unfolded gradually over 12 months, with several false rebounds (bull traps) that lured many people into buying back in. Those who rushed to buy at the peak without a dollar-cost averaging (DCA) strategy or a gradual buyback plan were forced to endure terrifying unrealized losses for years.
The question is, are we mentally prepared if that 84% scenario repeats? The reality is that 90% of investors will give up and cut their losses along the way because they can’t bear to watch their portfolios turn blood red. They’ll give up just before the real bull run begins, simply because of panic selling.
So, if you’re hoping for a new ATH in 2027–2028, be prepared to face a long and brutal “winter” first. Manage your risk, set aside emergency funds, and never enter the market with a “get rich quick” mindset. Surviving the bear market is the key to enjoying the party in the next bull market. Don’t become one of the 90% who fall by the wayside!
{spot}(BTCUSDT)
$BTC Many investors today are overly euphoric about anticipating a new Bitcoin all-time high (ATH) in the 2027–2028 cycle. But they often forget that the road there is never smooth. In fact, the beginning of a true bear market is the most dangerous phase, and one that is often overlooked.
Let’s learn from historical data. In the previous cycle, Bitcoin plunged 84% from its December 2017 peak to its December 2018 bottom. This decline didn’t happen overnight; it unfolded gradually over 12 months, with several false rebounds (bull traps) that lured many people into buying back in. Those who rushed to buy at the peak without a dollar-cost averaging (DCA) strategy or a gradual buyback plan were forced to endure terrifying unrealized losses for years.
The question is, are we mentally prepared if that 84% scenario repeats? The reality is that 90% of investors will give up and cut their losses along the way because they can’t bear to watch their portfolios turn blood red. They’ll give up just before the real bull run begins, simply because of panic selling.
So, if you’re hoping for a new ATH in 2027–2028, be prepared to face a long and brutal “winter” first. Manage your risk, set aside emergency funds, and never enter the market with a “get rich quick” mindset. Surviving the bear market is the key to enjoying the party in the next bull market. Don’t become one of the 90% who fall by the wayside!
114
·
--
Bearish
$BTC 📊 BTC: SUPPORT 85.180 BECOMES A KEY LEVEL
The 1-minute chart shows BTC repeatedly respecting the 85.180 support area and bouncing off it. This indicates that buyers are still active in defending that level in the short term.
As long as price holds above 85.180, the bounce scenario remains valid, with the main resistance at 85.280. The 85.280 area becomes an important target because previously, sellers appeared to be blocking the rise.
However, don’t rush to chase the green candles. For entry, be more disciplined by waiting for a retest or a confirmed bounce from the support area—don’t buy when price is already approaching resistance.
⚠️ If price falls and breaks below 85.160, short-term buyer strength is considered to have failed. In that case, a buy position becomes riskier, and it’s better to wait for a new structure to form.
🎯 Plan: • Support: 85.180
• Invalidation level: 85.160
• Resistance/target: 85.280
• Strategy: wait for bounce confirmation, don’t FOMO.
- Buy the dip 80800-77.770
Remember: professional traders don’t have to always hold a position. Cash is also a position. Protect your capital first, then let the market provide a setup with a reasonable risk-reward.
273
·
--
$BTC ⚠️ EFFECT OF OVERCONFIDENCE🚨 SWEET TRADING RISK AFTER WINNING back-to-back in Crypto trading is indeed fun. Profits grow, BTC and Altcoin confidence keeps rising without extreme dumps, and you feel like you already understand the market. This is where the biggest trap starts. The brain starts whispering: “I’m good. Whatever I buy will definitely go up.” Traders start getting bold:
• Ignoring the stop loss. • Increasing position size beyond the plan. • Entering without analysis.🚨
• Ignoring the stop loss. • Increasing position size beyond the plan. • Entering without analysis.🚨
157
·
--
Bearish
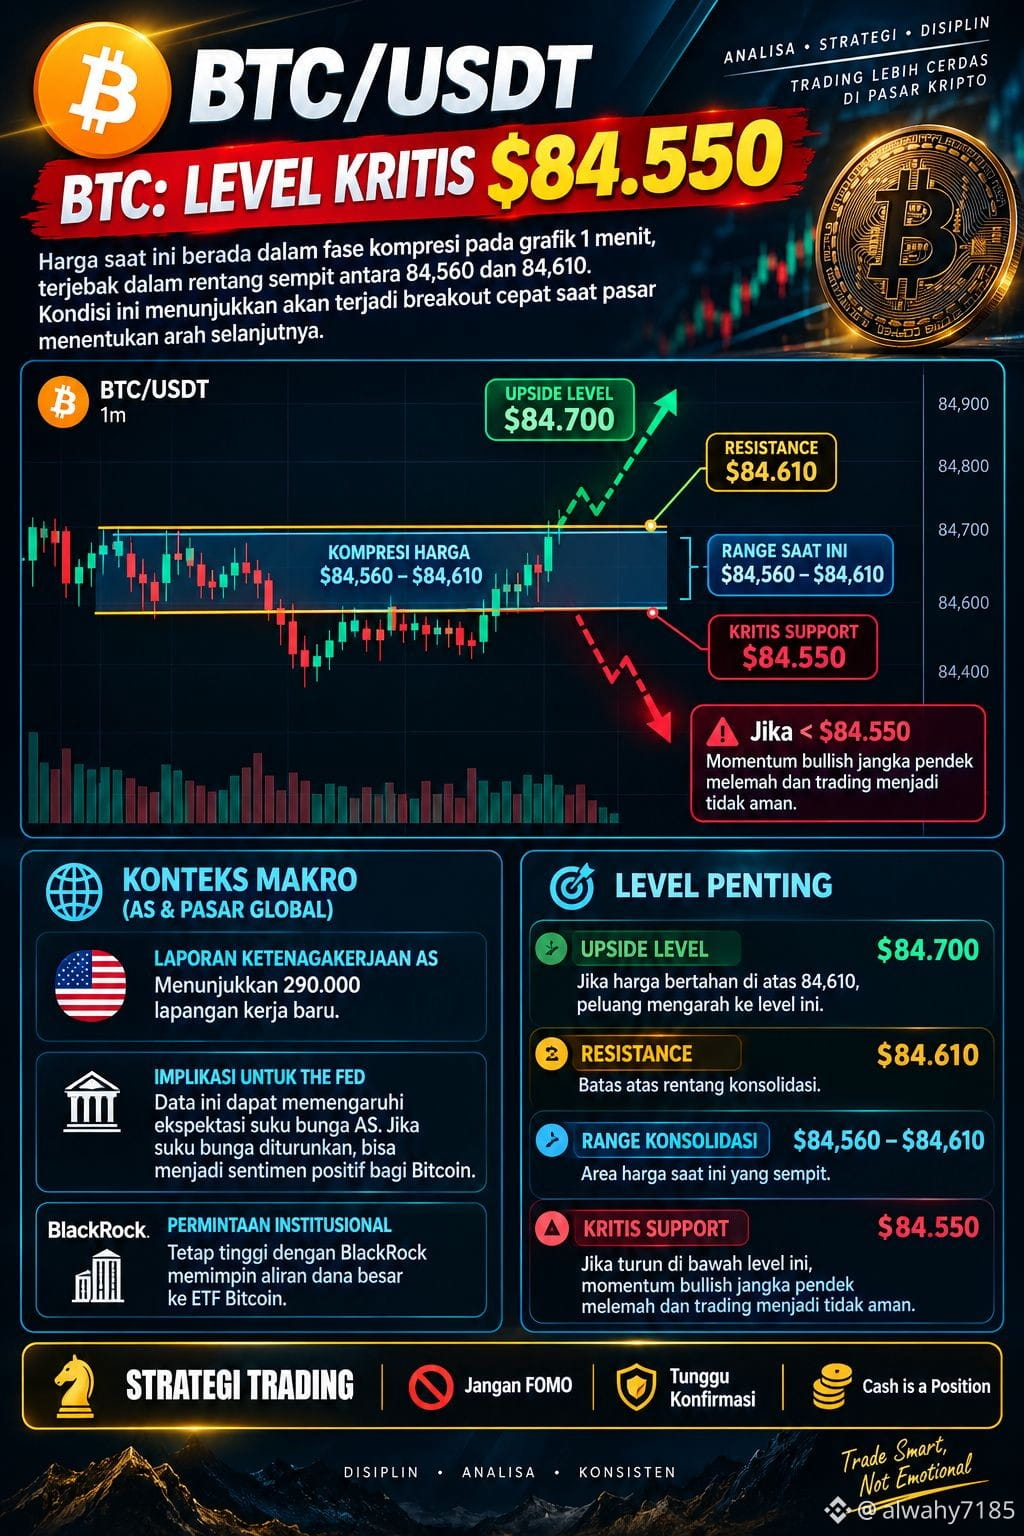
$BTC The cryptocurrency Bitcoin (BTC/USDT) is currently at a critical level of $84,550. On the 1-minute chart, the price is locked in a tight compression phase within the $84,560 to $84,610 range. This compression condition suggests a quick breakout once the market decides its direction.
Technically, resistance is at $84,610. If the price can hold above this level, the opportunity to move toward the upside level of $84,700 opens up widely. Conversely, if the price falls below the critical support of $84,550, short-term bullish momentum will weaken and trading will become unsafe.
From a macro perspective, the US employment report shows 290,000 new jobs. This labor data can affect expectations for The Fed’s interest rates; if rates are cut, it becomes a positive sentiment for Bitcoin. In addition, institutional demand remains high, with BlackRock leading the flow of large funds into Bitcoin ETFs.
Current trading strategy: Don’t FOMO, wait for confirmation, and remember that cash is a position. Stay disciplined, do your analysis, and remain consistent. Always trade smart, not emotional!
5
214
Log in to explore more content
Join global crypto users on Binance Square
⚡️ Get latest and useful information about crypto.
💬 Trusted by the world’s largest crypto exchange.
👍 Discover real insights from verified creators.
Email / Phone number
Trending Topics
BinancePick
2.6M views
139,849 Discussing
Join #EarningsSeason: Predict Earnings on Binance Pick, Share Your Take on Binance Square!
Binance Square Official
·400 Likes
·337.8k views
EarningsSeason
5M views
24,133 Discussing
FranklinTempletonFilesForTwoDividendToBitcoinETFs
0 views
0 Discussing