
AlphaCryptoSignal
792 Posts

AlphaCryptoSignal
Report
Block User
27 combined years in crypto, surviving drops and lost passwords. Real insights to keep your portfolio thriving | X: @AlphaCryptoSign
4 Following
5.4K+ Followers
1.2K+ Liked
Posts
All
Quotes
·
--
Bullish
Chart Request: #ENA
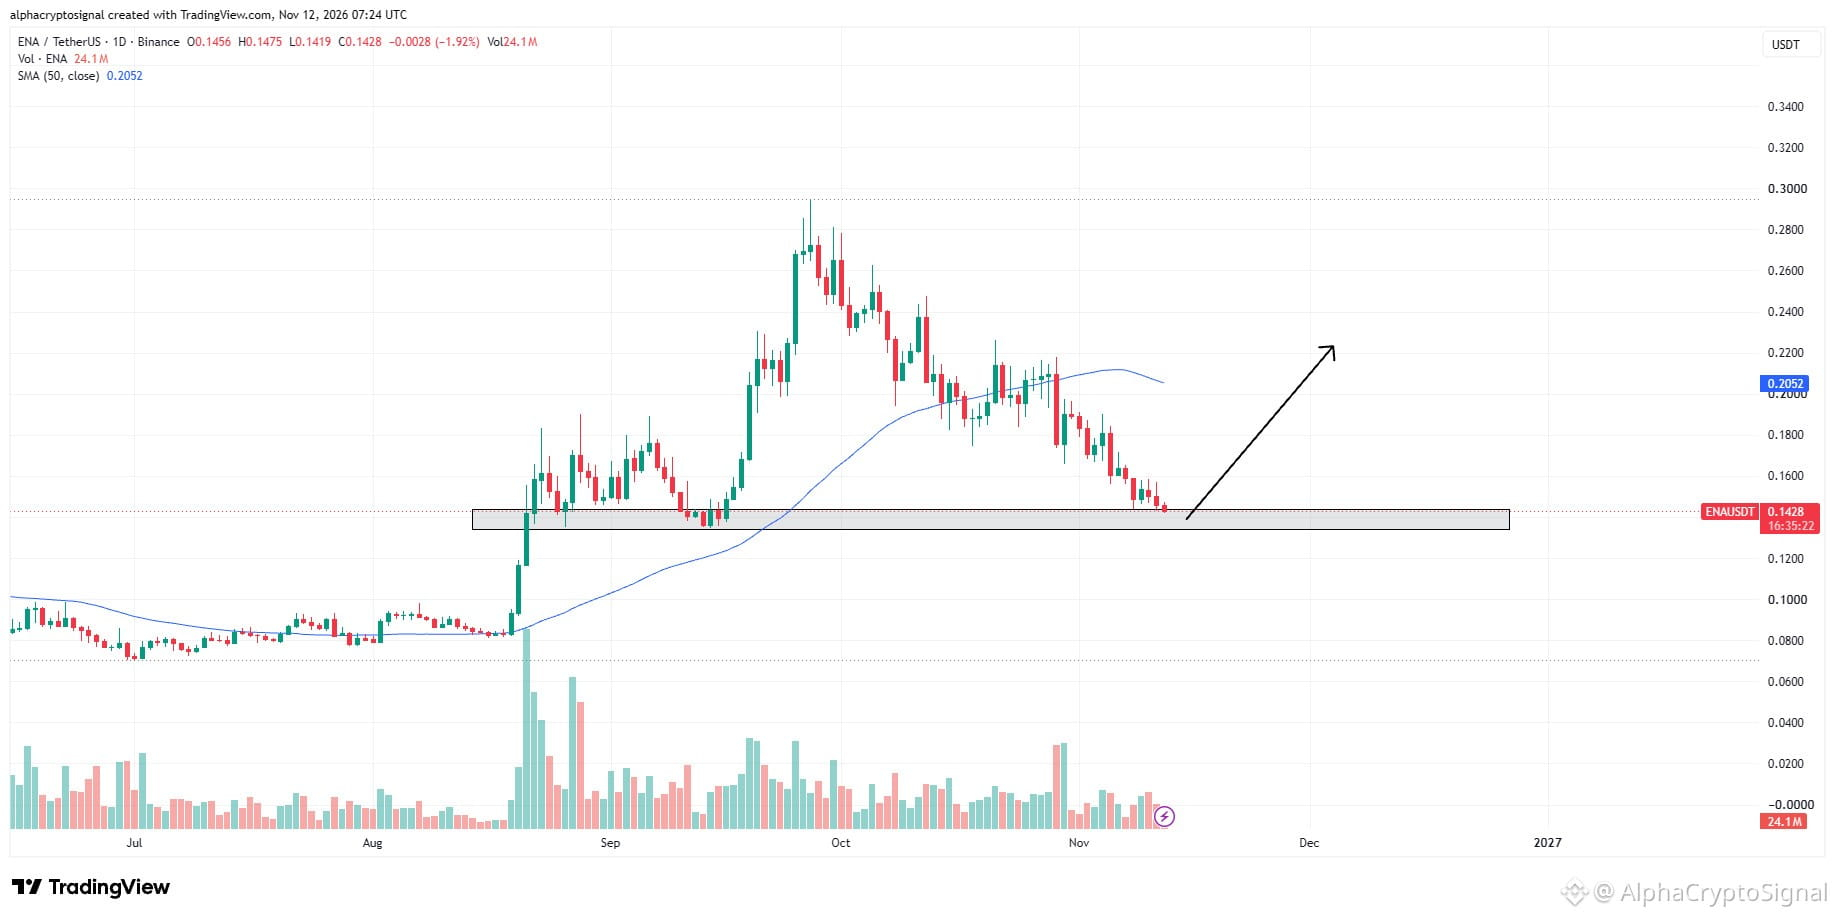
$ENA is back at a key mid-term support zone after an extended correction. This is an important area to watch for a potential reversal.
A bounce from here could set up another move higher, provided the support holds and $BTC manages to reclaim its weekly MA50.
{future}(ENAUSDT)
Chart Request: #ENA
$ENA is back at a key mid-term support zone after an extended correction. This is an important area to watch for a potential reversal.
A bounce from here could set up another move higher, provided the support holds and $BTC manages to reclaim its weekly MA50.
$ENA is back at a key mid-term support zone after an extended correction. This is an important area to watch for a potential reversal.
A bounce from here could set up another move higher, provided the support holds and $BTC manages to reclaim its weekly MA50.
541
·
--
Bullish
Thoughts on #BTC
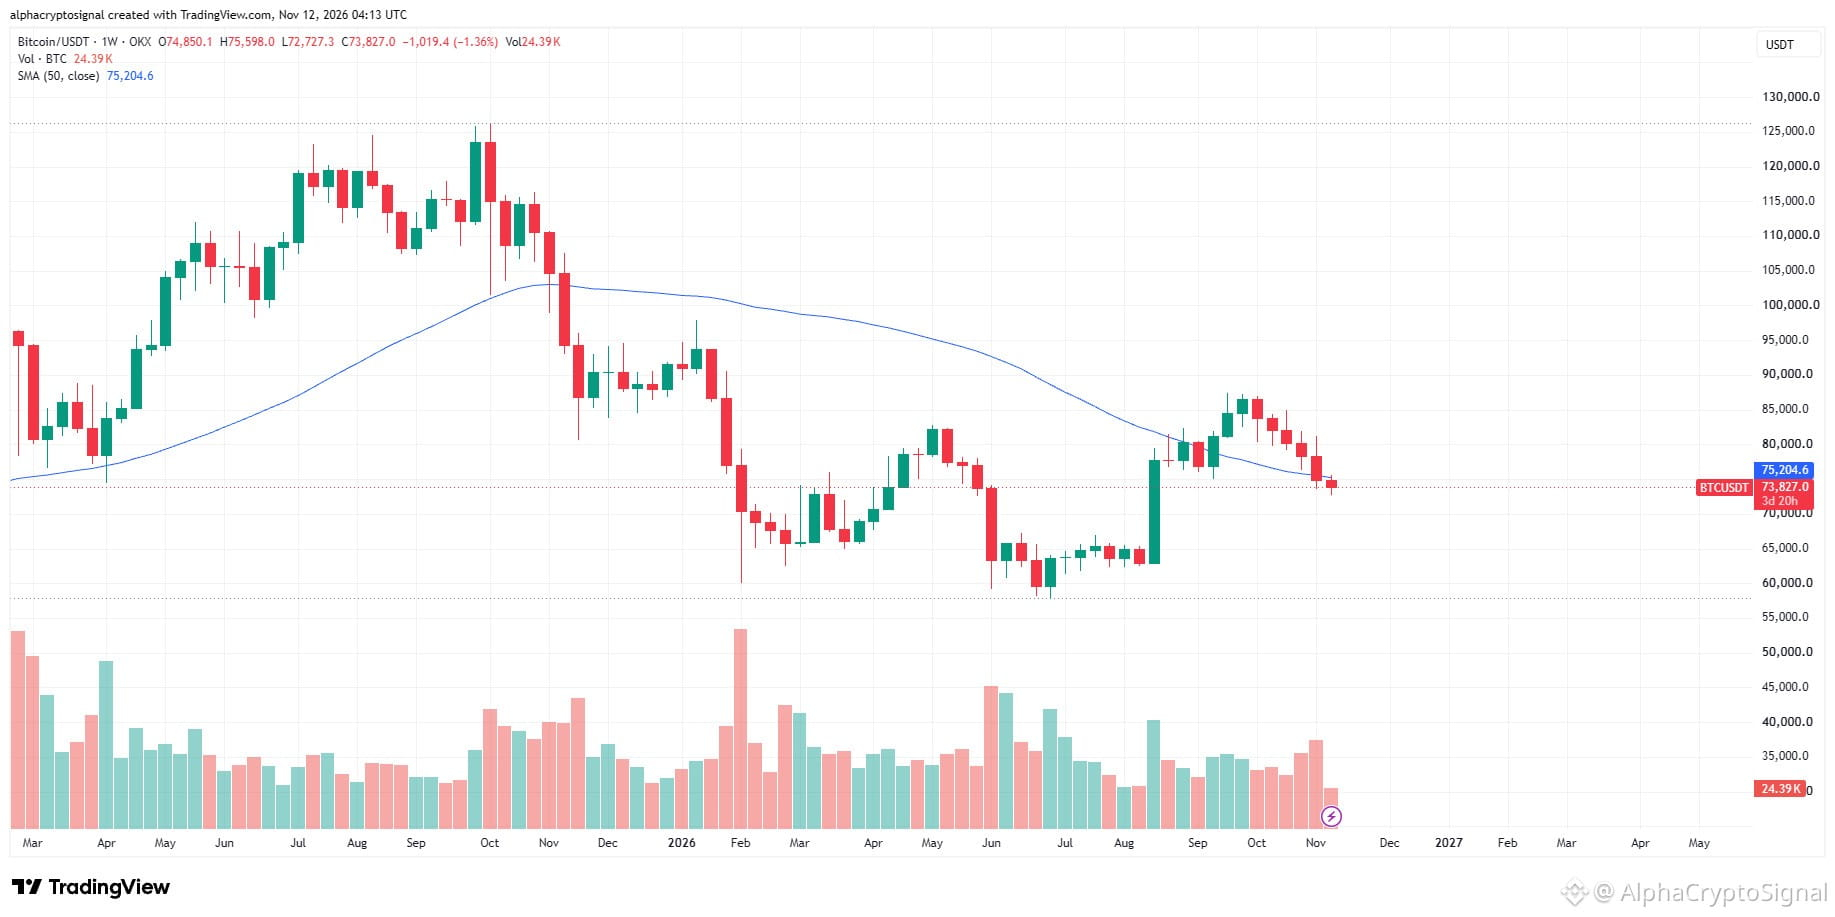
$BTC is approaching a critical decision point, with all eyes on the weekly 50 SMA. A confirmed weekly close below this level would be a major warning sign and could signal a deeper correction, potentially shifting the broader market structure back towards bearish territory.
On the other hand, a quick reclaim of the weekly 50 SMA would keep the bullish scenario alive and could restore confidence in the market. The next weekly close is crucial. This is a level worth watching closely.
{future}(BTCUSDT)
Thoughts on #BTC
$BTC is approaching a critical decision point, with all eyes on the weekly 50 SMA. A confirmed weekly close below this level would be a major warning sign and could signal a deeper correction, potentially shifting the broader market structure back towards bearish territory.
On the other hand, a quick reclaim of the weekly 50 SMA would keep the bullish scenario alive and could restore confidence in the market. The next weekly close is crucial. This is a level worth watching closely.
$BTC is approaching a critical decision point, with all eyes on the weekly 50 SMA. A confirmed weekly close below this level would be a major warning sign and could signal a deeper correction, potentially shifting the broader market structure back towards bearish territory.
On the other hand, a quick reclaim of the weekly 50 SMA would keep the bullish scenario alive and could restore confidence in the market. The next weekly close is crucial. This is a level worth watching closely.
78
·
--
Bullish
#POL Update 🏆
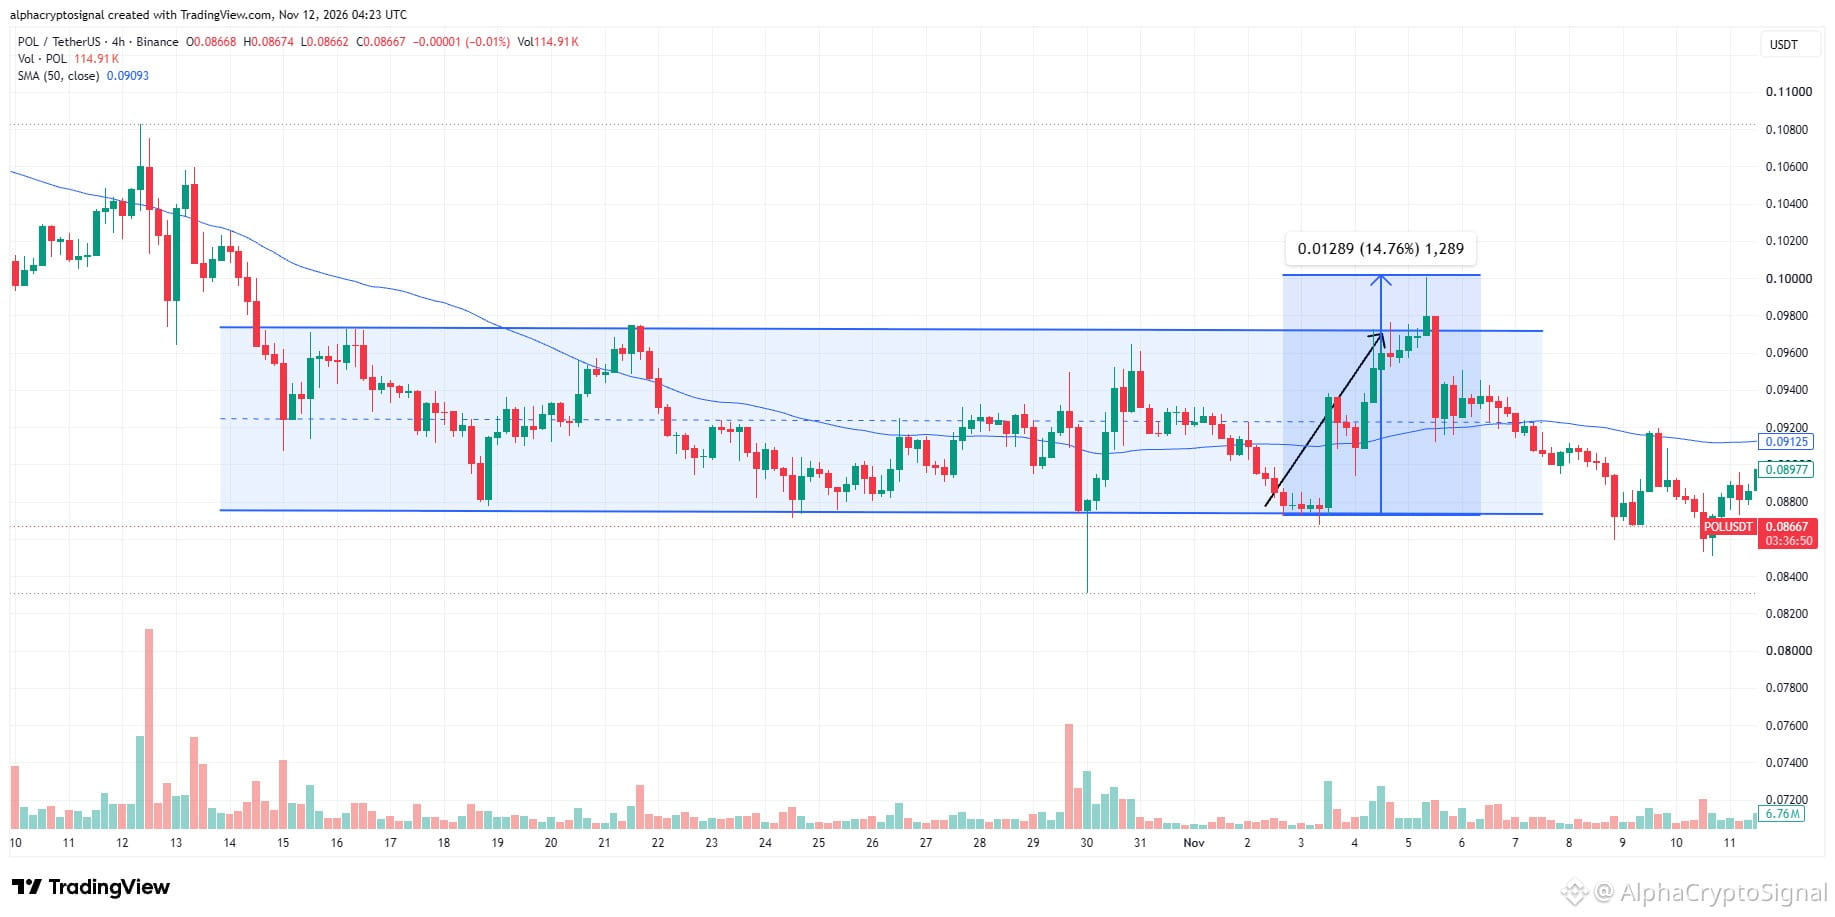
The horizontal channel setup we flagged on $POL played out cleanly. $POL tapped the lower boundary exactly where we were watching and triggered the bounce toward the upper range.
From that bottom zone, $POL delivered a solid +14.76% move before reversing again. Congratulations to everyone who followed.
{future}(POLUSDT)
#POL Update 🏆
The horizontal channel setup we flagged on $POL played out cleanly. $POL tapped the lower boundary exactly where we were watching and triggered the bounce toward the upper range.
From that bottom zone, $POL delivered a solid +14.76% move before reversing again. Congratulations to everyone who followed.
The horizontal channel setup we flagged on $POL played out cleanly. $POL tapped the lower boundary exactly where we were watching and triggered the bounce toward the upper range.
From that bottom zone, $POL delivered a solid +14.76% move before reversing again. Congratulations to everyone who followed.
1
407
·
--
Bullish
Chart Request: #İNJ
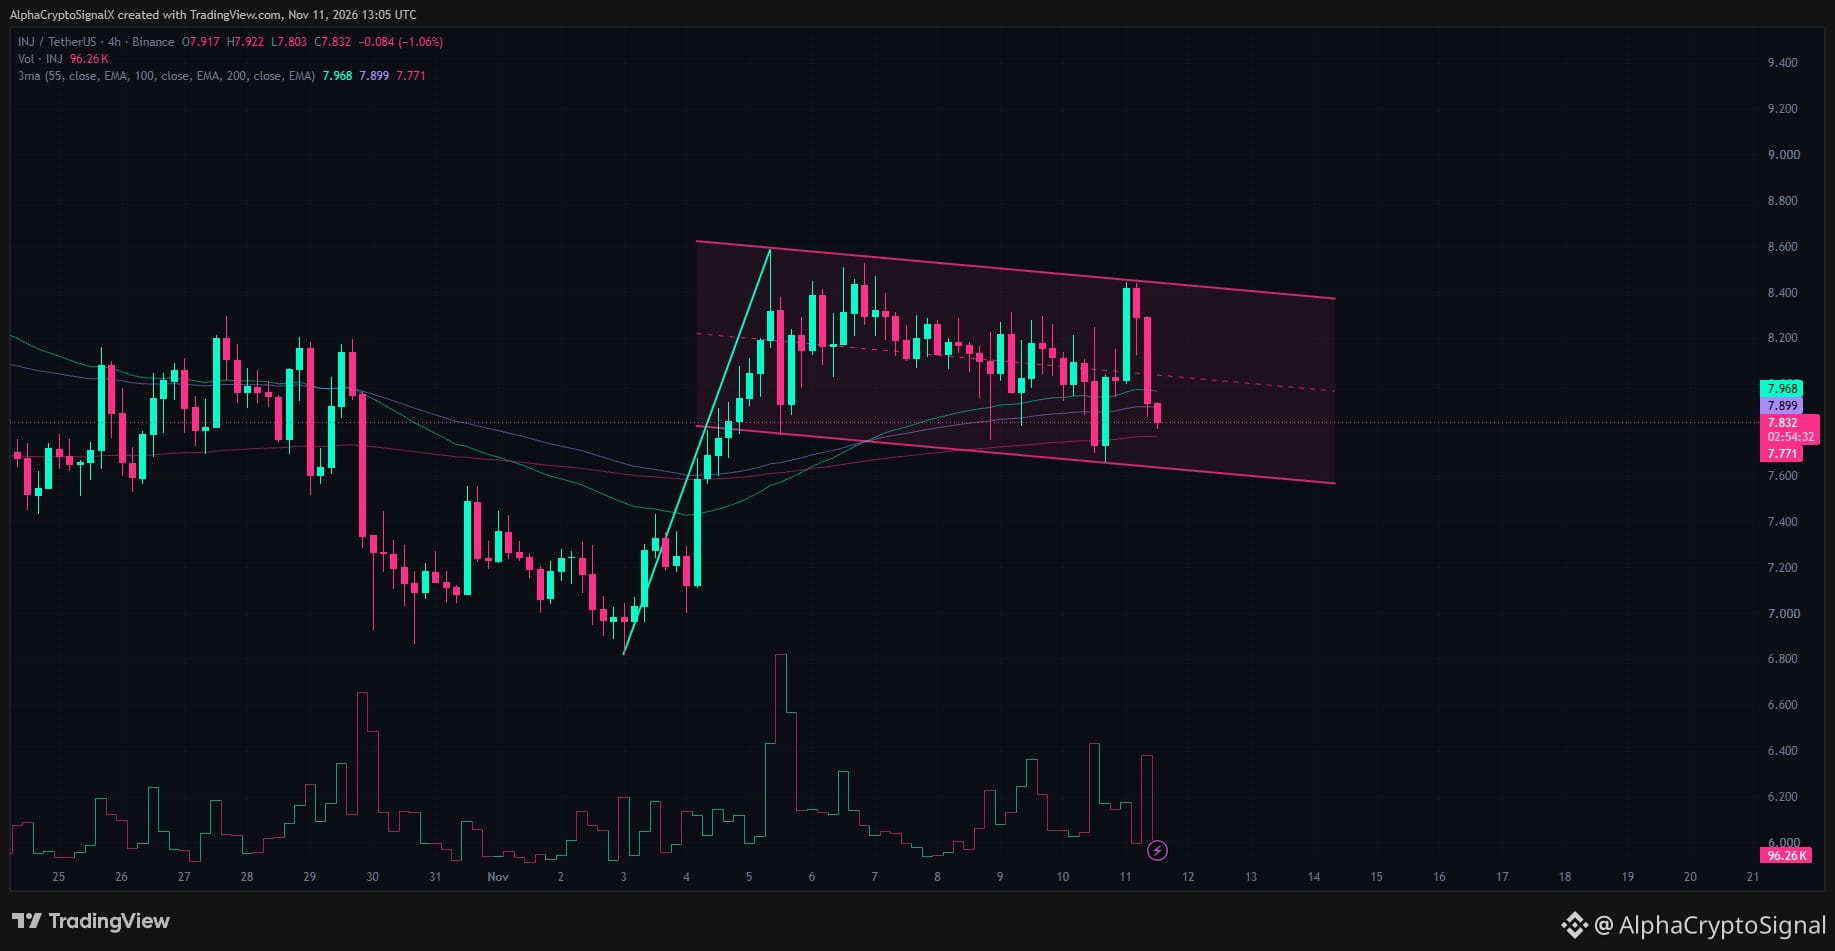
$INJ is consolidating within a bull flag pattern on the 4-hour timeframe following a strong vertical impulse, holding support right near its key exponential moving averages.
$INJ tests dynamic support, acting as overhead resistance inside the flag channel. A high-volume breakout and 4-hour close above the 55 EMA (~$7.97) triggers the flag continuation toward $9.00–$9.40.
{future}(INJUSDT)
Chart Request: #İNJ
$INJ is consolidating within a bull flag pattern on the 4-hour timeframe following a strong vertical impulse, holding support right near its key exponential moving averages.
$INJ tests dynamic support, acting as overhead resistance inside the flag channel. A high-volume breakout and 4-hour close above the 55 EMA (~$7.97) triggers the flag continuation toward $9.00–$9.40.
$INJ is consolidating within a bull flag pattern on the 4-hour timeframe following a strong vertical impulse, holding support right near its key exponential moving averages.
$INJ tests dynamic support, acting as overhead resistance inside the flag channel. A high-volume breakout and 4-hour close above the 55 EMA (~$7.97) triggers the flag continuation toward $9.00–$9.40.
382
·
--
Bullish
Thoughts on #GRAM
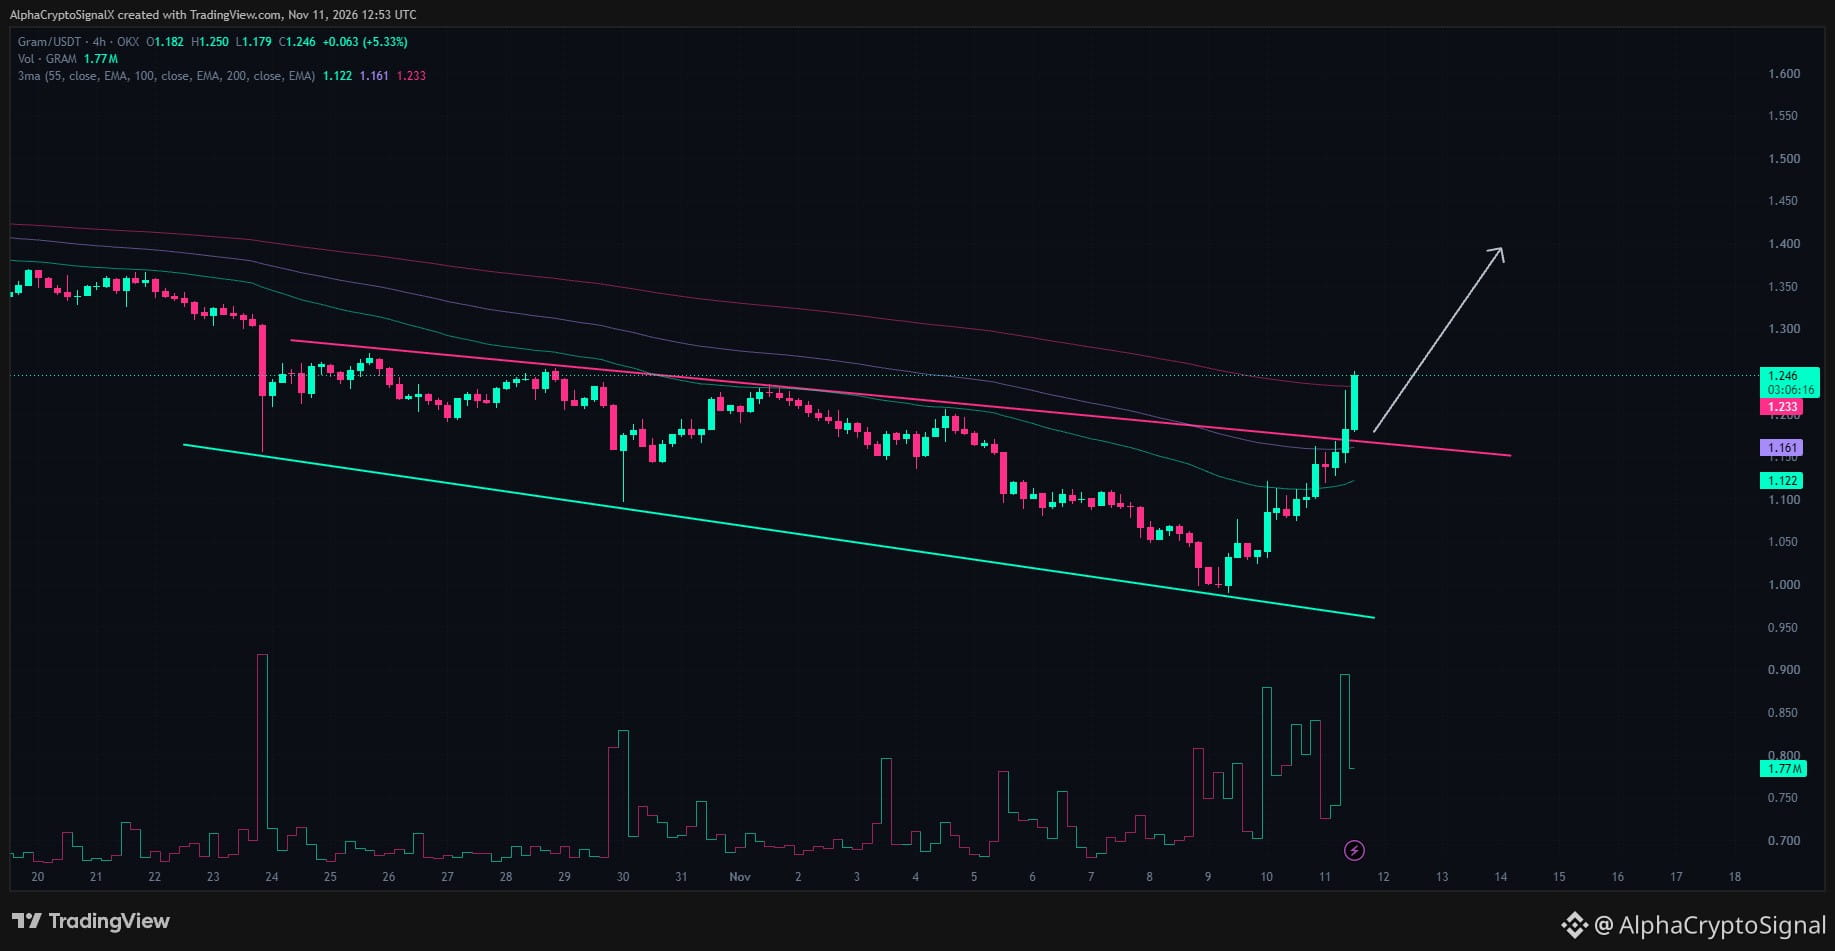
$GRAM has staged a news-driven impulsive breakout above the upper descending trendline of its 4-hour descending broadening wedge, supported by a strong influx of volume.
$GRAM has reclaimed the entire exponential moving average stack in a single expansion leg, pushing past the 55 EMA, 100 EMA, and 200 EMA. Maintaining a 4-hour close above the 200 EMA confirms bullish continuation, setting up a target expansion move toward the $1.38–$1.40 liquidity zone.
{future}(GRAMUSDT)
Thoughts on #GRAM
$GRAM has staged a news-driven impulsive breakout above the upper descending trendline of its 4-hour descending broadening wedge, supported by a strong influx of volume.
$GRAM has reclaimed the entire exponential moving average stack in a single expansion leg, pushing past the 55 EMA, 100 EMA, and 200 EMA. Maintaining a 4-hour close above the 200 EMA confirms bullish continuation, setting up a target expansion move toward the $1.38–$1.40 liquidity zone.
$GRAM has staged a news-driven impulsive breakout above the upper descending trendline of its 4-hour descending broadening wedge, supported by a strong influx of volume.
$GRAM has reclaimed the entire exponential moving average stack in a single expansion leg, pushing past the 55 EMA, 100 EMA, and 200 EMA. Maintaining a 4-hour close above the 200 EMA confirms bullish continuation, setting up a target expansion move toward the $1.38–$1.40 liquidity zone.
1
683
·
--
Bullish
#PHA LTF Analysis:
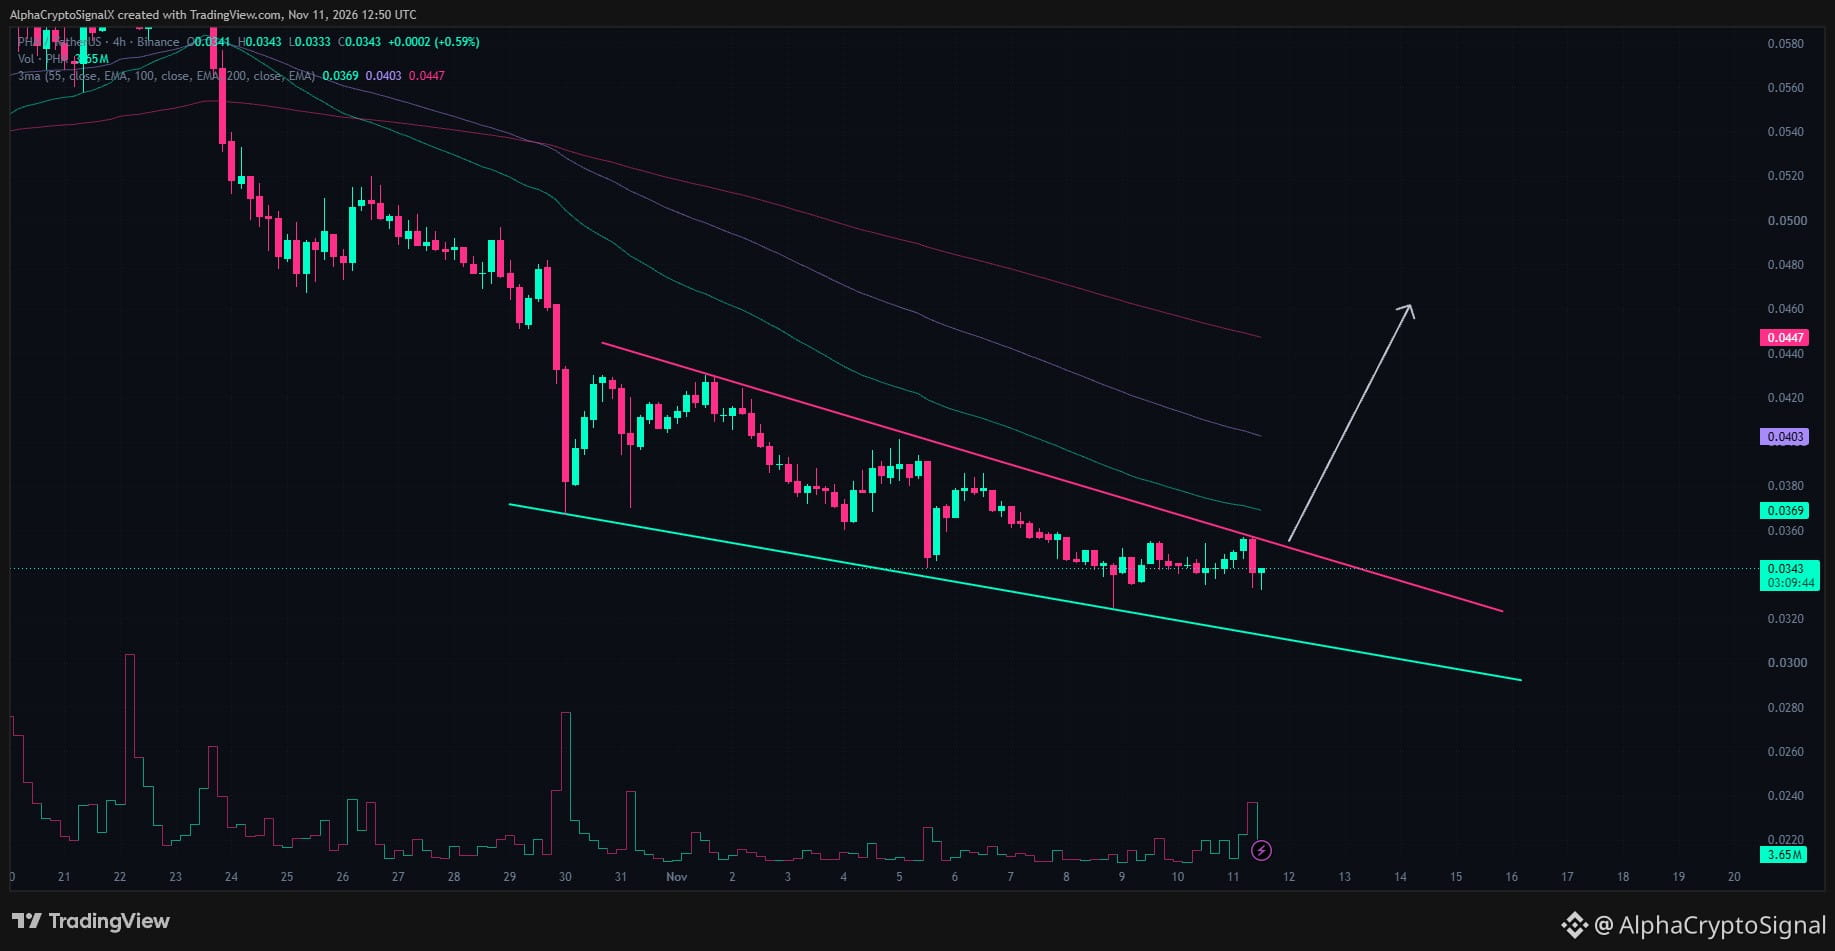
$PHA is consolidating near the lower boundary of a 4-hour descending wedge ($0.032–$0.033), pinned under dynamic resistance.
A high-volume breakout above the upper trendline and 55 EMA (~$0.0369) confirms the reversal on $PHA , targeting the 100/200 EMAs near $0.040 and $0.046+.
{future}(PHAUSDT)
#PHA LTF Analysis:
$PHA is consolidating near the lower boundary of a 4-hour descending wedge ($0.032–$0.033), pinned under dynamic resistance.
A high-volume breakout above the upper trendline and 55 EMA (~$0.0369) confirms the reversal on $PHA , targeting the 100/200 EMAs near $0.040 and $0.046+.
$PHA is consolidating near the lower boundary of a 4-hour descending wedge ($0.032–$0.033), pinned under dynamic resistance.
A high-volume breakout above the upper trendline and 55 EMA (~$0.0369) confirms the reversal on $PHA , targeting the 100/200 EMAs near $0.040 and $0.046+.
245
·
--
Bullish
Chart Request: #ONDO
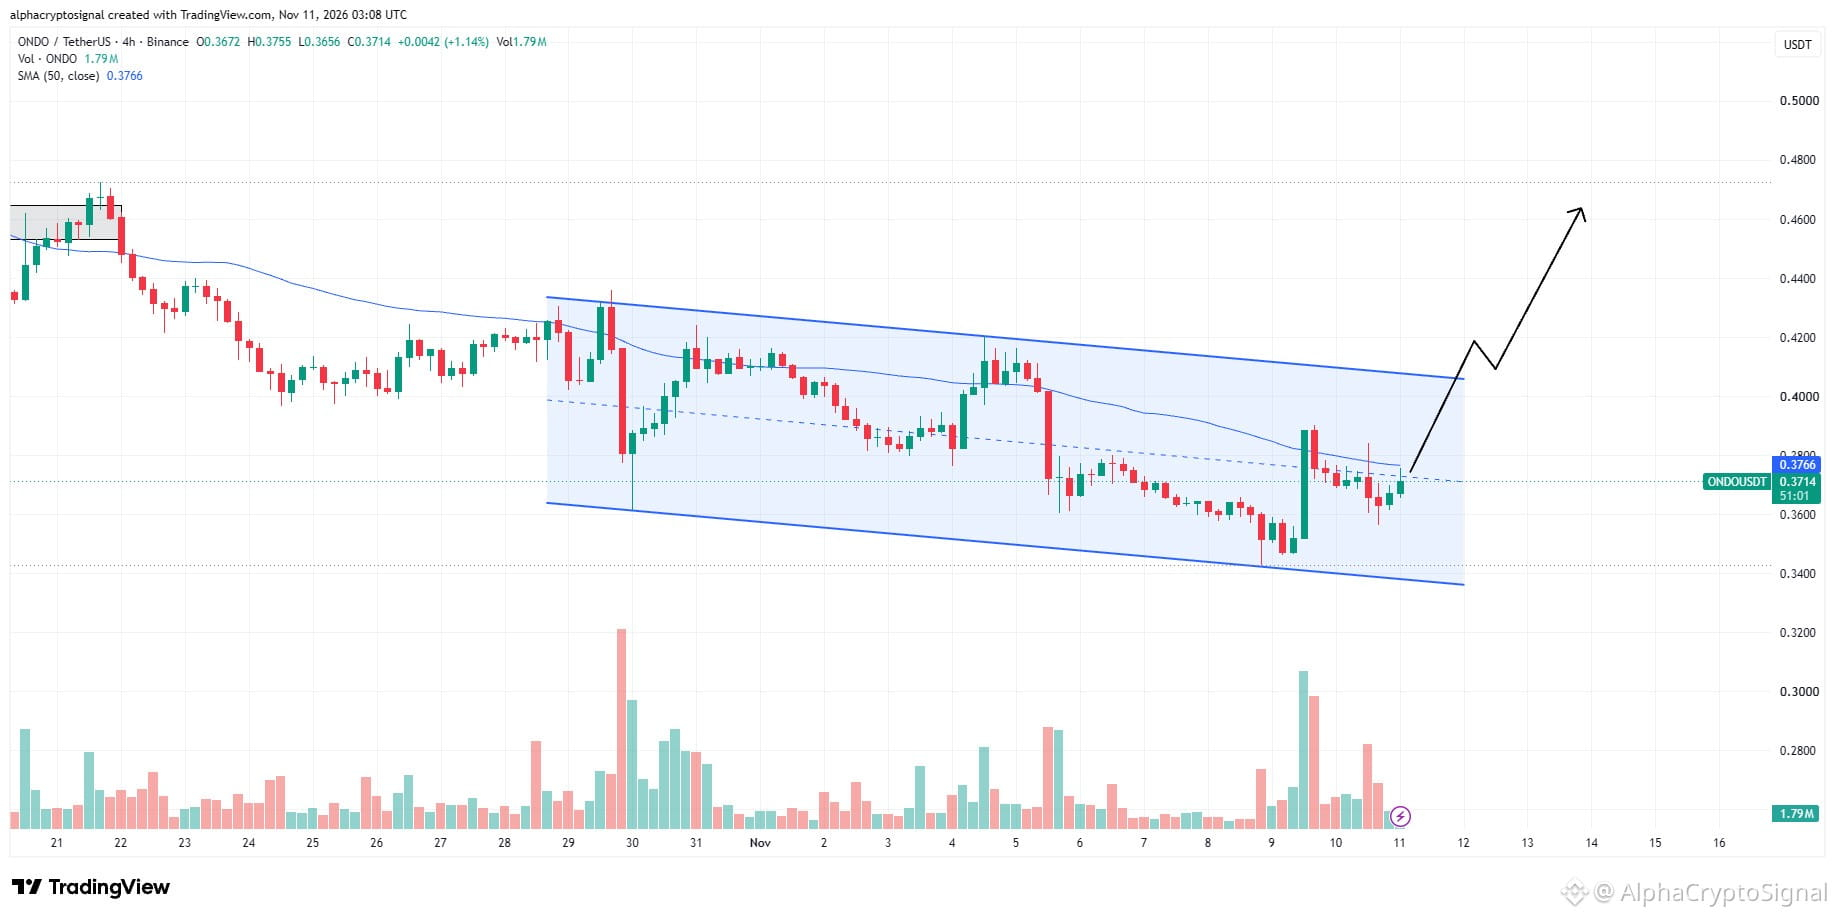
$ONDO is trading inside a descending channel on the 4H timeframe, with price attempting to recover from the lower half of the structure. The midline is the key level to watch.
A clean reclaim and hold above the midline could open the door for further upside toward the channel's upper boundary and previous swing highs for $ONDO . Watching for confirmation.
{future}(ONDOUSDT)
Chart Request: #ONDO
$ONDO is trading inside a descending channel on the 4H timeframe, with price attempting to recover from the lower half of the structure. The midline is the key level to watch.
A clean reclaim and hold above the midline could open the door for further upside toward the channel's upper boundary and previous swing highs for $ONDO . Watching for confirmation.
$ONDO is trading inside a descending channel on the 4H timeframe, with price attempting to recover from the lower half of the structure. The midline is the key level to watch.
A clean reclaim and hold above the midline could open the door for further upside toward the channel's upper boundary and previous swing highs for $ONDO . Watching for confirmation.
1
531
·
--
Bullish
Thoughts on #ETHFI
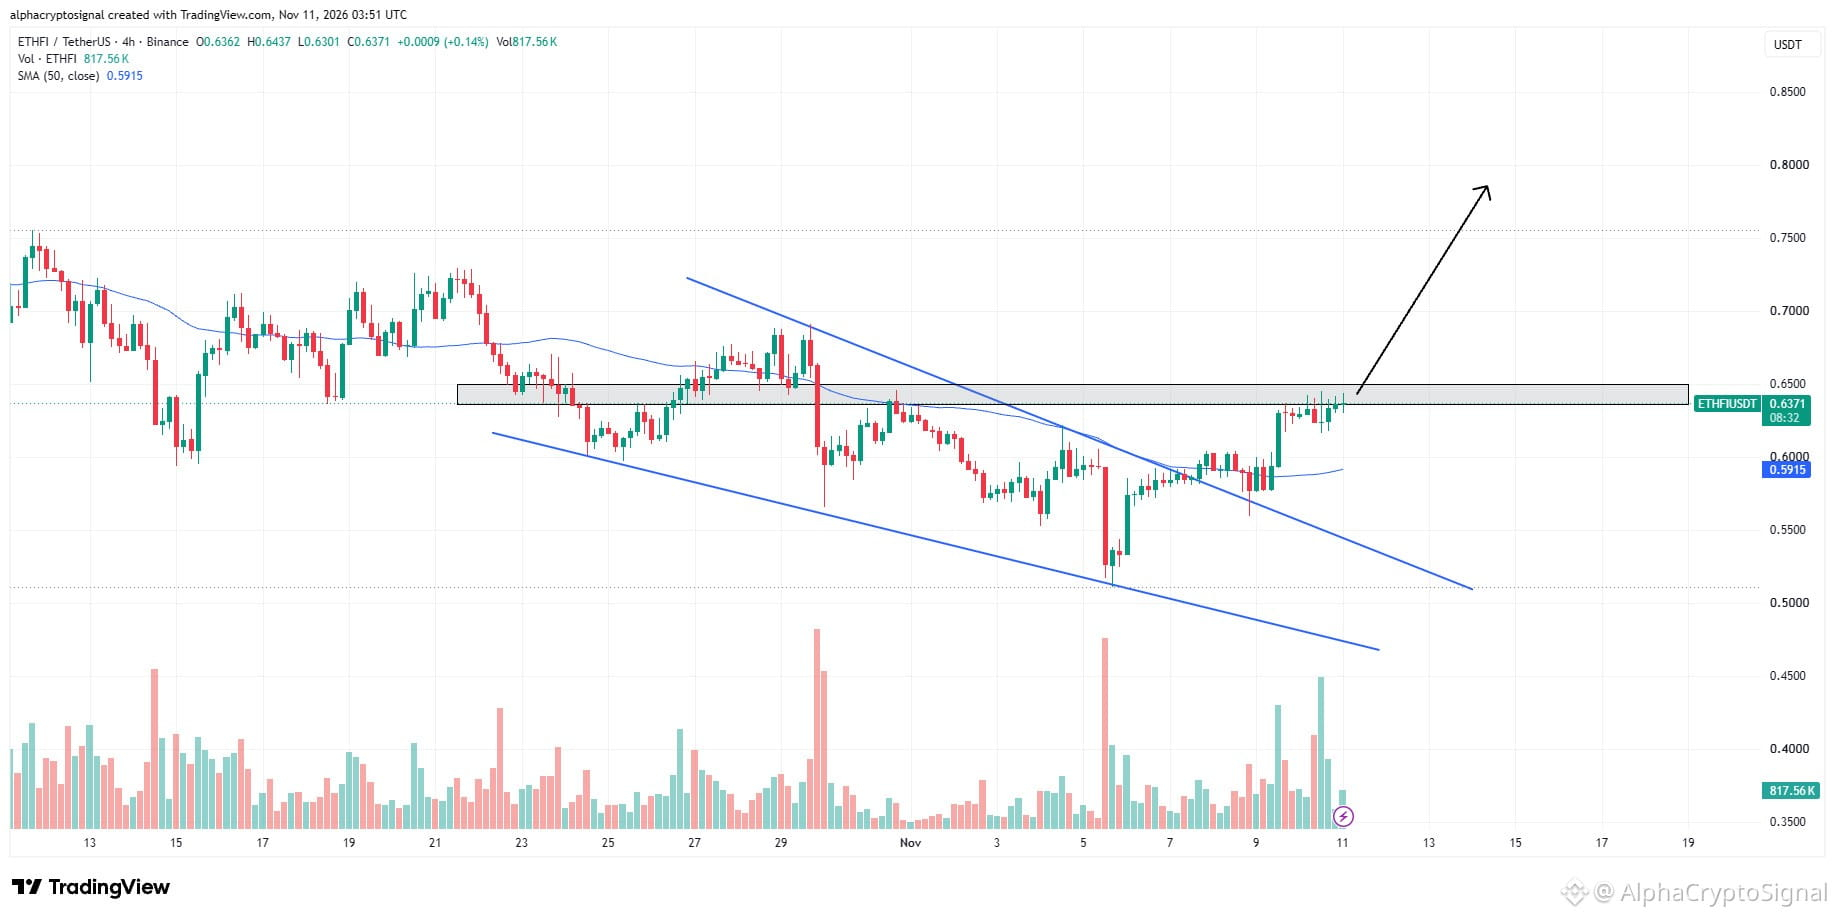
$ETHFI has broken out of its falling wedge and is now approaching a key horizontal resistance zone. Momentum is improving, with price pushing back above the 50 SMA.
Looking for a clean reclaim and flip of this horizontal level into support. A successful breakout could open the door for further upside and continuation towards higher resistance. Keeping $ETHFI on the radar.
{future}(ETHFIUSDT)
Thoughts on #ETHFI
$ETHFI has broken out of its falling wedge and is now approaching a key horizontal resistance zone. Momentum is improving, with price pushing back above the 50 SMA.
Looking for a clean reclaim and flip of this horizontal level into support. A successful breakout could open the door for further upside and continuation towards higher resistance. Keeping $ETHFI on the radar.
$ETHFI has broken out of its falling wedge and is now approaching a key horizontal resistance zone. Momentum is improving, with price pushing back above the 50 SMA.
Looking for a clean reclaim and flip of this horizontal level into support. A successful breakout could open the door for further upside and continuation towards higher resistance. Keeping $ETHFI on the radar.
1
416
·
--
Bullish
#İNJ LTF Analysis:
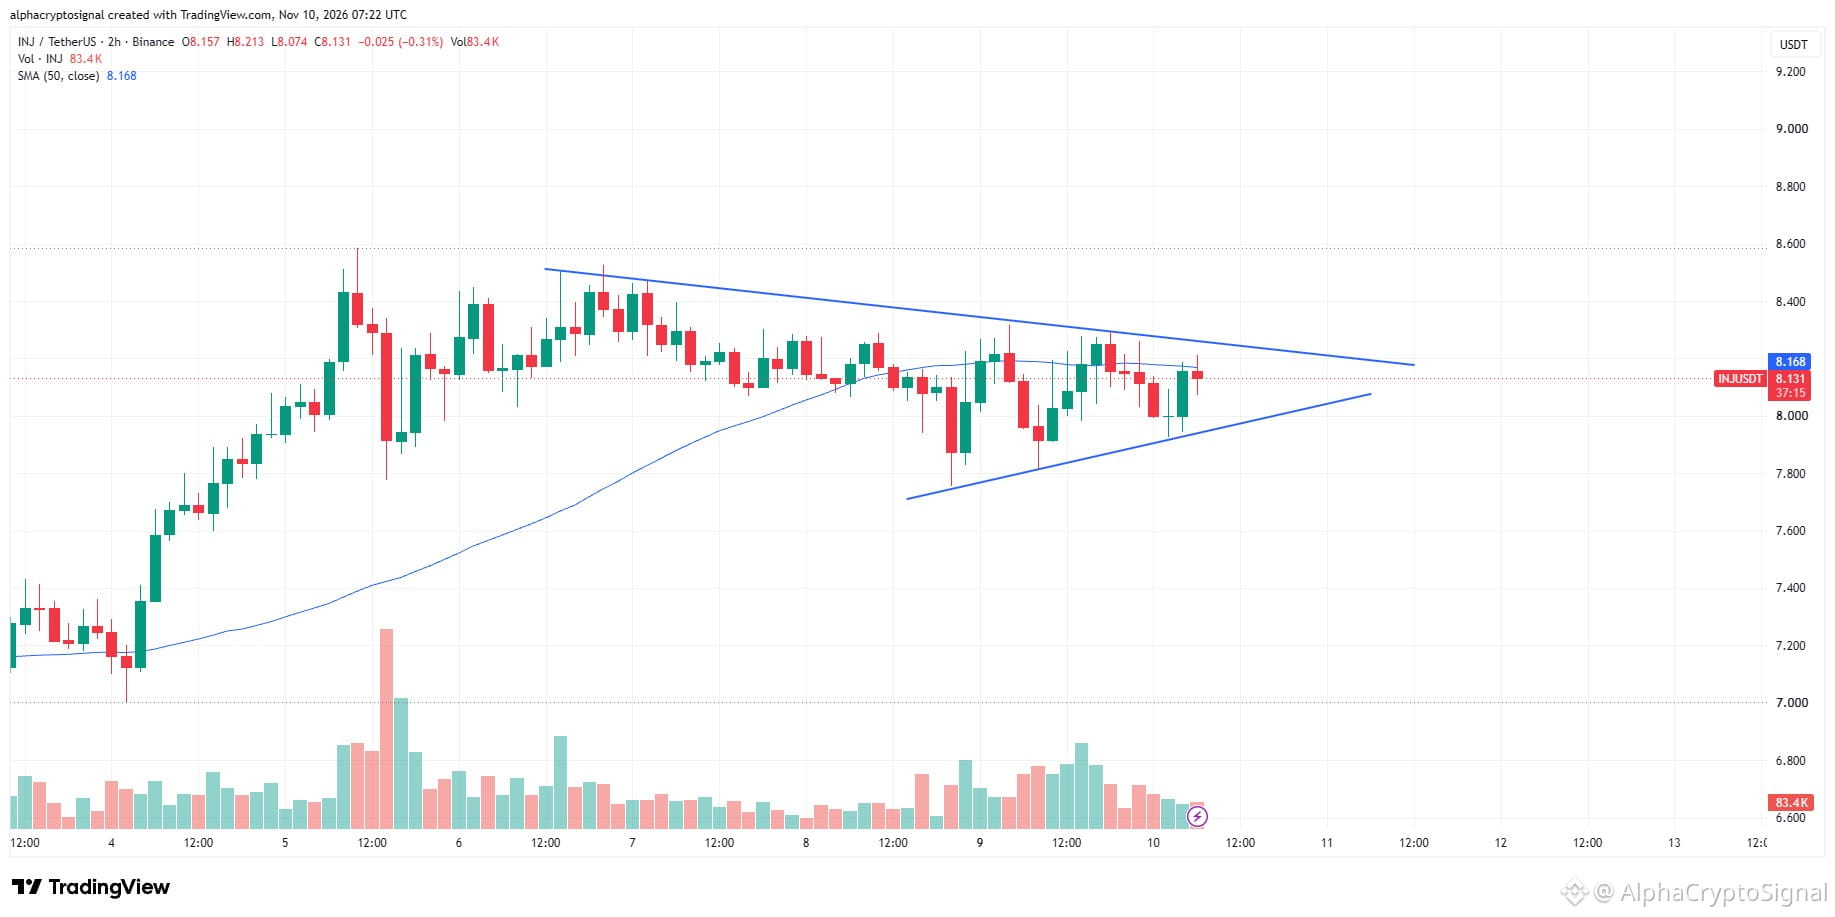
$INJ is consolidating inside a symmetrical triangle on the 2H timeframe, with price getting squeezed between converging trendlines. The structure is approaching its apex, suggesting a potential breakout is getting closer.
Looking for an upside breakout with confirmation. A clean move above the upper trendline could open the door for further upside. Keeping $INJ on the radar.
{future}(INJUSDT)
#İNJ LTF Analysis:
$INJ is consolidating inside a symmetrical triangle on the 2H timeframe, with price getting squeezed between converging trendlines. The structure is approaching its apex, suggesting a potential breakout is getting closer.
Looking for an upside breakout with confirmation. A clean move above the upper trendline could open the door for further upside. Keeping $INJ on the radar.
$INJ is consolidating inside a symmetrical triangle on the 2H timeframe, with price getting squeezed between converging trendlines. The structure is approaching its apex, suggesting a potential breakout is getting closer.
Looking for an upside breakout with confirmation. A clean move above the upper trendline could open the door for further upside. Keeping $INJ on the radar.
271
·
--
Bullish
Thoughts on #AVAX
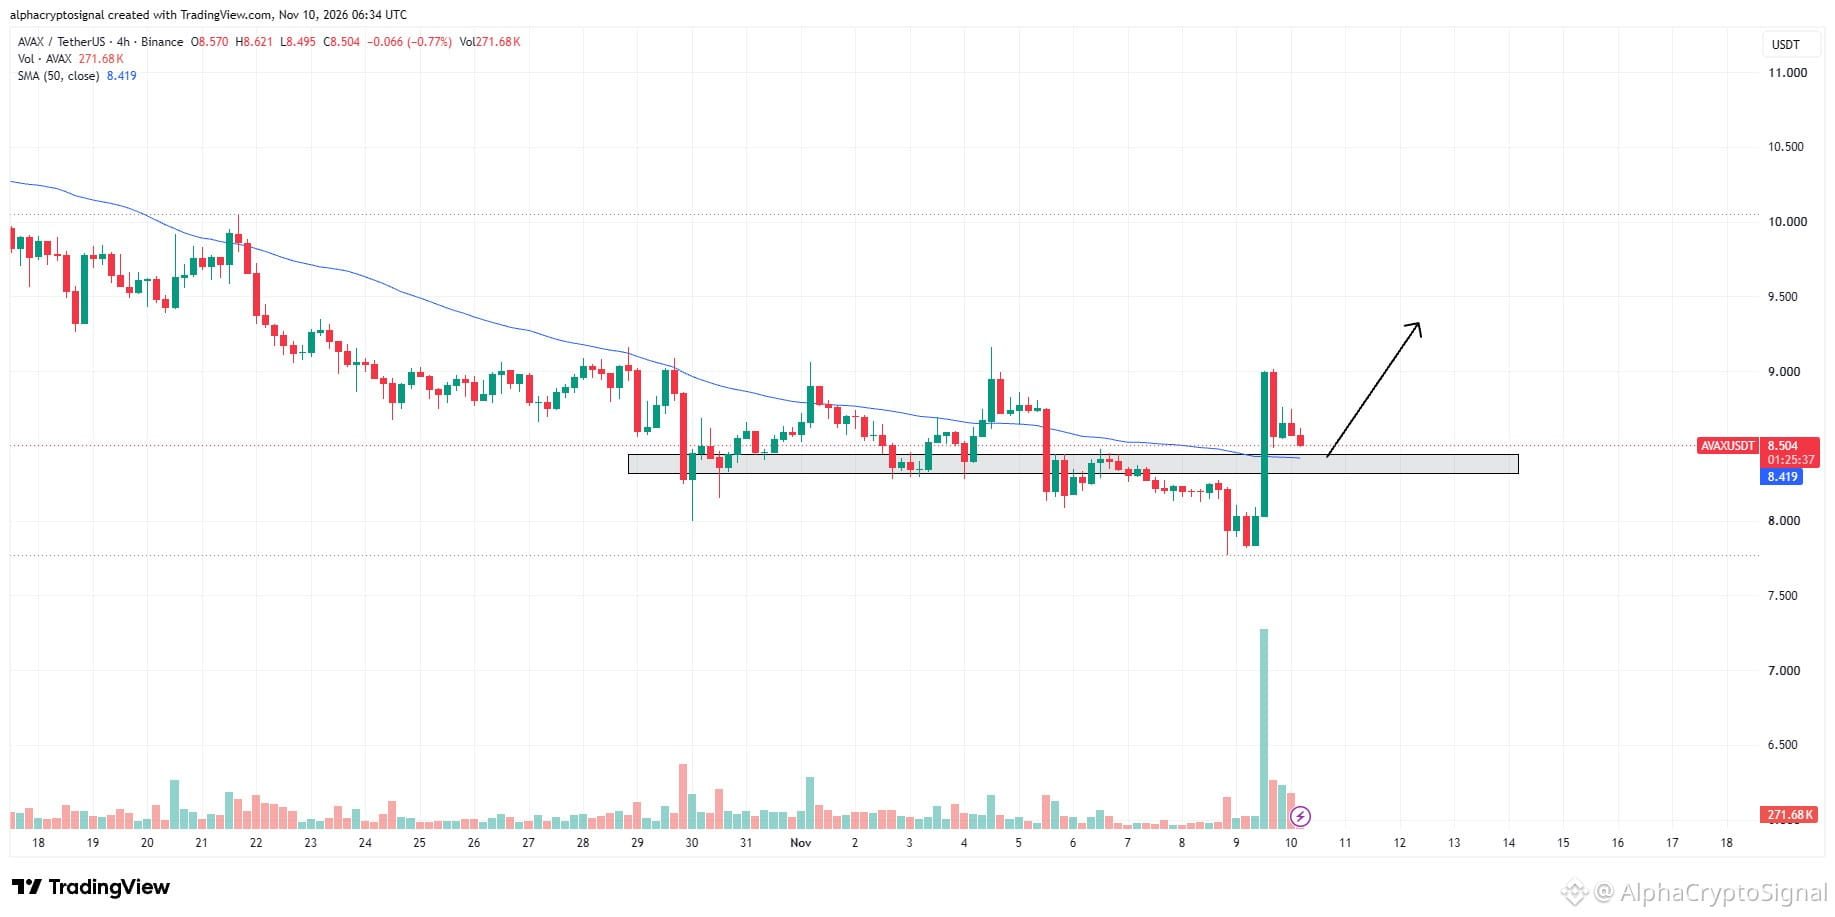
$AVAX has reclaimed a key horizontal resistance with a strong volume-backed move. $AVAX is now pulling back towards the breakout zone, which could act as support.
Looking for a retest and hold of this level for continuation towards higher resistance. If buyers defend the zone, another leg up could be on the cards.
{future}(AVAXUSDT)
Thoughts on #AVAX
$AVAX has reclaimed a key horizontal resistance with a strong volume-backed move. $AVAX is now pulling back towards the breakout zone, which could act as support.
Looking for a retest and hold of this level for continuation towards higher resistance. If buyers defend the zone, another leg up could be on the cards.
$AVAX has reclaimed a key horizontal resistance with a strong volume-backed move. $AVAX is now pulling back towards the breakout zone, which could act as support.
Looking for a retest and hold of this level for continuation towards higher resistance. If buyers defend the zone, another leg up could be on the cards.
212
·
--
Bullish
#AR LTF Analysis:
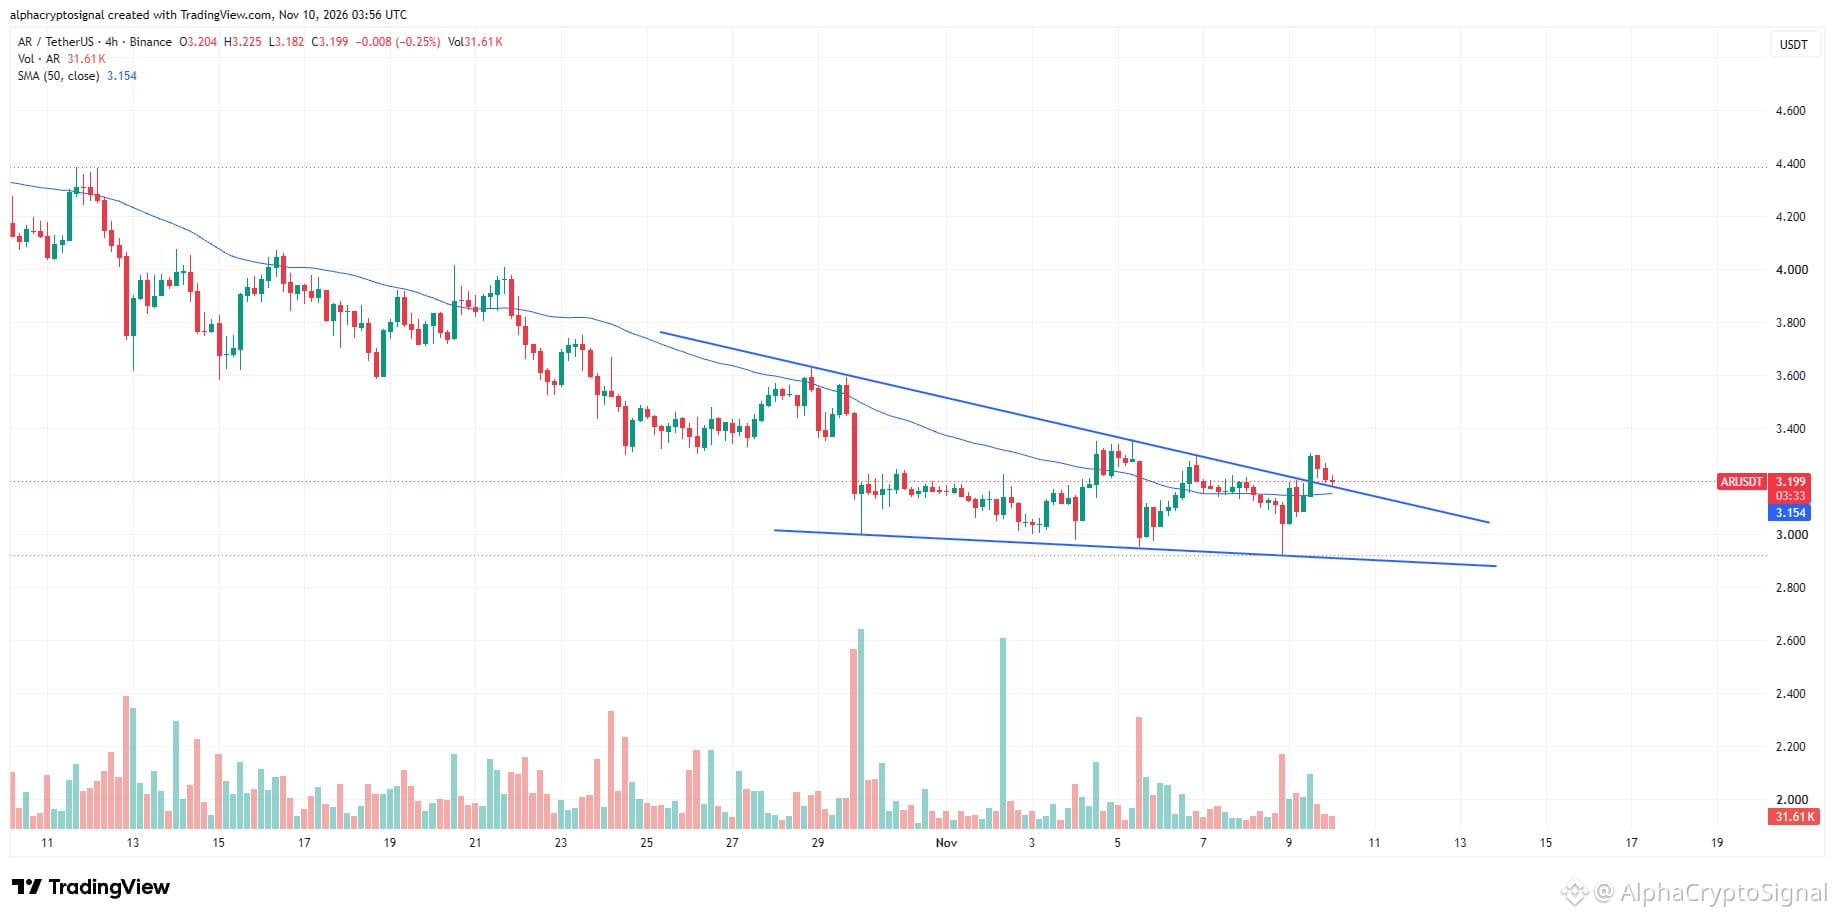
$AR has broken out of its falling wedge and is now retesting the breakout zone. Looking for this level to hold as support before considering a long entry on $AR . A successful retest could open the door for further upside.
{future}(ARUSDT)
#AR LTF Analysis:
$AR has broken out of its falling wedge and is now retesting the breakout zone. Looking for this level to hold as support before considering a long entry on $AR . A successful retest could open the door for further upside.
$AR has broken out of its falling wedge and is now retesting the breakout zone. Looking for this level to hold as support before considering a long entry on $AR . A successful retest could open the door for further upside.
1
405
·
--
Bullish
Thoughts on #JUP
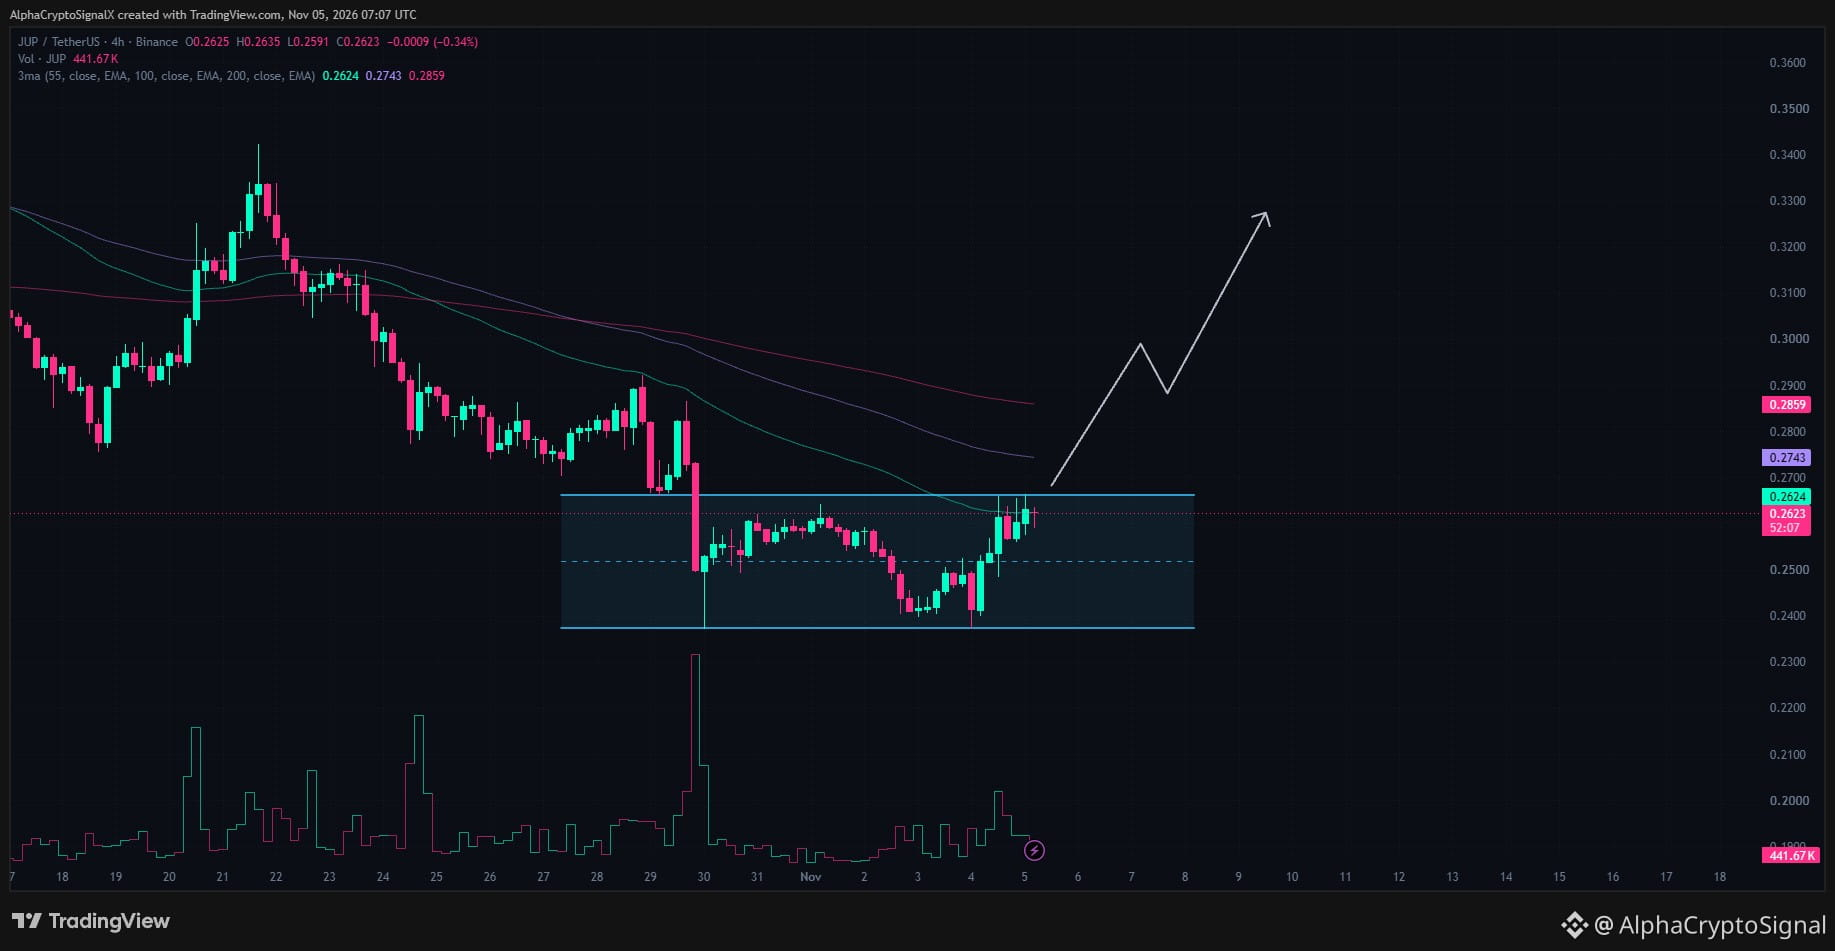
$JUP is consolidating within a tight horizontal range ($0.238–$0.266) on the 4-hour timeframe, testing the upper range resistance near the 55 EMA (~$0.2624).
A decisive high-volume 4-hour breakout above $0.266 will confirm the expansion for $JUP , targeting the 100 EMA (~$0.2743) and 200 EMA (~$0.2859) before pushing toward $0.330+.
{future}(JUPUSDT)
Thoughts on #JUP
$JUP is consolidating within a tight horizontal range ($0.238–$0.266) on the 4-hour timeframe, testing the upper range resistance near the 55 EMA (~$0.2624).
A decisive high-volume 4-hour breakout above $0.266 will confirm the expansion for $JUP , targeting the 100 EMA (~$0.2743) and 200 EMA (~$0.2859) before pushing toward $0.330+.
$JUP is consolidating within a tight horizontal range ($0.238–$0.266) on the 4-hour timeframe, testing the upper range resistance near the 55 EMA (~$0.2624).
A decisive high-volume 4-hour breakout above $0.266 will confirm the expansion for $JUP , targeting the 100 EMA (~$0.2743) and 200 EMA (~$0.2859) before pushing toward $0.330+.
142
·
--
Bullish
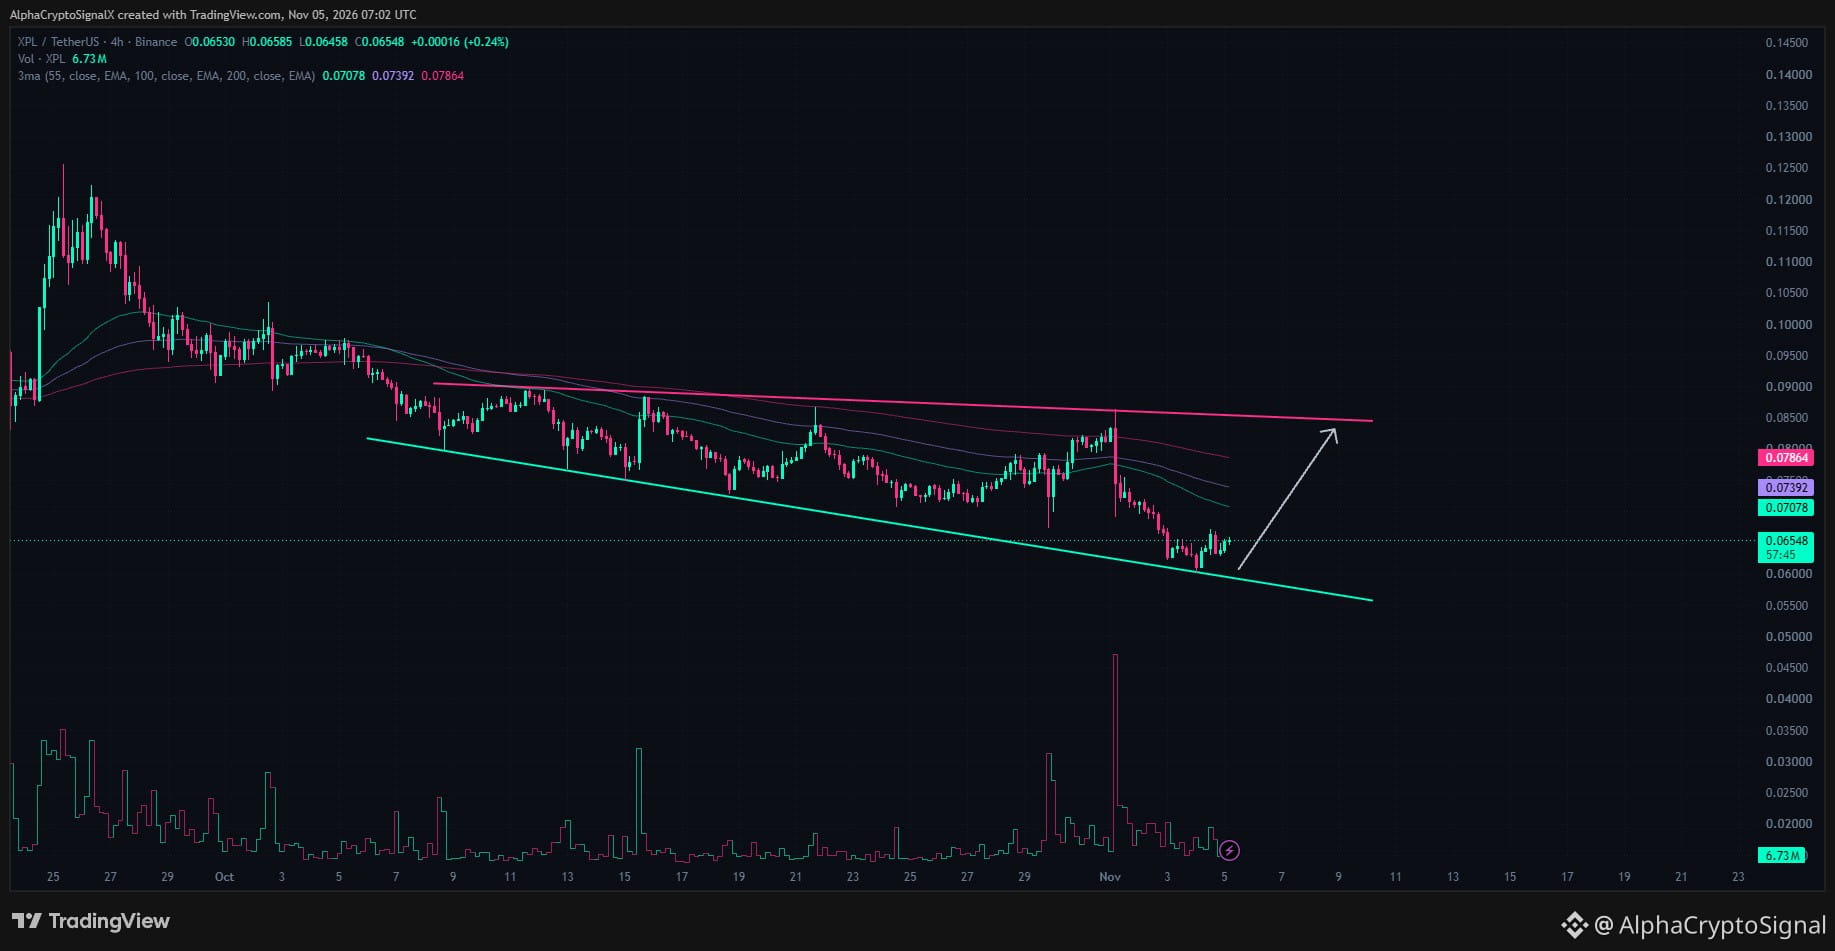
#XPL LTF Analysis:
$XPL is trading within a descending broadening wedge structure on the 4-hour timeframe, bouncing cleanly after sweeping liquidity near its lower support trendline around $0.060–$0.062.
$XPL is currently attempting to push higher toward its dynamic moving average resistance cluster. A high-volume breakout and reclaim past the 55 and 100 EMAs will confirm bullish momentum, clearing the pathway for an expansion leg toward the upper trendline resistance target around $0.085+.
{future}(XPLUSDT)
#XPL LTF Analysis:
$XPL is trading within a descending broadening wedge structure on the 4-hour timeframe, bouncing cleanly after sweeping liquidity near its lower support trendline around $0.060–$0.062.
$XPL is currently attempting to push higher toward its dynamic moving average resistance cluster. A high-volume breakout and reclaim past the 55 and 100 EMAs will confirm bullish momentum, clearing the pathway for an expansion leg toward the upper trendline resistance target around $0.085+.
$XPL is trading within a descending broadening wedge structure on the 4-hour timeframe, bouncing cleanly after sweeping liquidity near its lower support trendline around $0.060–$0.062.
$XPL is currently attempting to push higher toward its dynamic moving average resistance cluster. A high-volume breakout and reclaim past the 55 and 100 EMAs will confirm bullish momentum, clearing the pathway for an expansion leg toward the upper trendline resistance target around $0.085+.
2
1
1.3k
·
--
Bullish
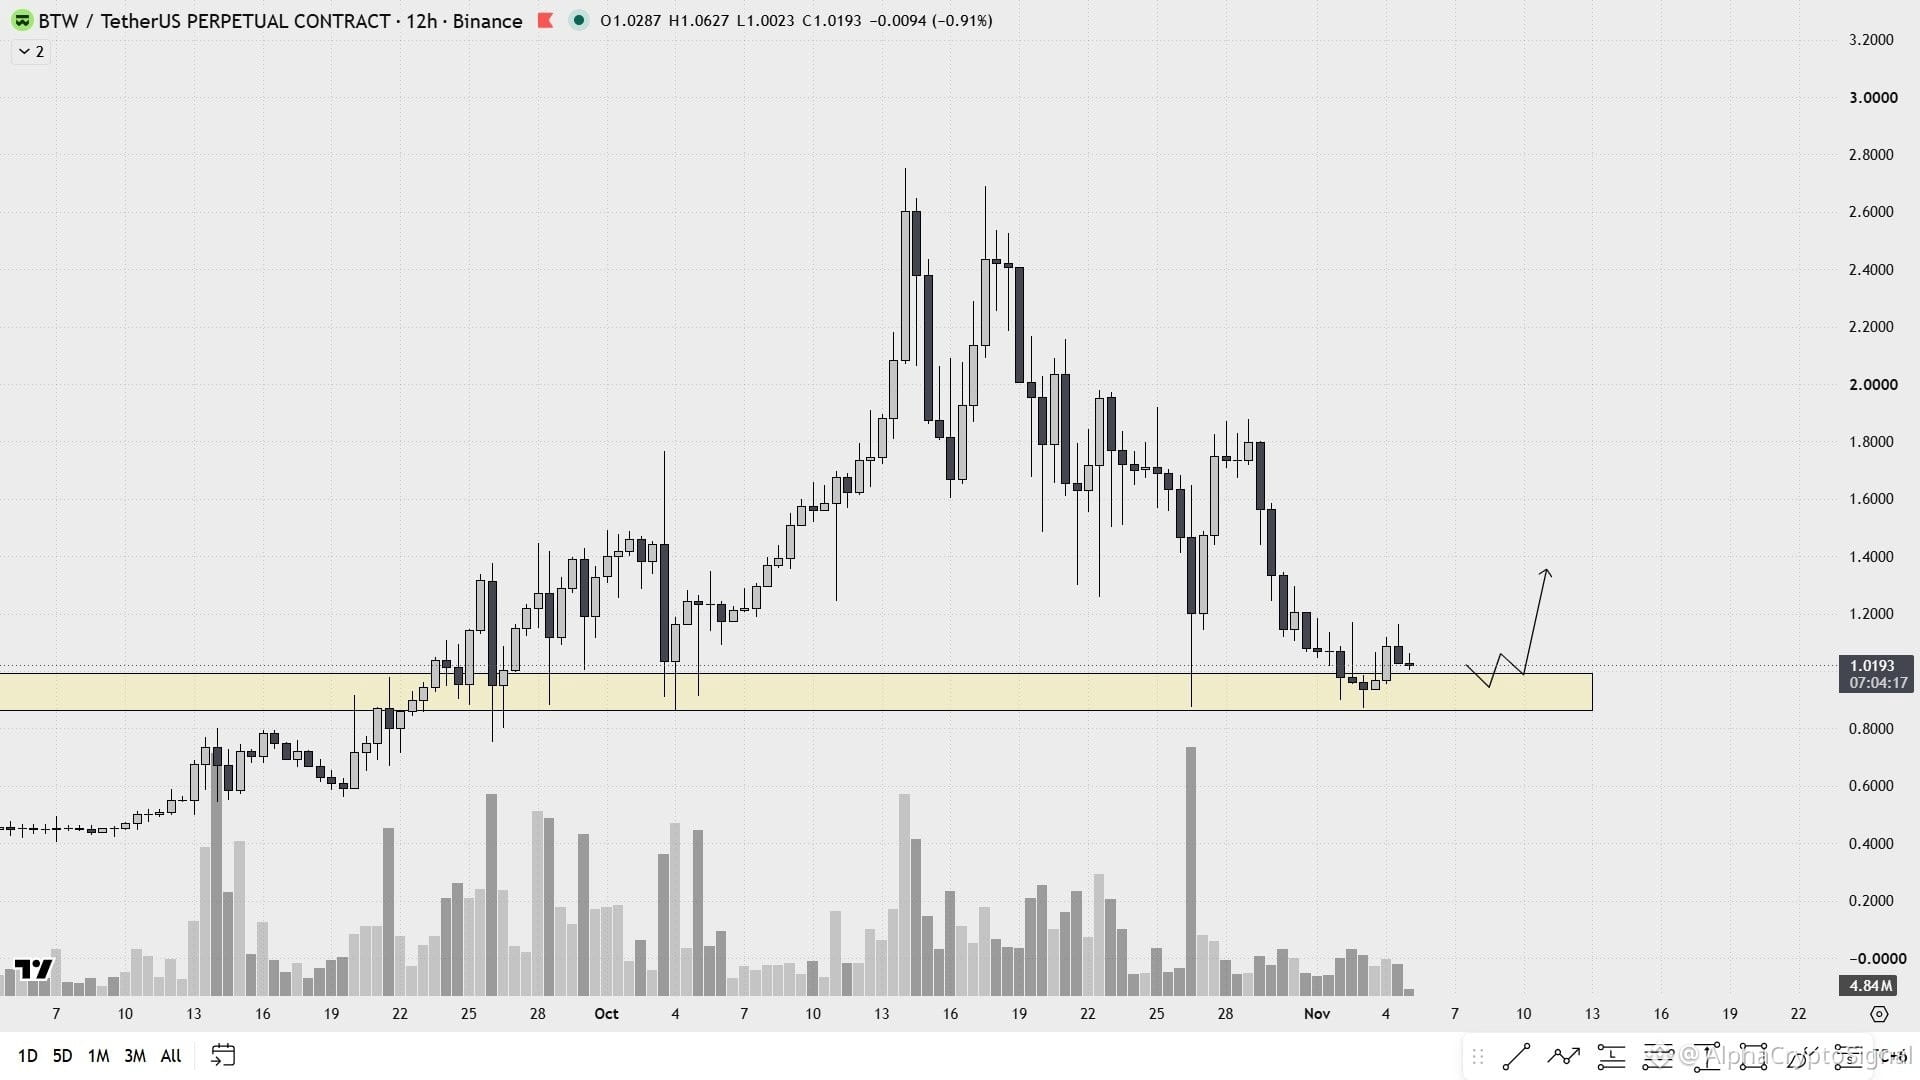
#BTW Update:
Volume is picking up.
Hold above the zone is good for price moving higher in the coming days.
Keep an eye on $BTW
{future}(BTWUSDT)
#BTW Update:
Volume is picking up.
Hold above the zone is good for price moving higher in the coming days.
Keep an eye on $BTW
Volume is picking up.
Hold above the zone is good for price moving higher in the coming days.
Keep an eye on $BTW
437
·
--
Bullish
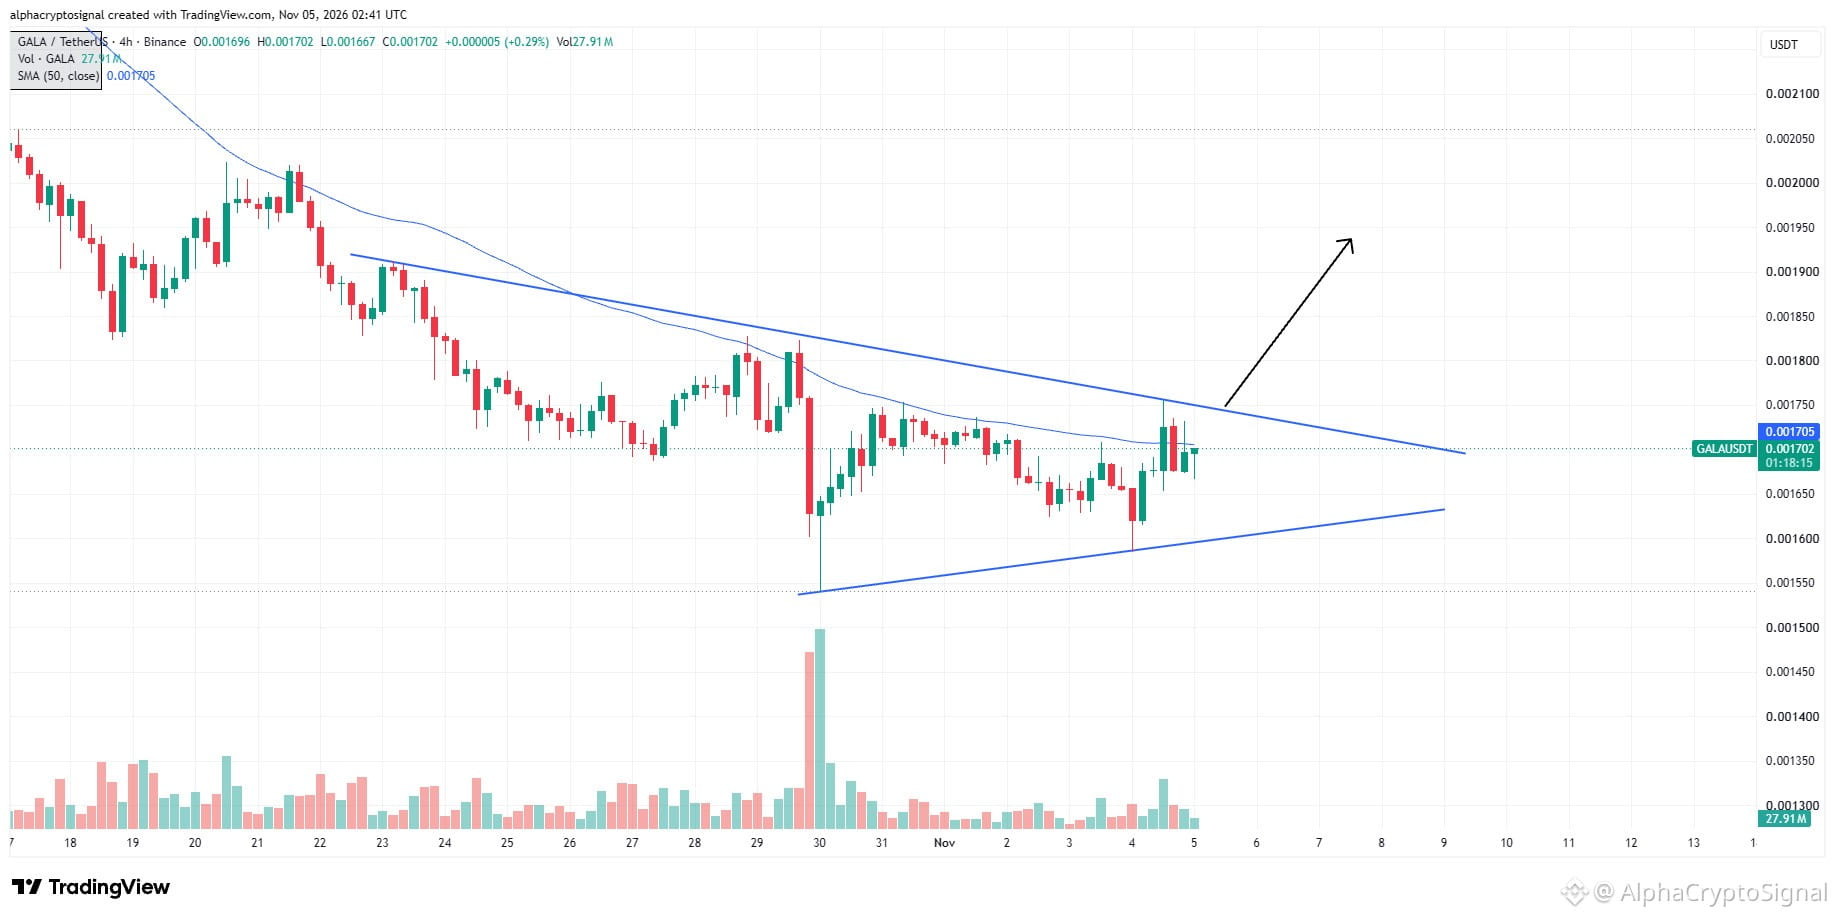
Thoughts on #GALA
$GALA is consolidating inside a symmetrical triangle, with price approaching the upper trendline. The structure is tightening, and we're getting closer to a potential breakout.
Looking for a clean breakout and resistance-to-support flip before considering a long on $GALA. A successful reclaim could open the door for a move towards higher levels.
{future}(GALAUSDT)
Thoughts on #GALA
$GALA is consolidating inside a symmetrical triangle, with price approaching the upper trendline. The structure is tightening, and we're getting closer to a potential breakout.
Looking for a clean breakout and resistance-to-support flip before considering a long on $GALA . A successful reclaim could open the door for a move towards higher levels.
$GALA is consolidating inside a symmetrical triangle, with price approaching the upper trendline. The structure is tightening, and we're getting closer to a potential breakout.
Looking for a clean breakout and resistance-to-support flip before considering a long on $GALA . A successful reclaim could open the door for a move towards higher levels.
2
1
1.6k
·
--
Bullish
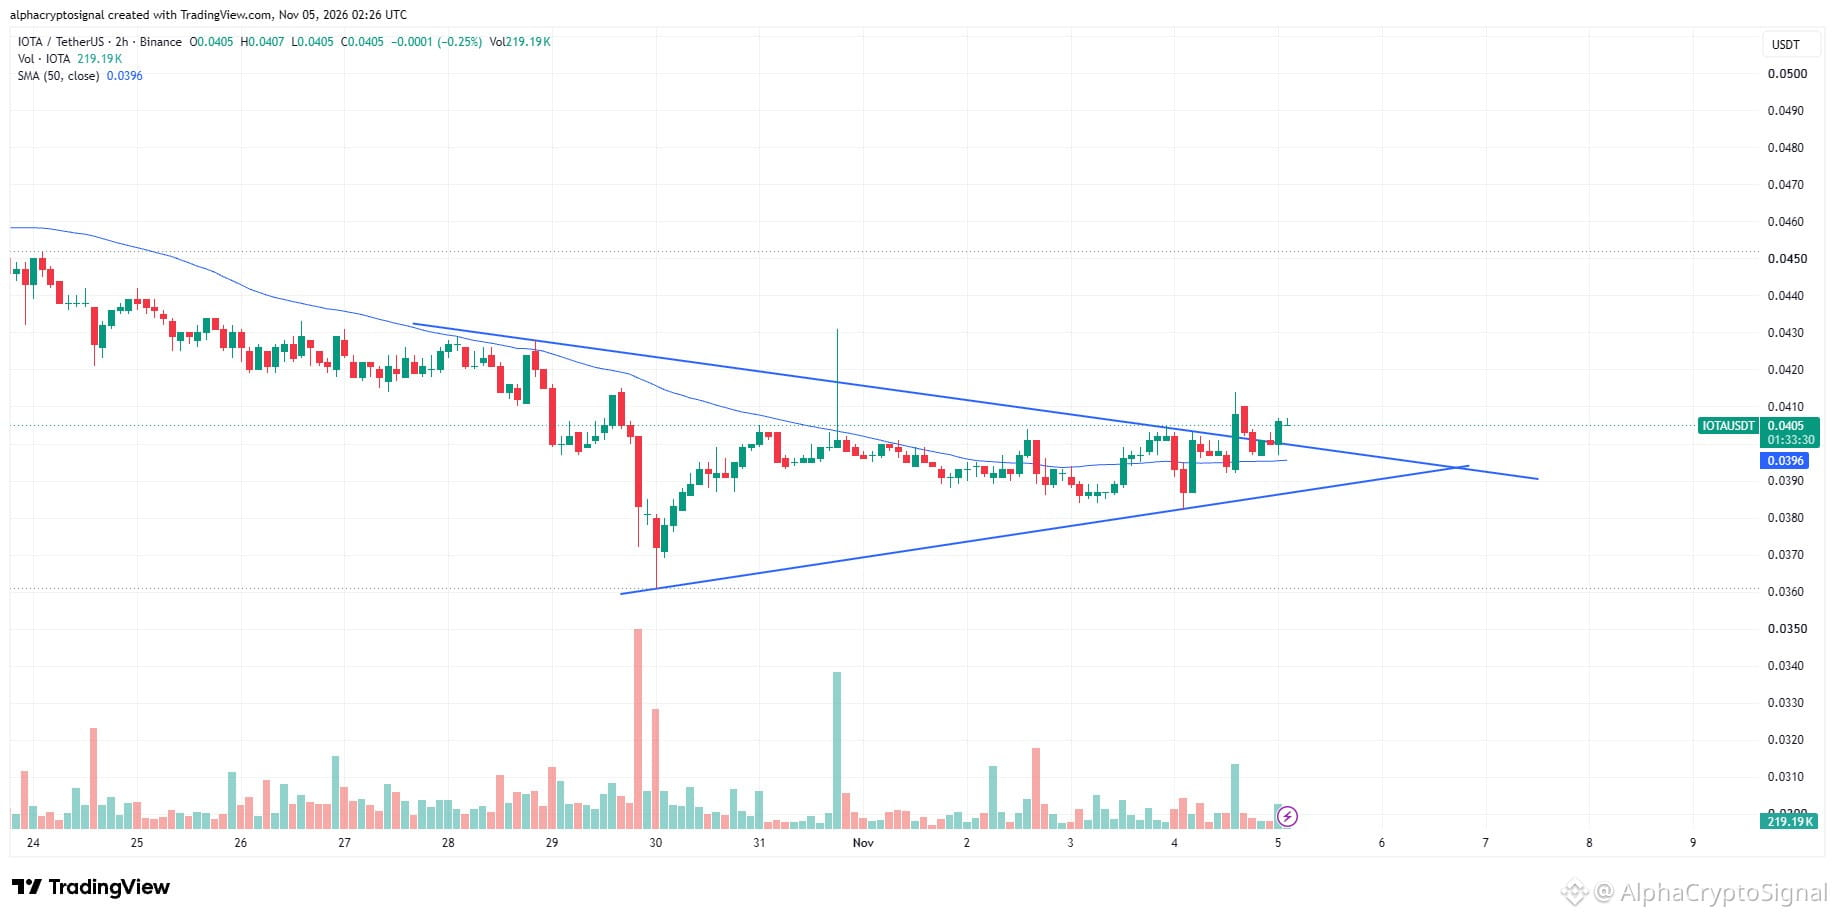
#IOTA LTF Analysis:
$IOTA is attempting a breakout from its symmetrical triangle on the 2H timeframe. $IOTA is pushing above the descending resistance, which is an encouraging sign for the bulls.
A sustained move above the trendline would strengthen the bullish setup and could open the door for further upside on $IOTA
{future}(IOTAUSDT)
#IOTA LTF Analysis:
$IOTA is attempting a breakout from its symmetrical triangle on the 2H timeframe. $IOTA is pushing above the descending resistance, which is an encouraging sign for the bulls.
A sustained move above the trendline would strengthen the bullish setup and could open the door for further upside on $IOTA
$IOTA is attempting a breakout from its symmetrical triangle on the 2H timeframe. $IOTA is pushing above the descending resistance, which is an encouraging sign for the bulls.
A sustained move above the trendline would strengthen the bullish setup and could open the door for further upside on $IOTA
1
319
·
--
Bullish
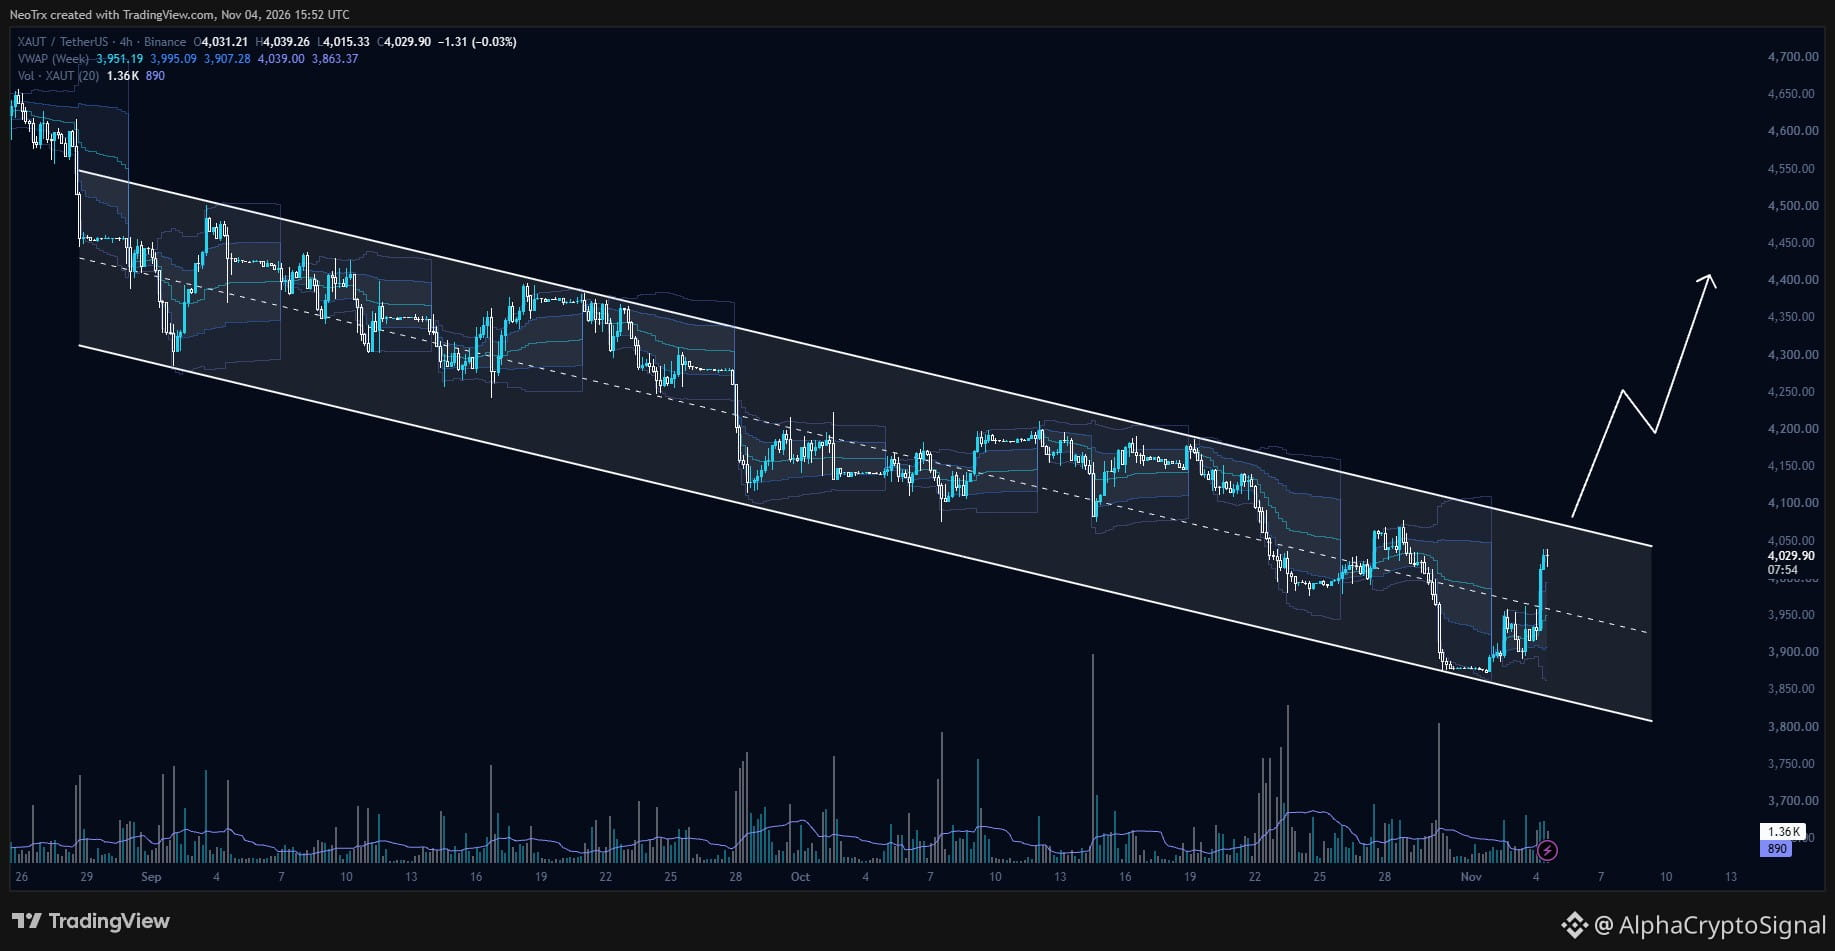
Thoughts on #XAUT (Gold):
$XAUT (gold) has been trading inside a massive descending channel on the 4H, and it just bounced off the lower boundary and reclaimed the channel midline. $XAUT is now pressing toward the upper boundary (~$4,050-$4,100) with the weekly VWAP (~$3,995) already reclaimed.
A 4H close above the upper boundary would be the breakout, and I'm expecting gold to run harder once it clears the channel, with $4,400 as the next target. If $XAUT falls back below the midline and the VWAP, the bounce loses steam.
{future}(XAUTUSDT)
Thoughts on #XAUT (Gold):
$XAUT (gold) has been trading inside a massive descending channel on the 4H, and it just bounced off the lower boundary and reclaimed the channel midline. $XAUT is now pressing toward the upper boundary (~$4,050-$4,100) with the weekly VWAP (~$3,995) already reclaimed.
A 4H close above the upper boundary would be the breakout, and I'm expecting gold to run harder once it clears the channel, with $4,400 as the next target. If $XAUT falls back below the midline and the VWAP, the bounce loses steam.
$XAUT (gold) has been trading inside a massive descending channel on the 4H, and it just bounced off the lower boundary and reclaimed the channel midline. $XAUT is now pressing toward the upper boundary (~$4,050-$4,100) with the weekly VWAP (~$3,995) already reclaimed.
A 4H close above the upper boundary would be the breakout, and I'm expecting gold to run harder once it clears the channel, with $4,400 as the next target. If $XAUT falls back below the midline and the VWAP, the bounce loses steam.
2
409
·
--
Bullish
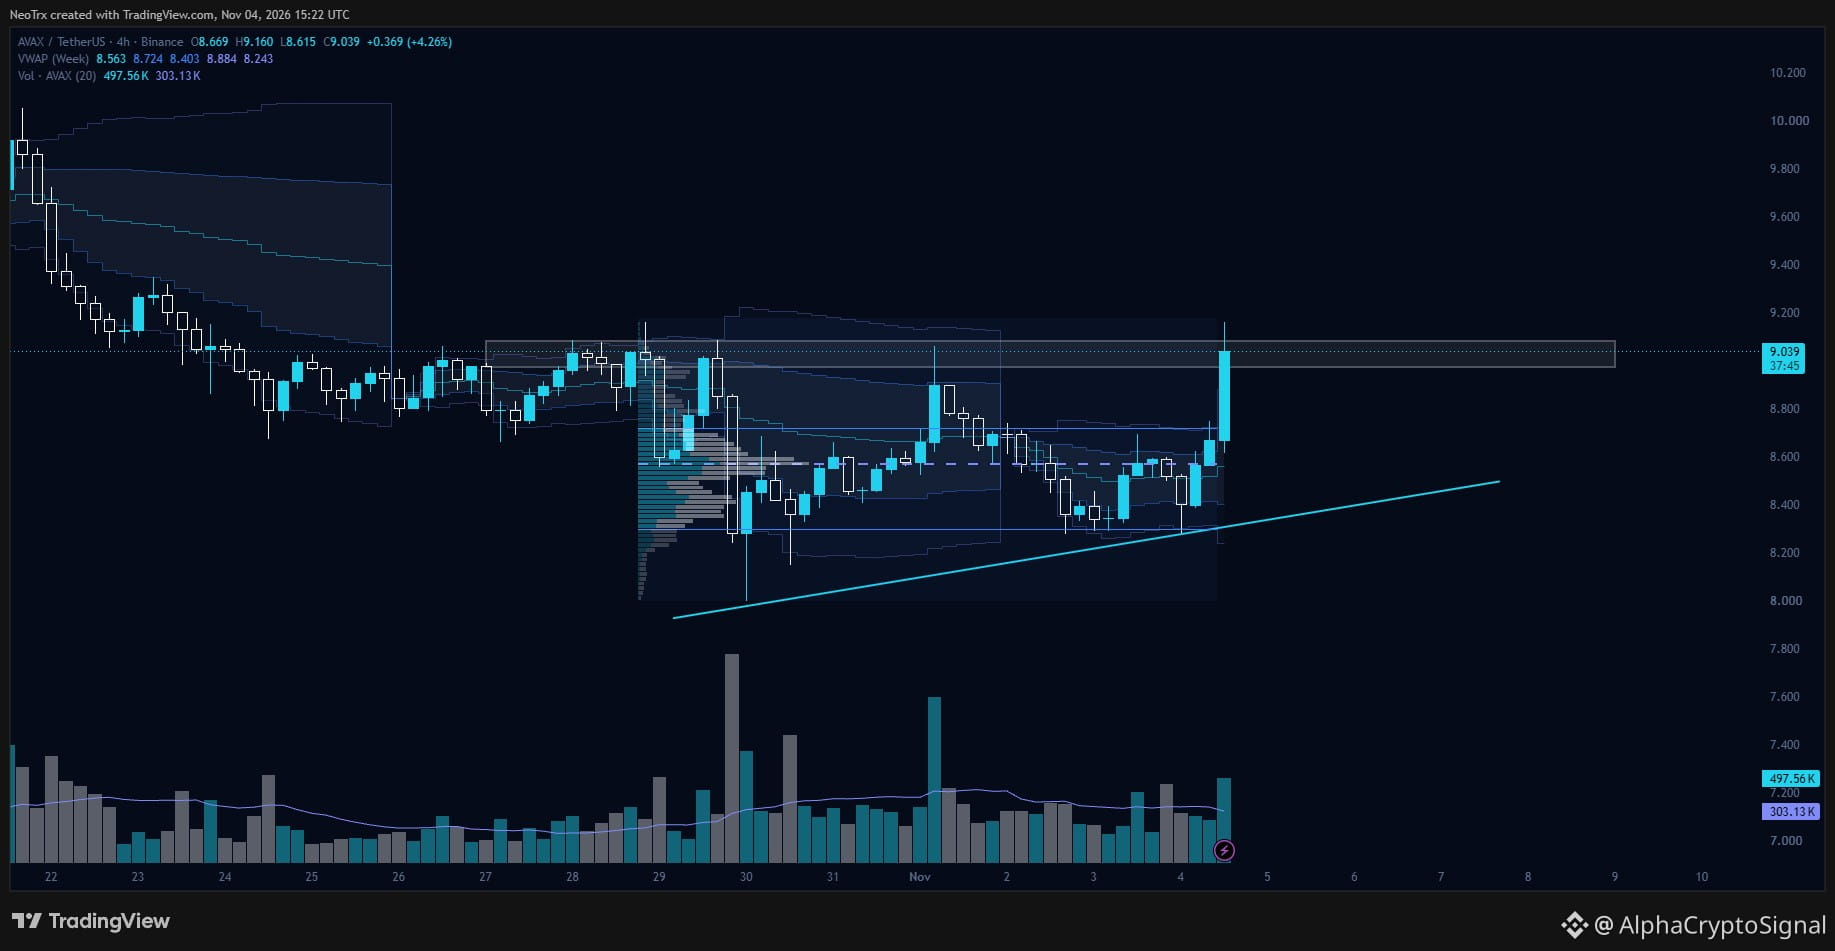
#AVAX LTF Analysis:
$AVAX is on the verge of an ascending triangle breakout on the 4H, pressing into the horizontal resistance zone (~$9.00-$9.10) after a strong bounce off the rising trendline. The volume profile shows $AVAX has entered the low volume zone, and it's moving explosively as expected.
A 4H close above the resistance is the trigger, with $10.00 as the next target. If $AVAX loses the ascending trendline (~$8.30), the setup is off.
{future}(AVAXUSDT)
#AVAX LTF Analysis:
$AVAX is on the verge of an ascending triangle breakout on the 4H, pressing into the horizontal resistance zone (~$9.00-$9.10) after a strong bounce off the rising trendline. The volume profile shows $AVAX has entered the low volume zone, and it's moving explosively as expected.
A 4H close above the resistance is the trigger, with $10.00 as the next target. If $AVAX loses the ascending trendline (~$8.30), the setup is off.
$AVAX is on the verge of an ascending triangle breakout on the 4H, pressing into the horizontal resistance zone (~$9.00-$9.10) after a strong bounce off the rising trendline. The volume profile shows $AVAX has entered the low volume zone, and it's moving explosively as expected.
A 4H close above the resistance is the trigger, with $10.00 as the next target. If $AVAX loses the ascending trendline (~$8.30), the setup is off.
3
1k
·
--
Bullish
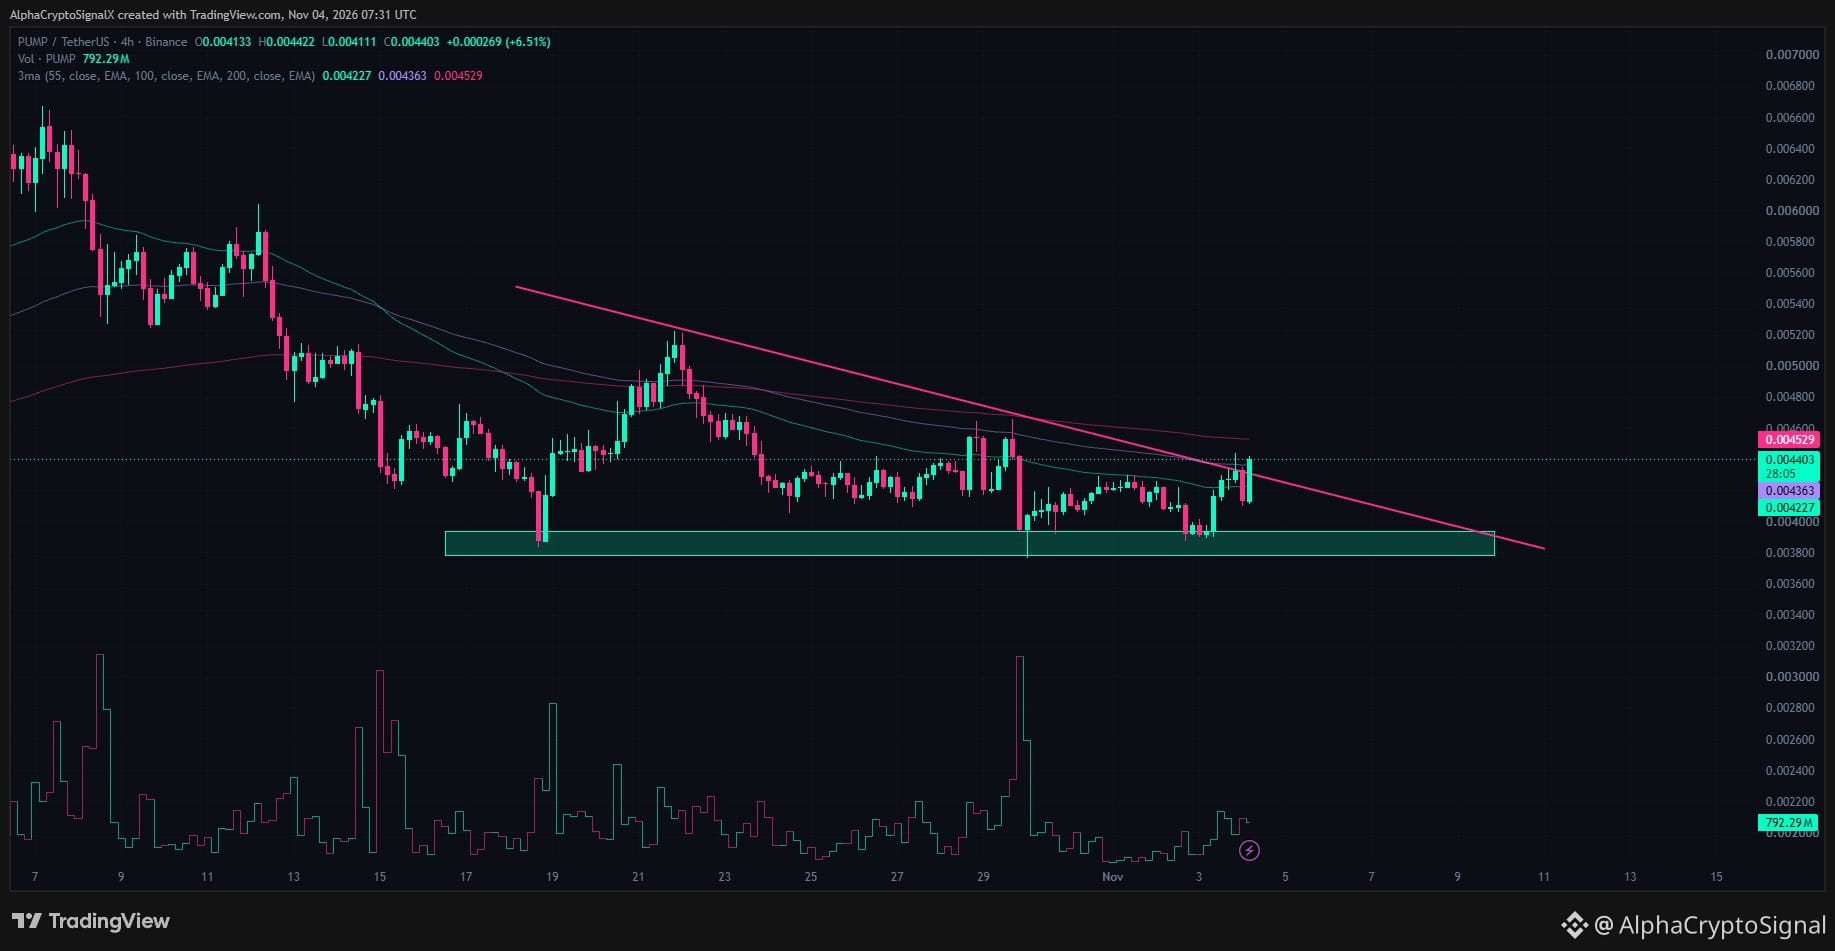
#PUMP LTF Analysis:
$PUMP is attempting a bullish breakout above the descending trendline of its 4-hour descending triangle, pushing past the 55 EMA (~$0.004227) and 100 EMA (~$0.004363).
A confirmed 4-hour close above the trendline and 100 EMA (~$0.00436) will validate the breakout on $PUMP , triggering a long setup targeting the higher liquidity around $0.0052+.
{future}(PUMPUSDT)
#PUMP LTF Analysis:
$PUMP is attempting a bullish breakout above the descending trendline of its 4-hour descending triangle, pushing past the 55 EMA (~$0.004227) and 100 EMA (~$0.004363).
A confirmed 4-hour close above the trendline and 100 EMA (~$0.00436) will validate the breakout on $PUMP , triggering a long setup targeting the higher liquidity around $0.0052+.
$PUMP is attempting a bullish breakout above the descending trendline of its 4-hour descending triangle, pushing past the 55 EMA (~$0.004227) and 100 EMA (~$0.004363).
A confirmed 4-hour close above the trendline and 100 EMA (~$0.00436) will validate the breakout on $PUMP , triggering a long setup targeting the higher liquidity around $0.0052+.
406
·
--
Bullish
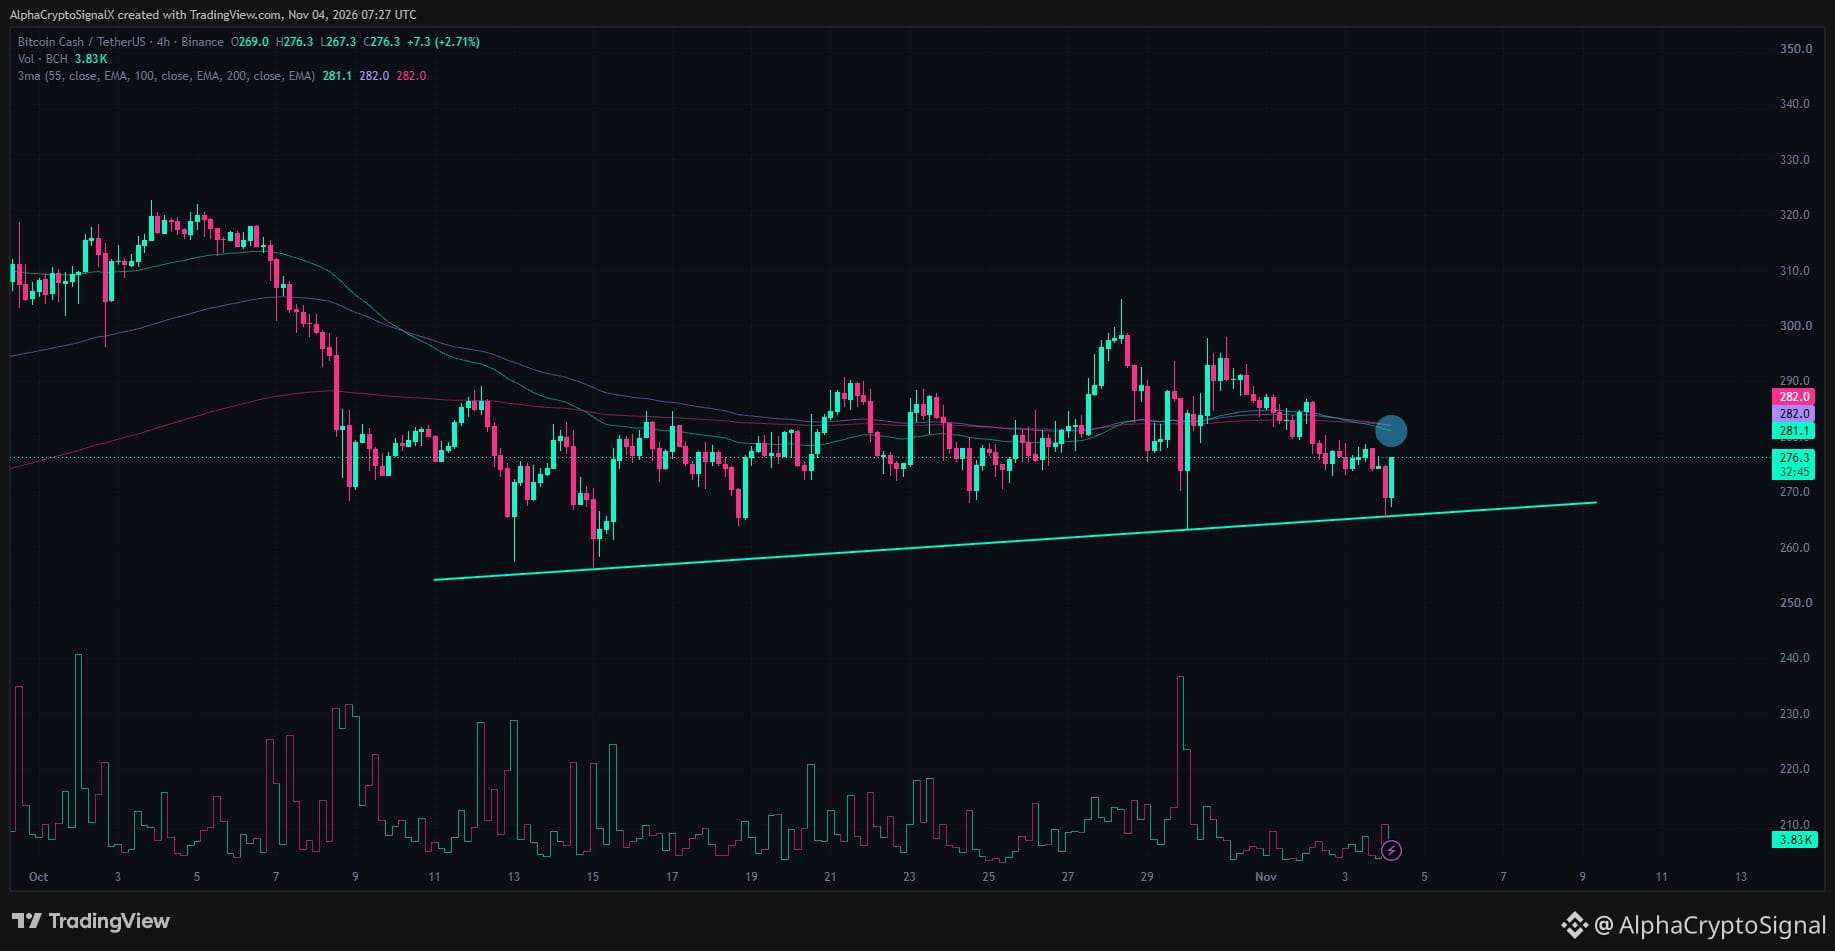
Thoughts on #BCH
$BCH is bouncing cleanly off its ascending trendline support zone around $267 on the 4-hour timeframe.
$BCH is pushing back up to test immediate dynamic resistance at the tightly stacked moving average cluster: 55 EMA (~$281.1), 100 EMA (~$282.0), and 200 EMA (~$282.0). A high-volume 4-hour close and reclaim above this $281–$282 EMA confluence will confirm the long entry, opening a path for an expansion move toward $300+.
{future}(BCHUSDT)
Thoughts on #BCH
$BCH is bouncing cleanly off its ascending trendline support zone around $267 on the 4-hour timeframe.
$BCH is pushing back up to test immediate dynamic resistance at the tightly stacked moving average cluster: 55 EMA (~$281.1), 100 EMA (~$282.0), and 200 EMA (~$282.0). A high-volume 4-hour close and reclaim above this $281–$282 EMA confluence will confirm the long entry, opening a path for an expansion move toward $300+.
$BCH is bouncing cleanly off its ascending trendline support zone around $267 on the 4-hour timeframe.
$BCH is pushing back up to test immediate dynamic resistance at the tightly stacked moving average cluster: 55 EMA (~$281.1), 100 EMA (~$282.0), and 200 EMA (~$282.0). A high-volume 4-hour close and reclaim above this $281–$282 EMA confluence will confirm the long entry, opening a path for an expansion move toward $300+.
1
200
Log in to explore more content
Join global crypto users on Binance Square
⚡️ Get latest and useful information about crypto.
💬 Trusted by the world’s largest crypto exchange.
👍 Discover real insights from verified creators.
Email / Phone number
Trending Topics
HuangExitNvidiaStrategyInFocus
63,761 views
809 Discussing
STOCKS | Nvidia’s Jensen Huang Resigns, Colette Kress Named as Interim CEO
Binance News
·20 Likes
·30.6k views
AnthropicRejectsIPODelayValuationinQuestion
651,879 views
5,081 Discussing
BitMineReports$6.3BNetLossForFiscal2026
7,534 views
98 Discussing