

無名先生
649 Posts

無名先生
 Square Verified
Report
Block User
Cryptocurrency、金融分析師、信息搬運工 、合作DM 、主攻領域、#Airdrops
2 Following
1.2K+ Followers
423 Liked
1 Badges
Posts
All
Videos
·
--
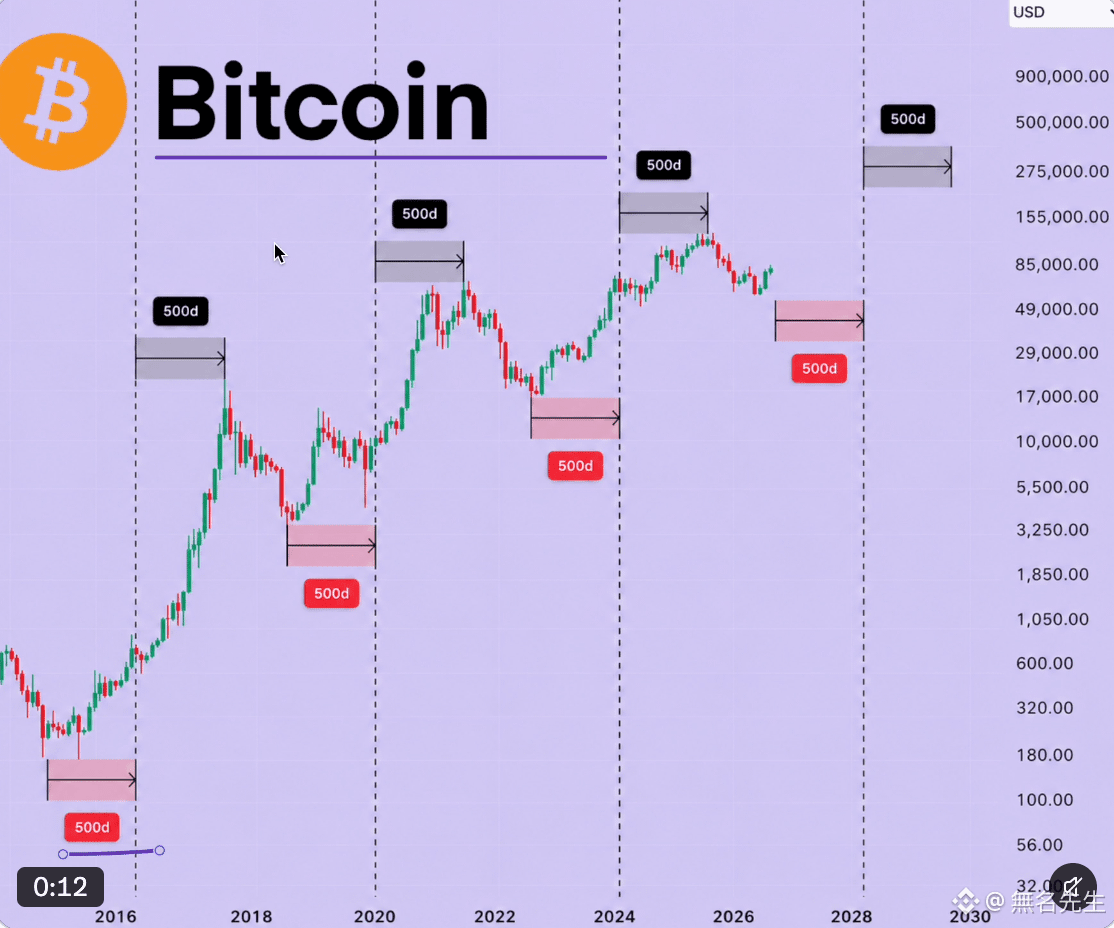
“The 500-Day Rule” has had a relatively high hit rate in history.
In the previous cycle, buying in the first 500 days before the halving and selling in the next 500 days after the halving corresponds to November 2022 through September 2025.
#BTC During that period, it rose from around 16,000 up to 126,000.
From 2016 to 2017 and from 2019 to 2021, using the same rhythm, it also captured the main upward phases.
“The 500-Day Rule” has had a relatively high hit rate in history.
In the previous cycle, buying in the first 500 days before the halving and selling in the next 500 days after the halving corresponds to November 2022 through September 2025.
#BTC During that period, it rose from around 16,000 up to 126,000.
From 2016 to 2017 and from 2019 to 2021, using the same rhythm, it also captured the main upward phases.
In the previous cycle, buying in the first 500 days before the halving and selling in the next 500 days after the halving corresponds to November 2022 through September 2025.
#BTC During that period, it rose from around 16,000 up to 126,000.
From 2016 to 2017 and from 2019 to 2021, using the same rhythm, it also captured the main upward phases.
307
·
--
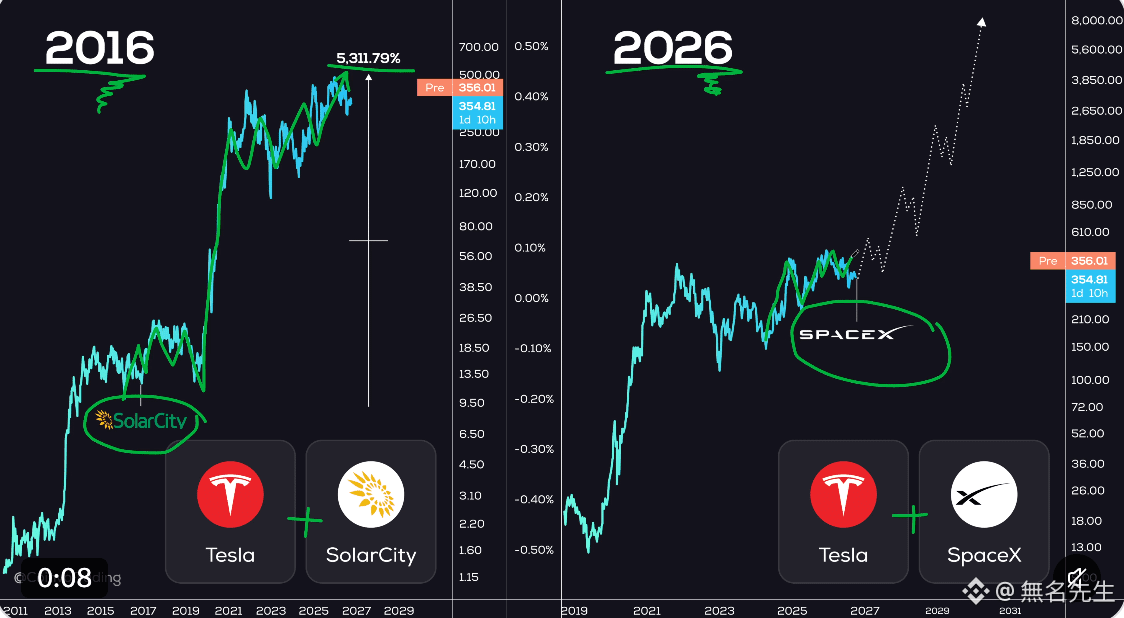
The actual data behind the SolarCity merger is: Tesla acquired it through an all-stock deal worth about $2.6 billion.
On the day the merger was announced, Tesla’s stock price fell by more than 10%, and the S&P put its credit rating on a negative watch.
That figure of 5300% is most likely the later long-term increase in Tesla’s stock, mistakenly attributed to the SolarCity acquisition.
The actual data behind the SolarCity merger is: Tesla acquired it through an all-stock deal worth about $2.6 billion.
On the day the merger was announced, Tesla’s stock price fell by more than 10%, and the S&P put its credit rating on a negative watch.
That figure of 5300% is most likely the later long-term increase in Tesla’s stock, mistakenly attributed to the SolarCity acquisition.
On the day the merger was announced, Tesla’s stock price fell by more than 10%, and the S&P put its credit rating on a negative watch.
That figure of 5300% is most likely the later long-term increase in Tesla’s stock, mistakenly attributed to the SolarCity acquisition.
271
·
--
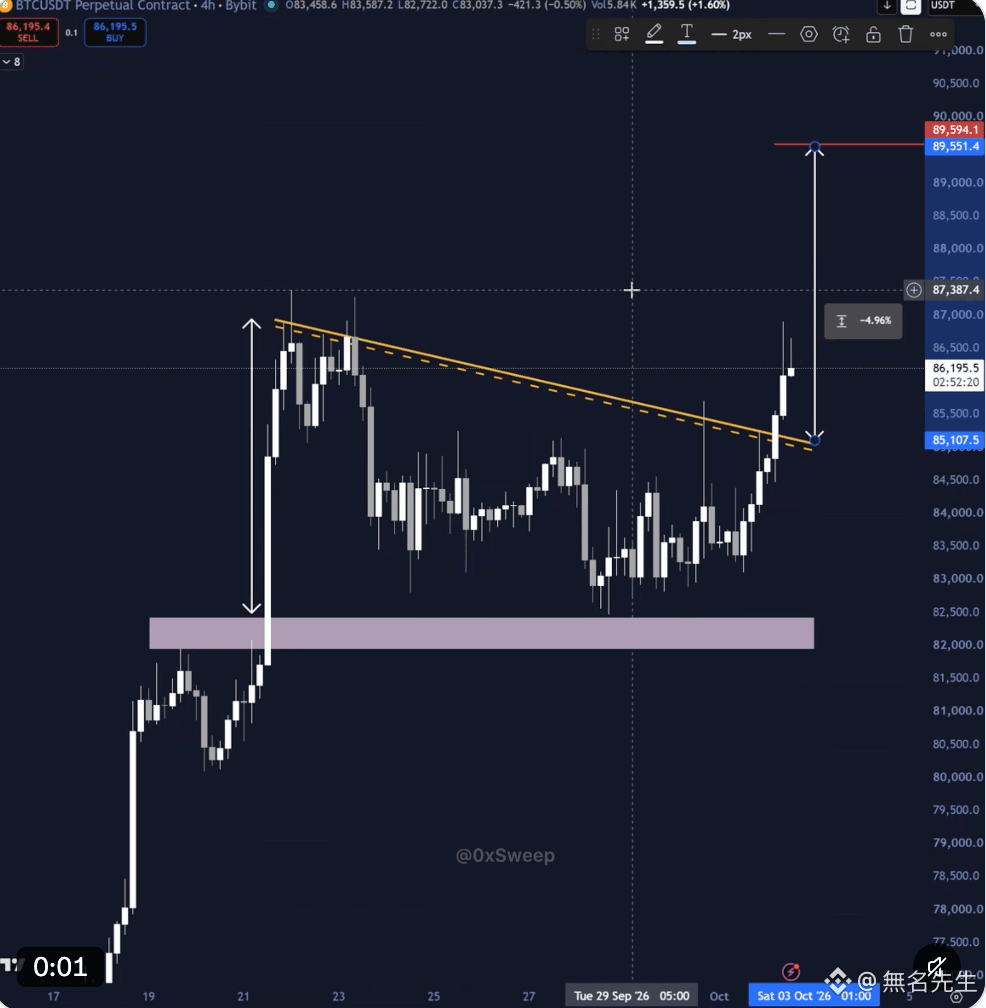
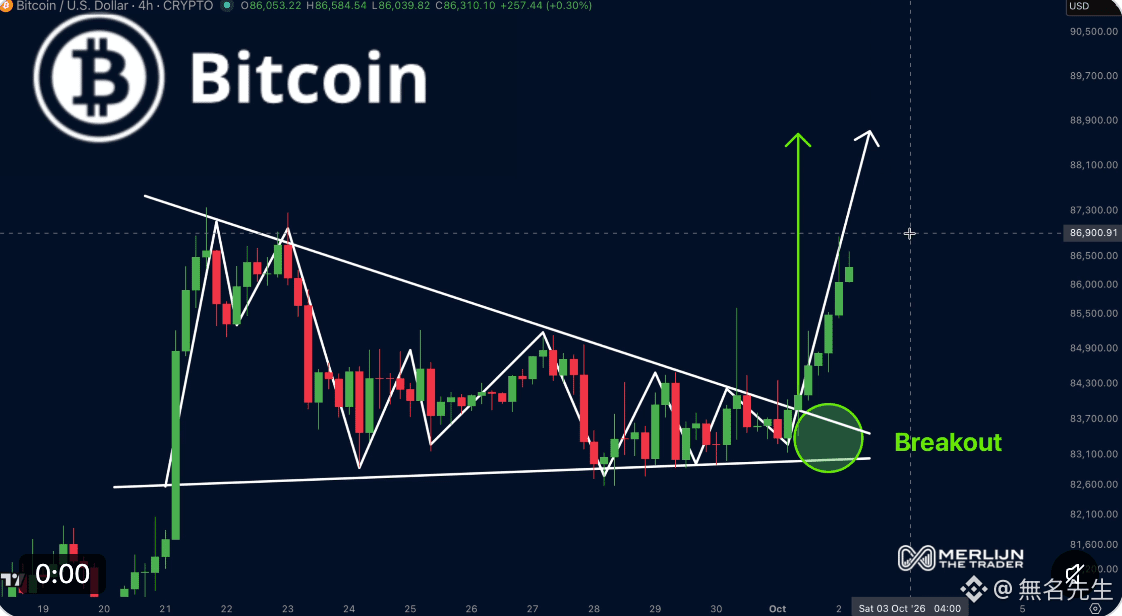
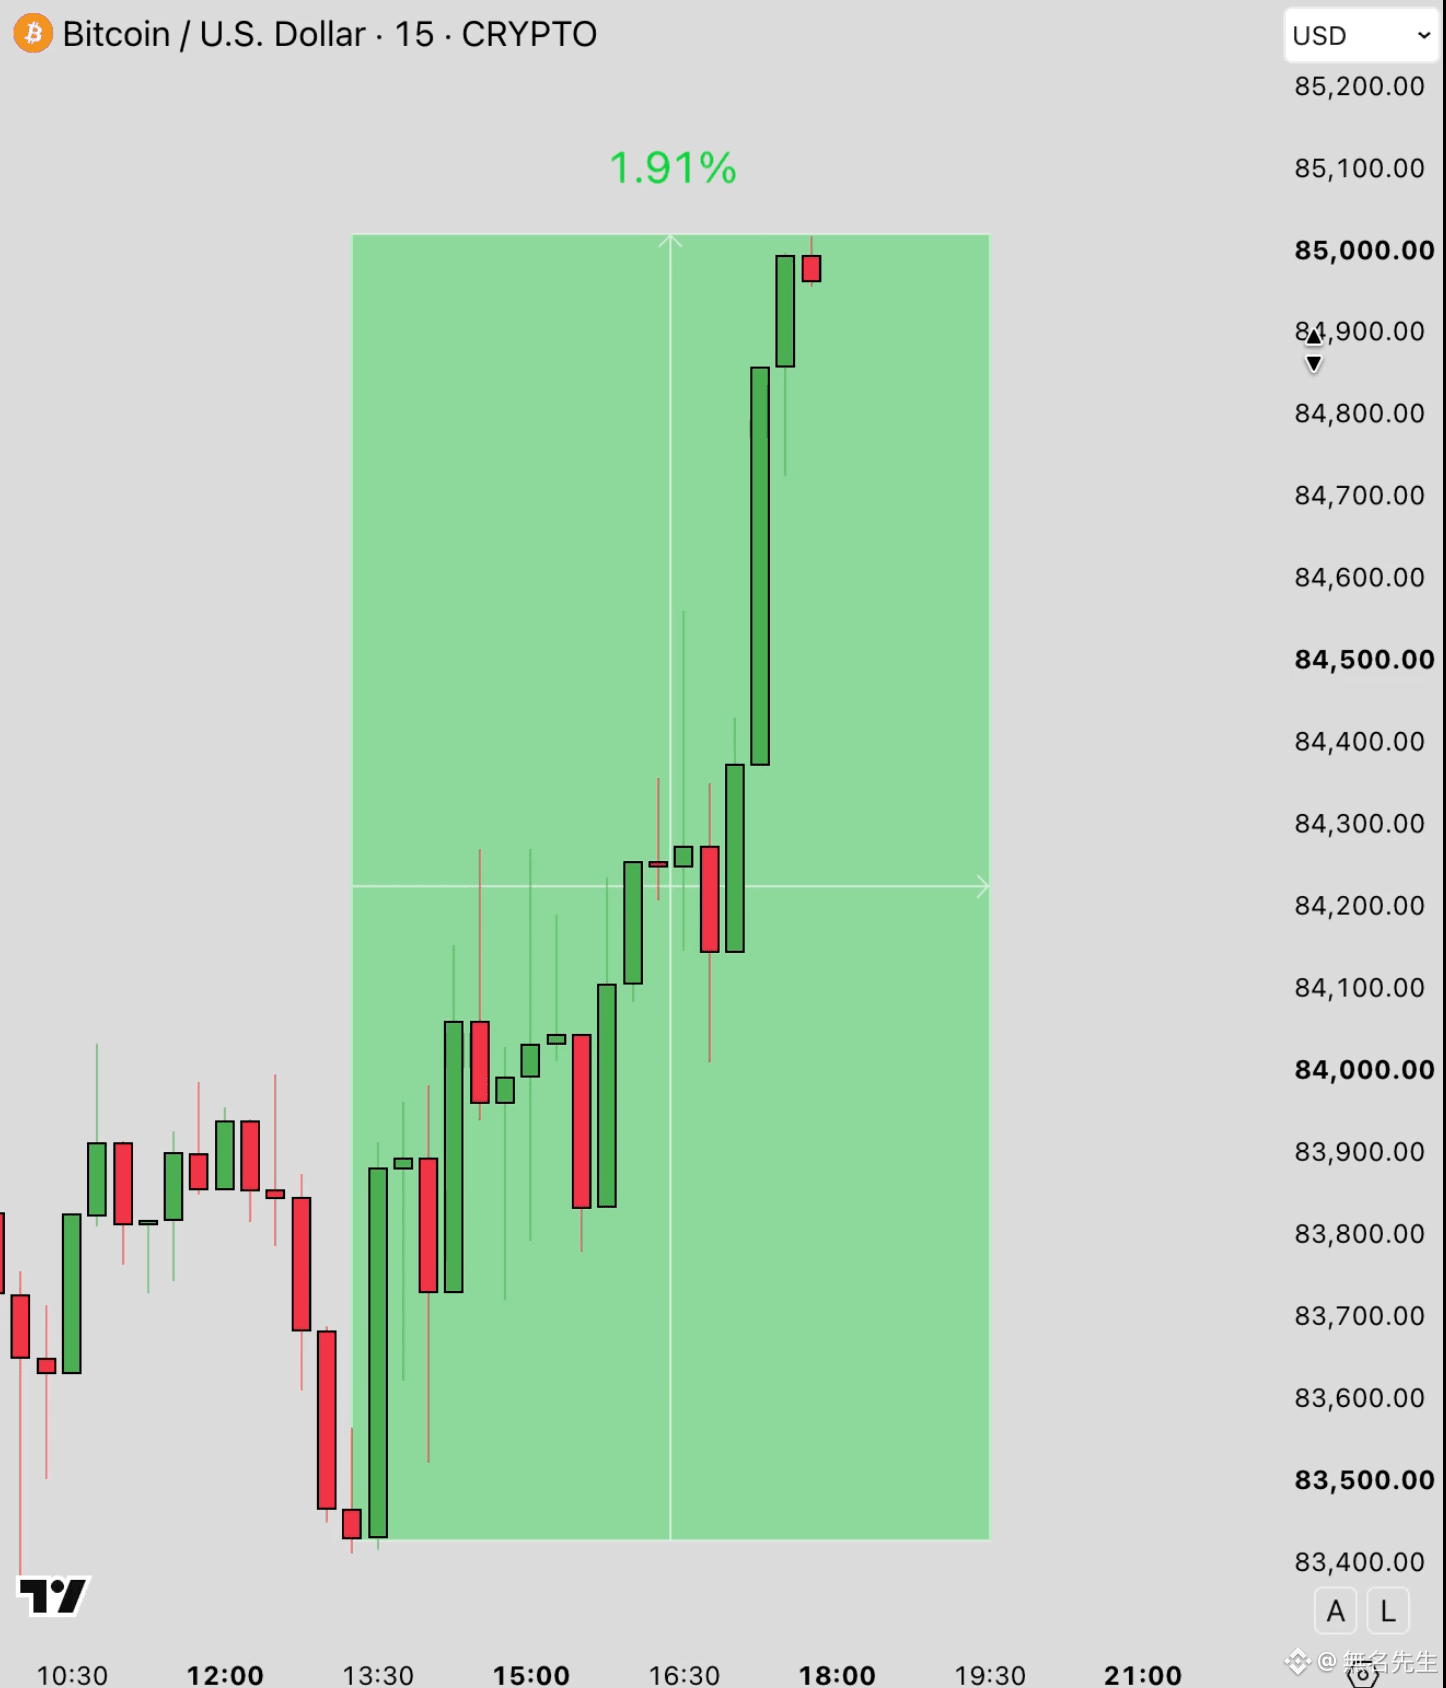
#BTC started around 83,000 and broke out of the previous range of consolidation.
The short-term structure has indeed turned stronger. After the resistance between 84,000 and 85,000 was digested, the space above has opened up.
90K is the next round-number level and one of the targets that traders on Kalshi assign a relatively high probability to.
However, there are still sell orders stacked between 87,000 and 88,000, so this needs to be cleared first.
If the breakout is valid, 90K is a reasonable target. If the breakout fails, then it will fall back into the range and continue to grind.
Let's see whether the price can hold above 85,000.
#BTC started around 83,000 and broke out of the previous range of consolidation.
The short-term structure has indeed turned stronger. After the resistance between 84,000 and 85,000 was digested, the space above has opened up.
90K is the next round-number level and one of the targets that traders on Kalshi assign a relatively high probability to.
However, there are still sell orders stacked between 87,000 and 88,000, so this needs to be cleared first.
If the breakout is valid, 90K is a reasonable target. If the breakout fails, then it will fall back into the range and continue to grind.
Let's see whether the price can hold above 85,000.
The short-term structure has indeed turned stronger. After the resistance between 84,000 and 85,000 was digested, the space above has opened up.
90K is the next round-number level and one of the targets that traders on Kalshi assign a relatively high probability to.
However, there are still sell orders stacked between 87,000 and 88,000, so this needs to be cleared first.
If the breakout is valid, 90K is a reasonable target. If the breakout fails, then it will fall back into the range and continue to grind.
Let's see whether the price can hold above 85,000.
235
·
--
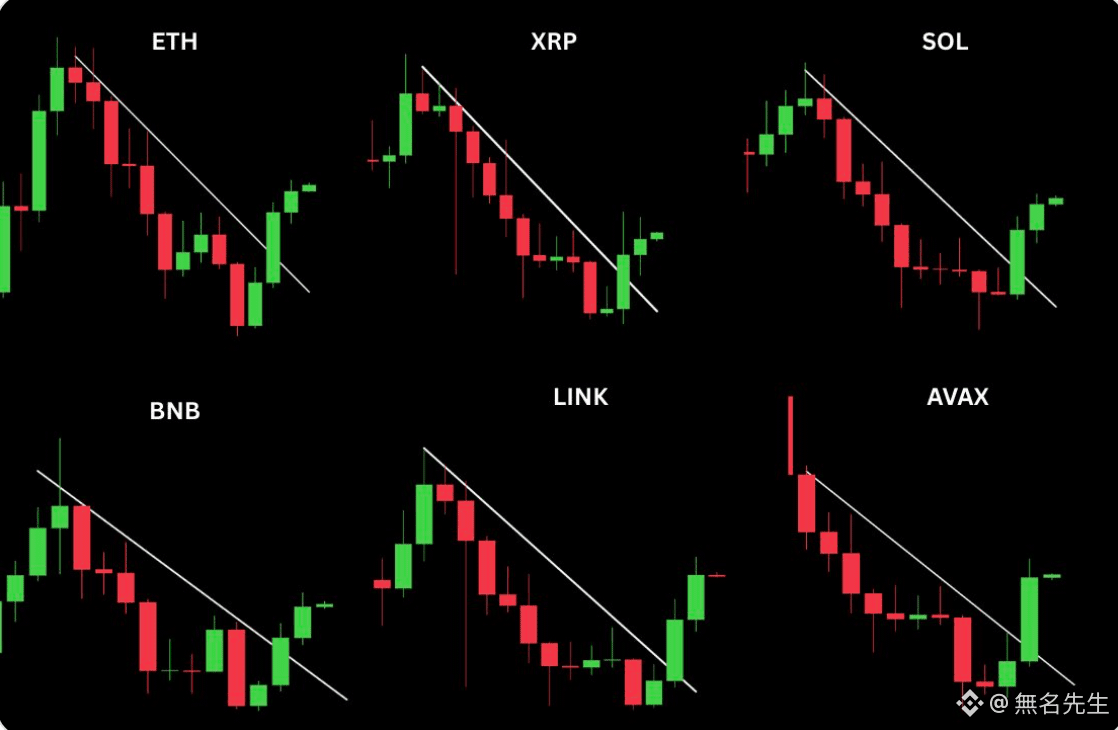
The counterfeit (clone) September harvest has been decent, but the claim of a “significant strengthening” depends on the specific data.
The counterfeit season index is currently between 60 and 64—higher than August’s 39—but it still falls short of the 75 needed to confirm a full counterfeit season.
Capital rotation is selective: it concentrates on projects with revenue and real-world use cases, and not all counterfeit projects rise together.
The counterfeit (clone) September harvest has been decent, but the claim of a “significant strengthening” depends on the specific data.
The counterfeit season index is currently between 60 and 64—higher than August’s 39—but it still falls short of the 75 needed to confirm a full counterfeit season.
Capital rotation is selective: it concentrates on projects with revenue and real-world use cases, and not all counterfeit projects rise together.
The counterfeit season index is currently between 60 and 64—higher than August’s 39—but it still falls short of the 75 needed to confirm a full counterfeit season.
Capital rotation is selective: it concentrates on projects with revenue and real-world use cases, and not all counterfeit projects rise together.
470
·
--
Unemployment rate rises to 4.2%, while non-farm payrolls only increased by 29,000, far below the expected 90,000.
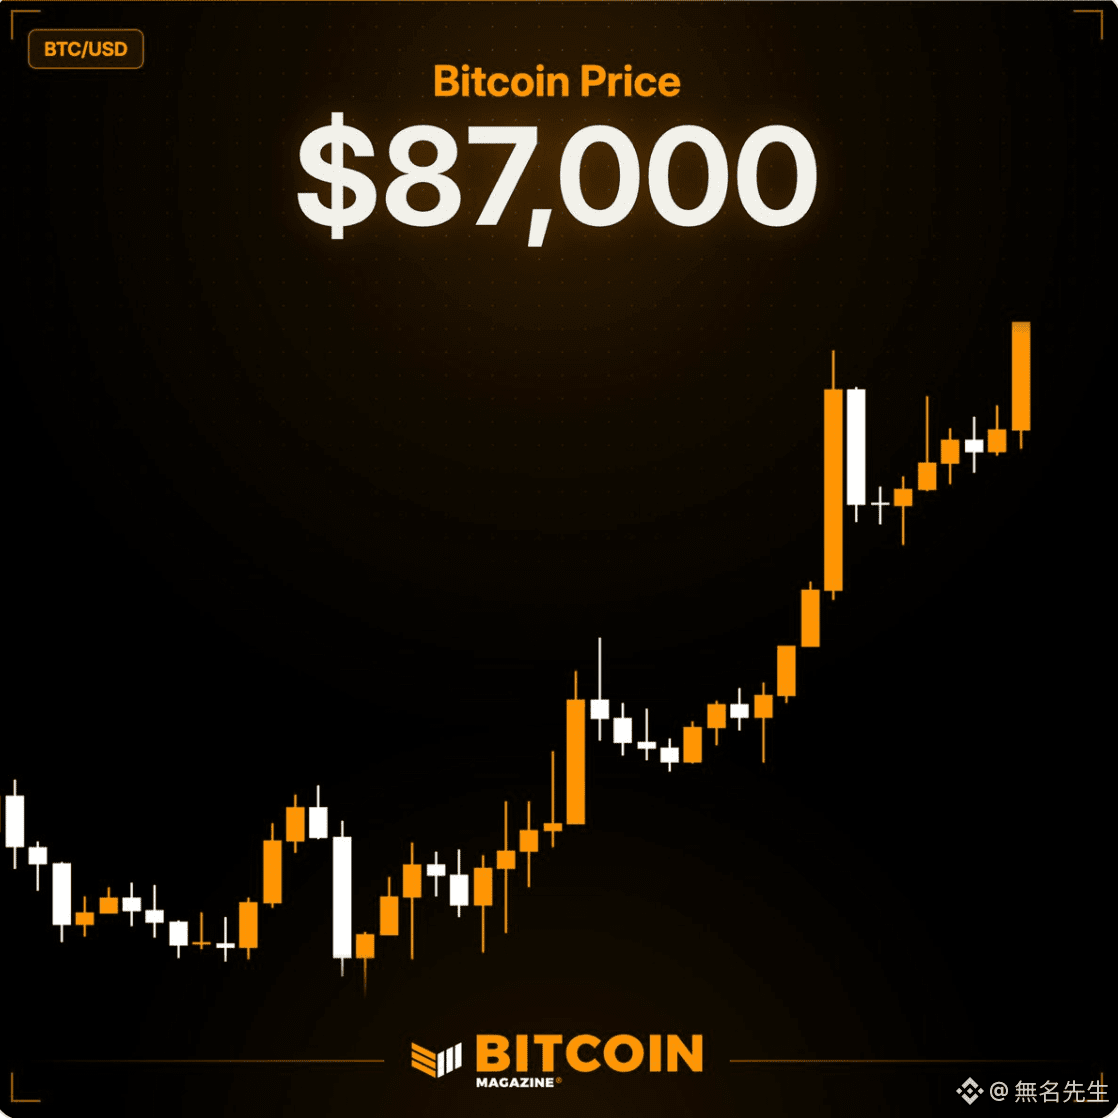
After the data was released, #BTC briefly surged to 87,250, then fell back to around 84,600.
This up move was mainly driven by spot demand. The annualized funding rate on perpetual contracts is only 5.4%, so leverage participation is low.
Unemployment rate rises to 4.2%, while non-farm payrolls only increased by 29,000, far below the expected 90,000.
After the data was released, #BTC briefly surged to 87,250, then fell back to around 84,600.
This up move was mainly driven by spot demand. The annualized funding rate on perpetual contracts is only 5.4%, so leverage participation is low.
After the data was released, #BTC briefly surged to 87,250, then fell back to around 84,600.
This up move was mainly driven by spot demand. The annualized funding rate on perpetual contracts is only 5.4%, so leverage participation is low.
181
·
--
“Uptober officially begins.” The words were already said on October 1.
At the time, #BTC was around 86,357. On Kalshi, traders had priced the probability of this month touching 90,000 at 56%, and the probability of touching 87,500 at about 72%.
But whether the breakout is valid depends on what level it manages to hold.
Currently, the price is ranging between 83,000 and 85,000. The resistance at 87,000 was rejected once at the end of September.
“Uptober officially begins.” The words were already said on October 1.
At the time, #BTC was around 86,357. On Kalshi, traders had priced the probability of this month touching 90,000 at 56%, and the probability of touching 87,500 at about 72%.
But whether the breakout is valid depends on what level it manages to hold.
Currently, the price is ranging between 83,000 and 85,000. The resistance at 87,000 was rejected once at the end of September.
At the time, #BTC was around 86,357. On Kalshi, traders had priced the probability of this month touching 90,000 at 56%, and the probability of touching 87,500 at about 72%.
But whether the breakout is valid depends on what level it manages to hold.
Currently, the price is ranging between 83,000 and 85,000. The resistance at 87,000 was rejected once at the end of September.
166
·
--
Verified
Job data increased by only 29,000, far below the expected 90,000—something that should have been good for gold.
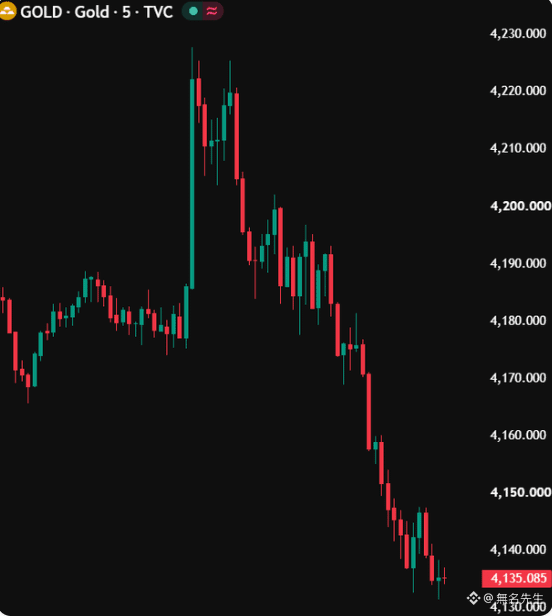
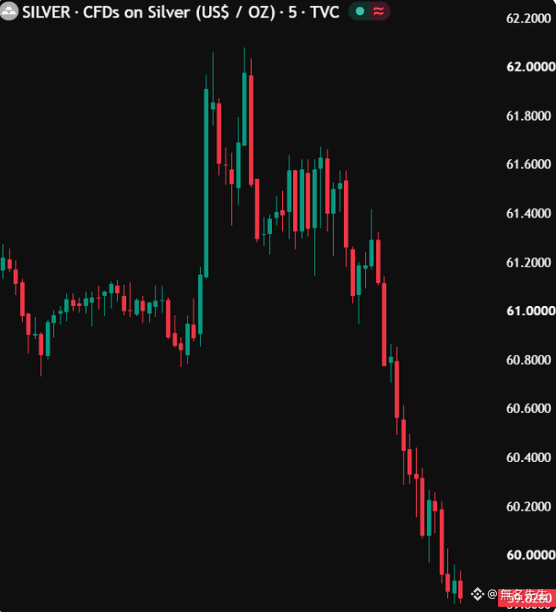
But after briefly spiking higher, the gold price turned and fell, closing down 0.95% to $4,162, while silver slipped 1.24% to $60.4.
The issue isn’t the data—it’s the bond market.
Earlier this week, the 10-year U.S. Treasury yield hit its highest level since 2002, and the 30-year yield is near 5.57%.
With gold not yielding interest, when risk-free yields are at their highest levels in more than two decades, the carrying cost becomes too high.
Job data increased by only 29,000, far below the expected 90,000—something that should have been good for gold.
But after briefly spiking higher, the gold price turned and fell, closing down 0.95% to $4,162, while silver slipped 1.24% to $60.4.
The issue isn’t the data—it’s the bond market.
Earlier this week, the 10-year U.S. Treasury yield hit its highest level since 2002, and the 30-year yield is near 5.57%.
With gold not yielding interest, when risk-free yields are at their highest levels in more than two decades, the carrying cost becomes too high.
But after briefly spiking higher, the gold price turned and fell, closing down 0.95% to $4,162, while silver slipped 1.24% to $60.4.
The issue isn’t the data—it’s the bond market.
Earlier this week, the 10-year U.S. Treasury yield hit its highest level since 2002, and the 30-year yield is near 5.57%.
With gold not yielding interest, when risk-free yields are at their highest levels in more than two decades, the carrying cost becomes too high.
587
·
--
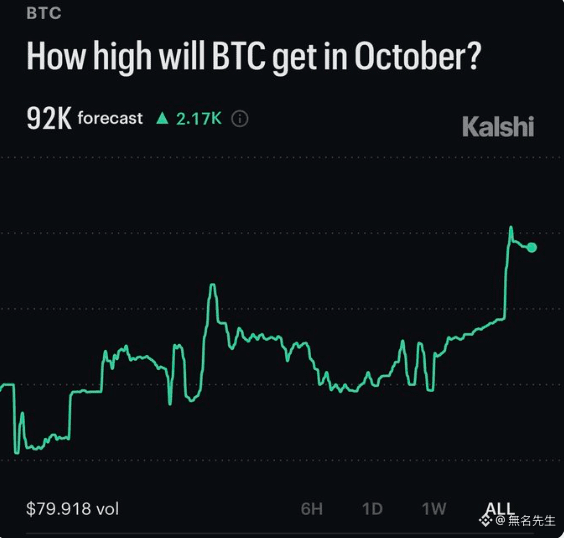
Kalshi indeed has traders betting that October will reach $92,000, but that target appears on October 1, when #BTC was around 86,357, and the four-hour structure remains bullish.
Calling it “market consensus” is inaccurate.
In the same period, another contract shows that traders have priced a probability of about 56% for the month reaching 90,000, a probability of roughly 72% for reaching 87,500, and only a 9% probability for reaching 100,000.
Kalshi indeed has traders betting that October will reach $92,000, but that target appears on October 1, when #BTC was around 86,357, and the four-hour structure remains bullish.
Calling it “market consensus” is inaccurate.
In the same period, another contract shows that traders have priced a probability of about 56% for the month reaching 90,000, a probability of roughly 72% for reaching 87,500, and only a 9% probability for reaching 100,000.
Calling it “market consensus” is inaccurate.
In the same period, another contract shows that traders have priced a probability of about 56% for the month reaching 90,000, a probability of roughly 72% for reaching 87,500, and only a 9% probability for reaching 100,000.

213
·
--
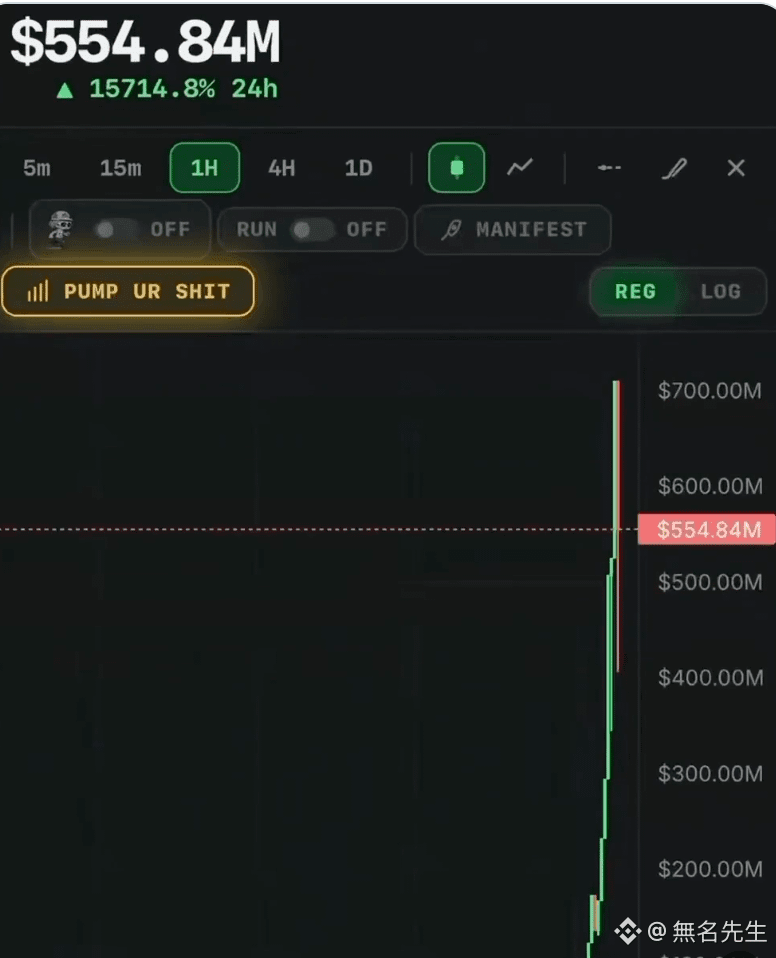
“I’ve done it many times before; this time too, I can.” This kind of statement only talks about the few times it succeeded. In the early stages, the risk is that the vast majority end up going to zero or stalling—only a very small proportion actually manage to get off the ground. When you see this kind of teaser, first think through how much loss you can realistically bear, and only then decide whether to get involved.
“I’ve done it many times before; this time too, I can.” This kind of statement only talks about the few times it succeeded. In the early stages, the risk is that the vast majority end up going to zero or stalling—only a very small proportion actually manage to get off the ground. When you see this kind of teaser, first think through how much loss you can realistically bear, and only then decide whether to get involved.
184
·
--
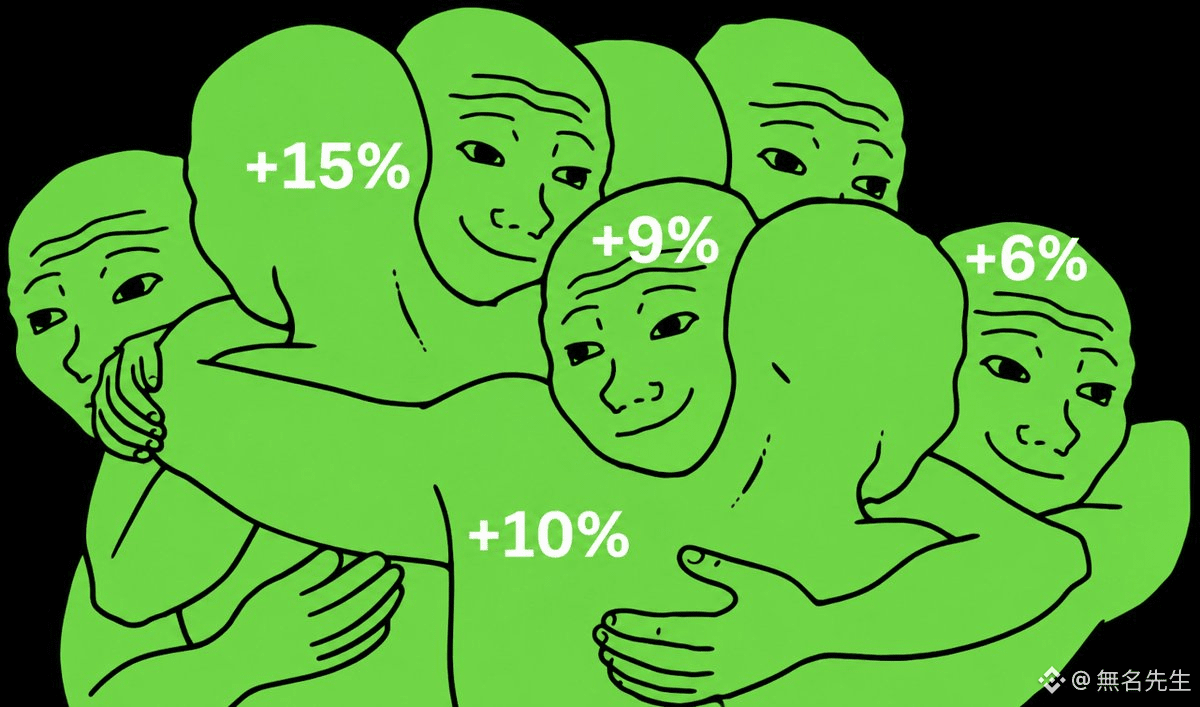
September really was a turning point. The CLARITY Act didn’t pass, and the Fed even raised rates, yet the market didn’t drop—it went up. #BTC closed above the 50-week moving average for two straight weeks, hitting a high around 87K. #ETH reached 2.8K and #SOL hit 120—both are new highs in the past eight months. Total crypto market capitalization has climbed back above $3 trillion.
ETF flows are the main driver. The #BTC ETF saw inflows of $2.65 billion in a single month, while the #ETH ETF brought in $832 million—making it the second-largest monthly inflow of the year. BlackRock’s push on tokenization, plus the NYSE connecting tokenized U.S. equities to 44 million crypto accounts, means institutional moves are happening faster than policy changes.
The #ETH/BTC breakout from the downtrend seen over the past five years is the most critical technical signal for altcoin season. Beyond the CLARITY Act, the SEC and CFTC are moving their own rules forward: staking tokens and buybacks are explicitly defined as non-securities, and the channels for banks to issue stablecoins are also opening up.
Policy is stuck, but regulation is progressing via detours. The market is casting votes with prices—choosing to believe in the latter.
September really was a turning point. The CLARITY Act didn’t pass, and the Fed even raised rates, yet the market didn’t drop—it went up. #BTC closed above the 50-week moving average for two straight weeks, hitting a high around 87K. #ETH reached 2.8K and #SOL hit 120—both are new highs in the past eight months. Total crypto market capitalization has climbed back above $3 trillion.
ETF flows are the main driver. The #BTC ETF saw inflows of $2.65 billion in a single month, while the #ETH ETF brought in $832 million—making it the second-largest monthly inflow of the year. BlackRock’s push on tokenization, plus the NYSE connecting tokenized U.S. equities to 44 million crypto accounts, means institutional moves are happening faster than policy changes.
The #ETH/BTC breakout from the downtrend seen over the past five years is the most critical technical signal for altcoin season. Beyond the CLARITY Act, the SEC and CFTC are moving their own rules forward: staking tokens and buybacks are explicitly defined as non-securities, and the channels for banks to issue stablecoins are also opening up.
Policy is stuck, but regulation is progressing via detours. The market is casting votes with prices—choosing to believe in the latter.
ETF flows are the main driver. The #BTC ETF saw inflows of $2.65 billion in a single month, while the #ETH ETF brought in $832 million—making it the second-largest monthly inflow of the year. BlackRock’s push on tokenization, plus the NYSE connecting tokenized U.S. equities to 44 million crypto accounts, means institutional moves are happening faster than policy changes.
The #ETH/BTC breakout from the downtrend seen over the past five years is the most critical technical signal for altcoin season. Beyond the CLARITY Act, the SEC and CFTC are moving their own rules forward: staking tokens and buybacks are explicitly defined as non-securities, and the channels for banks to issue stablecoins are also opening up.
Policy is stuck, but regulation is progressing via detours. The market is casting votes with prices—choosing to believe in the latter.
321
·
--
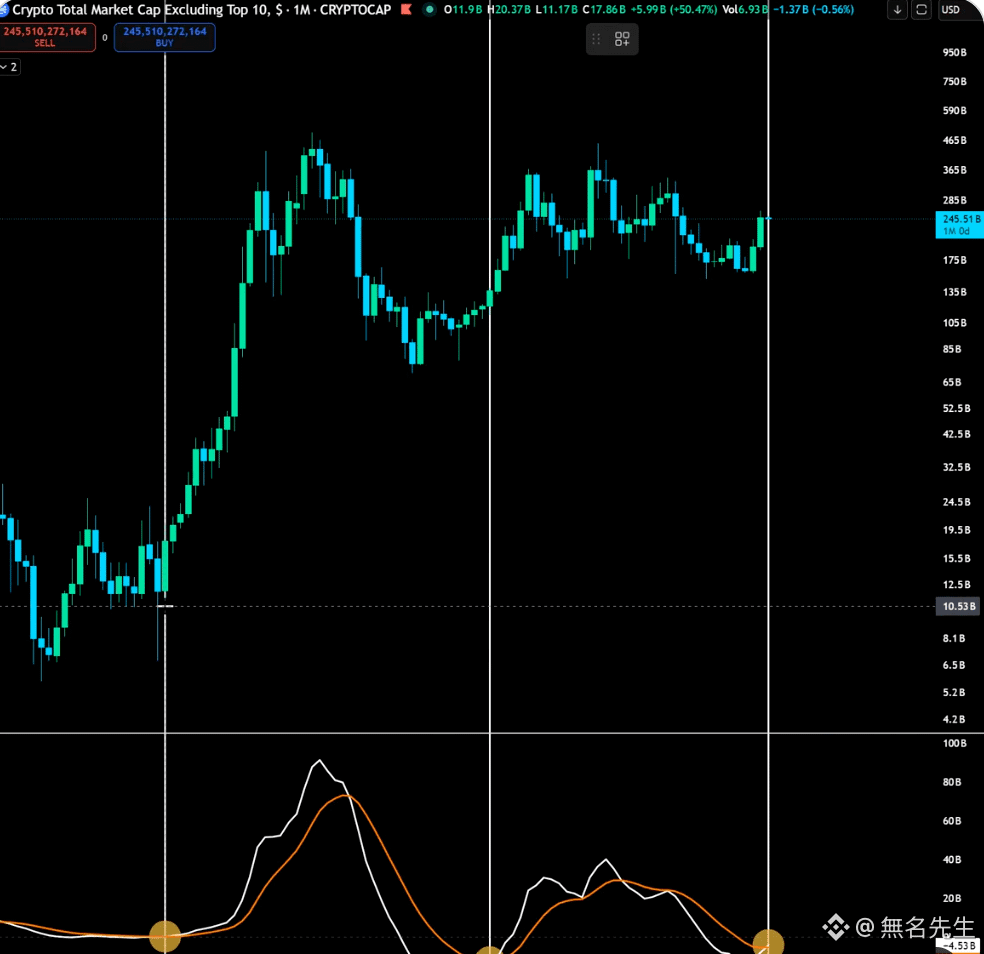
#BTC Monthly MACD Golden Cross is different from that of altcoins; they do not mean the same thing. Bitcoin is much larger in size, so a MACD golden cross usually corresponds to a more stable trend. Altcoins are more volatile—after a golden cross, they may surge sharply, or they may quickly fall back.
The Altseason Index is currently around 61, still some distance from confirming a full altseason at 75. The MACD golden cross is a background signal, not a trigger signal.
#BTC Monthly MACD Golden Cross is different from that of altcoins; they do not mean the same thing. Bitcoin is much larger in size, so a MACD golden cross usually corresponds to a more stable trend. Altcoins are more volatile—after a golden cross, they may surge sharply, or they may quickly fall back.
The Altseason Index is currently around 61, still some distance from confirming a full altseason at 75. The MACD golden cross is a background signal, not a trigger signal.
The Altseason Index is currently around 61, still some distance from confirming a full altseason at 75. The MACD golden cross is a background signal, not a trigger signal.
157
·
--
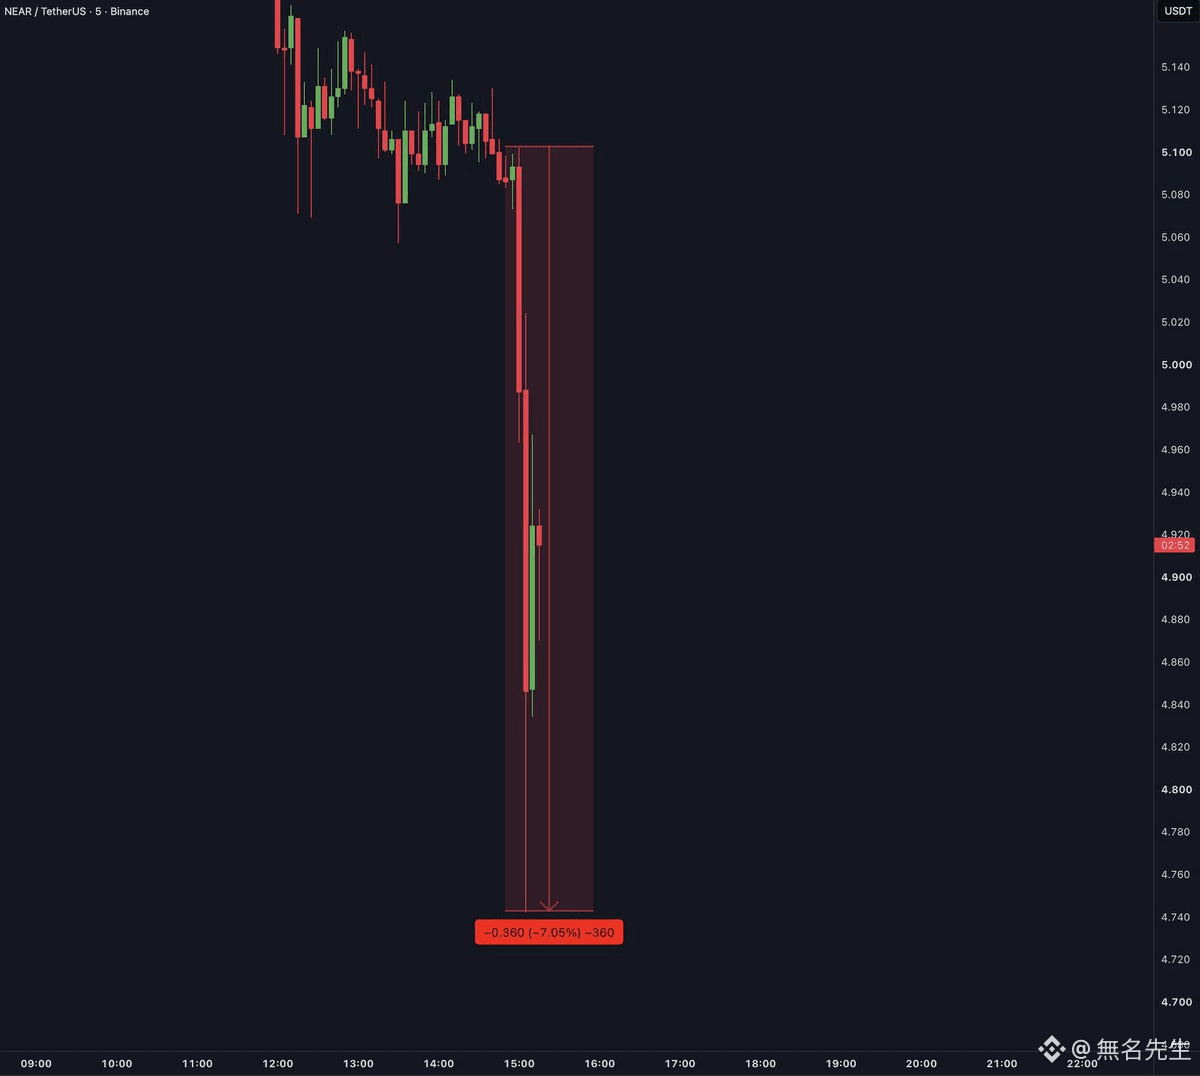
NEAR: The current price is around 2.5. There is still a long way to go before it reaches the high point of 2024, which was above $9. If by “crash” you mean continuing to drop from the current level, then you first need to confirm that it has broken below the recent support zone. The recent low is between 2.3 and 2.4; only if it breaks that level can you talk about acceleration.
The phrase “million-dollar short positions” packages the outcome of a single trade as if it were predictive ability. There are plenty of people who make money shorting, but losing trades are rarely highlighted. Whether the win rate is high or low depends on long-term track records, not on one successful trade.
NEAR’s fundamentals have not clearly deteriorated. Its mainnet activity, developer data, and ecosystem projects are all within normal ranges. If the price weakens, a more likely reason is that the overall market’s risk appetite has fallen—capital is concentrating in mainstream coins rather than there being a problem specific to NEAR.
From a trading perspective, if NEAR breaks below 2.3, the next potential support/entry zone is around 2.0. If 2.3 holds, there may still be a rebound in the short term. The direction depends on the overall market, not NEAR alone.
NEAR: The current price is around 2.5. There is still a long way to go before it reaches the high point of 2024, which was above $9. If by “crash” you mean continuing to drop from the current level, then you first need to confirm that it has broken below the recent support zone. The recent low is between 2.3 and 2.4; only if it breaks that level can you talk about acceleration.
The phrase “million-dollar short positions” packages the outcome of a single trade as if it were predictive ability. There are plenty of people who make money shorting, but losing trades are rarely highlighted. Whether the win rate is high or low depends on long-term track records, not on one successful trade.
NEAR’s fundamentals have not clearly deteriorated. Its mainnet activity, developer data, and ecosystem projects are all within normal ranges. If the price weakens, a more likely reason is that the overall market’s risk appetite has fallen—capital is concentrating in mainstream coins rather than there being a problem specific to NEAR.
From a trading perspective, if NEAR breaks below 2.3, the next potential support/entry zone is around 2.0. If 2.3 holds, there may still be a rebound in the short term. The direction depends on the overall market, not NEAR alone.
The phrase “million-dollar short positions” packages the outcome of a single trade as if it were predictive ability. There are plenty of people who make money shorting, but losing trades are rarely highlighted. Whether the win rate is high or low depends on long-term track records, not on one successful trade.
NEAR’s fundamentals have not clearly deteriorated. Its mainnet activity, developer data, and ecosystem projects are all within normal ranges. If the price weakens, a more likely reason is that the overall market’s risk appetite has fallen—capital is concentrating in mainstream coins rather than there being a problem specific to NEAR.
From a trading perspective, if NEAR breaks below 2.3, the next potential support/entry zone is around 2.0. If 2.3 holds, there may still be a rebound in the short term. The direction depends on the overall market, not NEAR alone.
339
·
--
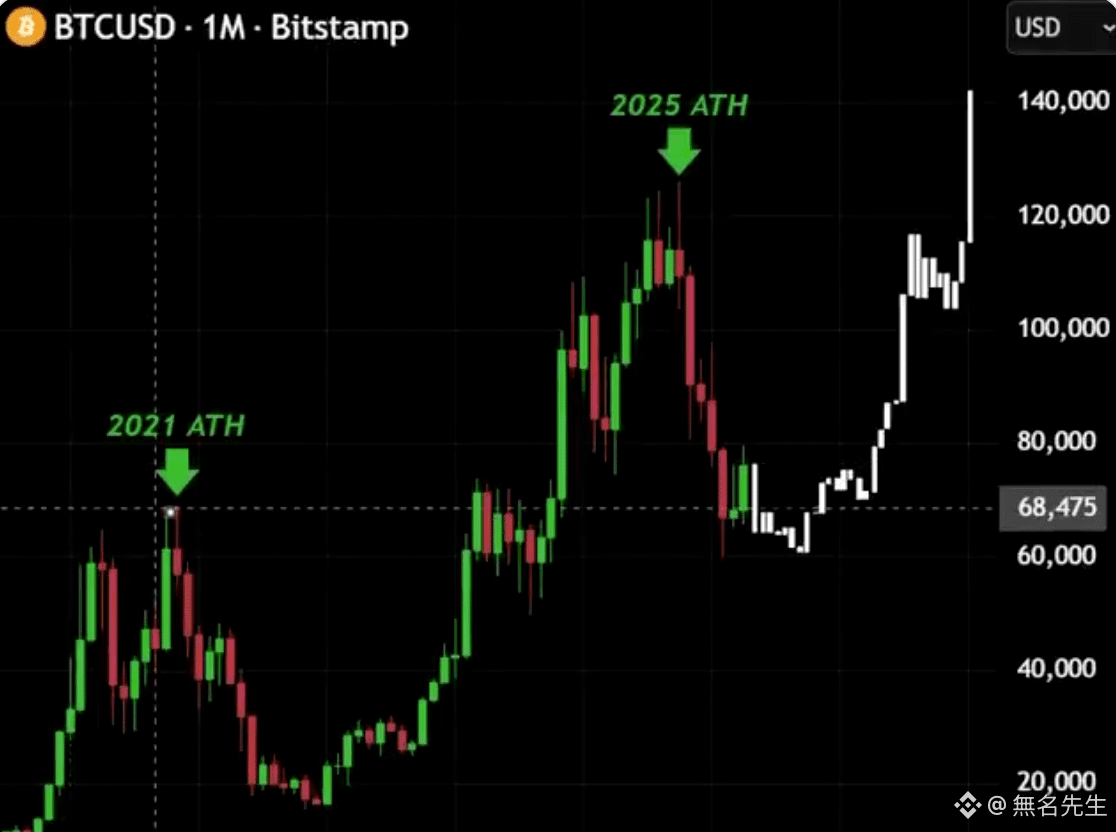
The sync signals between #BTC, #ETH, and altcoins really are increasing. The ETH/BTC has broken through nearly a five-year downtrend and is about to close green for the third consecutive month. Bitcoin’s dominance has fallen to 58.5%, failing to hold above 60%. Altcoin spot trading volume has risen to nearly 4 times that of Bitcoin—its highest level since September 2025.
But the altseason index is still between 60 and 64, far from confirming a full-blown altseason at 75. This round of capital rotation is selective, concentrated on projects with revenue and real-world use cases.
The sync signals between #BTC, #ETH, and altcoins really are increasing. The ETH/BTC has broken through nearly a five-year downtrend and is about to close green for the third consecutive month. Bitcoin’s dominance has fallen to 58.5%, failing to hold above 60%. Altcoin spot trading volume has risen to nearly 4 times that of Bitcoin—its highest level since September 2025.
But the altseason index is still between 60 and 64, far from confirming a full-blown altseason at 75. This round of capital rotation is selective, concentrated on projects with revenue and real-world use cases.
But the altseason index is still between 60 and 64, far from confirming a full-blown altseason at 75. This round of capital rotation is selective, concentrated on projects with revenue and real-world use cases.
282
·
--
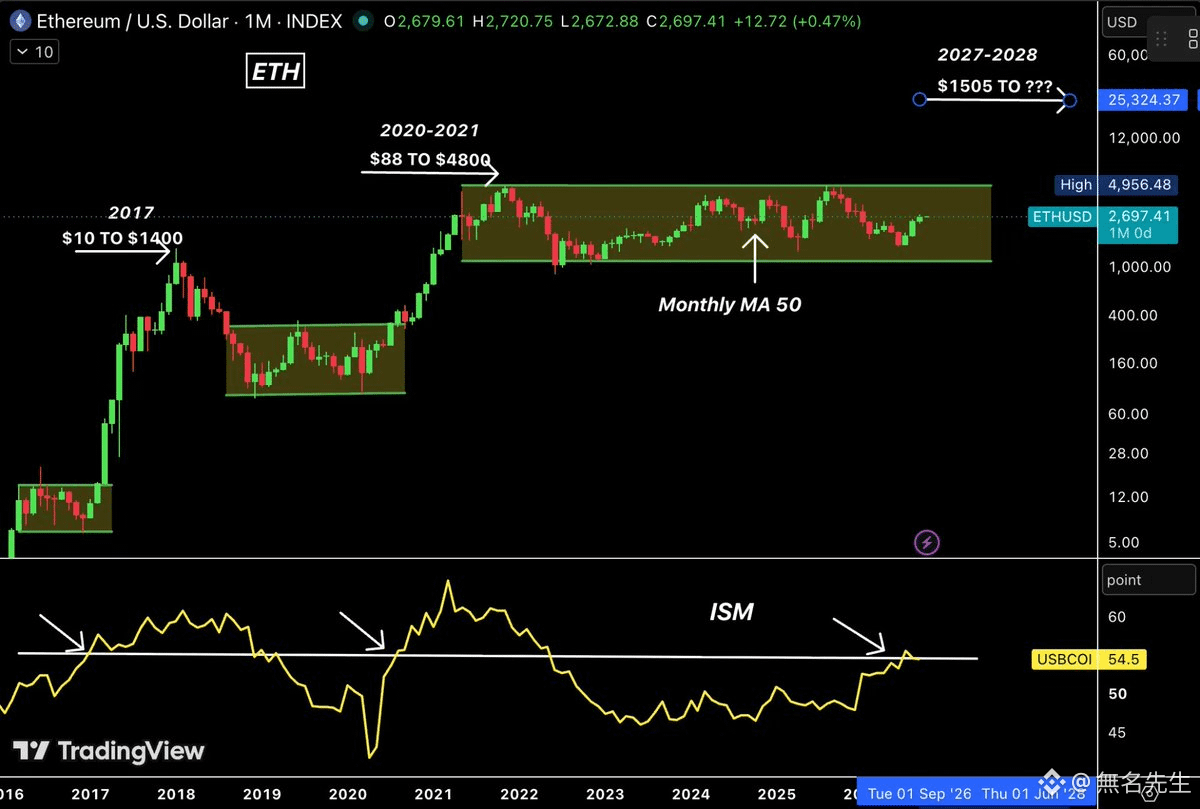
The ETH monthly line’s 50-day moving average is near 2695, and the price is exactly pressing against this line. This is a long-term support reference—holding it means the structure hasn’t broken.
The ISM reading of 54.5 is slightly lower than the prior value, but it’s still in the expansion range. From 54.5 to 56, manufacturing conditions need to improve further. This process may take a few months.
If ISM truly breaks above 56, historically it has corresponded to two instances of explosive upside for #ETH. But historical patterns require conditions to align—it's not that it will automatically happen just because time has come.
The ETH monthly line’s 50-day moving average is near 2695, and the price is exactly pressing against this line. This is a long-term support reference—holding it means the structure hasn’t broken.
The ISM reading of 54.5 is slightly lower than the prior value, but it’s still in the expansion range. From 54.5 to 56, manufacturing conditions need to improve further. This process may take a few months.
If ISM truly breaks above 56, historically it has corresponded to two instances of explosive upside for #ETH. But historical patterns require conditions to align—it's not that it will automatically happen just because time has come.
The ISM reading of 54.5 is slightly lower than the prior value, but it’s still in the expansion range. From 54.5 to 56, manufacturing conditions need to improve further. This process may take a few months.
If ISM truly breaks above 56, historically it has corresponded to two instances of explosive upside for #ETH. But historical patterns require conditions to align—it's not that it will automatically happen just because time has come.
287
·
--
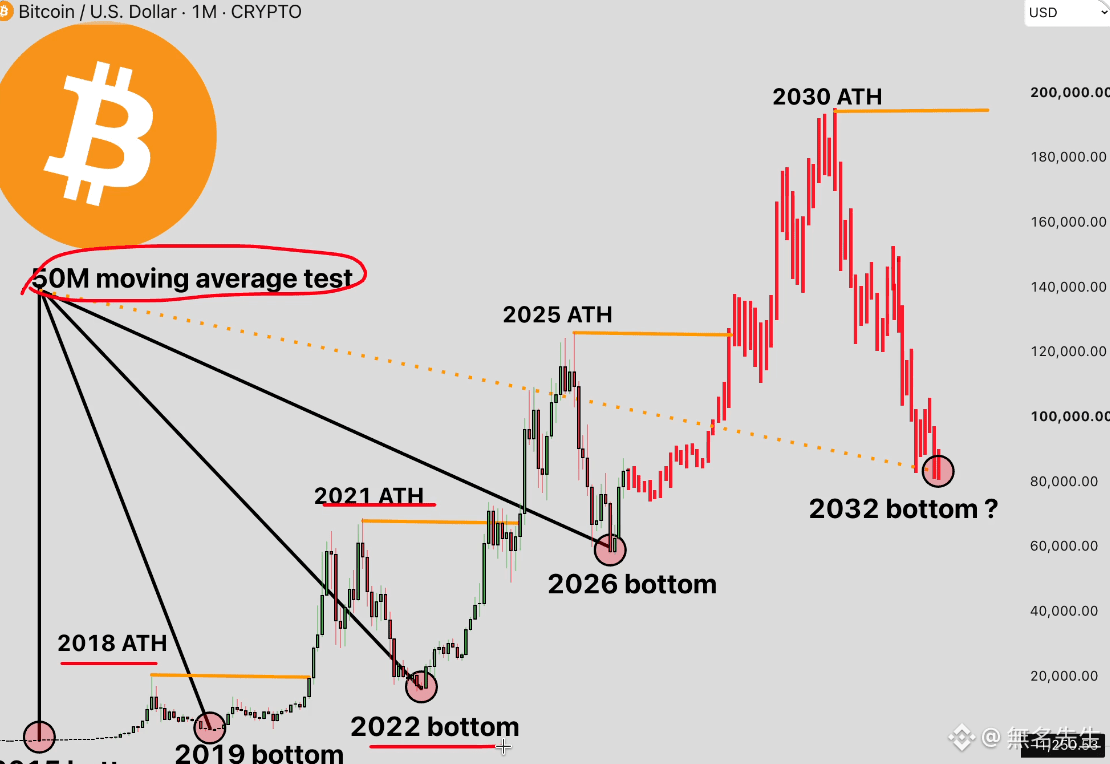
#BTC Where it is now, based on the periodic table, is “bear market season.” But on-chain data shows that 82% of addresses are in profit, UTXO profitability is 80%, and supply profitability is 71%. These numbers are rare in a bear market.
A more reasonable explanation is that the market is pricing in expectations for the next cycle in advance, rather than still digesting the drawdown from the previous cycle. You can use cycles as a reference, but don’t use them to define where we are right now.
#BTC Where it is now, based on the periodic table, is “bear market season.” But on-chain data shows that 82% of addresses are in profit, UTXO profitability is 80%, and supply profitability is 71%. These numbers are rare in a bear market.
A more reasonable explanation is that the market is pricing in expectations for the next cycle in advance, rather than still digesting the drawdown from the previous cycle. You can use cycles as a reference, but don’t use them to define where we are right now.
A more reasonable explanation is that the market is pricing in expectations for the next cycle in advance, rather than still digesting the drawdown from the previous cycle. You can use cycles as a reference, but don’t use them to define where we are right now.
176
·
--
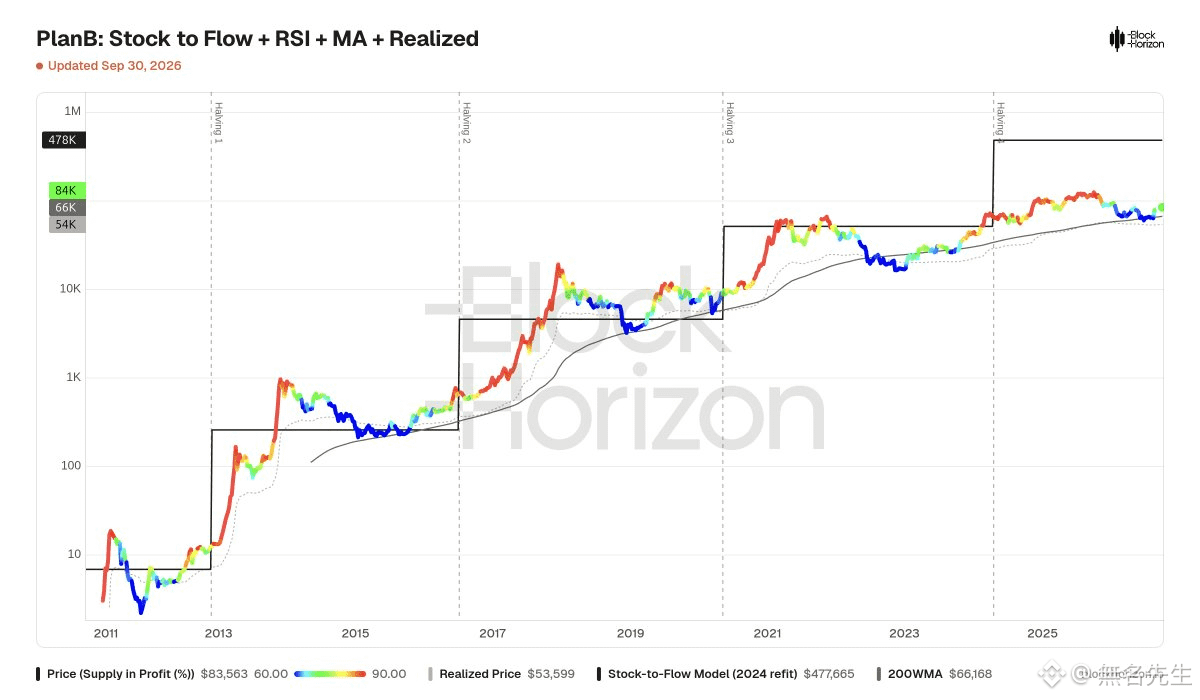
#BTC's September closing price is 83,563. Profitable addresses are 82%, profitable UTXOs are 80%, and profitable supply is 71%.
All three profitability indicators are above 70%, but they're still some distance away from the overheated range of above 90%. This means market sentiment is warm, but not yet to the point of extreme greed.
#BTC's September closing price is 83,563. Profitable addresses are 82%, profitable UTXOs are 80%, and profitable supply is 71%.
All three profitability indicators are above 70%, but they're still some distance away from the overheated range of above 90%. This means market sentiment is warm, but not yet to the point of extreme greed.
All three profitability indicators are above 70%, but they're still some distance away from the overheated range of above 90%. This means market sentiment is warm, but not yet to the point of extreme greed.
190
·
--
Historical data shows that in October Bitcoin indeed exhibits a strong positive return tendency. From 2010 to 2024, the monthly returns in October were almost all positive—only 2014 and 2018 were exceptions. Even more noteworthy is that October 2017, 2021, and 2023 all marked the start of, or continued, a significant uptrend, with gains of +46%, +41%, and +29%, respectively.
The backdrop for 2026 is different: the market is still in an extreme fear range, with Bitcoin trading around $58,000–$60,000. But historically, October rebounds often occur at times when market sentiment is equally bleak. If the historical patterns hold, $60,000 could be the key turning point for this cycle.
Historical data shows that in October Bitcoin indeed exhibits a strong positive return tendency. From 2010 to 2024, the monthly returns in October were almost all positive—only 2014 and 2018 were exceptions. Even more noteworthy is that October 2017, 2021, and 2023 all marked the start of, or continued, a significant uptrend, with gains of +46%, +41%, and +29%, respectively.
The backdrop for 2026 is different: the market is still in an extreme fear range, with Bitcoin trading around $58,000–$60,000. But historically, October rebounds often occur at times when market sentiment is equally bleak. If the historical patterns hold, $60,000 could be the key turning point for this cycle.
The backdrop for 2026 is different: the market is still in an extreme fear range, with Bitcoin trading around $58,000–$60,000. But historically, October rebounds often occur at times when market sentiment is equally bleak. If the historical patterns hold, $60,000 could be the key turning point for this cycle.
1
372
·
--
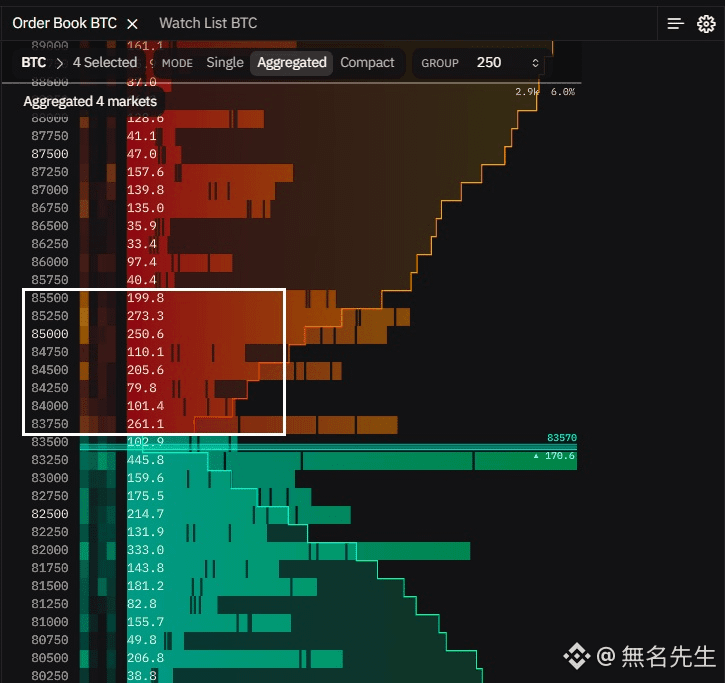
Bitcoin’s sideways consolidation isn’t without reason. Sell orders are stacked above 85,500, and every time the price reaches there, it gets blocked.
If that level gets eaten, it means the buy side is strong enough and the direction may change. If it keeps failing to break through, then just wait.
Bitcoin’s sideways consolidation isn’t without reason. Sell orders are stacked above 85,500, and every time the price reaches there, it gets blocked.
If that level gets eaten, it means the buy side is strong enough and the direction may change. If it keeps failing to break through, then just wait.
If that level gets eaten, it means the buy side is strong enough and the direction may change. If it keeps failing to break through, then just wait.
2
191
·
--
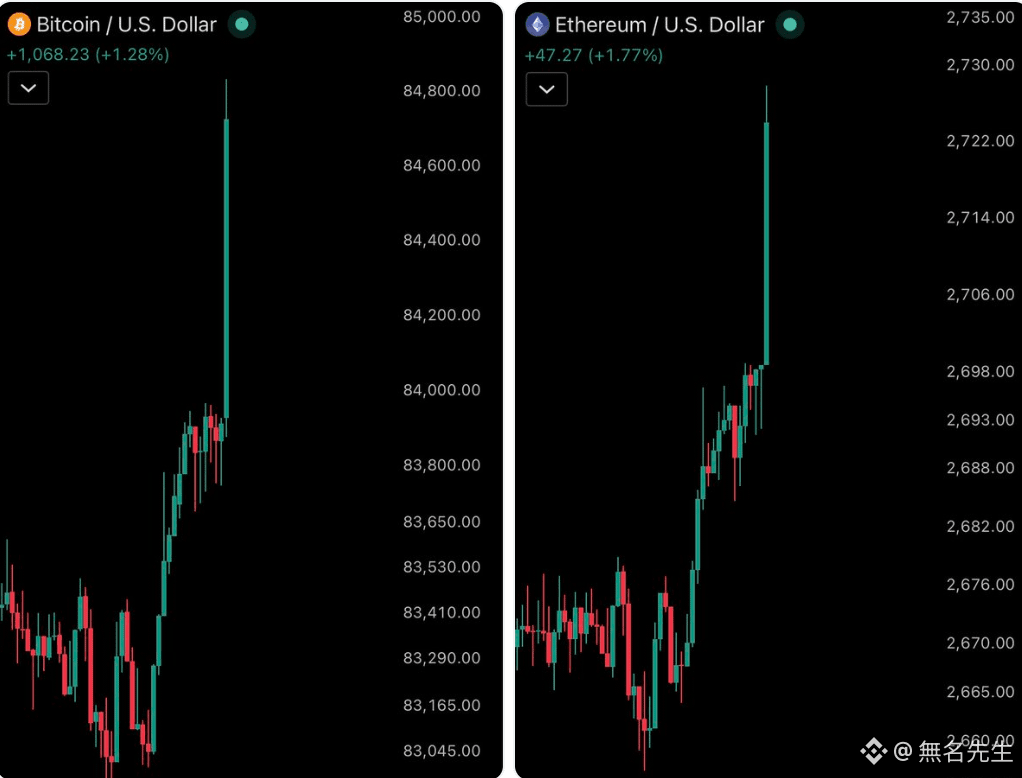
BTC and ETH rising in sync suggests this is macro-level capital flows, not an independent narrative for a particular coin.
PCE is moderate, the US dollar is falling, and risk appetite is picking up. In this kind of environment, crypto typically benefits alongside stocks and gold.
However, keep in mind that there is selling pressure above BTC at 85K to 86K, and the 2,800 level for ETH is resistance on the weekly timeframe. Just because it’s up today doesn’t mean it can break through tomorrow. Wait for confirmation.
BTC and ETH rising in sync suggests this is macro-level capital flows, not an independent narrative for a particular coin.
PCE is moderate, the US dollar is falling, and risk appetite is picking up. In this kind of environment, crypto typically benefits alongside stocks and gold.
However, keep in mind that there is selling pressure above BTC at 85K to 86K, and the 2,800 level for ETH is resistance on the weekly timeframe. Just because it’s up today doesn’t mean it can break through tomorrow. Wait for confirmation.
PCE is moderate, the US dollar is falling, and risk appetite is picking up. In this kind of environment, crypto typically benefits alongside stocks and gold.
However, keep in mind that there is selling pressure above BTC at 85K to 86K, and the 2,800 level for ETH is resistance on the weekly timeframe. Just because it’s up today doesn’t mean it can break through tomorrow. Wait for confirmation.
2
472
·
--
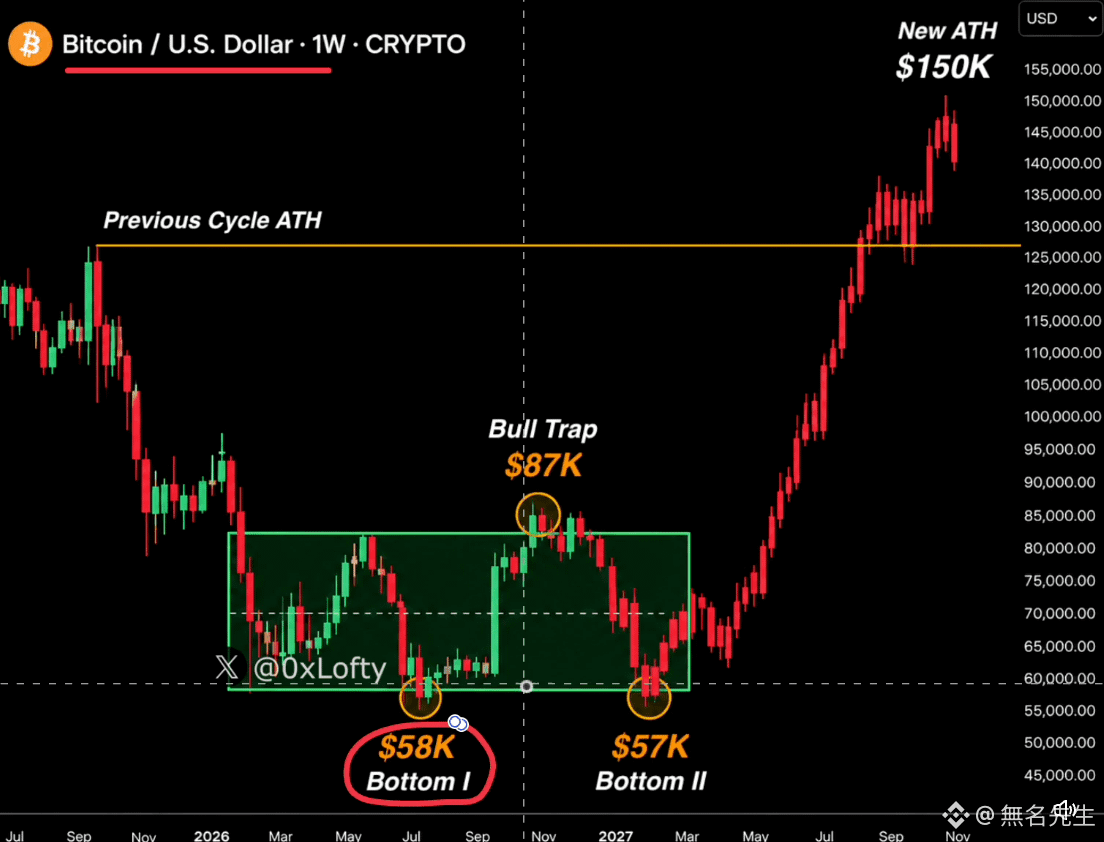
#BTC's false breakout has been confirmed, but the claim of a “final liquidation” is coming too fast. One candlestick can’t define a trend—the real direction depends on the depth of the pullback and the strength of the support.
#BTC's false breakout has been confirmed, but the claim of a “final liquidation” is coming too fast. One candlestick can’t define a trend—the real direction depends on the depth of the pullback and the strength of the support.
169
Log in to explore more content
Join global crypto users on Binance Square
⚡️ Get latest and useful information about crypto.
💬 Trusted by the world’s largest crypto exchange.
👍 Discover real insights from verified creators.
Email / Phone number
Trending Topics
ZcashETFPostsFirstWeeklyOutflow$93.6M
42,660 views
135 Discussing
#ZcashETFPostsFirstWeeklyOutflow$93.6M
Zcash ETF’s first weekly outflow of $93.6 million signals weakening investor demand and possible profit-booking. This could put short-term pressure on ZEC’s price and hurt sentiment across privacy-focused cryptocurrencies. Traders should watch support levels and further fund flows before taking positions.
Eram Trading Lab
·0 Likes
·72 views
GreekPoliceBustCryptoScamRingArrest17
105,758 views
804 Discussing
BitcoinRejectedAt$87K
136,092 views
193 Discussing