BNB Faces Selling Pressure – What's Next? 🔍
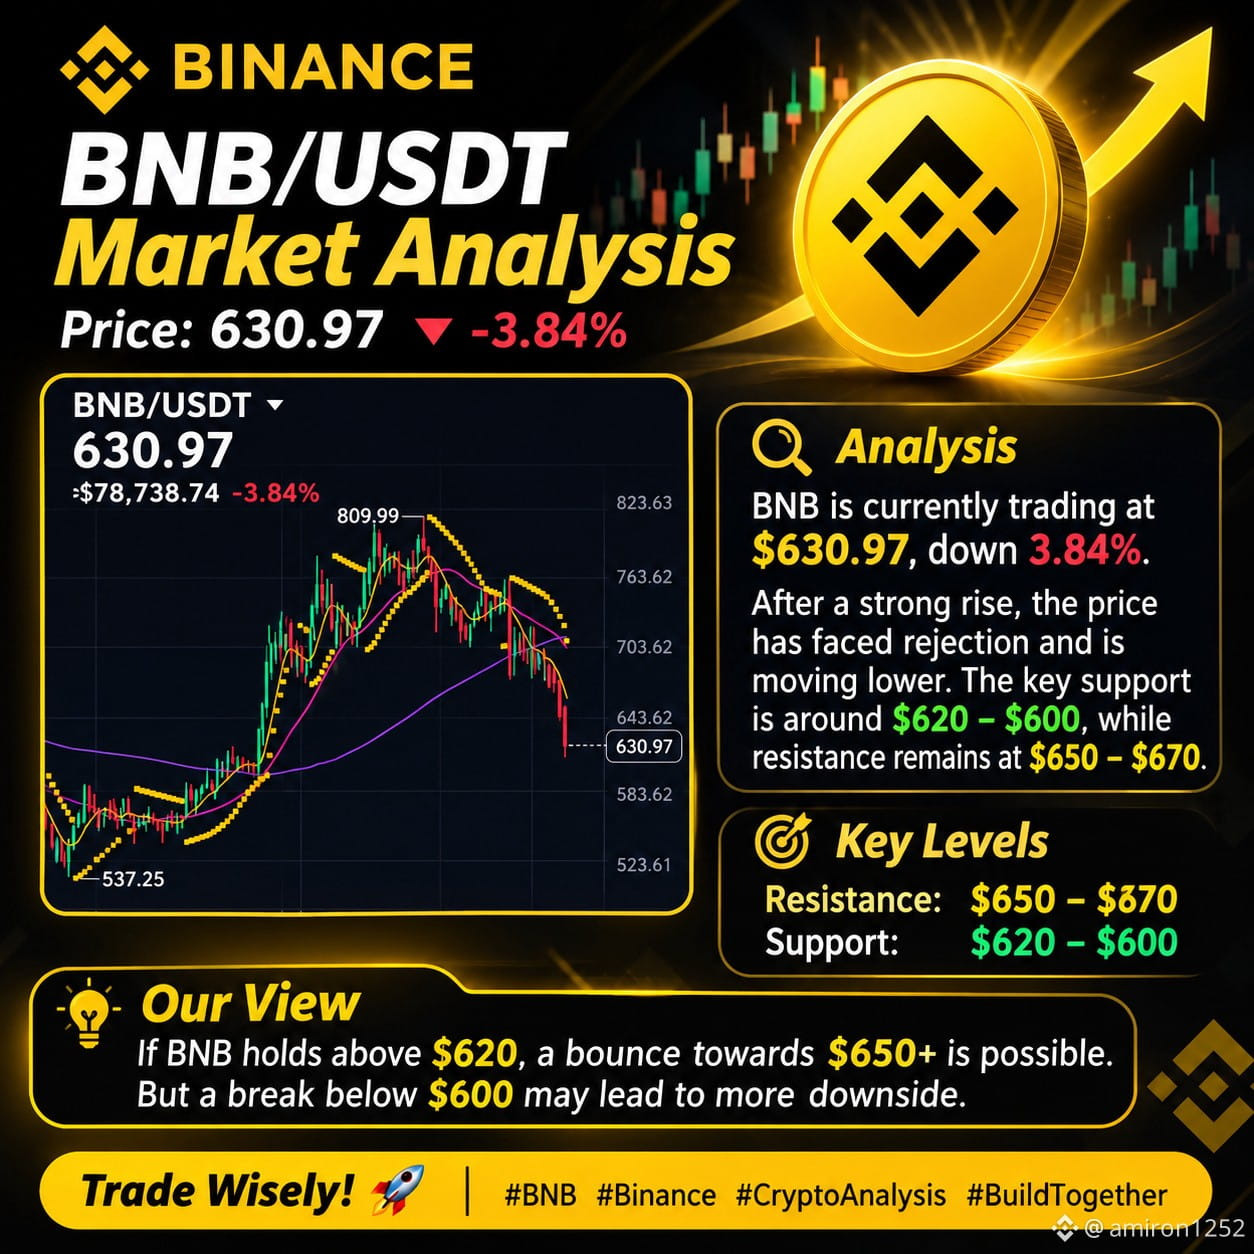
BNB is currently trading around $630.97, down 3.84% in the last 24 hours.
On the 1D chart, BNB is showing bearish momentum. The price is trading below MA(7), MA(25), and MA(99), indicating that sellers are currently in control. Key Support Zones: $622 – $600
📈 Resistance Zones: $650 – $670
My Market Outlook:
If BNB holds above the $620 support zone, a recovery towards $650 could be possible.
However, a breakdown below $600 may bring further downside pressure.
🎯 Keep an eye on volume and price action before making any trading decisions.
What do you think? Will BNB recover or drop further? 🚀
#BNB_Market_Update #Binance #CryptoAnalysis #BNB走势 #CryptoMarket
BNB is currently trading around $630.97, down 3.84% in the last 24 hours.
On the 1D chart, BNB is showing bearish momentum. The price is trading below MA(7), MA(25), and MA(99), indicating that sellers are currently in control. Key Support Zones: $622 – $600
📈 Resistance Zones: $650 – $670
My Market Outlook:
If BNB holds above the $620 support zone, a recovery towards $650 could be possible.
However, a breakdown below $600 may bring further downside pressure.
🎯 Keep an eye on volume and price action before making any trading decisions.
What do you think? Will BNB recover or drop further? 🚀
#BNB_Market_Update #Binance #CryptoAnalysis #BNB走势 #CryptoMarket