

#sky
sky
823,369 views
4,080 Discussing
Hot
Latest

·
--
Everyone is watching the red candle. I’m watching $SKY volume.
Price is $0.0645, down 5.77%, but $3.54M has traded today, about 1.7x the 20-day average. That is not sleepy selling. 👀
The 4h chart just lost another 4.8%. RSI is 30, yet price is still below both the 20d and 50d averages. Oversold does not automatically mean reversal.
Longs are paying 0.005% funding into this weakness. That’s the bit I’m watching, because $ETH isn’t showing this same forced pressure.
At $0.0645, I’d want to see a reclaim before getting interested. Sellers still own the chart. ⚠️
Holding or fading $SKY?
#SKY #Crypto #Altcoin
Everyone is watching the red candle. I’m watching $SKY volume.
Price is $0.0645, down 5.77%, but $3.54M has traded today, about 1.7x the 20-day average. That is not sleepy selling. 👀
The 4h chart just lost another 4.8%. RSI is 30, yet price is still below both the 20d and 50d averages. Oversold does not automatically mean reversal.
Longs are paying 0.005% funding into this weakness. That’s the bit I’m watching, because $ETH isn’t showing this same forced pressure.
At $0.0645, I’d want to see a reclaim before getting interested. Sellers still own the chart. ⚠️
Holding or fading $SKY ?
#SKY #Crypto #Altcoin

·
--
#sky
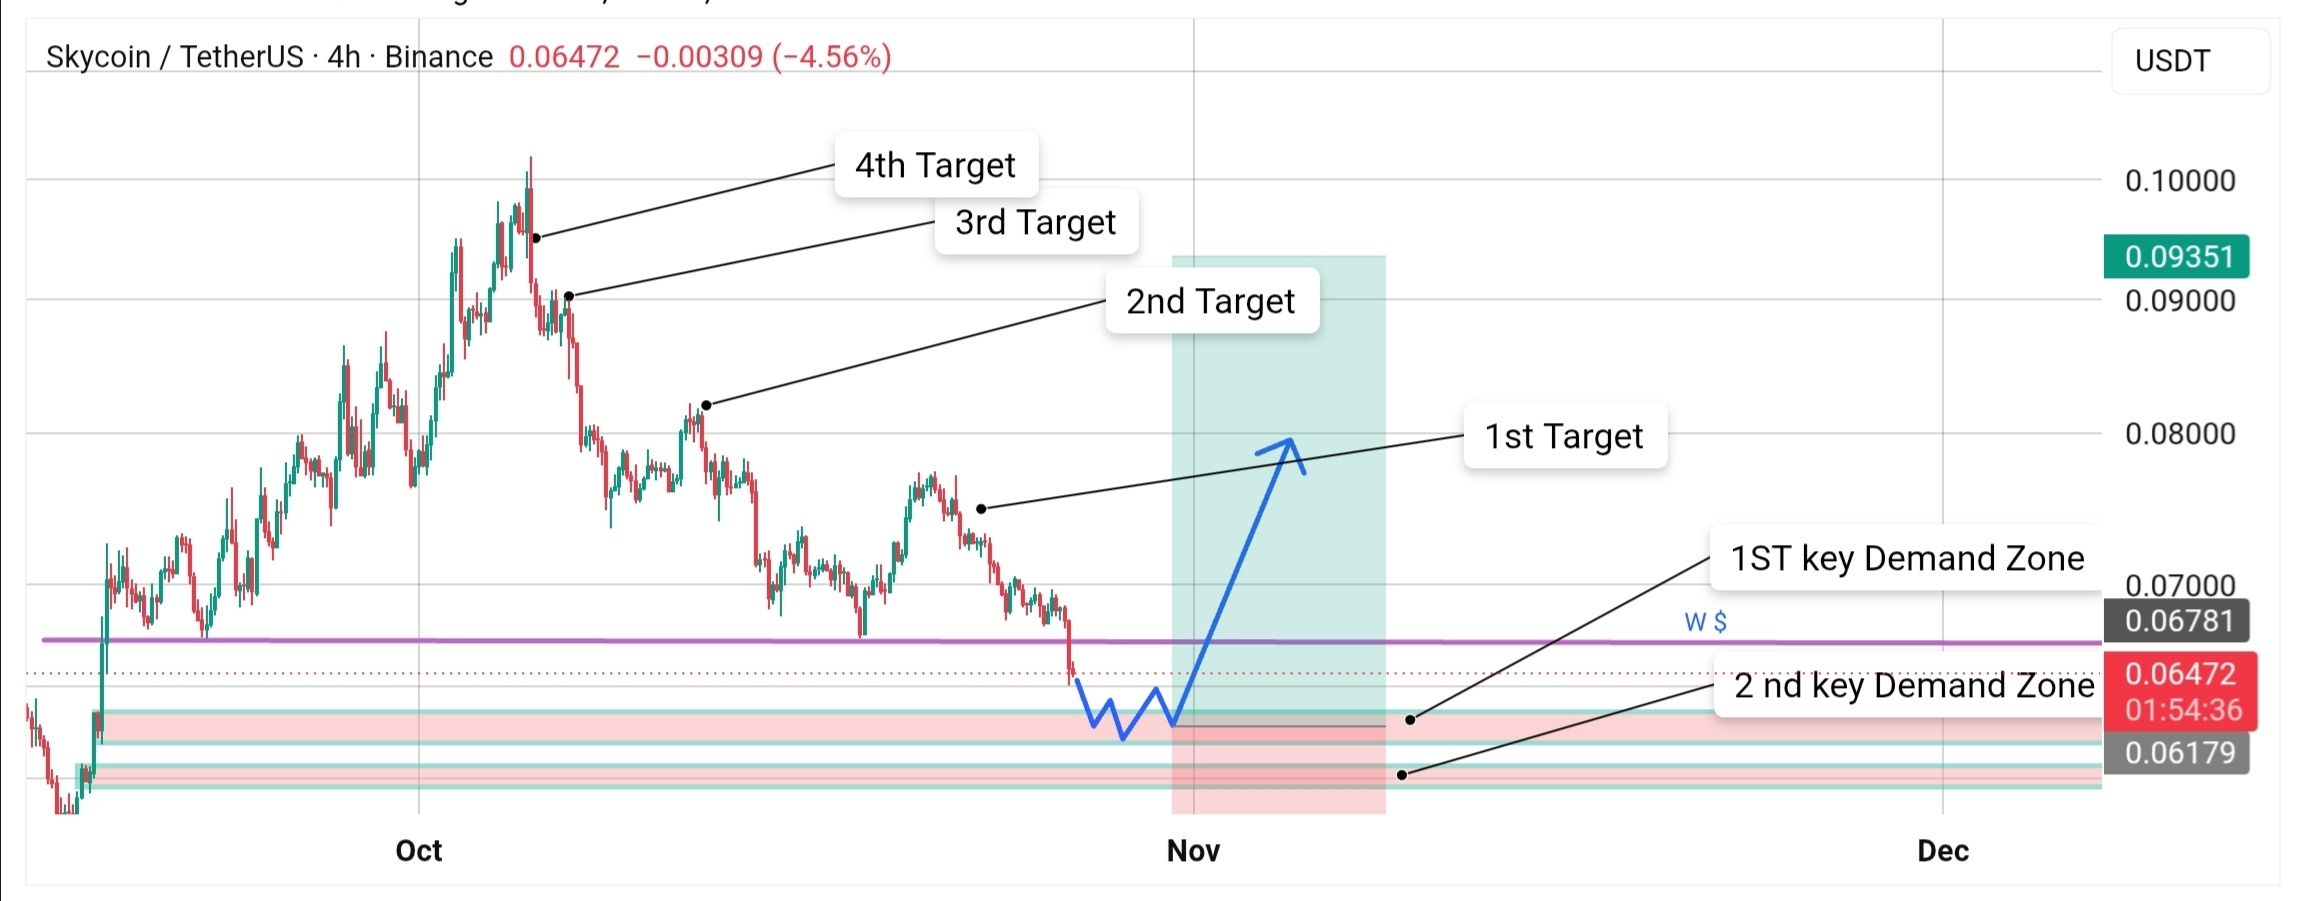
Skycoin (SKY/USDT) 4H Setup: Reaching Key Demand & Ready for Rebound! 📊
Hey Binance Square family! Let’s analyze the Skycoin (SKY) 4-Hour chart. SKY is currently trading around $0.0647, pulling back smoothly into a high-confluence institutional demand area and setting up an attractive long opportunity for a strong upside expansion.
Here is the complete technical analysis and trade setup for the upcoming sessions:
📉 Technical Analysis Breakdown
Current Market Context: SKY has experienced a corrective wave down from previous local highs, sweeping lower liquidity pools and approaching the 1st and 2nd Key Demand Zones (~$0.0617 to $0.0678).
Price Action & Reversal Path: The chart structure highlights a classic double-bottom/sweep reaction inside the discount zone followed by an impulsive upward impulse path heading toward higher targets.
🎯 Exact Trade Setup Parameters
Asset / Pair: Skycoin / USDT (Binance 4H Chart)
Position Type: Long 🟢
Entry Zone: $0.0618 – $0.0650 (Accumulating inside the key demand zones)
Stop-Loss (SL): $0.0590 (Placed safely below the structural demand zones to invalidate the setup if support fails)
📈 Take-Profit (TP) Targets
1st Target: $0.0750 (Initial resistance & minor liquidity pool)
2nd Target: $0.0820 (Mid-range structural supply level)
3rd Target: $0.0880 (High-timeframe continuation level)
4th Target: $0.0935+ (Upper target zone & major previous swing high resistance)
🤔 What do you think, Binance Square?
Do you think SKY will hold this key demand area and power through to Target 4, or will we see more range consolidation first?
Drop your thoughts and targets in the comments below! 👇💬
$SKY
{future}(SKYUSDT)
$BTC
{future}(BTCUSDT)
$SAGA
{future}(SAGAUSDT)
#Skycoin #SKY #CryptoTrading #BinanceSquare #TechnicalAnalysis #Altcoins #TradingSetup
#sky
Skycoin (SKY/USDT) 4H Setup: Reaching Key Demand & Ready for Rebound! 📊
Hey Binance Square family! Let’s analyze the Skycoin (SKY) 4-Hour chart. SKY is currently trading around $0.0647, pulling back smoothly into a high-confluence institutional demand area and setting up an attractive long opportunity for a strong upside expansion.
Here is the complete technical analysis and trade setup for the upcoming sessions:
📉 Technical Analysis Breakdown
Current Market Context: SKY has experienced a corrective wave down from previous local highs, sweeping lower liquidity pools and approaching the 1st and 2nd Key Demand Zones (~$0.0617 to $0.0678).
Price Action & Reversal Path: The chart structure highlights a classic double-bottom/sweep reaction inside the discount zone followed by an impulsive upward impulse path heading toward higher targets.
🎯 Exact Trade Setup Parameters
Asset / Pair: Skycoin / USDT (Binance 4H Chart)
Position Type: Long 🟢
Entry Zone: $0.0618 – $0.0650 (Accumulating inside the key demand zones)
Stop-Loss (SL): $0.0590 (Placed safely below the structural demand zones to invalidate the setup if support fails)
📈 Take-Profit (TP) Targets
1st Target: $0.0750 (Initial resistance & minor liquidity pool)
2nd Target: $0.0820 (Mid-range structural supply level)
3rd Target: $0.0880 (High-timeframe continuation level)
4th Target: $0.0935+ (Upper target zone & major previous swing high resistance)
🤔 What do you think, Binance Square?
Do you think SKY will hold this key demand area and power through to Target 4, or will we see more range consolidation first?
Drop your thoughts and targets in the comments below! 👇💬
$SKY
$BTC
$SAGA
#Skycoin #SKY #CryptoTrading #BinanceSquare #TechnicalAnalysis #Altcoins #TradingSetup
1
432

·
--
Article
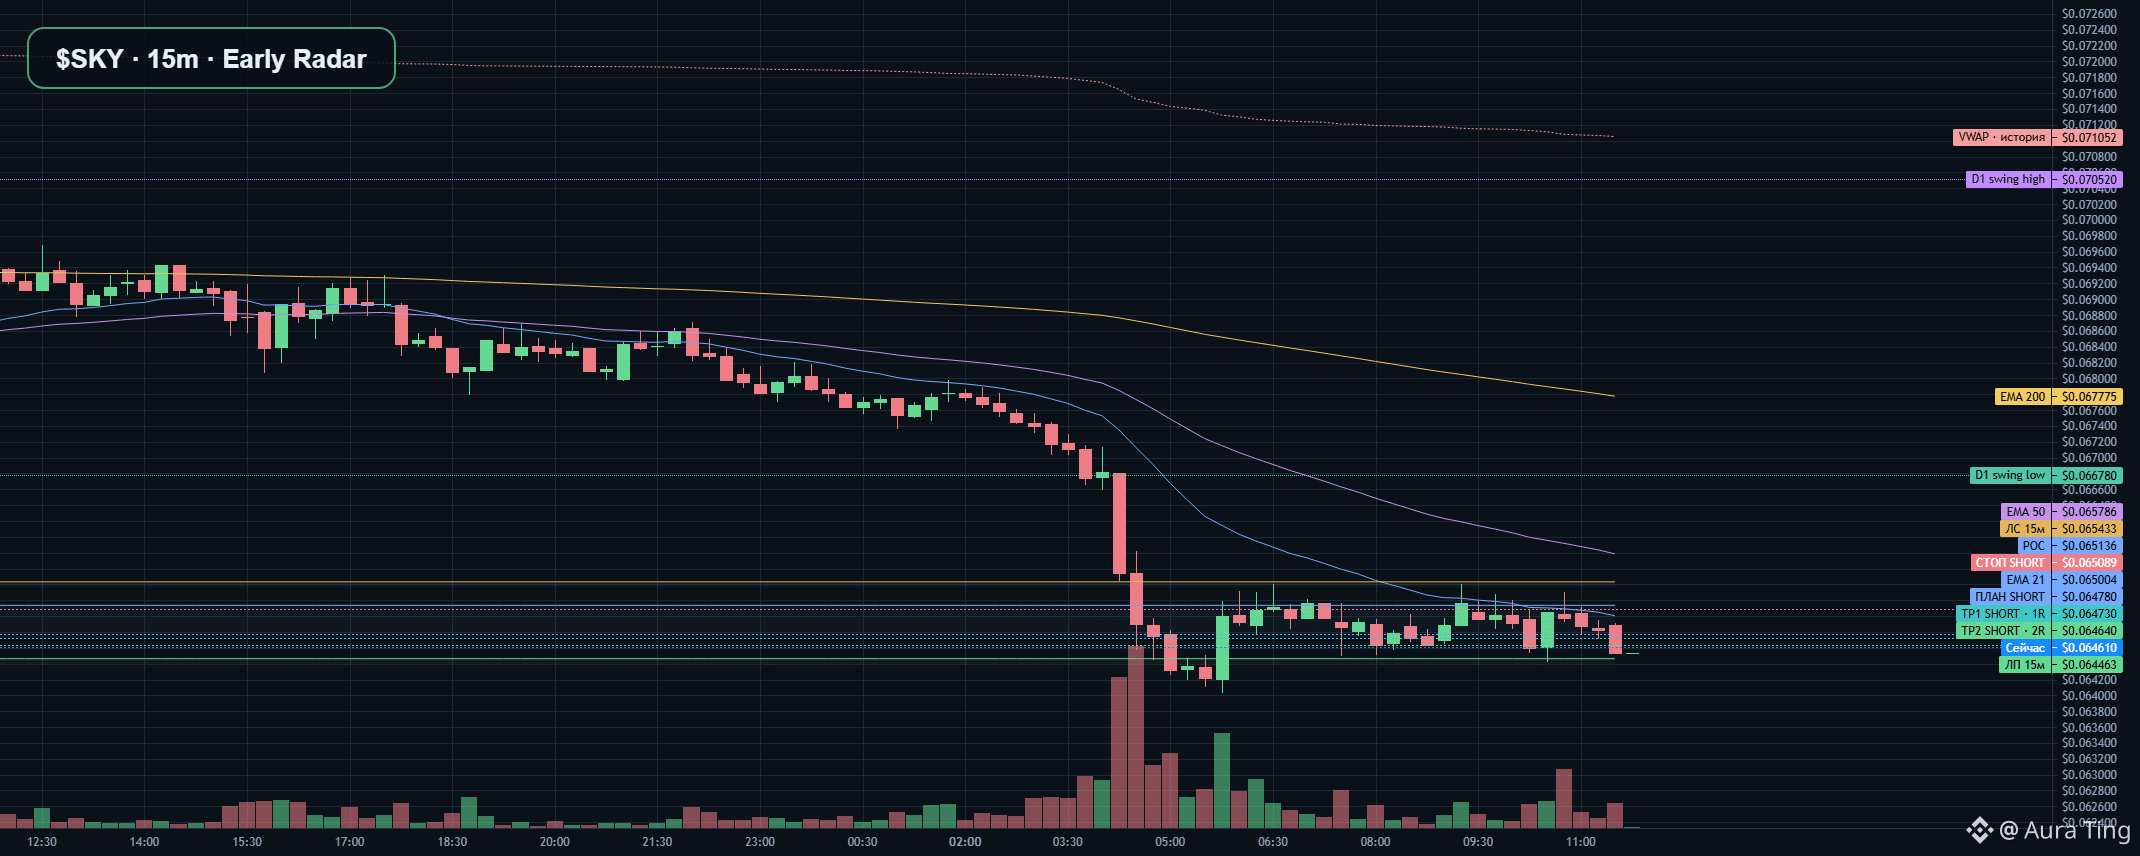
SKY · Early Radar⚡ $SKY · SHORT scenario target reached.
close 0.0645 / level 0.0648
📉 SHORT · $SKY (SKY/USDT) · downside scenario · context 15m, indicators 15m, trigger 5m
📍 Scenario: entry was recalculated from current price; waiting for a new closed 5m candle below it.
📊 MARKET
💵 Price: $0.06461 · 1h -0.72% · 24h -6.89%.
💧 1h volume: $139,643.215 · trades 736.
📊 M5 activity: volume $26,325.405 · trades 83 · activity score 47/100.
📚 Order book ±1%: depth $176,673.4587 · spread 0.03%.
🛡️ DATA CHECKS AND MARKET TYPE
✅ Data audit: passed · 5m/15m closed-candle checks are passed.
✅ Market quality: passed.
🛡️ Risk assessment: BLOCKED · mandatory checks did not pass ❗
🏷️ Context: Spot analytical hypothesis; no short position is opened automatically.
🧭 TECHNICAL PICTURE
🧭 Trigger state: entry was recalculated from current price; waiting for a new closed 5m candle below it.
📍 Historical Premium zone does not set this entry; levels use current price, ATR and closed-candle structure.
🔎 Trigger checks:
🔵 Current entry: $0.06478.
🕯️ New closed 5m below entry: waiting ❗
🕯️ 5m candle context: confirmation is not available ❗
📉 SHORT context: price is below EMA50 and VWAP (15m).
📊 Indicators:
〽️ EMA 21: $0.06500389 · price below
〽️ EMA 50: $0.06578588 · price below
〽️ EMA 200: $0.067523 · price below
⚖️ VWAP: $0.06692955 · price below
🌡️ RSI 14: 37.5
🧱 STRUCTURE AND PD ARRAY
📐 24h dealing range: $0.06404–$0.06968 · EQ $0.06686 · price is in Discount.
🧱 No verified OB/BB/PD Array in the required range half ❗
💎 Premium/Discount is context only; the current SHORT plan does not require a historical Premium zone. ❗
🎯 OBSERVATION PLAN
🔻 SHORT entry: current price $0.06478; confirmation requires a 5m close below · pending.
🛑 SHORT stop/invalidation: a 5m close above $0.06508857.
🎯 SHORT TP1 · 1R: $0.06473.
🏁 SHORT TP2 · 2R: $0.06464.
🛑 SHORT stop uses ATR14 5m: 1.50 ATR · undefined PLUS ATR BUFFER.
🧪 STATISTICS
📈 Confirmed downside impulses in 24h: 7.
🎲 Probability: no calibrated percentage yet; retest outcomes are still insufficient.
⚠️ Analytical draft only, not a trading recommendation or order. Verify levels on the chart and account for your own risk ❗
#SKY #CryptoAnalysis #Earlyradar #BinanceSquare #UnrecognizedTag
SKY · Early Radar
⚡ $SKY · SHORT scenario target reached.
close 0.0645 / level 0.0648
📉 SHORT · $SKY (SKY/USDT) · downside scenario · context 15m, indicators 15m, trigger 5m
📍 Scenario: entry was recalculated from current price; waiting for a new closed 5m candle below it.
📊 MARKET
💵 Price: $0.06461 · 1h -0.72% · 24h -6.89%.
💧 1h volume: $139,643.215 · trades 736.
📊 M5 activity: volume $26,325.405 · trades 83 · activity score 47/100.
📚 Order book ±1%: depth $176,673.4587 · spread 0.03%.
🛡️ DATA CHECKS AND MARKET TYPE
✅ Data audit: passed · 5m/15m closed-candle checks are passed.
✅ Market quality: passed.
🛡️ Risk assessment: BLOCKED · mandatory checks did not pass ❗
🏷️ Context: Spot analytical hypothesis; no short position is opened automatically.
🧭 TECHNICAL PICTURE
🧭 Trigger state: entry was recalculated from current price; waiting for a new closed 5m candle below it.
📍 Historical Premium zone does not set this entry; levels use current price, ATR and closed-candle structure.
🔎 Trigger checks:
🔵 Current entry: $0.06478.
🕯️ New closed 5m below entry: waiting ❗
🕯️ 5m candle context: confirmation is not available ❗
📉 SHORT context: price is below EMA50 and VWAP (15m).
📊 Indicators:
〽️ EMA 21: $0.06500389 · price below
〽️ EMA 50: $0.06578588 · price below
〽️ EMA 200: $0.067523 · price below
⚖️ VWAP: $0.06692955 · price below
🌡️ RSI 14: 37.5
🧱 STRUCTURE AND PD ARRAY
📐 24h dealing range: $0.06404–$0.06968 · EQ $0.06686 · price is in Discount.
🧱 No verified OB/BB/PD Array in the required range half ❗
💎 Premium/Discount is context only; the current SHORT plan does not require a historical Premium zone. ❗
🎯 OBSERVATION PLAN
🔻 SHORT entry: current price $0.06478; confirmation requires a 5m close below · pending.
🛑 SHORT stop/invalidation: a 5m close above $0.06508857.
🎯 SHORT TP1 · 1R: $0.06473.
🏁 SHORT TP2 · 2R: $0.06464.
🛑 SHORT stop uses ATR14 5m: 1.50 ATR · undefined PLUS ATR BUFFER.
🧪 STATISTICS
📈 Confirmed downside impulses in 24h: 7.
🎲 Probability: no calibrated percentage yet; retest outcomes are still insufficient.
⚠️ Analytical draft only, not a trading recommendation or order. Verify levels on the chart and account for your own risk ❗
#SKY #CryptoAnalysis #Earlyradar #BinanceSquare #UnrecognizedTag

🚨 SELLERS TAKING CONTROL AS $SKY MOMENTUM FADES NEAR RESISTANCE! 📉
Entry: 0.06826 ⚡
Target: 0.06482 🎯
Stop Loss: 0.07056 ⚠️
Buyers are losing their grip on $SKY as momentum quietly fades right at local resistance. 📉 The order flow reveals heavy bid absorption, signaling that supply is stepping in to cap the upside.
📊 Volume is rolling over on lower timeframes, preparing for a sharp mean-reversion drop into deeper liquidity layers. 📌 Once support yields, this pullback could trigger a swift cascading move lower. 💬 Are you taking the short flip here or waiting for support to get swept? 👇
⚠️ Not financial advice. Always manage your risk. 🛡️
🏷️ #SKY #ShortSetup #Crypto #Trading #Bearish
📉 🎯
6

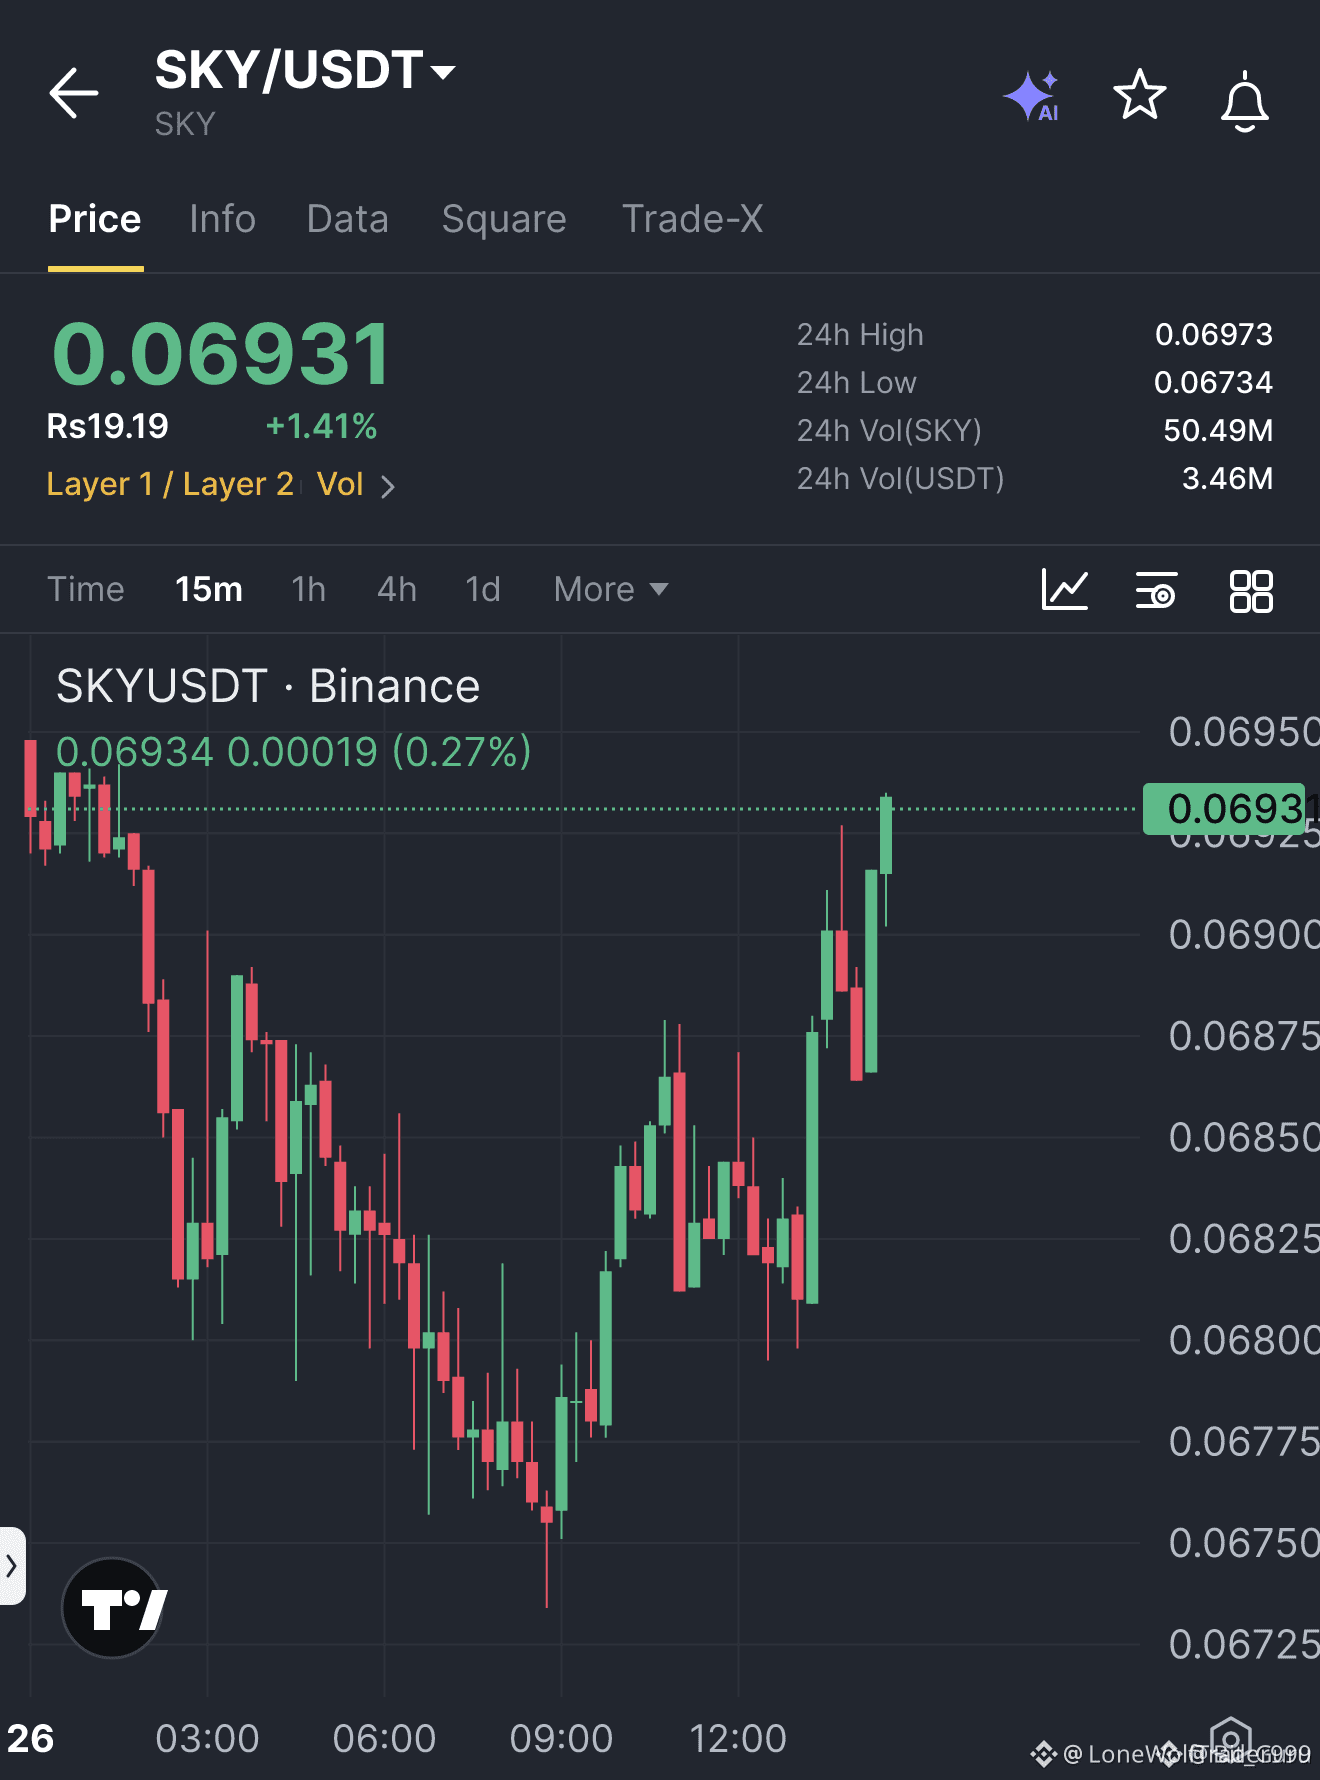
🚀 $SKY SKYROCKETS ABOVE 0.06935 BREAKOUT ALERT! 💥
Entry: 0.06936 ⚡
Target: 0.07143 🚀
Stop Loss: 0.06798 ⚠️
📊 The order flow flipped hard at 0.06935, with buy walls swallowing sell pressure and the 4H volume spiking like a tidal wave. 🌊 Momentum is roaring, and the bullish pressure zone sits right at 0.06936, offering a clean entry as the market rides the breakout wave. ⚡ Keep the entry tight—if price drifts far from the zone, the trade loses its edge. 💡 TP1 targets the next resistance at 0.07143, with upside potential to 0.07488 if the rally stays intact.
💬 Are you loading up on $SKY now or waiting for the next liquidity sweep? 👇
⚠️ Not financial advice. Always manage your risk. 🛡️
🏷️ #SKY #LongSetup #Breakout #Crypto
🔥 💎
7

·
--
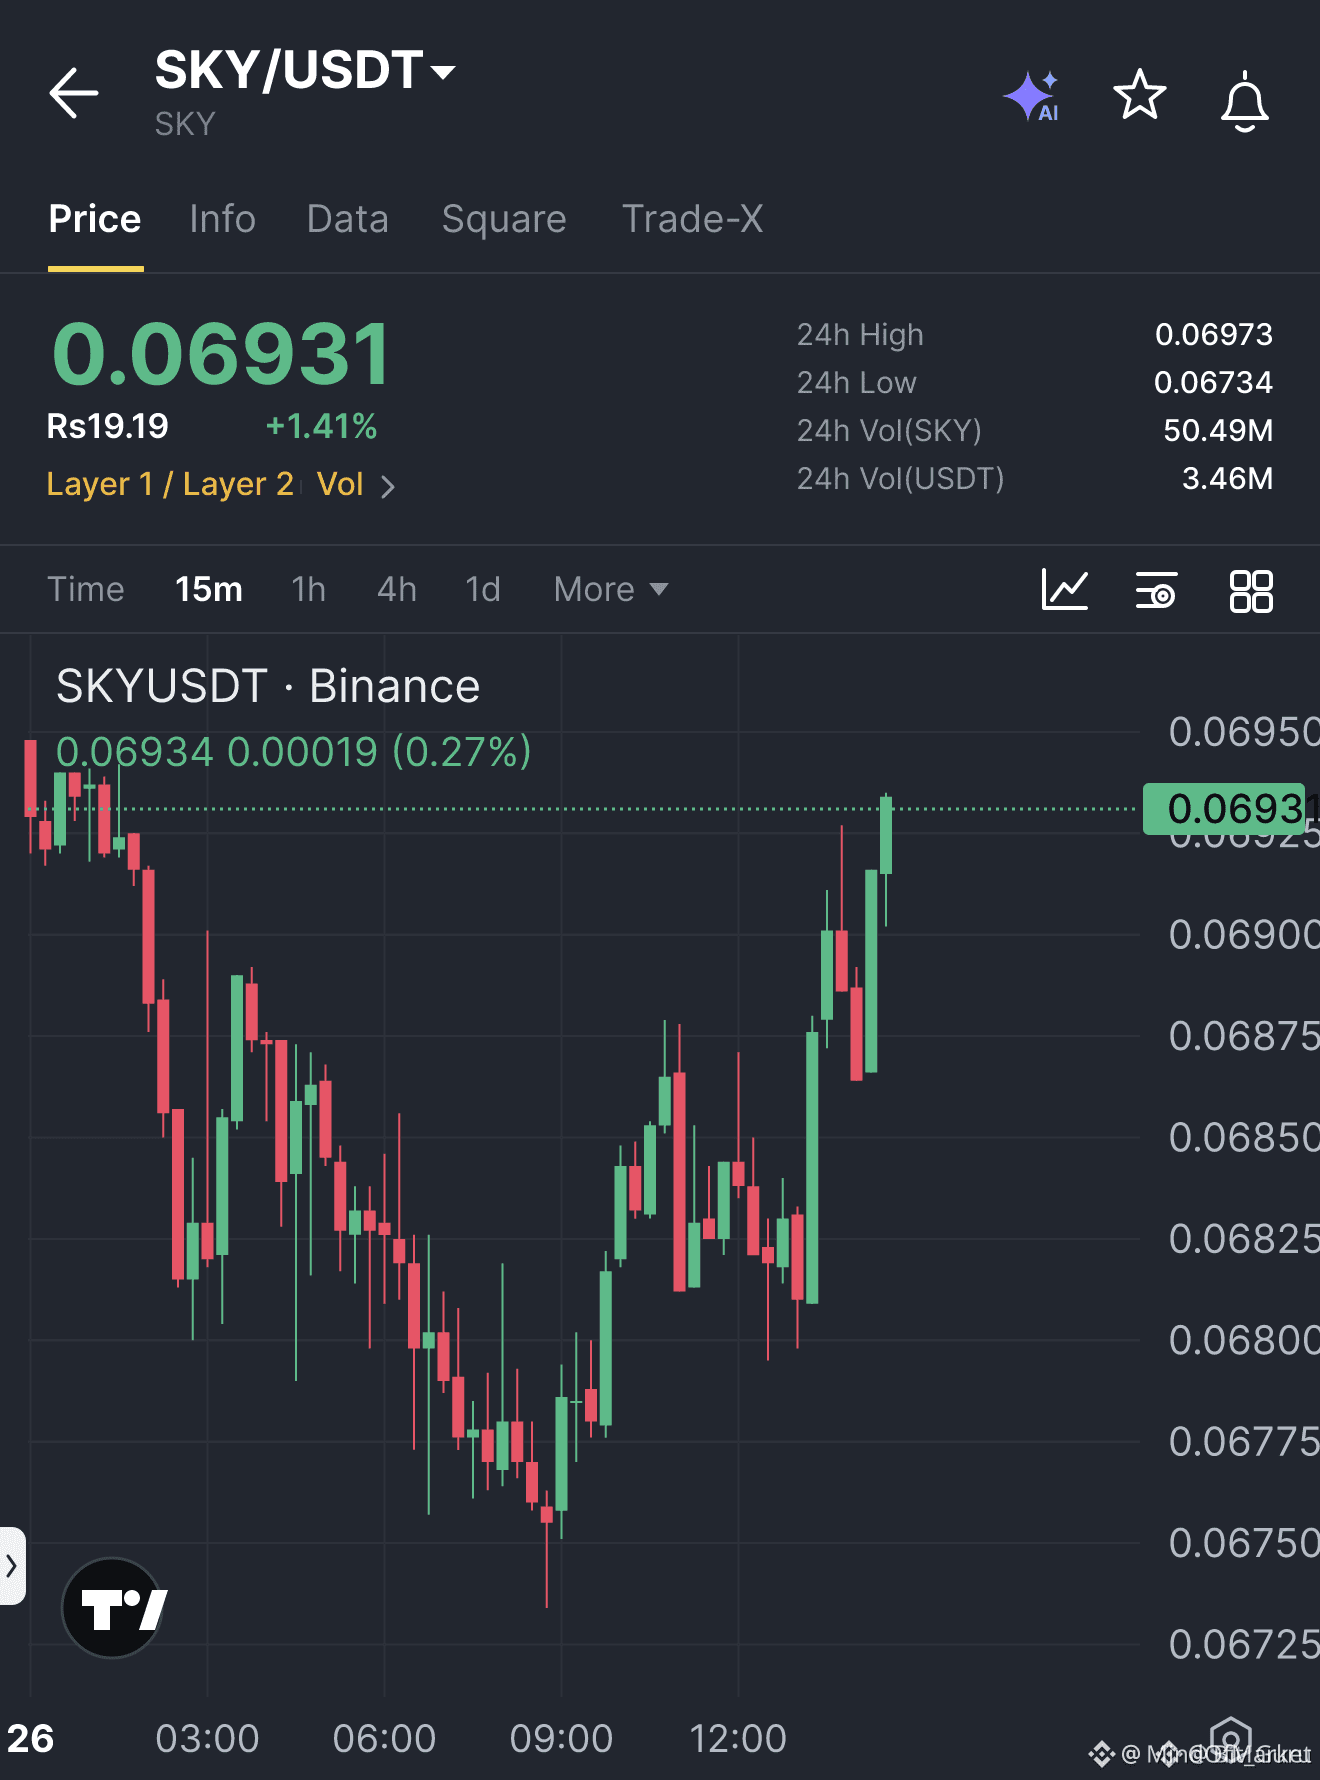
🚀 $SKY SKYROCKETS ABOVE 0.06935 BREAKOUT! 📈
Entry: 0.06936 ⚡
Target: 0.07143 🚀
Stop Loss: 0.06798 ⚠️
The demand block at 0.06935 held firm, swallowing the last wave of sell orders and flipping the microstructure to a bullish bias. 📊 Volume surged on the 1H, confirming smart money's commitment.
With the price now perched just above the breakout, the next liquidity pool sits near 0.0715, offering a clean risk‑reward corridor. ⚡ A retest of the entry zone could serve as a low‑risk add‑on before the next upward thrust. 📌
💬 Are you ready to ride the upside or waiting for the next liquidity sweep? 👇
⚠️ Not financial advice. Always manage your risk. 🛡️
🏷️ #SKY #LongSetup #Breakout #Crypto
🔥 💎
18

·
--
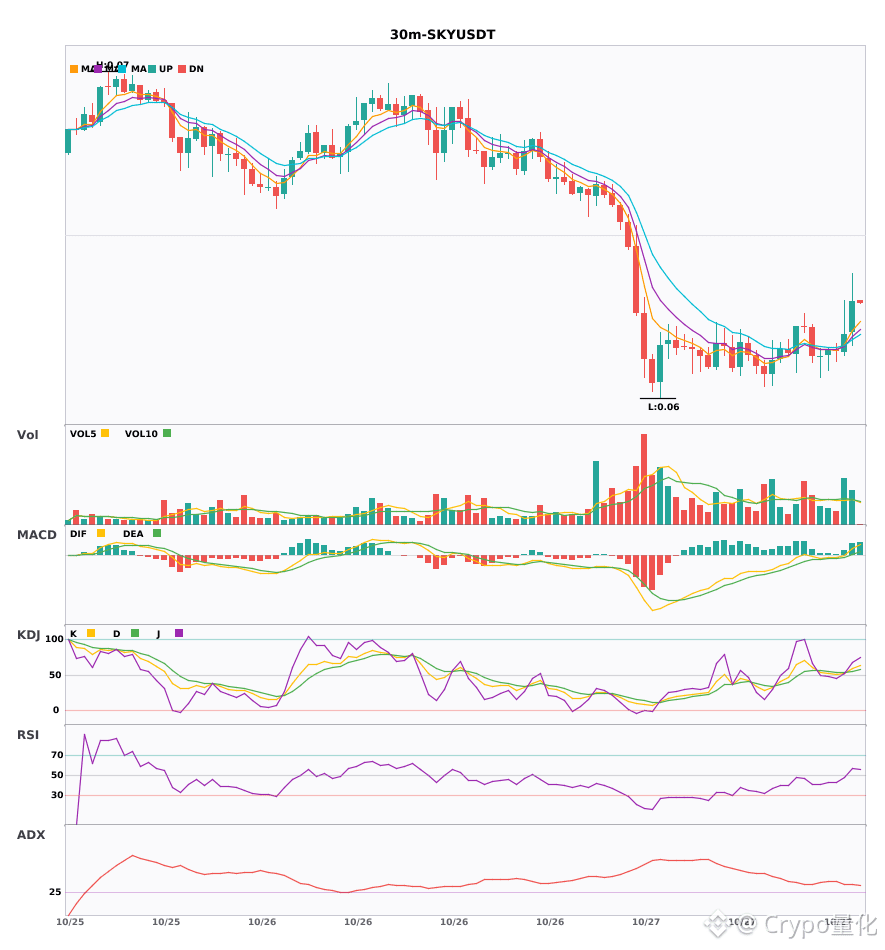
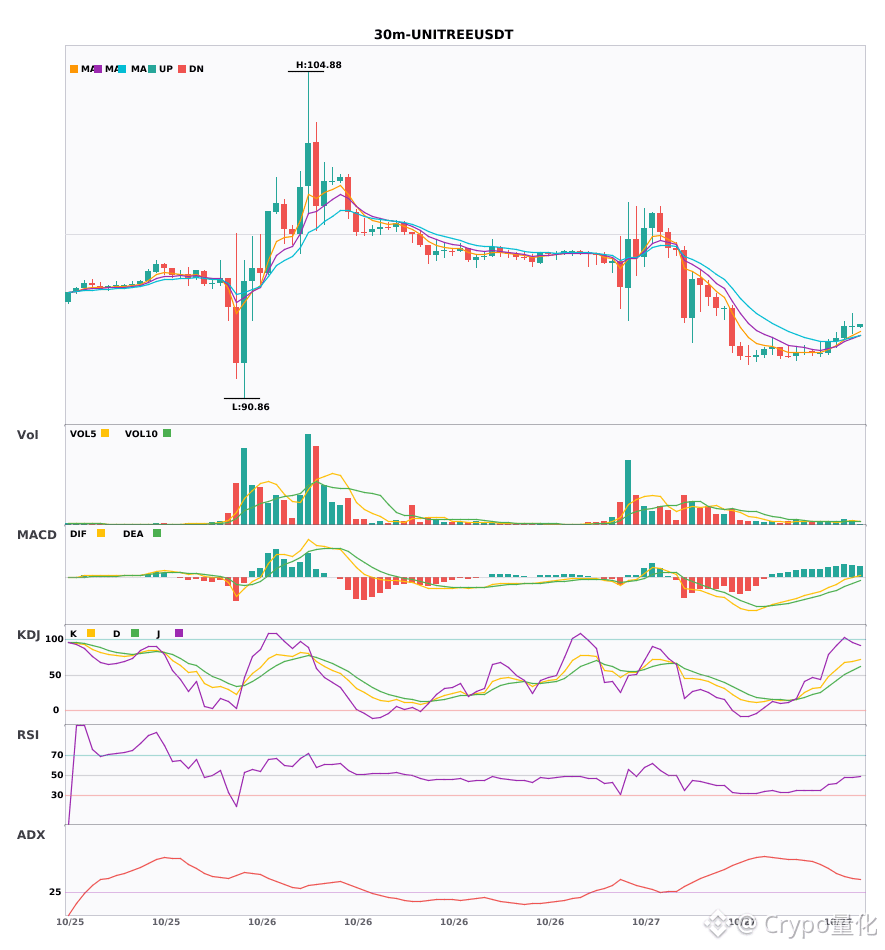
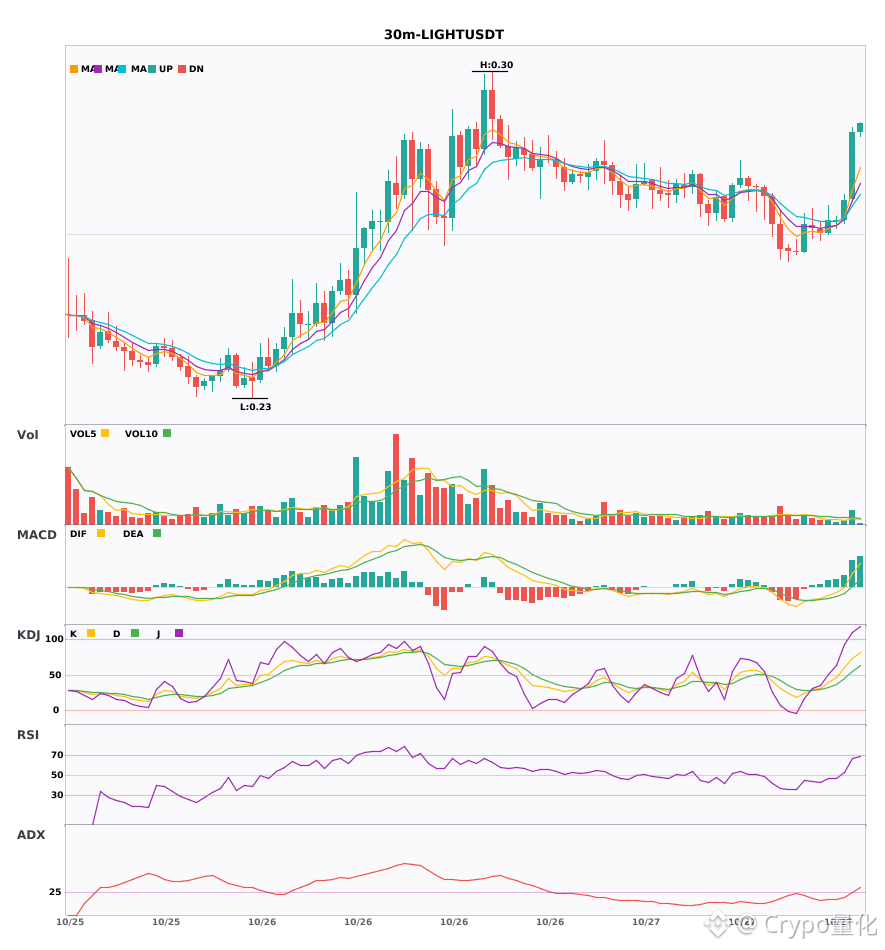
Three 30-minute bullish signals appeared simultaneously: $SKY / $UNITREE / $LIGHT🔥
════════════════════
🔴 $SKY 30-minute bullish signal
⚠️Technical analysis: ADX(33): clear trending market | MACD is bullish, trend is strong and momentum is increasing | EMA5 > EMA8 > EMA13: bullish alignment | KDJ golden cross, short-term outlook is bullish (K: 59.4, D: 55.1) | Volume increased (1.8x)
════════════════════
🔴 $UNITREE 30-minute bullish signal
⚠️Technical analysis: ADX(41): clear trending market | MACD DIF broke above the zero line, signaling a bullish trend reversal | Moving averages are converging and building momentum, with a directional move imminent | KDJ is strong, with bulls in control (K: 69.4, D: 56.7) | Volume increased (1.7x)
════════════════════
🔴 $LIGHT 30-minute bullish signal
⚠️Technical analysis: ADX(29): a trend is forming; an opportunity to participate | MACD DIF broke above the zero line, signaling a bullish trend reversal | EMA5 > EMA8 > EMA13: bullish alignment | KDJ is strong, with bulls in control (K: 72.7, D: 54.3) | Volume increased (1.9x)
════════════════════
🔔 Follow for first-hand market updates 🔔
#技术分析 #SKY #UNITREE #LIGHT
📌 When trading, check whether the candlestick pattern confirms the signal
Three 30-minute bullish signals appeared simultaneously: $SKY / $UNITREE / $LIGHT 🔥
════════════════════
🔴 $SKY 30-minute bullish signal
⚠️Technical analysis: ADX(33): clear trending market | MACD is bullish, trend is strong and momentum is increasing | EMA5 > EMA8 > EMA13: bullish alignment | KDJ golden cross, short-term outlook is bullish (K: 59.4, D: 55.1) | Volume increased (1.8x)
════════════════════
🔴 $UNITREE 30-minute bullish signal
⚠️Technical analysis: ADX(41): clear trending market | MACD DIF broke above the zero line, signaling a bullish trend reversal | Moving averages are converging and building momentum, with a directional move imminent | KDJ is strong, with bulls in control (K: 69.4, D: 56.7) | Volume increased (1.7x)
════════════════════
🔴 $LIGHT 30-minute bullish signal
⚠️Technical analysis: ADX(29): a trend is forming; an opportunity to participate | MACD DIF broke above the zero line, signaling a bullish trend reversal | EMA5 > EMA8 > EMA13: bullish alignment | KDJ is strong, with bulls in control (K: 72.7, D: 54.3) | Volume increased (1.9x)
════════════════════
🔔 Follow for first-hand market updates 🔔
#技术分析 #SKY #UNITREE #LIGHT
📌 When trading, check whether the candlestick pattern confirms the signal
════════════════════
🔴 $SKY 30-minute bullish signal
⚠️Technical analysis: ADX(33): clear trending market | MACD is bullish, trend is strong and momentum is increasing | EMA5 > EMA8 > EMA13: bullish alignment | KDJ golden cross, short-term outlook is bullish (K: 59.4, D: 55.1) | Volume increased (1.8x)
════════════════════
🔴 $UNITREE 30-minute bullish signal
⚠️Technical analysis: ADX(41): clear trending market | MACD DIF broke above the zero line, signaling a bullish trend reversal | Moving averages are converging and building momentum, with a directional move imminent | KDJ is strong, with bulls in control (K: 69.4, D: 56.7) | Volume increased (1.7x)
════════════════════
🔴 $LIGHT 30-minute bullish signal
⚠️Technical analysis: ADX(29): a trend is forming; an opportunity to participate | MACD DIF broke above the zero line, signaling a bullish trend reversal | EMA5 > EMA8 > EMA13: bullish alignment | KDJ is strong, with bulls in control (K: 72.7, D: 54.3) | Volume increased (1.9x)
════════════════════
🔔 Follow for first-hand market updates 🔔
#技术分析 #SKY #UNITREE #LIGHT
📌 When trading, check whether the candlestick pattern confirms the signal
8
·
--
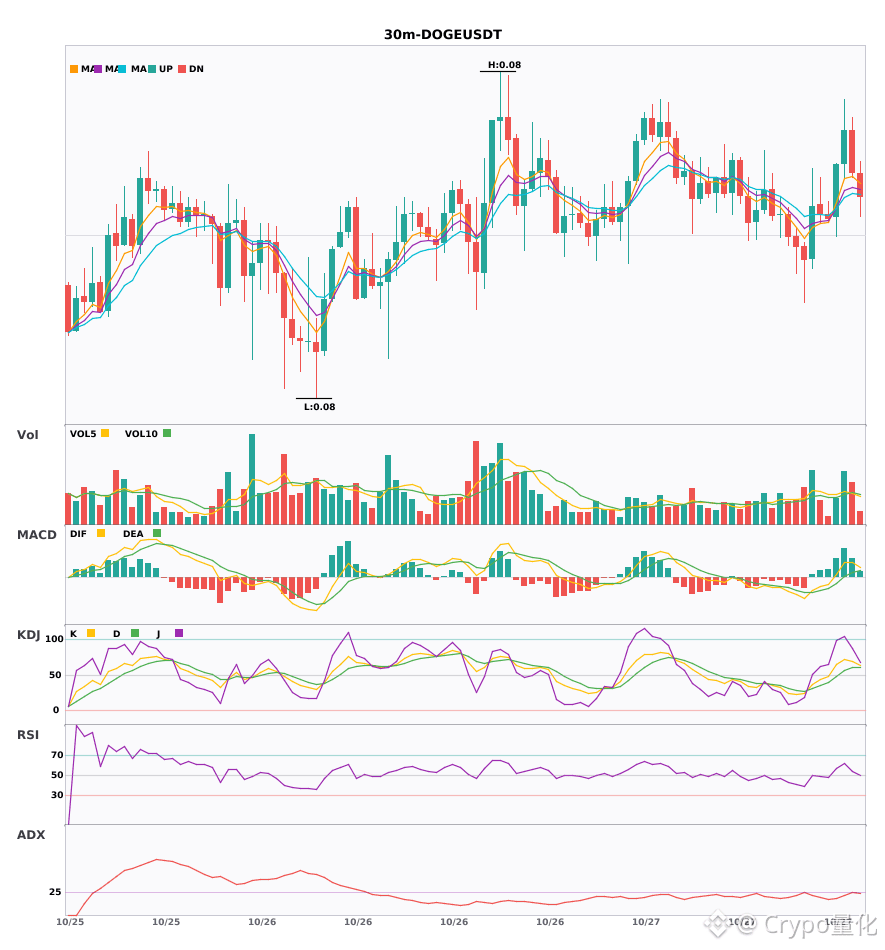
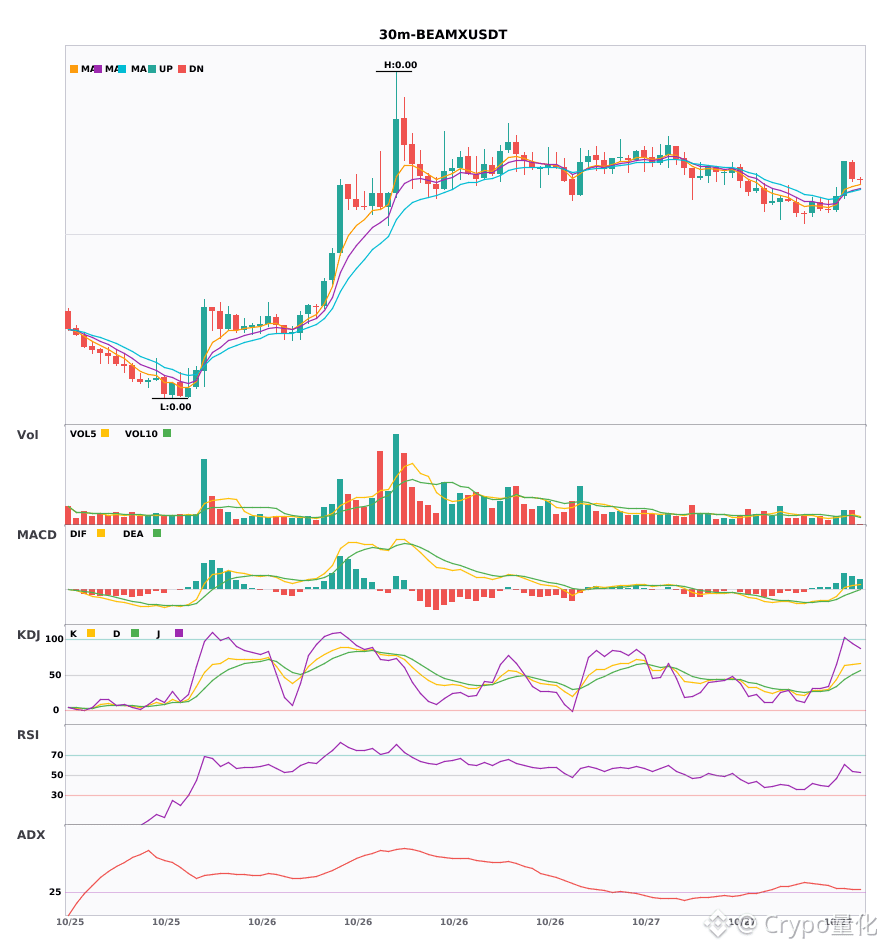
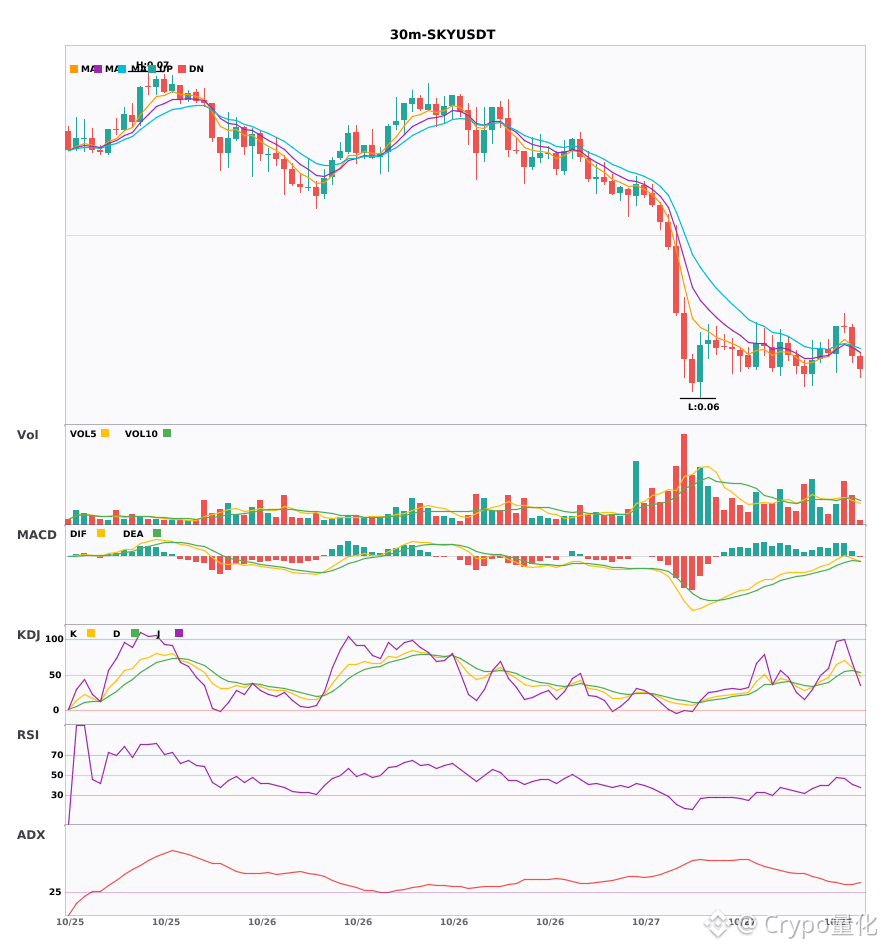
$DOGE / $BEAMX / $SKY 30-minute resonance turns bullish, with bullish signals appearing simultaneously🔥
════════════════════
🔴 $DOGE 30-minute bullish signal
⚠️Technical analysis: ADX(25) trend is forming, entry possible | MACD is bullish, trend is relatively strong, momentum is increasing | EMA5 is above EMA8 and EMA13 in a bullish alignment | KDJ is running strongly, bulls are dominant (K=71.5 D=55.7) | Volume expanded (1.8x)
════════════════════
🔴 $BEAMX 30-minute bullish signal
⚠️Technical analysis: ADX(30) trend is forming, entry possible | MACD is bullish, trend is relatively strong, momentum is weakening | EMA5 is above EMA8 and EMA13 in a bullish alignment | KDJ is running strongly, bulls are dominant (K=65.2 D=50.4) | Volume expanded (1.6x)
════════════════════
🔴 $SKY 30-minute bullish signal
⚠️Technical analysis: ADX(29) trend is forming, entry possible | MACD DIF breaks above the zero axis, trend turns bullish | Moving averages are converging, momentum is building, direction will soon be chosen | KDJ is running strongly, bulls are dominant (K=69.8 D=55.1) | Volume expanded (1.6x)
════════════════════
🔔 Follow to get the latest market moves 🔔
#技术分析 #DOGE #BEAMX #SKY
📌 When trading, pay attention to whether the candlestick pattern matches
════════════════════
🔴 $DOGE 30-minute bullish signal
⚠️Technical analysis: ADX(25) trend is forming, entry possible | MACD is bullish, trend is relatively strong, momentum is increasing | EMA5 is above EMA8 and EMA13 in a bullish alignment | KDJ is running strongly, bulls are dominant (K=71.5 D=55.7) | Volume expanded (1.8x)
════════════════════
🔴 $BEAMX 30-minute bullish signal
⚠️Technical analysis: ADX(30) trend is forming, entry possible | MACD is bullish, trend is relatively strong, momentum is weakening | EMA5 is above EMA8 and EMA13 in a bullish alignment | KDJ is running strongly, bulls are dominant (K=65.2 D=50.4) | Volume expanded (1.6x)
════════════════════
🔴 $SKY 30-minute bullish signal
⚠️Technical analysis: ADX(29) trend is forming, entry possible | MACD DIF breaks above the zero axis, trend turns bullish | Moving averages are converging, momentum is building, direction will soon be chosen | KDJ is running strongly, bulls are dominant (K=69.8 D=55.1) | Volume expanded (1.6x)
════════════════════
🔔 Follow to get the latest market moves 🔔
#技术分析 #DOGE #BEAMX #SKY
📌 When trading, pay attention to whether the candlestick pattern matches
10
·
--
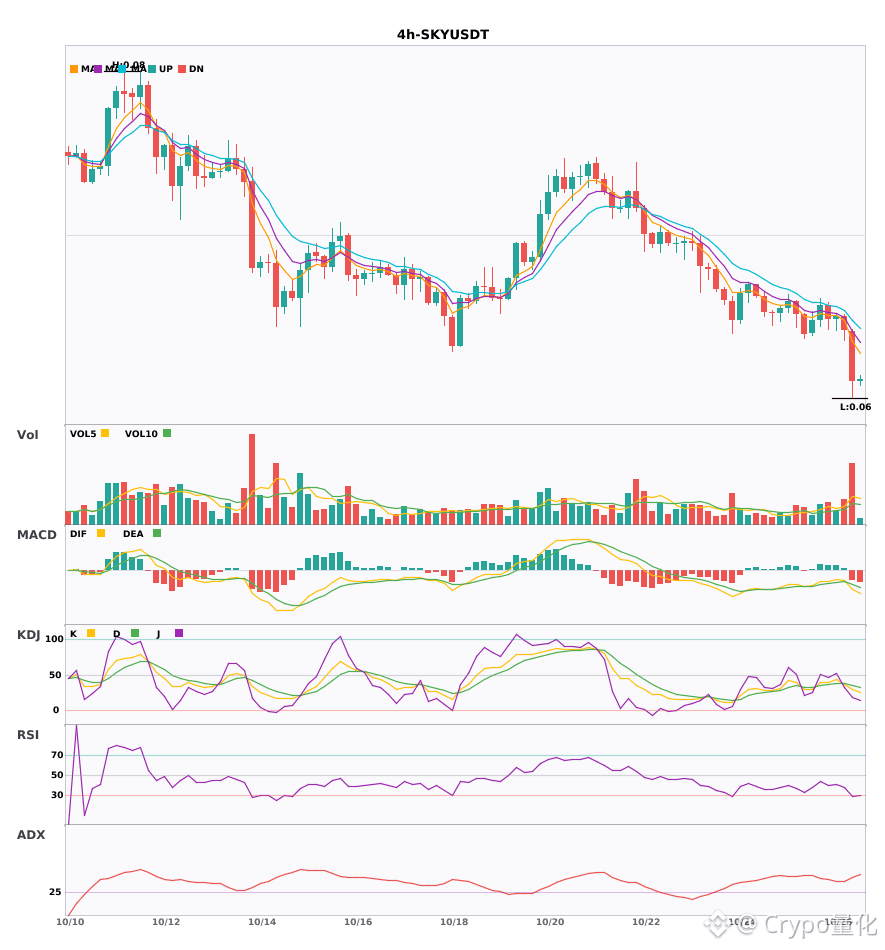
$SKY 4 Hourly outlook is bearish, with short-term pressure 🔥
════════════════════
🟢 $SKY 4 Hourly Bearish Signals
⚠️Technical analysis: ADX (42) indicates a clear trend | MACD bearish crossover below zero, with bearish momentum accelerating | EMA5 < EMA8 < EMA13, bearish alignment | KDJ is weak, with bears in control (K: 29.5, D: 35.1) | Volume surge (2.9x)
════════════════════
🔔 Follow us for the latest market updates 🔔
#技术分析 #SKY
📌 When trading, pay attention to whether the candlestick pattern confirms the setup
════════════════════
🟢 $SKY 4 Hourly Bearish Signals
⚠️Technical analysis: ADX (42) indicates a clear trend | MACD bearish crossover below zero, with bearish momentum accelerating | EMA5 < EMA8 < EMA13, bearish alignment | KDJ is weak, with bears in control (K: 29.5, D: 35.1) | Volume surge (2.9x)
════════════════════
🔔 Follow us for the latest market updates 🔔
#技术分析 #SKY
📌 When trading, pay attention to whether the candlestick pattern confirms the setup
4

·
--
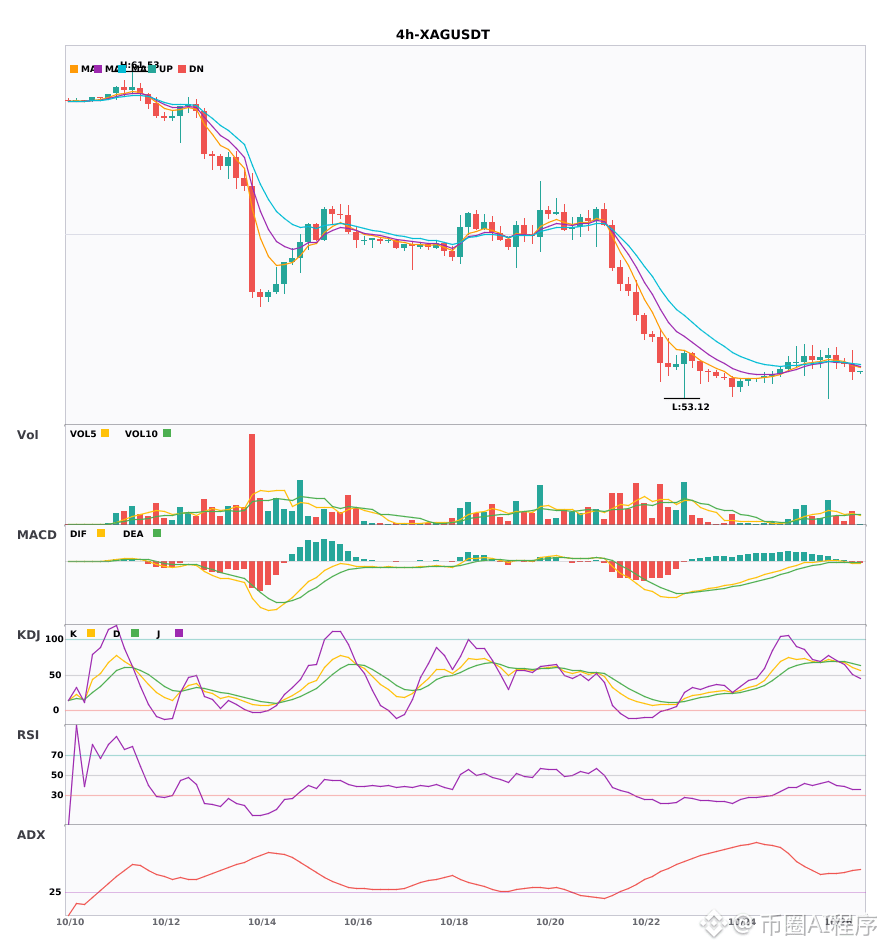
$SKY / $XAG 4-hour short signals, daily bearish trend confirmed 🔥
════════════════════
🟢 $SKY 4-hour short signal
⚠️Technical analysis: Daily bearish confluence confirmed | 4-hour entry: bearish MACD crossover below zero, accelerating downside | EMA5 < EMA8 < EMA13, bearish alignment | KDJ trending weakly, bears in control (K: 29.5, D: 35.1) | Volume surge (2.9x)
════════════════════
🟢 $XAG 4-hour short signal
⚠️Technical analysis: Daily bearish confluence confirmed | 4-hour entry: bearish MACD crossover below zero, accelerating downside | EMA5 crosses below EMA8, short-term outlook turns bearish | KDJ trending strongly, bulls in control (K: 60.7, D: 65.8) | Normal volume (1.3x)
════════════════════
🔔 Follow for the latest market movements 🔔
#多周期共振 #SKY #XAG
📌 When trading, pay attention to whether the candlestick pattern matches
════════════════════
🟢 $SKY 4-hour short signal
⚠️Technical analysis: Daily bearish confluence confirmed | 4-hour entry: bearish MACD crossover below zero, accelerating downside | EMA5 < EMA8 < EMA13, bearish alignment | KDJ trending weakly, bears in control (K: 29.5, D: 35.1) | Volume surge (2.9x)
════════════════════
🟢 $XAG 4-hour short signal
⚠️Technical analysis: Daily bearish confluence confirmed | 4-hour entry: bearish MACD crossover below zero, accelerating downside | EMA5 crosses below EMA8, short-term outlook turns bearish | KDJ trending strongly, bulls in control (K: 60.7, D: 65.8) | Normal volume (1.3x)
════════════════════
🔔 Follow for the latest market movements 🔔
#多周期共振 #SKY #XAG
📌 When trading, pay attention to whether the candlestick pattern matches
5

·
--
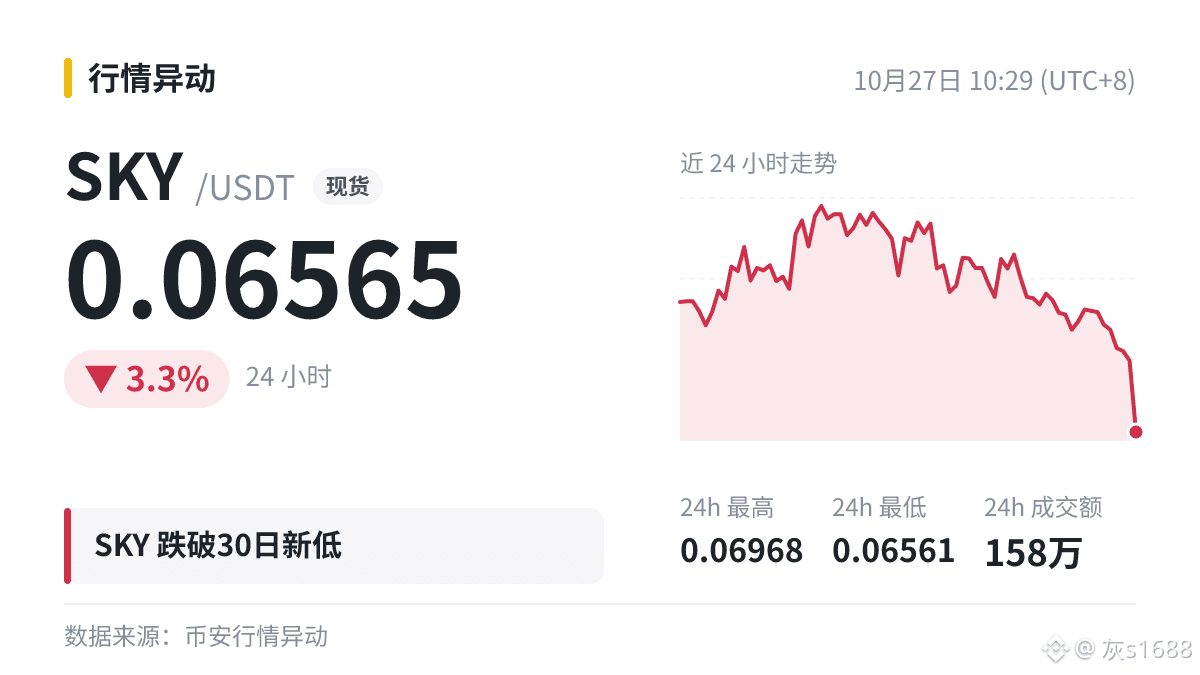
Don't panic, hear me out: $SKY 30 has hit a new low. The current price is 0.06565, and the previous low was 0.06661.
Whenever it hits a new low, someone in the comments always says, “This is the bottom,” and then the market politely dips another level.
Risk takes time to unwind. Don't rush.
#SKY
Don't panic, hear me out: $SKY 30 has hit a new low. The current price is 0.06565, and the previous low was 0.06661.
Whenever it hits a new low, someone in the comments always says, “This is the bottom,” and then the market politely dips another level.
Risk takes time to unwind. Don't rush.
#SKY
Whenever it hits a new low, someone in the comments always says, “This is the bottom,” and then the market politely dips another level.
Risk takes time to unwind. Don't rush.
#SKY
174

·
--
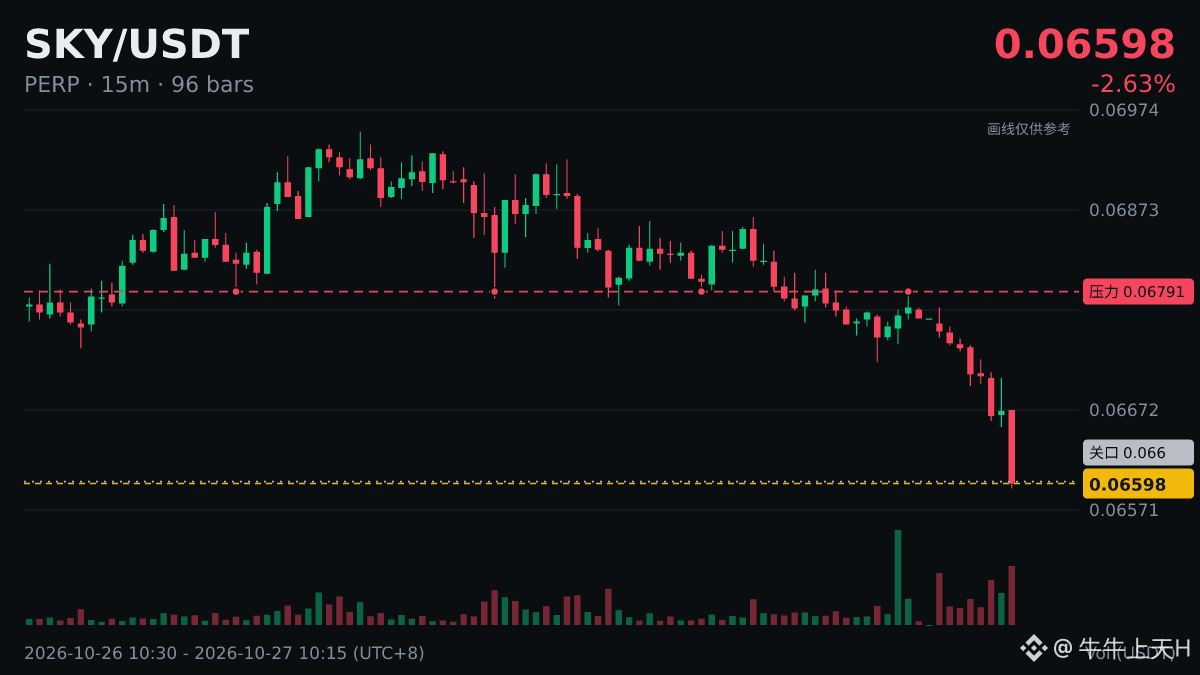
I just saw this and couldn’t help posting!
$SKY hit a new low 🐻 The 30-day low has been breached!
Current price: 0.0659. The previous low of 0.06661 couldn’t hold…
A big drop doesn’t mean it’s hit bottom. Wait patiently for a signal. Watch your position size, and don’t get carried away.
#SKY
I just saw this and couldn’t help posting!
$SKY hit a new low 🐻 The 30-day low has been breached!
Current price: 0.0659. The previous low of 0.06661 couldn’t hold…
A big drop doesn’t mean it’s hit bottom. Wait patiently for a signal. Watch your position size, and don’t get carried away.
#SKY
$SKY hit a new low 🐻 The 30-day low has been breached!
Current price: 0.0659. The previous low of 0.06661 couldn’t hold…
A big drop doesn’t mean it’s hit bottom. Wait patiently for a signal. Watch your position size, and don’t get carried away.
#SKY
27

·
--
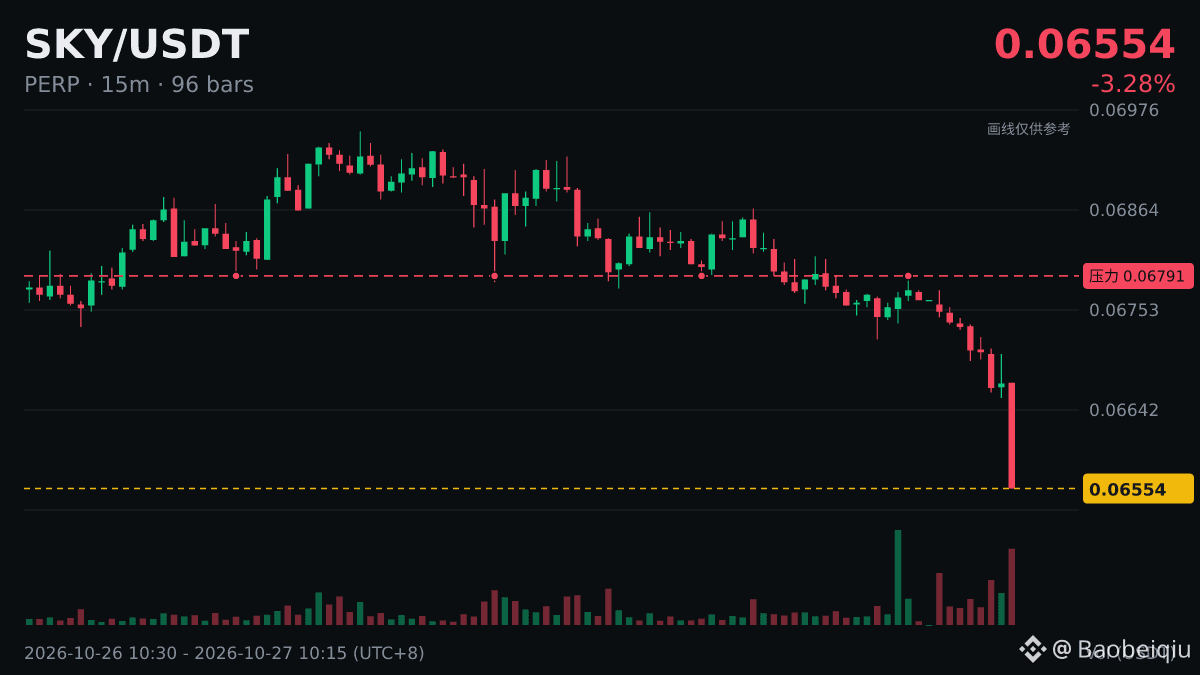
$SKY hit a new 30-day low, and selling pressure hasn't eased yet.
Current price: 0.06562, below the previous low of 0.06661; 24-hour trading volume: $1.59 million.
There are often plenty of long stop-loss orders below the previous low. Breaking through it can trigger a cascade of liquidations. Watch for large buy orders absorbing supply at the lows.
#SKY
Current price: 0.06562, below the previous low of 0.06661; 24-hour trading volume: $1.59 million.
There are often plenty of long stop-loss orders below the previous low. Breaking through it can trigger a cascade of liquidations. Watch for large buy orders absorbing supply at the lows.
#SKY
43

·
--
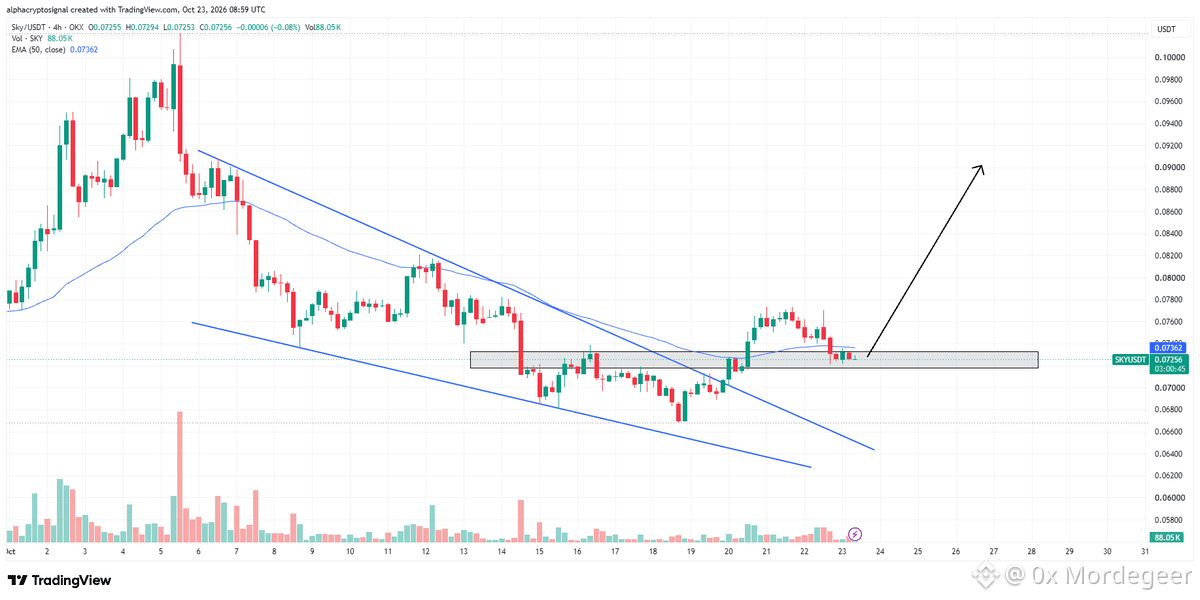
📊 $SKY Technical Analysis & Setup
$SKY has successfully broken out of its falling wedge pattern and is currently executing a textbook retest of the horizontal demand zone as support. Momentum is building as price hovers near 0.0726, sitting right underneath the 50 EMA.
• Key Support / Demand: 0.0700, 0.0726 zone
• Resistance / Supply Targets: $0.076 followed by $0.080
• Trigger / Confirmation: Bullish rejection candle off the current support with increasing volume to clear the 50 EMA
• Risk / Invalidation: A confirmed 4h candle close back under the support zone invalidates the setup
• Market Execution: Monitor order book depth and manage risk tightly during retest phases
DYOR — Educational setup, not financial advice.
#BinanceSquare #Crypto #SKY #Trading
$NEAR
11

·
--
Verified
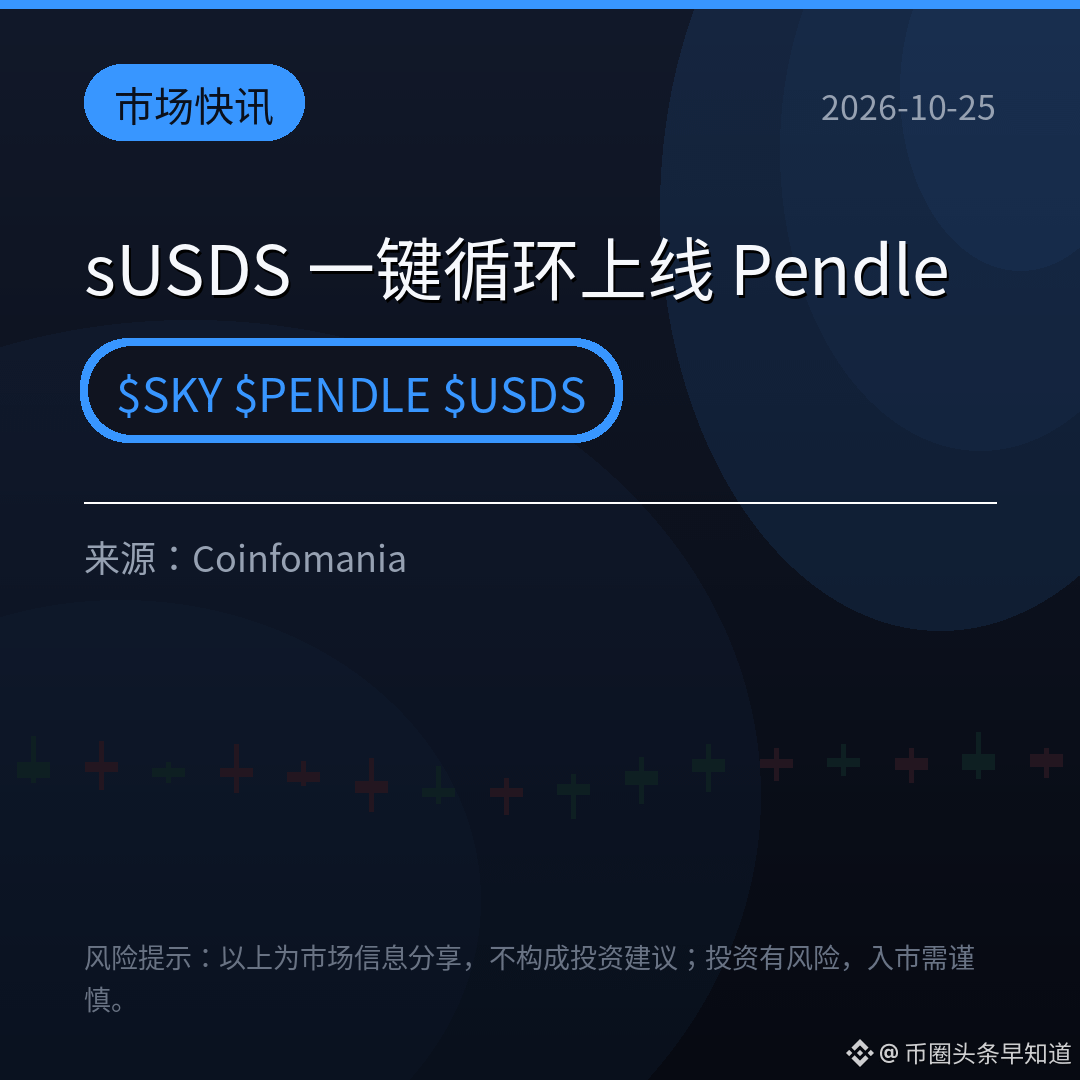
【Market Update】Sky announced: One-click sUSDS looping is now live on Pendle. Use PendleLoop to complete the loop in just a few clicks.
Convenience means lower costs and greater efficiency. Pendle’s yield-bearing asset strategies are getting easier to use, and sUSDS now has another use case.
But when positions fluctuate, losses can also hit faster. Is this bullish or bearish for $PENDLE ? Reply 1 if bullish, 2 if bearish.
$SKY $PENDLE $USDS
#DeFi #Pendle #Sky
(Source: Coinfomania)
⚠️Risk warning: The above is shared for market information only and does not constitute investment advice. Investing involves risk; please exercise caution.
1
209

·
--
Latest | Project Updates
Sky reports $30.8 million in September revenue; Galaxy adds $100 million in sUSDS and launches its first burn
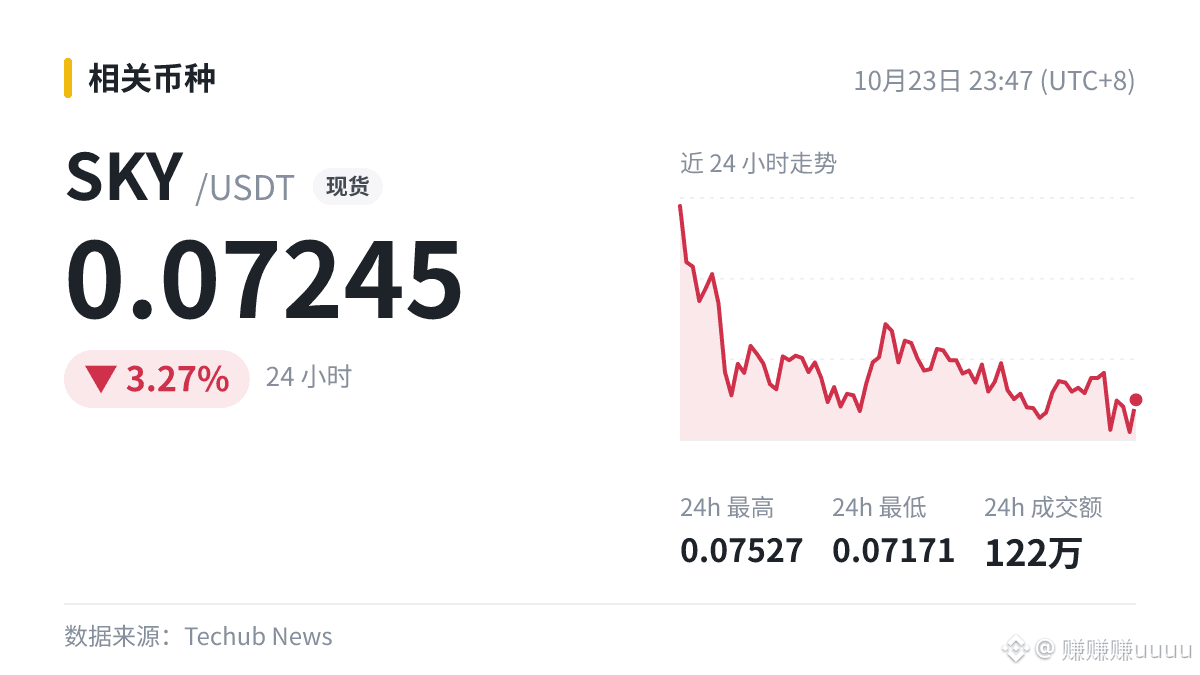
$SKY 0.07245|1h +0.028%|24h -3.27%
Follow-up: Are there any further details or official statements?
#SKY
Latest | Project Updates
Sky reports $30.8 million in September revenue; Galaxy adds $100 million in sUSDS and launches its first burn
$SKY 0.07245|1h +0.028%|24h -3.27%
Follow-up: Are there any further details or official statements?
#SKY
Sky reports $30.8 million in September revenue; Galaxy adds $100 million in sUSDS and launches its first burn
$SKY 0.07245|1h +0.028%|24h -3.27%
Follow-up: Are there any further details or official statements?
#SKY
4
⚡ $SKY PULLBACK ABSORBED AS BUYERS RECLAIM KEY SUPPORT FOR CONTINUATION 🚀
Entry: 0.0704 - 0.0706 ⚡
Target: 0.0712 / 0.0720 / 0.0728 🚀
Stop Loss: 0.0693 ⚠️
Sellers tried to push down $SKY , but aggressive spot bids caught the entire dip right at the structural floor. 📌 The price action shows clean absorption, turning what looked like a shallow sell-off into an accumulation launchpad. 📊
Momentum is realigning with the broader trend as order flow flips back to the buy side, setting up a smooth runway toward upper targets. 💡 Downside exposure remains tightly guarded below local invalidation.
💬 Are you riding this continuation higher or waiting for a breakout confirmation above 0.0712? 👇
⚠️ Not financial advice. Always manage your risk. 🛡️
🏷️ #SKY #LongSetup #Altcoins #Crypto #Breakout
🔥 💎
7

·
--
🩸 Downside Momentum: $SKY Pullback Rejection Confirmed
Rating: 76/100 [A] • Strategy: EMATrend
📊 Trade Thesis:
Price encountered strong overhead rejection at the 50 EMA on the 1-hour chart, fully aligning with the broader 4-hour downtrend. The inability to reclaim higher levels signals persistent distribution by sellers.
🎯 Entry: 0.07448
🛑 Stop-Loss: 0.07578 (-1.75%)
✅ Take-Profit: 0.07187 (+3.50%)
⚖️ Risk/Reward: 1:2.0
🚫 Invalidation Rule: If a 1-hour candle closes above $0.07578 (+1.75%), this bearish thesis is invalidated. Cut position immediately.
💡 Trade Management: Secure 50% profit at Take-Profit target ($0.07187 +3.50%) and move Stop-Loss to Breakeven to eliminate downside risk.
⚖️ Risk Note: Moderate leverage recommended (3x–5x on Futures). Never risk more than 1–2% of total portfolio capital on a single setup.
📈 Binance Market Data:
• Funding: 0.0032% (Neutral) • Next: 3h 58m
• Open Interest (OI): $18.01M
• 24h Volume: $6.29M
• 24h Range: 0.0739 — 0.07724 (-3.1%)
📈 Strategy Track Record: WR 60% over 631 trades
#SKY #Altcoins #PriceAction #BinanceSquare
⚠️ Not financial advice. Always manage your risk.
21
·
--
Bullish Structure & Reaccumulation Setup
#sky After pulling back to 0.06820, we saw a clear CHoCH (Change of Character) shifting market structure to bullish.
The Retracement: Following the creation of a new higher high, price is now undergoing a healthy re-correction back down into the key demand zone.
The Game Plan: Patiently wait for price to drop into that key demand zone, then look to position yourself for a long trade as it gears up to print the next higher high! 📈
Are you tracking this setup on your charts? Let me know your entry plans below! 👇
$SKY
{future}(SKYUSDT)
#BinanceSquare #CryptoTrading #TechnicalAnalysis #PriceAction #SmartMoney #LongTrade #Crypto #TradingSetup
Bullish Structure & Reaccumulation Setup
#sky After pulling back to 0.06820, we saw a clear CHoCH (Change of Character) shifting market structure to bullish.
The Retracement: Following the creation of a new higher high, price is now undergoing a healthy re-correction back down into the key demand zone.
The Game Plan: Patiently wait for price to drop into that key demand zone, then look to position yourself for a long trade as it gears up to print the next higher high! 📈
Are you tracking this setup on your charts? Let me know your entry plans below! 👇
$SKY
#BinanceSquare #CryptoTrading #TechnicalAnalysis #PriceAction #SmartMoney #LongTrade #Crypto #TradingSetup
128
·
--
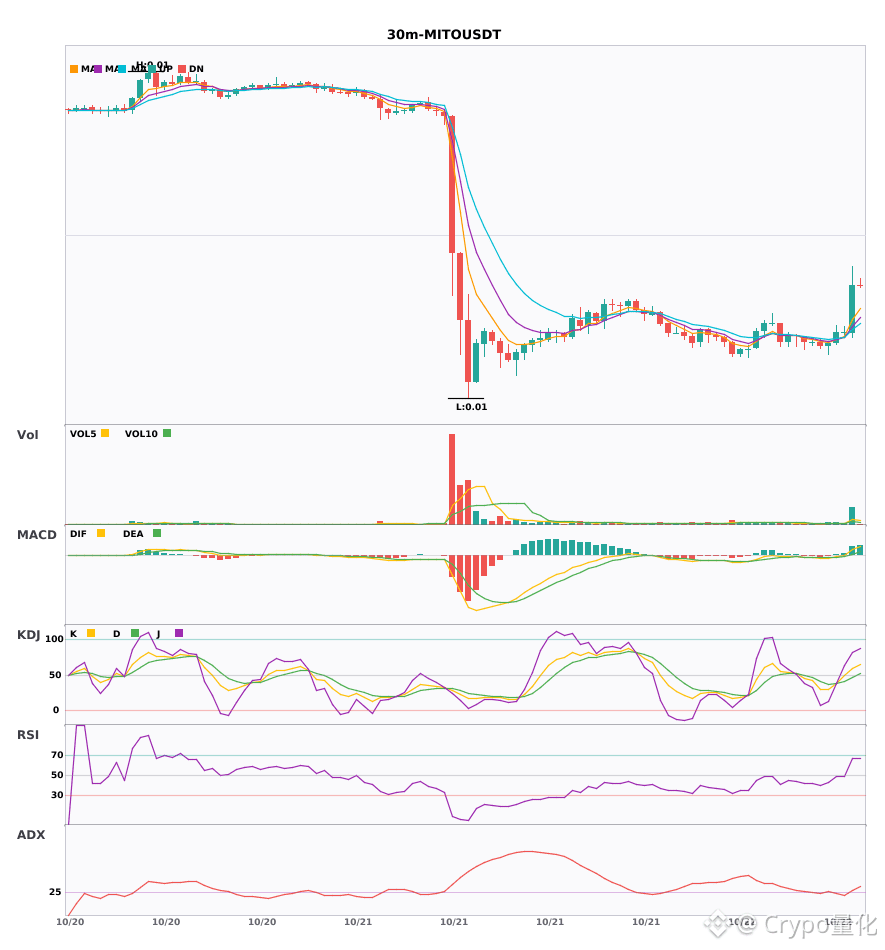
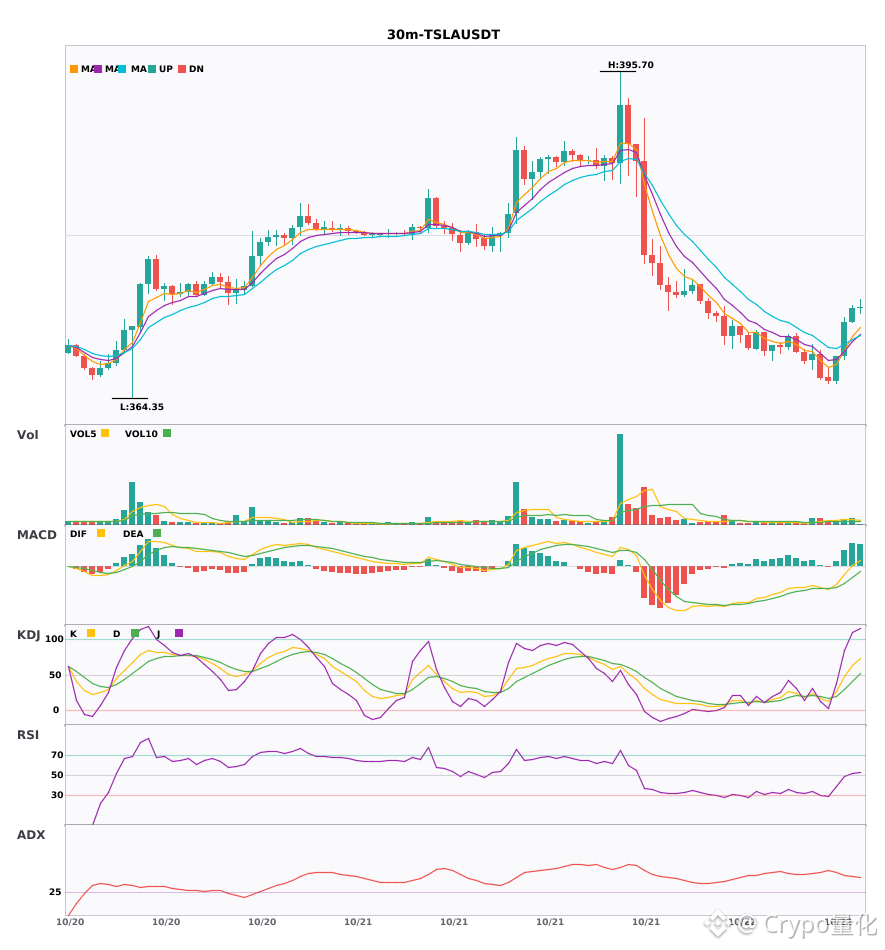
$MITO / $SKY / $TSLA 30-minute technical indicators are strengthening in sync—which has the greatest explosive potential? 🔥
════════════════════
🔴 $MITO 30-minute bullish signal
⚠️Technical analysis: ADX(29): A trend is forming; potential entry | MACD is bullish, with a strong trend and increasing momentum | EMA5 > EMA8 > EMA13: bullish alignment | Volume surge (5.6x)
📢Market update: Binance Futures Will Delist PTBUSDT and MITOUSDT USDⓈ-M Perpetual Contracts (2026-10-23)
════════════════════
🔴 $SKY 30-minute bullish signal
⚠️Technical analysis: ADX(33): A clear trending market | MACD DIF breaks above the zero line; trend turns bullish | Moving averages are converging as momentum builds; a directional move is imminent | KDJ is strong, with bulls in control (K: 63.3, D: 58.8) | Volume surge (2.7x)
════════════════════
🔴 $TSLA 30-minute bullish signal
⚠️Technical analysis: ADX(45): A clear trending market | MACD DIF breaks above the zero line; trend turns bullish | Moving averages are converging as momentum builds; a directional move is imminent | Volume expands (1.7x)
════════════════════
🔔 Follow for the latest market movements 🔔
#技术分析 #MITO #SKY #TSLA
📌 When trading, watch for whether the candlestick pattern confirms the signal
════════════════════
🔴 $MITO 30-minute bullish signal
⚠️Technical analysis: ADX(29): A trend is forming; potential entry | MACD is bullish, with a strong trend and increasing momentum | EMA5 > EMA8 > EMA13: bullish alignment | Volume surge (5.6x)
📢Market update: Binance Futures Will Delist PTBUSDT and MITOUSDT USDⓈ-M Perpetual Contracts (2026-10-23)
════════════════════
🔴 $SKY 30-minute bullish signal
⚠️Technical analysis: ADX(33): A clear trending market | MACD DIF breaks above the zero line; trend turns bullish | Moving averages are converging as momentum builds; a directional move is imminent | KDJ is strong, with bulls in control (K: 63.3, D: 58.8) | Volume surge (2.7x)
════════════════════
🔴 $TSLA 30-minute bullish signal
⚠️Technical analysis: ADX(45): A clear trending market | MACD DIF breaks above the zero line; trend turns bullish | Moving averages are converging as momentum builds; a directional move is imminent | Volume expands (1.7x)
════════════════════
🔔 Follow for the latest market movements 🔔
#技术分析 #MITO #SKY #TSLA
📌 When trading, watch for whether the candlestick pattern confirms the signal
15
Log in to explore more content
Join global crypto users on Binance Square
⚡️ Get latest and useful information about crypto.
💬 Trusted by the world’s largest crypto exchange.
👍 Discover real insights from verified creators.
Email / Phone number
Trending Topics
1
#CanMicrosoftDeliverOnAI
54,598 views
632 Discussing
2
#CanGoogleDefindItsCore
28,681 views
471 Discussing
3
#FOMCWatch
9M views
27,819 Discussing
4
#EthereumDropsBelow$2300
9,973 views
151 Discussing
5
#BitcoinSlipsBelow$80KAgain
27,770 views
116 Discussing
6
#ThailandLaunchesWORPTStablecoinToQRPaymentApp
55,326 views
747 Discussing
7
#StrategySkipsBitcoinPurchasesSpends$205MOnSTRCBuybacks
10,583 views
96 Discussing
8
#BitmineAdds10452ETH
98,019 views
1,137 Discussing
9
#SouthKoreaConsidersEducationTaxOnCryptoExchanges
54,670 views
824 Discussing
10
#OCCUrgesCommunityBanksToEnterStablecoinPayments
40,245 views
592 Discussing