

#mstr
mstr
1.1M views
6,314 Discussing
Hot
Latest

Verified
#strategymstrsurpassesnasdaqinmarketcap
🚨 THE LEVERAGE EQUATION: $MSTR
{future}(MSTRUSDT)
FLIPS NASDAQ 🚨
Michael Saylor’s ultimate corporate treasury bet just hit a historic milestone! Let’s break down MicroStrategy’s massive market cap flip using pure math 🧮👇
(Massive $BTC
{future}(BTCUSDT)
Treasury) + (Institutional Premium) = Flipping Nasdaq 📈
Here is the exact formula driving this corporate takeover:
The Asset Variable:
(The Bitcoin Standard) = MicroStrategy has aggressively transformed from a traditional software company into the ultimate proxy for Bitcoin, stockpiling billions in $BTC on its balance sheet.
The Valuation Variable:
(The Flippening) = Fueled by relentless demand for its crypto strategy, $MSTR's market capitalization has surged past $57 billion. In doing so, it has officially surpassed the market value of Nasdaq Inc. itself and entered the ranks of the world's 400 largest companies.
The Breakdown:
This is a monumental macro shift. A firm functioning primarily as a leveraged Bitcoin holding entity is now worth more than the legendary exchange operator hosting its stock! When traditional finance liquidity meets absolute digital scarcity, the resulting premium is explosive.
Will MicroStrategy continue its aggressive climb up the global ranks, or is this premium too hot to hold? Let's debate! 👇💬
#BTC #MSTR #CryptoNews
#strategymstrsurpassesnasdaqinmarketcap
🚨 THE LEVERAGE EQUATION: $MSTR
FLIPS NASDAQ 🚨
Michael Saylor’s ultimate corporate treasury bet just hit a historic milestone! Let’s break down MicroStrategy’s massive market cap flip using pure math 🧮👇
(Massive $BTC
Treasury) + (Institutional Premium) = Flipping Nasdaq 📈
Here is the exact formula driving this corporate takeover:
The Asset Variable:
(The Bitcoin Standard) = MicroStrategy has aggressively transformed from a traditional software company into the ultimate proxy for Bitcoin, stockpiling billions in $BTC on its balance sheet.
The Valuation Variable:
(The Flippening) = Fueled by relentless demand for its crypto strategy, $MSTR 's market capitalization has surged past $57 billion. In doing so, it has officially surpassed the market value of Nasdaq Inc. itself and entered the ranks of the world's 400 largest companies.
The Breakdown:
This is a monumental macro shift. A firm functioning primarily as a leveraged Bitcoin holding entity is now worth more than the legendary exchange operator hosting its stock! When traditional finance liquidity meets absolute digital scarcity, the resulting premium is explosive.
Will MicroStrategy continue its aggressive climb up the global ranks, or is this premium too hot to hold? Let's debate! 👇💬
#BTC #MSTR #CryptoNews
🚨 THE LEVERAGE EQUATION: $MSTR
FLIPS NASDAQ 🚨
Michael Saylor’s ultimate corporate treasury bet just hit a historic milestone! Let’s break down MicroStrategy’s massive market cap flip using pure math 🧮👇
(Massive $BTC
Treasury) + (Institutional Premium) = Flipping Nasdaq 📈
Here is the exact formula driving this corporate takeover:
The Asset Variable:
(The Bitcoin Standard) = MicroStrategy has aggressively transformed from a traditional software company into the ultimate proxy for Bitcoin, stockpiling billions in $BTC on its balance sheet.
The Valuation Variable:
(The Flippening) = Fueled by relentless demand for its crypto strategy, $MSTR 's market capitalization has surged past $57 billion. In doing so, it has officially surpassed the market value of Nasdaq Inc. itself and entered the ranks of the world's 400 largest companies.
The Breakdown:
This is a monumental macro shift. A firm functioning primarily as a leveraged Bitcoin holding entity is now worth more than the legendary exchange operator hosting its stock! When traditional finance liquidity meets absolute digital scarcity, the resulting premium is explosive.
Will MicroStrategy continue its aggressive climb up the global ranks, or is this premium too hot to hold? Let's debate! 👇💬
#BTC #MSTR #CryptoNews

3
876

🦈 $MSTR PAUSES BITCOIN BUYING, REDEPLOYS $205M INTO PREFERRED STOCK 📈
📊 The strategy team halted all BTC inflows for the week of Oct 19‑25, keeping the 848,517‑coin stash acquired at $75,446 avg price. Instead, $204.9 M of STRC preferred shares were repurchased, bolstering a $4.83 B cash cushion. ⚡ This move signals a liquidity‑preservation stance, likely awaiting a clearer macro catalyst before re‑entering the Bitcoin market.
💡 Institutional eyes are now on the next order‑block breach or fair‑value gap on BTC to justify fresh exposure. 👇 What does this redeployment mean for $BTC ’s upcoming direction? 💬
⚠️ Not financial advice. Always manage your risk. 🛡️
🏷️ #MSTR #InstitutionalStrategy #CashManagement #Crypto
🔥 🦈
🦈 $MSTR PAUSES BITCOIN BUYING, REDEPLOYS $205M INTO PREFERRED STOCK 📈
📊 The strategy team halted all BTC inflows for the week of Oct 19‑25, keeping the 848,517‑coin stash acquired at $75,446 avg price. Instead, $204.9 M of STRC preferred shares were repurchased, bolstering a $4.83 B cash cushion. ⚡ This move signals a liquidity‑preservation stance, likely awaiting a clearer macro catalyst before re‑entering the Bitcoin market.
💡 Institutional eyes are now on the next order‑block breach or fair‑value gap on BTC to justify fresh exposure. 👇 What does this redeployment mean for $BTC ’s upcoming direction? 💬
⚠️ Not financial advice. Always manage your risk. 🛡️
🏷️ #MSTR #InstitutionalStrategy #CashManagement #Crypto
🔥 🦈
📊 The strategy team halted all BTC inflows for the week of Oct 19‑25, keeping the 848,517‑coin stash acquired at $75,446 avg price. Instead, $204.9 M of STRC preferred shares were repurchased, bolstering a $4.83 B cash cushion. ⚡ This move signals a liquidity‑preservation stance, likely awaiting a clearer macro catalyst before re‑entering the Bitcoin market.
💡 Institutional eyes are now on the next order‑block breach or fair‑value gap on BTC to justify fresh exposure. 👇 What does this redeployment mean for $BTC ’s upcoming direction? 💬
⚠️ Not financial advice. Always manage your risk. 🛡️
🏷️ #MSTR #InstitutionalStrategy #CashManagement #Crypto
🔥 🦈

9


> MSTR REPURCHASES $204.9M OF STRC STOCK: SEC FILING
> STRATEGY $4.83B USD RESERVE AND $242.4M USD CASH AS OF OCT. 25: SEC FILING
> $MSTR
#MSTR
> MSTR REPURCHASES $204.9M OF STRC STOCK: SEC FILING
> STRATEGY $4.83B USD RESERVE AND $242.4M USD CASH AS OF OCT. 25: SEC FILING
> $MSTR
#MSTR
> STRATEGY $4.83B USD RESERVE AND $242.4M USD CASH AS OF OCT. 25: SEC FILING
> $MSTR
#MSTR
19

#StrategyMSTRSurpassesNasdaqInMarketCap
🚨 Strategy (MSTR) Makes a Major Market-Cap Move — What It Means for Bitcoin
📊 Why It Matters
Strategy, formerly MicroStrategy, has become one of the most closely watched corporate names in crypto because its business strategy is heavily tied to Bitcoin. Its market valuation can change sharply as BTC prices and investor sentiment shift.
⚡ Potential Impact on Crypto
₿ 1. Stronger Bitcoin Exposure: Rising demand for MSTR shares can reflect growing investor interest in Bitcoin-linked investments, although stock demand alone does not confirm fresh BTC buying.
📈 2. Market Sentiment: A rising MSTR valuation may signal confidence in Bitcoin's long-term investment case. However, the stock can move differently from BTC because of financing decisions, share dilution, and valuation premiums.
⚠️ 3. Volatility Risk: MSTR is not Bitcoin itself. Its shares can experience larger price swings, and a reversal in BTC or a change in investor sentiment could put pressure on the stock.
🔎 Trader's Takeaway
The key question is whether this market-cap milestone reflects sustained demand or a temporary valuation move. Watch BTC price action, institutional flows, and Strategy's financing activity before drawing a broader bullish conclusion.
Bottom line: Strategy remains an important indicator of corporate Bitcoin exposure, but its stock performance alone does not guarantee a Bitcoin rally.
#Bitcoin #BTC #strategy #MSTR
$ARIA $ERA $PLAY
{future}(ARIAUSDT)
{future}(ERAUSDT)
{future}(PLAYUSDT)
#StrategyMSTRSurpassesNasdaqInMarketCap
🚨 Strategy (MSTR) Makes a Major Market-Cap Move — What It Means for Bitcoin
📊 Why It Matters
Strategy, formerly MicroStrategy, has become one of the most closely watched corporate names in crypto because its business strategy is heavily tied to Bitcoin. Its market valuation can change sharply as BTC prices and investor sentiment shift.
⚡ Potential Impact on Crypto
₿ 1. Stronger Bitcoin Exposure: Rising demand for MSTR shares can reflect growing investor interest in Bitcoin-linked investments, although stock demand alone does not confirm fresh BTC buying.
📈 2. Market Sentiment: A rising MSTR valuation may signal confidence in Bitcoin's long-term investment case. However, the stock can move differently from BTC because of financing decisions, share dilution, and valuation premiums.
⚠️ 3. Volatility Risk: MSTR is not Bitcoin itself. Its shares can experience larger price swings, and a reversal in BTC or a change in investor sentiment could put pressure on the stock.
🔎 Trader's Takeaway
The key question is whether this market-cap milestone reflects sustained demand or a temporary valuation move. Watch BTC price action, institutional flows, and Strategy's financing activity before drawing a broader bullish conclusion.
Bottom line: Strategy remains an important indicator of corporate Bitcoin exposure, but its stock performance alone does not guarantee a Bitcoin rally.
#Bitcoin #BTC #strategy #MSTR
$ARIA $ERA $PLAY
🚨 Strategy (MSTR) Makes a Major Market-Cap Move — What It Means for Bitcoin
📊 Why It Matters
Strategy, formerly MicroStrategy, has become one of the most closely watched corporate names in crypto because its business strategy is heavily tied to Bitcoin. Its market valuation can change sharply as BTC prices and investor sentiment shift.
⚡ Potential Impact on Crypto
₿ 1. Stronger Bitcoin Exposure: Rising demand for MSTR shares can reflect growing investor interest in Bitcoin-linked investments, although stock demand alone does not confirm fresh BTC buying.
📈 2. Market Sentiment: A rising MSTR valuation may signal confidence in Bitcoin's long-term investment case. However, the stock can move differently from BTC because of financing decisions, share dilution, and valuation premiums.
⚠️ 3. Volatility Risk: MSTR is not Bitcoin itself. Its shares can experience larger price swings, and a reversal in BTC or a change in investor sentiment could put pressure on the stock.
🔎 Trader's Takeaway
The key question is whether this market-cap milestone reflects sustained demand or a temporary valuation move. Watch BTC price action, institutional flows, and Strategy's financing activity before drawing a broader bullish conclusion.
Bottom line: Strategy remains an important indicator of corporate Bitcoin exposure, but its stock performance alone does not guarantee a Bitcoin rally.
#Bitcoin #BTC #strategy #MSTR
$ARIA $ERA $PLAY

42

·
--
#StrategyMSTRSurpassesNasdaqInMarketCap
🏢 Strategy Is Now Worth More Than Nasdaq Itself
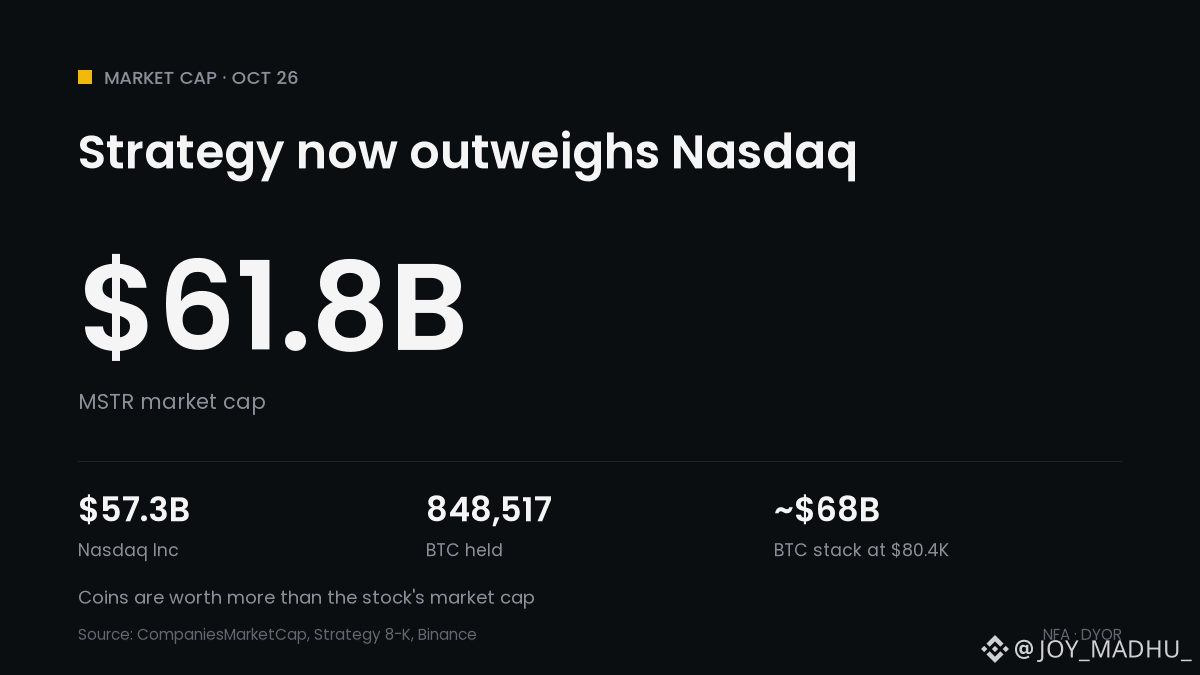
📊 $MSTR market cap: about $61.8B after Friday's $146.01 close
🏛️ Nasdaq Inc, the exchange operator it trades on: about $57.3B
🌍 That puts Strategy at about No. 395 among the world's listed companies
🟠 It holds 848,517 BTC at a $75,446 average (as of Oct 18)
📉 At ~$80.4K, that stack is worth about $68B, more than the stock's market cap
⚠️ Enterprise value, which counts debt and preferred stock, is about $80.6B
📅 Nov 11: MSCI publishes its final list of "non-operating" companies
What it means for crypto: Strategy's size is now tied almost entirely to Bitcoin. Its stock trading near or below the value of its coins can make it harder to raise money for more BTC.
Is Strategy a tech company or a Bitcoin fund? 👇
$BTC
#CryptoNews #Bitcoin #MSTR #StrategyMSTRSurpassesNasdaqInMarketCap
#StrategyMSTRSurpassesNasdaqInMarketCap
🏢 Strategy Is Now Worth More Than Nasdaq Itself
📊 $MSTR market cap: about $61.8B after Friday's $146.01 close
🏛️ Nasdaq Inc, the exchange operator it trades on: about $57.3B
🌍 That puts Strategy at about No. 395 among the world's listed companies
🟠 It holds 848,517 BTC at a $75,446 average (as of Oct 18)
📉 At ~$80.4K, that stack is worth about $68B, more than the stock's market cap
⚠️ Enterprise value, which counts debt and preferred stock, is about $80.6B
📅 Nov 11: MSCI publishes its final list of "non-operating" companies
What it means for crypto: Strategy's size is now tied almost entirely to Bitcoin. Its stock trading near or below the value of its coins can make it harder to raise money for more BTC.
Is Strategy a tech company or a Bitcoin fund? 👇
$BTC
#CryptoNews #Bitcoin #MSTR #StrategyMSTRSurpassesNasdaqInMarketCap
🏢 Strategy Is Now Worth More Than Nasdaq Itself
📊 $MSTR market cap: about $61.8B after Friday's $146.01 close
🏛️ Nasdaq Inc, the exchange operator it trades on: about $57.3B
🌍 That puts Strategy at about No. 395 among the world's listed companies
🟠 It holds 848,517 BTC at a $75,446 average (as of Oct 18)
📉 At ~$80.4K, that stack is worth about $68B, more than the stock's market cap
⚠️ Enterprise value, which counts debt and preferred stock, is about $80.6B
📅 Nov 11: MSCI publishes its final list of "non-operating" companies
What it means for crypto: Strategy's size is now tied almost entirely to Bitcoin. Its stock trading near or below the value of its coins can make it harder to raise money for more BTC.
Is Strategy a tech company or a Bitcoin fund? 👇
$BTC
#CryptoNews #Bitcoin #MSTR #StrategyMSTRSurpassesNasdaqInMarketCap
11

·
--
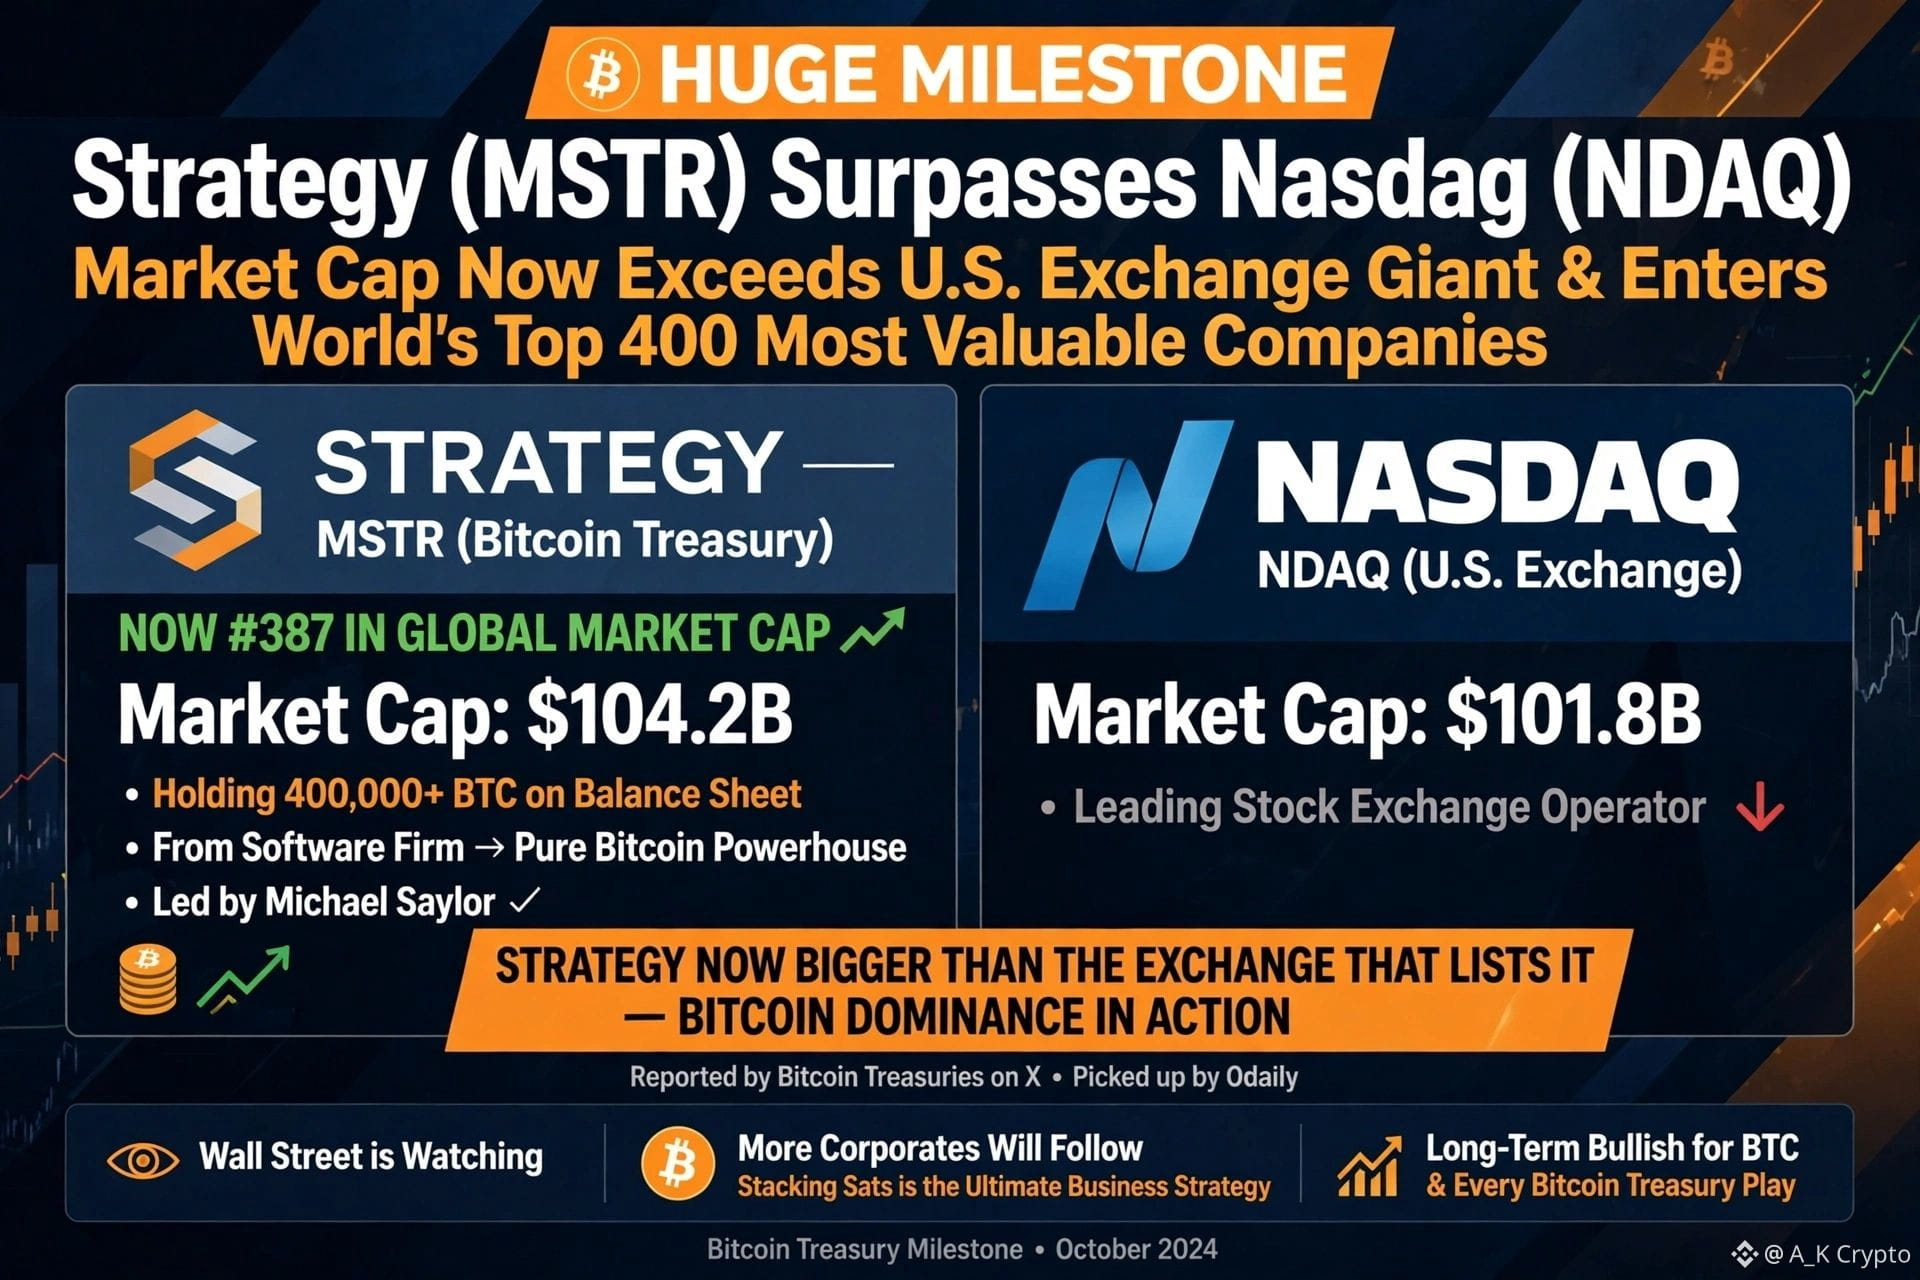
🚀 HUGE milestone for $BTC treasury king!
Strategy’s $MSTR market cap has officially surpassed U.S. exchange giant Nasdaq (NDAQ) and entered the world’s top 400 most valuable companies.
Reported by Bitcoin Treasuries on X and picked up by Odaily.
From software firm to pure Bitcoin powerhouse — Michael Saylor’s Strategy just overtook one of the biggest names in traditional finance.
This is pure Bitcoin dominance in action. A company holding hundreds of thousands of BTC is now bigger than the exchange that lists it. Wall Street is watching — more corporates will follow. $MSTR keeps proving that stacking sats is the ultimate business strategy. Long-term bullish for BTC and every Bitcoin treasury play. 🔥
#MSTR #Bitcoin #Strategy #CryptoNews #BTC
{spot}(BTCUSDT)
🚀 HUGE milestone for $BTC treasury king!
Strategy’s $MSTR market cap has officially surpassed U.S. exchange giant Nasdaq (NDAQ) and entered the world’s top 400 most valuable companies.
Reported by Bitcoin Treasuries on X and picked up by Odaily.
From software firm to pure Bitcoin powerhouse — Michael Saylor’s Strategy just overtook one of the biggest names in traditional finance.
This is pure Bitcoin dominance in action. A company holding hundreds of thousands of BTC is now bigger than the exchange that lists it. Wall Street is watching — more corporates will follow. $MSTR keeps proving that stacking sats is the ultimate business strategy. Long-term bullish for BTC and every Bitcoin treasury play. 🔥
#MSTR #Bitcoin #Strategy #CryptoNews #BTC
Strategy’s $MSTR market cap has officially surpassed U.S. exchange giant Nasdaq (NDAQ) and entered the world’s top 400 most valuable companies.
Reported by Bitcoin Treasuries on X and picked up by Odaily.
From software firm to pure Bitcoin powerhouse — Michael Saylor’s Strategy just overtook one of the biggest names in traditional finance.
This is pure Bitcoin dominance in action. A company holding hundreds of thousands of BTC is now bigger than the exchange that lists it. Wall Street is watching — more corporates will follow. $MSTR keeps proving that stacking sats is the ultimate business strategy. Long-term bullish for BTC and every Bitcoin treasury play. 🔥
#MSTR #Bitcoin #Strategy #CryptoNews #BTC
62

·
--
🚨🔥 #MSTR SURPASSES NASDAQ INC. IN MARKET CAP — BITCOIN STRATEGY MAKES HEADLINES! ₿📈
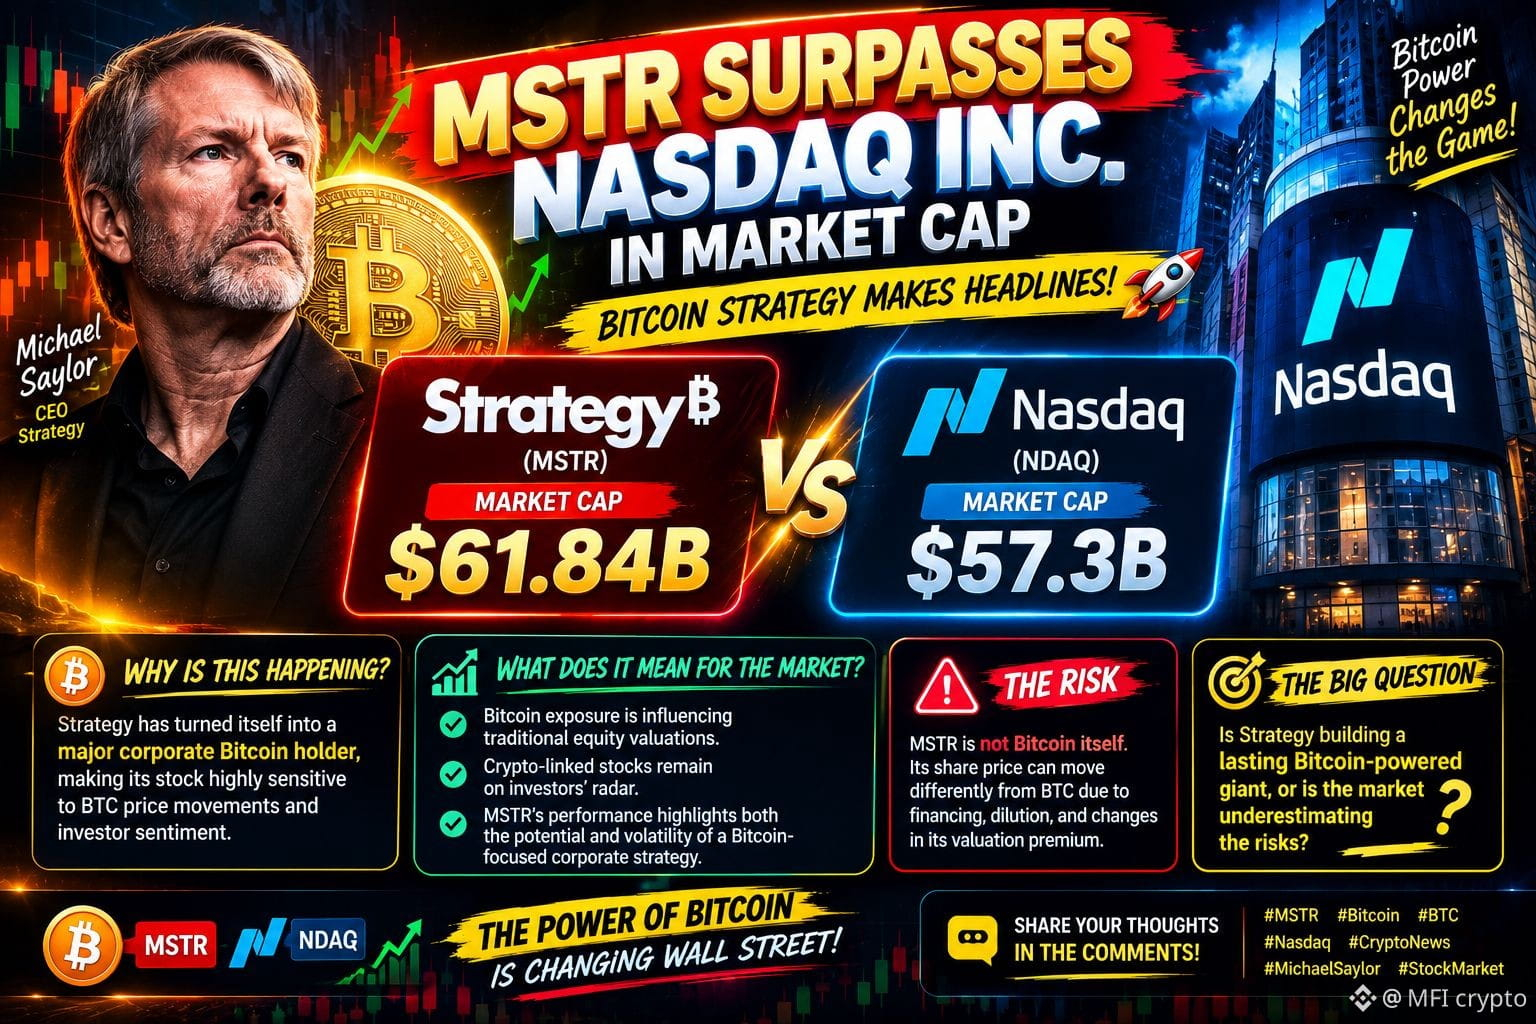
Wall Street has a new talking point! 👀 Strategy ($MSTR), Michael Saylor’s Bitcoin-focused company, has reportedly overtaken Nasdaq Inc. ($NDAQ.US ) in market capitalization.
💰 THE NUMBERS THAT MATTER
📊 MSTR: Approximately $61.84 billion
📊 NDAQ: Approximately $57.3 billion
Reported October 2026 figures; market caps fluctuate with share prices and share counts.
₿ WHY IS THIS HAPPENING?
Strategy has transformed itself into a major corporate Bitcoin holder, making its stock highly sensitive to BTC price movements and investor sentiment.
🔥 WHAT DOES IT MEAN FOR THE MARKET?
✅ Bitcoin exposure is influencing traditional equity valuations.
✅ Crypto-linked stocks remain on investors’ radar.
✅ MSTR’s performance highlights both the potential and volatility of a Bitcoin-focused corporate strategy.
⚠️ THE RISK: MSTR is not Bitcoin itself. Its share price can move differently from BTC due to financing, dilution, and changes in its valuation premium.
🎯 THE BIG QUESTION: Is Strategy building a lasting Bitcoin-powered giant, or is the market underestimating the risks?
👇 Share your thoughts in the comments!
#MSTR #Bitcoin #BTC #Nasdaq #CryptoNews #MichaelSaylor #StockMarket #BinanceSquare
#strategymstrsurpassesnasdaqinmarketcap
{stock_us}(NDAQ.US)
{spot}(ZECUSDT)
{spot}(BTCUSDT)
🚨🔥 #MSTR SURPASSES NASDAQ INC. IN MARKET CAP — BITCOIN STRATEGY MAKES HEADLINES! ₿📈
Wall Street has a new talking point! 👀 Strategy ($MSTR), Michael Saylor’s Bitcoin-focused company, has reportedly overtaken Nasdaq Inc. ($NDAQ.US ) in market capitalization.
💰 THE NUMBERS THAT MATTER
📊 MSTR: Approximately $61.84 billion
📊 NDAQ: Approximately $57.3 billion
Reported October 2026 figures; market caps fluctuate with share prices and share counts.
₿ WHY IS THIS HAPPENING?
Strategy has transformed itself into a major corporate Bitcoin holder, making its stock highly sensitive to BTC price movements and investor sentiment.
🔥 WHAT DOES IT MEAN FOR THE MARKET?
✅ Bitcoin exposure is influencing traditional equity valuations.
✅ Crypto-linked stocks remain on investors’ radar.
✅ MSTR’s performance highlights both the potential and volatility of a Bitcoin-focused corporate strategy.
⚠️ THE RISK: MSTR is not Bitcoin itself. Its share price can move differently from BTC due to financing, dilution, and changes in its valuation premium.
🎯 THE BIG QUESTION: Is Strategy building a lasting Bitcoin-powered giant, or is the market underestimating the risks?
👇 Share your thoughts in the comments!
#MSTR #Bitcoin #BTC #Nasdaq #CryptoNews #MichaelSaylor #StockMarket #BinanceSquare
#strategymstrsurpassesnasdaqinmarketcap
Wall Street has a new talking point! 👀 Strategy ($MSTR), Michael Saylor’s Bitcoin-focused company, has reportedly overtaken Nasdaq Inc. ($NDAQ.US ) in market capitalization.
💰 THE NUMBERS THAT MATTER
📊 MSTR: Approximately $61.84 billion
📊 NDAQ: Approximately $57.3 billion
Reported October 2026 figures; market caps fluctuate with share prices and share counts.
₿ WHY IS THIS HAPPENING?
Strategy has transformed itself into a major corporate Bitcoin holder, making its stock highly sensitive to BTC price movements and investor sentiment.
🔥 WHAT DOES IT MEAN FOR THE MARKET?
✅ Bitcoin exposure is influencing traditional equity valuations.
✅ Crypto-linked stocks remain on investors’ radar.
✅ MSTR’s performance highlights both the potential and volatility of a Bitcoin-focused corporate strategy.
⚠️ THE RISK: MSTR is not Bitcoin itself. Its share price can move differently from BTC due to financing, dilution, and changes in its valuation premium.
🎯 THE BIG QUESTION: Is Strategy building a lasting Bitcoin-powered giant, or is the market underestimating the risks?
👇 Share your thoughts in the comments!
#MSTR #Bitcoin #BTC #Nasdaq #CryptoNews #MichaelSaylor #StockMarket #BinanceSquare
#strategymstrsurpassesnasdaqinmarketcap
1
106

·
--
🚨 $MSTR FLIPS NASDAQ IN MARKET CAP SHOWDOWN! 📈
Smart money has been quietly loading BTC on MSTR's balance sheet, turning the software firm into a de‑facto Bitcoin trust. The resulting institutional premium has driven its market cap past $57 B, eclipsing Nasdaq's valuation. 📊🦈
When traditional exchange liquidity collides with immutable scarcity, the upside skew sharpens. The flip signals a new hierarchy where corporate treasuries become liquidity magnets for the next wave of institutional demand. 📈💡
💬 Will the premium sustain or will a liquidity pullback re‑price the flip? 👇
⚠️ Not financial advice. Always manage your risk. 🛡️
🏷️ #MSTR #MarketCapFlip #InstitutionalMoney #Crypto #MacroShift
🦈 🚀
🚨 $MSTR FLIPS NASDAQ IN MARKET CAP SHOWDOWN! 📈
Smart money has been quietly loading BTC on MSTR's balance sheet, turning the software firm into a de‑facto Bitcoin trust. The resulting institutional premium has driven its market cap past $57 B, eclipsing Nasdaq's valuation. 📊🦈
When traditional exchange liquidity collides with immutable scarcity, the upside skew sharpens. The flip signals a new hierarchy where corporate treasuries become liquidity magnets for the next wave of institutional demand. 📈💡
💬 Will the premium sustain or will a liquidity pullback re‑price the flip? 👇
⚠️ Not financial advice. Always manage your risk. 🛡️
🏷️ #MSTR #MarketCapFlip #InstitutionalMoney #Crypto #MacroShift
🦈 🚀
Smart money has been quietly loading BTC on MSTR's balance sheet, turning the software firm into a de‑facto Bitcoin trust. The resulting institutional premium has driven its market cap past $57 B, eclipsing Nasdaq's valuation. 📊🦈
When traditional exchange liquidity collides with immutable scarcity, the upside skew sharpens. The flip signals a new hierarchy where corporate treasuries become liquidity magnets for the next wave of institutional demand. 📈💡
💬 Will the premium sustain or will a liquidity pullback re‑price the flip? 👇
⚠️ Not financial advice. Always manage your risk. 🛡️
🏷️ #MSTR #MarketCapFlip #InstitutionalMoney #Crypto #MacroShift
🦈 🚀

2

·
--
🚀 $MSTR FLIPS NASDAQ IN A BOLD BITCOIN PLAY! 🟢
📊 MicroStrategy’s balance sheet now reads like a Bitcoin vault, turning a software firm into a pure crypto proxy. The relentless BTC accumulation has vaulted its market cap past $57 B, eclipsing the legendary exchange operator. 🦈
⚡ That premium is fueled by institutional appetite for digital scarcity, creating a liquidity surge that’s hard to ignore. Yet the rapid ascent also invites a fresh wave of scrutiny—can the premium sustain when the market pivots? 💡
💬 How do you see $MSTR ’s trajectory shaping the next tier of crypto‑driven giants? 👇
⚠️ Not financial advice. Always manage your risk. 🛡️
🏷️ #MSTR #Bitcoin #MarketCap #Crypto #LongSetup
🔥 💎
🚀 $MSTR FLIPS NASDAQ IN A BOLD BITCOIN PLAY! 🟢
📊 MicroStrategy’s balance sheet now reads like a Bitcoin vault, turning a software firm into a pure crypto proxy. The relentless BTC accumulation has vaulted its market cap past $57 B, eclipsing the legendary exchange operator. 🦈
⚡ That premium is fueled by institutional appetite for digital scarcity, creating a liquidity surge that’s hard to ignore. Yet the rapid ascent also invites a fresh wave of scrutiny—can the premium sustain when the market pivots? 💡
💬 How do you see $MSTR ’s trajectory shaping the next tier of crypto‑driven giants? 👇
⚠️ Not financial advice. Always manage your risk. 🛡️
🏷️ #MSTR #Bitcoin #MarketCap #Crypto #LongSetup
🔥 💎
📊 MicroStrategy’s balance sheet now reads like a Bitcoin vault, turning a software firm into a pure crypto proxy. The relentless BTC accumulation has vaulted its market cap past $57 B, eclipsing the legendary exchange operator. 🦈
⚡ That premium is fueled by institutional appetite for digital scarcity, creating a liquidity surge that’s hard to ignore. Yet the rapid ascent also invites a fresh wave of scrutiny—can the premium sustain when the market pivots? 💡
💬 How do you see $MSTR ’s trajectory shaping the next tier of crypto‑driven giants? 👇
⚠️ Not financial advice. Always manage your risk. 🛡️
🏷️ #MSTR #Bitcoin #MarketCap #Crypto #LongSetup
🔥 💎

7

#StrategyMSTRSurpassesNasdaqInMarketCap
🚀 Strategy (MSTR) Makes a Major Market Cap Statement! 📈
🔥 Strategy Surpasses Nasdaq in Market Capitalization!
Strategy continues to attract attention in the financial world with its aggressive Bitcoin-focused approach. The company, formerly known as MicroStrategy, has built a strong identity around Bitcoin accumulation, making it one of the most closely watched names in the crypto market.
💡 Why does this matter? ₿ Strategy’s Bitcoin-focused treasury model keeps it in the spotlight. 📊 Its market valuation reflects strong investor interest and changing market sentiment. 🌐 The connection between traditional equities and Bitcoin continues to grow.
⚠️ What’s next? Investors will be watching Bitcoin’s price movements, Strategy’s future purchases, and changes in market valuation to see whether this momentum continues.
🔥 Is Strategy becoming one of the biggest bridges between Wall Street and Bitcoin?
👇 What do you think? Bullish or bearish for MSTR?
#Strategy #MSTR #Bitcoin #BTC #CryptoNews #StockMarket #BinanceSquare
Market commentary only — not financial advice.
$MSCI.US $TSMB $MSFTB
#StrategyMSTRSurpassesNasdaqInMarketCap
🚀 Strategy (MSTR) Makes a Major Market Cap Statement! 📈
🔥 Strategy Surpasses Nasdaq in Market Capitalization!
Strategy continues to attract attention in the financial world with its aggressive Bitcoin-focused approach. The company, formerly known as MicroStrategy, has built a strong identity around Bitcoin accumulation, making it one of the most closely watched names in the crypto market.
💡 Why does this matter? ₿ Strategy’s Bitcoin-focused treasury model keeps it in the spotlight. 📊 Its market valuation reflects strong investor interest and changing market sentiment. 🌐 The connection between traditional equities and Bitcoin continues to grow.
⚠️ What’s next? Investors will be watching Bitcoin’s price movements, Strategy’s future purchases, and changes in market valuation to see whether this momentum continues.
🔥 Is Strategy becoming one of the biggest bridges between Wall Street and Bitcoin?
👇 What do you think? Bullish or bearish for MSTR?
#Strategy #MSTR #Bitcoin #BTC #CryptoNews #StockMarket #BinanceSquare
Market commentary only — not financial advice.
$MSCI.US $TSMB $MSFTB
🚀 Strategy (MSTR) Makes a Major Market Cap Statement! 📈
🔥 Strategy Surpasses Nasdaq in Market Capitalization!
Strategy continues to attract attention in the financial world with its aggressive Bitcoin-focused approach. The company, formerly known as MicroStrategy, has built a strong identity around Bitcoin accumulation, making it one of the most closely watched names in the crypto market.
💡 Why does this matter? ₿ Strategy’s Bitcoin-focused treasury model keeps it in the spotlight. 📊 Its market valuation reflects strong investor interest and changing market sentiment. 🌐 The connection between traditional equities and Bitcoin continues to grow.
⚠️ What’s next? Investors will be watching Bitcoin’s price movements, Strategy’s future purchases, and changes in market valuation to see whether this momentum continues.
🔥 Is Strategy becoming one of the biggest bridges between Wall Street and Bitcoin?
👇 What do you think? Bullish or bearish for MSTR?
#Strategy #MSTR #Bitcoin #BTC #CryptoNews #StockMarket #BinanceSquare
Market commentary only — not financial advice.
$MSCI.US $TSMB $MSFTB

33

🚨 $MSTR IGNITES POWERFUL BULLISH MOMENTUM TOWARDS FRESH LOCAL HIGH TARGETS! 💥
Entry: 135 ⚡
Target: 150 🚀
$MSTR has officially unlocked a clean continuation runway after holding solid structural support around the $135 region. ⚡ Buyers are aggressively stepping in, driving order flow with distinct upward velocity as resistance thins out ahead.
📊 With market momentum clearly favoring the bulls, the path of least resistance points straight toward the $150 liquidity pocket. Holding positions from this accumulation base offers a razor-sharp high-conviction setup as expansion kicks into gear. 💬 Are you holding through to $150 or securing profits along the way? 👇
⚠️ Not financial advice. Always manage your risk. 🛡️
🏷️ #MSTR #BullishMomentum #Breakout #CryptoTrading
🔥 💎
🚨 $MSTR IGNITES POWERFUL BULLISH MOMENTUM TOWARDS FRESH LOCAL HIGH TARGETS! 💥
Entry: 135 ⚡
Target: 150 🚀
$MSTR has officially unlocked a clean continuation runway after holding solid structural support around the $135 region. ⚡ Buyers are aggressively stepping in, driving order flow with distinct upward velocity as resistance thins out ahead.
📊 With market momentum clearly favoring the bulls, the path of least resistance points straight toward the $150 liquidity pocket. Holding positions from this accumulation base offers a razor-sharp high-conviction setup as expansion kicks into gear. 💬 Are you holding through to $150 or securing profits along the way? 👇
⚠️ Not financial advice. Always manage your risk. 🛡️
🏷️ #MSTR #BullishMomentum #Breakout #CryptoTrading
🔥 💎
Entry: 135 ⚡
Target: 150 🚀
$MSTR has officially unlocked a clean continuation runway after holding solid structural support around the $135 region. ⚡ Buyers are aggressively stepping in, driving order flow with distinct upward velocity as resistance thins out ahead.
📊 With market momentum clearly favoring the bulls, the path of least resistance points straight toward the $150 liquidity pocket. Holding positions from this accumulation base offers a razor-sharp high-conviction setup as expansion kicks into gear. 💬 Are you holding through to $150 or securing profits along the way? 👇
⚠️ Not financial advice. Always manage your risk. 🛡️
🏷️ #MSTR #BullishMomentum #Breakout #CryptoTrading
🔥 💎
23
⚡ $MSTR UNLOCKS A HIGH-VELOCITY 4H BREAKOUT AS BUYERS STEP UP IN FORCE! 💥
Entry: 136.50 - 138.00 ⚡
Target: 139.00 - 142.00 🎯
Stop Loss: 134.50 ⚠️
⚡ The 4H timeframe just activated a textbook bullish breakout, pushing through resistance with impressive buyer momentum. 📌 As long as price defends the key 136.50 flip, the continuation path remains wide open for higher expansions.
📊 Volume expansion on this move signals genuine institutional interest rather than a passive retail drift. 💡 Order flow is heavily favored toward aggressive bid defense on any minor dip into the entry zone.
💬 Are you catching this momentum bid above 136.50 or waiting for targets to hit? 👇
⚠️ Not financial advice. Always manage your risk. 🛡️
🏷️ #MSTR #Breakout #LongSetup #Crypto #Trading
🔥 💎
⚡ $MSTR UNLOCKS A HIGH-VELOCITY 4H BREAKOUT AS BUYERS STEP UP IN FORCE! 💥
Entry: 136.50 - 138.00 ⚡
Target: 139.00 - 142.00 🎯
Stop Loss: 134.50 ⚠️
⚡ The 4H timeframe just activated a textbook bullish breakout, pushing through resistance with impressive buyer momentum. 📌 As long as price defends the key 136.50 flip, the continuation path remains wide open for higher expansions.
📊 Volume expansion on this move signals genuine institutional interest rather than a passive retail drift. 💡 Order flow is heavily favored toward aggressive bid defense on any minor dip into the entry zone.
💬 Are you catching this momentum bid above 136.50 or waiting for targets to hit? 👇
⚠️ Not financial advice. Always manage your risk. 🛡️
🏷️ #MSTR #Breakout #LongSetup #Crypto #Trading
🔥 💎
Entry: 136.50 - 138.00 ⚡
Target: 139.00 - 142.00 🎯
Stop Loss: 134.50 ⚠️
⚡ The 4H timeframe just activated a textbook bullish breakout, pushing through resistance with impressive buyer momentum. 📌 As long as price defends the key 136.50 flip, the continuation path remains wide open for higher expansions.
📊 Volume expansion on this move signals genuine institutional interest rather than a passive retail drift. 💡 Order flow is heavily favored toward aggressive bid defense on any minor dip into the entry zone.
💬 Are you catching this momentum bid above 136.50 or waiting for targets to hit? 👇
⚠️ Not financial advice. Always manage your risk. 🛡️
🏷️ #MSTR #Breakout #LongSetup #Crypto #Trading
🔥 💎
7

Verified
#strategymstrsurpassesnasdaqinmarketcap
🚨 THE LEVERAGE EQUATION: $MSTR
{future}(MSTRUSDT)
IS TURNING THE NASDAQ UPSIDE DOWN 🚨
Michael Saylor’s ultimate bet on his company’s treasury has just reached a historic milestone! Let’s break down MicroStrategy’s market cap flip using simple calculations 🧮👇
(Massive BTC treasury
Here’s the exact formula driving this corporate takeover:
The asset variable:
(The Bitcoin standard) = MicroStrategy has boldly transformed itself from a traditional software company into the go-to vehicle for investing in Bitcoin, accumulating billions in BTC on its balance sheet.
The valuation variable:
(The great reversal) = Fueled by relentless demand for its crypto strategy, MSTR’s market capitalization has surpassed $57 billion. It has officially overtaken the market value of Nasdaq Inc. itself and joined the ranks of the world’s 400 largest companies.
The breakdown:
This is a major macroeconomic upheaval. A company that operates primarily as a leveraged Bitcoin-holding entity is now worth more than the legendary stock exchange operator where its shares are listed! When traditional finance liquidity meets absolute digital scarcity, the resulting premium is explosive.
Will MicroStrategy continue its meteoric rise in the global rankings, or is this premium too high to last? Let’s discuss! 👇💬
#BTC #MSTR #CryptoNews
$BULLA
{future}(BULLAUSDT)
$DOOD
{future}(DOODUSDT)
#strategymstrsurpassesnasdaqinmarketcap
🚨 THE LEVERAGE EQUATION: $MSTR
IS TURNING THE NASDAQ UPSIDE DOWN 🚨
Michael Saylor’s ultimate bet on his company’s treasury has just reached a historic milestone! Let’s break down MicroStrategy’s market cap flip using simple calculations 🧮👇
(Massive BTC treasury
Here’s the exact formula driving this corporate takeover:
The asset variable:
(The Bitcoin standard) = MicroStrategy has boldly transformed itself from a traditional software company into the go-to vehicle for investing in Bitcoin, accumulating billions in BTC on its balance sheet.
The valuation variable:
(The great reversal) = Fueled by relentless demand for its crypto strategy, MSTR’s market capitalization has surpassed $57 billion. It has officially overtaken the market value of Nasdaq Inc. itself and joined the ranks of the world’s 400 largest companies.
The breakdown:
This is a major macroeconomic upheaval. A company that operates primarily as a leveraged Bitcoin-holding entity is now worth more than the legendary stock exchange operator where its shares are listed! When traditional finance liquidity meets absolute digital scarcity, the resulting premium is explosive.
Will MicroStrategy continue its meteoric rise in the global rankings, or is this premium too high to last? Let’s discuss! 👇💬
#BTC #MSTR #CryptoNews
$BULLA
$DOOD
🚨 THE LEVERAGE EQUATION: $MSTR
IS TURNING THE NASDAQ UPSIDE DOWN 🚨
Michael Saylor’s ultimate bet on his company’s treasury has just reached a historic milestone! Let’s break down MicroStrategy’s market cap flip using simple calculations 🧮👇
(Massive BTC treasury
Here’s the exact formula driving this corporate takeover:
The asset variable:
(The Bitcoin standard) = MicroStrategy has boldly transformed itself from a traditional software company into the go-to vehicle for investing in Bitcoin, accumulating billions in BTC on its balance sheet.
The valuation variable:
(The great reversal) = Fueled by relentless demand for its crypto strategy, MSTR’s market capitalization has surpassed $57 billion. It has officially overtaken the market value of Nasdaq Inc. itself and joined the ranks of the world’s 400 largest companies.
The breakdown:
This is a major macroeconomic upheaval. A company that operates primarily as a leveraged Bitcoin-holding entity is now worth more than the legendary stock exchange operator where its shares are listed! When traditional finance liquidity meets absolute digital scarcity, the resulting premium is explosive.
Will MicroStrategy continue its meteoric rise in the global rankings, or is this premium too high to last? Let’s discuss! 👇💬
#BTC #MSTR #CryptoNews
$BULLA
$DOOD

1.1k

#strategymstrsurpassesnasdaqinmarketcap
THE LEVERAGE EFFECT EQUATION: $MSTR OVERTAKES NASDAQ
Michael Saylor’s bold bet has just rewritten the hierarchy of the financial market. MicroStrategy (MSTR) has surpassed Nasdaq Inc. in market value, entering the select group of the 400 largest companies in the world.
Let’s look at the numbers in the equation:
The base asset: 848.517 BTC in treasury, valued at tens of billions of dollars. The company is no longer just software; it has become the largest corporate vehicle for Bitcoin exposure.
The leverage: The relentless demand for MSTR shares pushed its market capitalization beyond US$57 billion, surpassing the valuation of the exchange itself that lists its shares.
The analysis:
This is an unprecedented macroeconomic twist. A company whose main asset is a decentralized digital currency is now worth more than one of the main infrastructures of the traditional financial system. When institutional liquidity meets Bitcoin’s programmed scarcity, the market premium becomes explosive.
The question that remains is: is this rise sustainable in the long term, or is the premium stretched too far?
$BTC $BULLA
#BTC #MSTR #CryptoNews
{spot}(BTCUSDT)
{future}(BULLAUSDT)
{future}(MSTRUSDT)
#strategymstrsurpassesnasdaqinmarketcap
THE LEVERAGE EFFECT EQUATION: $MSTR OVERTAKES NASDAQ
Michael Saylor’s bold bet has just rewritten the hierarchy of the financial market. MicroStrategy (MSTR) has surpassed Nasdaq Inc. in market value, entering the select group of the 400 largest companies in the world.
Let’s look at the numbers in the equation:
The base asset: 848.517 BTC in treasury, valued at tens of billions of dollars. The company is no longer just software; it has become the largest corporate vehicle for Bitcoin exposure.
The leverage: The relentless demand for MSTR shares pushed its market capitalization beyond US$57 billion, surpassing the valuation of the exchange itself that lists its shares.
The analysis:
This is an unprecedented macroeconomic twist. A company whose main asset is a decentralized digital currency is now worth more than one of the main infrastructures of the traditional financial system. When institutional liquidity meets Bitcoin’s programmed scarcity, the market premium becomes explosive.
The question that remains is: is this rise sustainable in the long term, or is the premium stretched too far?
$BTC $BULLA
#BTC #MSTR #CryptoNews
THE LEVERAGE EFFECT EQUATION: $MSTR OVERTAKES NASDAQ
Michael Saylor’s bold bet has just rewritten the hierarchy of the financial market. MicroStrategy (MSTR) has surpassed Nasdaq Inc. in market value, entering the select group of the 400 largest companies in the world.
Let’s look at the numbers in the equation:
The base asset: 848.517 BTC in treasury, valued at tens of billions of dollars. The company is no longer just software; it has become the largest corporate vehicle for Bitcoin exposure.
The leverage: The relentless demand for MSTR shares pushed its market capitalization beyond US$57 billion, surpassing the valuation of the exchange itself that lists its shares.
The analysis:
This is an unprecedented macroeconomic twist. A company whose main asset is a decentralized digital currency is now worth more than one of the main infrastructures of the traditional financial system. When institutional liquidity meets Bitcoin’s programmed scarcity, the market premium becomes explosive.
The question that remains is: is this rise sustainable in the long term, or is the premium stretched too far?
$BTC $BULLA
#BTC #MSTR #CryptoNews

1
365

MSTR’s market cap surpasses Nasdaq, placing it among the world’s 400 largest publicly traded companies
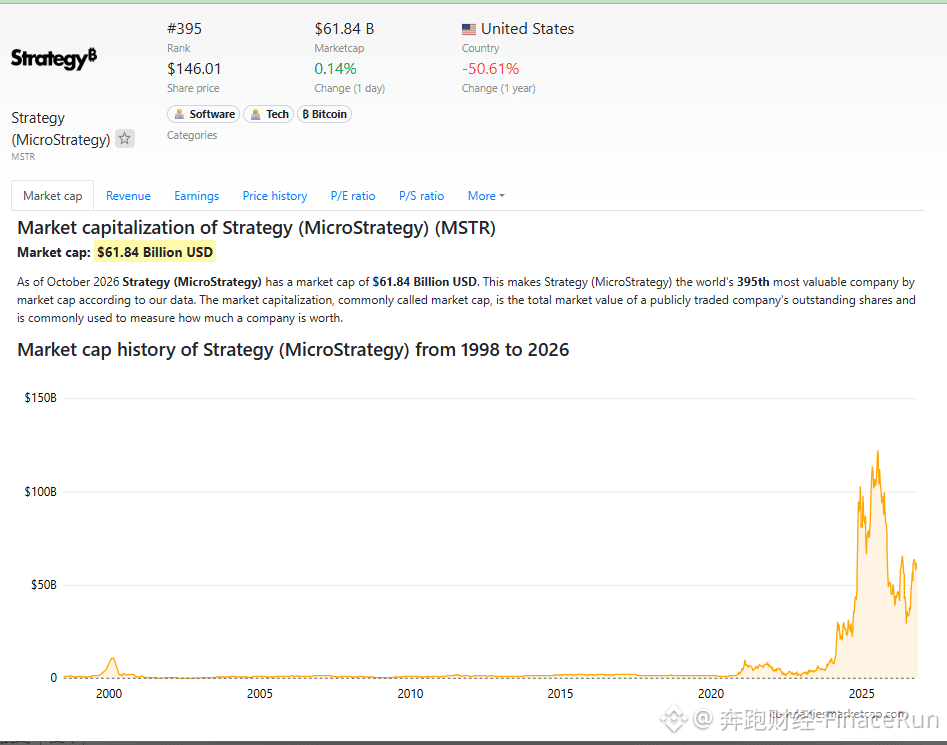
On October 26, Bitcoin Treasuries posted on X that Strategy’s MSTR now has a larger market cap than U.S. exchange giant Nasdaq, placing it among the 400 companies with the highest market caps worldwide.
Although the post did not disclose specific market cap figures, the live global rankings on Companiesmarketcap show that MSTR currently has a market cap of approximately $61.84 billion, ranking 395th among publicly traded companies worldwide;
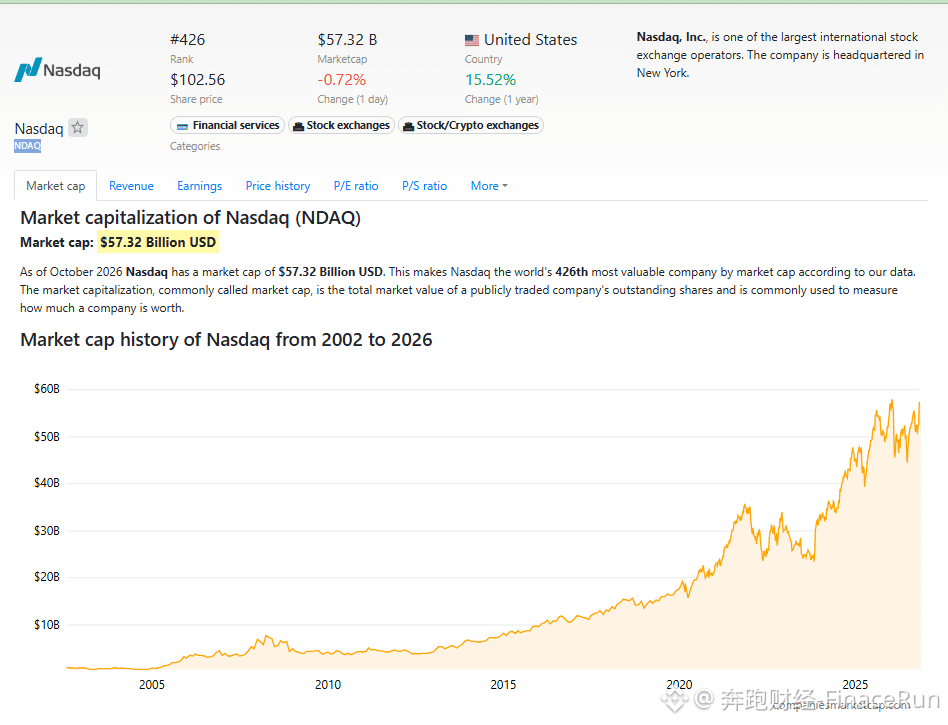
Nasdaq (NDAQ), meanwhile, has a current market cap of approximately $57.32 billion, ranking 426th globally. The two companies’ market caps currently differ by about $4.5 billion.
Notably, given the stark difference in the foundations of these two companies’ businesses, this market cap reversal is particularly significant:
MSTR’s share price is closely tied to Bitcoin’s performance. Its core strategy is to continuously accumulate Bitcoin, which has in turn boosted the company’s valuation;
Nasdaq, on the other hand, is a long-established securities trading infrastructure provider that has operated for many years and generates sustainable traditional finance cash flows through securities trading on its platform.
Therefore, MSTR’s rise above Nasdaq in the rankings is a tangible sign that crypto assets have entered mainstream capital markets.
What do you think: when a company that holds Bitcoin surpasses the market cap of the exchange where it is listed, is that a testament to the strength of its Bitcoin holdings, or has the market gone overboard with its valuation?
Finally, are you still waiting for Bitcoin’s price to return to a more rational level, or have you already bought in?
#MSTR
MSTR’s market cap surpasses Nasdaq, placing it among the world’s 400 largest publicly traded companies
On October 26, Bitcoin Treasuries posted on X that Strategy’s MSTR now has a larger market cap than U.S. exchange giant Nasdaq, placing it among the 400 companies with the highest market caps worldwide.
Although the post did not disclose specific market cap figures, the live global rankings on Companiesmarketcap show that MSTR currently has a market cap of approximately $61.84 billion, ranking 395th among publicly traded companies worldwide;
Nasdaq (NDAQ), meanwhile, has a current market cap of approximately $57.32 billion, ranking 426th globally. The two companies’ market caps currently differ by about $4.5 billion.
Notably, given the stark difference in the foundations of these two companies’ businesses, this market cap reversal is particularly significant:
MSTR’s share price is closely tied to Bitcoin’s performance. Its core strategy is to continuously accumulate Bitcoin, which has in turn boosted the company’s valuation;
Nasdaq, on the other hand, is a long-established securities trading infrastructure provider that has operated for many years and generates sustainable traditional finance cash flows through securities trading on its platform.
Therefore, MSTR’s rise above Nasdaq in the rankings is a tangible sign that crypto assets have entered mainstream capital markets.
What do you think: when a company that holds Bitcoin surpasses the market cap of the exchange where it is listed, is that a testament to the strength of its Bitcoin holdings, or has the market gone overboard with its valuation?
Finally, are you still waiting for Bitcoin’s price to return to a more rational level, or have you already bought in?
#MSTR
On October 26, Bitcoin Treasuries posted on X that Strategy’s MSTR now has a larger market cap than U.S. exchange giant Nasdaq, placing it among the 400 companies with the highest market caps worldwide.
Although the post did not disclose specific market cap figures, the live global rankings on Companiesmarketcap show that MSTR currently has a market cap of approximately $61.84 billion, ranking 395th among publicly traded companies worldwide;
Nasdaq (NDAQ), meanwhile, has a current market cap of approximately $57.32 billion, ranking 426th globally. The two companies’ market caps currently differ by about $4.5 billion.
Notably, given the stark difference in the foundations of these two companies’ businesses, this market cap reversal is particularly significant:
MSTR’s share price is closely tied to Bitcoin’s performance. Its core strategy is to continuously accumulate Bitcoin, which has in turn boosted the company’s valuation;
Nasdaq, on the other hand, is a long-established securities trading infrastructure provider that has operated for many years and generates sustainable traditional finance cash flows through securities trading on its platform.
Therefore, MSTR’s rise above Nasdaq in the rankings is a tangible sign that crypto assets have entered mainstream capital markets.
What do you think: when a company that holds Bitcoin surpasses the market cap of the exchange where it is listed, is that a testament to the strength of its Bitcoin holdings, or has the market gone overboard with its valuation?
Finally, are you still waiting for Bitcoin’s price to return to a more rational level, or have you already bought in?
#MSTR

1
221

·
--
🎯 Bitcoin’s biggest buyer has completely sat on its hands this week
📰 Strategy holds 848,500 BTC at an average price of $75.4K; last week, it neither issued shares nor bought or sold a single coin
💬 At the current price of $80.2K, its unrealized gains are painfully slim. It used to buy more aggressively the lower prices fell, but now it’s doing absolutely nothing. Pretty wild. The real test is only just beginning—just watch
🏷️ #Strategy #MSTR #机构持仓 #HODL
🎯 Bitcoin’s biggest buyer has completely sat on its hands this week
📰 Strategy holds 848,500 BTC at an average price of $75.4K; last week, it neither issued shares nor bought or sold a single coin
💬 At the current price of $80.2K, its unrealized gains are painfully slim. It used to buy more aggressively the lower prices fell, but now it’s doing absolutely nothing. Pretty wild. The real test is only just beginning—just watch
🏷️ #Strategy #MSTR #机构持仓 #HODL
📰 Strategy holds 848,500 BTC at an average price of $75.4K; last week, it neither issued shares nor bought or sold a single coin
💬 At the current price of $80.2K, its unrealized gains are painfully slim. It used to buy more aggressively the lower prices fell, but now it’s doing absolutely nothing. Pretty wild. The real test is only just beginning—just watch
🏷️ #Strategy #MSTR #机构持仓 #HODL
2

“Saylor” says Strategy has repurchased “$205 million” of $STRC. As of October 25, 2026, we hold “$848,517 worth of Bitcoin and $5.1 billion in dollar assets”#MSTR #MichaelSaylor
{spot}(MSTRBUSDT)
{spot}(BTCUSDT)
“Saylor” says Strategy has repurchased “$205 million” of $STRC. As of October 25, 2026, we hold “$848,517 worth of Bitcoin and $5.1 billion in dollar assets”#MSTR #MichaelSaylor

1
263

·
--
Verified
Bitcoin at $200,000: How Far Away Is It?First, consider a bottleneck. Many U.S. stock brokerage accounts want Bitcoin exposure but don’t want to open an account directly with an exchange. Strategy is one of the easiest ways for them to get it.
That gateway got bigger today. Strategy’s market cap has surpassed Nasdaq, the company, putting it among the world’s top 400 or so. To be clear, “Nasdaq” here means the publicly traded company Nasdaq, not the Nasdaq index. Rankings vary from 398th to 418th across data sources, and its market cap is around $60 billion.
A Bitcoin treasury worth more than the exchange operator itself. Strategy has already taken a seat at the table.
Bitcoin at $200,000: How Far Away Is It?
First, consider a bottleneck. Many U.S. stock brokerage accounts want Bitcoin exposure but don’t want to open an account directly with an exchange. Strategy is one of the easiest ways for them to get it.
That gateway got bigger today. Strategy’s market cap has surpassed Nasdaq, the company, putting it among the world’s top 400 or so. To be clear, “Nasdaq” here means the publicly traded company Nasdaq, not the Nasdaq index. Rankings vary from 398th to 418th across data sources, and its market cap is around $60 billion.
A Bitcoin treasury worth more than the exchange operator itself. Strategy has already taken a seat at the table.
That gateway got bigger today. Strategy’s market cap has surpassed Nasdaq, the company, putting it among the world’s top 400 or so. To be clear, “Nasdaq” here means the publicly traded company Nasdaq, not the Nasdaq index. Rankings vary from 398th to 418th across data sources, and its market cap is around $60 billion.
A Bitcoin treasury worth more than the exchange operator itself. Strategy has already taken a seat at the table.
1
164

I watched Saylor’s interview on Schwab twice. What he said was: “Digital credit is our product. MSTR is just a byproduct.”
The boss himself said common stock is a byproduct. So the folks holding MSTR—are they shareholders or fuel?
The logic isn’t complicated. For preferred shares like STRC to keep selling, their price has to stay near par and ideally trade at a premium. So the company uses real money to buy back preferred shares and support the price. In the weekly reports from the past couple of weeks, the money spent buying back STRC was several times what was spent buying BTC. I’ve complained about that before. Now the CEO has made it clear himself: first, keep the income-seeking crowd happy; you can bear the dilution and volatility of the common stock yourself.
Even funnier, Crypto Twitter spent the weekend guessing about the orange dot. Some people circulated a post from Saylor saying “Back to work, BTC” and took it to mean buying would resume this week. Meanwhile, a big account said there was no orange-dot chart this week, so it looks like buying will pause again. Same person, two groups reading it their own way, and everyone’s fortune-telling ahead of Thursday’s earnings report.
My take is simple: stop blindly piling into MSTR as if it were just a leveraged version of BTC. It’s now a company selling yield products; BTC is the collateral, and common stock is the layer that takes the hit before preferred shareholders do. If you want BTC, buy BTC. If you want yield, read the preferred-share terms. The common stock in between bears the risk of the business model, not just the price of the coin.
#MSTR #Bitcoin
I watched Saylor’s interview on Schwab twice. What he said was: “Digital credit is our product. MSTR is just a byproduct.”
The boss himself said common stock is a byproduct. So the folks holding MSTR—are they shareholders or fuel?
The logic isn’t complicated. For preferred shares like STRC to keep selling, their price has to stay near par and ideally trade at a premium. So the company uses real money to buy back preferred shares and support the price. In the weekly reports from the past couple of weeks, the money spent buying back STRC was several times what was spent buying BTC. I’ve complained about that before. Now the CEO has made it clear himself: first, keep the income-seeking crowd happy; you can bear the dilution and volatility of the common stock yourself.
Even funnier, Crypto Twitter spent the weekend guessing about the orange dot. Some people circulated a post from Saylor saying “Back to work, BTC” and took it to mean buying would resume this week. Meanwhile, a big account said there was no orange-dot chart this week, so it looks like buying will pause again. Same person, two groups reading it their own way, and everyone’s fortune-telling ahead of Thursday’s earnings report.
My take is simple: stop blindly piling into MSTR as if it were just a leveraged version of BTC. It’s now a company selling yield products; BTC is the collateral, and common stock is the layer that takes the hit before preferred shareholders do. If you want BTC, buy BTC. If you want yield, read the preferred-share terms. The common stock in between bears the risk of the business model, not just the price of the coin.
#MSTR #Bitcoin
The boss himself said common stock is a byproduct. So the folks holding MSTR—are they shareholders or fuel?
The logic isn’t complicated. For preferred shares like STRC to keep selling, their price has to stay near par and ideally trade at a premium. So the company uses real money to buy back preferred shares and support the price. In the weekly reports from the past couple of weeks, the money spent buying back STRC was several times what was spent buying BTC. I’ve complained about that before. Now the CEO has made it clear himself: first, keep the income-seeking crowd happy; you can bear the dilution and volatility of the common stock yourself.
Even funnier, Crypto Twitter spent the weekend guessing about the orange dot. Some people circulated a post from Saylor saying “Back to work, BTC” and took it to mean buying would resume this week. Meanwhile, a big account said there was no orange-dot chart this week, so it looks like buying will pause again. Same person, two groups reading it their own way, and everyone’s fortune-telling ahead of Thursday’s earnings report.
My take is simple: stop blindly piling into MSTR as if it were just a leveraged version of BTC. It’s now a company selling yield products; BTC is the collateral, and common stock is the layer that takes the hit before preferred shareholders do. If you want BTC, buy BTC. If you want yield, read the preferred-share terms. The common stock in between bears the risk of the business model, not just the price of the coin.
#MSTR #Bitcoin
73

·
--

Article
About 73% of MSTR positions are long, but only 68% of accounts areOn Binance, MSTR positions are about 72.9% long and 27.1% short, for a long/short ratio of about 2.69. But on the same exchange, only about 68.0% of accounts are long—positions are nearly five points more bullish than accounts.
Total open interest is about $119 million, including roughly $17.69 million on OKX. Prices: MSTR at about 142.34 on Binance (-1.828%) and 142.32 on OKX (-1.896%); BTC at about 80,157.1 on Binance (-0.572%) and 80,155.3 on OKX (-0.593%).
Price is soft, yet positioning remains 73% net long—the positions are more bullish than the traders, which is worth watching more closely than the decline alone.
#MSTR #持仓量 #多空比 #PerpetualFutures
With positioning at 73% and accounts at 68%, how do you read this nearly five-point gap—have positions already crowded in, or are traders still hesitating?
About 73% of MSTR positions are long, but only 68% of accounts are
On Binance, MSTR positions are about 72.9% long and 27.1% short, for a long/short ratio of about 2.69. But on the same exchange, only about 68.0% of accounts are long—positions are nearly five points more bullish than accounts.
Total open interest is about $119 million, including roughly $17.69 million on OKX. Prices: MSTR at about 142.34 on Binance (-1.828%) and 142.32 on OKX (-1.896%); BTC at about 80,157.1 on Binance (-0.572%) and 80,155.3 on OKX (-0.593%).
Price is soft, yet positioning remains 73% net long—the positions are more bullish than the traders, which is worth watching more closely than the decline alone.
#MSTR #持仓量 #多空比 #PerpetualFutures
With positioning at 73% and accounts at 68%, how do you read this nearly five-point gap—have positions already crowded in, or are traders still hesitating?
Total open interest is about $119 million, including roughly $17.69 million on OKX. Prices: MSTR at about 142.34 on Binance (-1.828%) and 142.32 on OKX (-1.896%); BTC at about 80,157.1 on Binance (-0.572%) and 80,155.3 on OKX (-0.593%).
Price is soft, yet positioning remains 73% net long—the positions are more bullish than the traders, which is worth watching more closely than the decline alone.
#MSTR #持仓量 #多空比 #PerpetualFutures
With positioning at 73% and accounts at 68%, how do you read this nearly five-point gap—have positions already crowded in, or are traders still hesitating?
5
Log in to explore more content
Join global crypto users on Binance Square
⚡️ Get latest and useful information about crypto.
💬 Trusted by the world’s largest crypto exchange.
👍 Discover real insights from verified creators.
Email / Phone number
Trending Topics
1
#BinancePick
2.7M views
145,646 Discussing
2
#EarningsSeason
5.1M views
24,919 Discussing
3
#AnthropicS1ExpectedToday
252 views
24 Discussing
4
#SouthKoreaReportedlyWeighsFourthCryptoTaxDelay
7,054 views
212 Discussing
5
#FranklinTempletonFilesForTwoDividendToBitcoinETFs
12,967 views
321 Discussing
6
#StrategyMSTRSurpassesNasdaqInMarketCap
11,758 views
267 Discussing
7
#CanadaProposesStablecoinRedemptionWithin3BusinessDays
475 views
29 Discussing
8
#ElectrumWalletBugLetRogueServersStealFunds
16,190 views
380 Discussing
9
#ArgentineCourtDismissesLIBRACaseAgainstMilei
26,903 views
453 Discussing
10
#SKHynixReportedlyPlansSpecialDividendFromKioxiaStakeSale
3,994 views
52 Discussing