
#kadena
kadena
280,518 views
404 Discussing
Hot
Latest

A +17% bounce means nothing when the weekly chart is still carving lower lows. That 24h pump is a blip inside a 48-hour bleed that printed 11 red candles out of 12, including a 35% single-session collapse.
Price sits near 0.0060. RSI on the 4H is buried at 23, daily below 17 — that’s not “oversold and ready to rip,” that’s freefall. Oversold can stay oversold for weeks. The 4H EMAs tell the story: short-term average is barely half the longer one. Trend is down. Hard.
The 1D chart shows the real damage. That bearish gap between roughly 0.0158 and 0.0217 is unfilled — and price is nowhere near it. For $KDA to even think about recovery, it needs to reclaim that entire zone. That’s a 160% climb from here. Not a bounce. A miracle.
As long as price stays under the 0.0063 area on a closing basis, the path of least resistance points lower toward 0.0055, then the macro objective near 0.0038. Lose those and 0.0038 becomes the last line before true capitulation. Reclaim 0.0063 with volume and the read changes — but nothing about this structure suggests that’s likely.
This is a falling knife with a fresh coat of paint. The bounce is real, but weak — risk remains firmly to the downside.
Tap $KDA and pull up the daily yourself. That unfilled gap is the only thing that matters until price proves otherwise.
Follow me — I’ll keep this level on watch and update if 0.0063 flips or fails. What’s the one level you’re watching on $KDA right now? 👇
Not financial advice. DYOR.
#KDA #Kadena #Crypto #BinanceSquare
A +17% bounce means nothing when the weekly chart is still carving lower lows. That 24h pump is a blip inside a 48-hour bleed that printed 11 red candles out of 12, including a 35% single-session collapse.
Price sits near 0.0060. RSI on the 4H is buried at 23, daily below 17 — that’s not “oversold and ready to rip,” that’s freefall. Oversold can stay oversold for weeks. The 4H EMAs tell the story: short-term average is barely half the longer one. Trend is down. Hard.
The 1D chart shows the real damage. That bearish gap between roughly 0.0158 and 0.0217 is unfilled — and price is nowhere near it. For $KDA to even think about recovery, it needs to reclaim that entire zone. That’s a 160% climb from here. Not a bounce. A miracle.
As long as price stays under the 0.0063 area on a closing basis, the path of least resistance points lower toward 0.0055, then the macro objective near 0.0038. Lose those and 0.0038 becomes the last line before true capitulation. Reclaim 0.0063 with volume and the read changes — but nothing about this structure suggests that’s likely.
This is a falling knife with a fresh coat of paint. The bounce is real, but weak — risk remains firmly to the downside.
Tap $KDA and pull up the daily yourself. That unfilled gap is the only thing that matters until price proves otherwise.
Follow me — I’ll keep this level on watch and update if 0.0063 flips or fails. What’s the one level you’re watching on $KDA right now? 👇
Not financial advice. DYOR.
#KDA #Kadena #Crypto #BinanceSquare
Price sits near 0.0060. RSI on the 4H is buried at 23, daily below 17 — that’s not “oversold and ready to rip,” that’s freefall. Oversold can stay oversold for weeks. The 4H EMAs tell the story: short-term average is barely half the longer one. Trend is down. Hard.
The 1D chart shows the real damage. That bearish gap between roughly 0.0158 and 0.0217 is unfilled — and price is nowhere near it. For $KDA to even think about recovery, it needs to reclaim that entire zone. That’s a 160% climb from here. Not a bounce. A miracle.
As long as price stays under the 0.0063 area on a closing basis, the path of least resistance points lower toward 0.0055, then the macro objective near 0.0038. Lose those and 0.0038 becomes the last line before true capitulation. Reclaim 0.0063 with volume and the read changes — but nothing about this structure suggests that’s likely.
This is a falling knife with a fresh coat of paint. The bounce is real, but weak — risk remains firmly to the downside.
Tap $KDA and pull up the daily yourself. That unfilled gap is the only thing that matters until price proves otherwise.
Follow me — I’ll keep this level on watch and update if 0.0063 flips or fails. What’s the one level you’re watching on $KDA right now? 👇
Not financial advice. DYOR.
#KDA #Kadena #Crypto #BinanceSquare
7
Everyone sees "+17.65% Top Gainer" and thinks $KDA is reviving.
Flip it: this is a dead-cat bounce inside a 35% single-candle collapse.
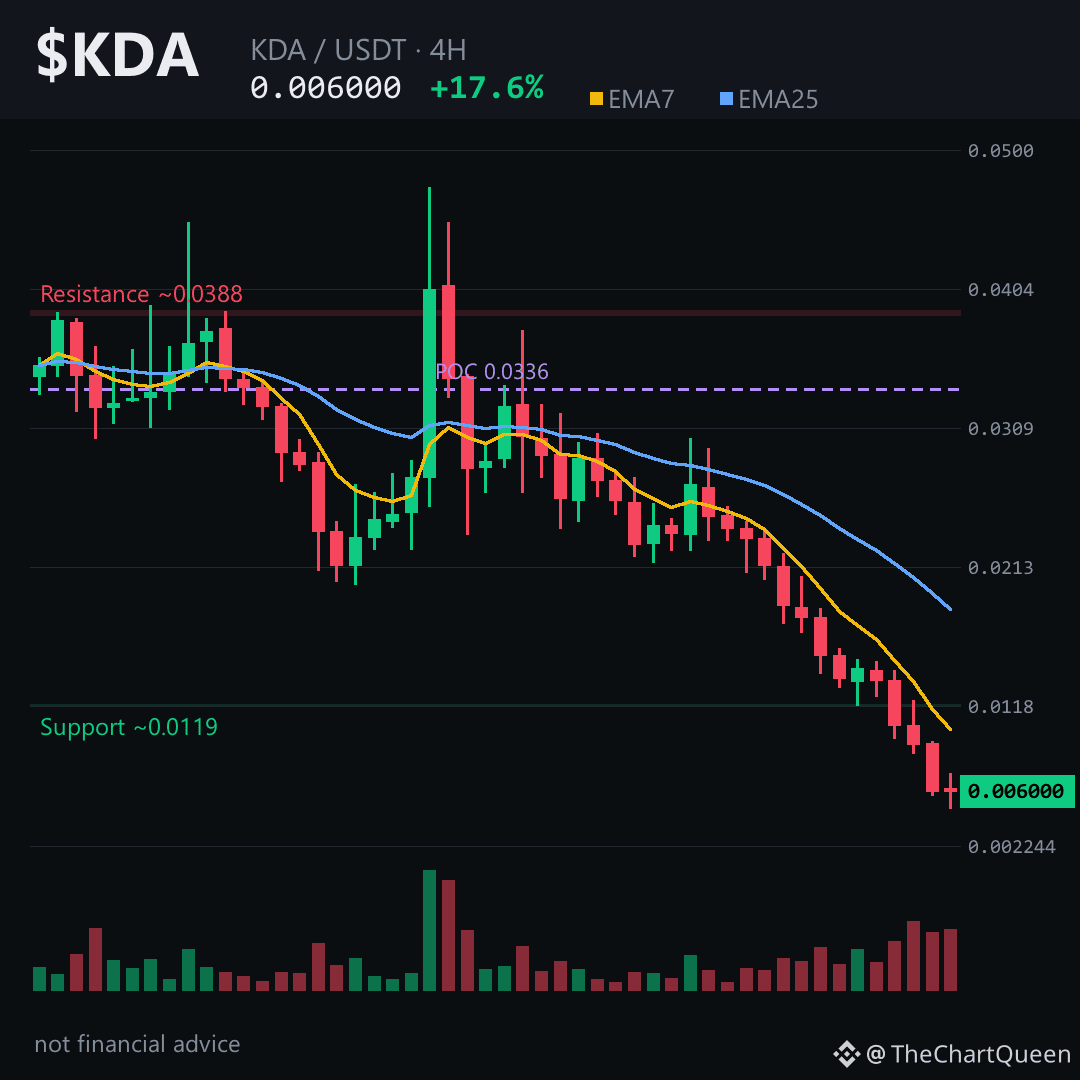
The 4H chart shows 11 red candles out of 12. Price printed a brutal -35.48% candle, then bounced from 0.0048 to 0.0060. That's air, not strength.
RSI sits at 23 — deeply oversold, but oversold in a downtrend is a condition, not a signal.
The real tell: an unfilled bearish gap lingers between 0.0094 and 0.0096. Any bounce toward it likely gets faded.
Here's the level that matters 👇
If $KDA loses ~0.0055 on a 4H close, the next objective sits near 0.0038. Invalidation: a decisive 4H close back above ~0.0063.
Tap $KDA to pull up the chart and read these levels yourself.
My read: the bounce is real but fragile. Path of least resistance remains lower until price holds above 0.0063 with volume.
Follow me for the follow-up if this level breaks or fails — I'll map the next zone.
What level are you watching on KDA right now? 👇
⚠️ Not financial advice. DYOR.
#KDA #Kadena #Crypto #BinanceSquare
Everyone sees "+17.65% Top Gainer" and thinks $KDA is reviving.
Flip it: this is a dead-cat bounce inside a 35% single-candle collapse.
The 4H chart shows 11 red candles out of 12. Price printed a brutal -35.48% candle, then bounced from 0.0048 to 0.0060. That's air, not strength.
RSI sits at 23 — deeply oversold, but oversold in a downtrend is a condition, not a signal.
The real tell: an unfilled bearish gap lingers between 0.0094 and 0.0096. Any bounce toward it likely gets faded.
Here's the level that matters 👇
If $KDA loses ~0.0055 on a 4H close, the next objective sits near 0.0038. Invalidation: a decisive 4H close back above ~0.0063.
Tap $KDA to pull up the chart and read these levels yourself.
My read: the bounce is real but fragile. Path of least resistance remains lower until price holds above 0.0063 with volume.
Follow me for the follow-up if this level breaks or fails — I'll map the next zone.
What level are you watching on KDA right now? 👇
⚠️ Not financial advice. DYOR.
#KDA #Kadena #Crypto #BinanceSquare
Flip it: this is a dead-cat bounce inside a 35% single-candle collapse.
The 4H chart shows 11 red candles out of 12. Price printed a brutal -35.48% candle, then bounced from 0.0048 to 0.0060. That's air, not strength.
RSI sits at 23 — deeply oversold, but oversold in a downtrend is a condition, not a signal.
The real tell: an unfilled bearish gap lingers between 0.0094 and 0.0096. Any bounce toward it likely gets faded.
Here's the level that matters 👇
If $KDA loses ~0.0055 on a 4H close, the next objective sits near 0.0038. Invalidation: a decisive 4H close back above ~0.0063.
Tap $KDA to pull up the chart and read these levels yourself.
My read: the bounce is real but fragile. Path of least resistance remains lower until price holds above 0.0063 with volume.
Follow me for the follow-up if this level breaks or fails — I'll map the next zone.
What level are you watching on KDA right now? 👇
⚠️ Not financial advice. DYOR.
#KDA #Kadena #Crypto #BinanceSquare
5
$0.024 to $0.006 in 48 hours — and it’s still flashing “Top Gainer” today. That’s the trap.
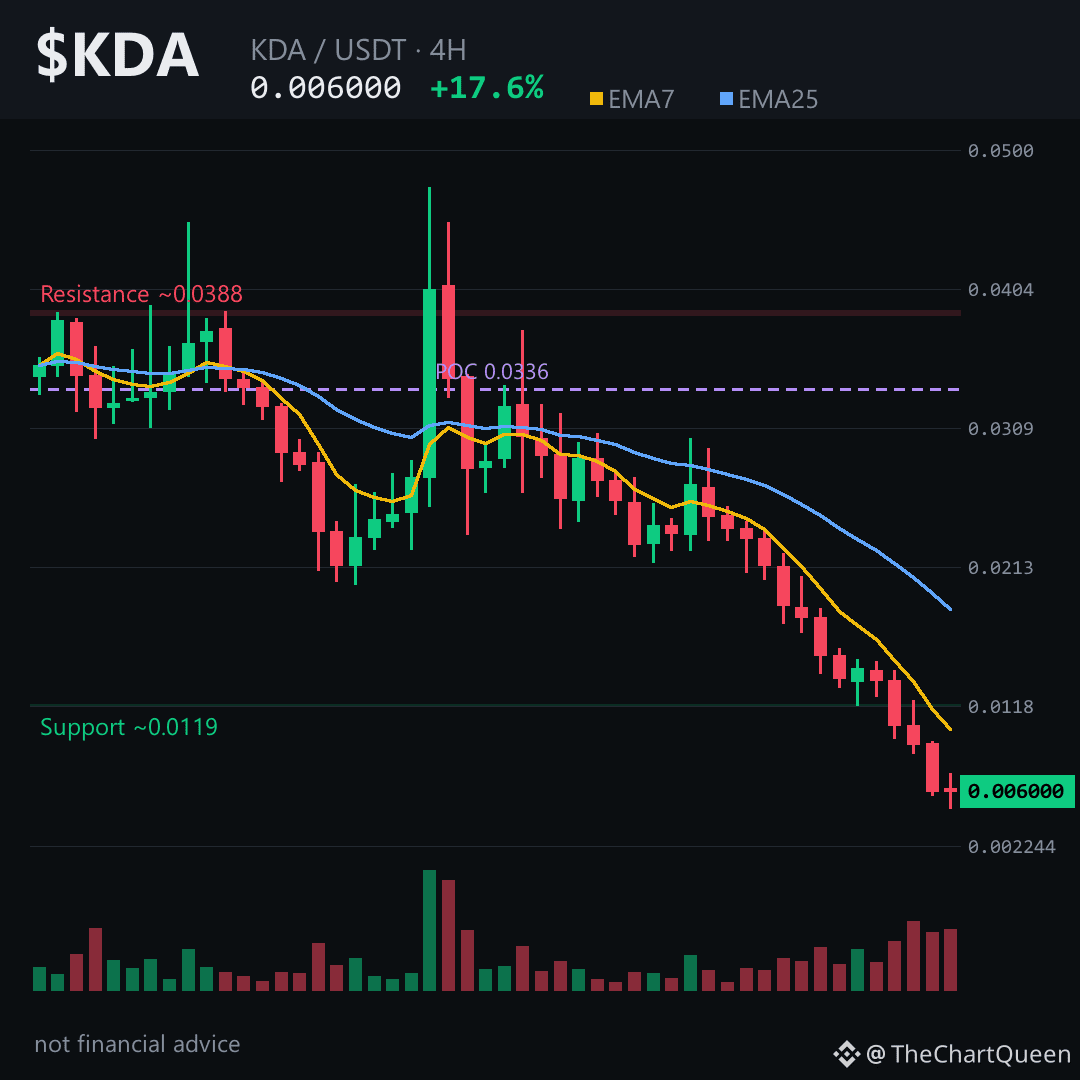
Price is up 17%, but the structure is a falling knife in a bear flag. Volume profile’s point of control sits far above — most recent volume is trapped higher, not supporting this bounce. RSI on the 4H near 23 is often a continuation signal in a downtrend, not a reversal.
The 4H setup is the cleanest read. Price is coiling just above 0.006, and the invalidation sits only a hair higher around 0.0063. If that zone holds as resistance, the path points toward the 0.0055 area — the next liquidity pocket. Lose that, and the unfilled gap lower near 0.0094–0.0096 becomes the magnet. The bounce is real, but it’s fighting a weekly downtrend with no fuel for a squeeze — open interest is flat.
My read: $KDA is in a relief bounce inside a larger breakdown, not a reversal. Tap $KDA to pull up the chart and watch how price behaves around the 0.0063 zone — that’s the line that separates a dead-cat bounce from something more.
Which level are you watching closer — 0.0063 resistance or the 0.0055 support? Drop your read on $KDA 👇
Follow for the next read on this chart.
⚠️ Not financial advice. DYOR.
#KDA #Kadena #Crypto #BinanceSquare
$0.024 to $0.006 in 48 hours — and it’s still flashing “Top Gainer” today. That’s the trap.
Price is up 17%, but the structure is a falling knife in a bear flag. Volume profile’s point of control sits far above — most recent volume is trapped higher, not supporting this bounce. RSI on the 4H near 23 is often a continuation signal in a downtrend, not a reversal.
The 4H setup is the cleanest read. Price is coiling just above 0.006, and the invalidation sits only a hair higher around 0.0063. If that zone holds as resistance, the path points toward the 0.0055 area — the next liquidity pocket. Lose that, and the unfilled gap lower near 0.0094–0.0096 becomes the magnet. The bounce is real, but it’s fighting a weekly downtrend with no fuel for a squeeze — open interest is flat.
My read: $KDA is in a relief bounce inside a larger breakdown, not a reversal. Tap $KDA to pull up the chart and watch how price behaves around the 0.0063 zone — that’s the line that separates a dead-cat bounce from something more.
Which level are you watching closer — 0.0063 resistance or the 0.0055 support? Drop your read on $KDA 👇
Follow for the next read on this chart.
⚠️ Not financial advice. DYOR.
#KDA #Kadena #Crypto #BinanceSquare
Price is up 17%, but the structure is a falling knife in a bear flag. Volume profile’s point of control sits far above — most recent volume is trapped higher, not supporting this bounce. RSI on the 4H near 23 is often a continuation signal in a downtrend, not a reversal.
The 4H setup is the cleanest read. Price is coiling just above 0.006, and the invalidation sits only a hair higher around 0.0063. If that zone holds as resistance, the path points toward the 0.0055 area — the next liquidity pocket. Lose that, and the unfilled gap lower near 0.0094–0.0096 becomes the magnet. The bounce is real, but it’s fighting a weekly downtrend with no fuel for a squeeze — open interest is flat.
My read: $KDA is in a relief bounce inside a larger breakdown, not a reversal. Tap $KDA to pull up the chart and watch how price behaves around the 0.0063 zone — that’s the line that separates a dead-cat bounce from something more.
Which level are you watching closer — 0.0063 resistance or the 0.0055 support? Drop your read on $KDA 👇
Follow for the next read on this chart.
⚠️ Not financial advice. DYOR.
#KDA #Kadena #Crypto #BinanceSquare
6
Everyone sees "+17.65%" and thinks bottom.
The chart says the opposite — that green number is just a dead cat stretching before the next leg down.
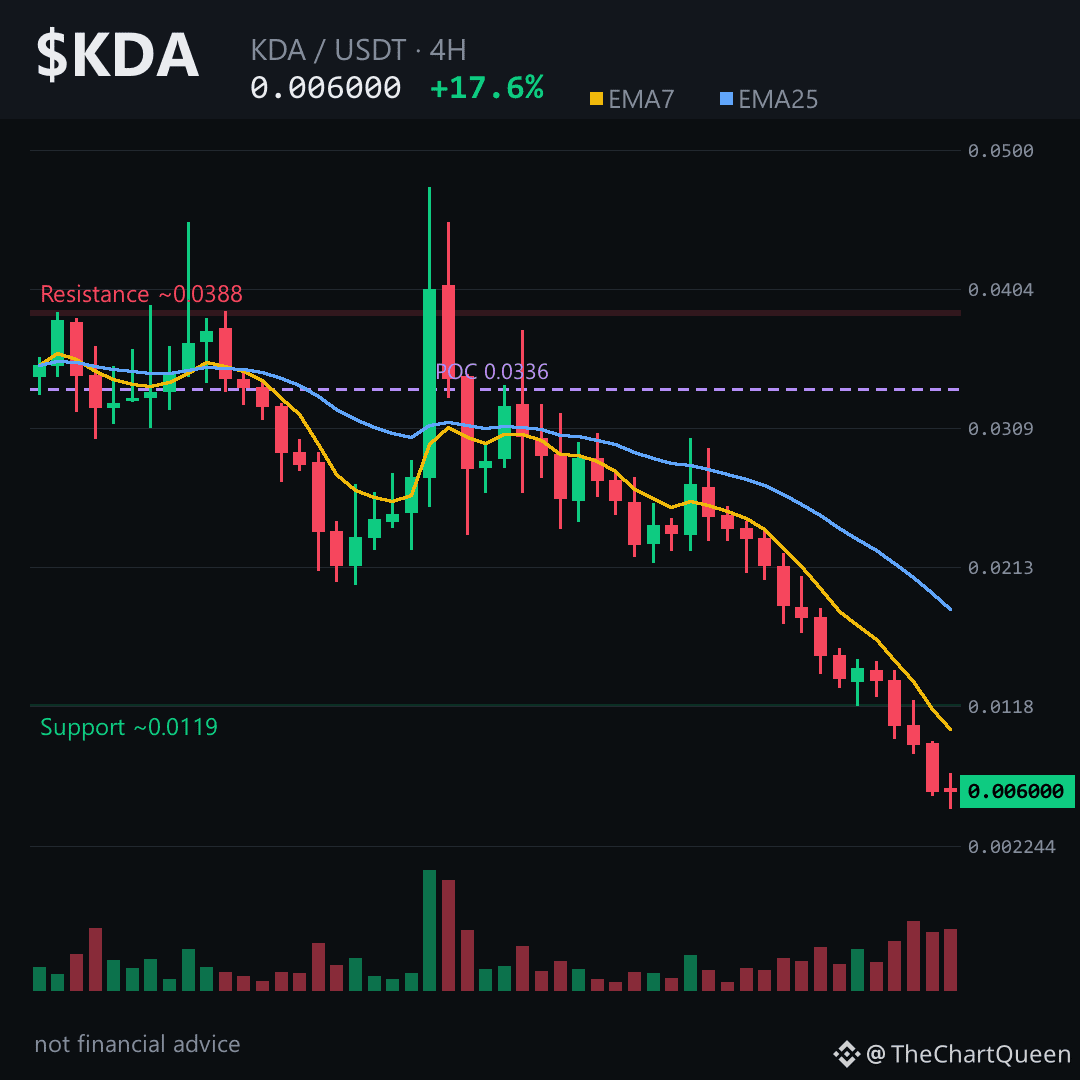
Price tagged 0.0048, bounced to 0.006 — but this is a bear flag on life support. RSI near 23 on a coin in freefall isn't "oversold bounce," it's momentum still bleeding out. 11 red candles out of the last 12, including a -35% monster just hours ago.
As long as $KDA stays below 0.0063, the path of least resistance is lower — toward 0.0055, then a sweep of that 0.0048 low.
Lose 0.0048 on a 4H close and the next real support doesn't arrive until 0.0038.
The trap? That empty futures book — zero funding, zero open interest. The bounce you're seeing is thin air, not conviction.
My read: the bounce is a gift to sellers, not a reversal.
Tap $KDA to pull up the chart and see how clean that rejection from 0.0072 looks.
I'll keep an eye on whether 0.0048 holds or folds — follow so my next breakdown lands in your feed.
What level are you watching on $KDA right now 👇
⚠️ Not financial advice. DYOR.
#KDA #Kadena #Crypto #BinanceSquare
Everyone sees "+17.65%" and thinks bottom.
The chart says the opposite — that green number is just a dead cat stretching before the next leg down.
Price tagged 0.0048, bounced to 0.006 — but this is a bear flag on life support. RSI near 23 on a coin in freefall isn't "oversold bounce," it's momentum still bleeding out. 11 red candles out of the last 12, including a -35% monster just hours ago.
As long as $KDA stays below 0.0063, the path of least resistance is lower — toward 0.0055, then a sweep of that 0.0048 low.
Lose 0.0048 on a 4H close and the next real support doesn't arrive until 0.0038.
The trap? That empty futures book — zero funding, zero open interest. The bounce you're seeing is thin air, not conviction.
My read: the bounce is a gift to sellers, not a reversal.
Tap $KDA to pull up the chart and see how clean that rejection from 0.0072 looks.
I'll keep an eye on whether 0.0048 holds or folds — follow so my next breakdown lands in your feed.
What level are you watching on $KDA right now 👇
⚠️ Not financial advice. DYOR.
#KDA #Kadena #Crypto #BinanceSquare
The chart says the opposite — that green number is just a dead cat stretching before the next leg down.
Price tagged 0.0048, bounced to 0.006 — but this is a bear flag on life support. RSI near 23 on a coin in freefall isn't "oversold bounce," it's momentum still bleeding out. 11 red candles out of the last 12, including a -35% monster just hours ago.
As long as $KDA stays below 0.0063, the path of least resistance is lower — toward 0.0055, then a sweep of that 0.0048 low.
Lose 0.0048 on a 4H close and the next real support doesn't arrive until 0.0038.
The trap? That empty futures book — zero funding, zero open interest. The bounce you're seeing is thin air, not conviction.
My read: the bounce is a gift to sellers, not a reversal.
Tap $KDA to pull up the chart and see how clean that rejection from 0.0072 looks.
I'll keep an eye on whether 0.0048 holds or folds — follow so my next breakdown lands in your feed.
What level are you watching on $KDA right now 👇
⚠️ Not financial advice. DYOR.
#KDA #Kadena #Crypto #BinanceSquare
1
Why did a “Top Gainer” just print 11 red candles out of 12?
This +17% bounce is sitting inside a much bigger downtrend.
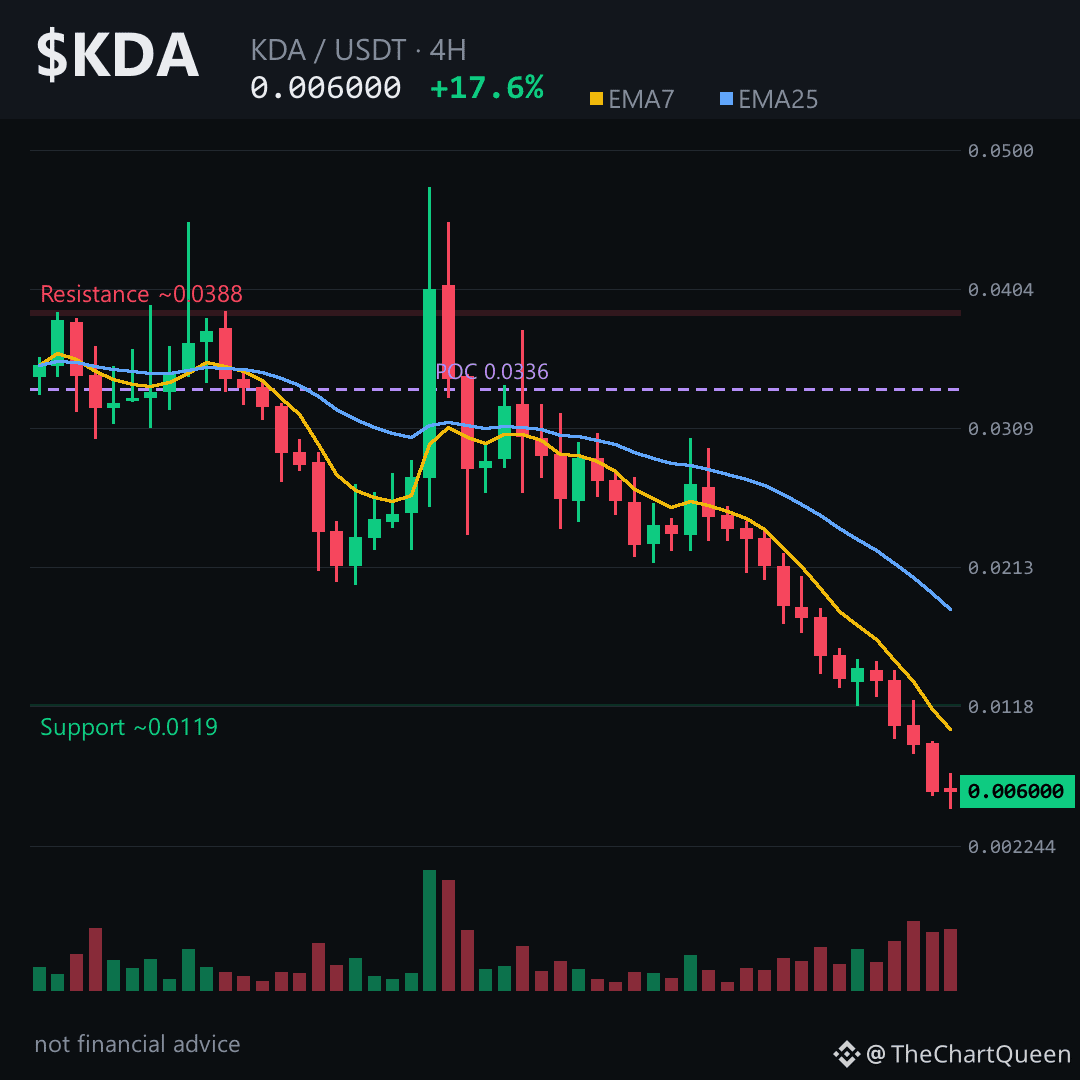
Price on the 4H sits near 0.0060, while the EMA7 is around 0.0102 — still far above. The bounce hasn’t even touched the first major resistance zone. RSI is deeply oversold near 23, but oversold can stay oversold longer than feels logical.
There’s also an unfilled bearish gap at 0.0094–0.0096. Gaps like that often act like a magnet, but from below, they can also act as a ceiling.
The level that matters most on the 4H: the 0.0063 area. If $KDA can’t reclaim and hold that zone, the path of least resistance stays lower — toward 0.0055. A 4H close above 0.0063 would be the first real sign this bounce has more fuel.
My read: weak relief bounce inside a heavy downtrend, not a reversal yet. The real risk is mistaking a short squeeze for a trend change.
Tap $KDA to pull up the chart and check these zones yourself.
Follow me — I’ll update this read if the 0.0063 area gets tested and tells us something new.
Which zone are you watching more closely on $KDA — the 0.0063 ceiling or the 0.0055 floor? 👇
⚠️ Not financial advice. DYOR.
#KDA #Kadena #Crypto #BinanceSquare
Why did a “Top Gainer” just print 11 red candles out of 12?
This +17% bounce is sitting inside a much bigger downtrend.
Price on the 4H sits near 0.0060, while the EMA7 is around 0.0102 — still far above. The bounce hasn’t even touched the first major resistance zone. RSI is deeply oversold near 23, but oversold can stay oversold longer than feels logical.
There’s also an unfilled bearish gap at 0.0094–0.0096. Gaps like that often act like a magnet, but from below, they can also act as a ceiling.
The level that matters most on the 4H: the 0.0063 area. If $KDA can’t reclaim and hold that zone, the path of least resistance stays lower — toward 0.0055. A 4H close above 0.0063 would be the first real sign this bounce has more fuel.
My read: weak relief bounce inside a heavy downtrend, not a reversal yet. The real risk is mistaking a short squeeze for a trend change.
Tap $KDA to pull up the chart and check these zones yourself.
Follow me — I’ll update this read if the 0.0063 area gets tested and tells us something new.
Which zone are you watching more closely on $KDA — the 0.0063 ceiling or the 0.0055 floor? 👇
⚠️ Not financial advice. DYOR.
#KDA #Kadena #Crypto #BinanceSquare
This +17% bounce is sitting inside a much bigger downtrend.
Price on the 4H sits near 0.0060, while the EMA7 is around 0.0102 — still far above. The bounce hasn’t even touched the first major resistance zone. RSI is deeply oversold near 23, but oversold can stay oversold longer than feels logical.
There’s also an unfilled bearish gap at 0.0094–0.0096. Gaps like that often act like a magnet, but from below, they can also act as a ceiling.
The level that matters most on the 4H: the 0.0063 area. If $KDA can’t reclaim and hold that zone, the path of least resistance stays lower — toward 0.0055. A 4H close above 0.0063 would be the first real sign this bounce has more fuel.
My read: weak relief bounce inside a heavy downtrend, not a reversal yet. The real risk is mistaking a short squeeze for a trend change.
Tap $KDA to pull up the chart and check these zones yourself.
Follow me — I’ll update this read if the 0.0063 area gets tested and tells us something new.
Which zone are you watching more closely on $KDA — the 0.0063 ceiling or the 0.0055 floor? 👇
⚠️ Not financial advice. DYOR.
#KDA #Kadena #Crypto #BinanceSquare
2
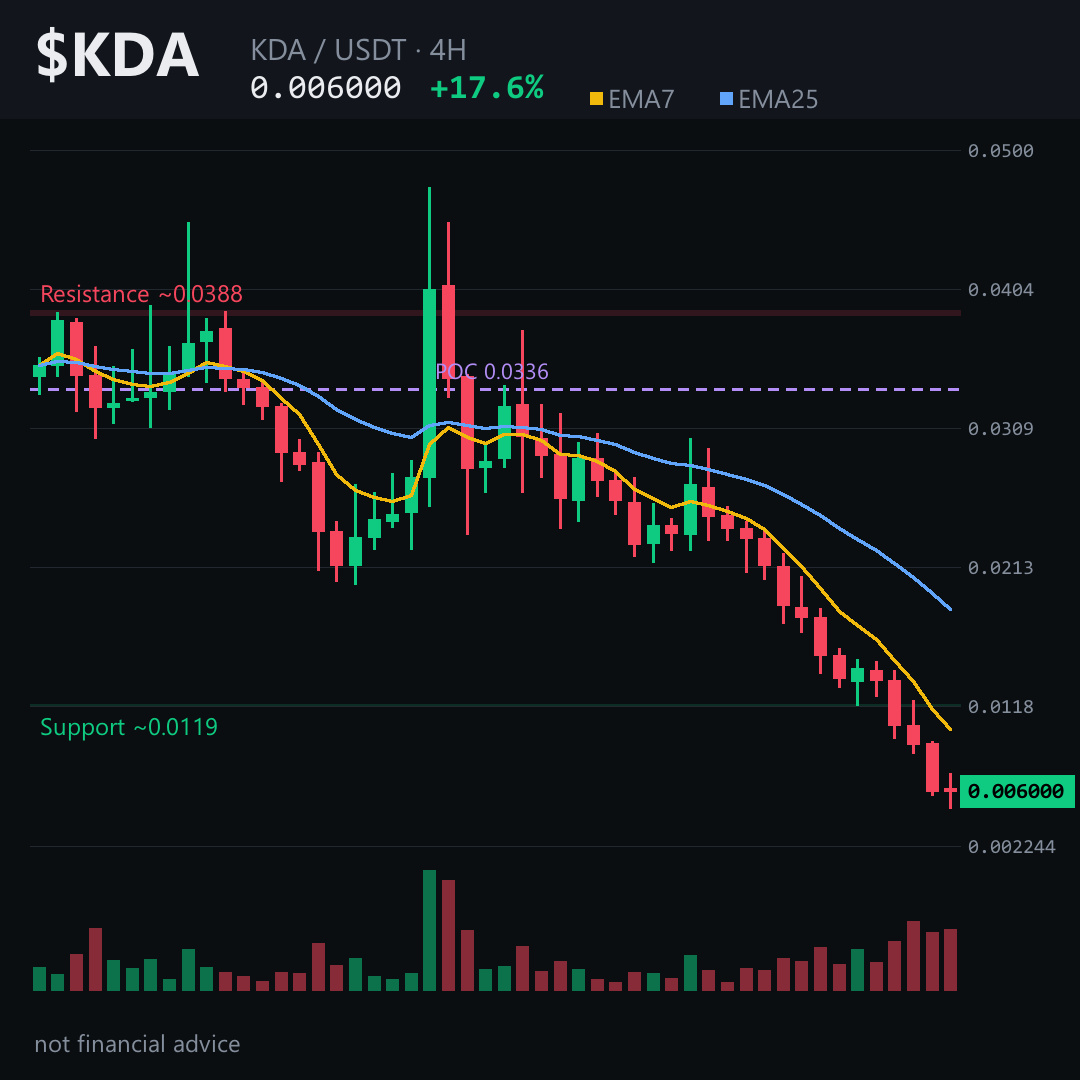
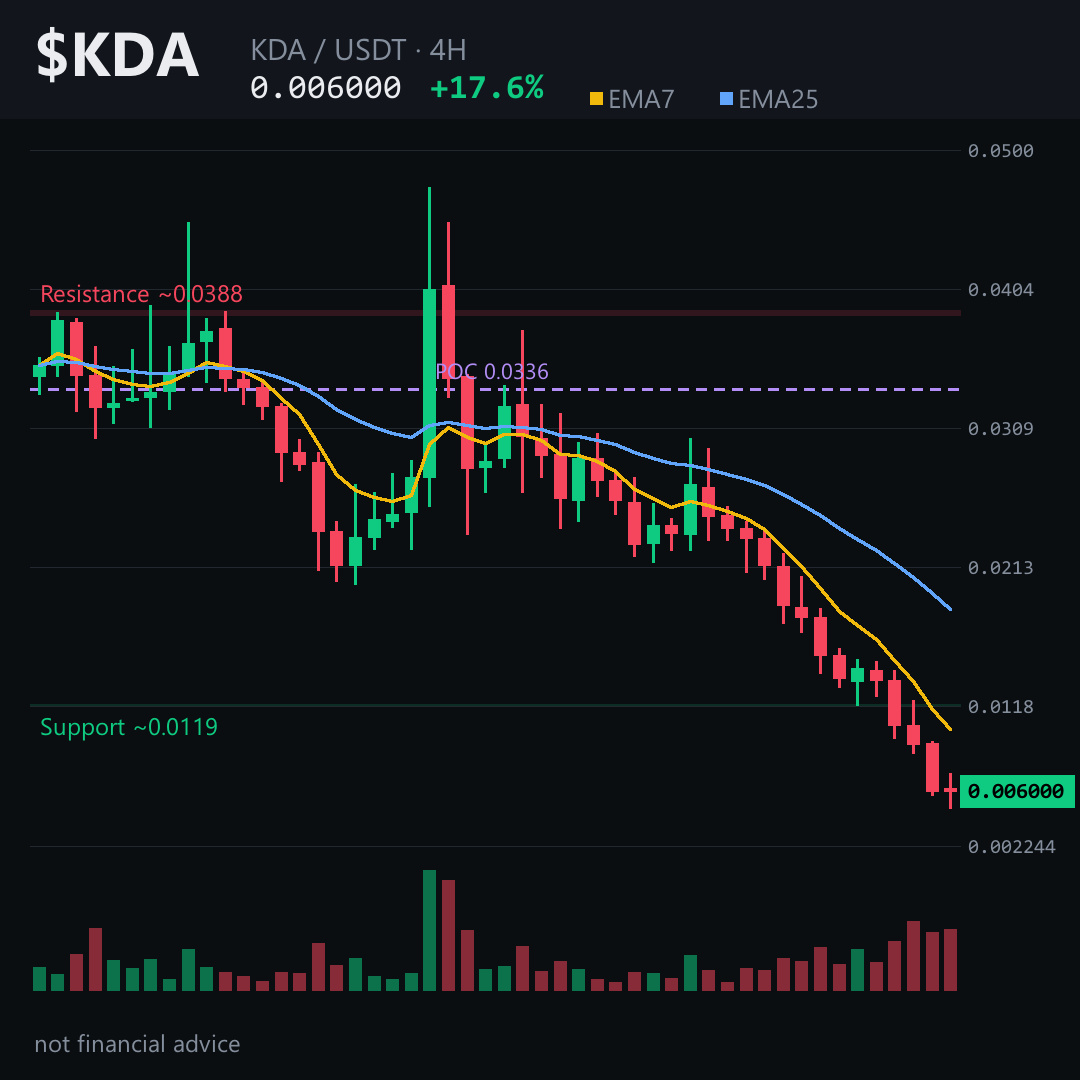
Why is a “Top Gainer” trading at the same price it had 12 hours ago after a +17% pump?
That 24h range is a 50% spread, and the last 48 hours show 11 red candles against 1 green. The bounce is real, but it’s happening inside a much larger downtrend.
4H structure: short-term MA still below the longer one — classic bearish. RSI at 23 means deeply oversold, which is why you’re seeing this bounce. But oversold can stay oversold in a downtrend.
Price is hovering near 0.006. If it loses that zone, next meaningful support is around 0.0055 — that’s the next decision point. For the bearish read to be wrong, price needs to reclaim and hold above roughly 0.0063 on a 4H close. That’s the line that flips the script.
There’s also an unfilled bearish gap lower around 0.0096 to 0.0094. Gaps often act as magnets later, but not always immediately.
My read: the bounce is real but fragile. The risk isn’t a sudden crash — it’s that any strength gets sold back into this downtrend until the structure genuinely shifts.
Tap $KDA to pull up the chart and see these zones yourself. I’ll keep tracking whether that 0.006 area holds or folds — follow so you don’t miss the update.
Which zone are you watching more closely — 0.0055 or 0.0063 on $KDA? 👇
⚠️ Not financial advice. DYOR.
#KDA #Kadena #Crypto #BinanceSquare
Why is a “Top Gainer” trading at the same price it had 12 hours ago after a +17% pump?
That 24h range is a 50% spread, and the last 48 hours show 11 red candles against 1 green. The bounce is real, but it’s happening inside a much larger downtrend.
4H structure: short-term MA still below the longer one — classic bearish. RSI at 23 means deeply oversold, which is why you’re seeing this bounce. But oversold can stay oversold in a downtrend.
Price is hovering near 0.006. If it loses that zone, next meaningful support is around 0.0055 — that’s the next decision point. For the bearish read to be wrong, price needs to reclaim and hold above roughly 0.0063 on a 4H close. That’s the line that flips the script.
There’s also an unfilled bearish gap lower around 0.0096 to 0.0094. Gaps often act as magnets later, but not always immediately.
My read: the bounce is real but fragile. The risk isn’t a sudden crash — it’s that any strength gets sold back into this downtrend until the structure genuinely shifts.
Tap $KDA to pull up the chart and see these zones yourself. I’ll keep tracking whether that 0.006 area holds or folds — follow so you don’t miss the update.
Which zone are you watching more closely — 0.0055 or 0.0063 on $KDA? 👇
⚠️ Not financial advice. DYOR.
#KDA #Kadena #Crypto #BinanceSquare
That 24h range is a 50% spread, and the last 48 hours show 11 red candles against 1 green. The bounce is real, but it’s happening inside a much larger downtrend.
4H structure: short-term MA still below the longer one — classic bearish. RSI at 23 means deeply oversold, which is why you’re seeing this bounce. But oversold can stay oversold in a downtrend.
Price is hovering near 0.006. If it loses that zone, next meaningful support is around 0.0055 — that’s the next decision point. For the bearish read to be wrong, price needs to reclaim and hold above roughly 0.0063 on a 4H close. That’s the line that flips the script.
There’s also an unfilled bearish gap lower around 0.0096 to 0.0094. Gaps often act as magnets later, but not always immediately.
My read: the bounce is real but fragile. The risk isn’t a sudden crash — it’s that any strength gets sold back into this downtrend until the structure genuinely shifts.
Tap $KDA to pull up the chart and see these zones yourself. I’ll keep tracking whether that 0.006 area holds or folds — follow so you don’t miss the update.
Which zone are you watching more closely — 0.0055 or 0.0063 on $KDA? 👇
⚠️ Not financial advice. DYOR.
#KDA #Kadena #Crypto #BinanceSquare
9
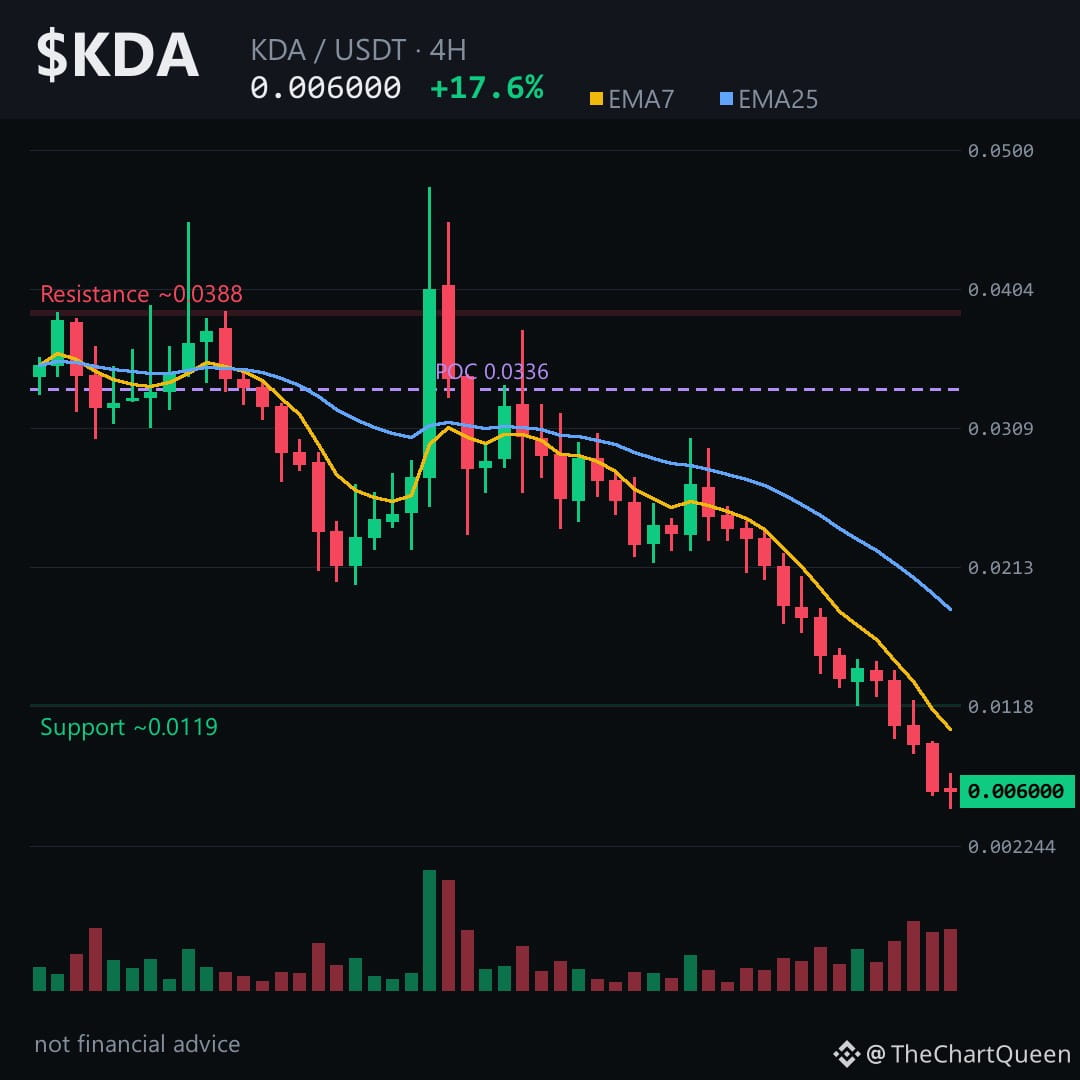
Everyone sees +17% and thinks $KDA is bouncing. They’re reading the headline, not the chart.
That green 4H candle is a corpse bounce inside an 11-of-12 red candle cascade. Price didn’t reclaim structure — it just paused at the bottom of a waterfall. And the daily picture is worse: price sits miles below both key averages, with momentum pinned near the floor. This is not accumulation. This is a falling knife taking a breath.
The 4H read is the cleanest: the pivot zone near 0.0060 is the only thing holding. Lose that on a 4H close and the next obvious destination is the unfilled gap below — the 0.0055 area, roughly where the last 35% collapse ran out of sellers. Invalidation sits just above, around 0.0063. If price can’t even reclaim that tiny ledge, the bounce is already over.
Tap $KDA to pull up the chart and see how thin this bounce really is.
My read: the +17% is noise inside a much larger downtrend. The risk isn’t missing the bottom — it’s mistaking a dead-cat twitch for a reversal.
If this zone fails, I’ll map the next support where liquidity actually sits. Follow so that read lands on your feed.
Which level are you trusting more on $KDA — the bounce zone or the gap below? 👇
⚠️ Not financial advice. DYOR.
#KDA #Kadena #Crypto #BinanceSquare
Everyone sees +17% and thinks $KDA is bouncing. They’re reading the headline, not the chart.
That green 4H candle is a corpse bounce inside an 11-of-12 red candle cascade. Price didn’t reclaim structure — it just paused at the bottom of a waterfall. And the daily picture is worse: price sits miles below both key averages, with momentum pinned near the floor. This is not accumulation. This is a falling knife taking a breath.
The 4H read is the cleanest: the pivot zone near 0.0060 is the only thing holding. Lose that on a 4H close and the next obvious destination is the unfilled gap below — the 0.0055 area, roughly where the last 35% collapse ran out of sellers. Invalidation sits just above, around 0.0063. If price can’t even reclaim that tiny ledge, the bounce is already over.
Tap $KDA to pull up the chart and see how thin this bounce really is.
My read: the +17% is noise inside a much larger downtrend. The risk isn’t missing the bottom — it’s mistaking a dead-cat twitch for a reversal.
If this zone fails, I’ll map the next support where liquidity actually sits. Follow so that read lands on your feed.
Which level are you trusting more on $KDA — the bounce zone or the gap below? 👇
⚠️ Not financial advice. DYOR.
#KDA #Kadena #Crypto #BinanceSquare
That green 4H candle is a corpse bounce inside an 11-of-12 red candle cascade. Price didn’t reclaim structure — it just paused at the bottom of a waterfall. And the daily picture is worse: price sits miles below both key averages, with momentum pinned near the floor. This is not accumulation. This is a falling knife taking a breath.
The 4H read is the cleanest: the pivot zone near 0.0060 is the only thing holding. Lose that on a 4H close and the next obvious destination is the unfilled gap below — the 0.0055 area, roughly where the last 35% collapse ran out of sellers. Invalidation sits just above, around 0.0063. If price can’t even reclaim that tiny ledge, the bounce is already over.
Tap $KDA to pull up the chart and see how thin this bounce really is.
My read: the +17% is noise inside a much larger downtrend. The risk isn’t missing the bottom — it’s mistaking a dead-cat twitch for a reversal.
If this zone fails, I’ll map the next support where liquidity actually sits. Follow so that read lands on your feed.
Which level are you trusting more on $KDA — the bounce zone or the gap below? 👇
⚠️ Not financial advice. DYOR.
#KDA #Kadena #Crypto #BinanceSquare
22
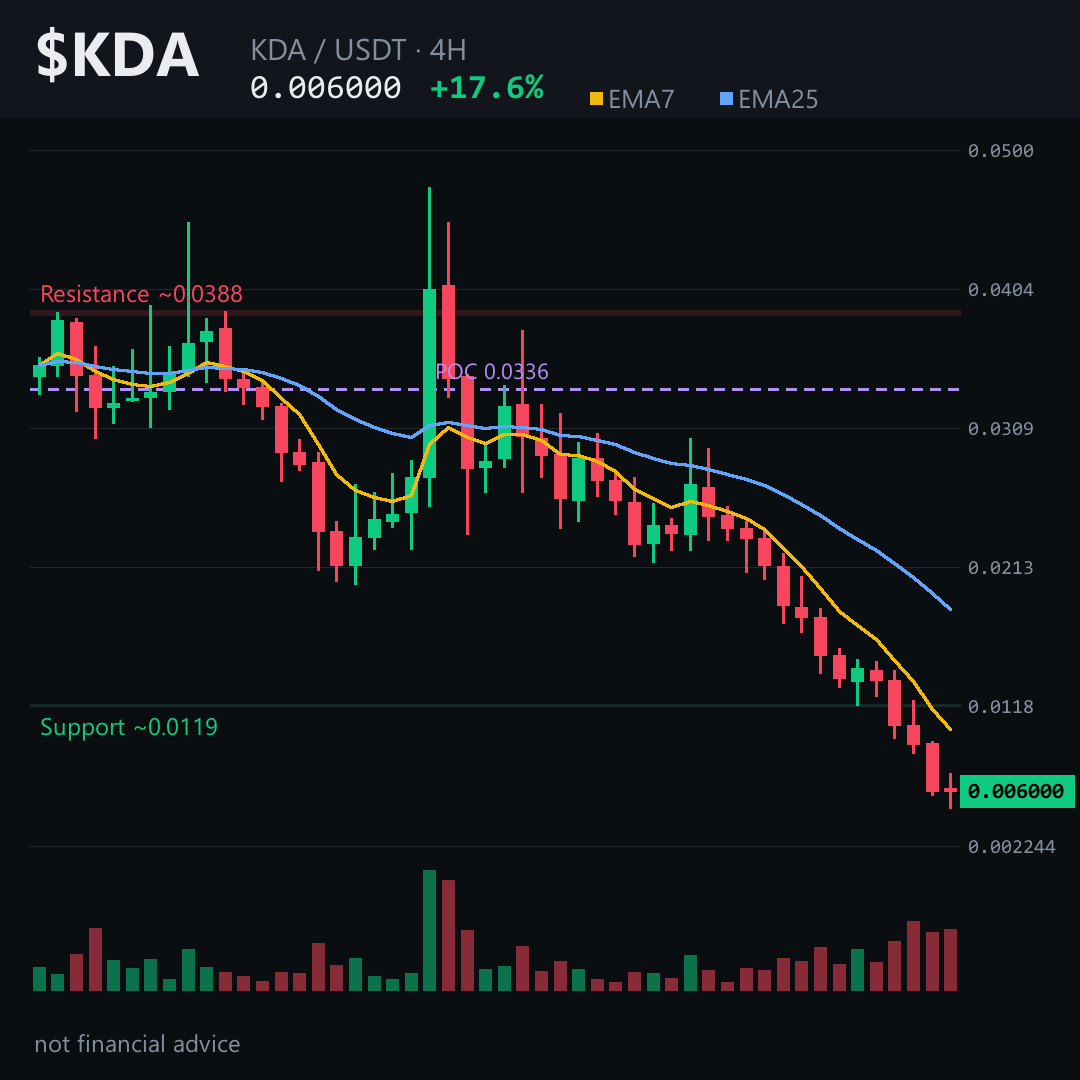
The 0.00633 barrier is the line in the sand for $KDA — once it cracks, the downside story flips. 👀
Price is hugging the 4‑hour pivot, EMA7 is well under EMA25, and RSI sits at 23 — deeply oversold but still bearish. A fresh unmitigated bearish gap sits just above the current price, suggesting the pressure isn’t done yet.
On the 4H chart the key zones are:
‑ Pivot around 0.0060, the current trading area.
‑ Invalidating zone just above ≈ 0.00633; if $KDA loses that level the bearish premise collapses.
‑ Potential downside target near ≈ 0.0055 if the move stays on script.
My read: the chart is warning that a slip below the 0.00633 area could open a path toward the 0.0055 zone.
If you want to see these levels live, tap $KDA and pull up the chart.
Follow me for the next breakdown when KDA tests the next barrier – I’ll map the new shape as it unfolds. What level are you watching most closely on KDA? 👇
⚠️ Not financial advice. DYOR.
#KDA #Kadena #Crypto #BinanceSquare
The 0.00633 barrier is the line in the sand for $KDA — once it cracks, the downside story flips. 👀
Price is hugging the 4‑hour pivot, EMA7 is well under EMA25, and RSI sits at 23 — deeply oversold but still bearish. A fresh unmitigated bearish gap sits just above the current price, suggesting the pressure isn’t done yet.
On the 4H chart the key zones are:
‑ Pivot around 0.0060, the current trading area.
‑ Invalidating zone just above ≈ 0.00633; if $KDA loses that level the bearish premise collapses.
‑ Potential downside target near ≈ 0.0055 if the move stays on script.
My read: the chart is warning that a slip below the 0.00633 area could open a path toward the 0.0055 zone.
If you want to see these levels live, tap $KDA and pull up the chart.
Follow me for the next breakdown when KDA tests the next barrier – I’ll map the new shape as it unfolds. What level are you watching most closely on KDA? 👇
⚠️ Not financial advice. DYOR.
#KDA #Kadena #Crypto #BinanceSquare
Price is hugging the 4‑hour pivot, EMA7 is well under EMA25, and RSI sits at 23 — deeply oversold but still bearish. A fresh unmitigated bearish gap sits just above the current price, suggesting the pressure isn’t done yet.
On the 4H chart the key zones are:
‑ Pivot around 0.0060, the current trading area.
‑ Invalidating zone just above ≈ 0.00633; if $KDA loses that level the bearish premise collapses.
‑ Potential downside target near ≈ 0.0055 if the move stays on script.
My read: the chart is warning that a slip below the 0.00633 area could open a path toward the 0.0055 zone.
If you want to see these levels live, tap $KDA and pull up the chart.
Follow me for the next breakdown when KDA tests the next barrier – I’ll map the new shape as it unfolds. What level are you watching most closely on KDA? 👇
⚠️ Not financial advice. DYOR.
#KDA #Kadena #Crypto #BinanceSquare
25
A 35% single-candle collapse on the 4H. And the 24h change still reads +17%. That is not a recovery. That is a rug in slow motion.
Price is trading near 0.006, miles below the volume pocket around 0.033 and the daily point of control near 0.053. The entire profile above is now dead weight. Every bounce is being sold before it can breathe.
The 4H RSI is pinned near 23. On most coins that screams "oversold bounce." Here it just confirms velocity — this thing is falling faster than the indicators can reset. The EMA7 is less than half the EMA25. Trend is not just down. It is vertical.
The level that matters on the 4H is around 0.0063. That is where any short-term reversion attempt loses credibility. As long as $KDA stays below it, the path of least resistance points toward the low 0.005s — a zone that has already been tested once in the last 24 hours and barely held.
The only thing missing from this collapse is leverage. Funding is flat at zero and open interest is basically nonexistent. That means no short squeeze fuel, no liquidation cascade to reverse the move. Just organic abandonment. Futures traders have already left the building.
My read: this is a falling knife with no crowd to catch it. The 4H close below 0.006 would be another structural break, not a signal. Real risk lives in trying to catch a bottom that has no volume behind it.
I watch this level until it either reclaims 0.0063 or loses 0.0054 — follow me and I’ll keep the read updated as the 4H prints.
What level on $KDA are you watching most closely right now 👇
Not financial advice. DYOR.
#KDA #Kadena #Crypto #BinanceSquare
A 35% single-candle collapse on the 4H. And the 24h change still reads +17%. That is not a recovery. That is a rug in slow motion.
Price is trading near 0.006, miles below the volume pocket around 0.033 and the daily point of control near 0.053. The entire profile above is now dead weight. Every bounce is being sold before it can breathe.
The 4H RSI is pinned near 23. On most coins that screams "oversold bounce." Here it just confirms velocity — this thing is falling faster than the indicators can reset. The EMA7 is less than half the EMA25. Trend is not just down. It is vertical.
The level that matters on the 4H is around 0.0063. That is where any short-term reversion attempt loses credibility. As long as $KDA stays below it, the path of least resistance points toward the low 0.005s — a zone that has already been tested once in the last 24 hours and barely held.
The only thing missing from this collapse is leverage. Funding is flat at zero and open interest is basically nonexistent. That means no short squeeze fuel, no liquidation cascade to reverse the move. Just organic abandonment. Futures traders have already left the building.
My read: this is a falling knife with no crowd to catch it. The 4H close below 0.006 would be another structural break, not a signal. Real risk lives in trying to catch a bottom that has no volume behind it.
I watch this level until it either reclaims 0.0063 or loses 0.0054 — follow me and I’ll keep the read updated as the 4H prints.
What level on $KDA are you watching most closely right now 👇
Not financial advice. DYOR.
#KDA #Kadena #Crypto #BinanceSquare
Price is trading near 0.006, miles below the volume pocket around 0.033 and the daily point of control near 0.053. The entire profile above is now dead weight. Every bounce is being sold before it can breathe.
The 4H RSI is pinned near 23. On most coins that screams "oversold bounce." Here it just confirms velocity — this thing is falling faster than the indicators can reset. The EMA7 is less than half the EMA25. Trend is not just down. It is vertical.
The level that matters on the 4H is around 0.0063. That is where any short-term reversion attempt loses credibility. As long as $KDA stays below it, the path of least resistance points toward the low 0.005s — a zone that has already been tested once in the last 24 hours and barely held.
The only thing missing from this collapse is leverage. Funding is flat at zero and open interest is basically nonexistent. That means no short squeeze fuel, no liquidation cascade to reverse the move. Just organic abandonment. Futures traders have already left the building.
My read: this is a falling knife with no crowd to catch it. The 4H close below 0.006 would be another structural break, not a signal. Real risk lives in trying to catch a bottom that has no volume behind it.
I watch this level until it either reclaims 0.0063 or loses 0.0054 — follow me and I’ll keep the read updated as the 4H prints.
What level on $KDA are you watching most closely right now 👇
Not financial advice. DYOR.
#KDA #Kadena #Crypto #BinanceSquare
22
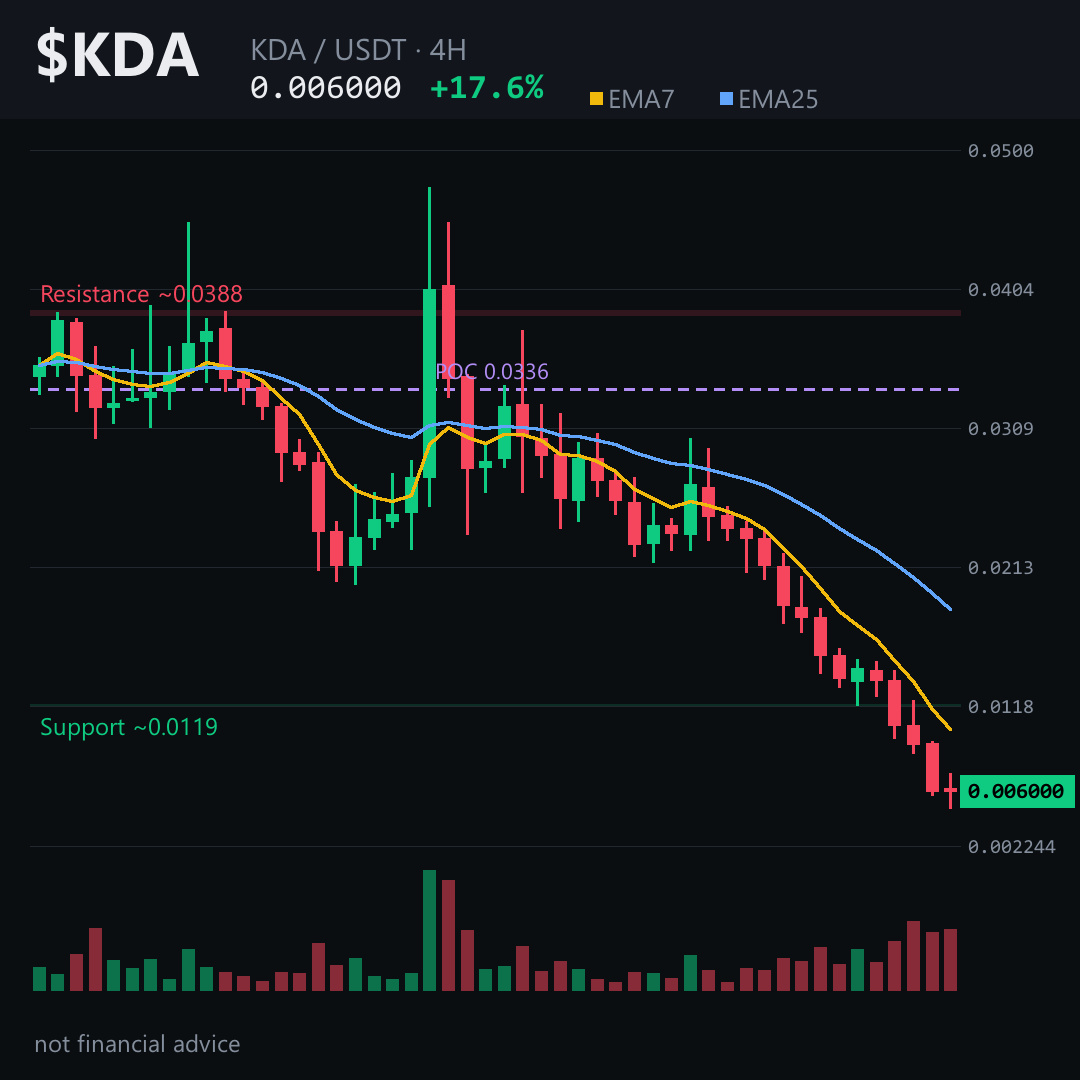
Only 1 green candle in the last 48 hours – the market has turned red 11 times straight. The 4‑hour EMA7 sits at 0.0102, barely half the EMA25 at 0.0185, and RSI is stuck at 23.5, hinting at deeper pressure. Read on 👇
Price is hovering just below the 4‑hour pivot around 0.0060. While the bearish EMA spread and ultra‑low RSI suggest further downside, the unfilled bearish FVG at 0.0095‑0.0094 whispers a hidden supply pocket that could accelerate the slide.
On the 4‑hour chart the critical zone sits near 0.0060. The invalidation line sits just above at ~0.00633 – a break above would nullify the bearish case. Failing that, the price may drift toward the objective zone around 0.0055. If $KDA loses the ~0.00633 area on a 4H close, this read is off the table. Tap $KDA to pull up the chart and verify these zones yourself.
The structure points to a continued slide toward the mid‑0.005 range, with the real risk lying if the market manages to retest the ~0.00633 ceiling.
I'll break down the next move once the price tests the 0.0063 barrier, so hit follow to stay updated. How do you interpret the $KDA 4‑hour structure? 👇
⚠️ Not financial advice. DYOR.
#KDA #Kadena #Crypto #BinanceSquare
Only 1 green candle in the last 48 hours – the market has turned red 11 times straight. The 4‑hour EMA7 sits at 0.0102, barely half the EMA25 at 0.0185, and RSI is stuck at 23.5, hinting at deeper pressure. Read on 👇
Price is hovering just below the 4‑hour pivot around 0.0060. While the bearish EMA spread and ultra‑low RSI suggest further downside, the unfilled bearish FVG at 0.0095‑0.0094 whispers a hidden supply pocket that could accelerate the slide.
On the 4‑hour chart the critical zone sits near 0.0060. The invalidation line sits just above at ~0.00633 – a break above would nullify the bearish case. Failing that, the price may drift toward the objective zone around 0.0055. If $KDA loses the ~0.00633 area on a 4H close, this read is off the table. Tap $KDA to pull up the chart and verify these zones yourself.
The structure points to a continued slide toward the mid‑0.005 range, with the real risk lying if the market manages to retest the ~0.00633 ceiling.
I'll break down the next move once the price tests the 0.0063 barrier, so hit follow to stay updated. How do you interpret the $KDA 4‑hour structure? 👇
⚠️ Not financial advice. DYOR.
#KDA #Kadena #Crypto #BinanceSquare
Price is hovering just below the 4‑hour pivot around 0.0060. While the bearish EMA spread and ultra‑low RSI suggest further downside, the unfilled bearish FVG at 0.0095‑0.0094 whispers a hidden supply pocket that could accelerate the slide.
On the 4‑hour chart the critical zone sits near 0.0060. The invalidation line sits just above at ~0.00633 – a break above would nullify the bearish case. Failing that, the price may drift toward the objective zone around 0.0055. If $KDA loses the ~0.00633 area on a 4H close, this read is off the table. Tap $KDA to pull up the chart and verify these zones yourself.
The structure points to a continued slide toward the mid‑0.005 range, with the real risk lying if the market manages to retest the ~0.00633 ceiling.
I'll break down the next move once the price tests the 0.0063 barrier, so hit follow to stay updated. How do you interpret the $KDA 4‑hour structure? 👇
⚠️ Not financial advice. DYOR.
#KDA #Kadena #Crypto #BinanceSquare
6
All eyes are on the 17% surge and the hype that $KDA will rocket higher.
The 4‑hour chart, however, is carving a quiet path toward the low‑60s.
The levels don’t lie 👇
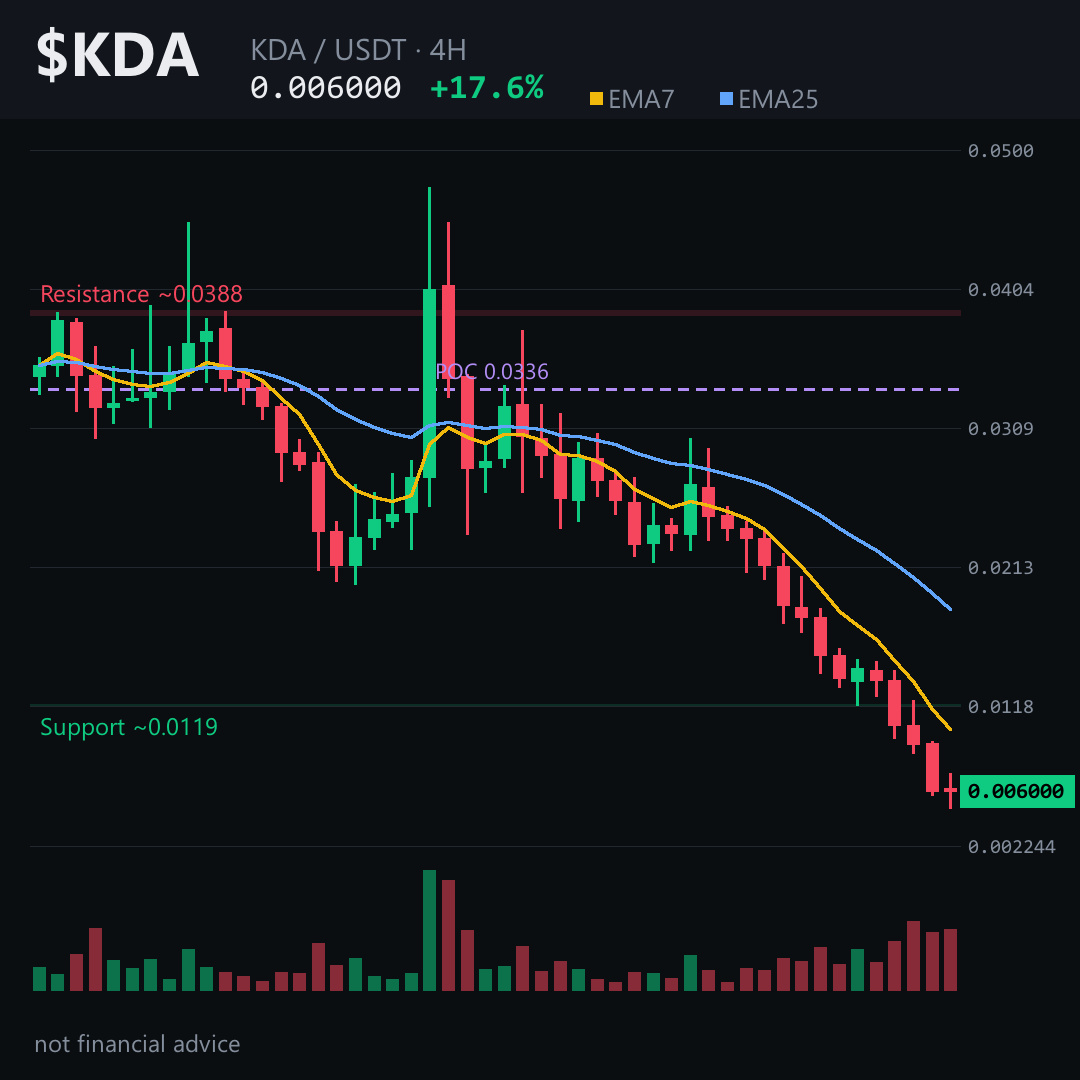
Price sits under the EMA7/EMA25 cross and RSI is trapped in the low‑20s – classic oversold pressure. A bearish unfilled gap lingers just below the current price, while a flat funding rate signals no fresh long‑side firepower.
On the 4‑hour picture the pivot hovers around the 0.0060 area. Lose the ~0.00633 zone on a 4H close and the bearish premise collapses. If $KDA respects that barrier, the next likely destination is the ~0.0055 zone, a clear objective for sellers. Tap $KDA to pull up the chart and see these zones yourself.
The chart is screaming lower; the real risk is a break below the 0.00633 level, which would open the path to the 0.0055 area.
I’ll break down the weekly macro picture once price tests that 0.0055 region — follow for the next layer of analysis.
Which zone are you watching on KDA? 👇
⚠️ Not financial advice. DYOR.
#KDA #Kadena #Crypto #BinanceSquare
All eyes are on the 17% surge and the hype that $KDA will rocket higher.
The 4‑hour chart, however, is carving a quiet path toward the low‑60s.
The levels don’t lie 👇
Price sits under the EMA7/EMA25 cross and RSI is trapped in the low‑20s – classic oversold pressure. A bearish unfilled gap lingers just below the current price, while a flat funding rate signals no fresh long‑side firepower.
On the 4‑hour picture the pivot hovers around the 0.0060 area. Lose the ~0.00633 zone on a 4H close and the bearish premise collapses. If $KDA respects that barrier, the next likely destination is the ~0.0055 zone, a clear objective for sellers. Tap $KDA to pull up the chart and see these zones yourself.
The chart is screaming lower; the real risk is a break below the 0.00633 level, which would open the path to the 0.0055 area.
I’ll break down the weekly macro picture once price tests that 0.0055 region — follow for the next layer of analysis.
Which zone are you watching on KDA? 👇
⚠️ Not financial advice. DYOR.
#KDA #Kadena #Crypto #BinanceSquare
The 4‑hour chart, however, is carving a quiet path toward the low‑60s.
The levels don’t lie 👇
Price sits under the EMA7/EMA25 cross and RSI is trapped in the low‑20s – classic oversold pressure. A bearish unfilled gap lingers just below the current price, while a flat funding rate signals no fresh long‑side firepower.
On the 4‑hour picture the pivot hovers around the 0.0060 area. Lose the ~0.00633 zone on a 4H close and the bearish premise collapses. If $KDA respects that barrier, the next likely destination is the ~0.0055 zone, a clear objective for sellers. Tap $KDA to pull up the chart and see these zones yourself.
The chart is screaming lower; the real risk is a break below the 0.00633 level, which would open the path to the 0.0055 area.
I’ll break down the weekly macro picture once price tests that 0.0055 region — follow for the next layer of analysis.
Which zone are you watching on KDA? 👇
⚠️ Not financial advice. DYOR.
#KDA #Kadena #Crypto #BinanceSquare
4
-35.48% in a single 4H candle.
That is not a pump. That is a liquidation cascade with a dead-cat bounce wearing a "+17.65%" costume.
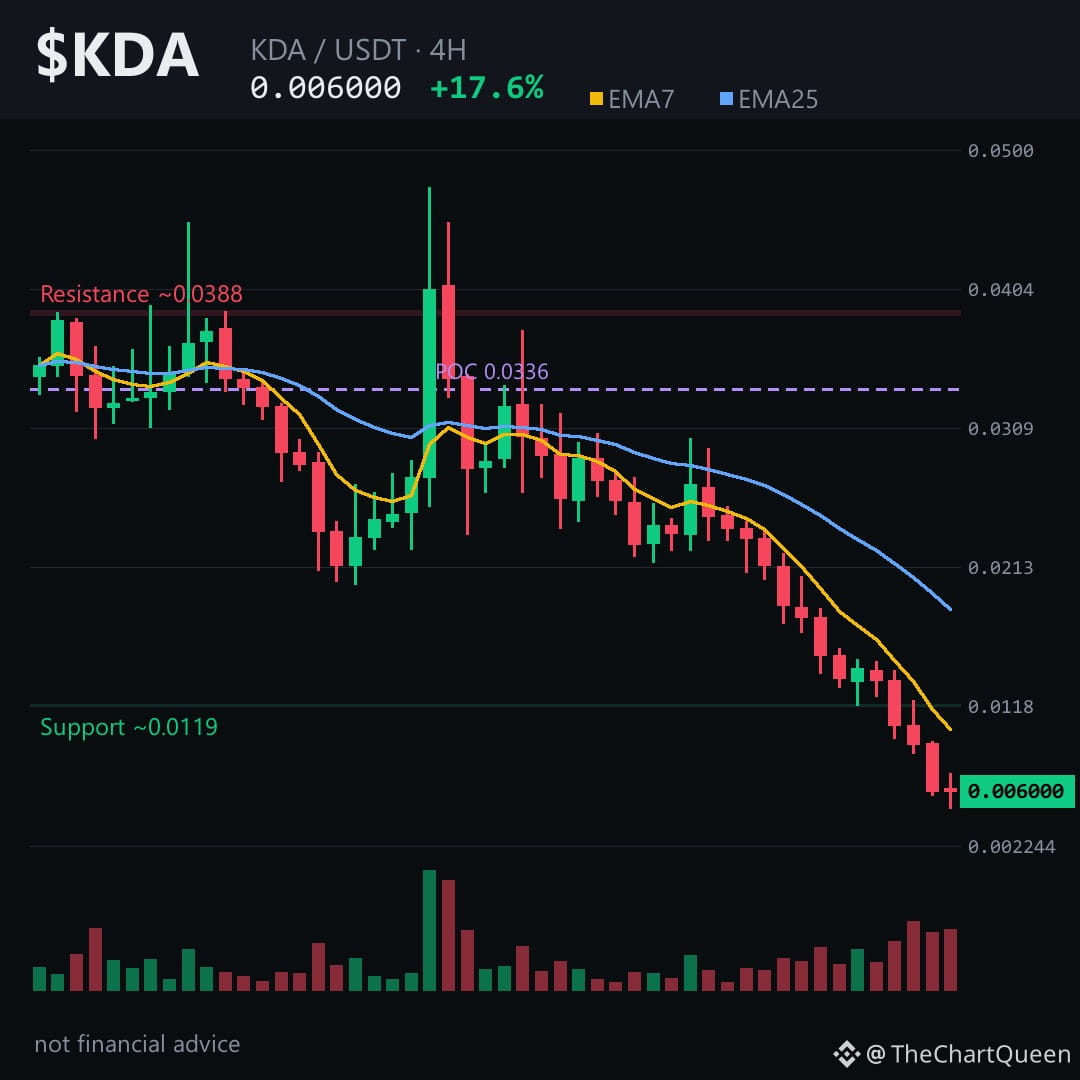
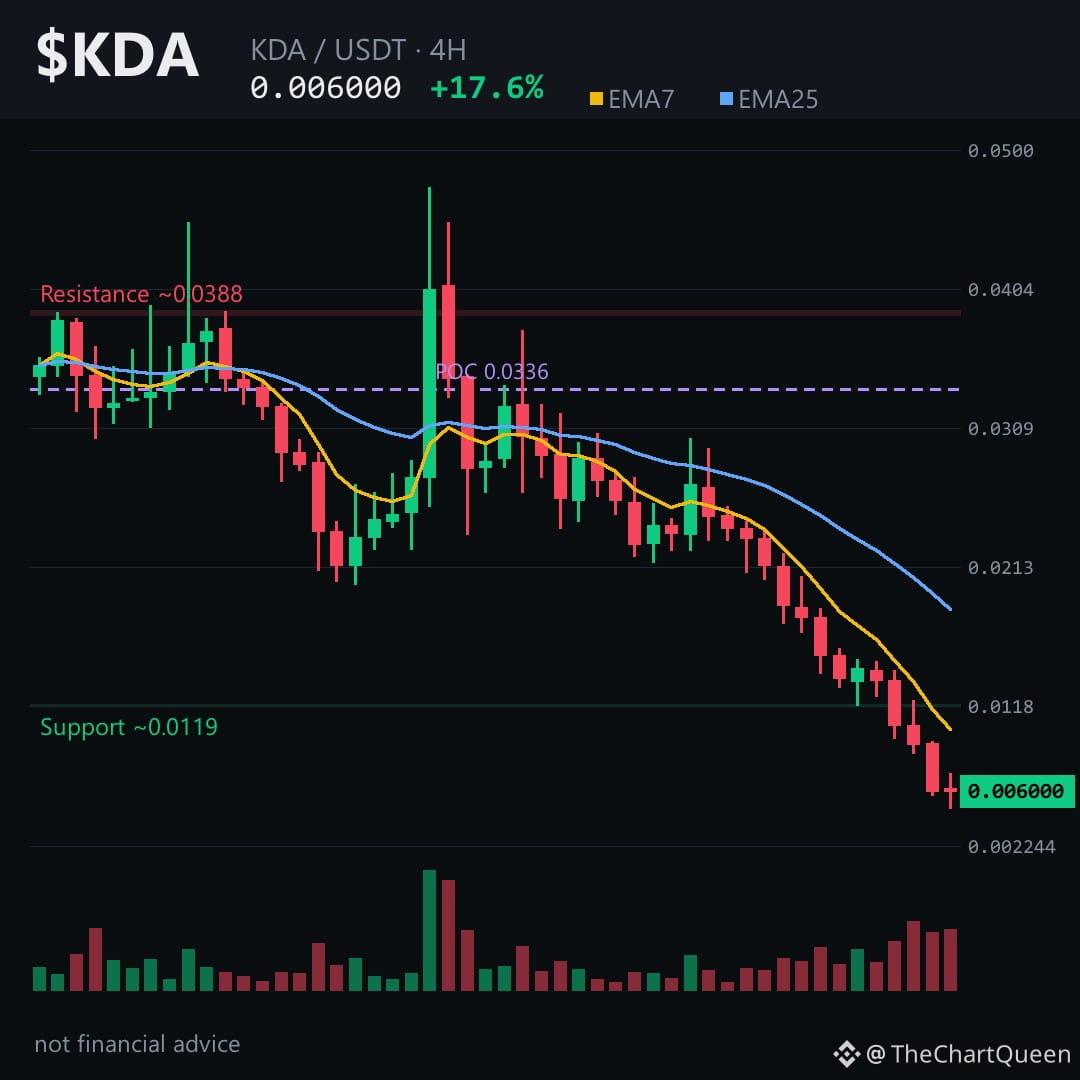
Eleven of the last twelve candles closed red. Price fell from 0.024 to 0.006 in two days. The bounce off the lows is barely a retrace of the most recent leg down.
Price sits near 0.0060, just above the objective zone at 0.0055. The invalidation sits around 0.0063 — less than five percent away. A 4H close back above that would tell me the bounce has more fuel than the tape suggests.
Below, an unfilled gap runs from 0.0096 down to 0.0094. Gaps act as magnets. The path of least resistance stays lower until that zone gets tested or the invalidation clears.
RSI on the 4H is 23 — oversold, but in a downtrend this steep, oversold can stay oversold for days.
My read: the bounce is real but fragile. The risk is mistaking a relief rally for a reversal. If $KDA fails to reclaim 0.0063, the 0.0055 zone is the next logical magnet. Tap $KDA to pull up the chart and see the gap for yourself.
I will update this read if the invalidation clears or the gap gets filled — follow so you do not have to hunt for it.
Which zone are you watching closer on $KDA — the gap above or the objective below? 👇
⚠️ Not financial advice. DYOR.
#KDA #Kadena #Crypto #BinanceSquare
-35.48% in a single 4H candle.
That is not a pump. That is a liquidation cascade with a dead-cat bounce wearing a "+17.65%" costume.
Eleven of the last twelve candles closed red. Price fell from 0.024 to 0.006 in two days. The bounce off the lows is barely a retrace of the most recent leg down.
Price sits near 0.0060, just above the objective zone at 0.0055. The invalidation sits around 0.0063 — less than five percent away. A 4H close back above that would tell me the bounce has more fuel than the tape suggests.
Below, an unfilled gap runs from 0.0096 down to 0.0094. Gaps act as magnets. The path of least resistance stays lower until that zone gets tested or the invalidation clears.
RSI on the 4H is 23 — oversold, but in a downtrend this steep, oversold can stay oversold for days.
My read: the bounce is real but fragile. The risk is mistaking a relief rally for a reversal. If $KDA fails to reclaim 0.0063, the 0.0055 zone is the next logical magnet. Tap $KDA to pull up the chart and see the gap for yourself.
I will update this read if the invalidation clears or the gap gets filled — follow so you do not have to hunt for it.
Which zone are you watching closer on $KDA — the gap above or the objective below? 👇
⚠️ Not financial advice. DYOR.
#KDA #Kadena #Crypto #BinanceSquare
That is not a pump. That is a liquidation cascade with a dead-cat bounce wearing a "+17.65%" costume.
Eleven of the last twelve candles closed red. Price fell from 0.024 to 0.006 in two days. The bounce off the lows is barely a retrace of the most recent leg down.
Price sits near 0.0060, just above the objective zone at 0.0055. The invalidation sits around 0.0063 — less than five percent away. A 4H close back above that would tell me the bounce has more fuel than the tape suggests.
Below, an unfilled gap runs from 0.0096 down to 0.0094. Gaps act as magnets. The path of least resistance stays lower until that zone gets tested or the invalidation clears.
RSI on the 4H is 23 — oversold, but in a downtrend this steep, oversold can stay oversold for days.
My read: the bounce is real but fragile. The risk is mistaking a relief rally for a reversal. If $KDA fails to reclaim 0.0063, the 0.0055 zone is the next logical magnet. Tap $KDA to pull up the chart and see the gap for yourself.
I will update this read if the invalidation clears or the gap gets filled — follow so you do not have to hunt for it.
Which zone are you watching closer on $KDA — the gap above or the objective below? 👇
⚠️ Not financial advice. DYOR.
#KDA #Kadena #Crypto #BinanceSquare
20

·
--
⚙️ ALTERNATIVE BLOCKCHAINS: TECHNOLOGY VS. DEMAND!
$KDA (KDA) • $Erg (ERG) • $FLUX (FLUX)
KDA, ERG, and FLUX offer different approaches to blockchain infrastructure and decentralized computing. Their prospects depend on adoption, developer activity, network economics, and competition.
Would you prioritize technical design or evidence of real users? Share your view — and research the risks before investing.
#Kadena #Ergo #Flux #Blockchain #CryptoAnalysis
Disclaimer: This is for informational purposes only, not financial advice. Crypto assets are highly volatile. DYOR.
⚙️ ALTERNATIVE BLOCKCHAINS: TECHNOLOGY VS. DEMAND!
$KDA (KDA) • $Erg (ERG) • $FLUX (FLUX)
KDA, ERG, and FLUX offer different approaches to blockchain infrastructure and decentralized computing. Their prospects depend on adoption, developer activity, network economics, and competition.
Would you prioritize technical design or evidence of real users? Share your view — and research the risks before investing.
#Kadena #Ergo #Flux #Blockchain #CryptoAnalysis
Disclaimer: This is for informational purposes only, not financial advice. Crypto assets are highly volatile. DYOR.
$KDA (KDA) • $Erg (ERG) • $FLUX (FLUX)
KDA, ERG, and FLUX offer different approaches to blockchain infrastructure and decentralized computing. Their prospects depend on adoption, developer activity, network economics, and competition.
Would you prioritize technical design or evidence of real users? Share your view — and research the risks before investing.
#Kadena #Ergo #Flux #Blockchain #CryptoAnalysis
Disclaimer: This is for informational purposes only, not financial advice. Crypto assets are highly volatile. DYOR.
1
9

·
--
$KDA Update | August 4, 2026
Kadena remains on investors' watchlist as the community continues to focus on ecosystem recovery and future development. Traders are closely monitoring volume and market sentiment for the next major move.$KDA
Are you bullish or bearish on KDA?
⚠️ Disclaimer: This is not financial advice. Always do your own research (DYOR).
$KDA Update | August 4, 2026
Kadena remains on investors' watchlist as the community continues to focus on ecosystem recovery and future development. Traders are closely monitoring volume and market sentiment for the next major move.$KDA
Are you bullish or bearish on KDA?
⚠️ Disclaimer: This is not financial advice. Always do your own research (DYOR).
Kadena remains on investors' watchlist as the community continues to focus on ecosystem recovery and future development. Traders are closely monitoring volume and market sentiment for the next major move.$KDA
Are you bullish or bearish on KDA?
⚠️ Disclaimer: This is not financial advice. Always do your own research (DYOR).
28
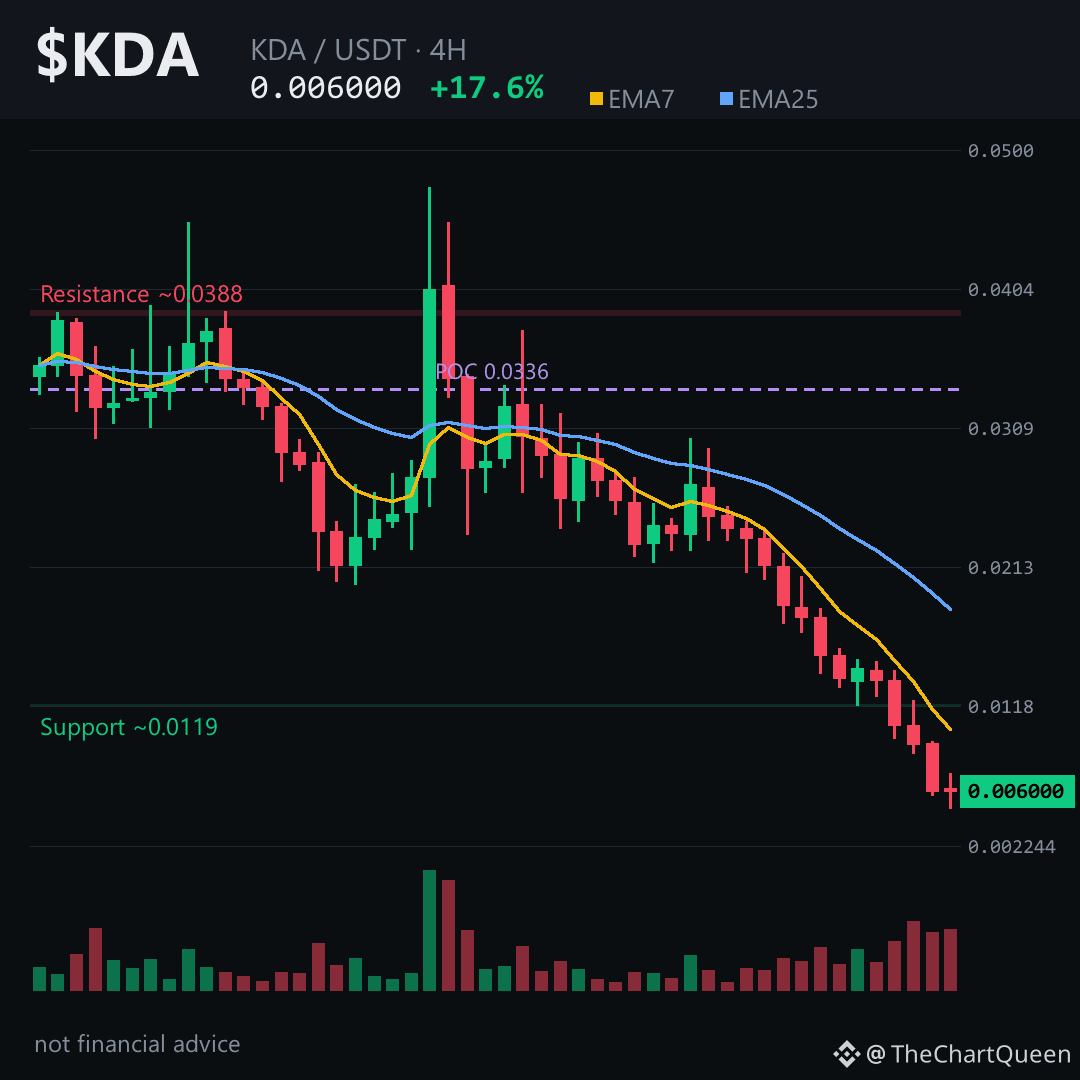
Imagine waking up to a +17% pump, only to realize the coin just printed 11 red candles in the last 12 periods. That’s the trap sitting on $KDA right now — and the chart is whispering something most people will miss.
A 50% daily range under a penny screams aggressive distribution. The volume spike didn’t build a floor; it carved a cliff. Price clings to 0.006 after a brutal -35% candle that sliced through a bearish fair value gap at 0.0094–0.0096 — now a lid overhead, not a stepping stone. RSI is buried at 23, but in a structured downtrend, oversold can stay oversold.
The daily swing read anchors the bias bearish: price trades well below both moving averages, and the volume profile point of control sits near 0.053 — miles above. The 0.0061 area is the immediate pivot. If $KDA fails to reclaim it with conviction, the path of least resistance points toward 0.0051. Invalidation sits around 0.0066 — a daily close above that cracks the breakdown narrative. Tap the chart and walk the levels yourself; the geometry doesn’t lie.
This bounce is noise inside a cascade. Flat funding, zero open interest — smart money isn’t even interested yet.
I’ll post a follow-up the moment the 0.0061 pivot gets tested or rejected — follow so that update lands on your feed. Which level are you watching more closely on $KDA right now, the 0.0051 objective or the 0.0066 invalidation? 👇
#KDA #Kadena #Crypto #BinanceSquare
⚠️ Not financial advice. DYOR.
Imagine waking up to a +17% pump, only to realize the coin just printed 11 red candles in the last 12 periods. That’s the trap sitting on $KDA right now — and the chart is whispering something most people will miss.
A 50% daily range under a penny screams aggressive distribution. The volume spike didn’t build a floor; it carved a cliff. Price clings to 0.006 after a brutal -35% candle that sliced through a bearish fair value gap at 0.0094–0.0096 — now a lid overhead, not a stepping stone. RSI is buried at 23, but in a structured downtrend, oversold can stay oversold.
The daily swing read anchors the bias bearish: price trades well below both moving averages, and the volume profile point of control sits near 0.053 — miles above. The 0.0061 area is the immediate pivot. If $KDA fails to reclaim it with conviction, the path of least resistance points toward 0.0051. Invalidation sits around 0.0066 — a daily close above that cracks the breakdown narrative. Tap the chart and walk the levels yourself; the geometry doesn’t lie.
This bounce is noise inside a cascade. Flat funding, zero open interest — smart money isn’t even interested yet.
I’ll post a follow-up the moment the 0.0061 pivot gets tested or rejected — follow so that update lands on your feed. Which level are you watching more closely on $KDA right now, the 0.0051 objective or the 0.0066 invalidation? 👇
#KDA #Kadena #Crypto #BinanceSquare
⚠️ Not financial advice. DYOR.
A 50% daily range under a penny screams aggressive distribution. The volume spike didn’t build a floor; it carved a cliff. Price clings to 0.006 after a brutal -35% candle that sliced through a bearish fair value gap at 0.0094–0.0096 — now a lid overhead, not a stepping stone. RSI is buried at 23, but in a structured downtrend, oversold can stay oversold.
The daily swing read anchors the bias bearish: price trades well below both moving averages, and the volume profile point of control sits near 0.053 — miles above. The 0.0061 area is the immediate pivot. If $KDA fails to reclaim it with conviction, the path of least resistance points toward 0.0051. Invalidation sits around 0.0066 — a daily close above that cracks the breakdown narrative. Tap the chart and walk the levels yourself; the geometry doesn’t lie.
This bounce is noise inside a cascade. Flat funding, zero open interest — smart money isn’t even interested yet.
I’ll post a follow-up the moment the 0.0061 pivot gets tested or rejected — follow so that update lands on your feed. Which level are you watching more closely on $KDA right now, the 0.0051 objective or the 0.0066 invalidation? 👇
#KDA #Kadena #Crypto #BinanceSquare
⚠️ Not financial advice. DYOR.
29
Picture a coin that just ripped 17% in a day, yet every single timeframe is screaming one word: lower.
That’s the strange reality with $KDA right now — a “Top Gainer” on the surface, but underneath, the chart has been quietly bleeding for two straight days.
On the 4-hour, price is under every meaningful moving average, RSI buried near 23, and the last 48 hours gave us 11 red candles out of 12. The bounce? It’s fighting a wall of prior support now flipped into resistance.
Futures liquidity is flat — no funding pressure, no open interest. That’s not aggressive bidding; it’s drifting on thin air.
The level that matters sits around mid-0.006. As long as $KDA can’t reclaim roughly the 0.0063 zone on a 4-hour close, path of least resistance still points toward 0.0055 — and if that gives way, the weekly macro objective near 0.0038 isn’t off the table.
Lose ~0.0063 decisively, or fail to hold the current pivot, and this “gain” looks like a pause before the next leg down.
My read: dead-cat bounce inside a broader downtrend, not a reversal. The risk isn’t missing the next breakout — it’s mistaking a short squeeze for strength.
I’ll keep watching whether 0.0063 gets reclaimed or rejected — follow along, because that’s the line that tells us if the bounce has legs or just ran out of air.
Which level are you trusting more on $KDA right now — the bounce, or the breakdown? 👇
⚠️ Not financial advice. DYOR.
#KDA #Kadena #Crypto #BinanceSquare
Picture a coin that just ripped 17% in a day, yet every single timeframe is screaming one word: lower.
That’s the strange reality with $KDA right now — a “Top Gainer” on the surface, but underneath, the chart has been quietly bleeding for two straight days.
On the 4-hour, price is under every meaningful moving average, RSI buried near 23, and the last 48 hours gave us 11 red candles out of 12. The bounce? It’s fighting a wall of prior support now flipped into resistance.
Futures liquidity is flat — no funding pressure, no open interest. That’s not aggressive bidding; it’s drifting on thin air.
The level that matters sits around mid-0.006. As long as $KDA can’t reclaim roughly the 0.0063 zone on a 4-hour close, path of least resistance still points toward 0.0055 — and if that gives way, the weekly macro objective near 0.0038 isn’t off the table.
Lose ~0.0063 decisively, or fail to hold the current pivot, and this “gain” looks like a pause before the next leg down.
My read: dead-cat bounce inside a broader downtrend, not a reversal. The risk isn’t missing the next breakout — it’s mistaking a short squeeze for strength.
I’ll keep watching whether 0.0063 gets reclaimed or rejected — follow along, because that’s the line that tells us if the bounce has legs or just ran out of air.
Which level are you trusting more on $KDA right now — the bounce, or the breakdown? 👇
⚠️ Not financial advice. DYOR.
#KDA #Kadena #Crypto #BinanceSquare
That’s the strange reality with $KDA right now — a “Top Gainer” on the surface, but underneath, the chart has been quietly bleeding for two straight days.
On the 4-hour, price is under every meaningful moving average, RSI buried near 23, and the last 48 hours gave us 11 red candles out of 12. The bounce? It’s fighting a wall of prior support now flipped into resistance.
Futures liquidity is flat — no funding pressure, no open interest. That’s not aggressive bidding; it’s drifting on thin air.
The level that matters sits around mid-0.006. As long as $KDA can’t reclaim roughly the 0.0063 zone on a 4-hour close, path of least resistance still points toward 0.0055 — and if that gives way, the weekly macro objective near 0.0038 isn’t off the table.
Lose ~0.0063 decisively, or fail to hold the current pivot, and this “gain” looks like a pause before the next leg down.
My read: dead-cat bounce inside a broader downtrend, not a reversal. The risk isn’t missing the next breakout — it’s mistaking a short squeeze for strength.
I’ll keep watching whether 0.0063 gets reclaimed or rejected — follow along, because that’s the line that tells us if the bounce has legs or just ran out of air.
Which level are you trusting more on $KDA right now — the bounce, or the breakdown? 👇
⚠️ Not financial advice. DYOR.
#KDA #Kadena #Crypto #BinanceSquare
18
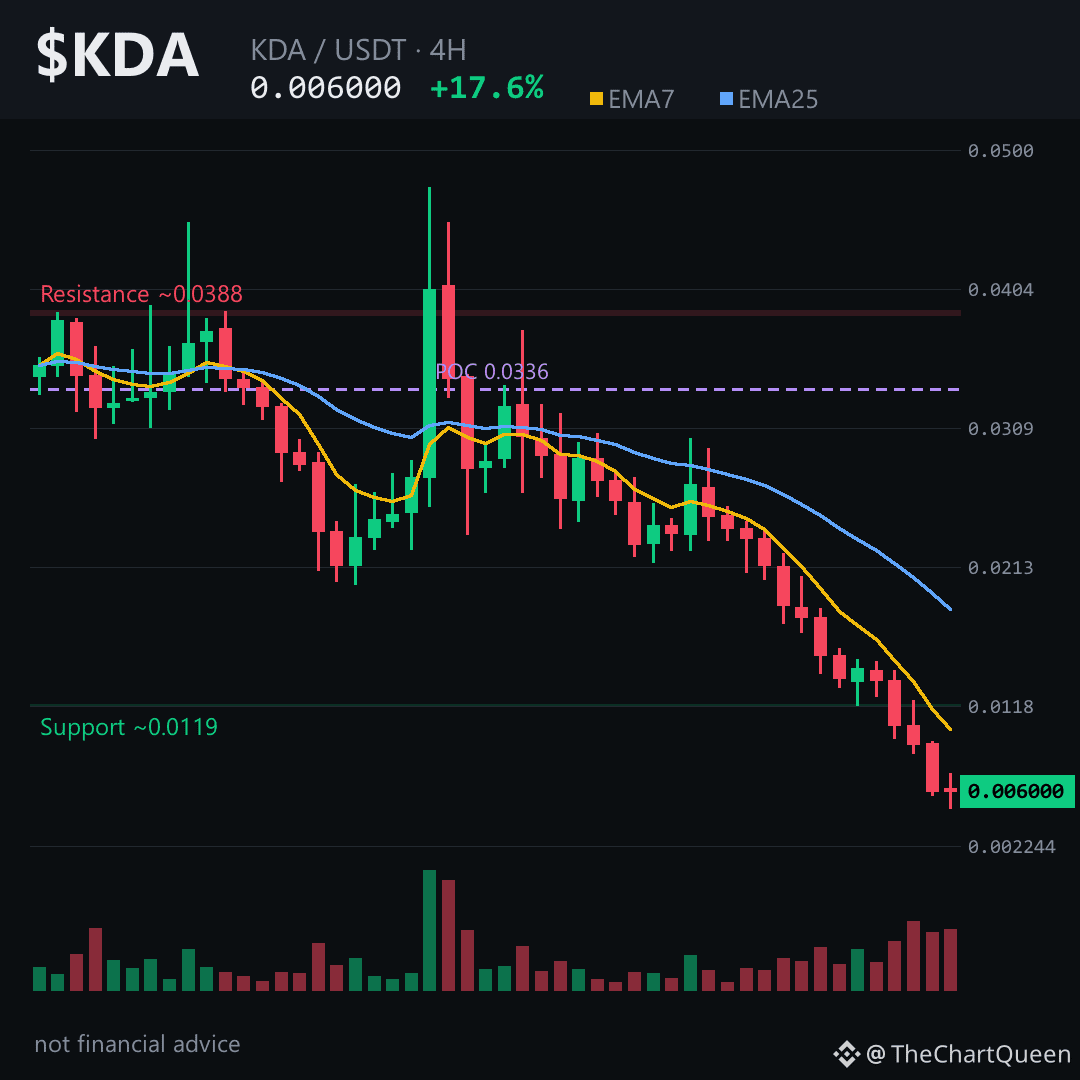
That 0.00603 pivot just held while the 4‑hour candles screamed red – a silent alarm you’d miss if you weren’t watching the tape.
Price is hugging the ~0.00603 zone, but EMA7 sits well under EMA25 and RSI is stuck in the low‑20s, whispering that the upside is already priced in. Yet the unfilled bearish gap at $0.0095‑$0.0094 and a shrinking ATR (average true range) tell a different story: sellers are still hunting liquidity.
On the 4‑hour frame the key battle is between the ~0.00603 support and the ~0.00633 invalidation line. Lose the ~0.00633 area on a 4‑hour close and the bearish case collapses; hold it and the price could drift toward the ~0.00549 objective zone.
My read: the chart is leaning down‑side, and the real risk is a break above the ~0.00633 barrier.
Tap $KDA to pull up the chart and see these levels yourself. Follow me for the next update when the price tests that boundary. What level are you watching on $KDA? 👇
⚠️ Not financial advice. DYOR.
#KDA #Kadena #Crypto #BinanceSquare
That 0.00603 pivot just held while the 4‑hour candles screamed red – a silent alarm you’d miss if you weren’t watching the tape.
Price is hugging the ~0.00603 zone, but EMA7 sits well under EMA25 and RSI is stuck in the low‑20s, whispering that the upside is already priced in. Yet the unfilled bearish gap at $0.0095‑$0.0094 and a shrinking ATR (average true range) tell a different story: sellers are still hunting liquidity.
On the 4‑hour frame the key battle is between the ~0.00603 support and the ~0.00633 invalidation line. Lose the ~0.00633 area on a 4‑hour close and the bearish case collapses; hold it and the price could drift toward the ~0.00549 objective zone.
My read: the chart is leaning down‑side, and the real risk is a break above the ~0.00633 barrier.
Tap $KDA to pull up the chart and see these levels yourself. Follow me for the next update when the price tests that boundary. What level are you watching on $KDA? 👇
⚠️ Not financial advice. DYOR.
#KDA #Kadena #Crypto #BinanceSquare
Price is hugging the ~0.00603 zone, but EMA7 sits well under EMA25 and RSI is stuck in the low‑20s, whispering that the upside is already priced in. Yet the unfilled bearish gap at $0.0095‑$0.0094 and a shrinking ATR (average true range) tell a different story: sellers are still hunting liquidity.
On the 4‑hour frame the key battle is between the ~0.00603 support and the ~0.00633 invalidation line. Lose the ~0.00633 area on a 4‑hour close and the bearish case collapses; hold it and the price could drift toward the ~0.00549 objective zone.
My read: the chart is leaning down‑side, and the real risk is a break above the ~0.00633 barrier.
Tap $KDA to pull up the chart and see these levels yourself. Follow me for the next update when the price tests that boundary. What level are you watching on $KDA? 👇
⚠️ Not financial advice. DYOR.
#KDA #Kadena #Crypto #BinanceSquare
28
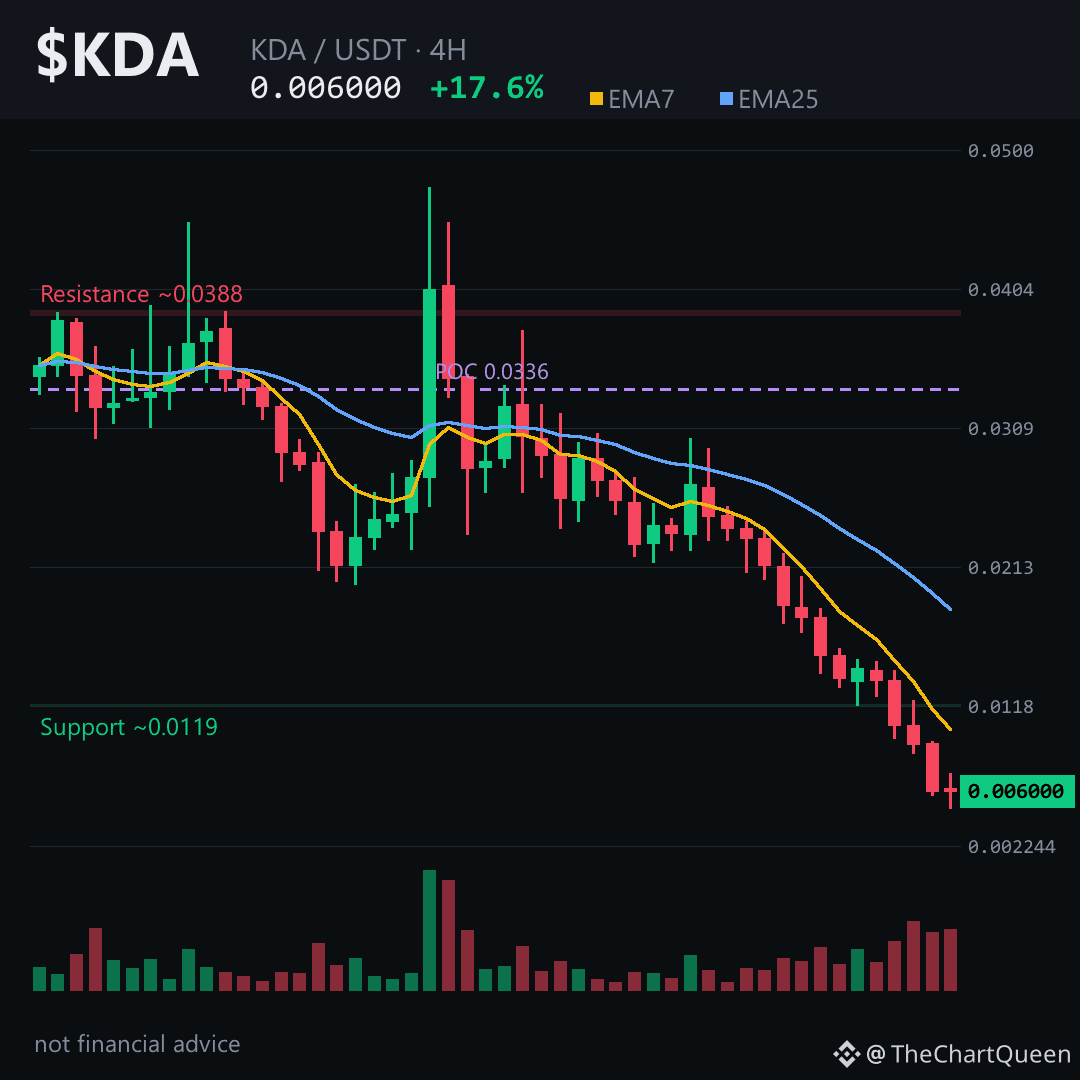
Everyone’s watching the +17% pop and calling a bottom.
They’re wrong. This is a liquidity grab before the next leg down.
The Trade — SHORT (Swing 1D):
Entry $0.00612000 | SL $0.00660960 | TP $0.00514080 | 3-5x Cross max
A clean 2.0:1 R:R targeting a sweep of the 24H low. OI and Funding are flatlined—a ghost town. No smart money is buying this dip, making any bounce suspect. Size for a 1-2% account risk max. Invalid above $0.00660960.
We’re fading hope with the dominant trend. This is a momentum continuation trade, not a hero bottom-call.
Tap $KDA to pull up the chart and set the limit—set it and forget it.
Follow me — I'll drop the exact update the moment this triggers or invalidates, so you catch it.
LONG or SHORT $KDA here? 👇
⚠️ Not financial advice. DYOR.
#KDA #Kadena #Crypto #BinanceSquare
Everyone’s watching the +17% pop and calling a bottom.
They’re wrong. This is a liquidity grab before the next leg down.
The Trade — SHORT (Swing 1D):
Entry $0.00612000 | SL $0.00660960 | TP $0.00514080 | 3-5x Cross max
A clean 2.0:1 R:R targeting a sweep of the 24H low. OI and Funding are flatlined—a ghost town. No smart money is buying this dip, making any bounce suspect. Size for a 1-2% account risk max. Invalid above $0.00660960.
We’re fading hope with the dominant trend. This is a momentum continuation trade, not a hero bottom-call.
Tap $KDA to pull up the chart and set the limit—set it and forget it.
Follow me — I'll drop the exact update the moment this triggers or invalidates, so you catch it.
LONG or SHORT $KDA here? 👇
⚠️ Not financial advice. DYOR.
#KDA #Kadena #Crypto #BinanceSquare
They’re wrong. This is a liquidity grab before the next leg down.
The Trade — SHORT (Swing 1D):
Entry $0.00612000 | SL $0.00660960 | TP $0.00514080 | 3-5x Cross max
A clean 2.0:1 R:R targeting a sweep of the 24H low. OI and Funding are flatlined—a ghost town. No smart money is buying this dip, making any bounce suspect. Size for a 1-2% account risk max. Invalid above $0.00660960.
We’re fading hope with the dominant trend. This is a momentum continuation trade, not a hero bottom-call.
Tap $KDA to pull up the chart and set the limit—set it and forget it.
Follow me — I'll drop the exact update the moment this triggers or invalidates, so you catch it.
LONG or SHORT $KDA here? 👇
⚠️ Not financial advice. DYOR.
#KDA #Kadena #Crypto #BinanceSquare
39
24 hours ago it was clinging to 2 cents — now it’s fighting to hold half a penny.
That +17% pop hides a savage liquidation cascade. The real story: 11 red candles out of 12, a -35% single-candle wipeout, and price pressing the lowest 4H support left. The bounce is thin air.
The daily chart confirms it. $KDA has a massive unfilled Fair Value Gap sitting roughly 0.021–0.015. That zone is a vacuum — any rally that can't reclaim it is just a dead-cat bounce. RSI is buried near 17; oversold can stay oversold for weeks in a trend this strong.
The 4H invalidation sits near 0.00633. If buyers can't push a close above that, gravity likely drags this toward 0.00548 — a level with almost no structural support beneath it.
My read: the bounce is a reaction, not a reversal. Until 0.00633 flips from resistance to support, the path of least resistance is lower.
I’ll update if $KDA starts chipping away at that daily gap — follow so it lands on your feed.
What’s the one level on this chart that would actually make you trust a bottom? 👇
#KDA #Kadena #Crypto #BinanceSquare
⚠️ Not financial advice. DYOR.
24 hours ago it was clinging to 2 cents — now it’s fighting to hold half a penny.
That +17% pop hides a savage liquidation cascade. The real story: 11 red candles out of 12, a -35% single-candle wipeout, and price pressing the lowest 4H support left. The bounce is thin air.
The daily chart confirms it. $KDA has a massive unfilled Fair Value Gap sitting roughly 0.021–0.015. That zone is a vacuum — any rally that can't reclaim it is just a dead-cat bounce. RSI is buried near 17; oversold can stay oversold for weeks in a trend this strong.
The 4H invalidation sits near 0.00633. If buyers can't push a close above that, gravity likely drags this toward 0.00548 — a level with almost no structural support beneath it.
My read: the bounce is a reaction, not a reversal. Until 0.00633 flips from resistance to support, the path of least resistance is lower.
I’ll update if $KDA starts chipping away at that daily gap — follow so it lands on your feed.
What’s the one level on this chart that would actually make you trust a bottom? 👇
#KDA #Kadena #Crypto #BinanceSquare
⚠️ Not financial advice. DYOR.
That +17% pop hides a savage liquidation cascade. The real story: 11 red candles out of 12, a -35% single-candle wipeout, and price pressing the lowest 4H support left. The bounce is thin air.
The daily chart confirms it. $KDA has a massive unfilled Fair Value Gap sitting roughly 0.021–0.015. That zone is a vacuum — any rally that can't reclaim it is just a dead-cat bounce. RSI is buried near 17; oversold can stay oversold for weeks in a trend this strong.
The 4H invalidation sits near 0.00633. If buyers can't push a close above that, gravity likely drags this toward 0.00548 — a level with almost no structural support beneath it.
My read: the bounce is a reaction, not a reversal. Until 0.00633 flips from resistance to support, the path of least resistance is lower.
I’ll update if $KDA starts chipping away at that daily gap — follow so it lands on your feed.
What’s the one level on this chart that would actually make you trust a bottom? 👇
#KDA #Kadena #Crypto #BinanceSquare
⚠️ Not financial advice. DYOR.
27
+17.65% looks like a party until you notice the last red candle dropped 35% in four hours.
That is the whole story of $KDA right now: a bounce inside a collapse.
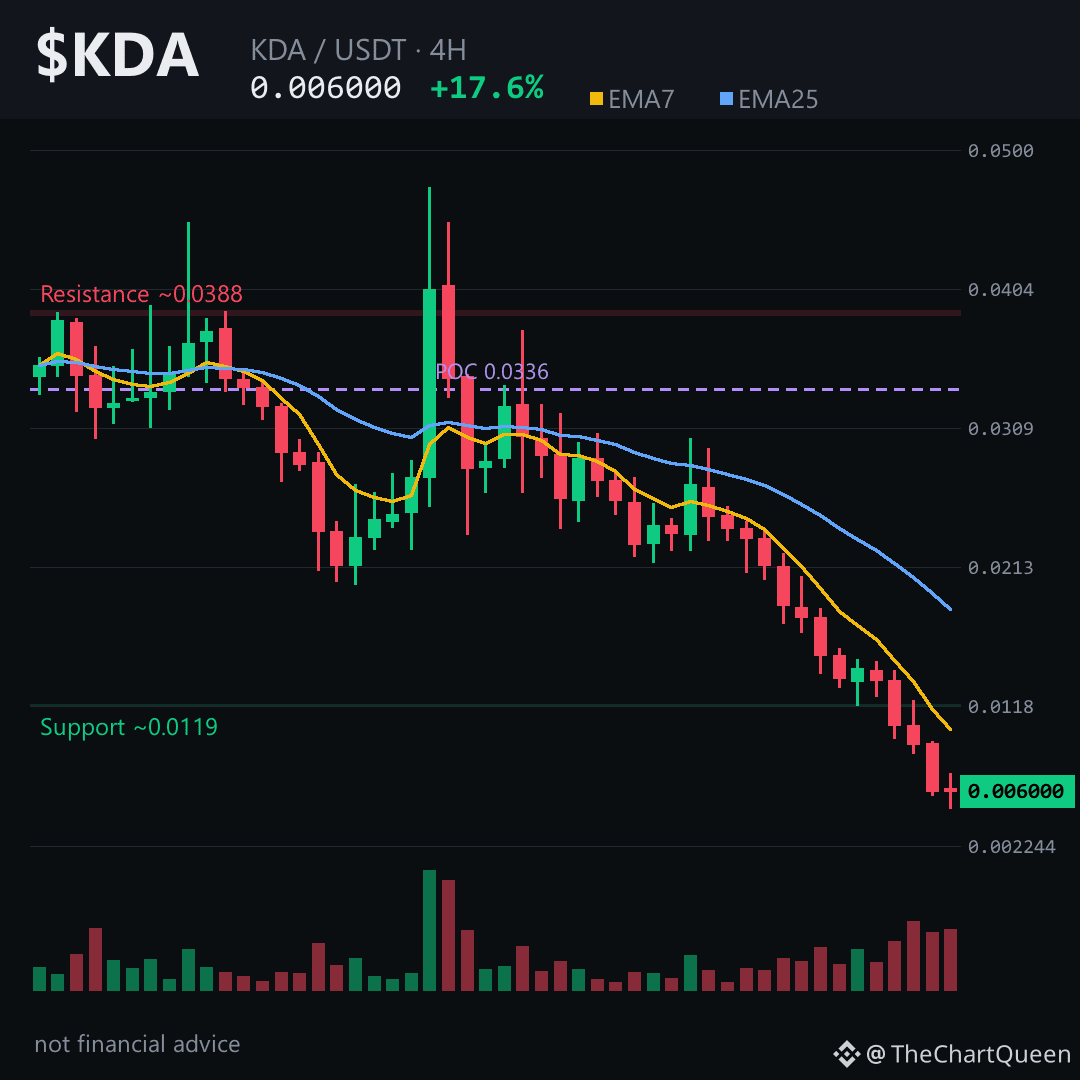
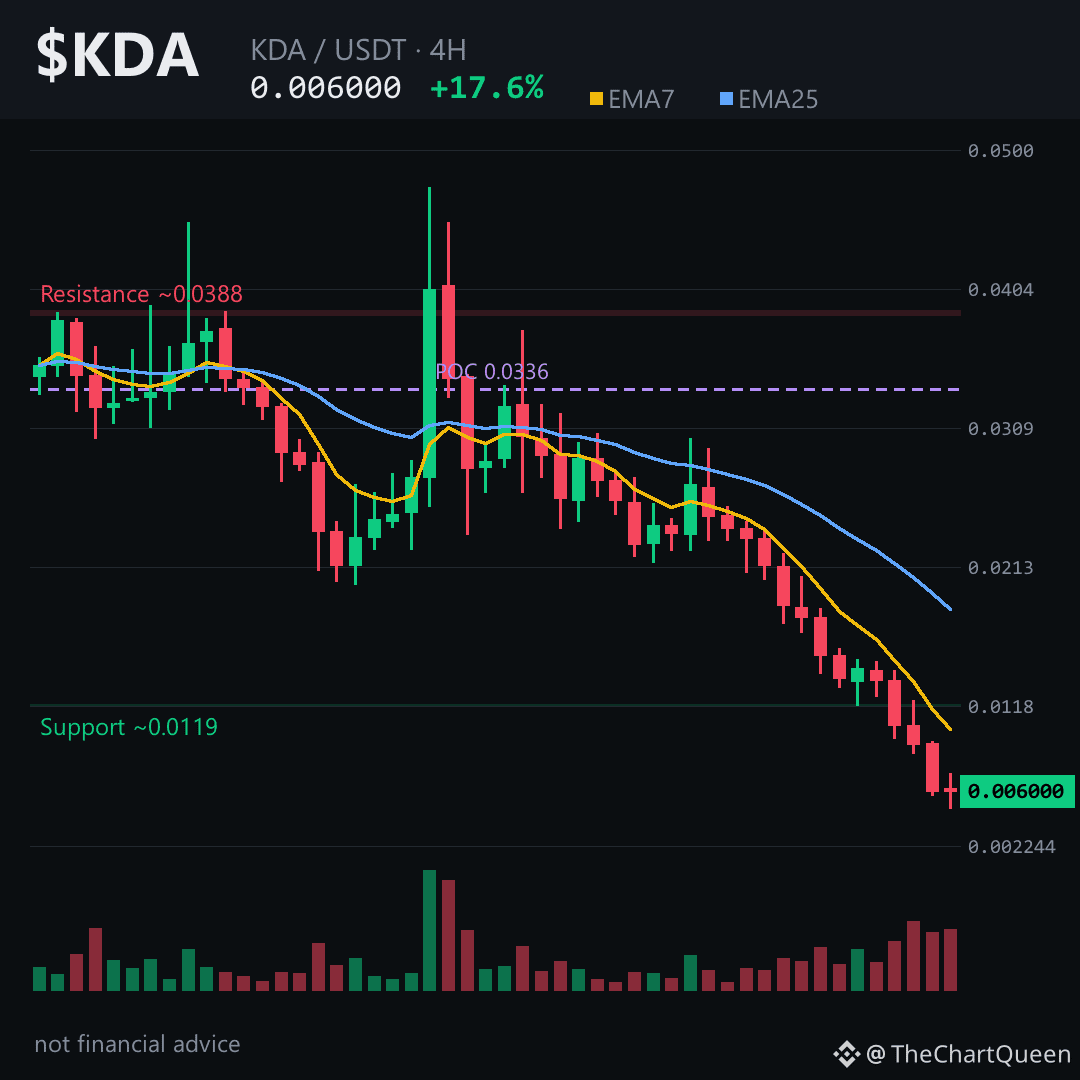
The 4h chart shows price clinging near 0.006 after slicing through every meaningful structure. RSI sits deep in the low 20s — oversold, but oversold in a downtrend often just means the selling isn't finished. EMA7 is still miles below EMA25, and eleven of the last twelve 4h candles are red. One green candle does not reverse that.
On the daily, the short EMA is barely a fraction of the long EMA — the gap is yawning. RSI near 17 says momentum is exhausted, but the unfilled bearish gap between roughly 0.0158 and 0.0217 still hangs overhead. That zone is a magnet only if buyers first prove they exist — and they have not.
The levels that matter are simple. If $KDA cannot reclaim ~0.0063 on a 4h close, the path of least resistance stays lower, toward 0.0055 and then possibly 0.0051. A close back above ~0.0066 would be the first honest sign this bounce has legs. Until then, it is a relief rally, not a reversal.
Futures are quiet — funding flat, open interest essentially zero. That is not conviction. That is a market holding its breath.
My read: the bounce is real but fragile. The trend above it is structurally broken on every timeframe that matters. The risk sits with anyone assuming the top-gainer label means the bottom is in.
Tap $KDA and look at the daily gap zone yourself — the chart tells the story faster than any post.
Follow me for the update when price either reclaims 0.0066 or loses the 0.0055 floor — that is the only fork that matters.
Which level are you trusting more, the 0.0063 reclaim or the 0.0055 breakdown? 👇
⚠️ Not financial advice. DYOR.
#KDA #Kadena #Crypto #BinanceSquare
+17.65% looks like a party until you notice the last red candle dropped 35% in four hours.
That is the whole story of $KDA right now: a bounce inside a collapse.
The 4h chart shows price clinging near 0.006 after slicing through every meaningful structure. RSI sits deep in the low 20s — oversold, but oversold in a downtrend often just means the selling isn't finished. EMA7 is still miles below EMA25, and eleven of the last twelve 4h candles are red. One green candle does not reverse that.
On the daily, the short EMA is barely a fraction of the long EMA — the gap is yawning. RSI near 17 says momentum is exhausted, but the unfilled bearish gap between roughly 0.0158 and 0.0217 still hangs overhead. That zone is a magnet only if buyers first prove they exist — and they have not.
The levels that matter are simple. If $KDA cannot reclaim ~0.0063 on a 4h close, the path of least resistance stays lower, toward 0.0055 and then possibly 0.0051. A close back above ~0.0066 would be the first honest sign this bounce has legs. Until then, it is a relief rally, not a reversal.
Futures are quiet — funding flat, open interest essentially zero. That is not conviction. That is a market holding its breath.
My read: the bounce is real but fragile. The trend above it is structurally broken on every timeframe that matters. The risk sits with anyone assuming the top-gainer label means the bottom is in.
Tap $KDA and look at the daily gap zone yourself — the chart tells the story faster than any post.
Follow me for the update when price either reclaims 0.0066 or loses the 0.0055 floor — that is the only fork that matters.
Which level are you trusting more, the 0.0063 reclaim or the 0.0055 breakdown? 👇
⚠️ Not financial advice. DYOR.
#KDA #Kadena #Crypto #BinanceSquare
That is the whole story of $KDA right now: a bounce inside a collapse.
The 4h chart shows price clinging near 0.006 after slicing through every meaningful structure. RSI sits deep in the low 20s — oversold, but oversold in a downtrend often just means the selling isn't finished. EMA7 is still miles below EMA25, and eleven of the last twelve 4h candles are red. One green candle does not reverse that.
On the daily, the short EMA is barely a fraction of the long EMA — the gap is yawning. RSI near 17 says momentum is exhausted, but the unfilled bearish gap between roughly 0.0158 and 0.0217 still hangs overhead. That zone is a magnet only if buyers first prove they exist — and they have not.
The levels that matter are simple. If $KDA cannot reclaim ~0.0063 on a 4h close, the path of least resistance stays lower, toward 0.0055 and then possibly 0.0051. A close back above ~0.0066 would be the first honest sign this bounce has legs. Until then, it is a relief rally, not a reversal.
Futures are quiet — funding flat, open interest essentially zero. That is not conviction. That is a market holding its breath.
My read: the bounce is real but fragile. The trend above it is structurally broken on every timeframe that matters. The risk sits with anyone assuming the top-gainer label means the bottom is in.
Tap $KDA and look at the daily gap zone yourself — the chart tells the story faster than any post.
Follow me for the update when price either reclaims 0.0066 or loses the 0.0055 floor — that is the only fork that matters.
Which level are you trusting more, the 0.0063 reclaim or the 0.0055 breakdown? 👇
⚠️ Not financial advice. DYOR.
#KDA #Kadena #Crypto #BinanceSquare
15
Log in to explore more content
Join global crypto users on Binance Square
⚡️ Get latest and useful information about crypto.
💬 Trusted by the world’s largest crypto exchange.
👍 Discover real insights from verified creators.
Email / Phone number
Trending Topics
1
#NvidiaLoses$2.7TrillionInMonthAndAHalf
8,880 views
89 Discussing
2
#CanBTCReboundAfterFallingBelow60K?
647,612 views
2,749 Discussing
3
#GlobalStocksFaceLongestLosingStreakSince2023
230,023 views
1,874 Discussing
4
#BlackRockIBITPostsRecord$541MSingleDayOutflow
23,715 views
74 Discussing
5
#AnthropicPlungesTowardIPOPriceonDay2
114,507 views
1,120 Discussing
6
#TwentyOneCapitalAdds172.25BTC
49,919 views
593 Discussing
7
#HKBillWouldExcludeTokenizedDepositsFromVirtualAssets
5,756 views
48 Discussing
8
#BNBDropsBelow540USDTWith8.46%DailyDecline
64,750 views
586 Discussing
9
#HKBillProposesHK$100KFineForUnauthorizedCryptoTitles
2,196 views
21 Discussing
10
#BitMineFaces$10.1BUnrealizedETHLoss
4,443 views
25 Discussing