
#btc
btc
9.4G views
61.6M Discussing
Hot
Latest


🟡 Bitcoin price wobbles ahead of Fed’s rate decision
Bitcoin (BTC) dipped as low as $59,500 on Binance ahead of tomorrow’s Federal Open Market Committee (FOMC) meeting. Market participants are bracing for a hawkish stance from the Federal Reserve (Fed), with expectations set for unchanged interest rates.
The CME FedWatch Tool indicates a mere 4.4% of economists predict a rate cut—the first in over a decade—while a dominant 95.6% anticipate rates to hold steady between 525-550 basis points.
According to The Kobeissi Letter, current market data indicates a 36% probability that there will be no interest rate cuts this year. Four months ago, the likelihood of maintaining current rates was only about 3%.
Expectations have also shifted to just one reduction this year. Previously, the market anticipated six rate cuts. Additionally, the probability of experiencing two or more rate cuts has diminished to 31%.
🔺 Stagflation risk
Amidst this financial climate, the US grapples with stagflation risks as inflation persists and economic growth slows.
The first quarter of 2024 saw GDP growth decelerate to 1.6%, falling short of the 2.2% forecast and down from the previous quarter’s 3.4%. Concurrently, the US Core PCE inflation index climbed from 2.0% to 3.7%.
Fed Chair Jerome Powell stated that recent data does not make the Fed more confident, suggesting a longer timeline to regain economic stability. He expressed belief in the adequacy of current policies to navigate the risks at hand, hinting at sustained high-interest rates without increases.
Bitcoin’s trajectory mirrored these economic uncertainties, dropping below $62,000 earlier in the week due to renewed stagflation worries.
A brief rally above $64,000 occurred with the launch of spot Bitcoin and Ethereum ETFs in Hong Kong yesterday, but the momentum was short-lived as investor caution set in ahead of the Fed’s key decision.
$BTC #BTC #Bitcoin
🟡 Bitcoin price wobbles ahead of Fed’s rate decision
Bitcoin (BTC) dipped as low as $59,500 on Binance ahead of tomorrow’s Federal Open Market Committee (FOMC) meeting. Market participants are bracing for a hawkish stance from the Federal Reserve (Fed), with expectations set for unchanged interest rates.
The CME FedWatch Tool indicates a mere 4.4% of economists predict a rate cut—the first in over a decade—while a dominant 95.6% anticipate rates to hold steady between 525-550 basis points.
According to The Kobeissi Letter, current market data indicates a 36% probability that there will be no interest rate cuts this year. Four months ago, the likelihood of maintaining current rates was only about 3%.
Expectations have also shifted to just one reduction this year. Previously, the market anticipated six rate cuts. Additionally, the probability of experiencing two or more rate cuts has diminished to 31%.
🔺 Stagflation risk
Amidst this financial climate, the US grapples with stagflation risks as inflation persists and economic growth slows.
The first quarter of 2024 saw GDP growth decelerate to 1.6%, falling short of the 2.2% forecast and down from the previous quarter’s 3.4%. Concurrently, the US Core PCE inflation index climbed from 2.0% to 3.7%.
Fed Chair Jerome Powell stated that recent data does not make the Fed more confident, suggesting a longer timeline to regain economic stability. He expressed belief in the adequacy of current policies to navigate the risks at hand, hinting at sustained high-interest rates without increases.
Bitcoin’s trajectory mirrored these economic uncertainties, dropping below $62,000 earlier in the week due to renewed stagflation worries.
A brief rally above $64,000 occurred with the launch of spot Bitcoin and Ethereum ETFs in Hong Kong yesterday, but the momentum was short-lived as investor caution set in ahead of the Fed’s key decision.
$BTC #BTC #Bitcoin
Bitcoin (BTC) dipped as low as $59,500 on Binance ahead of tomorrow’s Federal Open Market Committee (FOMC) meeting. Market participants are bracing for a hawkish stance from the Federal Reserve (Fed), with expectations set for unchanged interest rates.
The CME FedWatch Tool indicates a mere 4.4% of economists predict a rate cut—the first in over a decade—while a dominant 95.6% anticipate rates to hold steady between 525-550 basis points.
According to The Kobeissi Letter, current market data indicates a 36% probability that there will be no interest rate cuts this year. Four months ago, the likelihood of maintaining current rates was only about 3%.
Expectations have also shifted to just one reduction this year. Previously, the market anticipated six rate cuts. Additionally, the probability of experiencing two or more rate cuts has diminished to 31%.
🔺 Stagflation risk
Amidst this financial climate, the US grapples with stagflation risks as inflation persists and economic growth slows.
The first quarter of 2024 saw GDP growth decelerate to 1.6%, falling short of the 2.2% forecast and down from the previous quarter’s 3.4%. Concurrently, the US Core PCE inflation index climbed from 2.0% to 3.7%.
Fed Chair Jerome Powell stated that recent data does not make the Fed more confident, suggesting a longer timeline to regain economic stability. He expressed belief in the adequacy of current policies to navigate the risks at hand, hinting at sustained high-interest rates without increases.
Bitcoin’s trajectory mirrored these economic uncertainties, dropping below $62,000 earlier in the week due to renewed stagflation worries.
A brief rally above $64,000 occurred with the launch of spot Bitcoin and Ethereum ETFs in Hong Kong yesterday, but the momentum was short-lived as investor caution set in ahead of the Fed’s key decision.
$BTC #BTC #Bitcoin

Perla Pytko N4jk:
Reply
138
58
398
296.5k

·
--
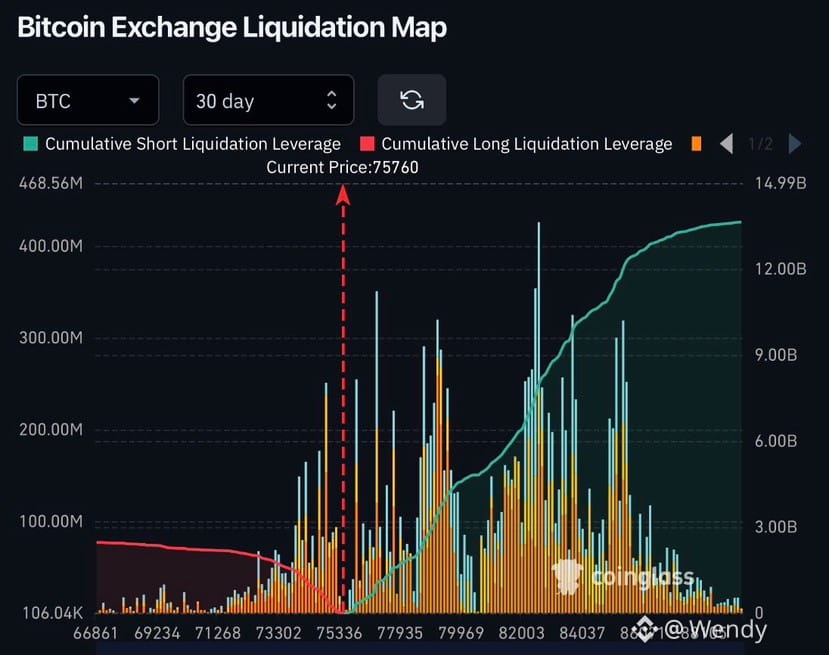
🚨 $13.6 BILLION IN BITCOIN SHORTS AT RISK!
With $BTC trading around $75,760, CoinGlass liquidation data shows:
🟢 $13.6B in potential short liquidations above the current price.
🔴 $2.4B in potential long liquidations below.
That’s nearly 5.7x more short liquidation leverage to the upside.
Could a massive short squeeze be coming? 👀
#Bitcoin #BTC $BTC
{future}(BTCUSDT)
🚨 $13.6 BILLION IN BITCOIN SHORTS AT RISK!
With $BTC trading around $75,760, CoinGlass liquidation data shows:
🟢 $13.6B in potential short liquidations above the current price.
🔴 $2.4B in potential long liquidations below.
That’s nearly 5.7x more short liquidation leverage to the upside.
Could a massive short squeeze be coming? 👀
#Bitcoin #BTC $BTC
With $BTC trading around $75,760, CoinGlass liquidation data shows:
🟢 $13.6B in potential short liquidations above the current price.
🔴 $2.4B in potential long liquidations below.
That’s nearly 5.7x more short liquidation leverage to the upside.
Could a massive short squeeze be coming? 👀
#Bitcoin #BTC $BTC
Tradeassi_com:
TradeAssi whale alerts: one HL whale closed a ~$105M BTC short opened near $78.6K at 8:39 PM, plus ETH, XRP and SOL shorts, with BTC now around $75.6K. Took about 4% off the top on a Saturday night.
3
6
974

·
--
Bullish
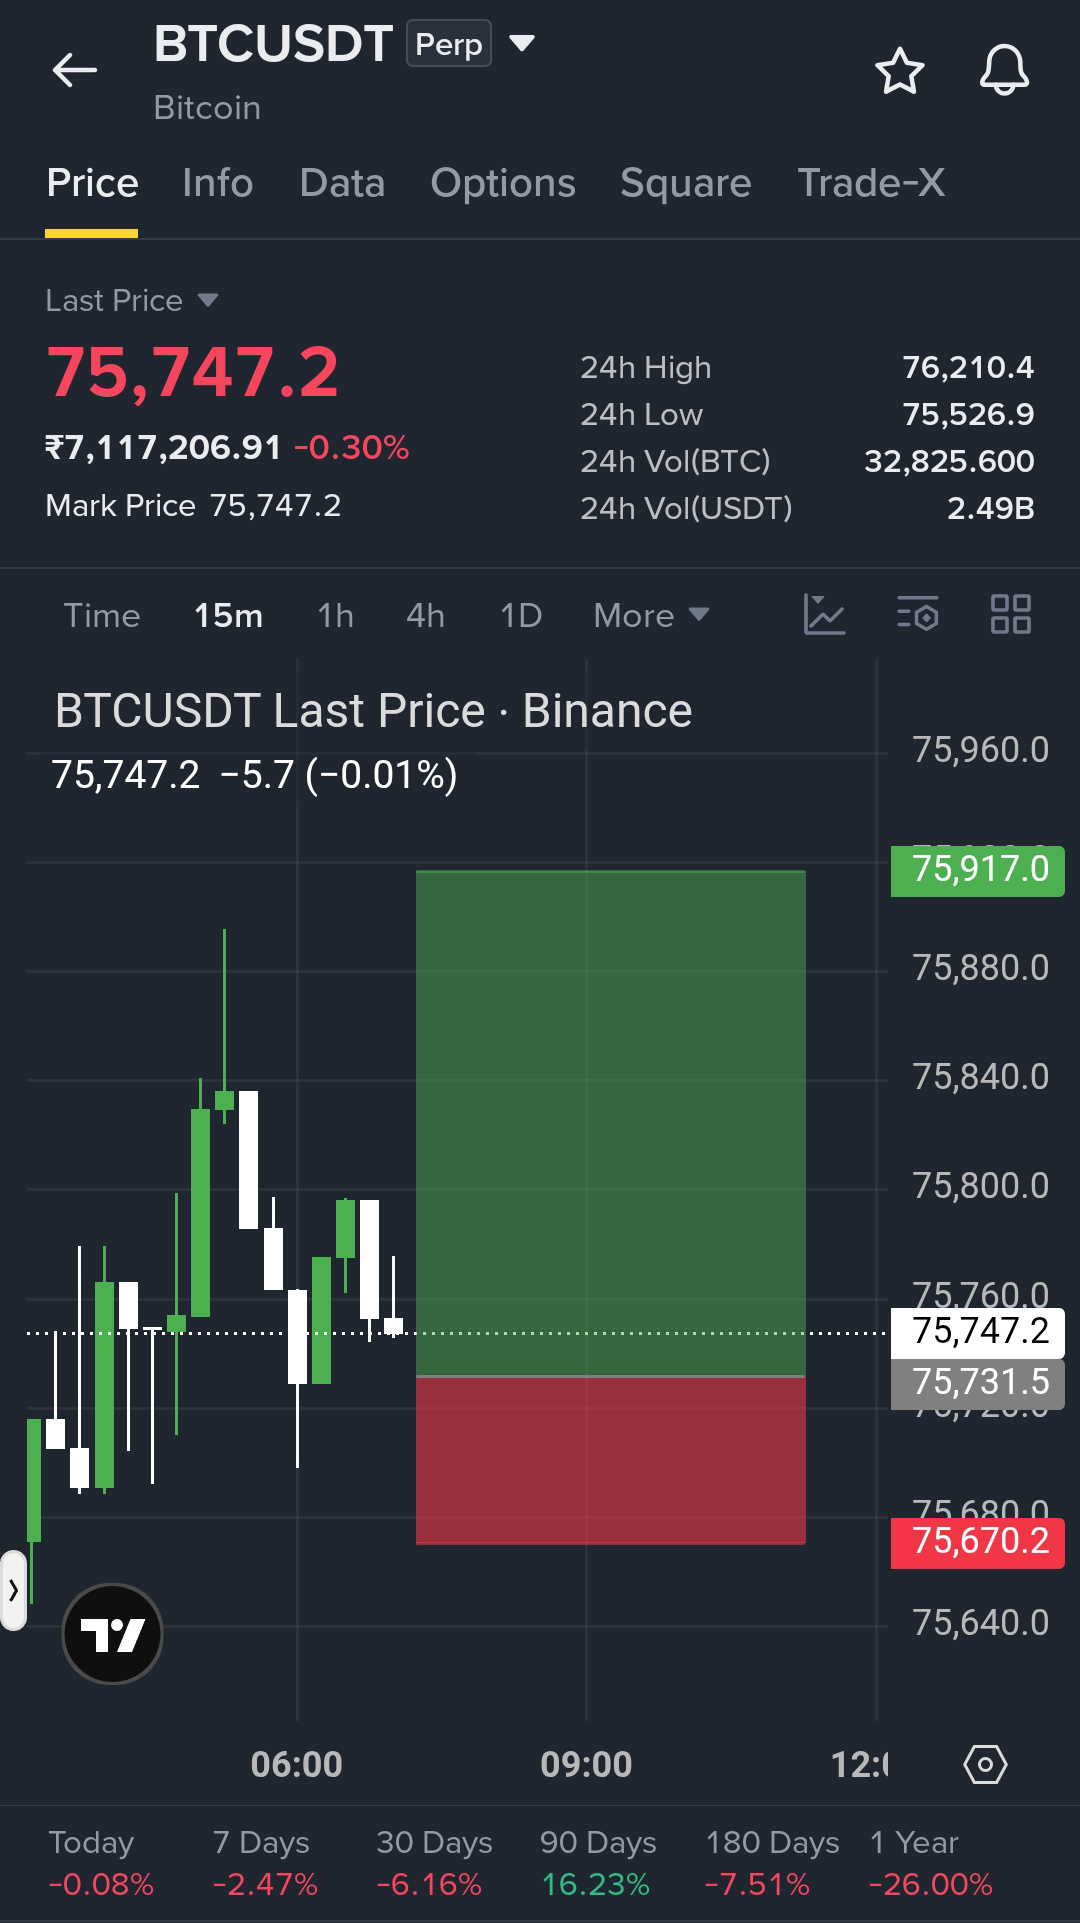
#BTC LONG ALERT 🤯 Buyers are trying to regain control. I’m taking the Long here 👇
Entry: 75,731.5
Stop-loss: 75,670.2
TP1: 75,793.3
TP2: 75,855.2
TP3: 75,917.0
Click here to trade 👇⬆️⬆️ Long.. With meeee...👇⬆️ $BTC
{future}(BTCUSDT)
#BTC LONG ALERT 🤯 Buyers are trying to regain control. I’m taking the Long here 👇
Entry: 75,731.5
Stop-loss: 75,670.2
TP1: 75,793.3
TP2: 75,855.2
TP3: 75,917.0
Click here to trade 👇⬆️⬆️ Long.. With meeee...👇⬆️ $BTC
Entry: 75,731.5
Stop-loss: 75,670.2
TP1: 75,793.3
TP2: 75,855.2
TP3: 75,917.0
Click here to trade 👇⬆️⬆️ Long.. With meeee...👇⬆️ $BTC
Yazdani 777:
all TP done but you not shear in group
2
4
239

*Good Morning Crypto Family ☀️*
Back to my plan again.
No panic, No rush.
My plan is simple:
$180 in Spot BTC / ETH, holding for 1 year.
2 posts daily on Square, that's it.
Market up or down, I don't care.
I am not a seller, I am a holder. 💎
What are you holding today?
Let me know in comments.
#BTC #ETH #CryptoHunterPK786
*Good Morning Crypto Family ☀️*
Back to my plan again.
No panic, No rush.
My plan is simple:
$180 in Spot BTC / ETH, holding for 1 year.
2 posts daily on Square, that's it.
Market up or down, I don't care.
I am not a seller, I am a holder. 💎
What are you holding today?
Let me know in comments.
#BTC #ETH #CryptoHunterPK786
Back to my plan again.
No panic, No rush.
My plan is simple:
$180 in Spot BTC / ETH, holding for 1 year.
2 posts daily on Square, that's it.
Market up or down, I don't care.
I am not a seller, I am a holder. 💎
What are you holding today?
Let me know in comments.
#BTC #ETH #CryptoHunterPK786
31

·
--
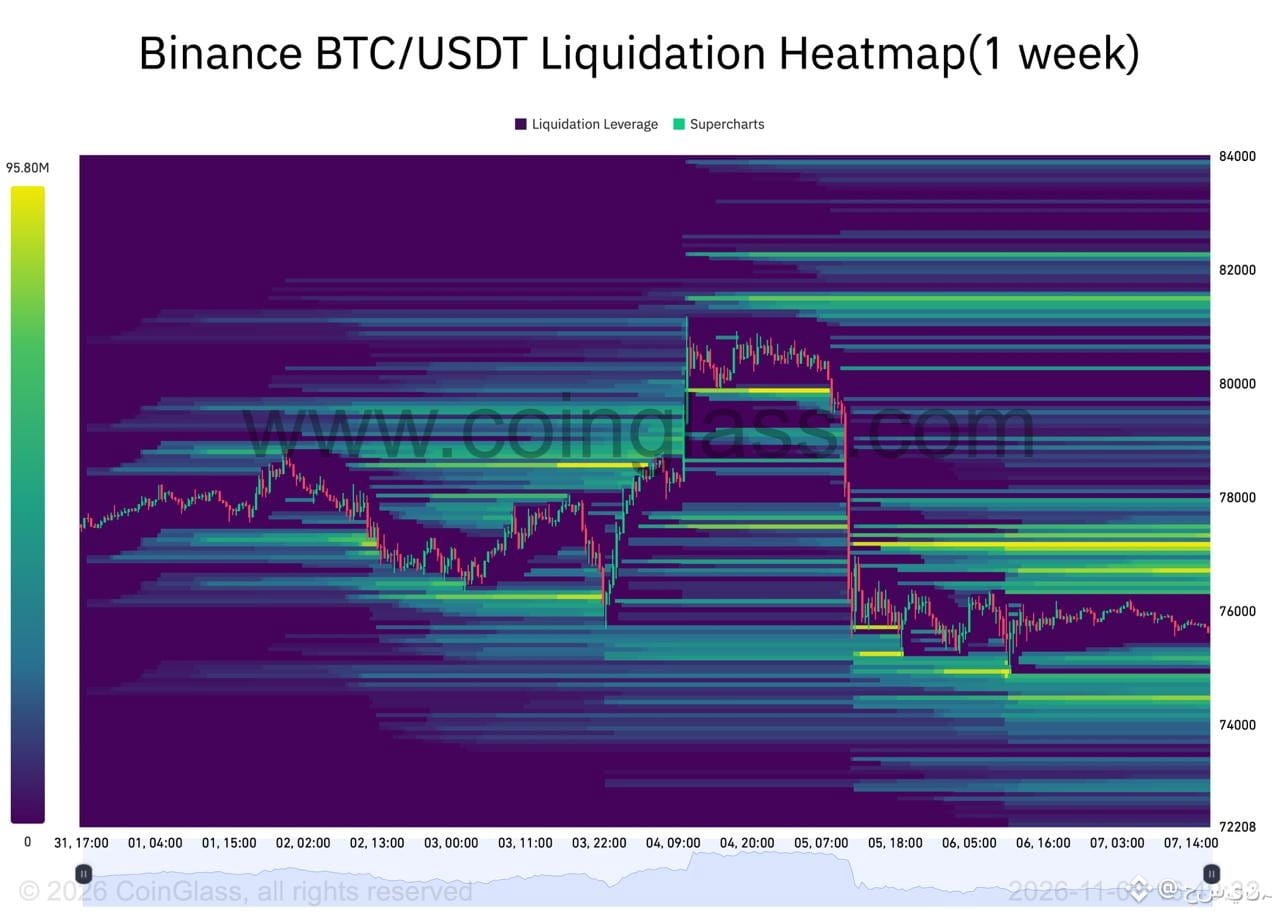
$BTC is trading near 75,750 after the November 5 dump, consolidating just above the 75,000 wick low on the 1 week liquidation heatmap, with the densest cluster stacked above near 77,150 to 77,200, a second near 76,700, and thinner pockets below near 74,450.
Price tends to gravitate toward these pockets, so a reclaim of 76,300 opens the door toward 76,700 and then 77,150 to 77,200. Lose 75,000 and the thin liquidity below leaves room for a move toward 74,450. #BTC
{future}(BTCUSDT)
$BTC is trading near 75,750 after the November 5 dump, consolidating just above the 75,000 wick low on the 1 week liquidation heatmap, with the densest cluster stacked above near 77,150 to 77,200, a second near 76,700, and thinner pockets below near 74,450.
Price tends to gravitate toward these pockets, so a reclaim of 76,300 opens the door toward 76,700 and then 77,150 to 77,200. Lose 75,000 and the thin liquidity below leaves room for a move toward 74,450. #BTC
Price tends to gravitate toward these pockets, so a reclaim of 76,300 opens the door toward 76,700 and then 77,150 to 77,200. Lose 75,000 and the thin liquidity below leaves room for a move toward 74,450. #BTC
1
122

·
--
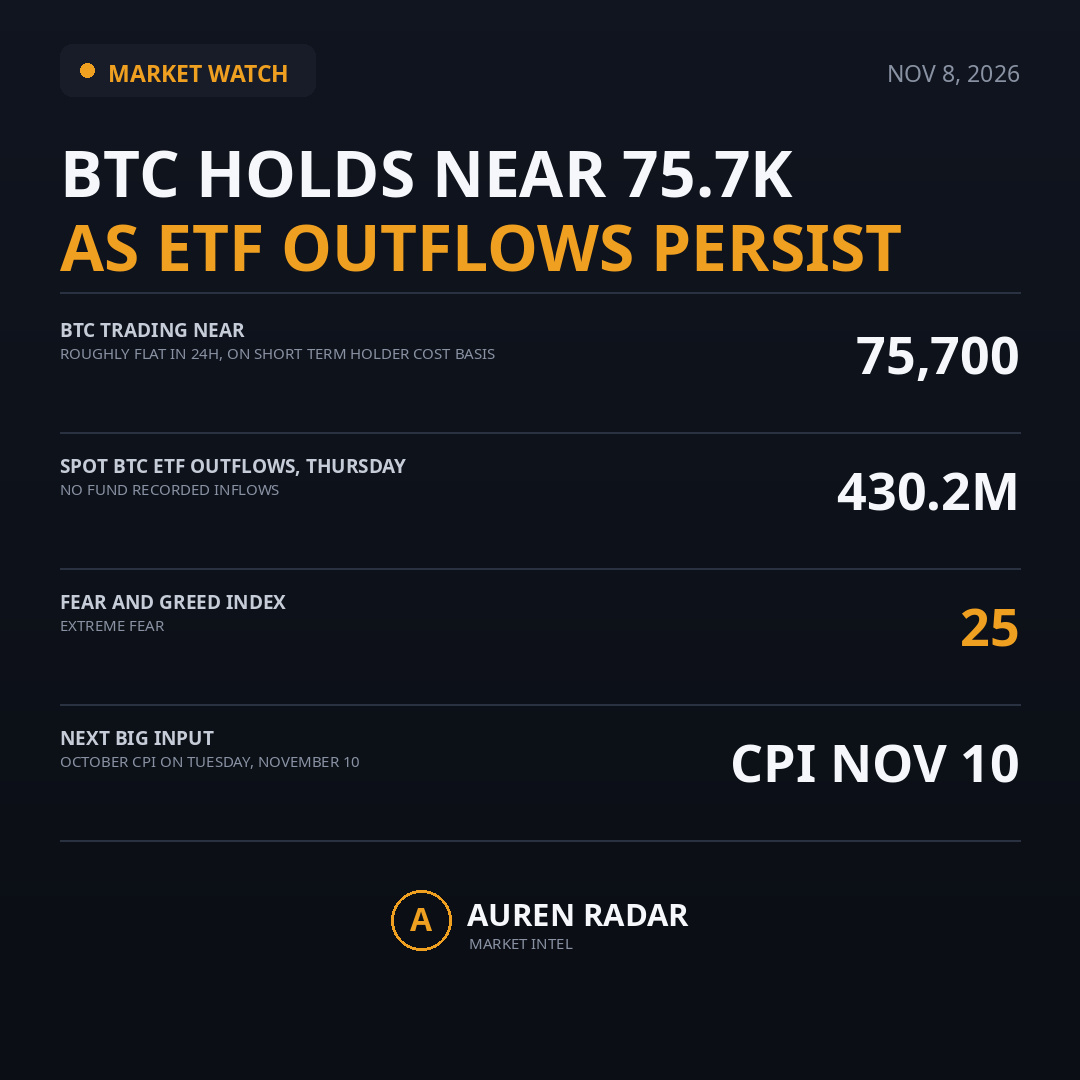
📡 BTC Holds Near 75.7K As ETF Outflows Persist
BTC trades near 75,700, roughly flat in 24h, sitting right on short term holder cost basis near the same level. ETH holds near 2,235 while SOL slips toward 89.
Spot BTC ETFs saw 430.2M in net outflows on Thursday, with no fund recording inflows, and the Fear and Greed Index sits at 25 in extreme fear.
FinCEN moved to cut MEXC off from the US financial system over alleged 16B in illicit flows, a reminder that regulatory pressure is still in play.
👀 Support near 75,700 and 73,200, resistance near 76,000 and 80,000. October CPI on Tuesday is the next big test.
📌 Personal opinion, not financial advice. DYOR.
#BTC #Crypto #CryptoMarket #Bitcoin
$BTCUSDT $ETHUSDT $SOLUSDT
📡 BTC Holds Near 75.7K As ETF Outflows Persist
BTC trades near 75,700, roughly flat in 24h, sitting right on short term holder cost basis near the same level. ETH holds near 2,235 while SOL slips toward 89.
Spot BTC ETFs saw 430.2M in net outflows on Thursday, with no fund recording inflows, and the Fear and Greed Index sits at 25 in extreme fear.
FinCEN moved to cut MEXC off from the US financial system over alleged 16B in illicit flows, a reminder that regulatory pressure is still in play.
👀 Support near 75,700 and 73,200, resistance near 76,000 and 80,000. October CPI on Tuesday is the next big test.
📌 Personal opinion, not financial advice. DYOR.
#BTC #Crypto #CryptoMarket #Bitcoin
$BTCUSDT $ETHUSDT $SOLUSDT
BTC trades near 75,700, roughly flat in 24h, sitting right on short term holder cost basis near the same level. ETH holds near 2,235 while SOL slips toward 89.
Spot BTC ETFs saw 430.2M in net outflows on Thursday, with no fund recording inflows, and the Fear and Greed Index sits at 25 in extreme fear.
FinCEN moved to cut MEXC off from the US financial system over alleged 16B in illicit flows, a reminder that regulatory pressure is still in play.
👀 Support near 75,700 and 73,200, resistance near 76,000 and 80,000. October CPI on Tuesday is the next big test.
📌 Personal opinion, not financial advice. DYOR.
#BTC #Crypto #CryptoMarket #Bitcoin
$BTCUSDT $ETHUSDT $SOLUSDT
1
711

·
--
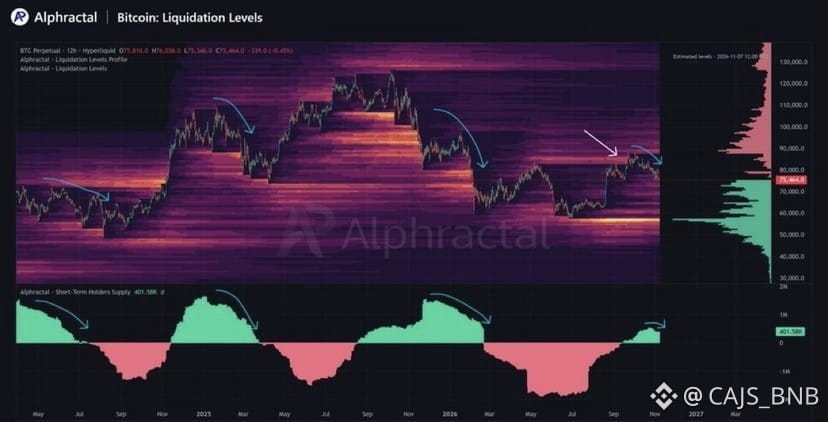
Bearish
$BTC: When Leverage Replaces Conviction, Risk Begins to Build
Bitcoin's biggest vulnerability may not be its price. It could be the behavior of the traders behind it.
Recent market observations suggest weakening short-term holder accumulation, with the 90-day supply delta showing signs of declining conviction.
Meanwhile, reported long liquidations over the past 30 days highlight the risks of aggressive leveraged positioning.
The concern is a potential shift from spot accumulation toward speculative exposure, where traders seek faster returns while accepting greater liquidation risk.
However, these indicators alone cannot confirm that leverage is replacing genuine demand.
A sustainable rally needs more than speculation. It needs underlying demand.
Are traders building the next Bitcoin rally, or creating the conditions for another liquidation event?
$BTC
{spot}(BTCUSDT)
#BTC #bitcoin #CryptoVision
$BTC : When Leverage Replaces Conviction, Risk Begins to Build
Bitcoin's biggest vulnerability may not be its price. It could be the behavior of the traders behind it.
Recent market observations suggest weakening short-term holder accumulation, with the 90-day supply delta showing signs of declining conviction.
Meanwhile, reported long liquidations over the past 30 days highlight the risks of aggressive leveraged positioning.
The concern is a potential shift from spot accumulation toward speculative exposure, where traders seek faster returns while accepting greater liquidation risk.
However, these indicators alone cannot confirm that leverage is replacing genuine demand.
A sustainable rally needs more than speculation. It needs underlying demand.
Are traders building the next Bitcoin rally, or creating the conditions for another liquidation event?
$BTC
#BTC #bitcoin #CryptoVision
Bitcoin's biggest vulnerability may not be its price. It could be the behavior of the traders behind it.
Recent market observations suggest weakening short-term holder accumulation, with the 90-day supply delta showing signs of declining conviction.
Meanwhile, reported long liquidations over the past 30 days highlight the risks of aggressive leveraged positioning.
The concern is a potential shift from spot accumulation toward speculative exposure, where traders seek faster returns while accepting greater liquidation risk.
However, these indicators alone cannot confirm that leverage is replacing genuine demand.
A sustainable rally needs more than speculation. It needs underlying demand.
Are traders building the next Bitcoin rally, or creating the conditions for another liquidation event?
$BTC
#BTC #bitcoin #CryptoVision

122

🚨 Daily Crypto Quick Bite | Nov 8, 2026
$BTC
{future}(BTCUSDT)
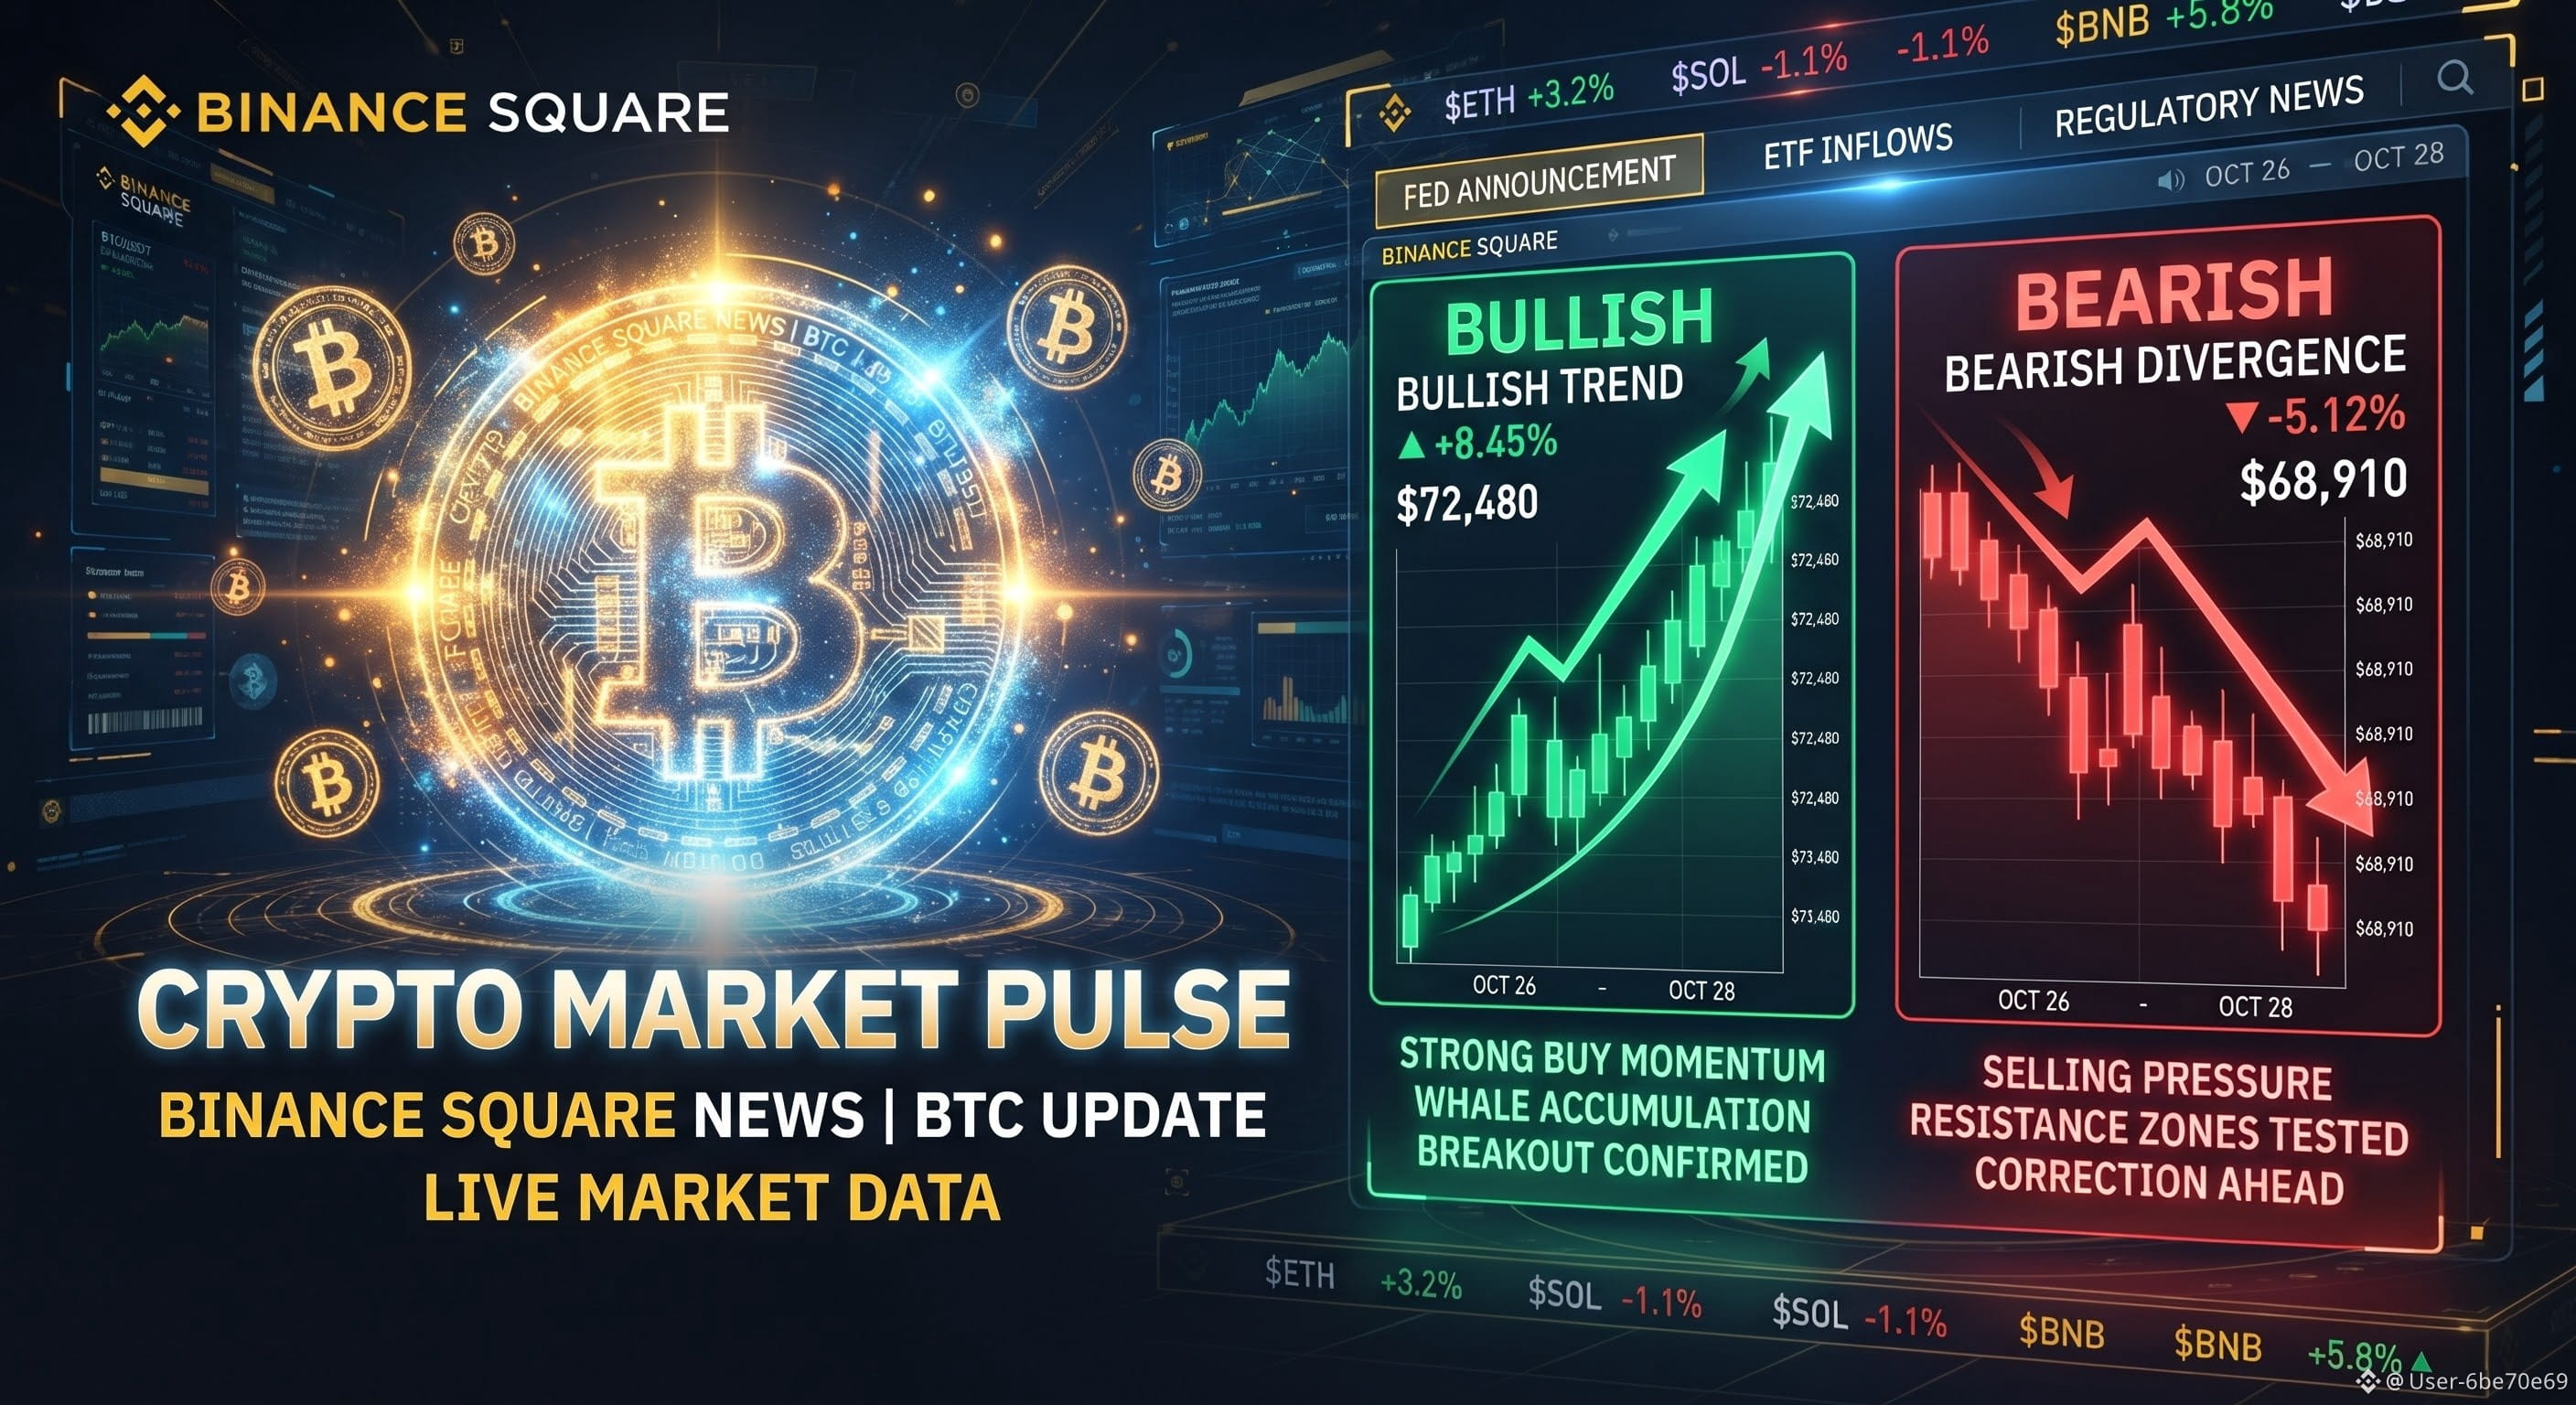
Update: Holding steady near $76,000 after touching a 7-week low. S&P 500 correlation hits its highest level since 2020.
📊 Liquidations: $72.6M total wiped out ($48M in longs).
🏦 ETF Flows: U.S. Spot Bitcoin ETFs saw $412M in net outflows on Nov 6.
💡 Buying the dip or staying safe? Drop your thoughts below!
#Binance #bitcoin #CryptoNews #BTC $BTC
🚨 Daily Crypto Quick Bite | Nov 8, 2026
$BTC
Update: Holding steady near $76,000 after touching a 7-week low. S&P 500 correlation hits its highest level since 2020.
📊 Liquidations: $72.6M total wiped out ($48M in longs).
🏦 ETF Flows: U.S. Spot Bitcoin ETFs saw $412M in net outflows on Nov 6.
💡 Buying the dip or staying safe? Drop your thoughts below!
#Binance #bitcoin #CryptoNews #BTC $BTC
$BTC
Update: Holding steady near $76,000 after touching a 7-week low. S&P 500 correlation hits its highest level since 2020.
📊 Liquidations: $72.6M total wiped out ($48M in longs).
🏦 ETF Flows: U.S. Spot Bitcoin ETFs saw $412M in net outflows on Nov 6.
💡 Buying the dip or staying safe? Drop your thoughts below!
#Binance #bitcoin #CryptoNews #BTC $BTC
16

Article
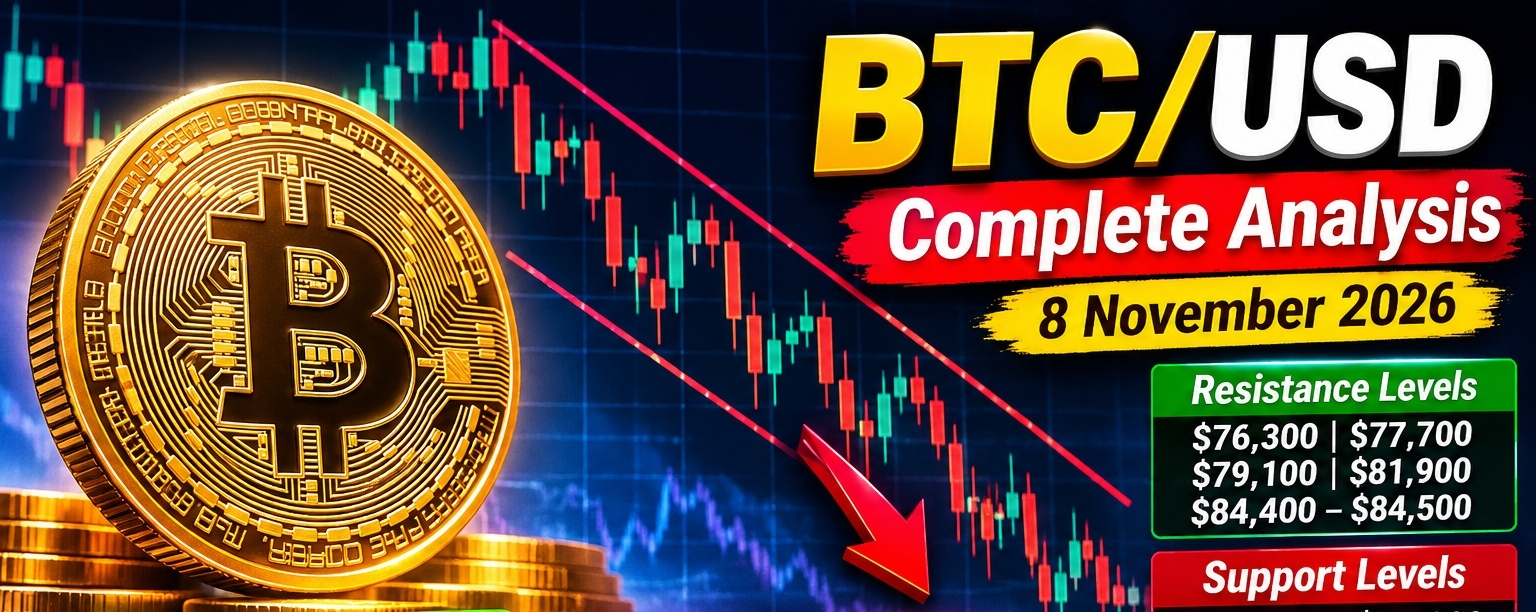
BTC/USD Complete Analysis — 8 November 2026$BTC /USD Complete Analysis — 8 November 2026
**Current price:** around **$75,800**. $BTC is sitting near a major support zone after a sharp weekly decline. citeturn196100search0turn196100search3
### 📊 Market Structure $BTC
{spot}(BTCUSDT)
**Short-term:** 🔴 Bearish
**4H:** Bearish
**Daily:** Bearish
**Weekly:** Neutral-to-bullish / corrective
The important point is that the **short-term trend is bearish while the longer-term weekly structure has not completely broken down**. Current technical data shows RSI around **38**, indicating weak momentum but not yet deeply oversold. citeturn196100search0
### 🔑 Key Support Levels
| Level | Importance |
|---|---|
| **$75,150–$75,200** | 🔥 Immediate support |
| **$74,000** | Strong secondary support |
| **$72,300** | 🔥 Major structural support |
| **$70,300** | Major downside level |
| **$65,000** | Deep correction zone |
The $75.1K area is particularly important because several technical measures converge there. A daily close below it would increase the probability of another move lower. citeturn196100search0
### 🚧 Resistance Levels
| Level | Importance |
|---|---|
| **$76,300** | Immediate resistance |
| **$77,700** | 🔥 Strong resistance |
| **$79,100** | Key breakout test |
| **$81,900** | Major resistance |
| **$84,400–$84,500** | Major bullish target/resistance |
A recovery above **$77,700** would be the first meaningful improvement. A daily close above **$79,100–$80,000** would substantially strengthen the bullish reversal case. citeturn196100search0turn196100news15
### 📉 Why BTC Is Under Pressure
Bitcoin lost roughly **3.2% during the Nov. 2–6 week**, while U.S. spot Bitcoin ETFs recorded about **$1.28 billion of outflows**. The sharp equity-market selloff also pressured BTC, with Nasdaq falling about 5.5% on the key risk-off session. citeturn196100search2turn196100search3
So the current weakness appears to be a combination of:
- ETF outflows
- Risk-off conditions in U.S. equities
- High leverage/liquidations
- Weak short-term momentum
- BTC remaining below important moving averages
### 🟢 Bullish Scenario
If BTC holds **$75,150–$75,200** and buyers push it above **$76,300**, the next targets are:
**$77,700 → $79,100 → $81,900 → $84,400**
A sustained daily close above **$79,100–$80,000** would make the recovery considerably more convincing.
### 🔴 Bearish Scenario
If BTC loses **$75,150** on a confirmed daily close:
**$74,000 → $72,300 → $70,300**
becomes the likely downside path.
A decisive break below **$72,300** would materially weaken the broader structure and could open a deeper correction toward the **$65K area**. citeturn196100search0
### 🎯 Trading Bias
**Current bias: 🔴 Bearish / Sell-the-rally**
I would avoid treating the current price as a confirmed bottom. The strongest evidence of a reversal would be:
**$75K holds → $76.3K reclaimed → $77.7K broken → $79.1K+ daily close.**
Until that happens, rallies into **$76K–$78K** can still face significant selling pressure.
**Important:** These are technical scenarios, not guaranteed predictions. BTC remains highly volatile.
📈 Monitor BTC/USD daily Tap to set up
If you want, I can also give you **BTC/USD entry, stop-loss, and take-profit levels for a short-term trade**.
#BTC #BTC走势分析 #Binance #TrendingTopic
BTC/USD Complete Analysis — 8 November 2026
$BTC /USD Complete Analysis — 8 November 2026
**Current price:** around **$75,800**. $BTC is sitting near a major support zone after a sharp weekly decline. citeturn196100search0turn196100search3
### 📊 Market Structure $BTC
**Short-term:** 🔴 Bearish
**4H:** Bearish
**Daily:** Bearish
**Weekly:** Neutral-to-bullish / corrective
The important point is that the **short-term trend is bearish while the longer-term weekly structure has not completely broken down**. Current technical data shows RSI around **38**, indicating weak momentum but not yet deeply oversold. citeturn196100search0
### 🔑 Key Support Levels
| Level | Importance |
|---|---|
| **$75,150–$75,200** | 🔥 Immediate support |
| **$74,000** | Strong secondary support |
| **$72,300** | 🔥 Major structural support |
| **$70,300** | Major downside level |
| **$65,000** | Deep correction zone |
The $75.1K area is particularly important because several technical measures converge there. A daily close below it would increase the probability of another move lower. citeturn196100search0
### 🚧 Resistance Levels
| Level | Importance |
|---|---|
| **$76,300** | Immediate resistance |
| **$77,700** | 🔥 Strong resistance |
| **$79,100** | Key breakout test |
| **$81,900** | Major resistance |
| **$84,400–$84,500** | Major bullish target/resistance |
A recovery above **$77,700** would be the first meaningful improvement. A daily close above **$79,100–$80,000** would substantially strengthen the bullish reversal case. citeturn196100search0turn196100news15
### 📉 Why BTC Is Under Pressure
Bitcoin lost roughly **3.2% during the Nov. 2–6 week**, while U.S. spot Bitcoin ETFs recorded about **$1.28 billion of outflows**. The sharp equity-market selloff also pressured BTC, with Nasdaq falling about 5.5% on the key risk-off session. citeturn196100search2turn196100search3
So the current weakness appears to be a combination of:
- ETF outflows
- Risk-off conditions in U.S. equities
- High leverage/liquidations
- Weak short-term momentum
- BTC remaining below important moving averages
### 🟢 Bullish Scenario
If BTC holds **$75,150–$75,200** and buyers push it above **$76,300**, the next targets are:
**$77,700 → $79,100 → $81,900 → $84,400**
A sustained daily close above **$79,100–$80,000** would make the recovery considerably more convincing.
### 🔴 Bearish Scenario
If BTC loses **$75,150** on a confirmed daily close:
**$74,000 → $72,300 → $70,300**
becomes the likely downside path.
A decisive break below **$72,300** would materially weaken the broader structure and could open a deeper correction toward the **$65K area**. citeturn196100search0
### 🎯 Trading Bias
**Current bias: 🔴 Bearish / Sell-the-rally**
I would avoid treating the current price as a confirmed bottom. The strongest evidence of a reversal would be:
**$75K holds → $76.3K reclaimed → $77.7K broken → $79.1K+ daily close.**
Until that happens, rallies into **$76K–$78K** can still face significant selling pressure.
**Important:** These are technical scenarios, not guaranteed predictions. BTC remains highly volatile.
📈 Monitor BTC/USD daily Tap to set up
If you want, I can also give you **BTC/USD entry, stop-loss, and take-profit levels for a short-term trade**.
#BTC #BTC走势分析 #Binance #TrendingTopic
**Current price:** around **$75,800**. $BTC is sitting near a major support zone after a sharp weekly decline. citeturn196100search0turn196100search3
### 📊 Market Structure $BTC
**Short-term:** 🔴 Bearish
**4H:** Bearish
**Daily:** Bearish
**Weekly:** Neutral-to-bullish / corrective
The important point is that the **short-term trend is bearish while the longer-term weekly structure has not completely broken down**. Current technical data shows RSI around **38**, indicating weak momentum but not yet deeply oversold. citeturn196100search0
### 🔑 Key Support Levels
| Level | Importance |
|---|---|
| **$75,150–$75,200** | 🔥 Immediate support |
| **$74,000** | Strong secondary support |
| **$72,300** | 🔥 Major structural support |
| **$70,300** | Major downside level |
| **$65,000** | Deep correction zone |
The $75.1K area is particularly important because several technical measures converge there. A daily close below it would increase the probability of another move lower. citeturn196100search0
### 🚧 Resistance Levels
| Level | Importance |
|---|---|
| **$76,300** | Immediate resistance |
| **$77,700** | 🔥 Strong resistance |
| **$79,100** | Key breakout test |
| **$81,900** | Major resistance |
| **$84,400–$84,500** | Major bullish target/resistance |
A recovery above **$77,700** would be the first meaningful improvement. A daily close above **$79,100–$80,000** would substantially strengthen the bullish reversal case. citeturn196100search0turn196100news15
### 📉 Why BTC Is Under Pressure
Bitcoin lost roughly **3.2% during the Nov. 2–6 week**, while U.S. spot Bitcoin ETFs recorded about **$1.28 billion of outflows**. The sharp equity-market selloff also pressured BTC, with Nasdaq falling about 5.5% on the key risk-off session. citeturn196100search2turn196100search3
So the current weakness appears to be a combination of:
- ETF outflows
- Risk-off conditions in U.S. equities
- High leverage/liquidations
- Weak short-term momentum
- BTC remaining below important moving averages
### 🟢 Bullish Scenario
If BTC holds **$75,150–$75,200** and buyers push it above **$76,300**, the next targets are:
**$77,700 → $79,100 → $81,900 → $84,400**
A sustained daily close above **$79,100–$80,000** would make the recovery considerably more convincing.
### 🔴 Bearish Scenario
If BTC loses **$75,150** on a confirmed daily close:
**$74,000 → $72,300 → $70,300**
becomes the likely downside path.
A decisive break below **$72,300** would materially weaken the broader structure and could open a deeper correction toward the **$65K area**. citeturn196100search0
### 🎯 Trading Bias
**Current bias: 🔴 Bearish / Sell-the-rally**
I would avoid treating the current price as a confirmed bottom. The strongest evidence of a reversal would be:
**$75K holds → $76.3K reclaimed → $77.7K broken → $79.1K+ daily close.**
Until that happens, rallies into **$76K–$78K** can still face significant selling pressure.
**Important:** These are technical scenarios, not guaranteed predictions. BTC remains highly volatile.
📈 Monitor BTC/USD daily Tap to set up
If you want, I can also give you **BTC/USD entry, stop-loss, and take-profit levels for a short-term trade**.
#BTC #BTC走势分析 #Binance #TrendingTopic
83

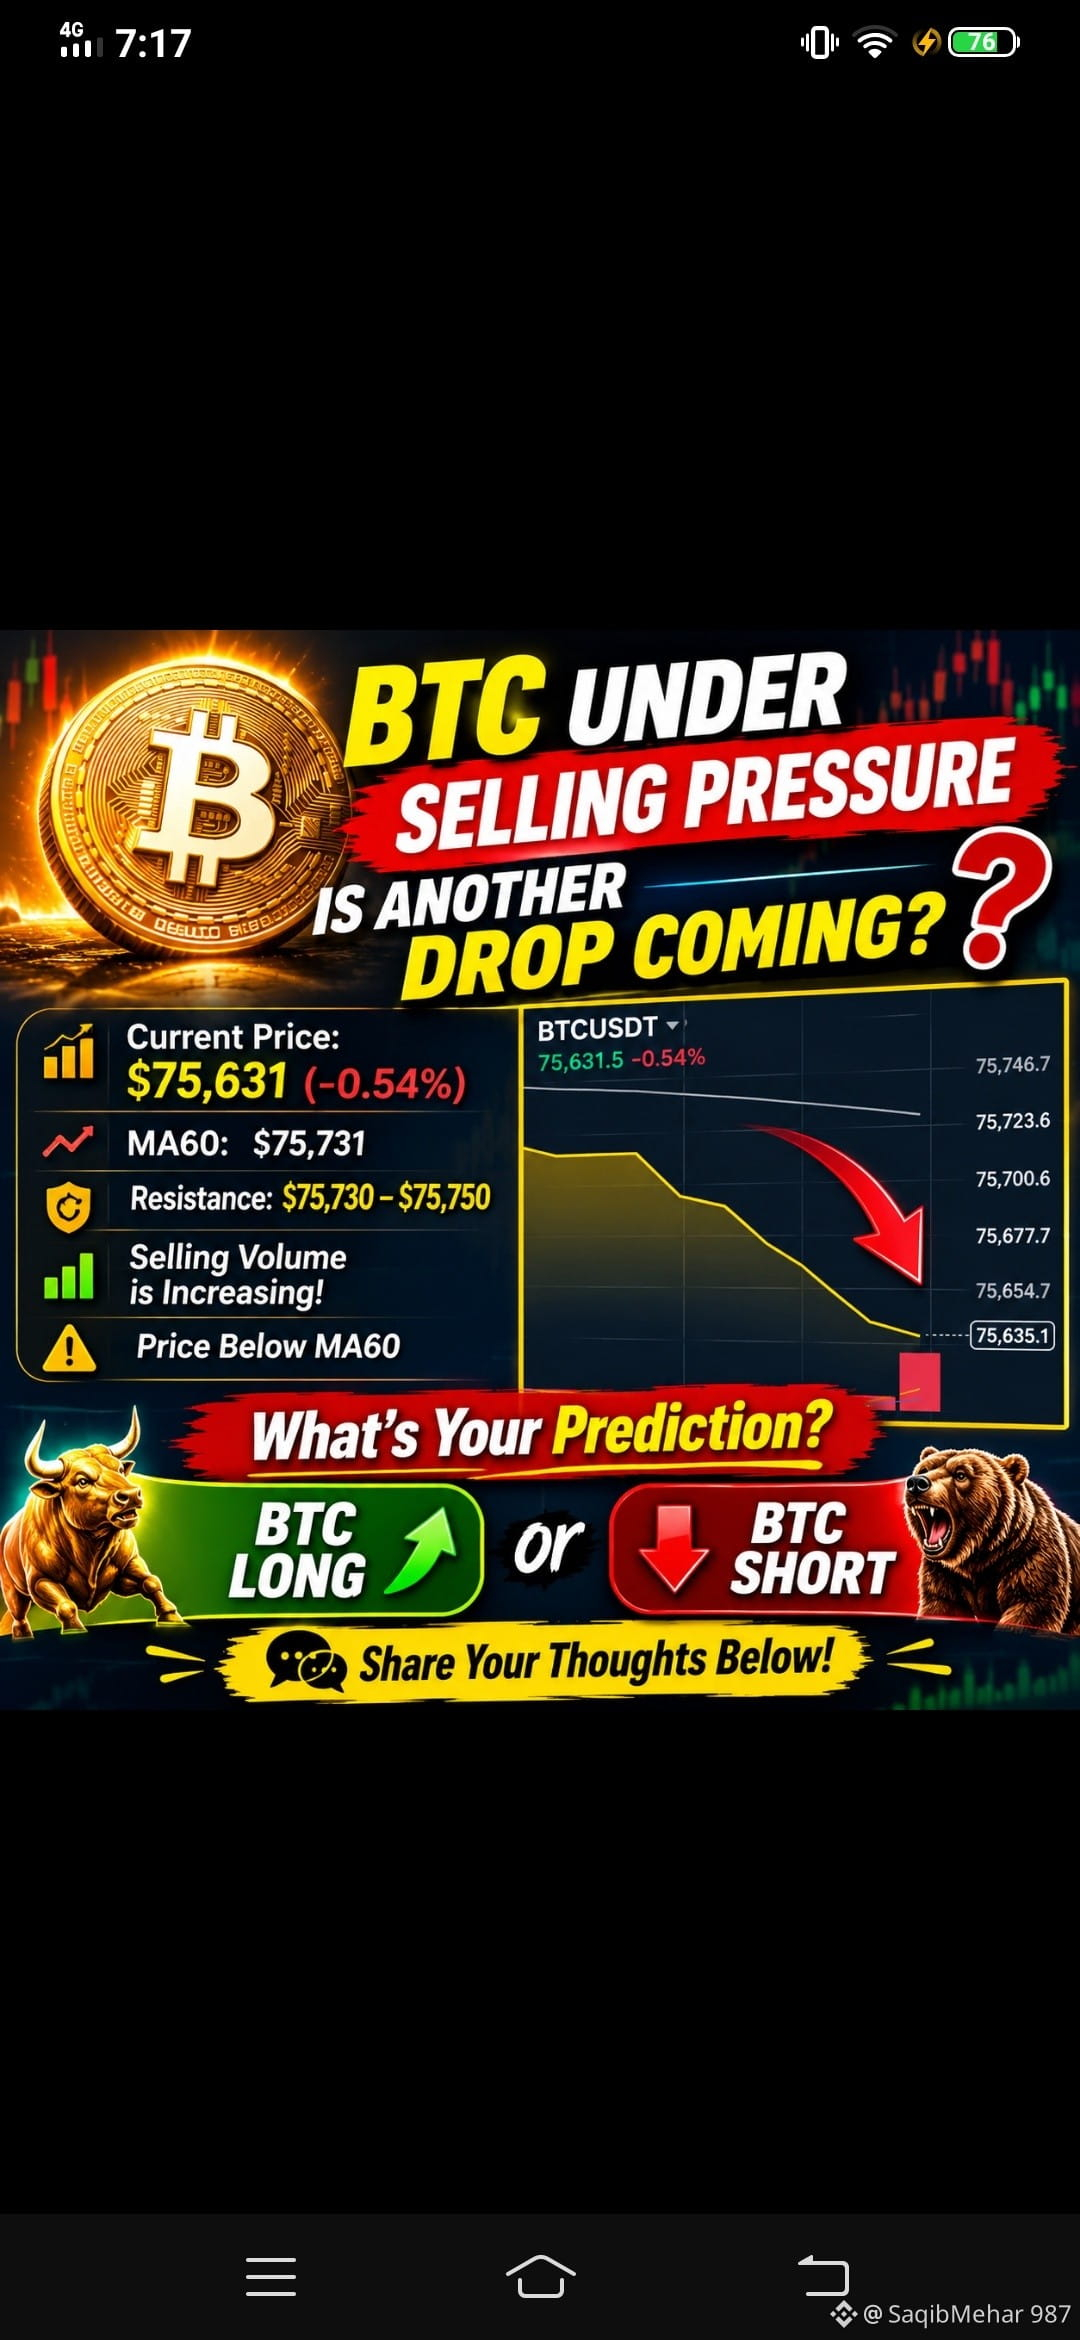
🚨 BTC UNDER SELLING PRESSURE — IS ANOTHER DROP COMING? 🐻📉
Bitcoin is facing short-term selling pressure!
According to the latest BTCUSDT chart, BTC is trading around $75,631, down approximately 0.54%.
🔍 Key Market Observations:
- Current Price: $75,631
- MA60: $75,731
- Immediate Resistance: $75,730–$75,750
- Selling volume is increasing.
- Price is currently trading below the MA60.
📉 What’s Next for BTC?
If BTC fails to reclaim the $75,730 area, bearish pressure could continue.
However, a strong recovery above the MA60 could bring buyers back into the market.
The big question is: Are we seeing a temporary dip or the beginning of another correction? 👀
🔥 What’s your prediction?
🐂 BTC LONG or 🐻 BTC SHORT?
Share your thoughts below!
#BTC #Bitcoin #BTCUSDT #CryptoMarket #BinanceSquare #CryptoTrading #Write2Earn
🚨 BTC UNDER SELLING PRESSURE — IS ANOTHER DROP COMING? 🐻📉
Bitcoin is facing short-term selling pressure!
According to the latest BTCUSDT chart, BTC is trading around $75,631, down approximately 0.54%.
🔍 Key Market Observations:
- Current Price: $75,631
- MA60: $75,731
- Immediate Resistance: $75,730–$75,750
- Selling volume is increasing.
- Price is currently trading below the MA60.
📉 What’s Next for BTC?
If BTC fails to reclaim the $75,730 area, bearish pressure could continue.
However, a strong recovery above the MA60 could bring buyers back into the market.
The big question is: Are we seeing a temporary dip or the beginning of another correction? 👀
🔥 What’s your prediction?
🐂 BTC LONG or 🐻 BTC SHORT?
Share your thoughts below!
#BTC #Bitcoin #BTCUSDT #CryptoMarket #BinanceSquare #CryptoTrading #Write2Earn
Bitcoin is facing short-term selling pressure!
According to the latest BTCUSDT chart, BTC is trading around $75,631, down approximately 0.54%.
🔍 Key Market Observations:
- Current Price: $75,631
- MA60: $75,731
- Immediate Resistance: $75,730–$75,750
- Selling volume is increasing.
- Price is currently trading below the MA60.
📉 What’s Next for BTC?
If BTC fails to reclaim the $75,730 area, bearish pressure could continue.
However, a strong recovery above the MA60 could bring buyers back into the market.
The big question is: Are we seeing a temporary dip or the beginning of another correction? 👀
🔥 What’s your prediction?
🐂 BTC LONG or 🐻 BTC SHORT?
Share your thoughts below!
#BTC #Bitcoin #BTCUSDT #CryptoMarket #BinanceSquare #CryptoTrading #Write2Earn
65

·
--
Article
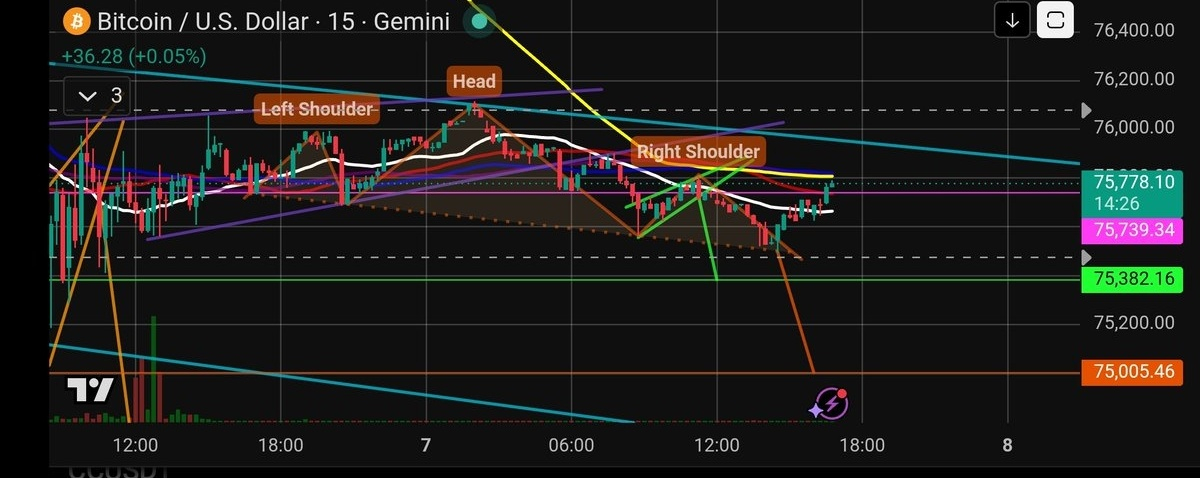
Bitcoin (BTC) Faces a Crucial Retest of the 15-Minute 200 MA – Will Sellers Push Price Lower?Bitcoin (BTC) Faces a Crucial Retest of the 15-Minute 200 MA – Will Sellers Push Price Lower?
As anticipated in my earlier market analysis today, Bitcoin has now returned to retest the 200 Moving Average (200 MA) on the 15-minute timeframe. This was an important level to watch, and price has now reached the area where the next short-term direction could become clearer.
The current market structure makes this retest particularly important. The 200 MA is acting as a key technical reference, and how BTC reacts around this level could determine whether the market continues its downward movement or attempts to recover.
What I'm Watching Now:
The main focus is on whether Bitcoin can successfully reclaim the 15-minute 200 MA or face another rejection from this level.
If sellers defend this moving average and price fails to establish acceptance above it, bearish pressure could increase. Such a rejection may open the door for another move toward the lower support zones and downside targets identified in my previous analysis.
On the other hand, if buyers manage to reclaim the 200 MA and maintain price above it, the bearish scenario could weaken. A sustained move above this level would suggest that buyers are attempting to regain short-term control.
Why This Retest Matters
Moving averages can provide useful insight into short-term momentum, but the reaction around them is more important than simply touching the indicator. Volume, candle closes, and the overall market structure should also be considered before drawing conclusions.
For now, I'm watching the 15-minute structure closely and waiting for clear confirmation. There is no need to rush into a position while the market is testing an important technical area.
My earlier projection brought this level into focus, and now the actual price reaction will determine the next opportunity.
For the complete analysis, previously identified downside targets, and important technical levels, check my timeline.
Let's see how BTC reacts from here. Stay patient, stay disciplined, and always manage your risk.
#BTC #BitcoinTrading #CryptoMarketAlert $BTC
{future}(BTCUSDT)
Bitcoin (BTC) Faces a Crucial Retest of the 15-Minute 200 MA – Will Sellers Push Price Lower?
Bitcoin (BTC) Faces a Crucial Retest of the 15-Minute 200 MA – Will Sellers Push Price Lower?
As anticipated in my earlier market analysis today, Bitcoin has now returned to retest the 200 Moving Average (200 MA) on the 15-minute timeframe. This was an important level to watch, and price has now reached the area where the next short-term direction could become clearer.
The current market structure makes this retest particularly important. The 200 MA is acting as a key technical reference, and how BTC reacts around this level could determine whether the market continues its downward movement or attempts to recover.
What I'm Watching Now:
The main focus is on whether Bitcoin can successfully reclaim the 15-minute 200 MA or face another rejection from this level.
If sellers defend this moving average and price fails to establish acceptance above it, bearish pressure could increase. Such a rejection may open the door for another move toward the lower support zones and downside targets identified in my previous analysis.
On the other hand, if buyers manage to reclaim the 200 MA and maintain price above it, the bearish scenario could weaken. A sustained move above this level would suggest that buyers are attempting to regain short-term control.
Why This Retest Matters
Moving averages can provide useful insight into short-term momentum, but the reaction around them is more important than simply touching the indicator. Volume, candle closes, and the overall market structure should also be considered before drawing conclusions.
For now, I'm watching the 15-minute structure closely and waiting for clear confirmation. There is no need to rush into a position while the market is testing an important technical area.
My earlier projection brought this level into focus, and now the actual price reaction will determine the next opportunity.
For the complete analysis, previously identified downside targets, and important technical levels, check my timeline.
Let's see how BTC reacts from here. Stay patient, stay disciplined, and always manage your risk.
#BTC #BitcoinTrading #CryptoMarketAlert $BTC
As anticipated in my earlier market analysis today, Bitcoin has now returned to retest the 200 Moving Average (200 MA) on the 15-minute timeframe. This was an important level to watch, and price has now reached the area where the next short-term direction could become clearer.
The current market structure makes this retest particularly important. The 200 MA is acting as a key technical reference, and how BTC reacts around this level could determine whether the market continues its downward movement or attempts to recover.
What I'm Watching Now:
The main focus is on whether Bitcoin can successfully reclaim the 15-minute 200 MA or face another rejection from this level.
If sellers defend this moving average and price fails to establish acceptance above it, bearish pressure could increase. Such a rejection may open the door for another move toward the lower support zones and downside targets identified in my previous analysis.
On the other hand, if buyers manage to reclaim the 200 MA and maintain price above it, the bearish scenario could weaken. A sustained move above this level would suggest that buyers are attempting to regain short-term control.
Why This Retest Matters
Moving averages can provide useful insight into short-term momentum, but the reaction around them is more important than simply touching the indicator. Volume, candle closes, and the overall market structure should also be considered before drawing conclusions.
For now, I'm watching the 15-minute structure closely and waiting for clear confirmation. There is no need to rush into a position while the market is testing an important technical area.
My earlier projection brought this level into focus, and now the actual price reaction will determine the next opportunity.
For the complete analysis, previously identified downside targets, and important technical levels, check my timeline.
Let's see how BTC reacts from here. Stay patient, stay disciplined, and always manage your risk.
#BTC #BitcoinTrading #CryptoMarketAlert $BTC
1
160

$BTC
{spot}(BTCUSDT)
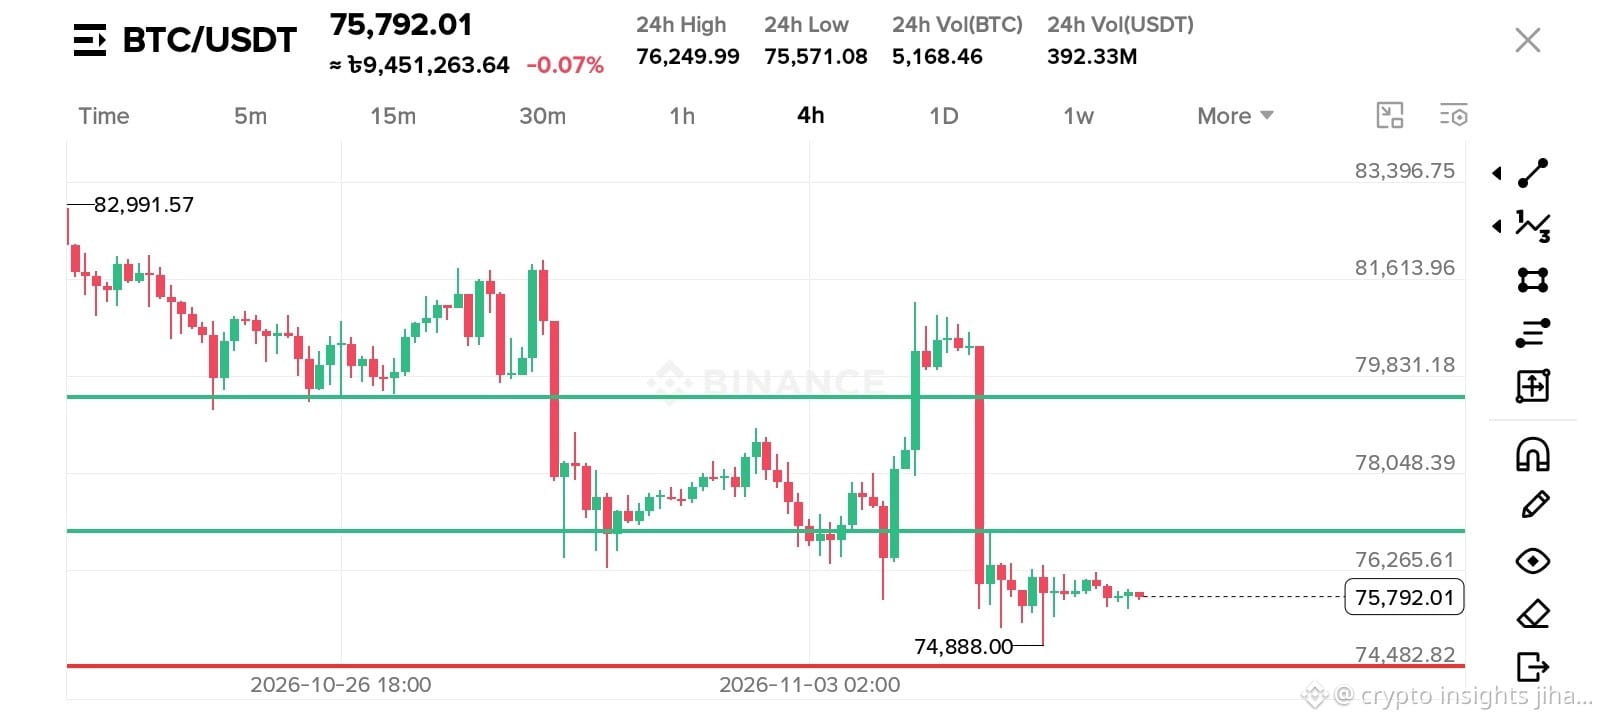
BTC / USDT - 4H
Price now - $75,780
BTC lost $79,831 and now sitting on last support.
Levels:
Support: $74,888 - $75,500
Resistance: $76,265 / $79,831
Hold above $74,888 = Buy to $76,265 then $79,831
Close below $74,888 = Wait for $74,482
Dominance still 59.9% - BTC decides everything now.
are you buying here or waiting ?
#BTC #Bitcoin
$BTC
BTC / USDT - 4H
Price now - $75,780
BTC lost $79,831 and now sitting on last support.
Levels:
Support: $74,888 - $75,500
Resistance: $76,265 / $79,831
Hold above $74,888 = Buy to $76,265 then $79,831
Close below $74,888 = Wait for $74,482
Dominance still 59.9% - BTC decides everything now.
are you buying here or waiting ?
#BTC #Bitcoin
BTC / USDT - 4H
Price now - $75,780
BTC lost $79,831 and now sitting on last support.
Levels:
Support: $74,888 - $75,500
Resistance: $76,265 / $79,831
Hold above $74,888 = Buy to $76,265 then $79,831
Close below $74,888 = Wait for $74,482
Dominance still 59.9% - BTC decides everything now.
are you buying here or waiting ?
#BTC #Bitcoin
119

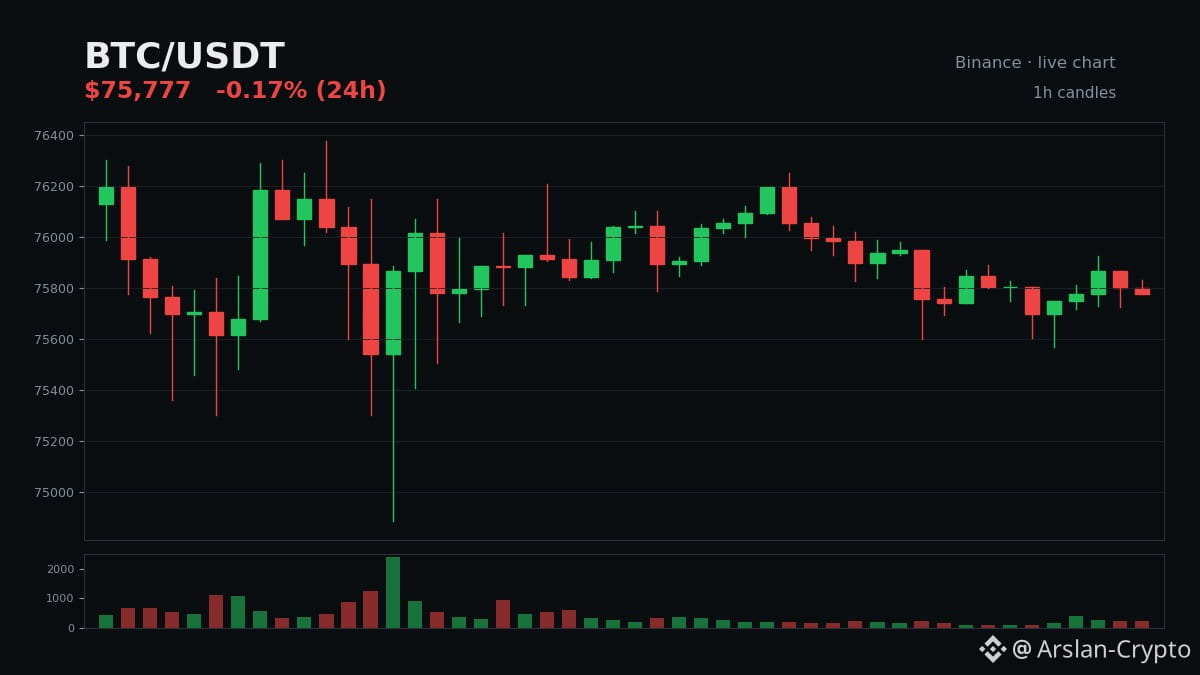
Bitcoin just retested its line — only $15 away from breaking it. And the options market settles in a few hours. 🎯
$BTC $75,777 (-0.2%) · 24h range $75,571–$76,250 · 24h volume ~$397M
24h low $75,571 — just $15 above the $75,556 line it has defended three days running
Friday dipped to $74,888 and still closed above the line
Options expire at 17:00 JST today, max pain $76,000 — price sits ~$220 below it
Three daily closes above the same line, and today it tested that line again from $15 away. A quiet Sunday — until the expiry and the weekly close land in the same evening.
Does the weekly close finally break Bitcoin off this line — up or down? 👇
#Bitcoin #BTC #Crypto
Not financial advice.
Bitcoin just retested its line — only $15 away from breaking it. And the options market settles in a few hours. 🎯
$BTC $75,777 (-0.2%) · 24h range $75,571–$76,250 · 24h volume ~$397M
24h low $75,571 — just $15 above the $75,556 line it has defended three days running
Friday dipped to $74,888 and still closed above the line
Options expire at 17:00 JST today, max pain $76,000 — price sits ~$220 below it
Three daily closes above the same line, and today it tested that line again from $15 away. A quiet Sunday — until the expiry and the weekly close land in the same evening.
Does the weekly close finally break Bitcoin off this line — up or down? 👇
#Bitcoin #BTC #Crypto
Not financial advice.
$BTC $75,777 (-0.2%) · 24h range $75,571–$76,250 · 24h volume ~$397M
24h low $75,571 — just $15 above the $75,556 line it has defended three days running
Friday dipped to $74,888 and still closed above the line
Options expire at 17:00 JST today, max pain $76,000 — price sits ~$220 below it
Three daily closes above the same line, and today it tested that line again from $15 away. A quiet Sunday — until the expiry and the weekly close land in the same evening.
Does the weekly close finally break Bitcoin off this line — up or down? 👇
#Bitcoin #BTC #Crypto
Not financial advice.
108


·
--
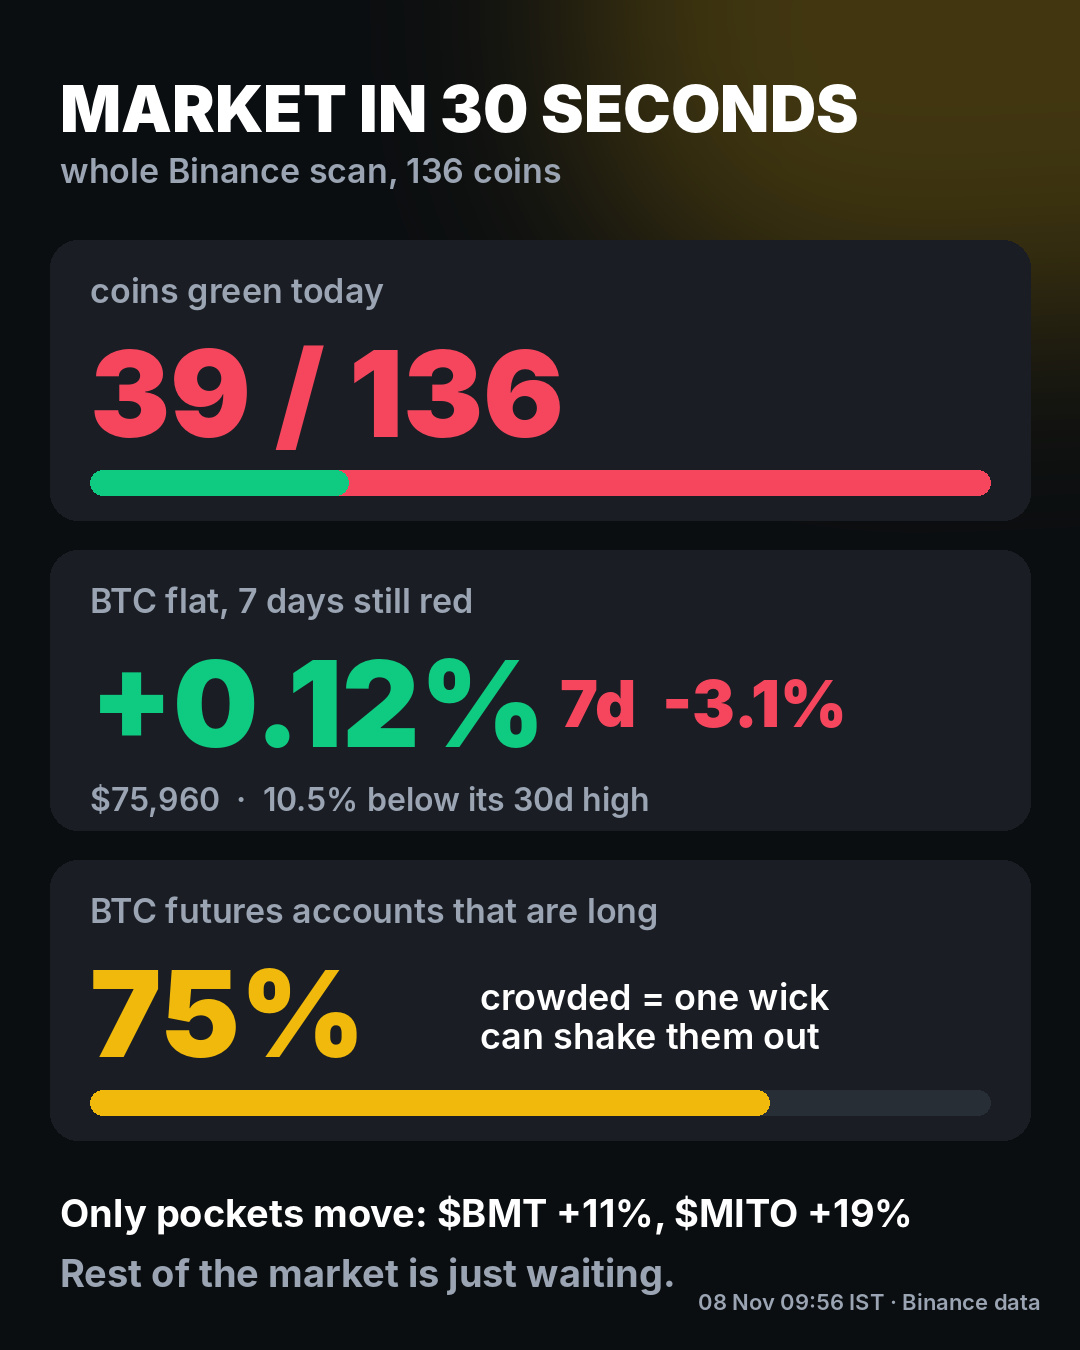
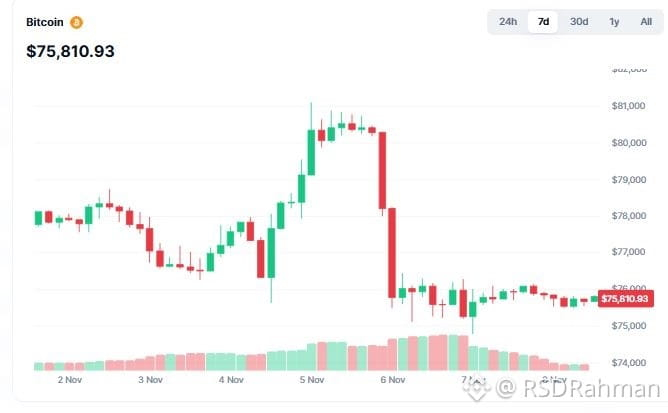
$BTC Market Update 📉
{spot}(BTCUSDT)
Bitcoin (BTC) is trading around $75,816, nearly flat over 24 hours but down 2.35% over the past week.
Market sentiment remains cautious, with key developments:
ETF Outflows: U.S. spot Bitcoin ETFs recorded $411.9M in outflows on November 6, bringing weekly outflows to approximately $1.28B.
Market Sentiment: Fear & Greed Index stands at 32 (Fear).
BTC Dominance: Increased to 60.02%, showing Bitcoin's relative strength against altcoins.
Market Pressure: Total crypto market cap is down 2.36% over the past week.
Outlook: BTC is showing short-term stability, but heavy ETF outflows, weak sentiment, and reduced market participation keep the outlook cautious. A sustained recovery in ETF inflows and buying volume is needed to confirm a stronger rebound.
#Bitcoin #BTC #CryptoMarket #CryptoNews
$BTC Market Update 📉
Bitcoin (BTC) is trading around $75,816, nearly flat over 24 hours but down 2.35% over the past week.
Market sentiment remains cautious, with key developments:
ETF Outflows: U.S. spot Bitcoin ETFs recorded $411.9M in outflows on November 6, bringing weekly outflows to approximately $1.28B.
Market Sentiment: Fear & Greed Index stands at 32 (Fear).
BTC Dominance: Increased to 60.02%, showing Bitcoin's relative strength against altcoins.
Market Pressure: Total crypto market cap is down 2.36% over the past week.
Outlook: BTC is showing short-term stability, but heavy ETF outflows, weak sentiment, and reduced market participation keep the outlook cautious. A sustained recovery in ETF inflows and buying volume is needed to confirm a stronger rebound.
#Bitcoin #BTC #CryptoMarket #CryptoNews
Bitcoin (BTC) is trading around $75,816, nearly flat over 24 hours but down 2.35% over the past week.
Market sentiment remains cautious, with key developments:
ETF Outflows: U.S. spot Bitcoin ETFs recorded $411.9M in outflows on November 6, bringing weekly outflows to approximately $1.28B.
Market Sentiment: Fear & Greed Index stands at 32 (Fear).
BTC Dominance: Increased to 60.02%, showing Bitcoin's relative strength against altcoins.
Market Pressure: Total crypto market cap is down 2.36% over the past week.
Outlook: BTC is showing short-term stability, but heavy ETF outflows, weak sentiment, and reduced market participation keep the outlook cautious. A sustained recovery in ETF inflows and buying volume is needed to confirm a stronger rebound.
#Bitcoin #BTC #CryptoMarket #CryptoNews

·
--
$BTC - Strategy founder maps Stretch security structure to 400 years of financial precedent.
Saylor connects Dutch trading companies, 19th-century railroad bonds, and modern U.S. tax code.
The framework finances bitcoin holdings via income-paying preferred shares.
Whether this historical analogy holds under stress remains untested.
#Bitcoin #BTC
$BTC - Strategy founder maps Stretch security structure to 400 years of financial precedent.
Saylor connects Dutch trading companies, 19th-century railroad bonds, and modern U.S. tax code.
The framework finances bitcoin holdings via income-paying preferred shares.
Whether this historical analogy holds under stress remains untested.
#Bitcoin #BTC
Saylor connects Dutch trading companies, 19th-century railroad bonds, and modern U.S. tax code.
The framework finances bitcoin holdings via income-paying preferred shares.
Whether this historical analogy holds under stress remains untested.
#Bitcoin #BTC
26

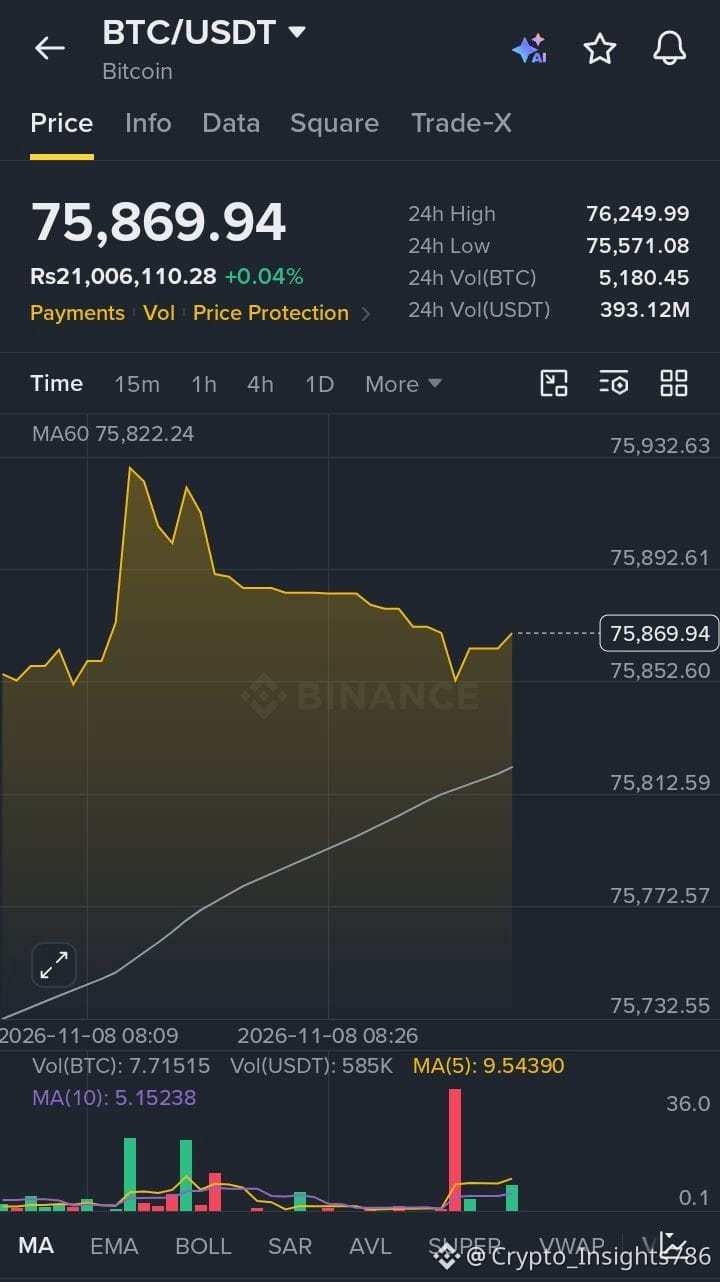
$BTC Current Price: $75,869
📊 Market Outlook: Neutral to Bearish
$BTC
is showing a slight recovery after falling below $75,000. Buyers are attempting to defend the $75,500 support zone.
🔹 Support: $75,500 / $74,900 🔹 Resistance: $76,300 / $77,000
📈 A breakout above $76,300 could strengthen bullish momentum, while a drop below $75,500 may trigger further downside.
Stay alert and trade wisely!
#bitcoin #BTC #CryptoAnalysis #BİNANCE #CryptoMarket
{spot}(BTCUSDT)
$BTC Current Price: $75,869
📊 Market Outlook: Neutral to Bearish
$BTC
is showing a slight recovery after falling below $75,000. Buyers are attempting to defend the $75,500 support zone.
🔹 Support: $75,500 / $74,900 🔹 Resistance: $76,300 / $77,000
📈 A breakout above $76,300 could strengthen bullish momentum, while a drop below $75,500 may trigger further downside.
Stay alert and trade wisely!
#bitcoin #BTC #CryptoAnalysis #BİNANCE #CryptoMarket
📊 Market Outlook: Neutral to Bearish
$BTC
is showing a slight recovery after falling below $75,000. Buyers are attempting to defend the $75,500 support zone.
🔹 Support: $75,500 / $74,900 🔹 Resistance: $76,300 / $77,000
📈 A breakout above $76,300 could strengthen bullish momentum, while a drop below $75,500 may trigger further downside.
Stay alert and trade wisely!
#bitcoin #BTC #CryptoAnalysis #BİNANCE #CryptoMarket
34

·
--
165,000 jobs just torched the rate-cut hope — $BTC pinned at $75,878, a December hike now priced near 80%.
Source: E8 Markets, 00:46 UTC — payrolls smashed the ~65,000 forecast, unemployment down to 4.1%.
The weekly close held above the 50-week average — barely. The low nicked $75,571 before buyers stepped back in.
ETF outflows hit $1.28B, funding flat at 0.0091%, while $ETH clings to $2,240.
I'm leaning cautious: the line holds, but the reason to hold it is gone.
$75,571 breaks and $74,250 is next; $76,500 reclaimed flips me.
Buy the $75,571 test or wait for $76,500?
Not financial advice. DYOR.
#BTC #FedWatch #CryptoNews
165,000 jobs just torched the rate-cut hope — $BTC pinned at $75,878, a December hike now priced near 80%.
Source: E8 Markets, 00:46 UTC — payrolls smashed the ~65,000 forecast, unemployment down to 4.1%.
The weekly close held above the 50-week average — barely. The low nicked $75,571 before buyers stepped back in.
ETF outflows hit $1.28B, funding flat at 0.0091%, while $ETH clings to $2,240.
I'm leaning cautious: the line holds, but the reason to hold it is gone.
$75,571 breaks and $74,250 is next; $76,500 reclaimed flips me.
Buy the $75,571 test or wait for $76,500?
Not financial advice. DYOR.
#BTC #FedWatch #CryptoNews
Source: E8 Markets, 00:46 UTC — payrolls smashed the ~65,000 forecast, unemployment down to 4.1%.
The weekly close held above the 50-week average — barely. The low nicked $75,571 before buyers stepped back in.
ETF outflows hit $1.28B, funding flat at 0.0091%, while $ETH clings to $2,240.
I'm leaning cautious: the line holds, but the reason to hold it is gone.
$75,571 breaks and $74,250 is next; $76,500 reclaimed flips me.
Buy the $75,571 test or wait for $76,500?
Not financial advice. DYOR.
#BTC #FedWatch #CryptoNews

·
--
#btc #Bitcoin #crypto
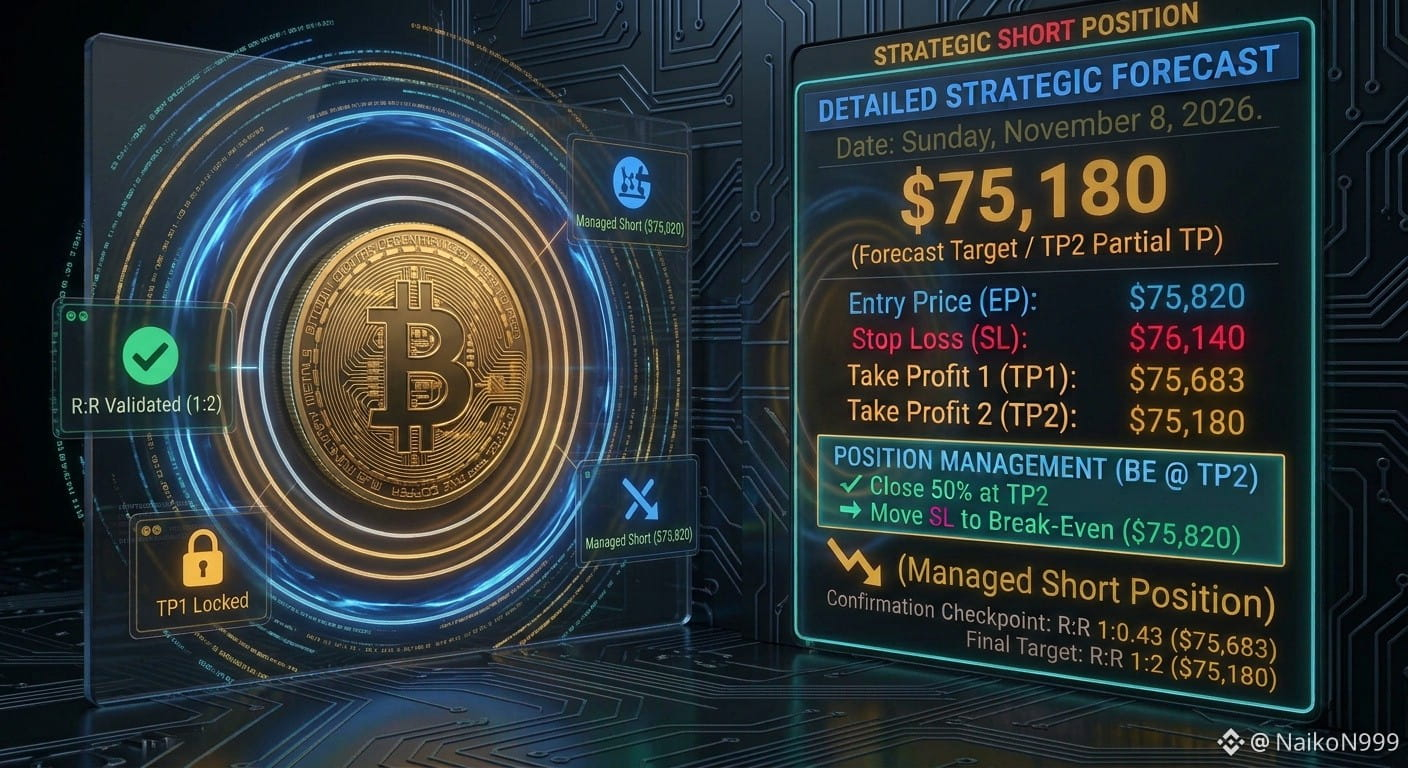
🎯 Daily $BTC Setup for Today!
Happy Sunday! Bitcoin is testing key local levels, presenting a structured scalp Short opportunity for the session:
🔹 EP: $75,820
🎯 TP 1: $75,683 (Local Target)
🎯 TP 2: $75,180 (R:R 1:2 — Extended Target)
🛑 SL: $76,140
📌 Strategy Note: Managing risk dynamically with a stop loss at $76,140. Monitoring price action closely as support zones are approached, securing partials and shifting to break-even as the setup progresses! 🚀
What are your thoughts on $BTC today — will we break through local support or bounce back? Share your forecast below! 👇
#btc #Bitcoin #crypto
🎯 Daily $BTC Setup for Today!
Happy Sunday! Bitcoin is testing key local levels, presenting a structured scalp Short opportunity for the session:
🔹 EP: $75,820
🎯 TP 1: $75,683 (Local Target)
🎯 TP 2: $75,180 (R:R 1:2 — Extended Target)
🛑 SL: $76,140
📌 Strategy Note: Managing risk dynamically with a stop loss at $76,140. Monitoring price action closely as support zones are approached, securing partials and shifting to break-even as the setup progresses! 🚀
What are your thoughts on $BTC today — will we break through local support or bounce back? Share your forecast below! 👇
🎯 Daily $BTC Setup for Today!
Happy Sunday! Bitcoin is testing key local levels, presenting a structured scalp Short opportunity for the session:
🔹 EP: $75,820
🎯 TP 1: $75,683 (Local Target)
🎯 TP 2: $75,180 (R:R 1:2 — Extended Target)
🛑 SL: $76,140
📌 Strategy Note: Managing risk dynamically with a stop loss at $76,140. Monitoring price action closely as support zones are approached, securing partials and shifting to break-even as the setup progresses! 🚀
What are your thoughts on $BTC today — will we break through local support or bounce back? Share your forecast below! 👇
2

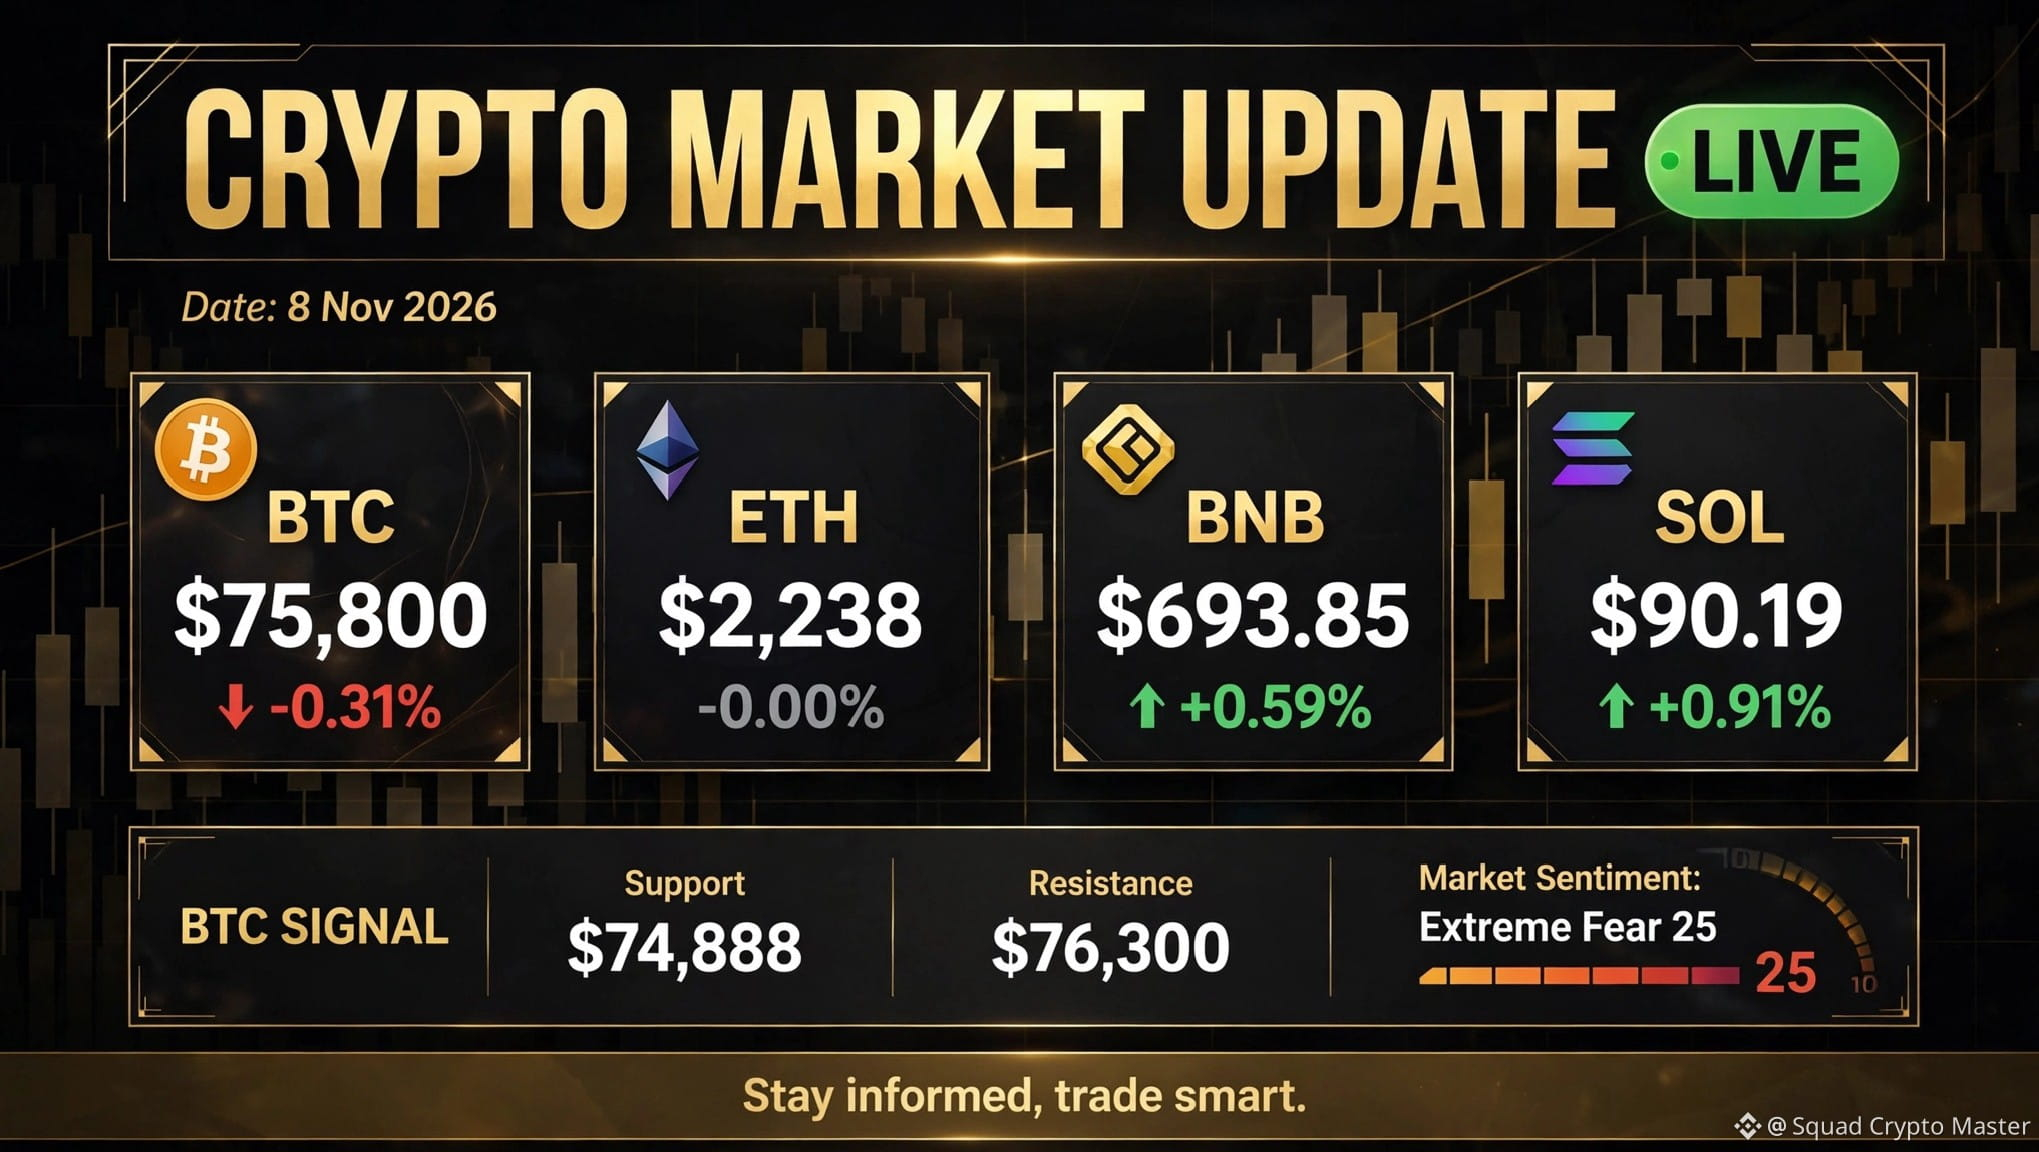
📊 CRYPTO MARKET UPDATE | 8 Nov 2026 🟢 LIVE
💰 BTC $75,800 (-0.31%) 🔴
💰 ETH $2,238 (-0.00%) ⚪
💰 BNB $693.85 (+0.59%) 🟢
💰 SOL $90.19 (+0.91%) 🟢
🎯 BTC SIGNAL:
Support: $74,888
Resistance: $76,300
🧭 Market Sentiment: Extreme Fear 25
⚠️ Market is in fear, but BTC is holding support. No FOMO, no panic — wait for breakout confirmation.
Stay informed, trade smart.
#CryptoUpdate #BTC #ETH #BNB #SOL
$BTC $ETH $BNB
📊 CRYPTO MARKET UPDATE | 8 Nov 2026 🟢 LIVE
💰 BTC $75,800 (-0.31%) 🔴
💰 ETH $2,238 (-0.00%) ⚪
💰 BNB $693.85 (+0.59%) 🟢
💰 SOL $90.19 (+0.91%) 🟢
🎯 BTC SIGNAL:
Support: $74,888
Resistance: $76,300
🧭 Market Sentiment: Extreme Fear 25
⚠️ Market is in fear, but BTC is holding support. No FOMO, no panic — wait for breakout confirmation.
Stay informed, trade smart.
#CryptoUpdate #BTC #ETH #BNB #SOL
$BTC $ETH $BNB
💰 BTC $75,800 (-0.31%) 🔴
💰 ETH $2,238 (-0.00%) ⚪
💰 BNB $693.85 (+0.59%) 🟢
💰 SOL $90.19 (+0.91%) 🟢
🎯 BTC SIGNAL:
Support: $74,888
Resistance: $76,300
🧭 Market Sentiment: Extreme Fear 25
⚠️ Market is in fear, but BTC is holding support. No FOMO, no panic — wait for breakout confirmation.
Stay informed, trade smart.
#CryptoUpdate #BTC #ETH #BNB #SOL
$BTC $ETH $BNB
27

·
--
Bitcoin ETFs Just Recorded a $1.28 Billion Weekly Outflow! 🚨
A major warning sign for the crypto market?
Bitcoin ETFs recorded approximately $1.28 billion in net outflows during the past week, marking their worst weekly performance since June, according to recent market reports.
This raises an important question:
Are institutional investors losing confidence, or is this simply a temporary market correction?
Here's what I'm watching:
Bitcoin's ability to hold key support levels.
Whether ETF inflows return.
How institutional investors react in the coming days.
The next few weeks could be interesting for crypto!
What's your view? Is this a buying opportunity or a sign of more downside?
#Bitcoin #BTC #CryptoNews
Bitcoin ETFs Just Recorded a $1.28 Billion Weekly Outflow! 🚨
A major warning sign for the crypto market?
Bitcoin ETFs recorded approximately $1.28 billion in net outflows during the past week, marking their worst weekly performance since June, according to recent market reports.
This raises an important question:
Are institutional investors losing confidence, or is this simply a temporary market correction?
Here's what I'm watching:
Bitcoin's ability to hold key support levels.
Whether ETF inflows return.
How institutional investors react in the coming days.
The next few weeks could be interesting for crypto!
What's your view? Is this a buying opportunity or a sign of more downside?
#Bitcoin #BTC #CryptoNews
A major warning sign for the crypto market?
Bitcoin ETFs recorded approximately $1.28 billion in net outflows during the past week, marking their worst weekly performance since June, according to recent market reports.
This raises an important question:
Are institutional investors losing confidence, or is this simply a temporary market correction?
Here's what I'm watching:
Bitcoin's ability to hold key support levels.
Whether ETF inflows return.
How institutional investors react in the coming days.
The next few weeks could be interesting for crypto!
What's your view? Is this a buying opportunity or a sign of more downside?
#Bitcoin #BTC #CryptoNews

43
Log in to explore more content
Join global crypto users on Binance Square
⚡️ Get latest and useful information about crypto.
💬 Trusted by the world’s largest crypto exchange.
👍 Discover real insights from verified creators.
Email / Phone number
Trending Topics
1
#JobsReportRaisesHikeOdds
570,041 views
3,574 Discussing
2
#CPITestsDecemberRateOutlook
181,953 views
1,273 Discussing
3
#US Data Center Rules May Constrain AI Expansion
79,636 views
234 Discussing
4
#ARKPlans14ThematicETFsCoveringAIAndTokenizedMarkets
4,963 views
74 Discussing
5
#WillAnthropicListOnTime
176,542 views
1,486 Discussing
6
#WillUS-IranTensionsBoostSafe-HavenDemand?
85,209 views
598 Discussing
7
#BitcoinETFsSee$412MNetOutflows
17,343 views
80 Discussing
8
#HKSFCPlansToRestrictCryptoAndExchangeTerms
70,152 views
610 Discussing
9
#TradFiForBeginners
101,252 views
1,085 Discussing
10
#FinCENAndFedWithdraw$250CryptoTransferProposal
10,843 views
18 Discussing