

#atom
atom
6.7M views
9,500 Discussing
Hot
Latest

·
--
$ATOM #ATOM
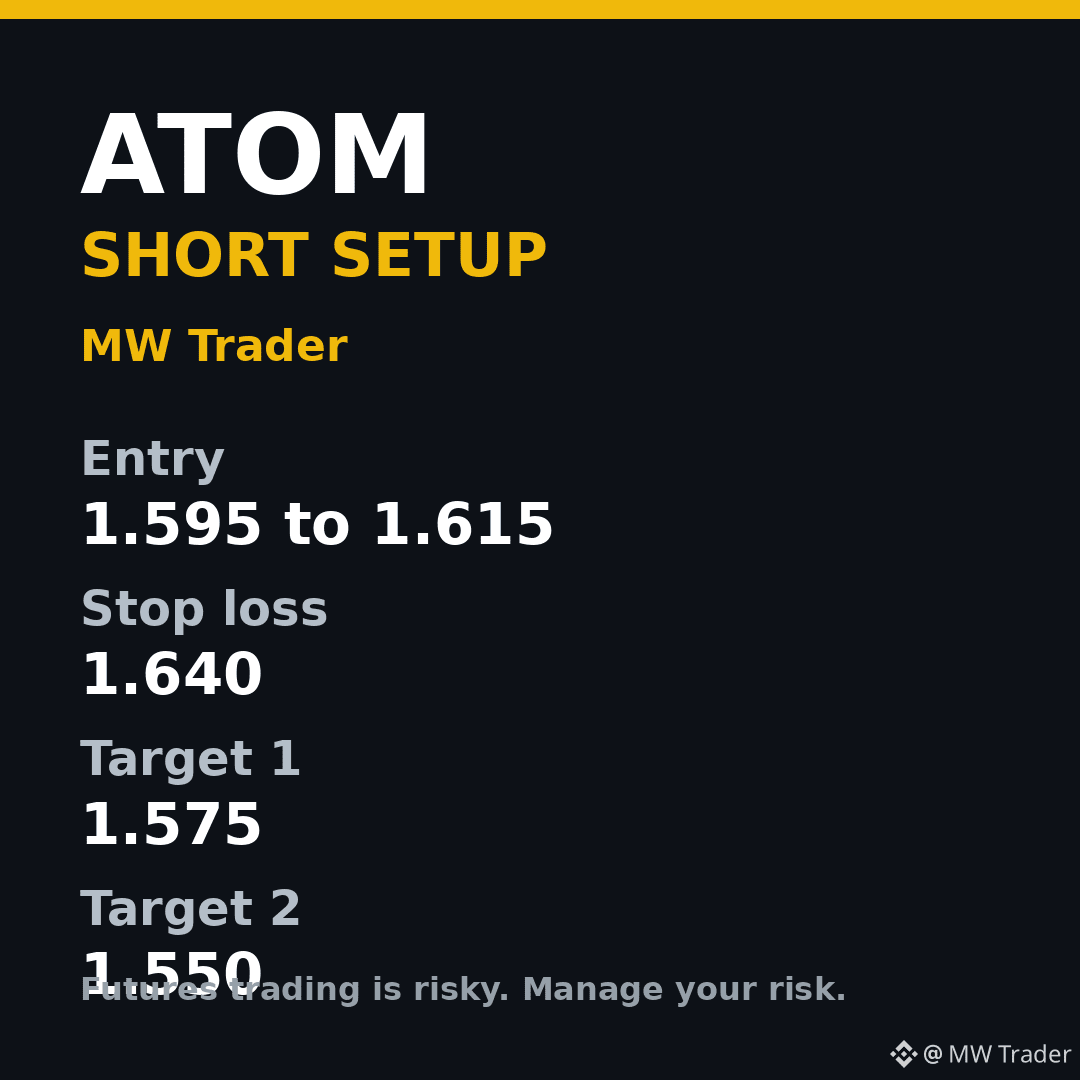
SHORT idea, fresh setup for 29 October
Entry: 1.595 to 1.615
Stop loss: 1.640
Target 1: 1.575
Target 2: 1.550
Cosmos is near 1.60, down 2.67 percent, with a range of 1.58 to 1.66. Price is sitting in the lower half of that range with no bounce strength showing. A short while price stays below 1.615 favours a move toward 1.575. Above 1.640, exit.
Futures trading is risky. Trade small, manage your risk, and do your own research.
#Cosmos #Crypto #FuturesTrading #TradingSignals
Follow for more trades.
3

·
--
🚨 SEVERE LIQUIDITY GAP: $ATOM
CVD shows AGGRESSIVE distribution. Institutional selling is absorbing all buy-side liquidity at the current level. Price is trapped in a low-volume node; the path of least resistance is DOWN.
EXECUTION:
ENTRY: 1.593 $ATOM
SL: 1.664
TP1: 1.480
TP2: 1.320
RR: 1:3.5+
ACTION: Short bias confirmed.
Is $ATOM facing a permanent supply flip or just a deep liquidity sweep?
#ATOM #BinanceSquare #SlowSclap #TradingAnalysis
2


·
--
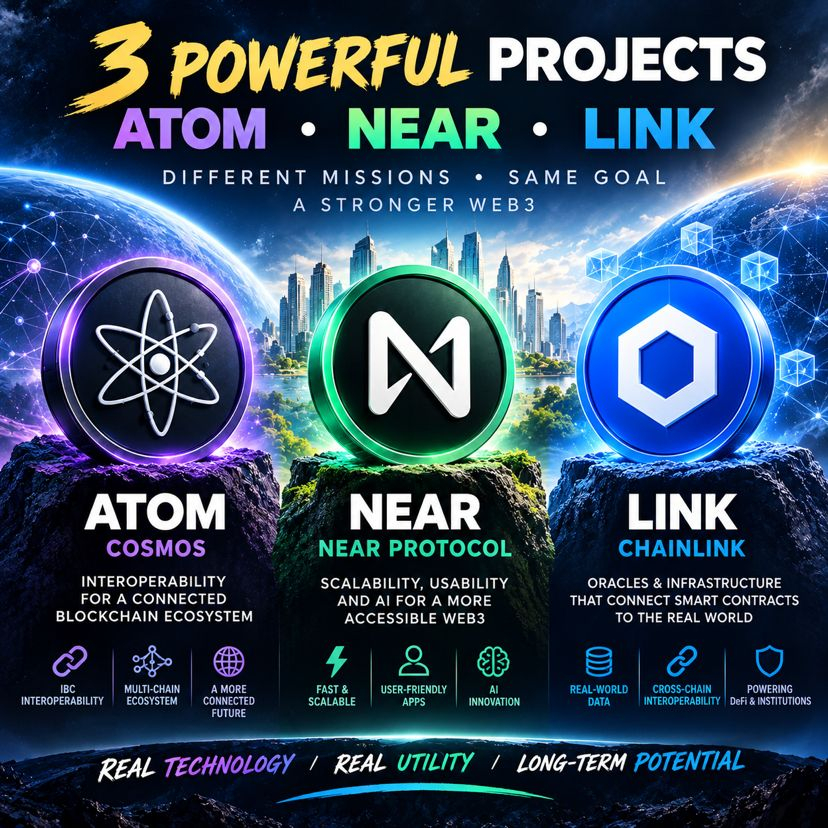
3 CRYPTO PROJECTS THAT DESERVE MORE ATTENTION: ATOM, NEAR & LINK
The market is full of hype, but smart investors also look for technology, real utility, and long-term potential. 👇
🌌 $ATOM Cosmos
Built around the vision of an interconnected blockchain ecosystem. Cosmos technology enables independent blockchains to communicate and work together through IBC. Interoperability is a major part of crypto’s future.
🤖 $NEAR NEAR Protocol
Focused on making blockchain easier to use, with scalable infrastructure and growing ambitions in AI and user friendly Web3 applications. If blockchain adoption expands, NEAR has an interesting role to play.
🔗 $LINK Chainlink
One of the most important infrastructure projects in crypto. Chainlink provides oracle services that connect smart contracts with real world data and supports cross chain interoperability. DeFi, tokenized assets, and institutional blockchain applications all need reliable infrastructure.
Why watch these three?
* ATOM: Blockchain interoperability
* NEAR: Scalability, usability & AI ambitions
* LINK: Oracles & cross-chain infrastructure
Different projects. Different strengths. One common theme: building infrastructure for the next stage of Web3.
Which one has the strongest long term potential ATOM, NEAR, or LINK? 👇
#ATOM #Near #LINK #crypto #altcoins
{spot}(LINKUSDT)
{spot}(NEARUSDT)
{spot}(ATOMUSDT)
3 CRYPTO PROJECTS THAT DESERVE MORE ATTENTION: ATOM, NEAR & LINK
The market is full of hype, but smart investors also look for technology, real utility, and long-term potential. 👇
🌌 $ATOM Cosmos
Built around the vision of an interconnected blockchain ecosystem. Cosmos technology enables independent blockchains to communicate and work together through IBC. Interoperability is a major part of crypto’s future.
🤖 $NEAR NEAR Protocol
Focused on making blockchain easier to use, with scalable infrastructure and growing ambitions in AI and user friendly Web3 applications. If blockchain adoption expands, NEAR has an interesting role to play.
🔗 $LINK Chainlink
One of the most important infrastructure projects in crypto. Chainlink provides oracle services that connect smart contracts with real world data and supports cross chain interoperability. DeFi, tokenized assets, and institutional blockchain applications all need reliable infrastructure.
Why watch these three?
* ATOM: Blockchain interoperability
* NEAR: Scalability, usability & AI ambitions
* LINK: Oracles & cross-chain infrastructure
Different projects. Different strengths. One common theme: building infrastructure for the next stage of Web3.
Which one has the strongest long term potential ATOM, NEAR, or LINK? 👇
#ATOM #Near #LINK #crypto #altcoins
2
531

·
--
Bullish
🚨 COSMOS HUB 5.0: Is ATOM entering a new chapter? ⚛️
Most people focus on price. Smart investors look at what could drive future demand.
The real question is: What happens when the Cosmos Hub becomes more useful and starts capturing more economic value?
With major ecosystem developments and the proposed Osmosis integration, ATOM's long-term value-accrual story deserves attention.
👀 The market often notices a transformation only after it starts showing up in the price.
Don't just watch the chart. Watch the fundamentals.
Are you accumulating $ATOM or waiting for confirmation? 👇
#Cosmos #ATOM #CosmosHub #Crypto
73

·
--
🧠 Galeon Brain Result
✅ SHORT $ATOM [TREND_WEAK]
━━━━━━━━━━━━━━━━
Entry $1.53 → $1.50
P&L +12.60% 🟢
⚠️ This signal is for reference only. Please be aware of the risks and make your own decisions.
Source: Galeon Brain | Follow X @hellogaleon
#GaleonBrain #ATOM #Futures
🧠 Galeon Brain Result
✅ SHORT $ATOM [TREND_WEAK]
━━━━━━━━━━━━━━━━
Entry $1.53 → $1.50
P&L +12.60% 🟢
⚠️ This signal is for reference only. Please be aware of the risks and make your own decisions.
Source: Galeon Brain | Follow X @hellogaleon
#GaleonBrain #ATOM #Futures
✅ SHORT $ATOM [TREND_WEAK]
━━━━━━━━━━━━━━━━
Entry $1.53 → $1.50
P&L +12.60% 🟢
⚠️ This signal is for reference only. Please be aware of the risks and make your own decisions.
Source: Galeon Brain | Follow X @hellogaleon
#GaleonBrain #ATOM #Futures

·
--
Technical principles | How can a group of mutually distrustful nodes agree on the same ledger?
Classic BFT protocols require the total number of nodes to be at least three times the number of malicious nodes plus one. In other words, malicious nodes must make up less than one-third of the total.
Many proof-of-stake chains combine BFT voting with staking: voting power is calculated based on the amount staked, and validators who violate the rules can have their stake slashed.
$ATOM is the native coin of Cosmos Hub, a chain that uses a Byzantine fault-tolerant consensus mechanism.
Be wary of claims promising stable, high returns.
#ATOM
4

·
--
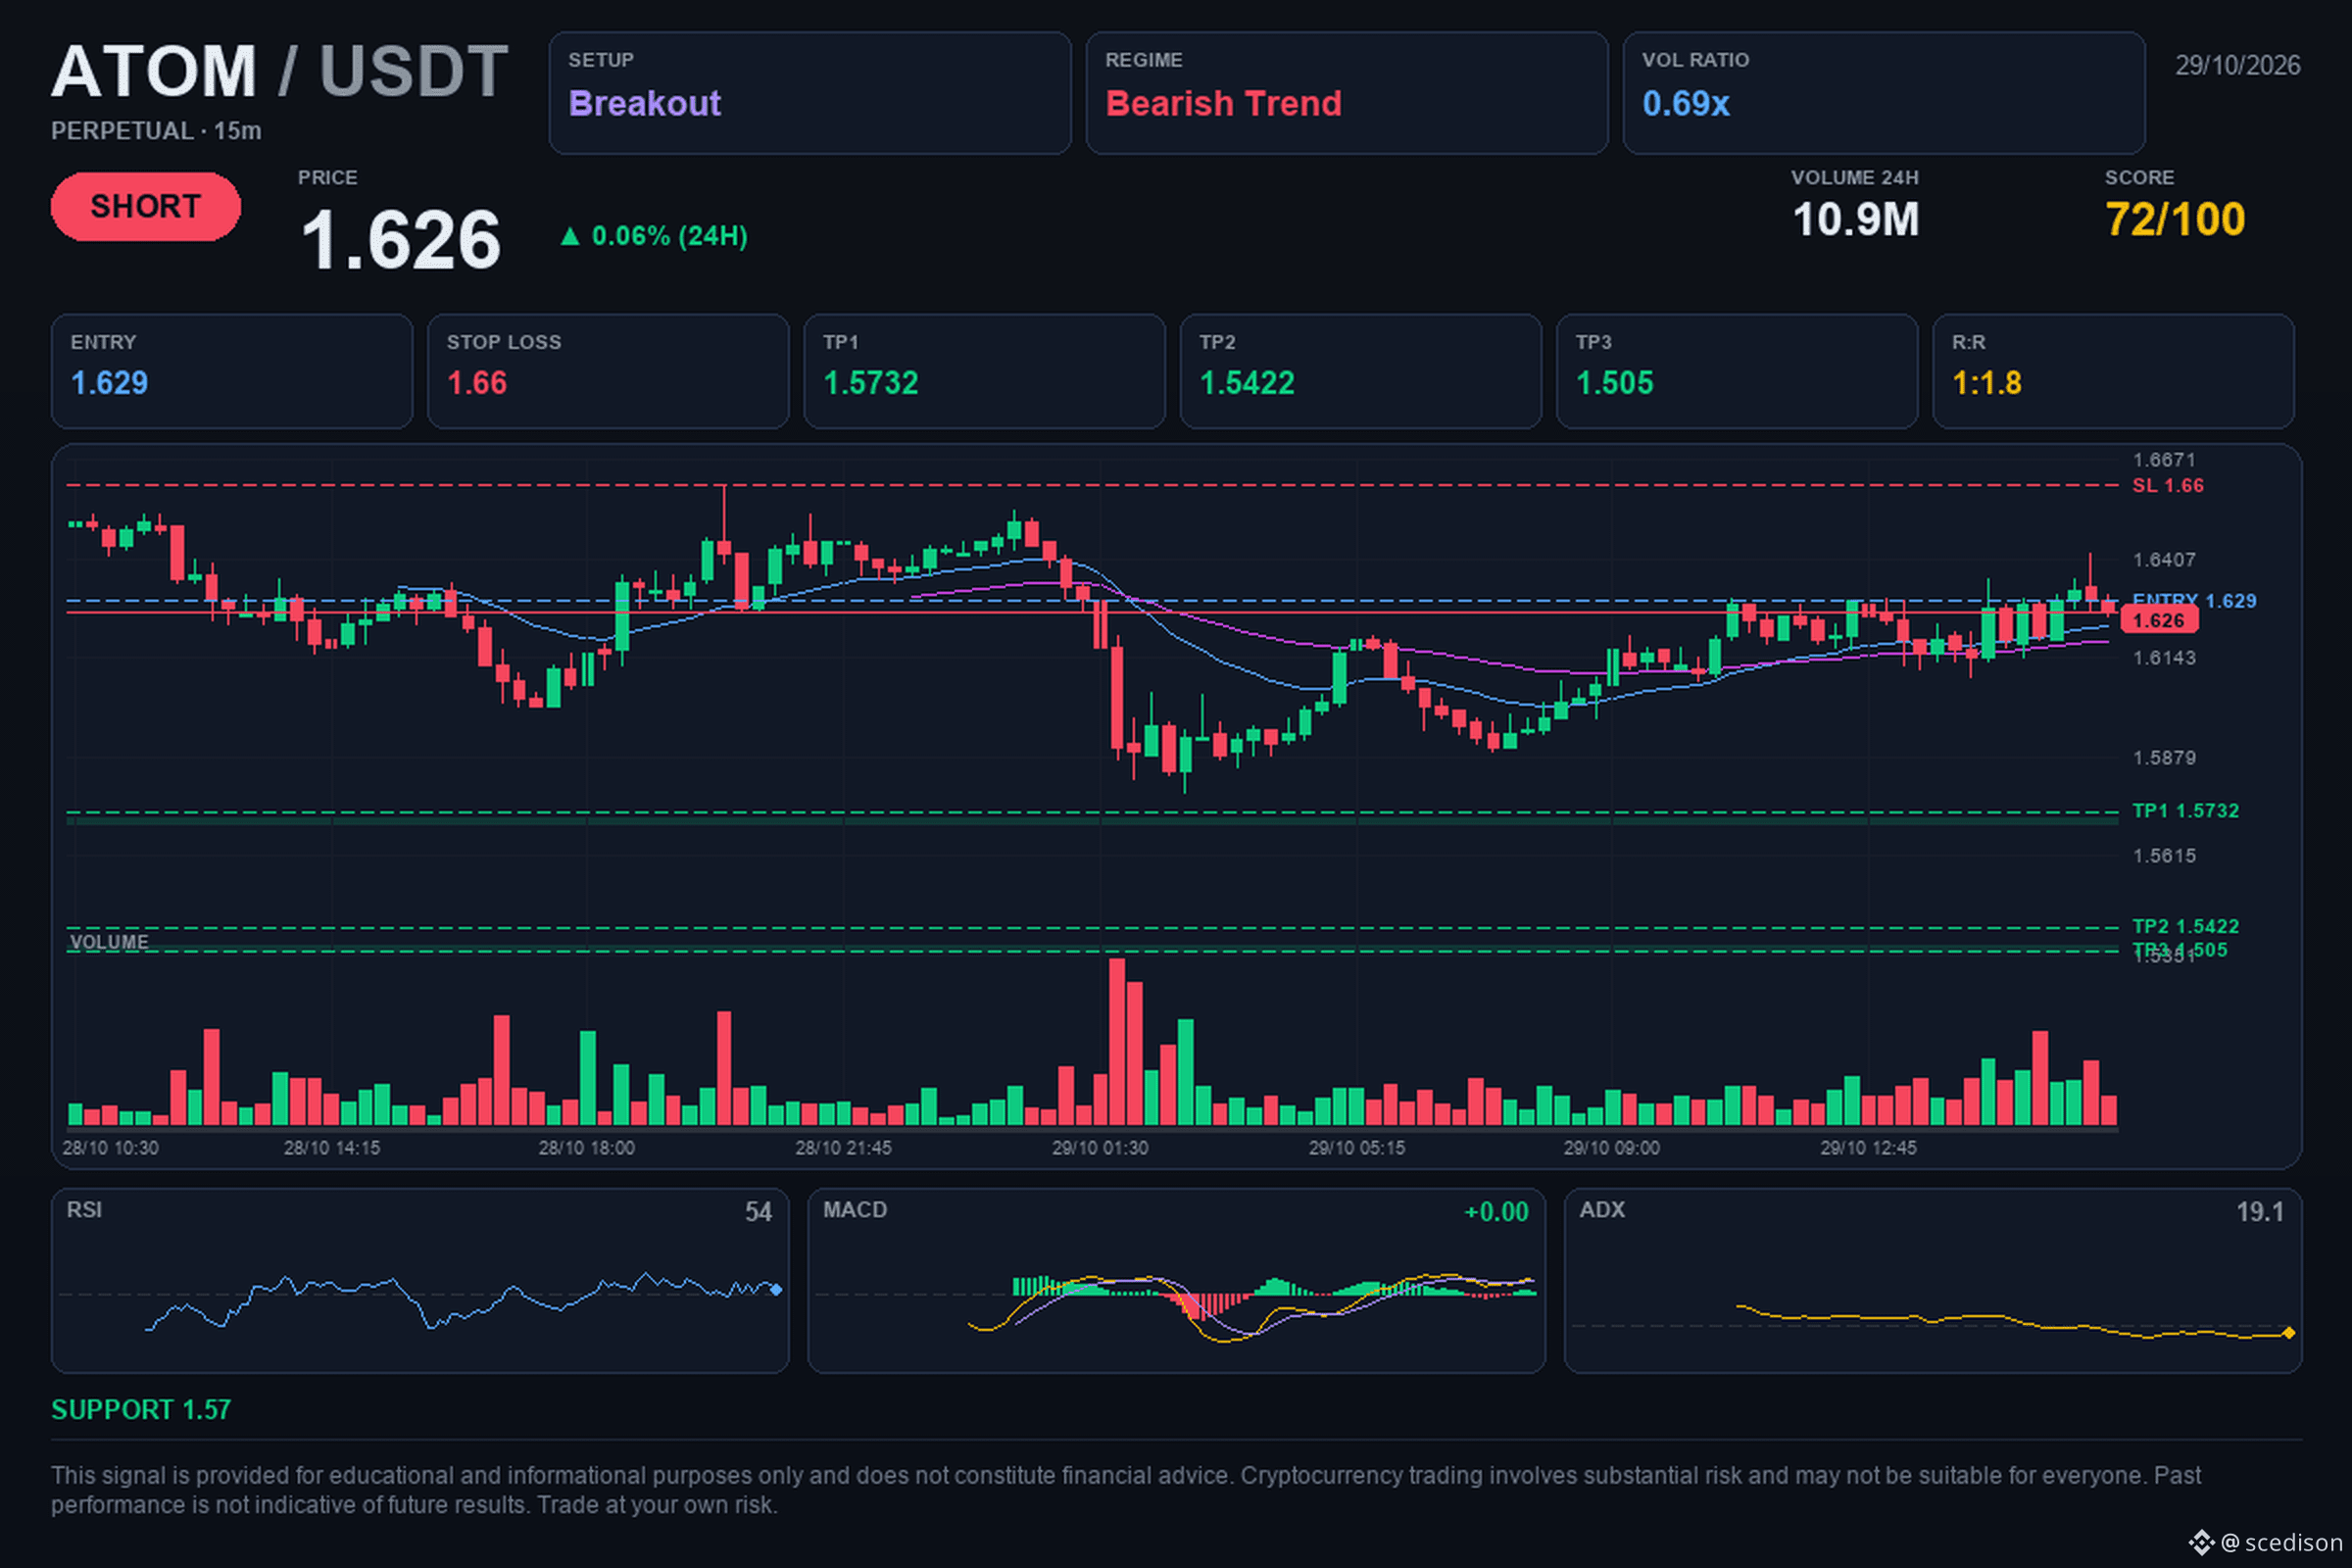
📢 $ATOM / USDT | 🔴 SHORT | ⭐ 73%
🎯 Target: $1.5732. Will it reach it?
🎯 Trading levels:
🔴 Entry: $1.629
🛑 Stop Loss: $1.66
🏁 TP1: $1.5732
🏁 TP2: $1.5422
🏁 TP3: $1.505
📈 Analysis:
The market structure shows a clear bearish trend, with lower lows and lower highs on the 4-hour timeframe. A confirmed bearish breakout is visible, accompanied by a significant increase in trading volume, reflecting increased selling pressure. This movement suggests that sellers remain in control of the current price direction.
⚖️ Risk/Reward: 1:1.8
⏱️ Timeframe: 15M
💭 A bearish breakout occurs when the price breaks through a previous support level, indicating a possible continuation of the decline.
#crypto #ATOM #trading #Bearish
💡 This analysis is for educational purposes and does not constitute financial advice. Do your own research and make your decision calmly.
10

·
--
If a few nodes in a network start lying, can the other nodes still arrive at the same ledger?
Byzantine fault tolerance is worth understanding.
Many proof-of-stake chains combine BFT voting with staking: voting power is calculated based on the amount staked, and validators who violate the rules have their stake slashed.
It’s okay to move a little slower—surviving matters much more than making a big profit once.
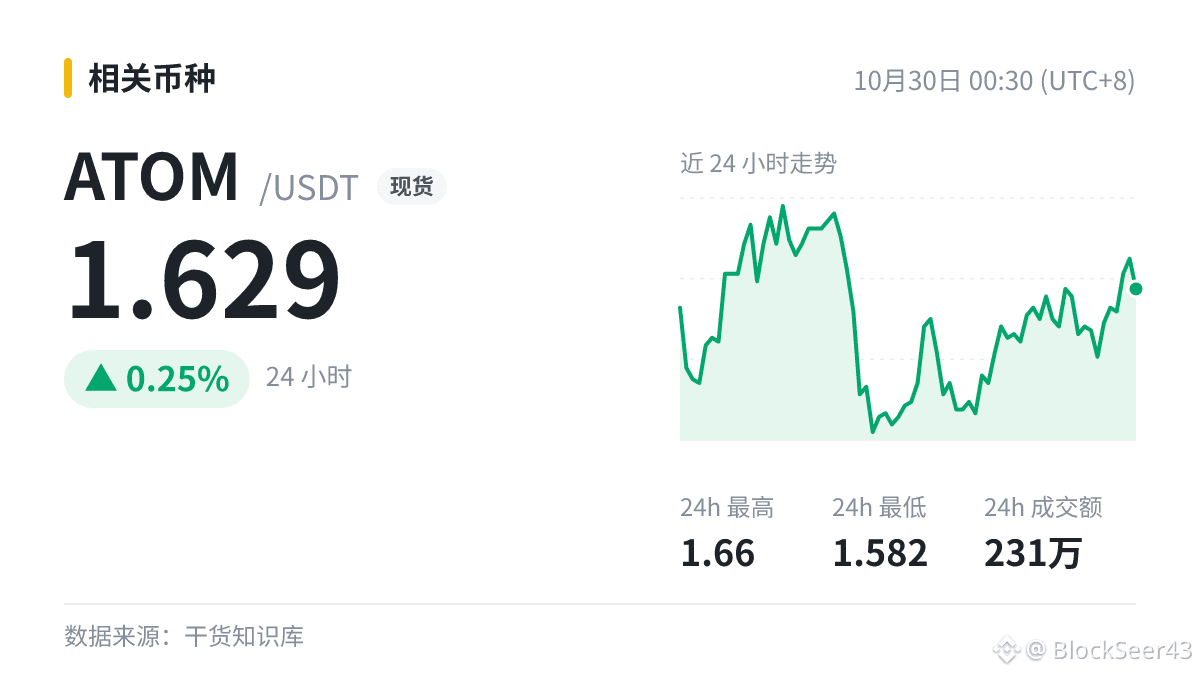
$ATOM is the native coin of Cosmos Hub, a chain that uses a Byzantine fault-tolerant consensus mechanism. Currently 1.623.
#ATOM
Crypto markets move fast, so don’t use too much leverage.

·
--
If a few dishonest nodes join the network, can the other nodes still arrive at the same ledger?
Bitcoin’s proof of work uses competition over computing power to decide who creates each block, keeping the ledger consistent as long as the honest side controls the majority of the computing power.
Key point: If you store large amounts of assets on a chain with very few validators, remember that collusion among just a few nodes could affect the ledger.
$ATOM is the native coin of Cosmos Hub, a chain that uses a Byzantine fault-tolerant consensus mechanism.
Don’t stake all your funds on a single judgment.
#ATOM

·
--
$ATOM
{future}(ATOMUSDT)
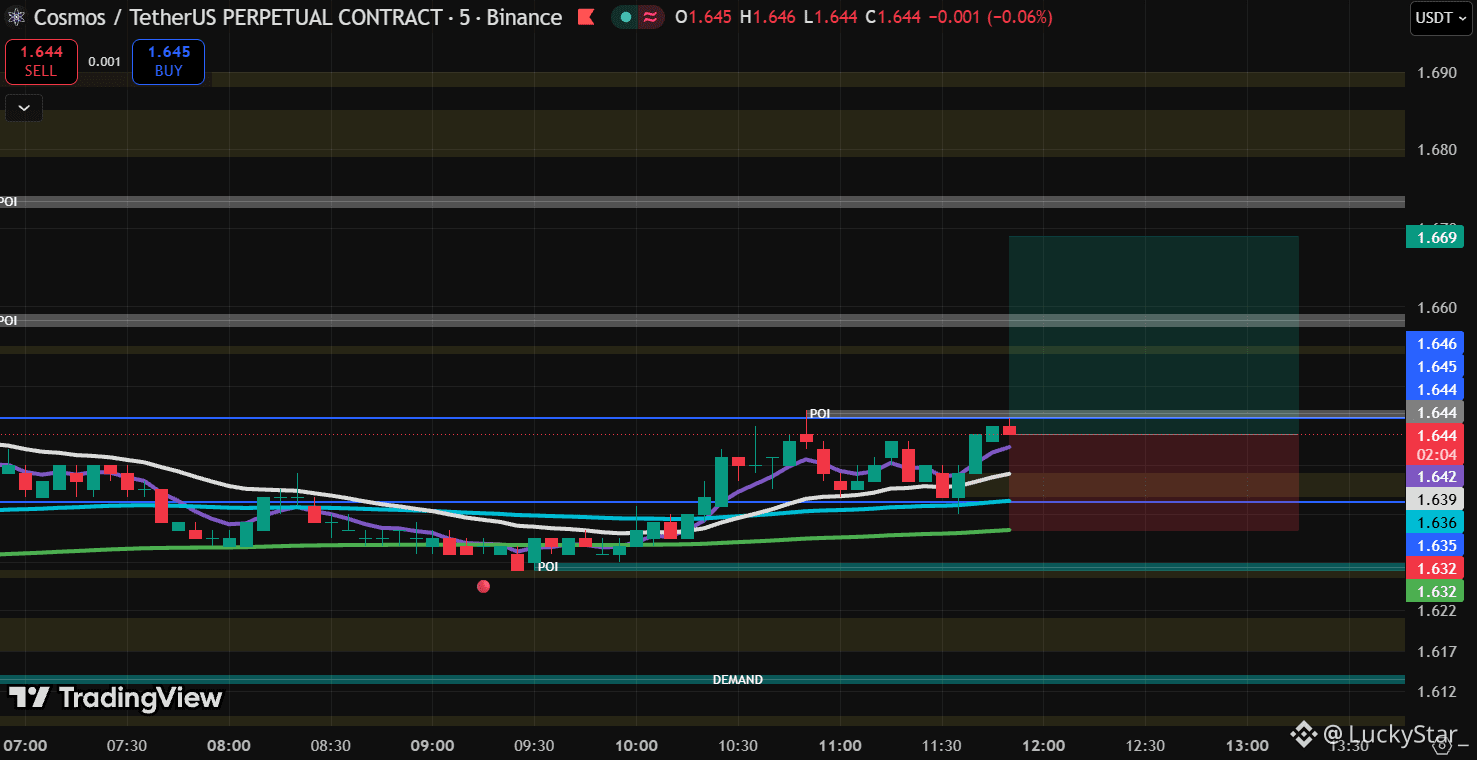
Whales are actively pushing the price up to get another accumulation of liquidity.
🚀 TIME FOR TREND CONTINUATION?
📊 The market looks stable.
#ATOM #ATOMUSDT #crypto #TechnicalAnalysis
$ATOM
Whales are actively pushing the price up to get another accumulation of liquidity.
🚀 TIME FOR TREND CONTINUATION?
📊 The market looks stable.
#ATOM #ATOMUSDT #crypto #TechnicalAnalysis
Whales are actively pushing the price up to get another accumulation of liquidity.
🚀 TIME FOR TREND CONTINUATION?
📊 The market looks stable.
#ATOM #ATOMUSDT #crypto #TechnicalAnalysis
15

·
--
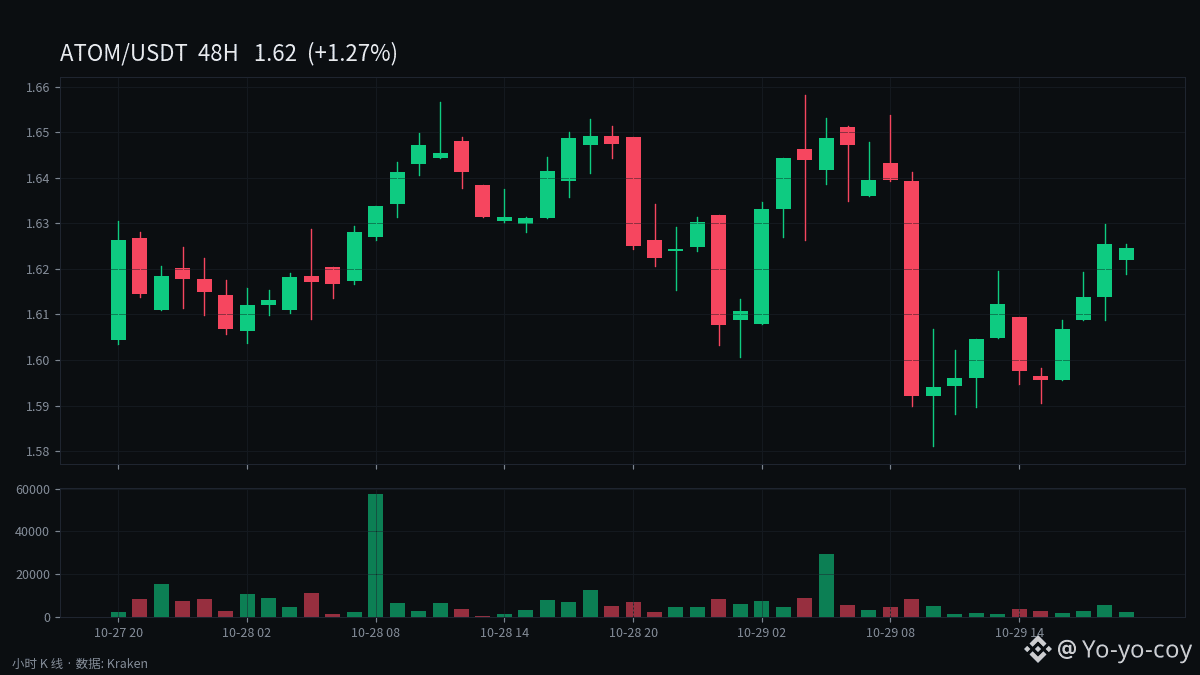
Bottom line: ATOM’s structure on October 29 showed typical resistance from all moving averages, with the price compressed around $1.60. The short-term direction remains dominated by bears.
Data (October 29, Blockchain.News / CoinPaprika):
- Spot price around $1.60, down about 2.2% over 24 hours, with a range of $1.58–$1.66. The daily ATR(14) is just $0.08, and the volatility bands have narrowed considerably.
- The 7-day moving average at $1.64, 12-day EMA at $1.67, 26-day EMA at $1.71, 20-day and 50-day moving averages at $1.73, and 200-day moving average at $1.71 are all above the current price.
- Resistance is first at $1.64 (aligned with the 7-day moving average), then at $1.69. Support is at $1.57, with strong support at $1.54, about two ATRs below the current price.
- Over longer periods, ATOM is down about 4.7% over 7 days, 6.3% over 30 days, and 46% over a year. It remains about 96% below its January 2022 all-time high of $44.55.
Notably, the stochastic indicator has entered deeply oversold territory, but the moving-average structure offers no sign of a trend reversal. In this compressed market, watch whether $1.57 holds; if it breaks, $1.54 is the next level. A rebound would need to reclaim $1.64 to escape this resistance zone.
$ATOM
#ATOM #Cosmos
Not investment advice
1

·
--
Bullish
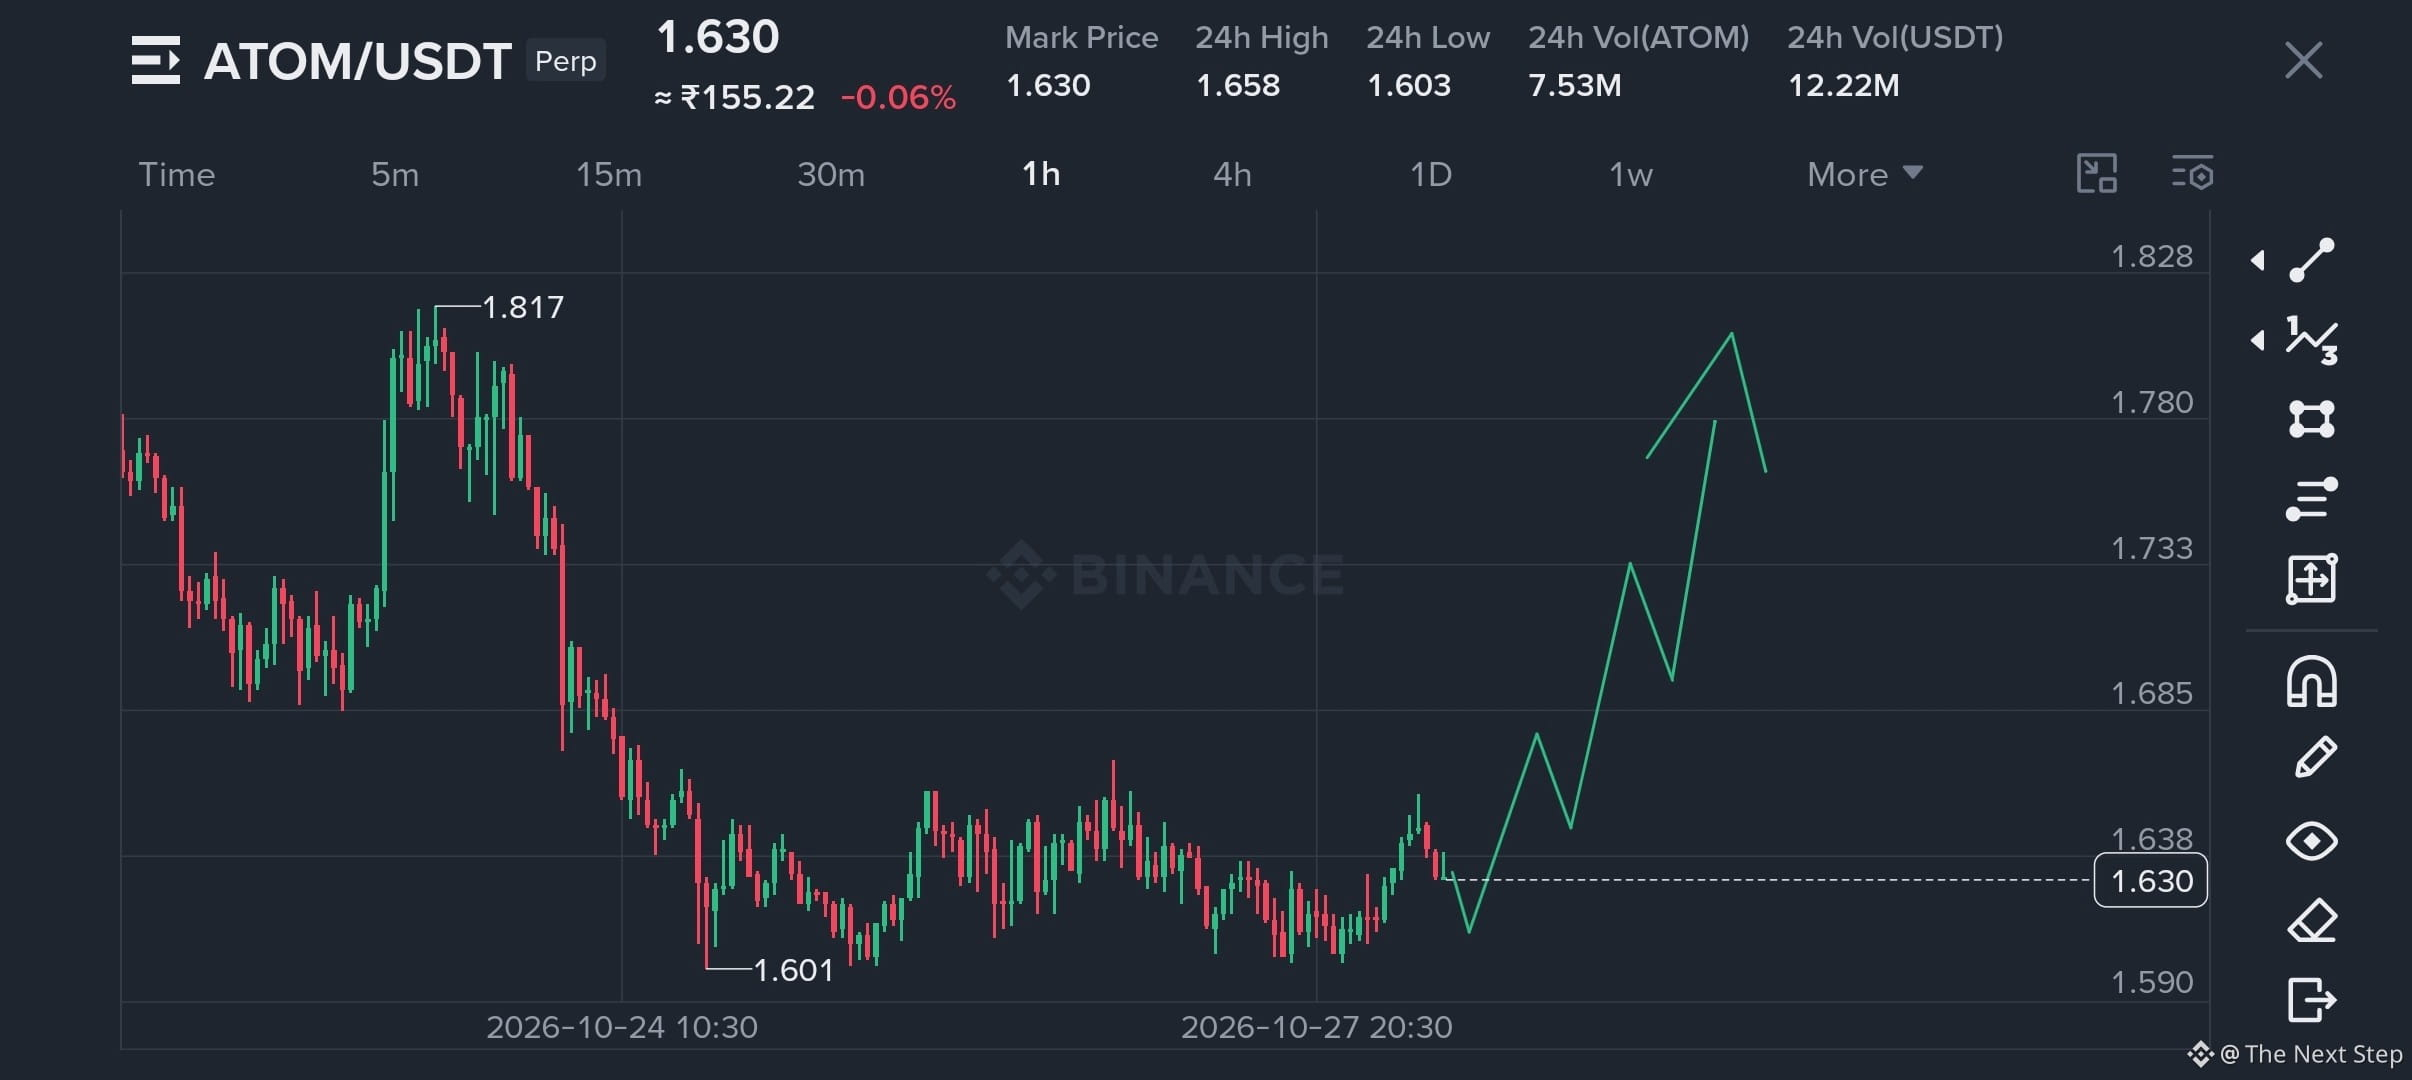
$ATOM Long Entry Now . . . 🔥
Bullish Trend📈 . . . .
Entry : 1.640-1.660
Stop Loss : 1.580
Target 🎯
TP : 1.680
TP : 1.750
TP : 1.800
TP : 1.850
Follow For More Trade ✨
Trade Here 👇
{future}(ATOMUSDT)
#ATOM #BTC #FOMCWatch
$ATOM Long Entry Now . . . 🔥
Bullish Trend📈 . . . .
Entry : 1.640-1.660
Stop Loss : 1.580
Target 🎯
TP : 1.680
TP : 1.750
TP : 1.800
TP : 1.850
Follow For More Trade ✨
Trade Here 👇
#ATOM #BTC #FOMCWatch
Bullish Trend📈 . . . .
Entry : 1.640-1.660
Stop Loss : 1.580
Target 🎯
TP : 1.680
TP : 1.750
TP : 1.800
TP : 1.850
Follow For More Trade ✨
Trade Here 👇
#ATOM #BTC #FOMCWatch
73

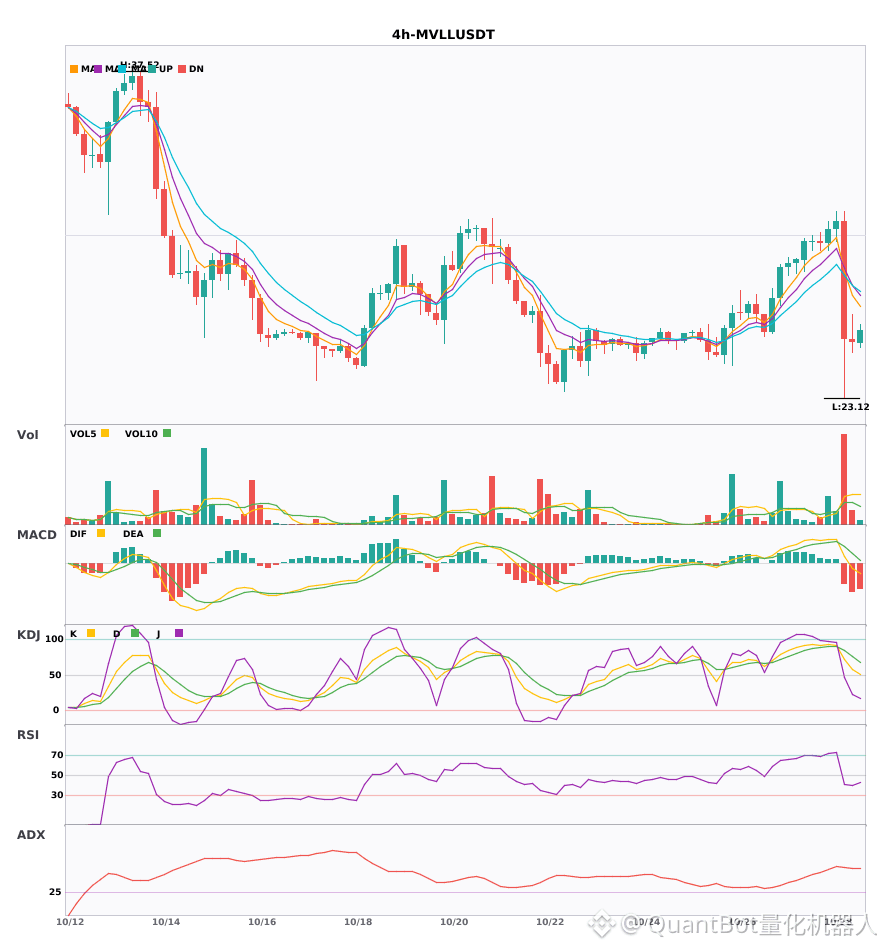
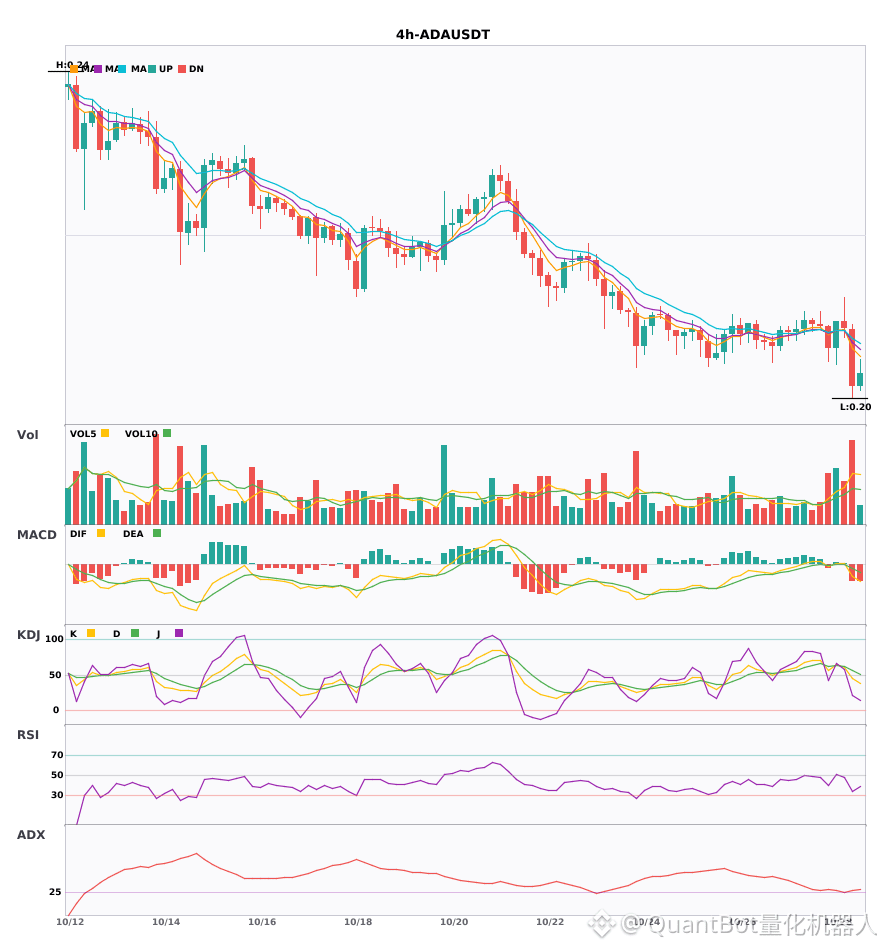
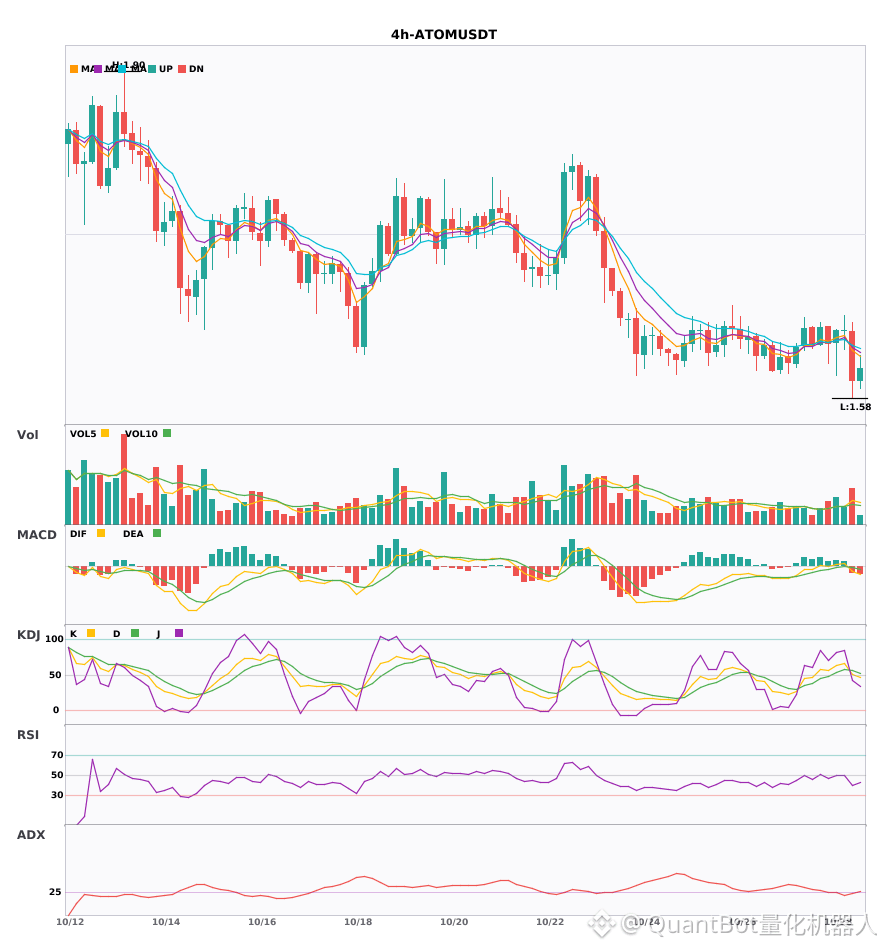
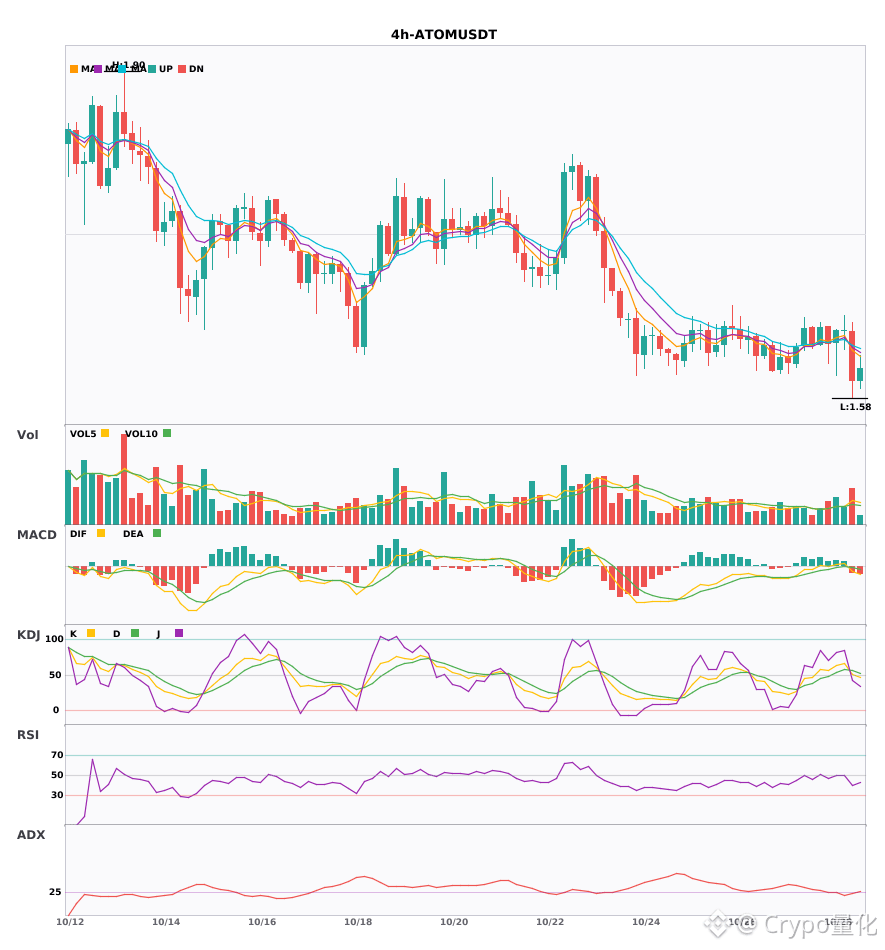
3 four-hour bearish alerts: $MVLL / $ADA / $ATOM
📉 $MVLL | 4-hour bearish signal
━━━━━━━━━━━━━━━━━━
Technical analysis: ADX(57) Very strong trend (beware of an overheated pullback) | MACD DIF has fallen below the zero line, indicating a bearish trend | EMA5 < EMA8 < EMA13, bearish alignment | KDJ is running strong, with bulls in control (K: 57.8, D: 75.4) | Volume surge (4.1x)
Price change: -0.5800%
📉 $ADA | 4-hour bearish signal
━━━━━━━━━━━━━━━━━━
Technical analysis: ADX(27) Trend is forming; entry is possible | MACD bearish cross below zero, bearish momentum accelerating | EMA5 crossed below EMA8, short-term outlook turns bearish | Increased volume (2.3x)
Price change: -4.1800%
📉 $ATOM | 4-hour bearish signal
━━━━━━━━━━━━━━━━━━
Technical analysis: ADX(25) Trend is forming; entry is possible | MACD bearish cross below zero, bearish momentum accelerating | EMA5 crossed below EMA8, short-term outlook turns bearish | KDJ bearish cross, short-term outlook is bearish (K: 51.4, D: 55.7) | Increased volume (1.8x)
Price change: -3.0400%
━━━━━━━━━━━━━━━━━━
#技术分析 #MVLL #ADA #ATOM
📌 The above content is for reference only and does not constitute investment advice

·
--
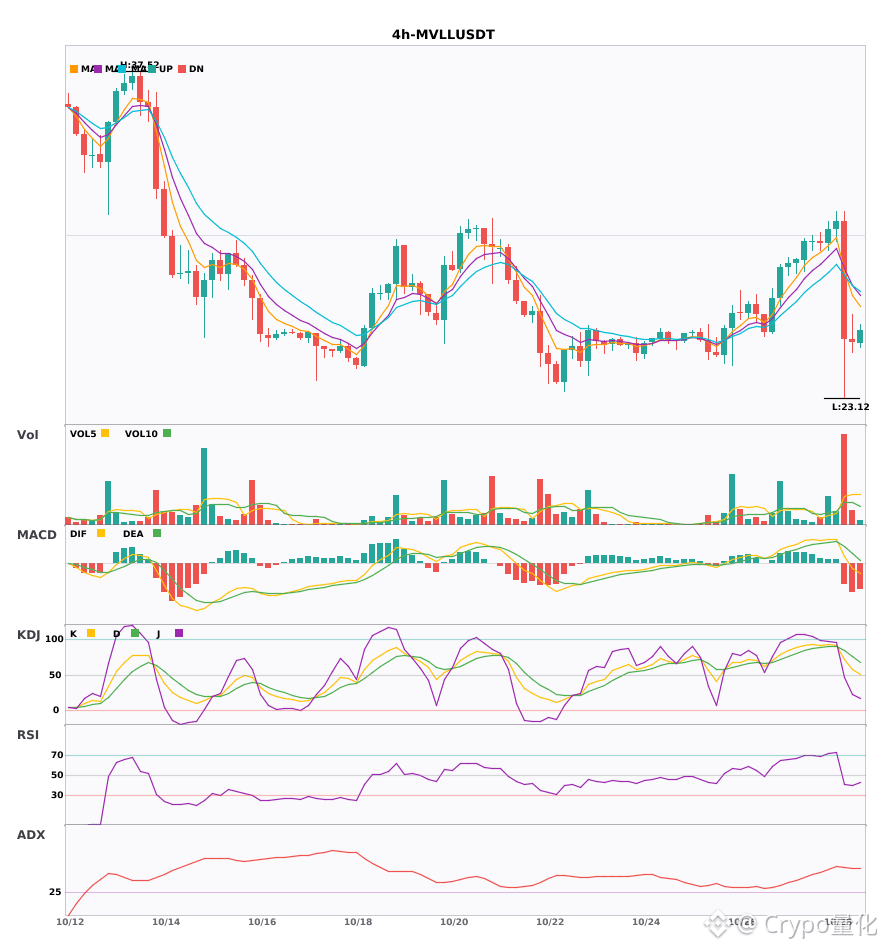
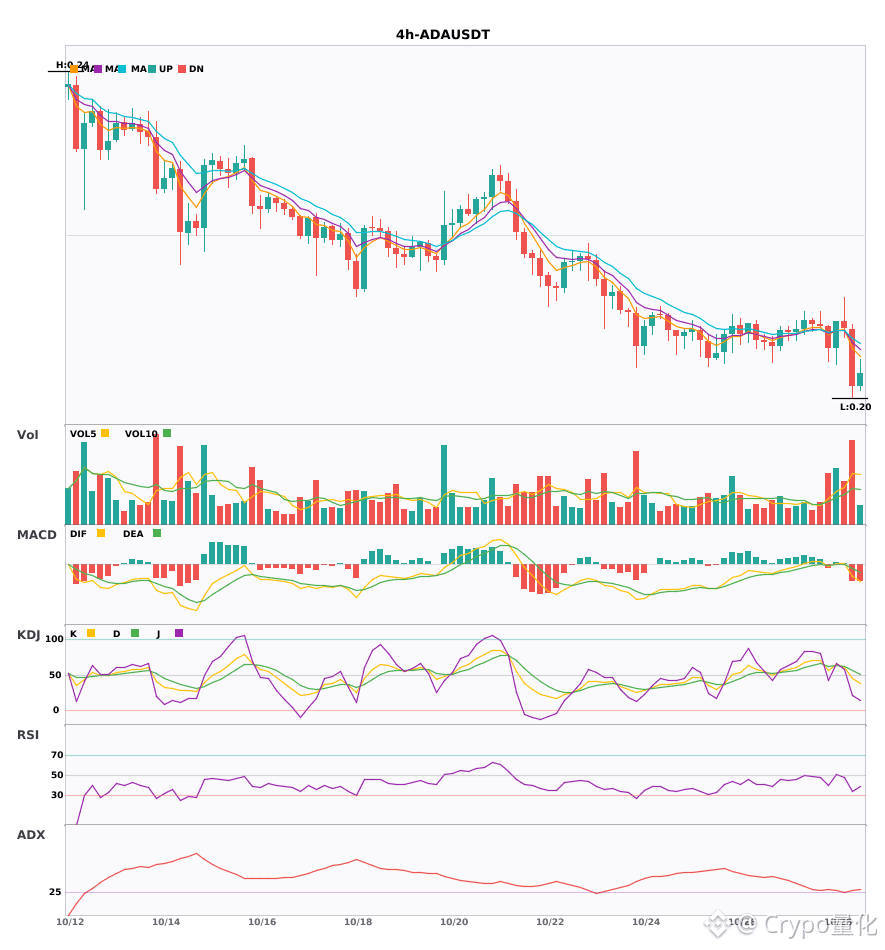
$MVLL / $ADA / $ATOM 4-hour confluence turns bearish; bearish signals have appeared simultaneously 🔥
════════════════════
🟢 $MVLL 4-hour bearish signal
⚠️ Technicals: ADX (57): very strong trend (beware of a potentially overheated pullback) | MACD DIF fell below the zero line, signaling a bearish trend | EMA5 < EMA8 < EMA13, bearish alignment | KDJ is running strong, with bulls in control (K: 57.8, D: 75.4) | Volume surged (4.1x)
════════════════════
🟢 $ADA 4-hour bearish signal
⚠️ Technicals: ADX (27): trend is forming; entry is possible | MACD bearish crossover below zero, accelerating bearish momentum | EMA5 crossed below EMA8, turning bearish in the short term | Volume increased (2.3x)
════════════════════
🟢 $ATOM 4-hour bearish signal
⚠️ Technicals: ADX (25): trend is forming; entry is possible | MACD bearish crossover below zero, accelerating bearish momentum | EMA5 crossed below EMA8, turning bearish in the short term | KDJ bearish crossover, short-term outlook is bearish (K: 51.4, D: 55.7) | Volume increased (1.8x)
════════════════════
🔔 Follow for real-time market updates 🔔
#技术分析 #MVLL #ADA #ATOM
📌 When trading, pay attention to whether the candlestick pattern confirms the setup.
════════════════════
🟢 $MVLL 4-hour bearish signal
⚠️ Technicals: ADX (57): very strong trend (beware of a potentially overheated pullback) | MACD DIF fell below the zero line, signaling a bearish trend | EMA5 < EMA8 < EMA13, bearish alignment | KDJ is running strong, with bulls in control (K: 57.8, D: 75.4) | Volume surged (4.1x)
════════════════════
🟢 $ADA 4-hour bearish signal
⚠️ Technicals: ADX (27): trend is forming; entry is possible | MACD bearish crossover below zero, accelerating bearish momentum | EMA5 crossed below EMA8, turning bearish in the short term | Volume increased (2.3x)
════════════════════
🟢 $ATOM 4-hour bearish signal
⚠️ Technicals: ADX (25): trend is forming; entry is possible | MACD bearish crossover below zero, accelerating bearish momentum | EMA5 crossed below EMA8, turning bearish in the short term | KDJ bearish crossover, short-term outlook is bearish (K: 51.4, D: 55.7) | Volume increased (1.8x)
════════════════════
🔔 Follow for real-time market updates 🔔
#技术分析 #MVLL #ADA #ATOM
📌 When trading, pay attention to whether the candlestick pattern confirms the setup.
7
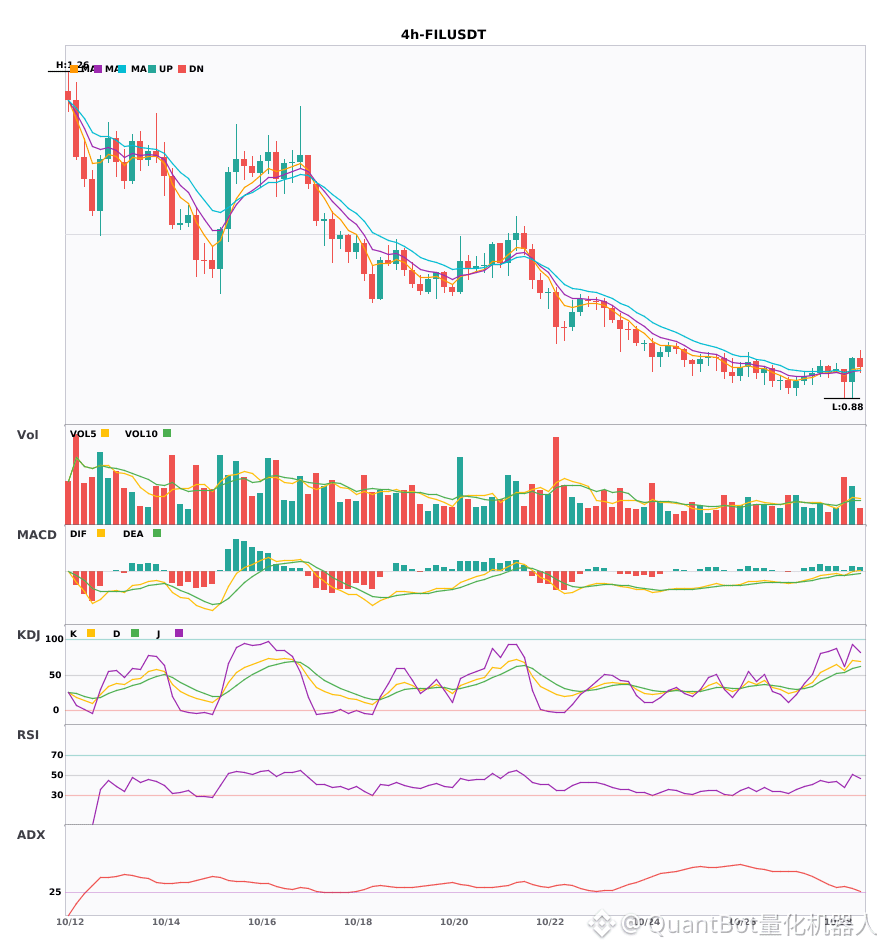
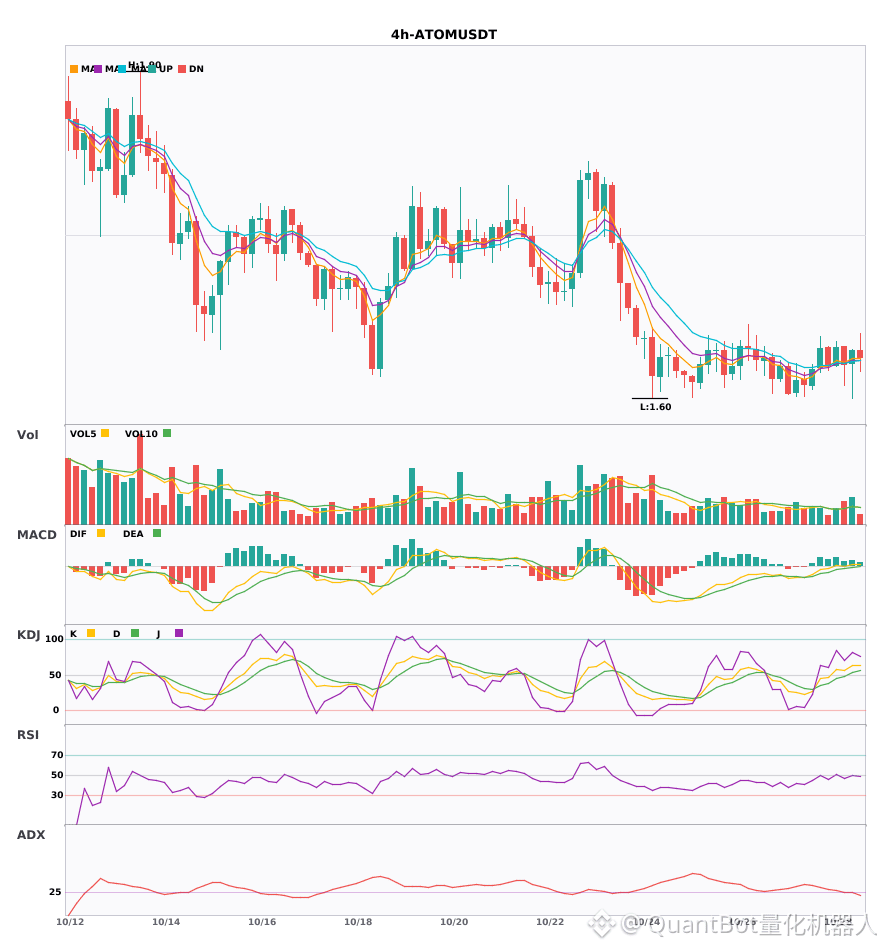
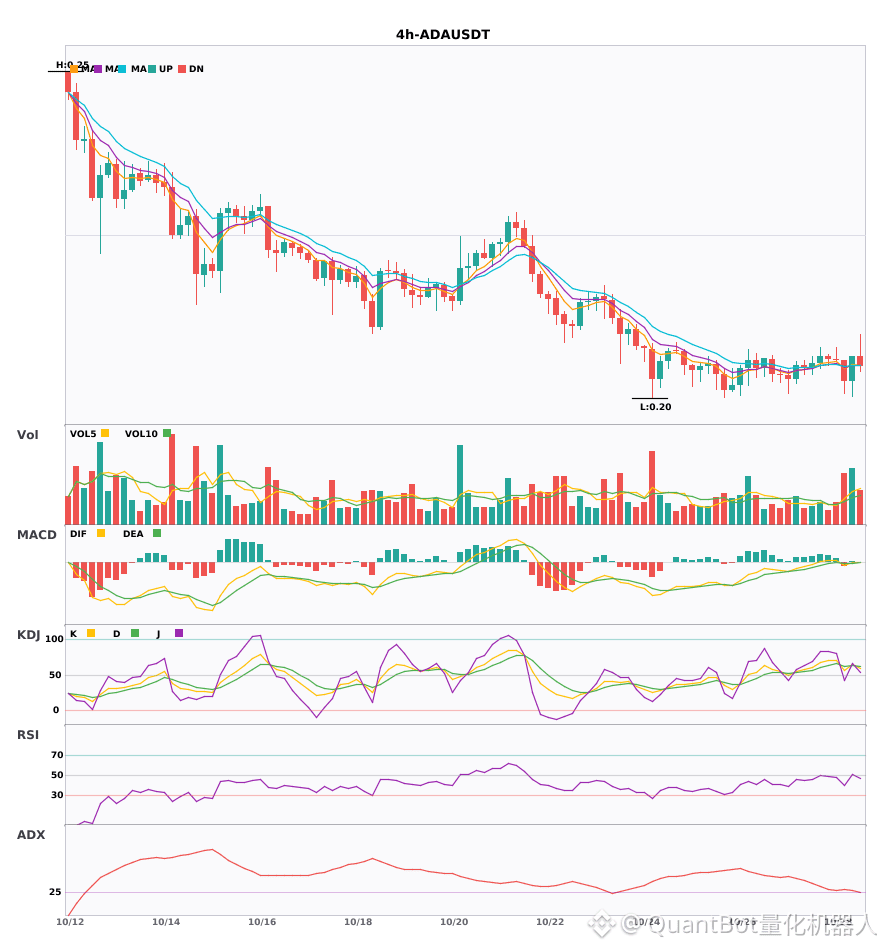
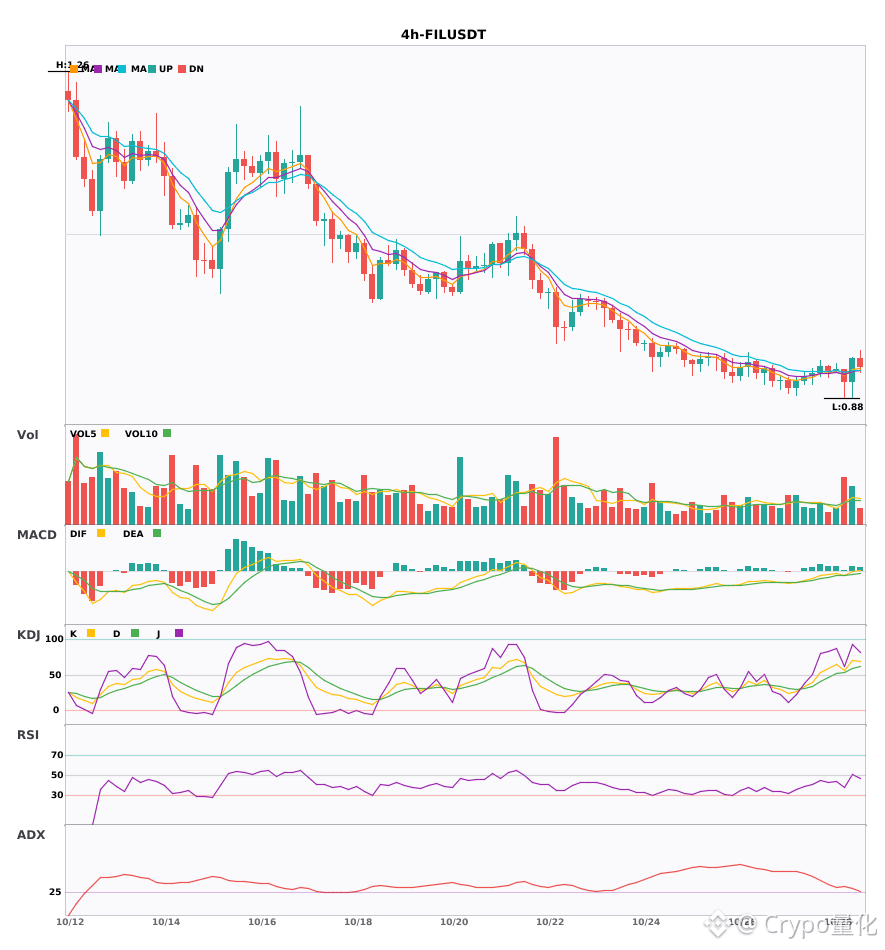
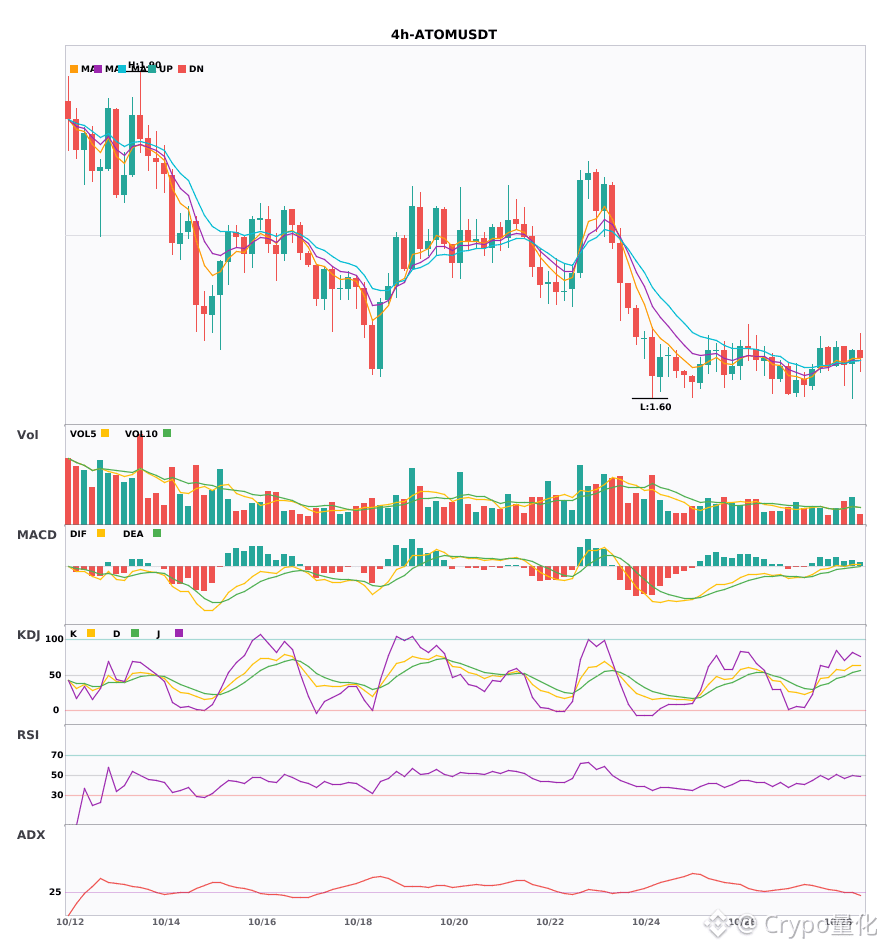
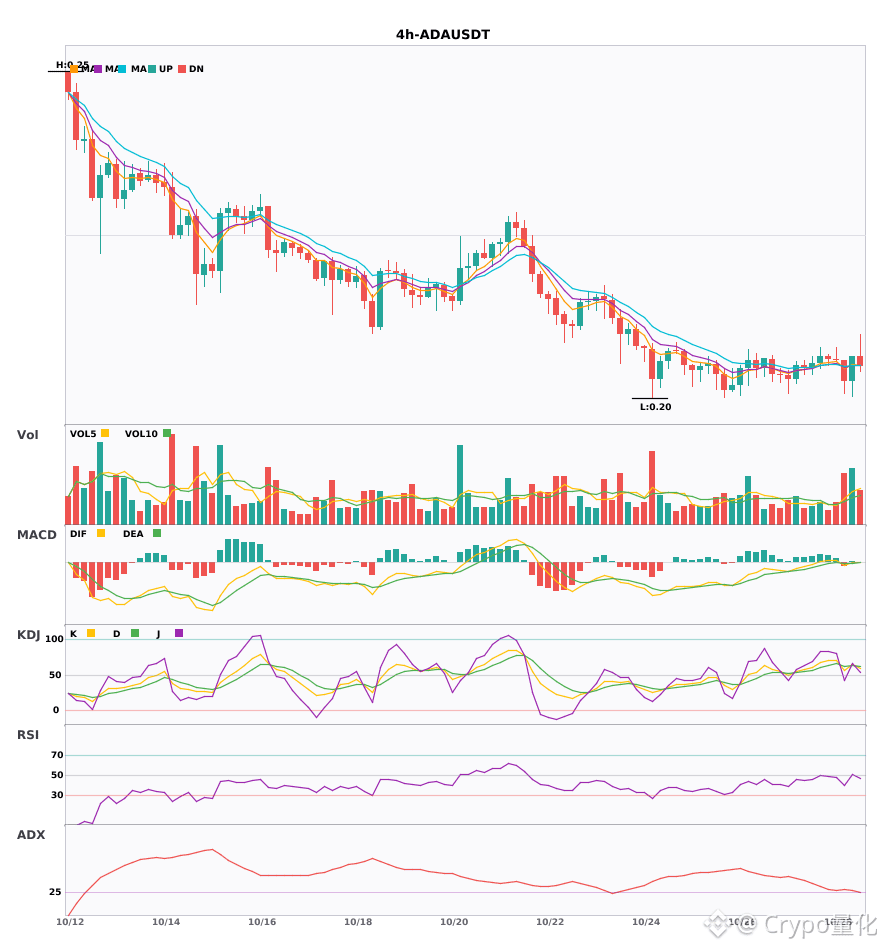
$FIL / $ATOM / $ADA 4-hour technical signals are strengthening in sync. Which has the greatest breakout potential?
📈 $FIL | 4-hour bullish signal
━━━━━━━━━━━━━━━━━━
Technical analysis: ADX(29) Trend is forming; entry is possible | MACD DIF breaks above zero, trend turns bullish | EMA5 crosses above EMA8, short-term trend turns bullish | KDJ is strong, bulls have the upper hand (K: 70.4, D: 59.3) | Volume increases (2.1x)
Price change: 3.2300%
📌 Market update: Binance Will Support the Filecoin (FIL) Network Upgrade & Hard Fork - 2026-10-19
📈 $ATOM | 4-hour bullish signal
━━━━━━━━━━━━━━━━━━
Technical analysis: ADX(26) Trend is forming; entry is possible | MACD is bullish, trend is strong, momentum is increasing | EMA5 > EMA8 > EMA13, bullish alignment | KDJ is strong, bulls have the upper hand (K: 62.8, D: 53.3) | Volume increases (1.5x)
Price change: 0.8600%
📈 $ADA | 4-hour bullish signal
━━━━━━━━━━━━━━━━━━
Technical analysis: ADX(28) Trend is forming; entry is possible | MACD golden cross above zero, bullish momentum is emerging | EMA5 crosses above EMA8, short-term trend turns bullish | KDJ golden cross, short-term outlook is bullish (K: 64.2, D: 63.1) | Volume increases (2.2x)
Price change: 2.0200%
━━━━━━━━━━━━━━━━━━
#技术分析 #FIL #ATOM #ADA
📌 The above is for informational purposes only and does not constitute investment advice
19
·
--
Three 4-hour bullish signals appeared simultaneously: $FIL / $ATOM / $ADA🔥
════════════════════
🔴 $FIL 4-hour bullish signal
⚠️Technical analysis: ADX(29): Trend is forming; potential entry | MACDDIF breaks above zero, trend turns bullish | EMA5 crosses above EMA8, short-term outlook turns bullish | KDJ is strong, bulls have the upper hand (K: 70.4, D: 59.3) | Volume increases (2.1x)
📢Market update: Binance Will Support the Filecoin (FIL) Network Upgrade & Hard Fork - 2026-10-19
════════════════════
🔴 $ATOM 4-hour bullish signal
⚠️Technical analysis: ADX(26): Trend is forming; potential entry | MACD is bullish, trend is strong and momentum is increasing | EMA5 > EMA8 > EMA13, bullish alignment | KDJ is strong, bulls have the upper hand (K: 62.8, D: 53.3) | Volume increases (1.5x)
════════════════════
🔴 $ADA 4-hour bullish signal
⚠️Technical analysis: ADX(28): Trend is forming; potential entry | MACD golden cross above zero, bullish momentum is building | EMA5 crosses above EMA8, short-term outlook turns bullish | KDJ golden cross, short-term outlook is bullish (K: 64.2, D: 63.1) | Volume increases (2.2x)
════════════════════
🔔 Follow for the latest market movements 🔔
#技术分析 #FIL #ATOM #ADA
📌 When trading, pay attention to whether the candlestick pattern confirms the setup
Three 4-hour bullish signals appeared simultaneously: $FIL / $ATOM / $ADA 🔥
════════════════════
🔴 $FIL 4-hour bullish signal
⚠️Technical analysis: ADX(29): Trend is forming; potential entry | MACDDIF breaks above zero, trend turns bullish | EMA5 crosses above EMA8, short-term outlook turns bullish | KDJ is strong, bulls have the upper hand (K: 70.4, D: 59.3) | Volume increases (2.1x)
📢Market update: Binance Will Support the Filecoin (FIL) Network Upgrade & Hard Fork - 2026-10-19
════════════════════
🔴 $ATOM 4-hour bullish signal
⚠️Technical analysis: ADX(26): Trend is forming; potential entry | MACD is bullish, trend is strong and momentum is increasing | EMA5 > EMA8 > EMA13, bullish alignment | KDJ is strong, bulls have the upper hand (K: 62.8, D: 53.3) | Volume increases (1.5x)
════════════════════
🔴 $ADA 4-hour bullish signal
⚠️Technical analysis: ADX(28): Trend is forming; potential entry | MACD golden cross above zero, bullish momentum is building | EMA5 crosses above EMA8, short-term outlook turns bullish | KDJ golden cross, short-term outlook is bullish (K: 64.2, D: 63.1) | Volume increases (2.2x)
════════════════════
🔔 Follow for the latest market movements 🔔
#技术分析 #FIL #ATOM #ADA
📌 When trading, pay attention to whether the candlestick pattern confirms the setup
════════════════════
🔴 $FIL 4-hour bullish signal
⚠️Technical analysis: ADX(29): Trend is forming; potential entry | MACDDIF breaks above zero, trend turns bullish | EMA5 crosses above EMA8, short-term outlook turns bullish | KDJ is strong, bulls have the upper hand (K: 70.4, D: 59.3) | Volume increases (2.1x)
📢Market update: Binance Will Support the Filecoin (FIL) Network Upgrade & Hard Fork - 2026-10-19
════════════════════
🔴 $ATOM 4-hour bullish signal
⚠️Technical analysis: ADX(26): Trend is forming; potential entry | MACD is bullish, trend is strong and momentum is increasing | EMA5 > EMA8 > EMA13, bullish alignment | KDJ is strong, bulls have the upper hand (K: 62.8, D: 53.3) | Volume increases (1.5x)
════════════════════
🔴 $ADA 4-hour bullish signal
⚠️Technical analysis: ADX(28): Trend is forming; potential entry | MACD golden cross above zero, bullish momentum is building | EMA5 crosses above EMA8, short-term outlook turns bullish | KDJ golden cross, short-term outlook is bullish (K: 64.2, D: 63.1) | Volume increases (2.2x)
════════════════════
🔔 Follow for the latest market movements 🔔
#技术分析 #FIL #ATOM #ADA
📌 When trading, pay attention to whether the candlestick pattern confirms the setup
6

·
--
⚛️ Top 3 Cosmos Ecosystem Coins to Watch
Cosmos connects independent chains through IBC:
1️⃣ $ATOM: the hub token of the Cosmos ecosystem.
2️⃣ $INJ (Injective): a finance-focused chain for trading and derivatives.
3️⃣ $TIA (Celestia): a modular data availability layer used by rollups.
⚠️ How much value ATOM captures from the ecosystem is still debated, so I focus on real usage over narrative.
Which Cosmos coin are you holding? 👇
Not financial advice. DYOR.
#Cosmos #ATOM #Binance
⚛️ Top 3 Cosmos Ecosystem Coins to Watch
Cosmos connects independent chains through IBC:
1️⃣ $ATOM : the hub token of the Cosmos ecosystem.
2️⃣ $INJ (Injective): a finance-focused chain for trading and derivatives.
3️⃣ $TIA (Celestia): a modular data availability layer used by rollups.
⚠️ How much value ATOM captures from the ecosystem is still debated, so I focus on real usage over narrative.
Which Cosmos coin are you holding? 👇
Not financial advice. DYOR.
#Cosmos #ATOM #Binance

2
1k

·
--
Bearish
$ATOM
{future}(ATOMUSDT)
⚡ ATOMUSDT — Short Watch
• Live Price: $1.641 •
Margin: Isolated •
Setup: Weak Bounce Rejection •
Entry Zone: $1.655 – $1.675 •
Invalidation: $1.695 •
Targets: $1.630 / $1.610 / $1.585
#ATOM #ATOM空投 #Atomone #atom #BitmineAdds10452ETH
$ATOM
⚡ ATOMUSDT — Short Watch
• Live Price: $1.641 •
Margin: Isolated •
Setup: Weak Bounce Rejection •
Entry Zone: $1.655 – $1.675 •
Invalidation: $1.695 •
Targets: $1.630 / $1.610 / $1.585
#ATOM #ATOM空投 #Atomone #atom #BitmineAdds10452ETH
⚡ ATOMUSDT — Short Watch
• Live Price: $1.641 •
Margin: Isolated •
Setup: Weak Bounce Rejection •
Entry Zone: $1.655 – $1.675 •
Invalidation: $1.695 •
Targets: $1.630 / $1.610 / $1.585
#ATOM #ATOM空投 #Atomone #atom #BitmineAdds10452ETH
92

🚀 3 CRYPTO COINS TO WATCH THIS WEEK! 📈
The next opportunity could be closer than you think. Keep these 3 coins on your radar! 👀
🔹 1. $ATOM — Cosmos
🎯 Watch for: A breakout with strong volume
📍 Entry: After resistance confirmation
💰 TP1: +3% | TP2: +5% | TP3: +8%
🔹 2. $LTC — Litecoin
🎯 Watch for: A bounce from a strong support zone
📍 Entry: After bullish confirmation
💰 TP1: +2% | TP2: +4% | TP3: +6%
🔹 3. $UNI — Uniswap
🎯 Watch for: A bullish trend reversal
📍 Entry: After a confirmed breakout
💰 TP1: +3% | TP2: +6% | TP3: +9%
💡 Smart Trading Plan
✅ Confirm the chart before entering
✅ Set targets in advance
✅ Take profits according to your plan
🔥 Which coin looks strongest to you — ATOM, LTC, or UNI?
Comment below! 👇
❤️ Like | 🔁 Repost | ➕ Follow for more crypto updates!
#ATOM #LTC #UNI #CryptoTrading #Altcoins
{spot}(UNIUSDT)
{spot}(LTCUSDT)
{spot}(ATOMUSDT)
🚀 3 CRYPTO COINS TO WATCH THIS WEEK! 📈
The next opportunity could be closer than you think. Keep these 3 coins on your radar! 👀
🔹 1. $ATOM — Cosmos
🎯 Watch for: A breakout with strong volume
📍 Entry: After resistance confirmation
💰 TP1: +3% | TP2: +5% | TP3: +8%
🔹 2. $LTC — Litecoin
🎯 Watch for: A bounce from a strong support zone
📍 Entry: After bullish confirmation
💰 TP1: +2% | TP2: +4% | TP3: +6%
🔹 3. $UNI — Uniswap
🎯 Watch for: A bullish trend reversal
📍 Entry: After a confirmed breakout
💰 TP1: +3% | TP2: +6% | TP3: +9%
💡 Smart Trading Plan
✅ Confirm the chart before entering
✅ Set targets in advance
✅ Take profits according to your plan
🔥 Which coin looks strongest to you — ATOM, LTC, or UNI?
Comment below! 👇
❤️ Like | 🔁 Repost | ➕ Follow for more crypto updates!
#ATOM #LTC #UNI #CryptoTrading #Altcoins
237
·
--
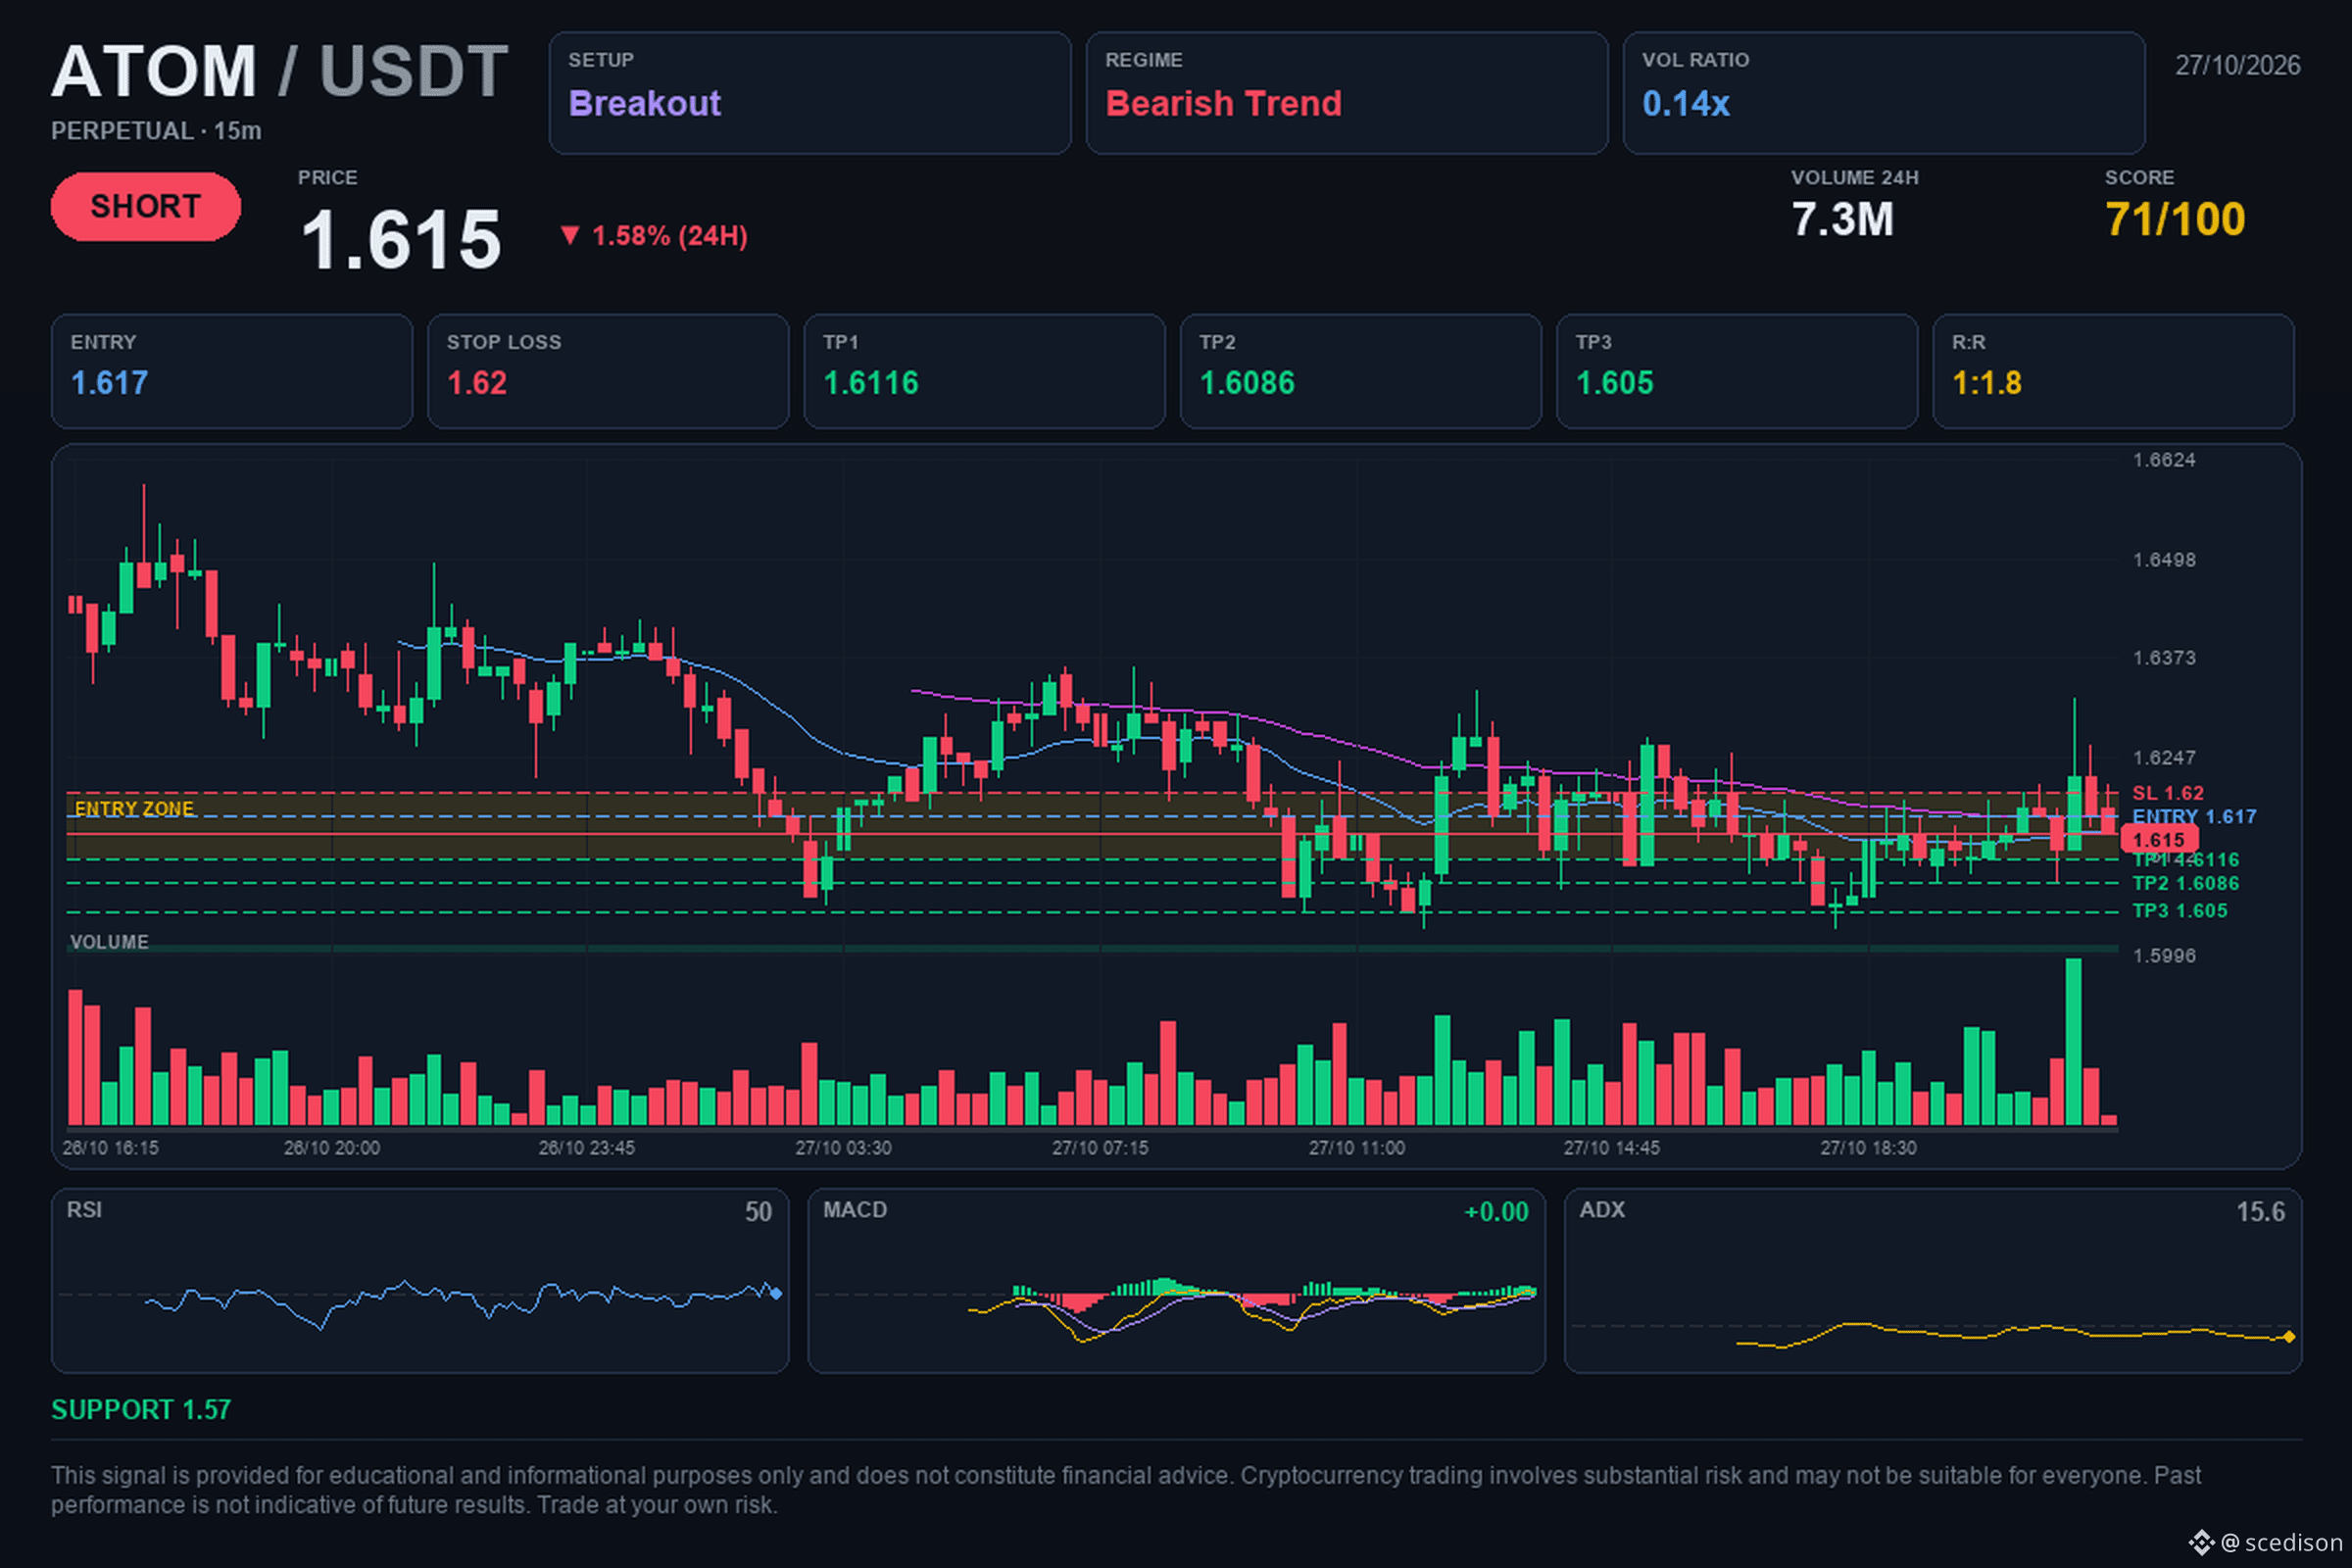
📢 $ATOM / USDT | 🔴 SHORT | ⭐ 71%
🎯 Target: $1.6116. Will it reach it?
🎯 Trade levels:
🔴 Entry: $1.617
🛑 Stop Loss: $1.62
🏁 TP1: $1.6116
🏁 TP2: $1.6086
🏁 TP3: $1.605
📈 Analysis:
The current structure shows a well-established downtrend, with lower highs forming on the 4-hour timeframe. We’re seeing selling pressure supported by a 50.6% increase in relative volume, suggesting growing interest in the downward move. The break below current support levels reinforces this technical setup for sellers.
⚖️ Risk/Reward: 1:1.8
⏱️ Timeframe: 15M
#crypto #ATOM #trading #Bearish
💡 This analysis is for educational purposes and does not constitute financial advice. Do your own research and make your decision calmly.
13
Log in to explore more content
Join global crypto users on Binance Square
⚡️ Get latest and useful information about crypto.
💬 Trusted by the world’s largest crypto exchange.
👍 Discover real insights from verified creators.
Email / Phone number
Trending Topics
1
#$1.5BInLeveragedCryptoBetsLiquidated
2,241 views
41 Discussing
2
#KOSPIFalls3.53%BackBelow6000
5,017 views
188 Discussing
3
#USMidtermElections
112,755 views
1,434 Discussing
4
#StrategySTRCReaches$99.95ForFirstTimeIn165Days
1,797 views
56 Discussing
5
#BinanceWillListPredictPREDICT
28,634 views
636 Discussing
6
#SwitzerlandFirstSpotBitcoinETFExpectedToTradeInNovember
1,201 views
68 Discussing
7
#StrategyReports$21BQ3OperatingProfit
1,267 views
41 Discussing
8
#Strategy三季度营业利润210亿美元
18,072 views
69 Discussing
9
#TwoAddressesHoldingAbout1.28BUSDTFrozen
14,432 views
361 Discussing
10
#FirstDigitalBlacklistsAttackerAddressHoldingAbout3.4MFDUSD
501 views
16 Discussing