

#etf
etf
1G views
5.7M Discussing
Hot
Latest

·
--
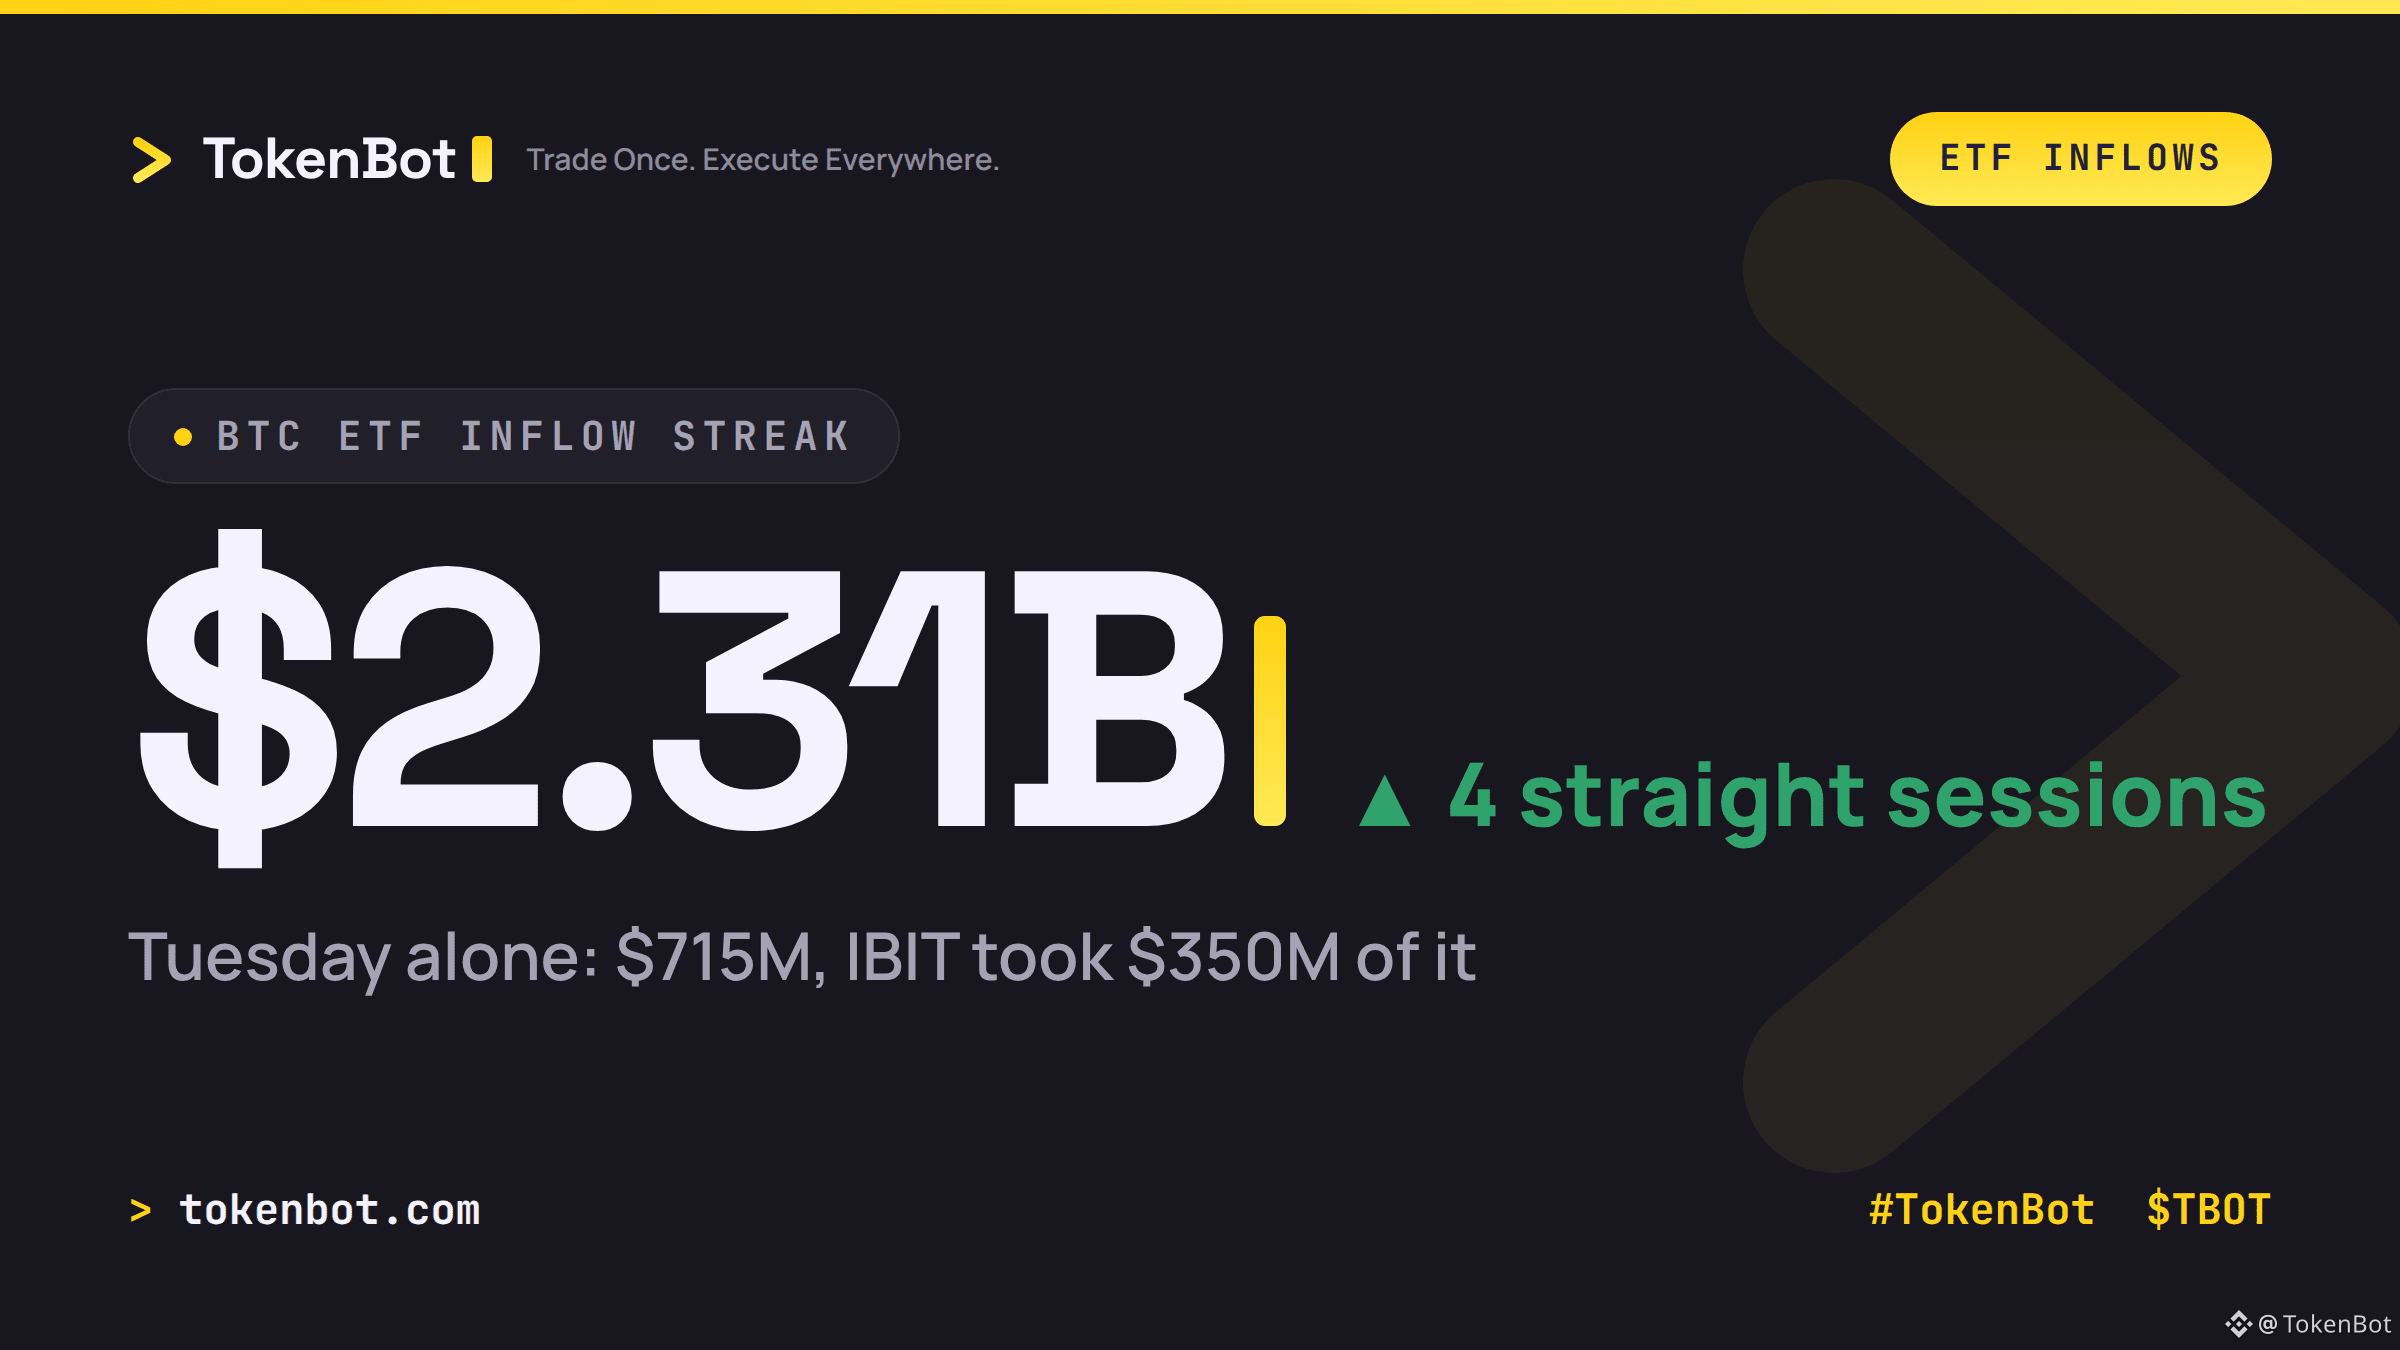
Spot BTC ETFs just booked a 4-day, $2.31B inflow streak. Tuesday alone brought in $715M, with BlackRock's IBIT taking $350M of that on its own, and Monday's print was reportedly the largest single day in about 11 months.
The mechanism matters here: ETF inflows aren't leverage. When an authorized participant creates new shares, they're buying real spot BTC to back them. That's structurally different from the perp-driven short squeeze that's been running this week - one adds durable spot demand, the other just resets funding and open interest.
Worth watching whether this streak holds once the squeeze cools off, or whether it was riding the same momentum. IBIT has led every day of the run so far.
Anyone else tracking ETF creation flow as a separate signal from perp OI, or do you treat it as the same trade in different wrapper? #TokenBot #Bitcoin #ETF #TradingSignals $BTC $TBOT
tokenbot.com
Spot BTC ETFs just booked a 4-day, $2.31B inflow streak. Tuesday alone brought in $715M, with BlackRock's IBIT taking $350M of that on its own, and Monday's print was reportedly the largest single day in about 11 months.
The mechanism matters here: ETF inflows aren't leverage. When an authorized participant creates new shares, they're buying real spot BTC to back them. That's structurally different from the perp-driven short squeeze that's been running this week - one adds durable spot demand, the other just resets funding and open interest.
Worth watching whether this streak holds once the squeeze cools off, or whether it was riding the same momentum. IBIT has led every day of the run so far.
Anyone else tracking ETF creation flow as a separate signal from perp OI, or do you treat it as the same trade in different wrapper? #TokenBot #Bitcoin #ETF #TradingSignals $BTC $TBOT
tokenbot.com
The mechanism matters here: ETF inflows aren't leverage. When an authorized participant creates new shares, they're buying real spot BTC to back them. That's structurally different from the perp-driven short squeeze that's been running this week - one adds durable spot demand, the other just resets funding and open interest.
Worth watching whether this streak holds once the squeeze cools off, or whether it was riding the same momentum. IBIT has led every day of the run so far.
Anyone else tracking ETF creation flow as a separate signal from perp OI, or do you treat it as the same trade in different wrapper? #TokenBot #Bitcoin #ETF #TradingSignals $BTC $TBOT
tokenbot.com
BTC-1,95%
IBITETF-0,04%
3.3k

BTC is down. ETH is down. SOL is down.
But Bitcoin ETFs just saw 7,107 BTC in net inflows.
Ethereum ETFs added 67,597 ETH.
Retail sees red candles and panic.
Institutions see red candles and keep adding.
So who is reacting emotionally—and who is positioning quietly?
The market is not rewarding noise right now.
It is testing conviction. 🔥
$BTC
{spot}(BTCUSDT)
$ETH
{spot}(ETHUSDT)
$SOL
{spot}(SOLUSDT)
#FOMO #crypto #ETF #markets #BinanceSquare
BTC is down. ETH is down. SOL is down.
But Bitcoin ETFs just saw 7,107 BTC in net inflows.
Ethereum ETFs added 67,597 ETH.
Retail sees red candles and panic.
Institutions see red candles and keep adding.
So who is reacting emotionally—and who is positioning quietly?
The market is not rewarding noise right now.
It is testing conviction. 🔥
$BTC
$ETH
$SOL
#FOMO #crypto #ETF #markets #BinanceSquare
But Bitcoin ETFs just saw 7,107 BTC in net inflows.
Ethereum ETFs added 67,597 ETH.
Retail sees red candles and panic.
Institutions see red candles and keep adding.
So who is reacting emotionally—and who is positioning quietly?
The market is not rewarding noise right now.
It is testing conviction. 🔥
$BTC
$ETH
$SOL
#FOMO #crypto #ETF #markets #BinanceSquare

76

·
--
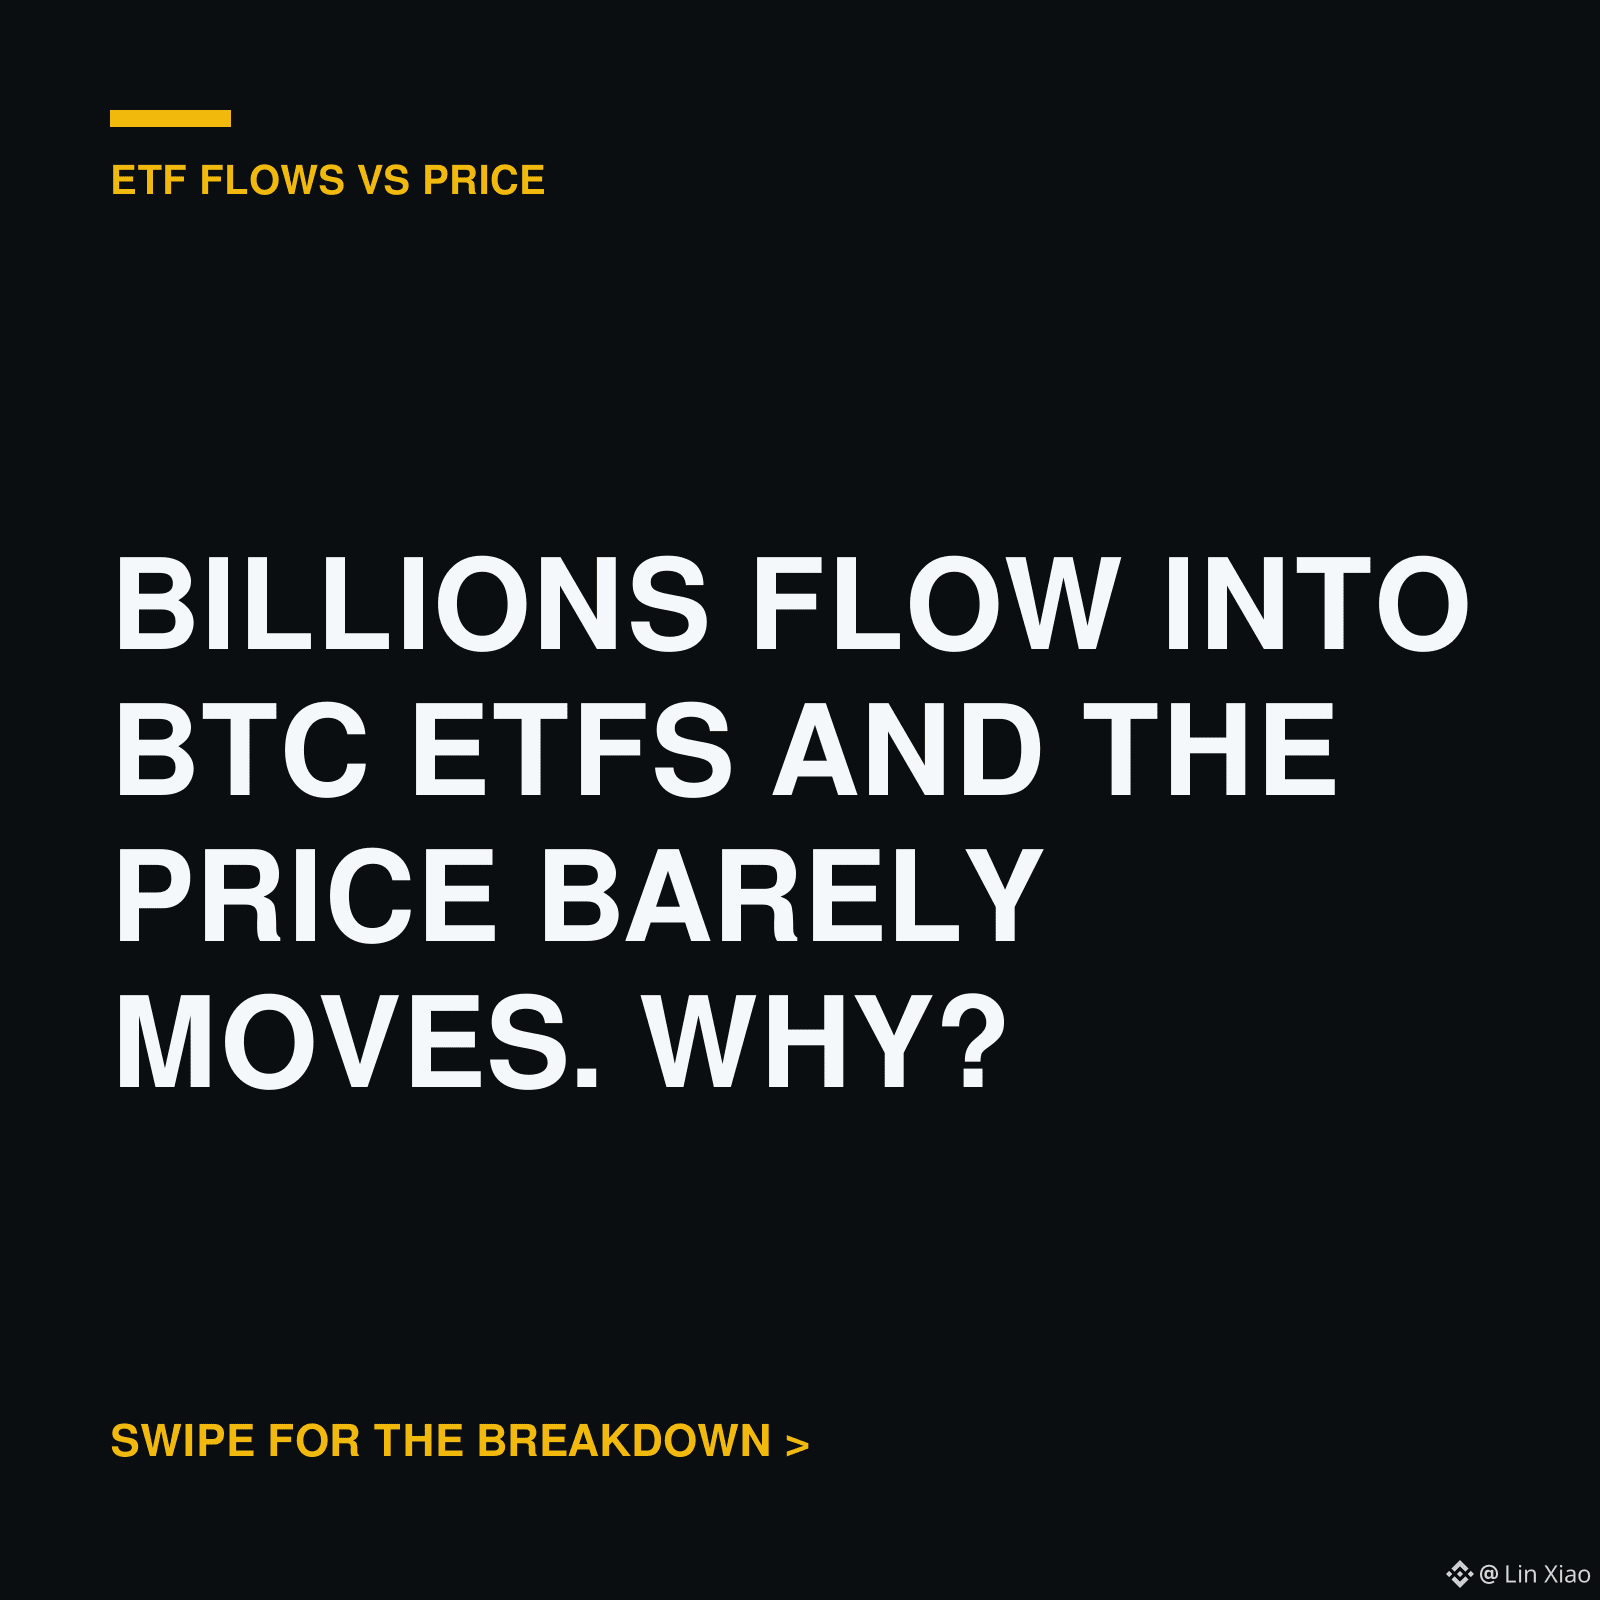
Why did billions in ETF inflows move Bitcoin almost 0%? 🤔
Everyone read the headline as bullish. The chart just shrugged.
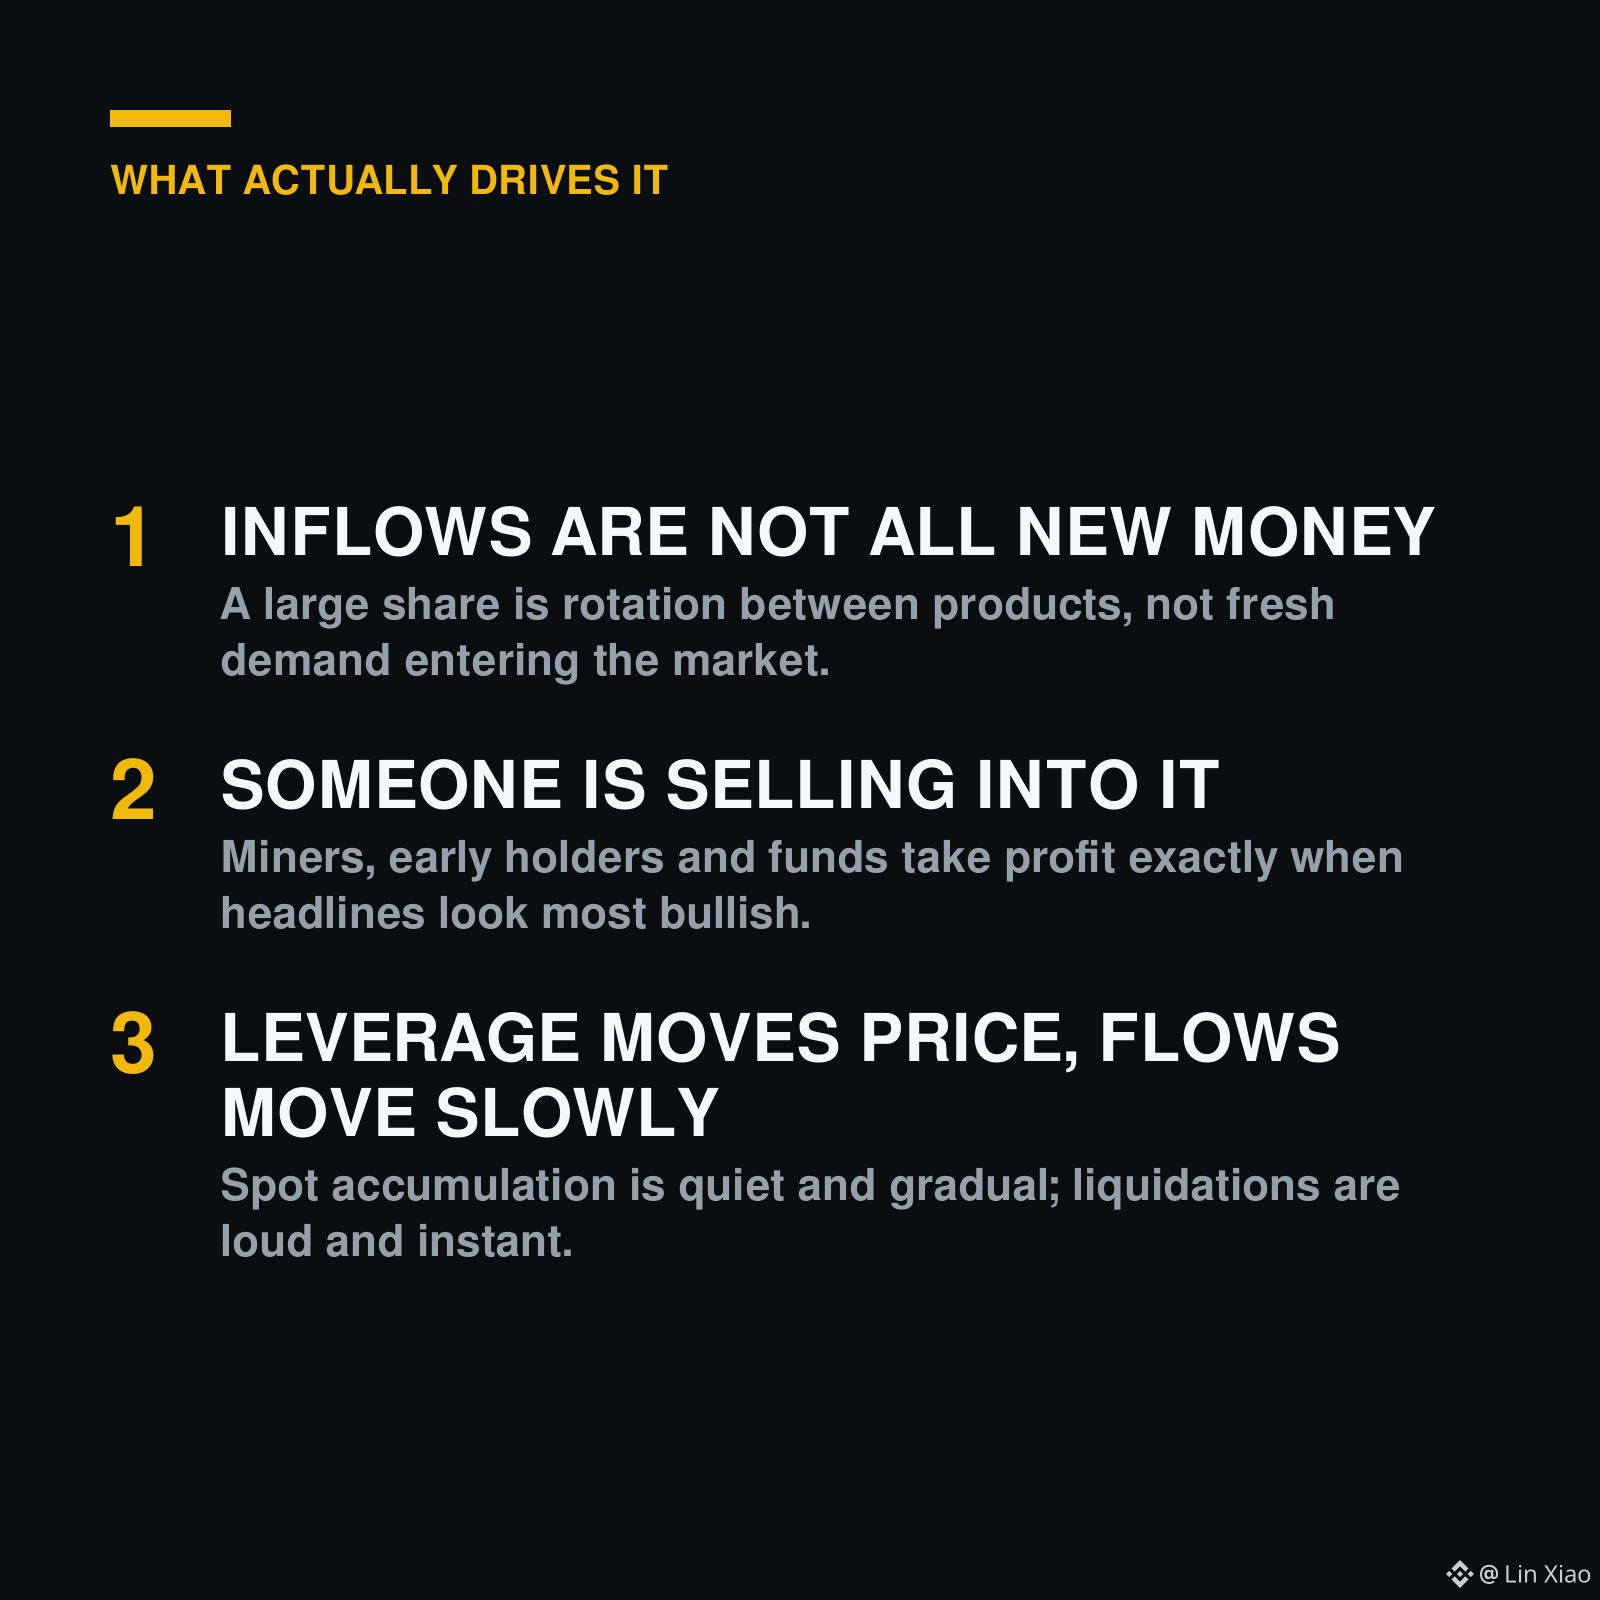
Here's what most people miss:
1) Inflows aren't all new money - a big share is rotation between products, not fresh demand
2) Someone is selling into it - miners and early holders take profit exactly when headlines look best
3) Leverage moves price fast, spot flows move slowly - one is loud, the other is quiet
Flows tell you WHO is buying. They never tell you WHEN price reacts.
Swipe the 4 slides for the full breakdown 👉
Which one surprised you most - 1, 2 or 3? Comment your number below.
Save this for the next "record inflows" headline, and follow for daily alpha, no FOMO.
#Bitcoin #ETF #CryptoNews #TradingTips $BTC $ETH
Why did billions in ETF inflows move Bitcoin almost 0%? 🤔
Everyone read the headline as bullish. The chart just shrugged.
Here's what most people miss:
1) Inflows aren't all new money - a big share is rotation between products, not fresh demand
2) Someone is selling into it - miners and early holders take profit exactly when headlines look best
3) Leverage moves price fast, spot flows move slowly - one is loud, the other is quiet
Flows tell you WHO is buying. They never tell you WHEN price reacts.
Swipe the 4 slides for the full breakdown 👉
Which one surprised you most - 1, 2 or 3? Comment your number below.
Save this for the next "record inflows" headline, and follow for daily alpha, no FOMO.
#Bitcoin #ETF #CryptoNews #TradingTips $BTC $ETH
Everyone read the headline as bullish. The chart just shrugged.
Here's what most people miss:
1) Inflows aren't all new money - a big share is rotation between products, not fresh demand
2) Someone is selling into it - miners and early holders take profit exactly when headlines look best
3) Leverage moves price fast, spot flows move slowly - one is loud, the other is quiet
Flows tell you WHO is buying. They never tell you WHEN price reacts.
Swipe the 4 slides for the full breakdown 👉
Which one surprised you most - 1, 2 or 3? Comment your number below.
Save this for the next "record inflows" headline, and follow for daily alpha, no FOMO.
#Bitcoin #ETF #CryptoNews #TradingTips $BTC $ETH


1
1
55


·
--
$BTC - IBIT dominates ETF flows while price slides toward 84,000 USDT
BlackRock's IBIT pulled in roughly 1 billion USDT across four trading sessions
The fund captured about 44 percent of total US spot Bitcoin ETF inflows during that stretch
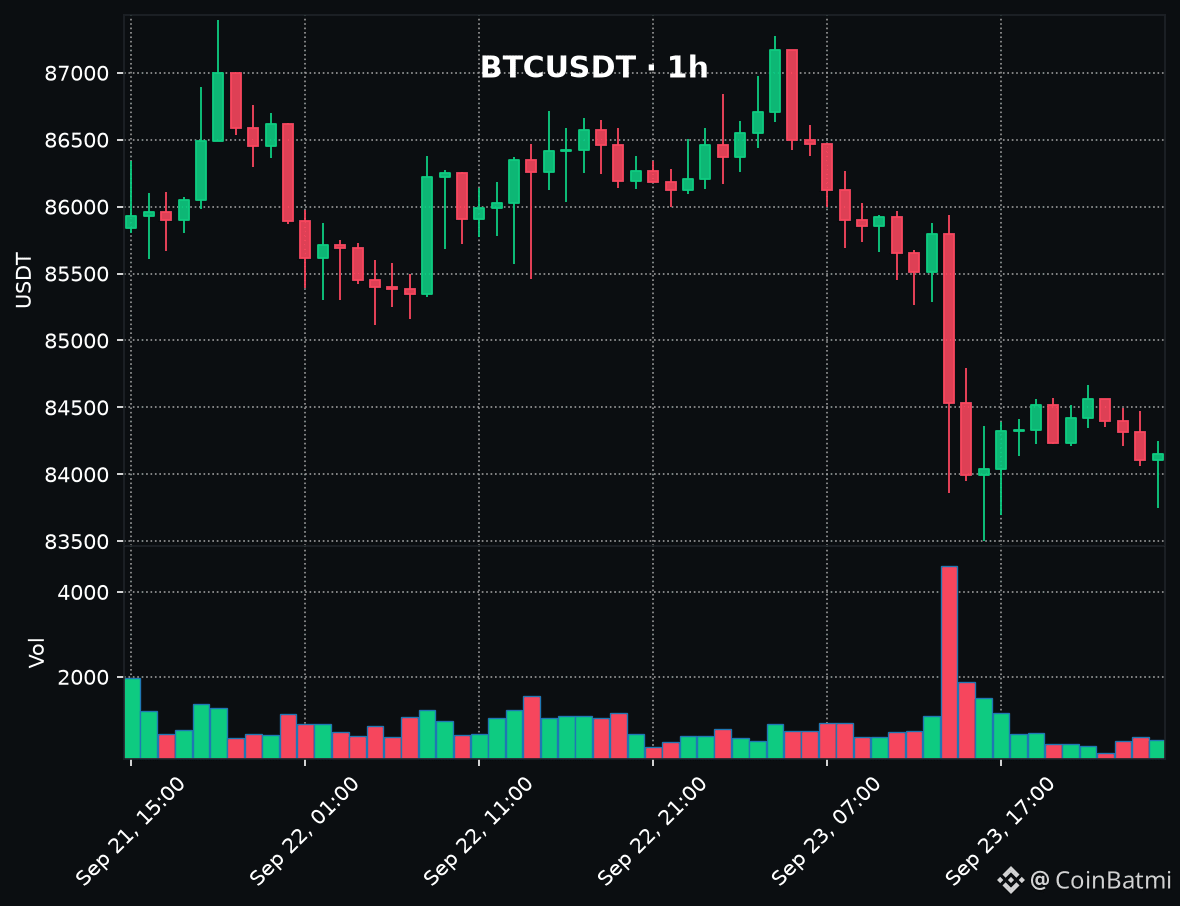
Bitcoin's price pulled back from near 87,000 USDT toward 84,000 USDT
The inflow concentration in a single fund while price declines suggests institutional accumulation may be decoupling from short-term spot momentum
#ETF #Institutional
$BTC - IBIT dominates ETF flows while price slides toward 84,000 USDT
BlackRock's IBIT pulled in roughly 1 billion USDT across four trading sessions
The fund captured about 44 percent of total US spot Bitcoin ETF inflows during that stretch
Bitcoin's price pulled back from near 87,000 USDT toward 84,000 USDT
The inflow concentration in a single fund while price declines suggests institutional accumulation may be decoupling from short-term spot momentum
#ETF #Institutional
BlackRock's IBIT pulled in roughly 1 billion USDT across four trading sessions
The fund captured about 44 percent of total US spot Bitcoin ETF inflows during that stretch
Bitcoin's price pulled back from near 87,000 USDT toward 84,000 USDT
The inflow concentration in a single fund while price declines suggests institutional accumulation may be decoupling from short-term spot momentum
#ETF #Institutional
BTC-1,95%
IBITETF-0,04%
64

#etf
💥 Bitcoin ETFs plug $5.7B hole, but market hit by wave of profit-taking
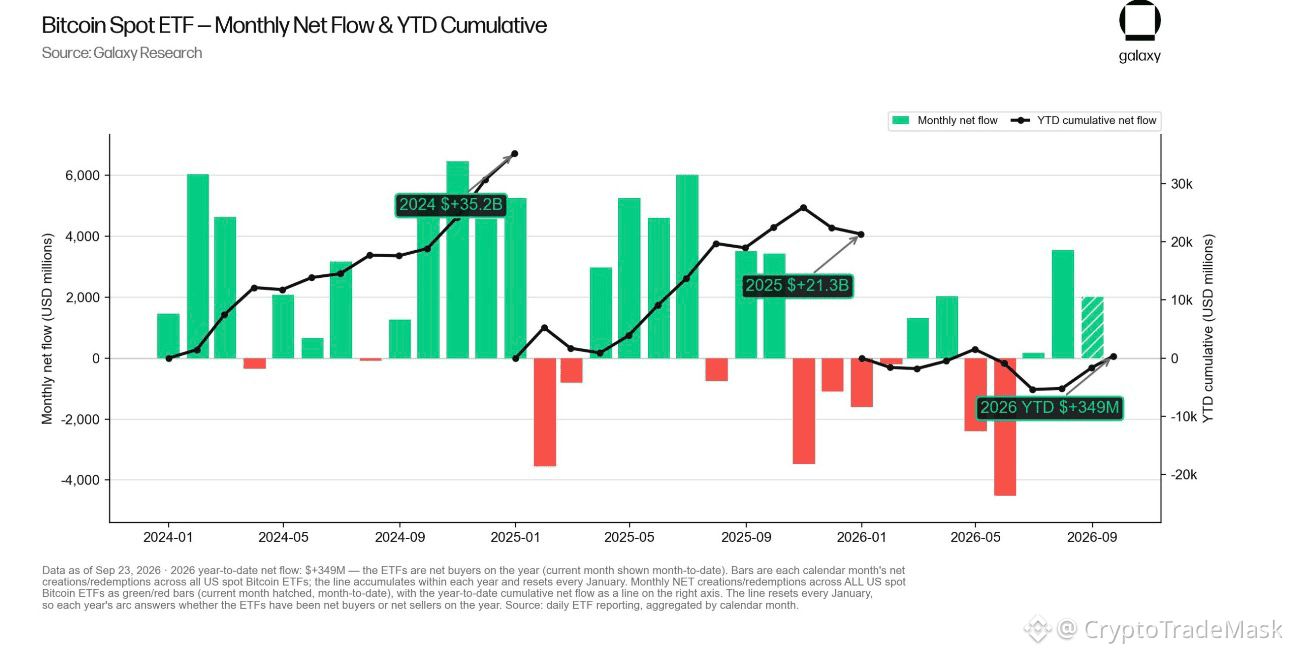
US spot $BTC ETFs have staged a powerful comeback: in the early part of this week alone, they attracted over $1.7 billion (specifically $999 million on September 21 and $715 million on September 22).
This fully offset the massive year-to-date drawdown seen on July 13, when fund outflows had reached $5.69 billion. Net annual inflows have now turned positive again, standing at approximately $349 million.
📊 Key market details:
➡️ Flagship: BlackRock (IBIT) remains the primary driver of the recovery, attracting ~$1.02 billion over the last four trading sessions.
➡️ Rally catalyst: Increased ETF buying began in August, spurred by comments from US Treasury Secretary Scott Bessent regarding government bonds. Since then, BTC has risen by approximately 35%—climbing from $64,100 to over $85,000.
➡️ Back in the black: The average purchase price for BTC via ETFs is around $82,000, meaning fund investors are once again sitting on unrealized profits.
❓ So why isn't the price rising further?
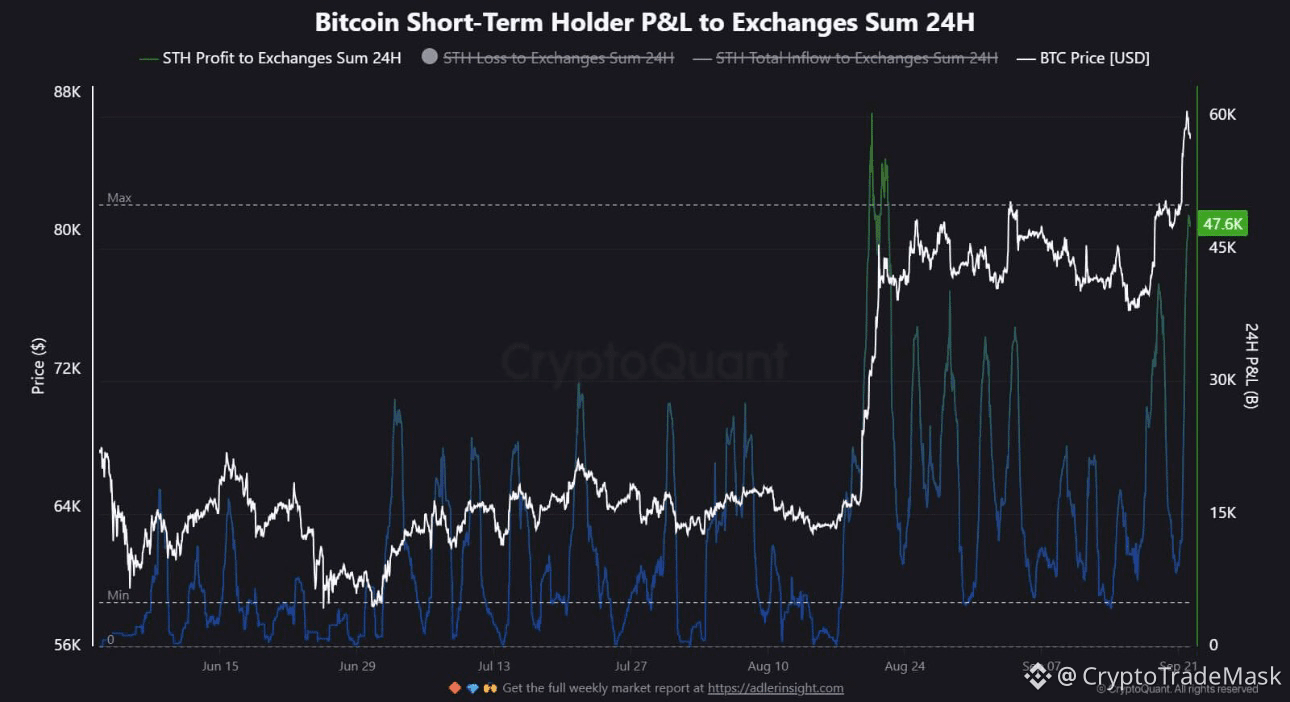
Despite record-breaking ETF activity, BTC has pulled back from a local high of $87,265 to levels around $84,500. The reason is widespread profit-taking:
According to CryptoQuant, short-term holders transferred approximately 47,600 BTC (worth over $4 billion at current rates) to exchanges as the price approached $88,000.
Santiment analysts warn that peak ETF inflows often coincide with local market highs due to the "FOMO" effect among smaller investors following a major rally.
⚠️ Bottom line: Institutional demand via ETFs is currently actively absorbing the sell-off volume from those locking in profits after the summer lows. Bitcoin's future performance will depend on whether the funds' buying pace holds steady once the wave of selling peaks.
{future}(BTCUSDT)
#etf
💥 Bitcoin ETFs plug $5.7B hole, but market hit by wave of profit-taking
US spot $BTC ETFs have staged a powerful comeback: in the early part of this week alone, they attracted over $1.7 billion (specifically $999 million on September 21 and $715 million on September 22).
This fully offset the massive year-to-date drawdown seen on July 13, when fund outflows had reached $5.69 billion. Net annual inflows have now turned positive again, standing at approximately $349 million.
📊 Key market details:
➡️ Flagship: BlackRock (IBIT) remains the primary driver of the recovery, attracting ~$1.02 billion over the last four trading sessions.
➡️ Rally catalyst: Increased ETF buying began in August, spurred by comments from US Treasury Secretary Scott Bessent regarding government bonds. Since then, BTC has risen by approximately 35%—climbing from $64,100 to over $85,000.
➡️ Back in the black: The average purchase price for BTC via ETFs is around $82,000, meaning fund investors are once again sitting on unrealized profits.
❓ So why isn't the price rising further?
Despite record-breaking ETF activity, BTC has pulled back from a local high of $87,265 to levels around $84,500. The reason is widespread profit-taking:
According to CryptoQuant, short-term holders transferred approximately 47,600 BTC (worth over $4 billion at current rates) to exchanges as the price approached $88,000.
Santiment analysts warn that peak ETF inflows often coincide with local market highs due to the "FOMO" effect among smaller investors following a major rally.
⚠️ Bottom line: Institutional demand via ETFs is currently actively absorbing the sell-off volume from those locking in profits after the summer lows. Bitcoin's future performance will depend on whether the funds' buying pace holds steady once the wave of selling peaks.
💥 Bitcoin ETFs plug $5.7B hole, but market hit by wave of profit-taking
US spot $BTC ETFs have staged a powerful comeback: in the early part of this week alone, they attracted over $1.7 billion (specifically $999 million on September 21 and $715 million on September 22).
This fully offset the massive year-to-date drawdown seen on July 13, when fund outflows had reached $5.69 billion. Net annual inflows have now turned positive again, standing at approximately $349 million.
📊 Key market details:
➡️ Flagship: BlackRock (IBIT) remains the primary driver of the recovery, attracting ~$1.02 billion over the last four trading sessions.
➡️ Rally catalyst: Increased ETF buying began in August, spurred by comments from US Treasury Secretary Scott Bessent regarding government bonds. Since then, BTC has risen by approximately 35%—climbing from $64,100 to over $85,000.
➡️ Back in the black: The average purchase price for BTC via ETFs is around $82,000, meaning fund investors are once again sitting on unrealized profits.
❓ So why isn't the price rising further?
Despite record-breaking ETF activity, BTC has pulled back from a local high of $87,265 to levels around $84,500. The reason is widespread profit-taking:
According to CryptoQuant, short-term holders transferred approximately 47,600 BTC (worth over $4 billion at current rates) to exchanges as the price approached $88,000.
Santiment analysts warn that peak ETF inflows often coincide with local market highs due to the "FOMO" effect among smaller investors following a major rally.
⚠️ Bottom line: Institutional demand via ETFs is currently actively absorbing the sell-off volume from those locking in profits after the summer lows. Bitcoin's future performance will depend on whether the funds' buying pace holds steady once the wave of selling peaks.
BTC-1,95%
IBITETF-0,04%
58

·
--
Are this week's Bitcoin ETF inflows new buyers or a hedged carry trade?US spot Bitcoin ETFs took $999M on Monday 21 September and another $714.7M on Tuesday 22 September, the fourth straight inflow session, and the four-day run is reported above $2.3bn. The week before, ending 18 September, the whole complex took $6.21M. On its face that one Monday session dwarfs the entire week before it.
I'd hold off on reading that as a wave of new believers until Friday, because there's a dated report coming that can tell the two stories apart.
Quick one on the date first. Several outlets dated the $999M print to "Monday, September 22", but the 21st was the Monday and the 22nd was the Tuesday. Go with their date and you've got one session too many, and the $714.7M that really printed on the 22nd starts to look like a contradiction when it's just the next day's number. It's the second time in three weeks I've seen a daily flow figure re-dated to the day it was published, so I check the weekday on these now.
The other way to get an inflow
Cash-and-carry is the trade where a fund buys spot exposure, here the ETF, and shorts CME Bitcoin futures against it to collect the gap between the two. It's delta-neutral and carries no view on price at all, and in the flows table it looks exactly like someone buying Bitcoin because they want to own Bitcoin.
IOSG's weekly brief argues that roughly half of the variation in ETF flows tracks new short positions opened by leveraged funds, at a correlation of about 0.70. Those are their figures and I haven't seen the underlying study, so I'm treating them as a claim with a name on it. I'd still give it some weight, because a crypto venture investor arguing against the industry's favourite bullish statistic is the opposite of talking their book.
If they're right, the $999M and $714.7M sessions could be leveraged funds putting a basis trade back on, and the comparison with that $6.21M week would be measuring a financing spread more than new demand. I've been reading these prints through eligibility, meaning each rule change decides who is able to buy. A basis trade sits outside that frame, all it needs is a spread wide enough to be worth collecting.
Where the hedge shows up
The short leg of that trade lands in the CFTC's Traders in Financial Futures report, under leveraged funds. Their aggregate Bitcoin futures net short was about 39,877 BTC-equivalent in the week ending Tuesday 8 September, after a rebuild of 1,669 on the week, and about 32,602 in the week ending Tuesday 15 September, a narrowing of 7,275. I have both of those figures from a secondary source, derived rather than read off the CFTC's own table, so they carry that caveat.
The report covering Tuesday 22 September publishes on Friday 25 September, and both big sessions sit inside that reporting week, $1.714bn between them.
What Friday can and can't settle
If the leveraged-fund net short widens materially from the 32,602 base, the carry read gets real support, and a good part of that $1.714bn was probably hedged money with no opinion on where $BTC goes next. If the net short comes in flat or narrower in a week that took that much in creations, I think the arbitrage reading fails on its own instrument, which would mean the money most likely wasn't hedged and the demand reading survives.
It won't settle everything though. One week isn't a trend, and "leveraged funds" lumps together hedge funds, CTAs and other managed money, so it isn't a pure arbitrage proxy (the source concedes that itself). And an ETF flow figure on its own can't score this in either direction, however big it is.
Somebody built a product for that hedge
KalshiEX self-certified a Bitcoin perpetual contract, BTCPERP, under CFTC Regulation 40.2(a) on 2 June 2026. Self-certification means the exchange certifies it complies and lists the contract, and the Commission doesn't sign off, so "CFTC approved" is the wrong way to describe it. The filing names who it's pitched at, including "ETP market makers and authorized participants carrying inventory", and argues a perp "eliminates roll cost and roll-date basis risk". That's exactly the crowd whose hedge shows up in the CFTC data as a futures short.
I haven't got a volume or open interest figure for that contract since it listed, so it tells me the hedge is big enough for someone to design a product around it and nothing yet about whether anyone trades it.
$ETH had its own run too, +$162M on 22 September for a third straight inflow day. The same question applies there, I just don't have a positioning series in front of me to test it against.
Bitcoin made an eight-month high on 21 September with rates pointing the other way, and the flows are the easy explanation people reach for. I'll be reading Friday's leveraged-fund line before I make up my mind on Monday's flow print. Let's see how it comes in.
#Bitcoin #ETF #CFTC #Crypto #Macro
Are this week's Bitcoin ETF inflows new buyers or a hedged carry trade?
US spot Bitcoin ETFs took $999M on Monday 21 September and another $714.7M on Tuesday 22 September, the fourth straight inflow session, and the four-day run is reported above $2.3bn. The week before, ending 18 September, the whole complex took $6.21M. On its face that one Monday session dwarfs the entire week before it.
I'd hold off on reading that as a wave of new believers until Friday, because there's a dated report coming that can tell the two stories apart.
Quick one on the date first. Several outlets dated the $999M print to "Monday, September 22", but the 21st was the Monday and the 22nd was the Tuesday. Go with their date and you've got one session too many, and the $714.7M that really printed on the 22nd starts to look like a contradiction when it's just the next day's number. It's the second time in three weeks I've seen a daily flow figure re-dated to the day it was published, so I check the weekday on these now.
The other way to get an inflow
Cash-and-carry is the trade where a fund buys spot exposure, here the ETF, and shorts CME Bitcoin futures against it to collect the gap between the two. It's delta-neutral and carries no view on price at all, and in the flows table it looks exactly like someone buying Bitcoin because they want to own Bitcoin.
IOSG's weekly brief argues that roughly half of the variation in ETF flows tracks new short positions opened by leveraged funds, at a correlation of about 0.70. Those are their figures and I haven't seen the underlying study, so I'm treating them as a claim with a name on it. I'd still give it some weight, because a crypto venture investor arguing against the industry's favourite bullish statistic is the opposite of talking their book.
If they're right, the $999M and $714.7M sessions could be leveraged funds putting a basis trade back on, and the comparison with that $6.21M week would be measuring a financing spread more than new demand. I've been reading these prints through eligibility, meaning each rule change decides who is able to buy. A basis trade sits outside that frame, all it needs is a spread wide enough to be worth collecting.
Where the hedge shows up
The short leg of that trade lands in the CFTC's Traders in Financial Futures report, under leveraged funds. Their aggregate Bitcoin futures net short was about 39,877 BTC-equivalent in the week ending Tuesday 8 September, after a rebuild of 1,669 on the week, and about 32,602 in the week ending Tuesday 15 September, a narrowing of 7,275. I have both of those figures from a secondary source, derived rather than read off the CFTC's own table, so they carry that caveat.
The report covering Tuesday 22 September publishes on Friday 25 September, and both big sessions sit inside that reporting week, $1.714bn between them.
What Friday can and can't settle
If the leveraged-fund net short widens materially from the 32,602 base, the carry read gets real support, and a good part of that $1.714bn was probably hedged money with no opinion on where $BTC goes next. If the net short comes in flat or narrower in a week that took that much in creations, I think the arbitrage reading fails on its own instrument, which would mean the money most likely wasn't hedged and the demand reading survives.
It won't settle everything though. One week isn't a trend, and "leveraged funds" lumps together hedge funds, CTAs and other managed money, so it isn't a pure arbitrage proxy (the source concedes that itself). And an ETF flow figure on its own can't score this in either direction, however big it is.
Somebody built a product for that hedge
KalshiEX self-certified a Bitcoin perpetual contract, BTCPERP, under CFTC Regulation 40.2(a) on 2 June 2026. Self-certification means the exchange certifies it complies and lists the contract, and the Commission doesn't sign off, so "CFTC approved" is the wrong way to describe it. The filing names who it's pitched at, including "ETP market makers and authorized participants carrying inventory", and argues a perp "eliminates roll cost and roll-date basis risk". That's exactly the crowd whose hedge shows up in the CFTC data as a futures short.
I haven't got a volume or open interest figure for that contract since it listed, so it tells me the hedge is big enough for someone to design a product around it and nothing yet about whether anyone trades it.
$ETH had its own run too, +$162M on 22 September for a third straight inflow day. The same question applies there, I just don't have a positioning series in front of me to test it against.
Bitcoin made an eight-month high on 21 September with rates pointing the other way, and the flows are the easy explanation people reach for. I'll be reading Friday's leveraged-fund line before I make up my mind on Monday's flow print. Let's see how it comes in.
#Bitcoin #ETF #CFTC #Crypto #Macro
I'd hold off on reading that as a wave of new believers until Friday, because there's a dated report coming that can tell the two stories apart.
Quick one on the date first. Several outlets dated the $999M print to "Monday, September 22", but the 21st was the Monday and the 22nd was the Tuesday. Go with their date and you've got one session too many, and the $714.7M that really printed on the 22nd starts to look like a contradiction when it's just the next day's number. It's the second time in three weeks I've seen a daily flow figure re-dated to the day it was published, so I check the weekday on these now.
The other way to get an inflow
Cash-and-carry is the trade where a fund buys spot exposure, here the ETF, and shorts CME Bitcoin futures against it to collect the gap between the two. It's delta-neutral and carries no view on price at all, and in the flows table it looks exactly like someone buying Bitcoin because they want to own Bitcoin.
IOSG's weekly brief argues that roughly half of the variation in ETF flows tracks new short positions opened by leveraged funds, at a correlation of about 0.70. Those are their figures and I haven't seen the underlying study, so I'm treating them as a claim with a name on it. I'd still give it some weight, because a crypto venture investor arguing against the industry's favourite bullish statistic is the opposite of talking their book.
If they're right, the $999M and $714.7M sessions could be leveraged funds putting a basis trade back on, and the comparison with that $6.21M week would be measuring a financing spread more than new demand. I've been reading these prints through eligibility, meaning each rule change decides who is able to buy. A basis trade sits outside that frame, all it needs is a spread wide enough to be worth collecting.
Where the hedge shows up
The short leg of that trade lands in the CFTC's Traders in Financial Futures report, under leveraged funds. Their aggregate Bitcoin futures net short was about 39,877 BTC-equivalent in the week ending Tuesday 8 September, after a rebuild of 1,669 on the week, and about 32,602 in the week ending Tuesday 15 September, a narrowing of 7,275. I have both of those figures from a secondary source, derived rather than read off the CFTC's own table, so they carry that caveat.
The report covering Tuesday 22 September publishes on Friday 25 September, and both big sessions sit inside that reporting week, $1.714bn between them.
What Friday can and can't settle
If the leveraged-fund net short widens materially from the 32,602 base, the carry read gets real support, and a good part of that $1.714bn was probably hedged money with no opinion on where $BTC goes next. If the net short comes in flat or narrower in a week that took that much in creations, I think the arbitrage reading fails on its own instrument, which would mean the money most likely wasn't hedged and the demand reading survives.
It won't settle everything though. One week isn't a trend, and "leveraged funds" lumps together hedge funds, CTAs and other managed money, so it isn't a pure arbitrage proxy (the source concedes that itself). And an ETF flow figure on its own can't score this in either direction, however big it is.
Somebody built a product for that hedge
KalshiEX self-certified a Bitcoin perpetual contract, BTCPERP, under CFTC Regulation 40.2(a) on 2 June 2026. Self-certification means the exchange certifies it complies and lists the contract, and the Commission doesn't sign off, so "CFTC approved" is the wrong way to describe it. The filing names who it's pitched at, including "ETP market makers and authorized participants carrying inventory", and argues a perp "eliminates roll cost and roll-date basis risk". That's exactly the crowd whose hedge shows up in the CFTC data as a futures short.
I haven't got a volume or open interest figure for that contract since it listed, so it tells me the hedge is big enough for someone to design a product around it and nothing yet about whether anyone trades it.
$ETH had its own run too, +$162M on 22 September for a third straight inflow day. The same question applies there, I just don't have a positioning series in front of me to test it against.
Bitcoin made an eight-month high on 21 September with rates pointing the other way, and the flows are the easy explanation people reach for. I'll be reading Friday's leveraged-fund line before I make up my mind on Monday's flow print. Let's see how it comes in.
#Bitcoin #ETF #CFTC #Crypto #Macro
77

·
--
🚀 $BTC GETS A TOKENIZED STOCK BOOST FROM BLOCKCHAIN.COM & A TOP‑TIER EXCHANGE! 🦈
📊 Institutional pipelines are wiring tokenized equities directly onto public ledgers, a clear signal that smart‑money is hunting new on‑chain liquidity pools. 🦈 The upcoming ETF structure will channel traditional equity flow through $BTC ’s network, potentially inflating demand for bridge assets and tightening supply dynamics. ⚡ Early order‑block analysis shows the $BTC price corridor aligning with the upcoming tokenized supply influx, creating a low‑risk accumulation zone. 📌 Keep an eye on volume spikes as the market digests this cross‑asset bridge.
💬 How will tokenized ETFs reshape on‑chain liquidity for $BTC ? 👇
⚠️ Not financial advice. Always manage your risk. 🛡️
🏷️ #BTC #TokenizedStocks #ETF #CryptoNews
🚀 🔥
🚀 $BTC GETS A TOKENIZED STOCK BOOST FROM BLOCKCHAIN.COM & A TOP‑TIER EXCHANGE! 🦈
📊 Institutional pipelines are wiring tokenized equities directly onto public ledgers, a clear signal that smart‑money is hunting new on‑chain liquidity pools. 🦈 The upcoming ETF structure will channel traditional equity flow through $BTC ’s network, potentially inflating demand for bridge assets and tightening supply dynamics. ⚡ Early order‑block analysis shows the $BTC price corridor aligning with the upcoming tokenized supply influx, creating a low‑risk accumulation zone. 📌 Keep an eye on volume spikes as the market digests this cross‑asset bridge.
💬 How will tokenized ETFs reshape on‑chain liquidity for $BTC ? 👇
⚠️ Not financial advice. Always manage your risk. 🛡️
🏷️ #BTC #TokenizedStocks #ETF #CryptoNews
🚀 🔥
📊 Institutional pipelines are wiring tokenized equities directly onto public ledgers, a clear signal that smart‑money is hunting new on‑chain liquidity pools. 🦈 The upcoming ETF structure will channel traditional equity flow through $BTC ’s network, potentially inflating demand for bridge assets and tightening supply dynamics. ⚡ Early order‑block analysis shows the $BTC price corridor aligning with the upcoming tokenized supply influx, creating a low‑risk accumulation zone. 📌 Keep an eye on volume spikes as the market digests this cross‑asset bridge.
💬 How will tokenized ETFs reshape on‑chain liquidity for $BTC ? 👇
⚠️ Not financial advice. Always manage your risk. 🛡️
🏷️ #BTC #TokenizedStocks #ETF #CryptoNews
🚀 🔥

22

🚨 $BTC INFLUX OF $1.7B SPOT ETF CASH SPARKS FOMO SURGE! 💥
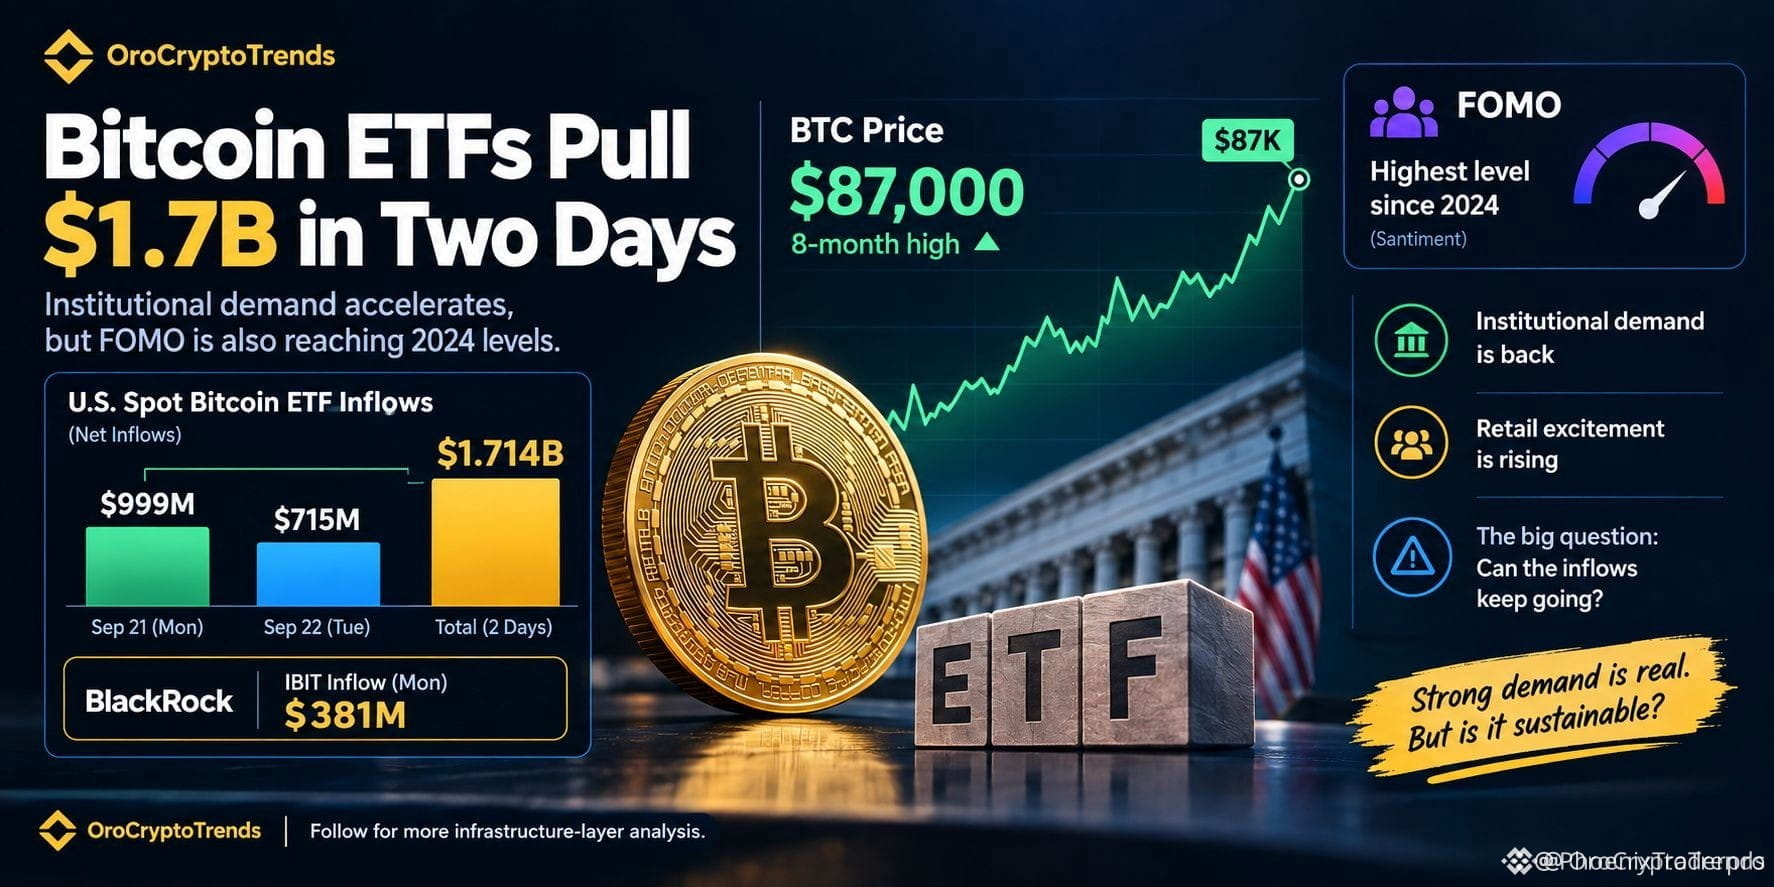
📊 The past two sessions saw over $1.7 B flow into U.S. spot ETFs, with BlackRock’s IBIT alone swallowing $381 M. That flood lifts $BTC past $87K, but the real story is the clash of institutional capital and retail hype. 🦈 Santiment flags FOMO at its highest since 2024, meaning the narrative is getting crowded while the money trucks keep rolling in.
⚡ Institutional inflows prove demand is real, yet the tempo of those flows will decide if the rally sustains once the buzz fades. 📈 Are we witnessing a durable liquidity wave or a short‑lived frenzy? 💬
⚠️ Not financial advice. Always manage your risk. 🛡️
🏷️ #BTC #ETF #Liquidity #Crypto
🔥 💎
🚨 $BTC INFLUX OF $1.7B SPOT ETF CASH SPARKS FOMO SURGE! 💥
📊 The past two sessions saw over $1.7 B flow into U.S. spot ETFs, with BlackRock’s IBIT alone swallowing $381 M. That flood lifts $BTC past $87K, but the real story is the clash of institutional capital and retail hype. 🦈 Santiment flags FOMO at its highest since 2024, meaning the narrative is getting crowded while the money trucks keep rolling in.
⚡ Institutional inflows prove demand is real, yet the tempo of those flows will decide if the rally sustains once the buzz fades. 📈 Are we witnessing a durable liquidity wave or a short‑lived frenzy? 💬
⚠️ Not financial advice. Always manage your risk. 🛡️
🏷️ #BTC #ETF #Liquidity #Crypto
🔥 💎
📊 The past two sessions saw over $1.7 B flow into U.S. spot ETFs, with BlackRock’s IBIT alone swallowing $381 M. That flood lifts $BTC past $87K, but the real story is the clash of institutional capital and retail hype. 🦈 Santiment flags FOMO at its highest since 2024, meaning the narrative is getting crowded while the money trucks keep rolling in.
⚡ Institutional inflows prove demand is real, yet the tempo of those flows will decide if the rally sustains once the buzz fades. 📈 Are we witnessing a durable liquidity wave or a short‑lived frenzy? 💬
⚠️ Not financial advice. Always manage your risk. 🛡️
🏷️ #BTC #ETF #Liquidity #Crypto
🔥 💎
22

Bitcoin is charging ahead while institutional ETF money shows a surprising split.
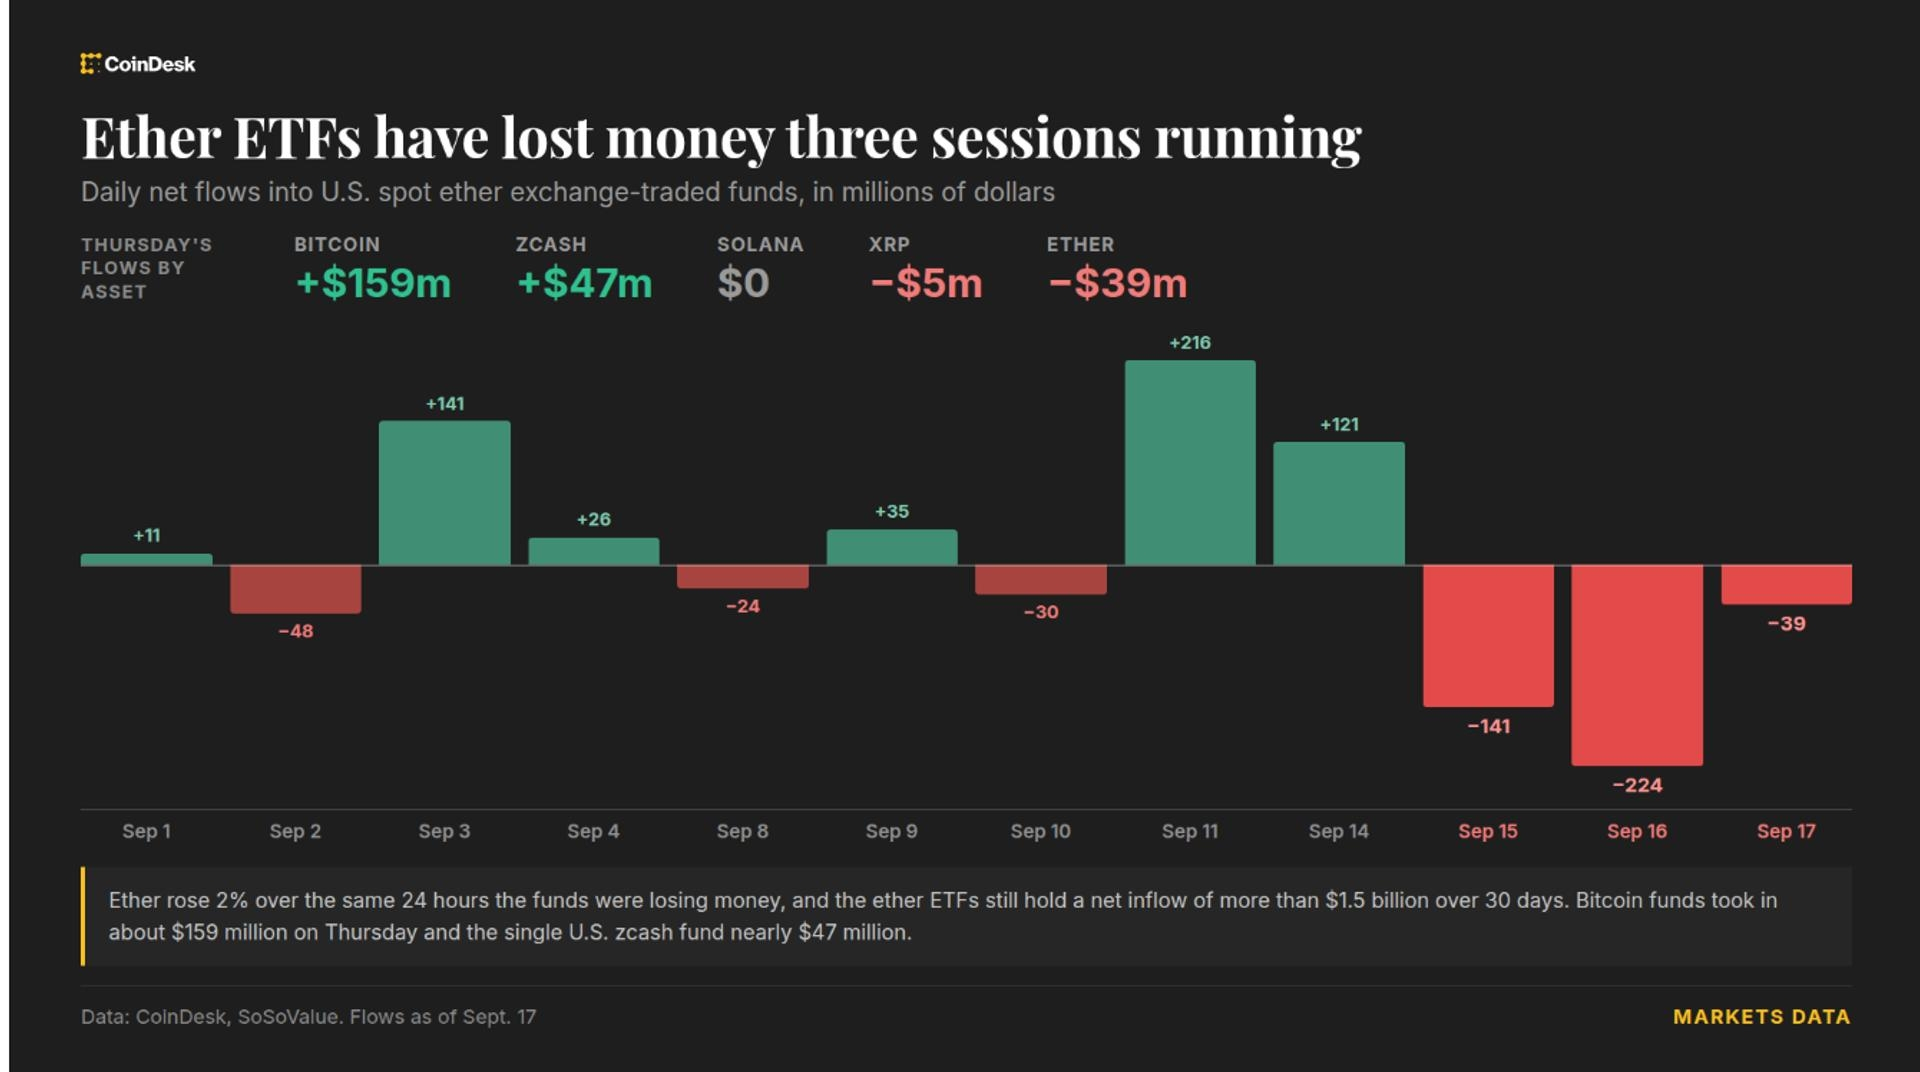
While $BTC pushes past $77,000 with strong momentum, institutional funds are telling a very different story for altcoins. Ether spot ETFs just logged their third consecutive day of net outflows despite price gains across the board.
🔥 Bitcoin continues its upward trajectory pushing past major resistance levels
📉 $ETH ETFs shed capital for three straight sessions even as prices held green
💎 Altcoins and privacy tokens like Zcash are joining the broader market rally
Institutional rebalancing is creating fascinating divergence in this rally.
#Write2Earn #Bitcoin #CryptoNews #ETF
Bitcoin is charging ahead while institutional ETF money shows a surprising split.
While $BTC pushes past $77,000 with strong momentum, institutional funds are telling a very different story for altcoins. Ether spot ETFs just logged their third consecutive day of net outflows despite price gains across the board.
🔥 Bitcoin continues its upward trajectory pushing past major resistance levels
📉 $ETH ETFs shed capital for three straight sessions even as prices held green
💎 Altcoins and privacy tokens like Zcash are joining the broader market rally
Institutional rebalancing is creating fascinating divergence in this rally.
#Write2Earn #Bitcoin #CryptoNews #ETF
While $BTC pushes past $77,000 with strong momentum, institutional funds are telling a very different story for altcoins. Ether spot ETFs just logged their third consecutive day of net outflows despite price gains across the board.
🔥 Bitcoin continues its upward trajectory pushing past major resistance levels
📉 $ETH ETFs shed capital for three straight sessions even as prices held green
💎 Altcoins and privacy tokens like Zcash are joining the broader market rally
Institutional rebalancing is creating fascinating divergence in this rally.
#Write2Earn #Bitcoin #CryptoNews #ETF
88

·
--
$BTC Back Above 86K ETF Inflows Hit 999M in ONE Day
After 8 months $BTC finally reclaimed 86000 highest since January 2026
US Spot $BTC ETFs saw 999M inflows on Sept 21 biggest since Oct 2025
Market cap is back to 27T and Fear Greed is at 71 Greed
This is NOT full altseason yet its selective rotation Dont FOMO DYOR
What's your next move Hold or Take Profit
Not financial advice
#BTC #ETF #CryptoNews #BinanceSquare
$BTC Back Above 86K ETF Inflows Hit 999M in ONE Day
After 8 months $BTC finally reclaimed 86000 highest since January 2026
US Spot $BTC ETFs saw 999M inflows on Sept 21 biggest since Oct 2025
Market cap is back to 27T and Fear Greed is at 71 Greed
This is NOT full altseason yet its selective rotation Dont FOMO DYOR
What's your next move Hold or Take Profit
Not financial advice
#BTC #ETF #CryptoNews #BinanceSquare
After 8 months $BTC finally reclaimed 86000 highest since January 2026
US Spot $BTC ETFs saw 999M inflows on Sept 21 biggest since Oct 2025
Market cap is back to 27T and Fear Greed is at 71 Greed
This is NOT full altseason yet its selective rotation Dont FOMO DYOR
What's your next move Hold or Take Profit
Not financial advice
#BTC #ETF #CryptoNews #BinanceSquare

90

·
--
ETF FLOWS ARE GETTING INTERESTING
I’m keeping an eye on the latest U.S. spot ETF flows because the money is still moving into crypto across multiple assets.
BTC led the board with $714.75M in net inflows, followed by ETH at $162.31M.
Other notable inflows:
• ZEC — $32.81M
• SOL — $28.87M
• XRP — $20.02M
• LINK — $1.89M
• DOGE — $1.17M
• AVAX — $1.15M
Even the smaller flows in HBAR and LTC are worth watching.
My take: when capital starts spreading beyond BTC and ETH, I pay more attention to whether this is the beginning of broader market participation or just short-term rotation.
For me, ETF flows are not a buy signal by themselves, but they’re definitely something I want on my radar.
#crypto #Bitcoin #ETF #Altcoins #Binance
ETF FLOWS ARE GETTING INTERESTING
I’m keeping an eye on the latest U.S. spot ETF flows because the money is still moving into crypto across multiple assets.
BTC led the board with $714.75M in net inflows, followed by ETH at $162.31M.
Other notable inflows:
• ZEC — $32.81M
• SOL — $28.87M
• XRP — $20.02M
• LINK — $1.89M
• DOGE — $1.17M
• AVAX — $1.15M
Even the smaller flows in HBAR and LTC are worth watching.
My take: when capital starts spreading beyond BTC and ETH, I pay more attention to whether this is the beginning of broader market participation or just short-term rotation.
For me, ETF flows are not a buy signal by themselves, but they’re definitely something I want on my radar.
#crypto #Bitcoin #ETF #Altcoins #Binance
I’m keeping an eye on the latest U.S. spot ETF flows because the money is still moving into crypto across multiple assets.
BTC led the board with $714.75M in net inflows, followed by ETH at $162.31M.
Other notable inflows:
• ZEC — $32.81M
• SOL — $28.87M
• XRP — $20.02M
• LINK — $1.89M
• DOGE — $1.17M
• AVAX — $1.15M
Even the smaller flows in HBAR and LTC are worth watching.
My take: when capital starts spreading beyond BTC and ETH, I pay more attention to whether this is the beginning of broader market participation or just short-term rotation.
For me, ETF flows are not a buy signal by themselves, but they’re definitely something I want on my radar.
#crypto #Bitcoin #ETF #Altcoins #Binance

1
98

·
--
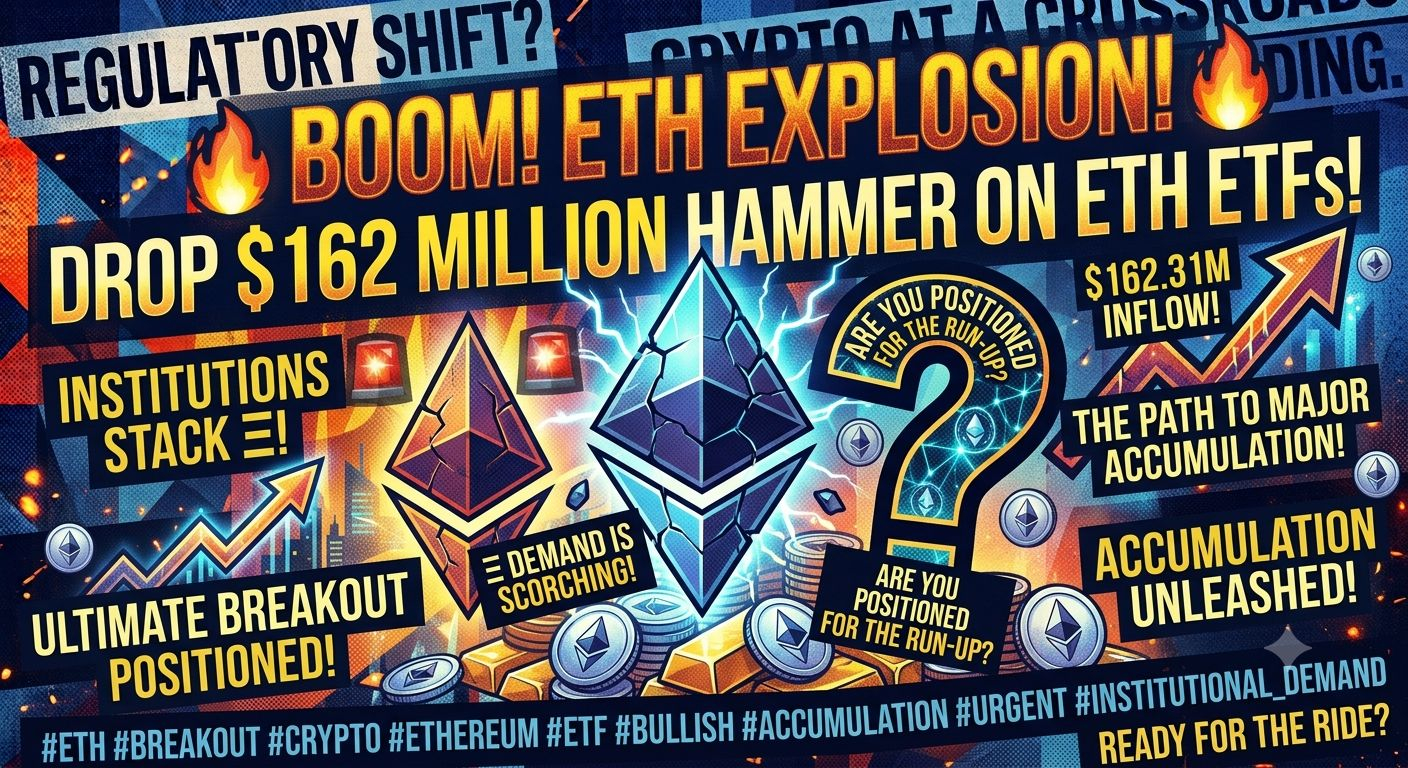
🔥 BOOM! ETH EXPLOSION! $TAKE
BlackRock and the big boys just dropped a $162 MILLION hammer on Ethereum ETFs! 🔨 Demand is scorching as institutions stack. $BCH
Are you positioned for the ultimate breakout? $NIL 🚀💰 #Ethereum #ETF
🔥 BOOM! ETH EXPLOSION! $TAKE
BlackRock and the big boys just dropped a $162 MILLION hammer on Ethereum ETFs! 🔨 Demand is scorching as institutions stack. $BCH
Are you positioned for the ultimate breakout? $NIL 🚀💰 #Ethereum #ETF
BlackRock and the big boys just dropped a $162 MILLION hammer on Ethereum ETFs! 🔨 Demand is scorching as institutions stack. $BCH
Are you positioned for the ultimate breakout? $NIL 🚀💰 #Ethereum #ETF
1
54

Article
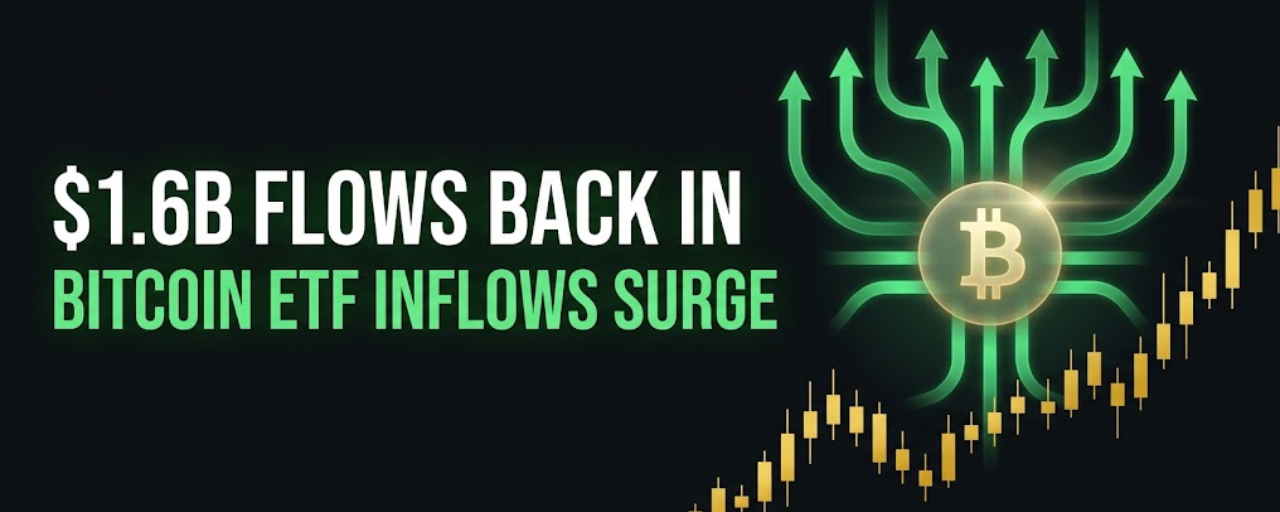
$1.6B Flows Back into Bitcoin ETFs: Is Institutional Demand Turning a Corner?Three straight sessions of inflows just reversed last week's outflows. Here's what that shift actually signals.
💰 Money doesn't lie about conviction the way headlines do. And this week, the money moved back in.
U.S. spot Bitcoin ETFs just posted a three-session run of nearly $1.6 billion in net inflows, reversing the redemptions seen just the week before. Spot Ether funds added another $270 million on top of that.
📊 Here's why this particular shift matters.
ETF flows aren't retail sentiment; they're a direct read on institutional and wealth management demand. When that number flips from outflows to nearly $1.6 billion of inflows in three sessions, it means large allocators actively chose to add exposure, not just hold what they already had.
🔄 Even more interesting, this reversal landed at a very specific moment.
This inflow streak happened during the same window Bitcoin broke above $85,000 and pushed toward $86,600, the same week Strategy confirmed a fresh BTC purchase and a Bitcoin reserve bill advanced through a House committee for the first time ever. None of these are coincidences, they're the same underlying story showing up across four different channels at once.
🧠 Why does the timing actually matter here?
A single day of ETF inflows can be noise. Three consecutive sessions reversing a prior week of outflows is a trend forming, not a blip. It suggests institutional desks aren't just reacting to the price move after the fact, they're adding into it, which is a meaningfully different signal than retail chasing a green candle.
✅ What this means for you
If you're holding, this is a genuinely supportive data point, institutional flows reversing this sharply after a down week suggests real conviction returning, not just short-term positioning.
If you're on the sidelines, ETF inflow data is one of the more reliable signals to watch precisely because it's harder to fake than social sentiment or a single trending hashtag. A continuation of this inflow streak over the coming week would meaningfully strengthen the case that this rally has real staying power.
If you're actively trading, watch whether inflows stay positive as price consolidates. Institutional money staying in during a pause is a stronger signal than institutional money piling in only while price is already ripping.
🟢 Bullish scenario
Inflows continue for a second consecutive week, institutional demand becomes a consistent tailwind, and ETF flows help hold BTC's price above recent breakout levels.
🔴 Risk scenario
This turns out to be a short covering-adjacent bounce in institutional positioning, inflows fade again next week, and the reversal proves temporary rather than the start of a sustained trend.
👀 Three things to watch
1️⃣ Next week's flow data
Does the inflow streak extend, or was this a one-week reversal tied to this specific price breakout?
2️⃣ Issuer breakdown
Is demand broad-based across multiple ETF issuers, or concentrated in just one or two funds?
3️⃣ Ether ETF flows
Does the $270 million into spot Ether funds continue growing alongside Bitcoin's, or does it lag behind?
💡 The key takeaway
Price moves can be driven by leverage and short squeezes. ETF inflows are driven by allocators actually choosing to commit capital.
Seeing both happen together this week, a price breakout and nearly $1.6 billion in institutional inflows reversing a down week, is a stronger combined signal than either one would be alone. The real test is whether this becomes a multi-week pattern or fades as quickly as it appeared.
That is the part worth watching.
This post is for informational and educational purposes only and is not financial advice. Crypto markets are volatile. Always conduct your own research before making financial decisions.
#BinanceSquare #Bitcoin #ETF #Institutional #Crypto
$1.6B Flows Back into Bitcoin ETFs: Is Institutional Demand Turning a Corner?
Three straight sessions of inflows just reversed last week's outflows. Here's what that shift actually signals.
💰 Money doesn't lie about conviction the way headlines do. And this week, the money moved back in.
U.S. spot Bitcoin ETFs just posted a three-session run of nearly $1.6 billion in net inflows, reversing the redemptions seen just the week before. Spot Ether funds added another $270 million on top of that.
📊 Here's why this particular shift matters.
ETF flows aren't retail sentiment; they're a direct read on institutional and wealth management demand. When that number flips from outflows to nearly $1.6 billion of inflows in three sessions, it means large allocators actively chose to add exposure, not just hold what they already had.
🔄 Even more interesting, this reversal landed at a very specific moment.
This inflow streak happened during the same window Bitcoin broke above $85,000 and pushed toward $86,600, the same week Strategy confirmed a fresh BTC purchase and a Bitcoin reserve bill advanced through a House committee for the first time ever. None of these are coincidences, they're the same underlying story showing up across four different channels at once.
🧠 Why does the timing actually matter here?
A single day of ETF inflows can be noise. Three consecutive sessions reversing a prior week of outflows is a trend forming, not a blip. It suggests institutional desks aren't just reacting to the price move after the fact, they're adding into it, which is a meaningfully different signal than retail chasing a green candle.
✅ What this means for you
If you're holding, this is a genuinely supportive data point, institutional flows reversing this sharply after a down week suggests real conviction returning, not just short-term positioning.
If you're on the sidelines, ETF inflow data is one of the more reliable signals to watch precisely because it's harder to fake than social sentiment or a single trending hashtag. A continuation of this inflow streak over the coming week would meaningfully strengthen the case that this rally has real staying power.
If you're actively trading, watch whether inflows stay positive as price consolidates. Institutional money staying in during a pause is a stronger signal than institutional money piling in only while price is already ripping.
🟢 Bullish scenario
Inflows continue for a second consecutive week, institutional demand becomes a consistent tailwind, and ETF flows help hold BTC's price above recent breakout levels.
🔴 Risk scenario
This turns out to be a short covering-adjacent bounce in institutional positioning, inflows fade again next week, and the reversal proves temporary rather than the start of a sustained trend.
👀 Three things to watch
1️⃣ Next week's flow data
Does the inflow streak extend, or was this a one-week reversal tied to this specific price breakout?
2️⃣ Issuer breakdown
Is demand broad-based across multiple ETF issuers, or concentrated in just one or two funds?
3️⃣ Ether ETF flows
Does the $270 million into spot Ether funds continue growing alongside Bitcoin's, or does it lag behind?
💡 The key takeaway
Price moves can be driven by leverage and short squeezes. ETF inflows are driven by allocators actually choosing to commit capital.
Seeing both happen together this week, a price breakout and nearly $1.6 billion in institutional inflows reversing a down week, is a stronger combined signal than either one would be alone. The real test is whether this becomes a multi-week pattern or fades as quickly as it appeared.
That is the part worth watching.
This post is for informational and educational purposes only and is not financial advice. Crypto markets are volatile. Always conduct your own research before making financial decisions.
#BinanceSquare #Bitcoin #ETF #Institutional #Crypto
💰 Money doesn't lie about conviction the way headlines do. And this week, the money moved back in.
U.S. spot Bitcoin ETFs just posted a three-session run of nearly $1.6 billion in net inflows, reversing the redemptions seen just the week before. Spot Ether funds added another $270 million on top of that.
📊 Here's why this particular shift matters.
ETF flows aren't retail sentiment; they're a direct read on institutional and wealth management demand. When that number flips from outflows to nearly $1.6 billion of inflows in three sessions, it means large allocators actively chose to add exposure, not just hold what they already had.
🔄 Even more interesting, this reversal landed at a very specific moment.
This inflow streak happened during the same window Bitcoin broke above $85,000 and pushed toward $86,600, the same week Strategy confirmed a fresh BTC purchase and a Bitcoin reserve bill advanced through a House committee for the first time ever. None of these are coincidences, they're the same underlying story showing up across four different channels at once.
🧠 Why does the timing actually matter here?
A single day of ETF inflows can be noise. Three consecutive sessions reversing a prior week of outflows is a trend forming, not a blip. It suggests institutional desks aren't just reacting to the price move after the fact, they're adding into it, which is a meaningfully different signal than retail chasing a green candle.
✅ What this means for you
If you're holding, this is a genuinely supportive data point, institutional flows reversing this sharply after a down week suggests real conviction returning, not just short-term positioning.
If you're on the sidelines, ETF inflow data is one of the more reliable signals to watch precisely because it's harder to fake than social sentiment or a single trending hashtag. A continuation of this inflow streak over the coming week would meaningfully strengthen the case that this rally has real staying power.
If you're actively trading, watch whether inflows stay positive as price consolidates. Institutional money staying in during a pause is a stronger signal than institutional money piling in only while price is already ripping.
🟢 Bullish scenario
Inflows continue for a second consecutive week, institutional demand becomes a consistent tailwind, and ETF flows help hold BTC's price above recent breakout levels.
🔴 Risk scenario
This turns out to be a short covering-adjacent bounce in institutional positioning, inflows fade again next week, and the reversal proves temporary rather than the start of a sustained trend.
👀 Three things to watch
1️⃣ Next week's flow data
Does the inflow streak extend, or was this a one-week reversal tied to this specific price breakout?
2️⃣ Issuer breakdown
Is demand broad-based across multiple ETF issuers, or concentrated in just one or two funds?
3️⃣ Ether ETF flows
Does the $270 million into spot Ether funds continue growing alongside Bitcoin's, or does it lag behind?
💡 The key takeaway
Price moves can be driven by leverage and short squeezes. ETF inflows are driven by allocators actually choosing to commit capital.
Seeing both happen together this week, a price breakout and nearly $1.6 billion in institutional inflows reversing a down week, is a stronger combined signal than either one would be alone. The real test is whether this becomes a multi-week pattern or fades as quickly as it appeared.
That is the part worth watching.
This post is for informational and educational purposes only and is not financial advice. Crypto markets are volatile. Always conduct your own research before making financial decisions.
#BinanceSquare #Bitcoin #ETF #Institutional #Crypto
1
1
12


Article
Ethereum (ETH) Enters a Critical Phase as ETF Demand Strengthens and Glamsterdam Upgrade Moves .Ethereum (ETH) is once again attracting significant attention across the cryptocurrency market as institutional demand strengthens, spot Ethereum ETFs record consecutive inflows, and the network moves closer to its next major protocol upgrade.
$BTC
{spot}(BTCUSDT)
The latest developments put Ethereum at an important point in its 2026 roadmap. On September 22, U.S. spot Ethereum ETFs recorded approximately $162 million in net inflows, marking the third consecutive day of positive inflows. BlackRock’s ETHA led the latest session with approximately $88.13 million in net inflows, followed by Fidelity’s FETH with about $33.64 million.
This renewed ETF demand is particularly notable because institutional flows have become an increasingly important factor in the digital-asset market. Earlier in the week, Ethereum spot ETFs also recorded a much larger single-day inflow of approximately $269.98 million, according to data reported from SoSoValue.
ETH Price Recovers as Market Momentum Improves
Ethereum has also experienced a significant recovery during September.
Recent market data placed ETH around the $2,700–$2,800 range, while reports showed ETH reaching levels not seen since earlier in the year. On September 21, ETH closed around $2,776 after reaching an intraday high near $2,805.
Reuters reported that Ether had broken above a key technical resistance area around $2,661.52, following a strong rally in late August. The report also highlighted that ETH had moved above its 10-day moving average and a longer-term trendline.
However, technical levels should not be interpreted as guarantees of future price movements. Ethereum remains sensitive to broader market conditions, liquidity, investor sentiment and changes in cryptocurrency flows.
Institutional Accumulation Adds Another Important Dimension
ETF activity is not the only sign of institutional interest in Ethereum.
Ethereum treasury company BitMine recently increased its ETH holdings to approximately 5.98 million ETH, according to The Block. The company’s holdings represented more than 4.9% of Ethereum’s circulating supply at the time of the report. BitMine also purchased another 27,562 ETH during the previous week.
Large-scale accumulation does not automatically determine the future price of ETH, but it demonstrates that Ethereum is increasingly being treated by some institutions as a strategic digital asset rather than simply a trading instrument.
Glamsterdam: Ethereum’s Next Major Upgrade
One of the most important long-term developments for Ethereum is the upcoming Glamsterdam upgrade.
According to Ethereum’s official roadmap, Glamsterdam is currently being tested on devnets and is targeted for Q4 2026, although a final mainnet date has not yet been confirmed. The next major milestone is a Sepolia fork scheduled for October 6, 2026.
The upgrade is designed to improve Ethereum’s ability to scale while maintaining decentralization and network sustainability.
One of the headline changes is Enshrined Proposer-Builder Separation (ePBS). This is intended to bring the separation between block proposers and block builders directly into the Ethereum protocol, reducing reliance on external relay infrastructure and helping the network handle larger amounts of data more efficiently.
Another major component is Block-Level Access Lists, which are designed to make transaction dependencies easier to identify and support greater parallel processing. This could help Ethereum process more activity efficiently as the network continues to scale.
Potential Improvements to Transaction Costs
Glamsterdam also includes proposals aimed at improving Ethereum’s transaction economics.
One proposal, EIP-2780, would reduce the intrinsic gas cost associated with basic ETH transfers between existing accounts. Ethereum’s official documentation estimates that a standard transfer could become substantially cheaper under the proposal, although the exact effect will depend on the final implementation and network conditions.
For Ethereum users, lower costs could make simple transactions more efficient. For developers, improvements in scalability and data handling could support a broader range of applications and higher network activity.
Ethereum’s Scaling Strategy Continues to Evolve
Glamsterdam is not an isolated development. It is part of Ethereum’s broader roadmap following major upgrades including The Merge, Shapella, Dencun, Pectra and Fusaka.
Ethereum’s official roadmap currently lists Glamsterdam for Q4 2026 and Hegotá for 2027. The broader objective is to improve scalability, security and sustainability while allowing Ethereum and its Layer-2 ecosystem to handle significantly more activity.
The Ethereum Foundation has also identified longer-term research areas including faster finality, privacy, state growth, zkEVM development and post-quantum security. These developments show that Ethereum’s evolution is continuing well beyond the next upgrade.
What the Latest Data Means for ETH
The current Ethereum story is therefore being driven by several factors at the same time:
1. ETF demand is returning.
Spot Ethereum ETFs have recorded consecutive days of net inflows, with September 22 producing approximately $162 million in net inflows.
2. Institutional exposure is expanding.
Large treasury-focused entities such as BitMine continue accumulating ETH, highlighting growing institutional involvement in the Ethereum ecosystem.
3. Ethereum’s protocol is still evolving.
Glamsterdam is being tested ahead of a planned Q4 2026 mainnet release, with scaling, efficiency and protocol-level improvements among its major objectives.
4. ETH market momentum has improved.
ETH has recovered into the $2,700–$2,800 area during the latest market move, although volatility remains significant.
The Road Ahead
Ethereum enters the final part of September with a combination of stronger institutional activity, renewed ETF demand and major technological developments on the horizon.
The upcoming Glamsterdam upgrade could become an important milestone in Ethereum’s long-term scaling strategy, while continued ETF flows and institutional accumulation are providing additional market data to watch.
At the same time, investors should recognize that positive ETF flows, institutional purchases and network upgrades do not guarantee a specific future price. Cryptocurrency markets remain highly volatile, and Ethereum’s price can be affected by macroeconomic conditions, liquidity, regulation, market sentiment and changes in capital flows.
For now, the key Ethereum developments to monitor are spot ETF flows, institutional ETH accumulation, the October 6 Sepolia milestone, and the progress of Glamsterdam toward its planned Q4 2026 mainnet launch.
$ETH
ETH remains one of the most closely watched assets in the digital-asset market, with both its financial demand and underlying network development entering an important period.
{spot}(ETHUSDT)
$ARB
{spot}(ARBUSDT)
#ETHETFsApproved #ARB #etf #ETH🔥🔥🔥🔥🔥🔥
Ethereum (ETH) Enters a Critical Phase as ETF Demand Strengthens and Glamsterdam Upgrade Moves .
Ethereum (ETH) is once again attracting significant attention across the cryptocurrency market as institutional demand strengthens, spot Ethereum ETFs record consecutive inflows, and the network moves closer to its next major protocol upgrade.
$BTC
The latest developments put Ethereum at an important point in its 2026 roadmap. On September 22, U.S. spot Ethereum ETFs recorded approximately $162 million in net inflows, marking the third consecutive day of positive inflows. BlackRock’s ETHA led the latest session with approximately $88.13 million in net inflows, followed by Fidelity’s FETH with about $33.64 million.
This renewed ETF demand is particularly notable because institutional flows have become an increasingly important factor in the digital-asset market. Earlier in the week, Ethereum spot ETFs also recorded a much larger single-day inflow of approximately $269.98 million, according to data reported from SoSoValue.
ETH Price Recovers as Market Momentum Improves
Ethereum has also experienced a significant recovery during September.
Recent market data placed ETH around the $2,700–$2,800 range, while reports showed ETH reaching levels not seen since earlier in the year. On September 21, ETH closed around $2,776 after reaching an intraday high near $2,805.
Reuters reported that Ether had broken above a key technical resistance area around $2,661.52, following a strong rally in late August. The report also highlighted that ETH had moved above its 10-day moving average and a longer-term trendline.
However, technical levels should not be interpreted as guarantees of future price movements. Ethereum remains sensitive to broader market conditions, liquidity, investor sentiment and changes in cryptocurrency flows.
Institutional Accumulation Adds Another Important Dimension
ETF activity is not the only sign of institutional interest in Ethereum.
Ethereum treasury company BitMine recently increased its ETH holdings to approximately 5.98 million ETH, according to The Block. The company’s holdings represented more than 4.9% of Ethereum’s circulating supply at the time of the report. BitMine also purchased another 27,562 ETH during the previous week.
Large-scale accumulation does not automatically determine the future price of ETH, but it demonstrates that Ethereum is increasingly being treated by some institutions as a strategic digital asset rather than simply a trading instrument.
Glamsterdam: Ethereum’s Next Major Upgrade
One of the most important long-term developments for Ethereum is the upcoming Glamsterdam upgrade.
According to Ethereum’s official roadmap, Glamsterdam is currently being tested on devnets and is targeted for Q4 2026, although a final mainnet date has not yet been confirmed. The next major milestone is a Sepolia fork scheduled for October 6, 2026.
The upgrade is designed to improve Ethereum’s ability to scale while maintaining decentralization and network sustainability.
One of the headline changes is Enshrined Proposer-Builder Separation (ePBS). This is intended to bring the separation between block proposers and block builders directly into the Ethereum protocol, reducing reliance on external relay infrastructure and helping the network handle larger amounts of data more efficiently.
Another major component is Block-Level Access Lists, which are designed to make transaction dependencies easier to identify and support greater parallel processing. This could help Ethereum process more activity efficiently as the network continues to scale.
Potential Improvements to Transaction Costs
Glamsterdam also includes proposals aimed at improving Ethereum’s transaction economics.
One proposal, EIP-2780, would reduce the intrinsic gas cost associated with basic ETH transfers between existing accounts. Ethereum’s official documentation estimates that a standard transfer could become substantially cheaper under the proposal, although the exact effect will depend on the final implementation and network conditions.
For Ethereum users, lower costs could make simple transactions more efficient. For developers, improvements in scalability and data handling could support a broader range of applications and higher network activity.
Ethereum’s Scaling Strategy Continues to Evolve
Glamsterdam is not an isolated development. It is part of Ethereum’s broader roadmap following major upgrades including The Merge, Shapella, Dencun, Pectra and Fusaka.
Ethereum’s official roadmap currently lists Glamsterdam for Q4 2026 and Hegotá for 2027. The broader objective is to improve scalability, security and sustainability while allowing Ethereum and its Layer-2 ecosystem to handle significantly more activity.
The Ethereum Foundation has also identified longer-term research areas including faster finality, privacy, state growth, zkEVM development and post-quantum security. These developments show that Ethereum’s evolution is continuing well beyond the next upgrade.
What the Latest Data Means for ETH
The current Ethereum story is therefore being driven by several factors at the same time:
1. ETF demand is returning.
Spot Ethereum ETFs have recorded consecutive days of net inflows, with September 22 producing approximately $162 million in net inflows.
2. Institutional exposure is expanding.
Large treasury-focused entities such as BitMine continue accumulating ETH, highlighting growing institutional involvement in the Ethereum ecosystem.
3. Ethereum’s protocol is still evolving.
Glamsterdam is being tested ahead of a planned Q4 2026 mainnet release, with scaling, efficiency and protocol-level improvements among its major objectives.
4. ETH market momentum has improved.
ETH has recovered into the $2,700–$2,800 area during the latest market move, although volatility remains significant.
The Road Ahead
Ethereum enters the final part of September with a combination of stronger institutional activity, renewed ETF demand and major technological developments on the horizon.
The upcoming Glamsterdam upgrade could become an important milestone in Ethereum’s long-term scaling strategy, while continued ETF flows and institutional accumulation are providing additional market data to watch.
At the same time, investors should recognize that positive ETF flows, institutional purchases and network upgrades do not guarantee a specific future price. Cryptocurrency markets remain highly volatile, and Ethereum’s price can be affected by macroeconomic conditions, liquidity, regulation, market sentiment and changes in capital flows.
For now, the key Ethereum developments to monitor are spot ETF flows, institutional ETH accumulation, the October 6 Sepolia milestone, and the progress of Glamsterdam toward its planned Q4 2026 mainnet launch.
$ETH
ETH remains one of the most closely watched assets in the digital-asset market, with both its financial demand and underlying network development entering an important period.
$ARB
#ETHETFsApproved #ARB #etf #ETH🔥🔥🔥🔥🔥🔥
$BTC
The latest developments put Ethereum at an important point in its 2026 roadmap. On September 22, U.S. spot Ethereum ETFs recorded approximately $162 million in net inflows, marking the third consecutive day of positive inflows. BlackRock’s ETHA led the latest session with approximately $88.13 million in net inflows, followed by Fidelity’s FETH with about $33.64 million.
This renewed ETF demand is particularly notable because institutional flows have become an increasingly important factor in the digital-asset market. Earlier in the week, Ethereum spot ETFs also recorded a much larger single-day inflow of approximately $269.98 million, according to data reported from SoSoValue.
ETH Price Recovers as Market Momentum Improves
Ethereum has also experienced a significant recovery during September.
Recent market data placed ETH around the $2,700–$2,800 range, while reports showed ETH reaching levels not seen since earlier in the year. On September 21, ETH closed around $2,776 after reaching an intraday high near $2,805.
Reuters reported that Ether had broken above a key technical resistance area around $2,661.52, following a strong rally in late August. The report also highlighted that ETH had moved above its 10-day moving average and a longer-term trendline.
However, technical levels should not be interpreted as guarantees of future price movements. Ethereum remains sensitive to broader market conditions, liquidity, investor sentiment and changes in cryptocurrency flows.
Institutional Accumulation Adds Another Important Dimension
ETF activity is not the only sign of institutional interest in Ethereum.
Ethereum treasury company BitMine recently increased its ETH holdings to approximately 5.98 million ETH, according to The Block. The company’s holdings represented more than 4.9% of Ethereum’s circulating supply at the time of the report. BitMine also purchased another 27,562 ETH during the previous week.
Large-scale accumulation does not automatically determine the future price of ETH, but it demonstrates that Ethereum is increasingly being treated by some institutions as a strategic digital asset rather than simply a trading instrument.
Glamsterdam: Ethereum’s Next Major Upgrade
One of the most important long-term developments for Ethereum is the upcoming Glamsterdam upgrade.
According to Ethereum’s official roadmap, Glamsterdam is currently being tested on devnets and is targeted for Q4 2026, although a final mainnet date has not yet been confirmed. The next major milestone is a Sepolia fork scheduled for October 6, 2026.
The upgrade is designed to improve Ethereum’s ability to scale while maintaining decentralization and network sustainability.
One of the headline changes is Enshrined Proposer-Builder Separation (ePBS). This is intended to bring the separation between block proposers and block builders directly into the Ethereum protocol, reducing reliance on external relay infrastructure and helping the network handle larger amounts of data more efficiently.
Another major component is Block-Level Access Lists, which are designed to make transaction dependencies easier to identify and support greater parallel processing. This could help Ethereum process more activity efficiently as the network continues to scale.
Potential Improvements to Transaction Costs
Glamsterdam also includes proposals aimed at improving Ethereum’s transaction economics.
One proposal, EIP-2780, would reduce the intrinsic gas cost associated with basic ETH transfers between existing accounts. Ethereum’s official documentation estimates that a standard transfer could become substantially cheaper under the proposal, although the exact effect will depend on the final implementation and network conditions.
For Ethereum users, lower costs could make simple transactions more efficient. For developers, improvements in scalability and data handling could support a broader range of applications and higher network activity.
Ethereum’s Scaling Strategy Continues to Evolve
Glamsterdam is not an isolated development. It is part of Ethereum’s broader roadmap following major upgrades including The Merge, Shapella, Dencun, Pectra and Fusaka.
Ethereum’s official roadmap currently lists Glamsterdam for Q4 2026 and Hegotá for 2027. The broader objective is to improve scalability, security and sustainability while allowing Ethereum and its Layer-2 ecosystem to handle significantly more activity.
The Ethereum Foundation has also identified longer-term research areas including faster finality, privacy, state growth, zkEVM development and post-quantum security. These developments show that Ethereum’s evolution is continuing well beyond the next upgrade.
What the Latest Data Means for ETH
The current Ethereum story is therefore being driven by several factors at the same time:
1. ETF demand is returning.
Spot Ethereum ETFs have recorded consecutive days of net inflows, with September 22 producing approximately $162 million in net inflows.
2. Institutional exposure is expanding.
Large treasury-focused entities such as BitMine continue accumulating ETH, highlighting growing institutional involvement in the Ethereum ecosystem.
3. Ethereum’s protocol is still evolving.
Glamsterdam is being tested ahead of a planned Q4 2026 mainnet release, with scaling, efficiency and protocol-level improvements among its major objectives.
4. ETH market momentum has improved.
ETH has recovered into the $2,700–$2,800 area during the latest market move, although volatility remains significant.
The Road Ahead
Ethereum enters the final part of September with a combination of stronger institutional activity, renewed ETF demand and major technological developments on the horizon.
The upcoming Glamsterdam upgrade could become an important milestone in Ethereum’s long-term scaling strategy, while continued ETF flows and institutional accumulation are providing additional market data to watch.
At the same time, investors should recognize that positive ETF flows, institutional purchases and network upgrades do not guarantee a specific future price. Cryptocurrency markets remain highly volatile, and Ethereum’s price can be affected by macroeconomic conditions, liquidity, regulation, market sentiment and changes in capital flows.
For now, the key Ethereum developments to monitor are spot ETF flows, institutional ETH accumulation, the October 6 Sepolia milestone, and the progress of Glamsterdam toward its planned Q4 2026 mainnet launch.
$ETH
ETH remains one of the most closely watched assets in the digital-asset market, with both its financial demand and underlying network development entering an important period.
$ARB
#ETHETFsApproved #ARB #etf #ETH🔥🔥🔥🔥🔥🔥
219

·
--
🟢 Bitcoin pushed past eighty-four thousand dollars on a two hundred sixty-two million dollar short squeeze before spot ETFs recorded nearly one billion dollars in inflows. On-chain sequencing proves derivatives spark the initial market shock 🚀 while Wall Street capital follows to amplify 📈 the rally. Watch futures open interest for the true leading signal.
Are spot Bitcoin ETFs momentum followers or genuine market catalysts? Share your view below. 👇
#bitcoin #etf #derivatives #blackrock #liquidations
🟢 Bitcoin pushed past eighty-four thousand dollars on a two hundred sixty-two million dollar short squeeze before spot ETFs recorded nearly one billion dollars in inflows. On-chain sequencing proves derivatives spark the initial market shock 🚀 while Wall Street capital follows to amplify 📈 the rally. Watch futures open interest for the true leading signal.
Are spot Bitcoin ETFs momentum followers or genuine market catalysts? Share your view below. 👇
#bitcoin #etf #derivatives #blackrock #liquidations
Are spot Bitcoin ETFs momentum followers or genuine market catalysts? Share your view below. 👇
#bitcoin #etf #derivatives #blackrock #liquidations

46

·
--
Bullish
Spot Bitcoin ETFs just pulled in nearly $1 BILLION in a single day. 🤯
That's the 9th largest inflow EVER.
Here's the backdrop:
📈 $BTC reclaimed $85,000 as oil prices and bond yields retreated, sitting at an 8-month high
🏢 Strategy bought 950 more $BTC for $76M, pushing total holdings to 846,000 BTC
🔵 Tom Lee says the crypto bull market is officially underway
Ξ Bitmine is closing in on its 5% Ethereum supply target with a fresh 27,562 $ETH buy
This isn't retail FOMO. This is institutional money moving in at scale.
Not everyone agrees though, one analyst who called 2026 correctly is now warning of a possible Q4 crash. Worth watching both sides.
Is this the start of the next leg up? 👇
#bitcoin #etf #BitcoinBreaksAboveMayHighNears$86K #CryptoNews #BinanceSquareFamily
Spot Bitcoin ETFs just pulled in nearly $1 BILLION in a single day. 🤯
That's the 9th largest inflow EVER.
Here's the backdrop:
📈 $BTC reclaimed $85,000 as oil prices and bond yields retreated, sitting at an 8-month high
🏢 Strategy bought 950 more $BTC for $76M, pushing total holdings to 846,000 BTC
🔵 Tom Lee says the crypto bull market is officially underway
Ξ Bitmine is closing in on its 5% Ethereum supply target with a fresh 27,562 $ETH buy
This isn't retail FOMO. This is institutional money moving in at scale.
Not everyone agrees though, one analyst who called 2026 correctly is now warning of a possible Q4 crash. Worth watching both sides.
Is this the start of the next leg up? 👇
#bitcoin #etf #BitcoinBreaksAboveMayHighNears$86K #CryptoNews #BinanceSquareFamily
That's the 9th largest inflow EVER.
Here's the backdrop:
📈 $BTC reclaimed $85,000 as oil prices and bond yields retreated, sitting at an 8-month high
🏢 Strategy bought 950 more $BTC for $76M, pushing total holdings to 846,000 BTC
🔵 Tom Lee says the crypto bull market is officially underway
Ξ Bitmine is closing in on its 5% Ethereum supply target with a fresh 27,562 $ETH buy
This isn't retail FOMO. This is institutional money moving in at scale.
Not everyone agrees though, one analyst who called 2026 correctly is now warning of a possible Q4 crash. Worth watching both sides.
Is this the start of the next leg up? 👇
#bitcoin #etf #BitcoinBreaksAboveMayHighNears$86K #CryptoNews #BinanceSquareFamily
1
97
·
--
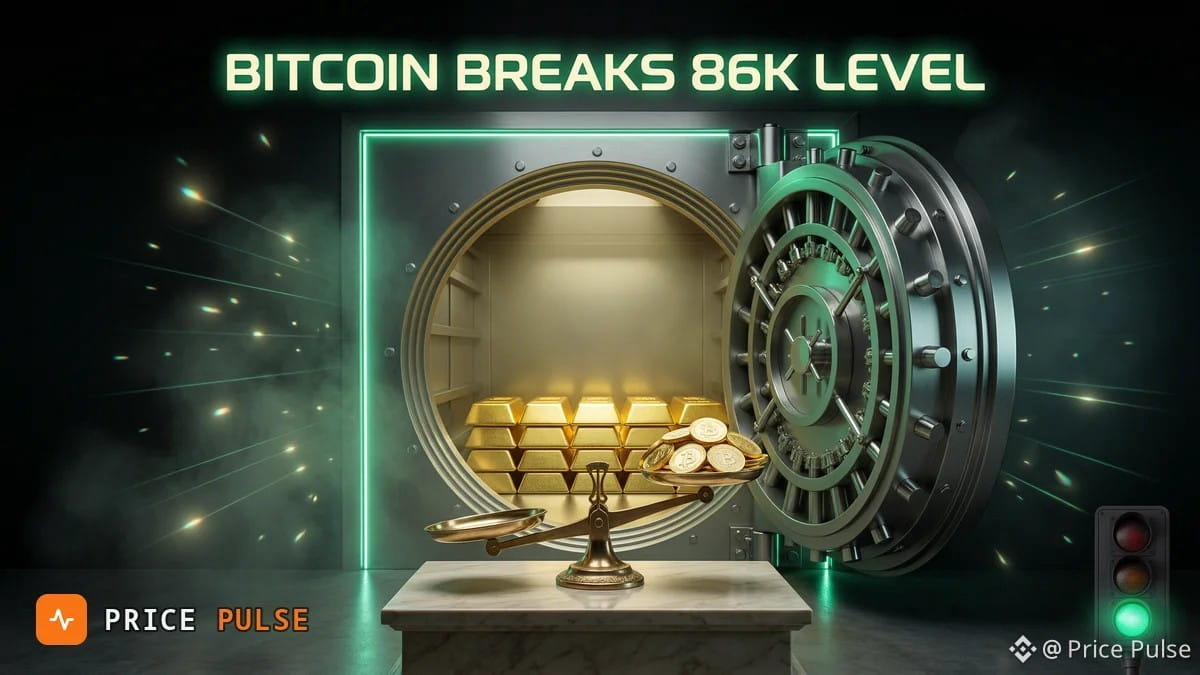
🟢 Bitcoin broke past $86,000 as returning U.S. spot ETF demand collided with a massive short squeeze above $82,000. Easing Treasury yields and falling energy prices provided the macro fuel 🚀 for institutional buyers to absorb sell pressure. If ETF inflows maintain this pace, spot liquidity depth 📈 supports a continued drive toward higher all-time levels while $82,000 holds as key baseline support.
Will sustained ETF inflows push Bitcoin past $90K before macro yield volatility returns? 👇
#bitcoin #etf #macro #yields #derivatives
🟢 Bitcoin broke past $86,000 as returning U.S. spot ETF demand collided with a massive short squeeze above $82,000. Easing Treasury yields and falling energy prices provided the macro fuel 🚀 for institutional buyers to absorb sell pressure. If ETF inflows maintain this pace, spot liquidity depth 📈 supports a continued drive toward higher all-time levels while $82,000 holds as key baseline support.
Will sustained ETF inflows push Bitcoin past $90K before macro yield volatility returns? 👇
#bitcoin #etf #macro #yields #derivatives
Will sustained ETF inflows push Bitcoin past $90K before macro yield volatility returns? 👇
#bitcoin #etf #macro #yields #derivatives
18

·
--
#BitcoinETFs #blakrock #etf
Bitcoin ETF & Institutional Inflows
Hook: 🚨 BREAKING: The ETF Era Just Flipped Bitcoin's DNA.
Body:
BlackRock and Fidelity are quietly absorbing almost every available BTC. The US crypto ETF universe now includes 11 spot Bitcoin ETFs, with Bitwise projecting 100+ additional products launching through the remainder of 2026 .
Here's the critical data point:
Binance Research just revealed that BTC's correlation with global liquidity flipped from +0.21 before spot ETF approvals to −0.778 in 2026 . Translation: Bitcoin is no longer trading like a risk asset. It's trading like a macro hedge.
Why this matters:
• Institutional money is no longer "coming" — it's already here.
• ETF flows are now the dominant price driver, not retail sentiment.
• The old "crypto follows NASDAQ" playbook is broken.
Are you positioning for a decoupled BTC, or still watching the NASDAQ chart?
#BitcoinETF #BTC #InstitutionalAdoption #BinanceSquare
#BitcoinETFs #blakrock #etf
Bitcoin ETF & Institutional Inflows
Hook: 🚨 BREAKING: The ETF Era Just Flipped Bitcoin's DNA.
Body:
BlackRock and Fidelity are quietly absorbing almost every available BTC. The US crypto ETF universe now includes 11 spot Bitcoin ETFs, with Bitwise projecting 100+ additional products launching through the remainder of 2026 .
Here's the critical data point:
Binance Research just revealed that BTC's correlation with global liquidity flipped from +0.21 before spot ETF approvals to −0.778 in 2026 . Translation: Bitcoin is no longer trading like a risk asset. It's trading like a macro hedge.
Why this matters:
• Institutional money is no longer "coming" — it's already here.
• ETF flows are now the dominant price driver, not retail sentiment.
• The old "crypto follows NASDAQ" playbook is broken.
Are you positioning for a decoupled BTC, or still watching the NASDAQ chart?
#BitcoinETF #BTC #InstitutionalAdoption #BinanceSquare
Bitcoin ETF & Institutional Inflows
Hook: 🚨 BREAKING: The ETF Era Just Flipped Bitcoin's DNA.
Body:
BlackRock and Fidelity are quietly absorbing almost every available BTC. The US crypto ETF universe now includes 11 spot Bitcoin ETFs, with Bitwise projecting 100+ additional products launching through the remainder of 2026 .
Here's the critical data point:
Binance Research just revealed that BTC's correlation with global liquidity flipped from +0.21 before spot ETF approvals to −0.778 in 2026 . Translation: Bitcoin is no longer trading like a risk asset. It's trading like a macro hedge.
Why this matters:
• Institutional money is no longer "coming" — it's already here.
• ETF flows are now the dominant price driver, not retail sentiment.
• The old "crypto follows NASDAQ" playbook is broken.
Are you positioning for a decoupled BTC, or still watching the NASDAQ chart?
#BitcoinETF #BTC #InstitutionalAdoption #BinanceSquare
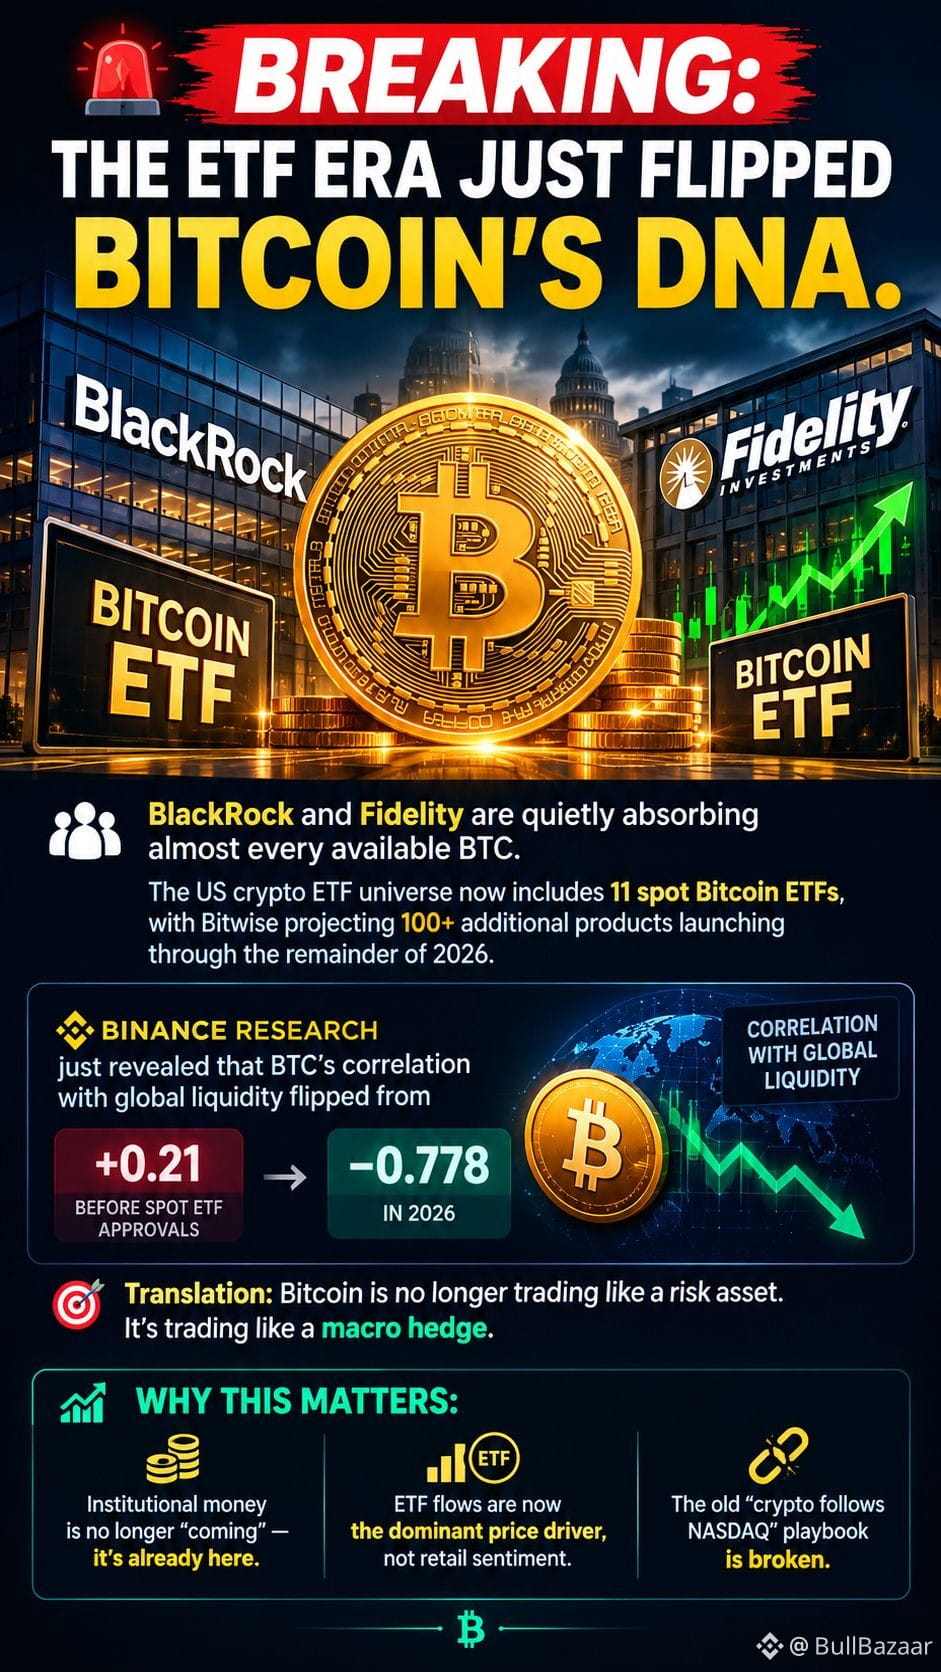
66
#etf
🚀 Massive capital inflow into spot ETFs: Institutions are back!
September 21 marked one of the strongest days for crypto ETF inflows: total net inflows for Bitcoin and Ethereum exceeded $1.18 billion, with outflows for both categories at exactly zero ($0.00).
{future}(BTCUSDT)
➡️ $BTC ETFs: +$937.30 million for the day
Total assets under management reached $102.03 billion.
IBIT (BlackRock / iShares): +$381.40 million
ARKB (ARK 21Shares): +$289.10 million
FBTC (Fidelity): +$238.80 million
GBTC (Grayscale): +$3.30 million
Other funds: +$24.70 million
{future}(ETHUSDT)
➡️ $ETH ETFs: +$251.60 million for the day
Total assets under management reached $14.63 billion.
ETHA (BlackRock): +$110.10 million
FETH (Fidelity): +$73.00 million
ETHE (Grayscale): +$4.90 million
ETHW (Bitwise): +$4.30 million
Other funds: +$59.30 million
⚠️ Key takeaway: The complete absence of outflows, combined with strong buying from BlackRock, ARK, and Fidelity, signals a powerful bullish sentiment among major investors.
#etf
🚀 Massive capital inflow into spot ETFs: Institutions are back!
September 21 marked one of the strongest days for crypto ETF inflows: total net inflows for Bitcoin and Ethereum exceeded $1.18 billion, with outflows for both categories at exactly zero ($0.00).
➡️ $BTC ETFs: +$937.30 million for the day
Total assets under management reached $102.03 billion.
IBIT (BlackRock / iShares): +$381.40 million
ARKB (ARK 21Shares): +$289.10 million
FBTC (Fidelity): +$238.80 million
GBTC (Grayscale): +$3.30 million
Other funds: +$24.70 million
➡️ $ETH ETFs: +$251.60 million for the day
Total assets under management reached $14.63 billion.
ETHA (BlackRock): +$110.10 million
FETH (Fidelity): +$73.00 million
ETHE (Grayscale): +$4.90 million
ETHW (Bitwise): +$4.30 million
Other funds: +$59.30 million
⚠️ Key takeaway: The complete absence of outflows, combined with strong buying from BlackRock, ARK, and Fidelity, signals a powerful bullish sentiment among major investors.
🚀 Massive capital inflow into spot ETFs: Institutions are back!
September 21 marked one of the strongest days for crypto ETF inflows: total net inflows for Bitcoin and Ethereum exceeded $1.18 billion, with outflows for both categories at exactly zero ($0.00).
➡️ $BTC ETFs: +$937.30 million for the day
Total assets under management reached $102.03 billion.
IBIT (BlackRock / iShares): +$381.40 million
ARKB (ARK 21Shares): +$289.10 million
FBTC (Fidelity): +$238.80 million
GBTC (Grayscale): +$3.30 million
Other funds: +$24.70 million
➡️ $ETH ETFs: +$251.60 million for the day
Total assets under management reached $14.63 billion.
ETHA (BlackRock): +$110.10 million
FETH (Fidelity): +$73.00 million
ETHE (Grayscale): +$4.90 million
ETHW (Bitwise): +$4.30 million
Other funds: +$59.30 million
⚠️ Key takeaway: The complete absence of outflows, combined with strong buying from BlackRock, ARK, and Fidelity, signals a powerful bullish sentiment among major investors.
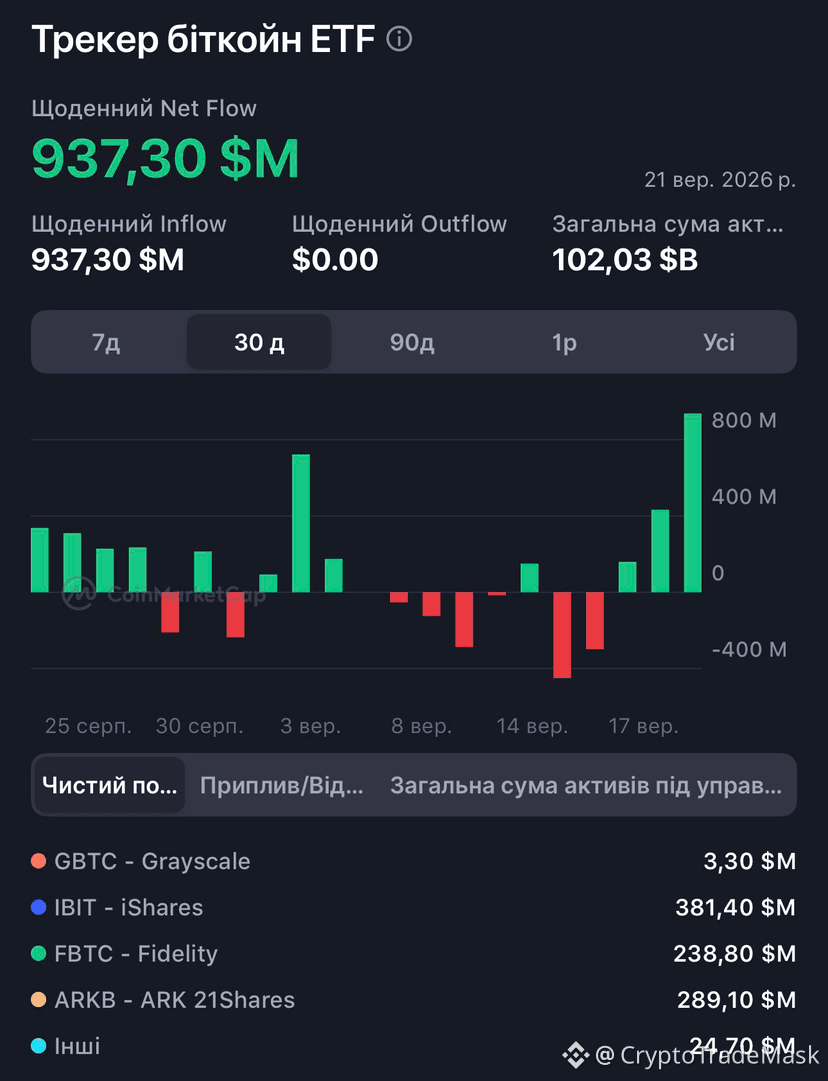
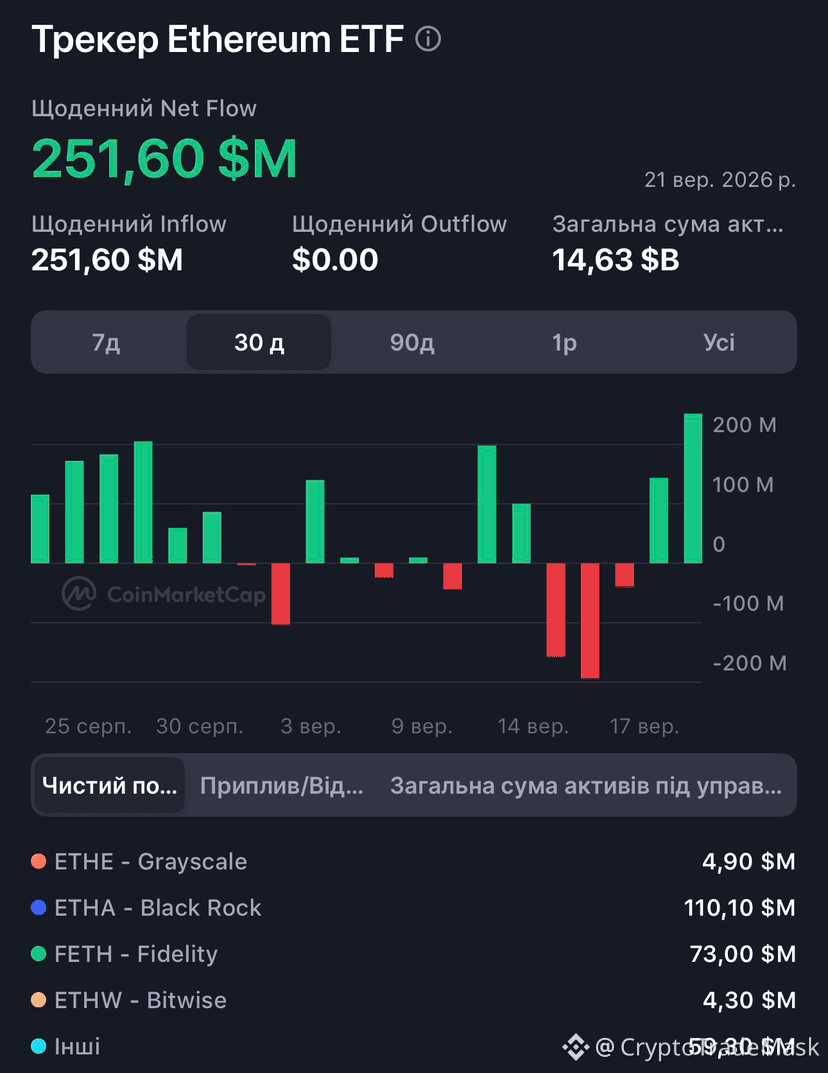
1
37

Bitcoin ($BTC) ETFs recorded a Monday inflow that topped the total net inflow of the previous week, which had been the weakest on record.
This abrupt change underscores how quickly capital can move into crypto‑linked products.
Investors saw more money enter in a single day than in the entire low‑inflow week before. What do you think drives such rapid swings in ETF funding? Bitcoin exchange‑traded funds saw a sharp inflow on Monday that exceeded the total net inflow recorded for the entire previous week. That prior week had posted the weakest net inflow in the funds' history.
#Bitcoin #Etf #Crypto #Investment #Marketflows
Bitcoin ($BTC ) ETFs recorded a Monday inflow that topped the total net inflow of the previous week, which had been the weakest on record.
This abrupt change underscores how quickly capital can move into crypto‑linked products.
Investors saw more money enter in a single day than in the entire low‑inflow week before. What do you think drives such rapid swings in ETF funding? Bitcoin exchange‑traded funds saw a sharp inflow on Monday that exceeded the total net inflow recorded for the entire previous week. That prior week had posted the weakest net inflow in the funds' history.
#Bitcoin #Etf #Crypto #Investment #Marketflows
This abrupt change underscores how quickly capital can move into crypto‑linked products.
Investors saw more money enter in a single day than in the entire low‑inflow week before. What do you think drives such rapid swings in ETF funding? Bitcoin exchange‑traded funds saw a sharp inflow on Monday that exceeded the total net inflow recorded for the entire previous week. That prior week had posted the weakest net inflow in the funds' history.
#Bitcoin #Etf #Crypto #Investment #Marketflows
83
Log in to explore more content
Join global crypto users on Binance Square
⚡️ Get latest and useful information about crypto.
💬 Trusted by the world’s largest crypto exchange.
👍 Discover real insights from verified creators.
Email / Phone number
Trending Topics
1
#ETHBreaksAbove$2,700
8 views
20 Discussing
2
#USWeighsPromotingDollarStablecoinsAbroad
7,839 views
490 Discussing
3
#US10YTreasuryYieldHits19YearHigh
6,708 views
390 Discussing
4
#SpotBitcoinETFsInflow$2.31BInFourDays
685 views
33 Discussing
5
#BitcoinRejectedAt$87,300Twice
0 views
0 Discussing
6
#BCHJumps28%OnCMEFuturesListing
50,202 views
1,075 Discussing
7
#WallStreetEarningsRevisionsTurnBearish
35,030 views
819 Discussing
8
#DollarIndexReclaims101
31,808 views
790 Discussing
9
#21SharesLaunchesEuropesFirstZcashETP
78,524 views
1,555 Discussing
10
#CardanoJoinsX402PaymentStandard
49,385 views
1,126 Discussing