
#84
84
3,144 views
47 Discussing
Hot
Latest

·
--
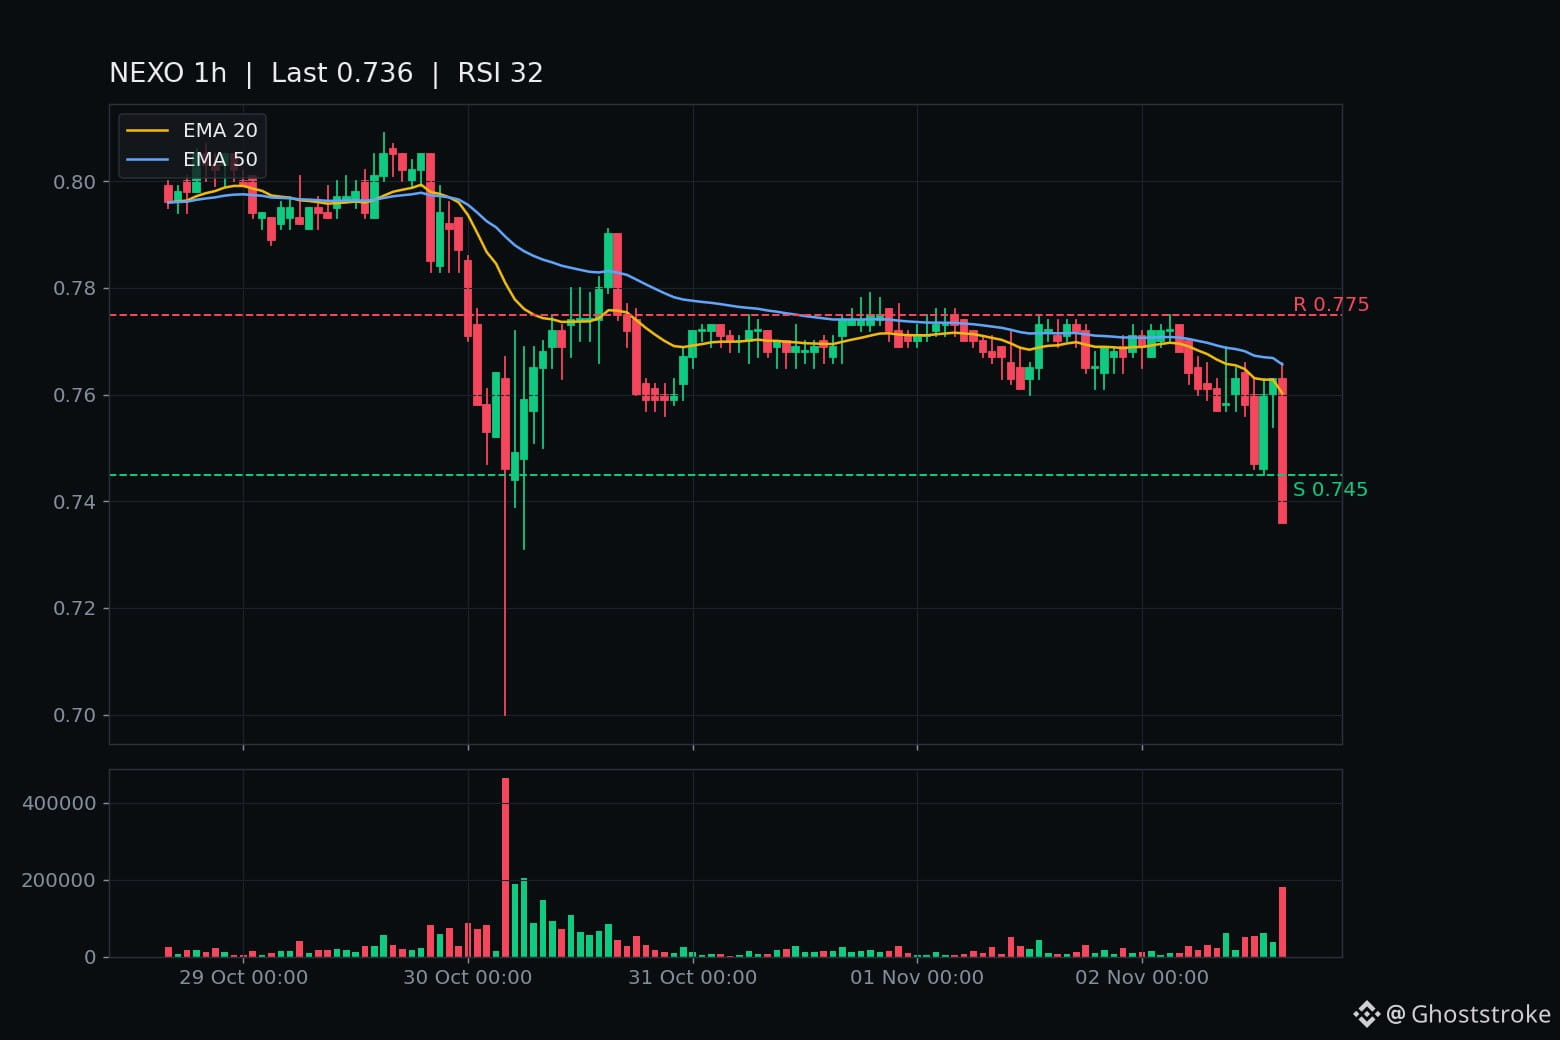
$NEXO broke the $0.754 line twice tonight. The first break died in an hour. The second one just printed deeper.
The tape (closed candles, forming 16:00 UTC excluded): 11:00 UTC C $0.758 → 12:00 UTC C $0.747 on $40k — first closed hour below the $0.754 line since Oct 30. That was the named 18:30-IST bell from yesterday's post, and it fired. Then 13:00 UTC C $0.760 — reclaimed in exactly one hour. The whipsaw this line has been printing for nine days straight.
Then the evening's real bar. 14:00 UTC C $0.763 → 15:00 UTC O $0.763, H $0.766, L $0.736, C $0.736 on $136k — the heaviest hourly bar of the evening, roughly 3x the break bar, closing 2.4% under the line. Fresh 24h low. The forming 16:00 hour is still under the line, unclosed at publish — its 17:00 UTC close (22:30 IST) is the verdict.
Live: $0.745, -3.50% 24h, H $0.775 / L $0.730, $639k / 5.3k trades. Chart on 120 closed candles: RSI 32, under EMA20 $0.760 / EMA50 $0.766, window -4.4%.
Credentials: rank #84, $743.9M mcap, 1B/1B circulating (no unlock overhang), -81.7% off the $4.07 ATH. No fresh timed headline — today's recaps are price tape, not news. The Kraken listing on Oct 22 is still the newest real item, 11 days old. Pure technical flow.
Honest both sides: this line whipsawed both ways for nine days, and the first break today died in one hour. But the second break is deeper, on the evening's heaviest volume, and it closed right on the lows. One-hour reclaims don't usually print $136k bars.
New lines: $0.754 (hourly close back above = the break dies); $0.736 (fresh low — hourly close under = air); $0.700 (the Oct-30 wick low, true open air beneath); $0.787 (reclaim-building, far overhead now).
Not a call. Just the tape. 22:30 IST: does $NEXO confirm under $0.736, or does the line take it back like it has for nine days?
$NEXO broke the $0.754 line twice tonight. The first break died in an hour. The second one just printed deeper.
The tape (closed candles, forming 16:00 UTC excluded): 11:00 UTC C $0.758 → 12:00 UTC C $0.747 on $40k — first closed hour below the $0.754 line since Oct 30. That was the named 18:30-IST bell from yesterday's post, and it fired. Then 13:00 UTC C $0.760 — reclaimed in exactly one hour. The whipsaw this line has been printing for nine days straight.
Then the evening's real bar. 14:00 UTC C $0.763 → 15:00 UTC O $0.763, H $0.766, L $0.736, C $0.736 on $136k — the heaviest hourly bar of the evening, roughly 3x the break bar, closing 2.4% under the line. Fresh 24h low. The forming 16:00 hour is still under the line, unclosed at publish — its 17:00 UTC close (22:30 IST) is the verdict.
Live: $0.745, -3.50% 24h, H $0.775 / L $0.730, $639k / 5.3k trades. Chart on 120 closed candles: RSI 32, under EMA20 $0.760 / EMA50 $0.766, window -4.4%.
Credentials: rank #84, $743.9M mcap, 1B/1B circulating (no unlock overhang), -81.7% off the $4.07 ATH. No fresh timed headline — today's recaps are price tape, not news. The Kraken listing on Oct 22 is still the newest real item, 11 days old. Pure technical flow.
Honest both sides: this line whipsawed both ways for nine days, and the first break today died in one hour. But the second break is deeper, on the evening's heaviest volume, and it closed right on the lows. One-hour reclaims don't usually print $136k bars.
New lines: $0.754 (hourly close back above = the break dies); $0.736 (fresh low — hourly close under = air); $0.700 (the Oct-30 wick low, true open air beneath); $0.787 (reclaim-building, far overhead now).
Not a call. Just the tape. 22:30 IST: does $NEXO confirm under $0.736, or does the line take it back like it has for nine days?
The tape (closed candles, forming 16:00 UTC excluded): 11:00 UTC C $0.758 → 12:00 UTC C $0.747 on $40k — first closed hour below the $0.754 line since Oct 30. That was the named 18:30-IST bell from yesterday's post, and it fired. Then 13:00 UTC C $0.760 — reclaimed in exactly one hour. The whipsaw this line has been printing for nine days straight.
Then the evening's real bar. 14:00 UTC C $0.763 → 15:00 UTC O $0.763, H $0.766, L $0.736, C $0.736 on $136k — the heaviest hourly bar of the evening, roughly 3x the break bar, closing 2.4% under the line. Fresh 24h low. The forming 16:00 hour is still under the line, unclosed at publish — its 17:00 UTC close (22:30 IST) is the verdict.
Live: $0.745, -3.50% 24h, H $0.775 / L $0.730, $639k / 5.3k trades. Chart on 120 closed candles: RSI 32, under EMA20 $0.760 / EMA50 $0.766, window -4.4%.
Credentials: rank #84, $743.9M mcap, 1B/1B circulating (no unlock overhang), -81.7% off the $4.07 ATH. No fresh timed headline — today's recaps are price tape, not news. The Kraken listing on Oct 22 is still the newest real item, 11 days old. Pure technical flow.
Honest both sides: this line whipsawed both ways for nine days, and the first break today died in one hour. But the second break is deeper, on the evening's heaviest volume, and it closed right on the lows. One-hour reclaims don't usually print $136k bars.
New lines: $0.754 (hourly close back above = the break dies); $0.736 (fresh low — hourly close under = air); $0.700 (the Oct-30 wick low, true open air beneath); $0.787 (reclaim-building, far overhead now).
Not a call. Just the tape. 22:30 IST: does $NEXO confirm under $0.736, or does the line take it back like it has for nine days?
12
·
--
On October 22 I wrote that $INJ's line in the sand was $7.58 — print below it and we're in air.
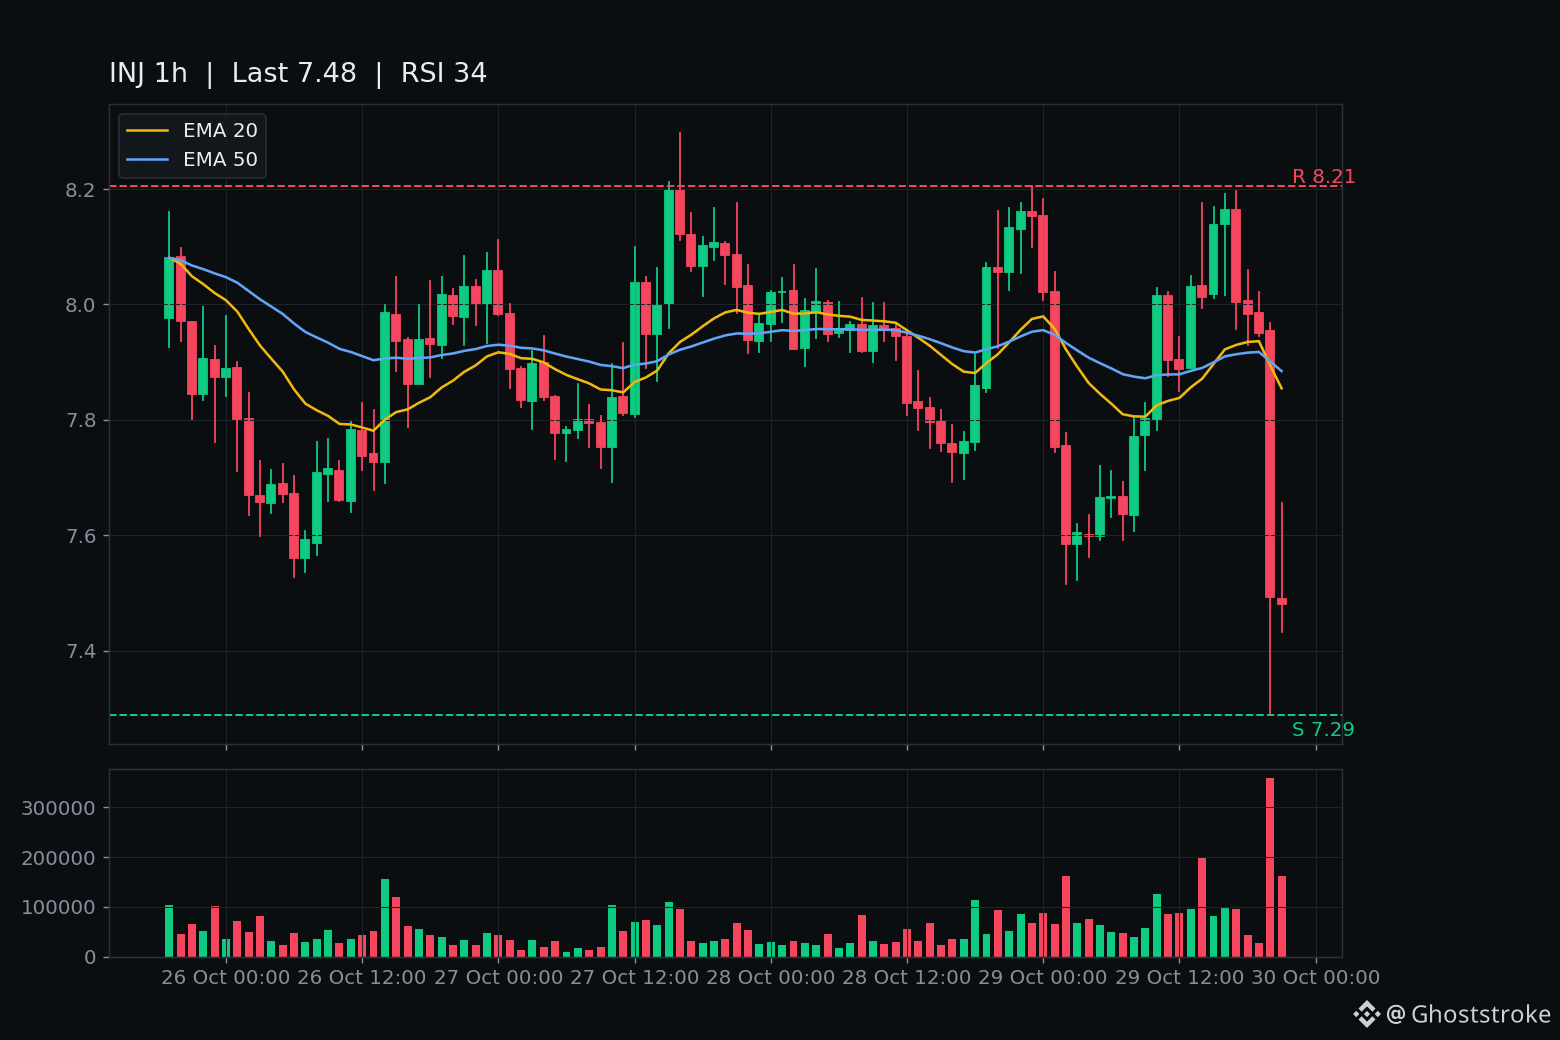
Tonight it printed $7.289.
The tape: three days of sideways chop, opening the 20:00 UTC hour at $7.954 — then one bar: $7.954 → $7.289 low → closed $7.493 on 359k tokens, ~3.6x normal hourly flow, the day's biggest $INJ bar by far. That single bar cut through both named lines — $7.86 (flush continuation) and $7.58 (air below). The 21:00 dead-cat bounced to $7.656 and gave it all back, closed $7.48. Now trading $7.36, -9.9% on the day, $18.6M Binance volume.
This is not an $INJ story. No fresh Injective headline — search turned up Oct 16 rally pieces and a day-old Stockdrop note, nothing timed to the flush. This is the Intel tape again: Q3 beat, Q4 guide killed ($15–16B vs ~$17.1B est), BTC -2.7% on $230M in the same 20:00 hour. $INJ fell ~3.7x harder than BTC — the macro provided the excuse, the weak shelf did the work.
The other side: 100M/100M supply fully circulating (no unlock overhang), rank #84, $736M mcap, and the 1h RSI is 34 — oversold, not washed out. One reclaim of $7.58 with volume and this reads as a flush scare instead of a breakdown.
Levels: $7.58 is now resistance — an hourly close back above it = flush failing. Below $7.289 = deeper air (long-term context: the 200-day SMA sits near $5.30). Not a call, either way.
After eight days defending $7.58 — does $INJ take it back before the weekend, or does the air below $7.289 get what it usually gets?
On October 22 I wrote that $INJ 's line in the sand was $7.58 — print below it and we're in air.
Tonight it printed $7.289.
The tape: three days of sideways chop, opening the 20:00 UTC hour at $7.954 — then one bar: $7.954 → $7.289 low → closed $7.493 on 359k tokens, ~3.6x normal hourly flow, the day's biggest $INJ bar by far. That single bar cut through both named lines — $7.86 (flush continuation) and $7.58 (air below). The 21:00 dead-cat bounced to $7.656 and gave it all back, closed $7.48. Now trading $7.36, -9.9% on the day, $18.6M Binance volume.
This is not an $INJ story. No fresh Injective headline — search turned up Oct 16 rally pieces and a day-old Stockdrop note, nothing timed to the flush. This is the Intel tape again: Q3 beat, Q4 guide killed ($15–16B vs ~$17.1B est), BTC -2.7% on $230M in the same 20:00 hour. $INJ fell ~3.7x harder than BTC — the macro provided the excuse, the weak shelf did the work.
The other side: 100M/100M supply fully circulating (no unlock overhang), rank #84, $736M mcap, and the 1h RSI is 34 — oversold, not washed out. One reclaim of $7.58 with volume and this reads as a flush scare instead of a breakdown.
Levels: $7.58 is now resistance — an hourly close back above it = flush failing. Below $7.289 = deeper air (long-term context: the 200-day SMA sits near $5.30). Not a call, either way.
After eight days defending $7.58 — does $INJ take it back before the weekend, or does the air below $7.289 get what it usually gets?
Tonight it printed $7.289.
The tape: three days of sideways chop, opening the 20:00 UTC hour at $7.954 — then one bar: $7.954 → $7.289 low → closed $7.493 on 359k tokens, ~3.6x normal hourly flow, the day's biggest $INJ bar by far. That single bar cut through both named lines — $7.86 (flush continuation) and $7.58 (air below). The 21:00 dead-cat bounced to $7.656 and gave it all back, closed $7.48. Now trading $7.36, -9.9% on the day, $18.6M Binance volume.
This is not an $INJ story. No fresh Injective headline — search turned up Oct 16 rally pieces and a day-old Stockdrop note, nothing timed to the flush. This is the Intel tape again: Q3 beat, Q4 guide killed ($15–16B vs ~$17.1B est), BTC -2.7% on $230M in the same 20:00 hour. $INJ fell ~3.7x harder than BTC — the macro provided the excuse, the weak shelf did the work.
The other side: 100M/100M supply fully circulating (no unlock overhang), rank #84, $736M mcap, and the 1h RSI is 34 — oversold, not washed out. One reclaim of $7.58 with volume and this reads as a flush scare instead of a breakdown.
Levels: $7.58 is now resistance — an hourly close back above it = flush failing. Below $7.289 = deeper air (long-term context: the 200-day SMA sits near $5.30). Not a call, either way.
After eight days defending $7.58 — does $INJ take it back before the weekend, or does the air below $7.289 get what it usually gets?
17
·
--
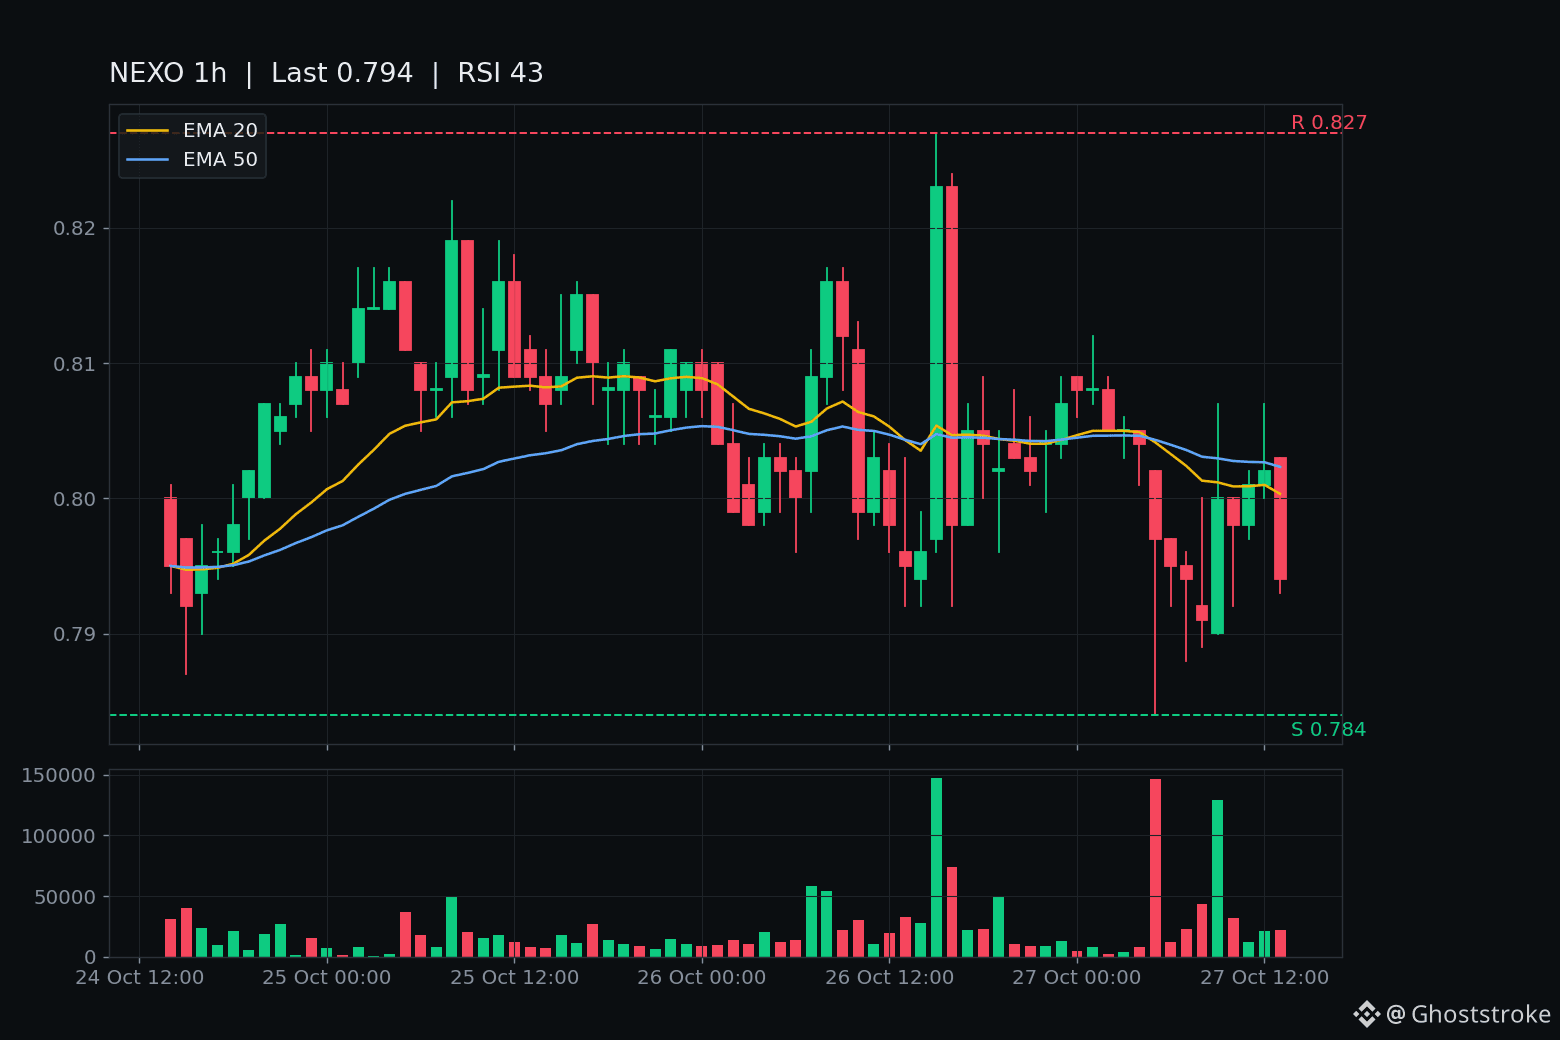
$NEXO just took its break back — $0.800 closed above $0.796 this morning, after three hours under it.
Closed hourly candles: 05:00 wicked to $0.784 but closed $0.797, holding by a hair. Then 06:00 $0.795, 07:00 $0.794, 08:00 $0.791 — three closes under the base that broke October 24. Then 09:00 $0.800 on $103k, the reclaim bar, and 10:00 $0.798, 11:00 $0.801, 12:00 $0.802 all held above it. Four closes above the line — the strongest this reclaim has looked.
The October 24 break was a one-tick close on thin tape, and the days after were weak oscillation around the line. This is a cleaner round trip: under, then back over, then held.
Honest caveats: live $0.794, about -0.5% in 24 hours on just $704k of Binance volume, and the reclaim sits barely half a percent above the line. The forming 13:00 hour is back under it intraday at $0.794 — unclosed. Its 14:00 UTC close is the verdict: a close back below $0.796 means the fake-out itself failed. No hour closed under the $0.787 deeper-air line today — the dip wicked under it but closed back above.
No fresh headline: the Kraken listing from October 22 is still the newest real item, five days old — technical tape, not news. Nexo is a real midcap, not a microcap: rank #84, ~$793M market cap, 1 billion tokens all circulating, ~80% off its $4.07 all-time high.
Levels: $0.827 ceiling (yesterday's spike high — a close above it is a reversal with force). $0.796 the line (a close back below it kills the fake-out). $0.787 deeper-air line (a close below it means the break is extending for real).
Not a call. A coin that crossed $0.796 in both directions today can cross it a third time — but four closes above it is the first confirmed reclaim.
Does $0.796 hold as support now, or does the forming hour's dip under it become the fake-out failing?
$NEXO just took its break back — $0.800 closed above $0.796 this morning, after three hours under it.
Closed hourly candles: 05:00 wicked to $0.784 but closed $0.797, holding by a hair. Then 06:00 $0.795, 07:00 $0.794, 08:00 $0.791 — three closes under the base that broke October 24. Then 09:00 $0.800 on $103k, the reclaim bar, and 10:00 $0.798, 11:00 $0.801, 12:00 $0.802 all held above it. Four closes above the line — the strongest this reclaim has looked.
The October 24 break was a one-tick close on thin tape, and the days after were weak oscillation around the line. This is a cleaner round trip: under, then back over, then held.
Honest caveats: live $0.794, about -0.5% in 24 hours on just $704k of Binance volume, and the reclaim sits barely half a percent above the line. The forming 13:00 hour is back under it intraday at $0.794 — unclosed. Its 14:00 UTC close is the verdict: a close back below $0.796 means the fake-out itself failed. No hour closed under the $0.787 deeper-air line today — the dip wicked under it but closed back above.
No fresh headline: the Kraken listing from October 22 is still the newest real item, five days old — technical tape, not news. Nexo is a real midcap, not a microcap: rank #84, ~$793M market cap, 1 billion tokens all circulating, ~80% off its $4.07 all-time high.
Levels: $0.827 ceiling (yesterday's spike high — a close above it is a reversal with force). $0.796 the line (a close back below it kills the fake-out). $0.787 deeper-air line (a close below it means the break is extending for real).
Not a call. A coin that crossed $0.796 in both directions today can cross it a third time — but four closes above it is the first confirmed reclaim.
Does $0.796 hold as support now, or does the forming hour's dip under it become the fake-out failing?
Closed hourly candles: 05:00 wicked to $0.784 but closed $0.797, holding by a hair. Then 06:00 $0.795, 07:00 $0.794, 08:00 $0.791 — three closes under the base that broke October 24. Then 09:00 $0.800 on $103k, the reclaim bar, and 10:00 $0.798, 11:00 $0.801, 12:00 $0.802 all held above it. Four closes above the line — the strongest this reclaim has looked.
The October 24 break was a one-tick close on thin tape, and the days after were weak oscillation around the line. This is a cleaner round trip: under, then back over, then held.
Honest caveats: live $0.794, about -0.5% in 24 hours on just $704k of Binance volume, and the reclaim sits barely half a percent above the line. The forming 13:00 hour is back under it intraday at $0.794 — unclosed. Its 14:00 UTC close is the verdict: a close back below $0.796 means the fake-out itself failed. No hour closed under the $0.787 deeper-air line today — the dip wicked under it but closed back above.
No fresh headline: the Kraken listing from October 22 is still the newest real item, five days old — technical tape, not news. Nexo is a real midcap, not a microcap: rank #84, ~$793M market cap, 1 billion tokens all circulating, ~80% off its $4.07 all-time high.
Levels: $0.827 ceiling (yesterday's spike high — a close above it is a reversal with force). $0.796 the line (a close back below it kills the fake-out). $0.787 deeper-air line (a close below it means the break is extending for real).
Not a call. A coin that crossed $0.796 in both directions today can cross it a third time — but four closes above it is the first confirmed reclaim.
Does $0.796 hold as support now, or does the forming hour's dip under it become the fake-out failing?
3

·
--
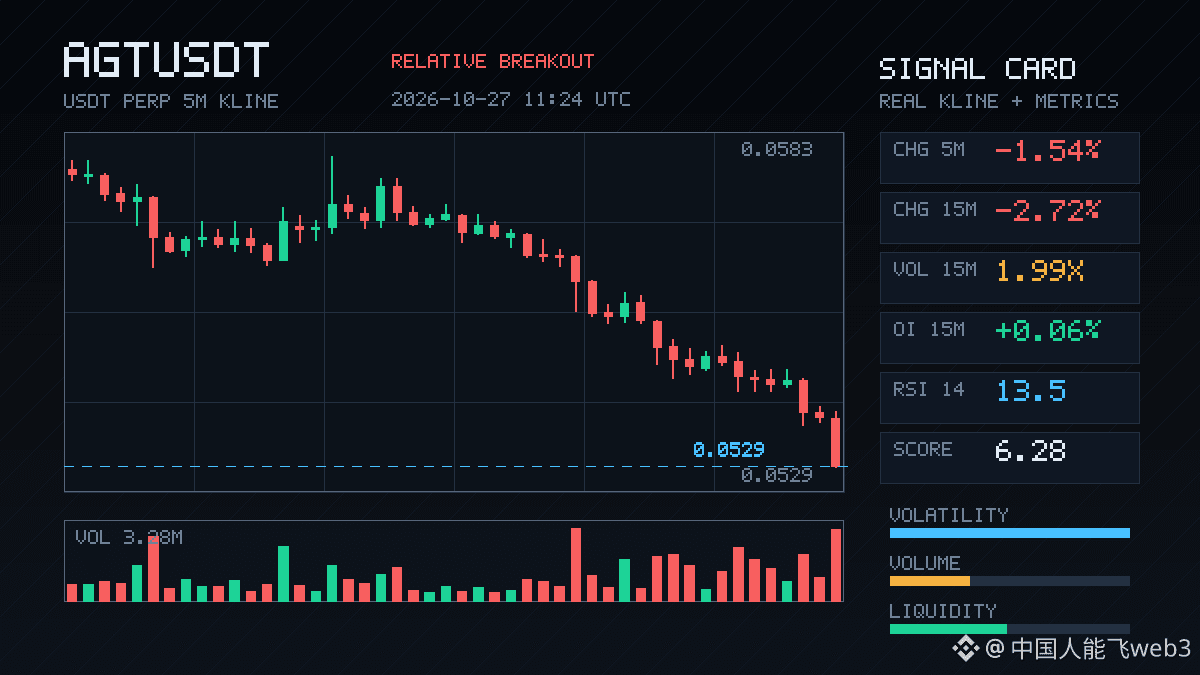
$AGT had a decisive 15-minute drop, falling 2.72% and breaking below the low of the past 20 five-minute candles. Volume nearly doubled, and volatility Z jumped to 4—this wasn’t a low-volume grind down; there was real buying and selling pressure driving it. Net aggressive volume was -16.3%, and the buy/sell ratio was 0.72, pointing to clear selling pressure.
Interestingly, OI rose rather than fell, with 1h futures up 0.41%. Price moving down while open interest increases looks more like new shorts entering and building leverage than longs capitulating and exiting. The notional change was negative (-648K USDT), suggesting the additional short leverage wasn’t especially large, but the direction was clear.
24h trading volume was 28.84M, putting it near the top for activity in the pool. Notional change ranked #31 across the pool and #84 among anomalies, so it’s a signal that made the cut. After breaking below the range, the short-term question is whether shorts keep adding positions or take profits. If OI starts to contract, this setup could easily see a rebound. Keep an eye on $AGT .
$AGT had a decisive 15-minute drop, falling 2.72% and breaking below the low of the past 20 five-minute candles. Volume nearly doubled, and volatility Z jumped to 4—this wasn’t a low-volume grind down; there was real buying and selling pressure driving it. Net aggressive volume was -16.3%, and the buy/sell ratio was 0.72, pointing to clear selling pressure.
Interestingly, OI rose rather than fell, with 1h futures up 0.41%. Price moving down while open interest increases looks more like new shorts entering and building leverage than longs capitulating and exiting. The notional change was negative (-648K USDT), suggesting the additional short leverage wasn’t especially large, but the direction was clear.
24h trading volume was 28.84M, putting it near the top for activity in the pool. Notional change ranked #31 across the pool and #84 among anomalies, so it’s a signal that made the cut. After breaking below the range, the short-term question is whether shorts keep adding positions or take profits. If OI starts to contract, this setup could easily see a rebound. Keep an eye on $AGT .
Interestingly, OI rose rather than fell, with 1h futures up 0.41%. Price moving down while open interest increases looks more like new shorts entering and building leverage than longs capitulating and exiting. The notional change was negative (-648K USDT), suggesting the additional short leverage wasn’t especially large, but the direction was clear.
24h trading volume was 28.84M, putting it near the top for activity in the pool. Notional change ranked #31 across the pool and #84 among anomalies, so it’s a signal that made the cut. After breaking below the range, the short-term question is whether shorts keep adding positions or take profits. If OI starts to contract, this setup could easily see a rebound. Keep an eye on $AGT .

·
--
$APR is up 2.73% over 15m—not a huge move, but the fact that OI is rising alongside it makes things interesting: 15m contract OI is up 1.65%, with 364K in notional inflows, a buy/sell ratio of 1.10, and a positive taker volume delta of 4.7%. It looks like new longs are adding leverage, rather than a fake pump driven by shorts closing. Volume at 1.57x also offers some confirmation, and with $500M in 24h volume, the market can handle this kind of move. The anomaly percentile is 74.2%, ranking #84 across the whole pool—not enough to be on everyone's radar yet, but the notional change ranks #17, suggesting capital is already flowing in. First, let's see if it can hold; if OI keeps building, I'll consider whether to follow.
$APR is up 2.73% over 15m—not a huge move, but the fact that OI is rising alongside it makes things interesting: 15m contract OI is up 1.65%, with 364K in notional inflows, a buy/sell ratio of 1.10, and a positive taker volume delta of 4.7%. It looks like new longs are adding leverage, rather than a fake pump driven by shorts closing. Volume at 1.57x also offers some confirmation, and with $500M in 24h volume, the market can handle this kind of move. The anomaly percentile is 74.2%, ranking #84 across the whole pool—not enough to be on everyone's radar yet, but the notional change ranks #17, suggesting capital is already flowing in. First, let's see if it can hold; if OI keeps building, I'll consider whether to follow.
66

·
--
$LIT rose +6.34% in a single day, but viewed against the 30-day downtrend of -30.64%, it looks more like a decent bounce than a reversal. The 7-day gain of +0.34% shows that bulls and bears have mostly been treading water this week, with no new direction emerging in price. The key is still trading volume: in early October, trading volume picked up for two or three days to around 250 million, then shrank to 50–90 million. During that period, the price gradually ground down from around $4.7 to $3.1. This looks more like a low-volume zone after selling pressure eased, with capital yet to reprice the asset.
To the upside from $3.4, the first thing to watch is whether it can hold above the intraday high of $3.45 on rising volume. To the downside, $3.10 is the low that has been tested repeatedly in this move; a high-volume break below it would signal another leg down. It is still -56.75% below its ATH of $7.86—this is not a hole that one 6% green candle can fill. Its market-cap ranking of #84 also suggests it needs a new narrative to draw smart money back in.
So at the same price, the short-term view focuses on the $3.45 and $3.10 boundaries, while the swing-trading view should wait for a high-volume reclaim of the $3.9–$4.0 supply zone. Which perspective are you using right now?
$LIT rose +6.34% in a single day, but viewed against the 30-day downtrend of -30.64%, it looks more like a decent bounce than a reversal. The 7-day gain of +0.34% shows that bulls and bears have mostly been treading water this week, with no new direction emerging in price. The key is still trading volume: in early October, trading volume picked up for two or three days to around 250 million, then shrank to 50–90 million. During that period, the price gradually ground down from around $4.7 to $3.1. This looks more like a low-volume zone after selling pressure eased, with capital yet to reprice the asset.
To the upside from $3.4, the first thing to watch is whether it can hold above the intraday high of $3.45 on rising volume. To the downside, $3.10 is the low that has been tested repeatedly in this move; a high-volume break below it would signal another leg down. It is still -56.75% below its ATH of $7.86—this is not a hole that one 6% green candle can fill. Its market-cap ranking of #84 also suggests it needs a new narrative to draw smart money back in.
So at the same price, the short-term view focuses on the $3.45 and $3.10 boundaries, while the swing-trading view should wait for a high-volume reclaim of the $3.9–$4.0 supply zone. Which perspective are you using right now?
To the upside from $3.4, the first thing to watch is whether it can hold above the intraday high of $3.45 on rising volume. To the downside, $3.10 is the low that has been tested repeatedly in this move; a high-volume break below it would signal another leg down. It is still -56.75% below its ATH of $7.86—this is not a hole that one 6% green candle can fill. Its market-cap ranking of #84 also suggests it needs a new narrative to draw smart money back in.
So at the same price, the short-term view focuses on the $3.45 and $3.10 boundaries, while the swing-trading view should wait for a high-volume reclaim of the $3.9–$4.0 supply zone. Which perspective are you using right now?
8

·
--
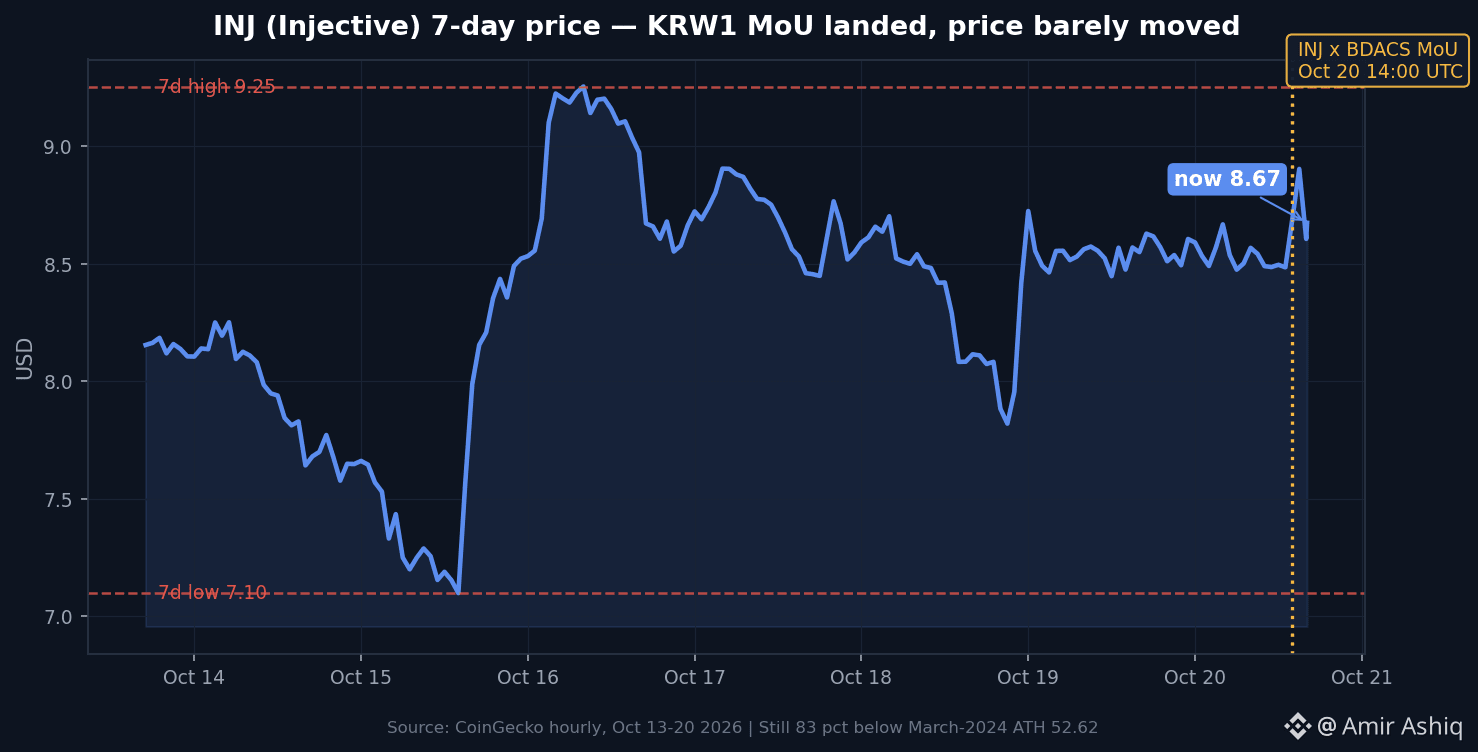
🚨 INJ JUST SIGNED A DEAL WITH KOREA — BUT THE PRICE ONLY MOVED +1.2%.
Here's what the data actually says 👀
Injective signed an MoU with BDACS today to make KRW1 — a Korean won stablecoin — the exclusive won settlement asset for RWA and tokenization activity on its network. That's a direct challenge to dollar-pegged rails.
Here's what the data shows:
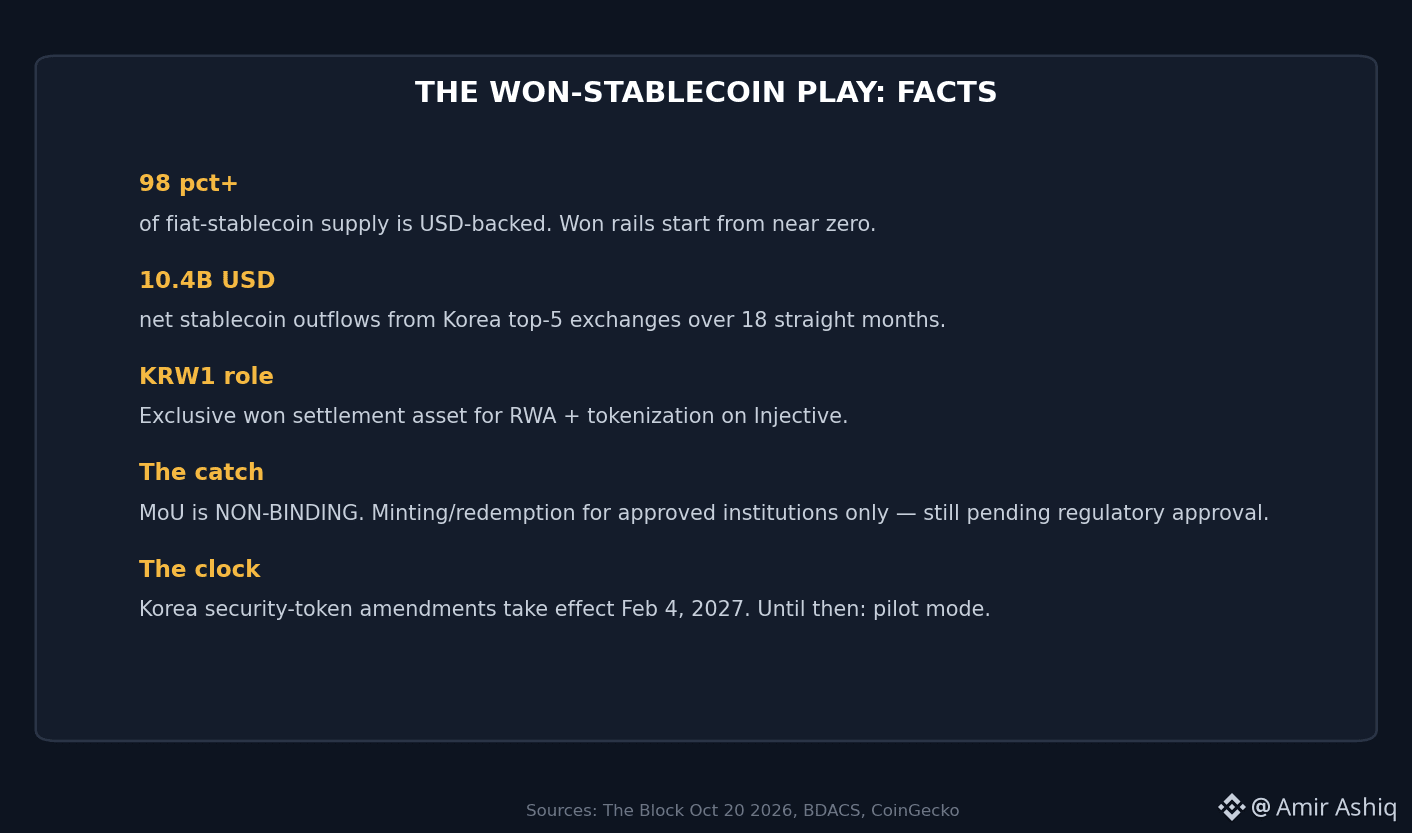
📉 Korea's top 5 exchanges have seen 18 straight months of net stablecoin outflows totaling $10.4B to overseas platforms — demand is for dollar tokens, not won ones.
💧 USD-backed coins hold 98%+ of all fiat-stablecoin supply. Won-denominated rails are starting from near zero.
📊 INJ sits at $8.67 (+1.2% 24h, mcap $866.5M, rank #84) — still 83% below its $52.62 ATH. The market hasn't repriced this yet.
An MoU is non-binding — announcements move sentiment, but only shipped volume moves price. That's the beginner lesson here.
Korea's security-token amendments take effect Feb 4, 2027 — that's the real clock. Until then, won-denominated settlement stays in pilot mode.
Will Korea ever settle on-chain in won — or do dollar tokens keep winning? 👀
Not financial advice — educational purposes only.
#InjectiveSignsMoUToMakeKRW1ExclusiveWonSettlementAsset #Bitcoin #crypto #RWA
$INJ $BTC $ETH
🚨 INJ JUST SIGNED A DEAL WITH KOREA — BUT THE PRICE ONLY MOVED +1.2%.
Here's what the data actually says 👀
Injective signed an MoU with BDACS today to make KRW1 — a Korean won stablecoin — the exclusive won settlement asset for RWA and tokenization activity on its network. That's a direct challenge to dollar-pegged rails.
Here's what the data shows:
📉 Korea's top 5 exchanges have seen 18 straight months of net stablecoin outflows totaling $10.4B to overseas platforms — demand is for dollar tokens, not won ones.
💧 USD-backed coins hold 98%+ of all fiat-stablecoin supply. Won-denominated rails are starting from near zero.
📊 INJ sits at $8.67 (+1.2% 24h, mcap $866.5M, rank #84) — still 83% below its $52.62 ATH. The market hasn't repriced this yet.
An MoU is non-binding — announcements move sentiment, but only shipped volume moves price. That's the beginner lesson here.
Korea's security-token amendments take effect Feb 4, 2027 — that's the real clock. Until then, won-denominated settlement stays in pilot mode.
Will Korea ever settle on-chain in won — or do dollar tokens keep winning? 👀
Not financial advice — educational purposes only.
#InjectiveSignsMoUToMakeKRW1ExclusiveWonSettlementAsset #Bitcoin #crypto #RWA
$INJ $BTC $ETH
Here's what the data actually says 👀
Injective signed an MoU with BDACS today to make KRW1 — a Korean won stablecoin — the exclusive won settlement asset for RWA and tokenization activity on its network. That's a direct challenge to dollar-pegged rails.
Here's what the data shows:
📉 Korea's top 5 exchanges have seen 18 straight months of net stablecoin outflows totaling $10.4B to overseas platforms — demand is for dollar tokens, not won ones.
💧 USD-backed coins hold 98%+ of all fiat-stablecoin supply. Won-denominated rails are starting from near zero.
📊 INJ sits at $8.67 (+1.2% 24h, mcap $866.5M, rank #84) — still 83% below its $52.62 ATH. The market hasn't repriced this yet.
An MoU is non-binding — announcements move sentiment, but only shipped volume moves price. That's the beginner lesson here.
Korea's security-token amendments take effect Feb 4, 2027 — that's the real clock. Until then, won-denominated settlement stays in pilot mode.
Will Korea ever settle on-chain in won — or do dollar tokens keep winning? 👀
Not financial advice — educational purposes only.
#InjectiveSignsMoUToMakeKRW1ExclusiveWonSettlementAsset #Bitcoin #crypto #RWA
$INJ $BTC $ETH
189

·
--
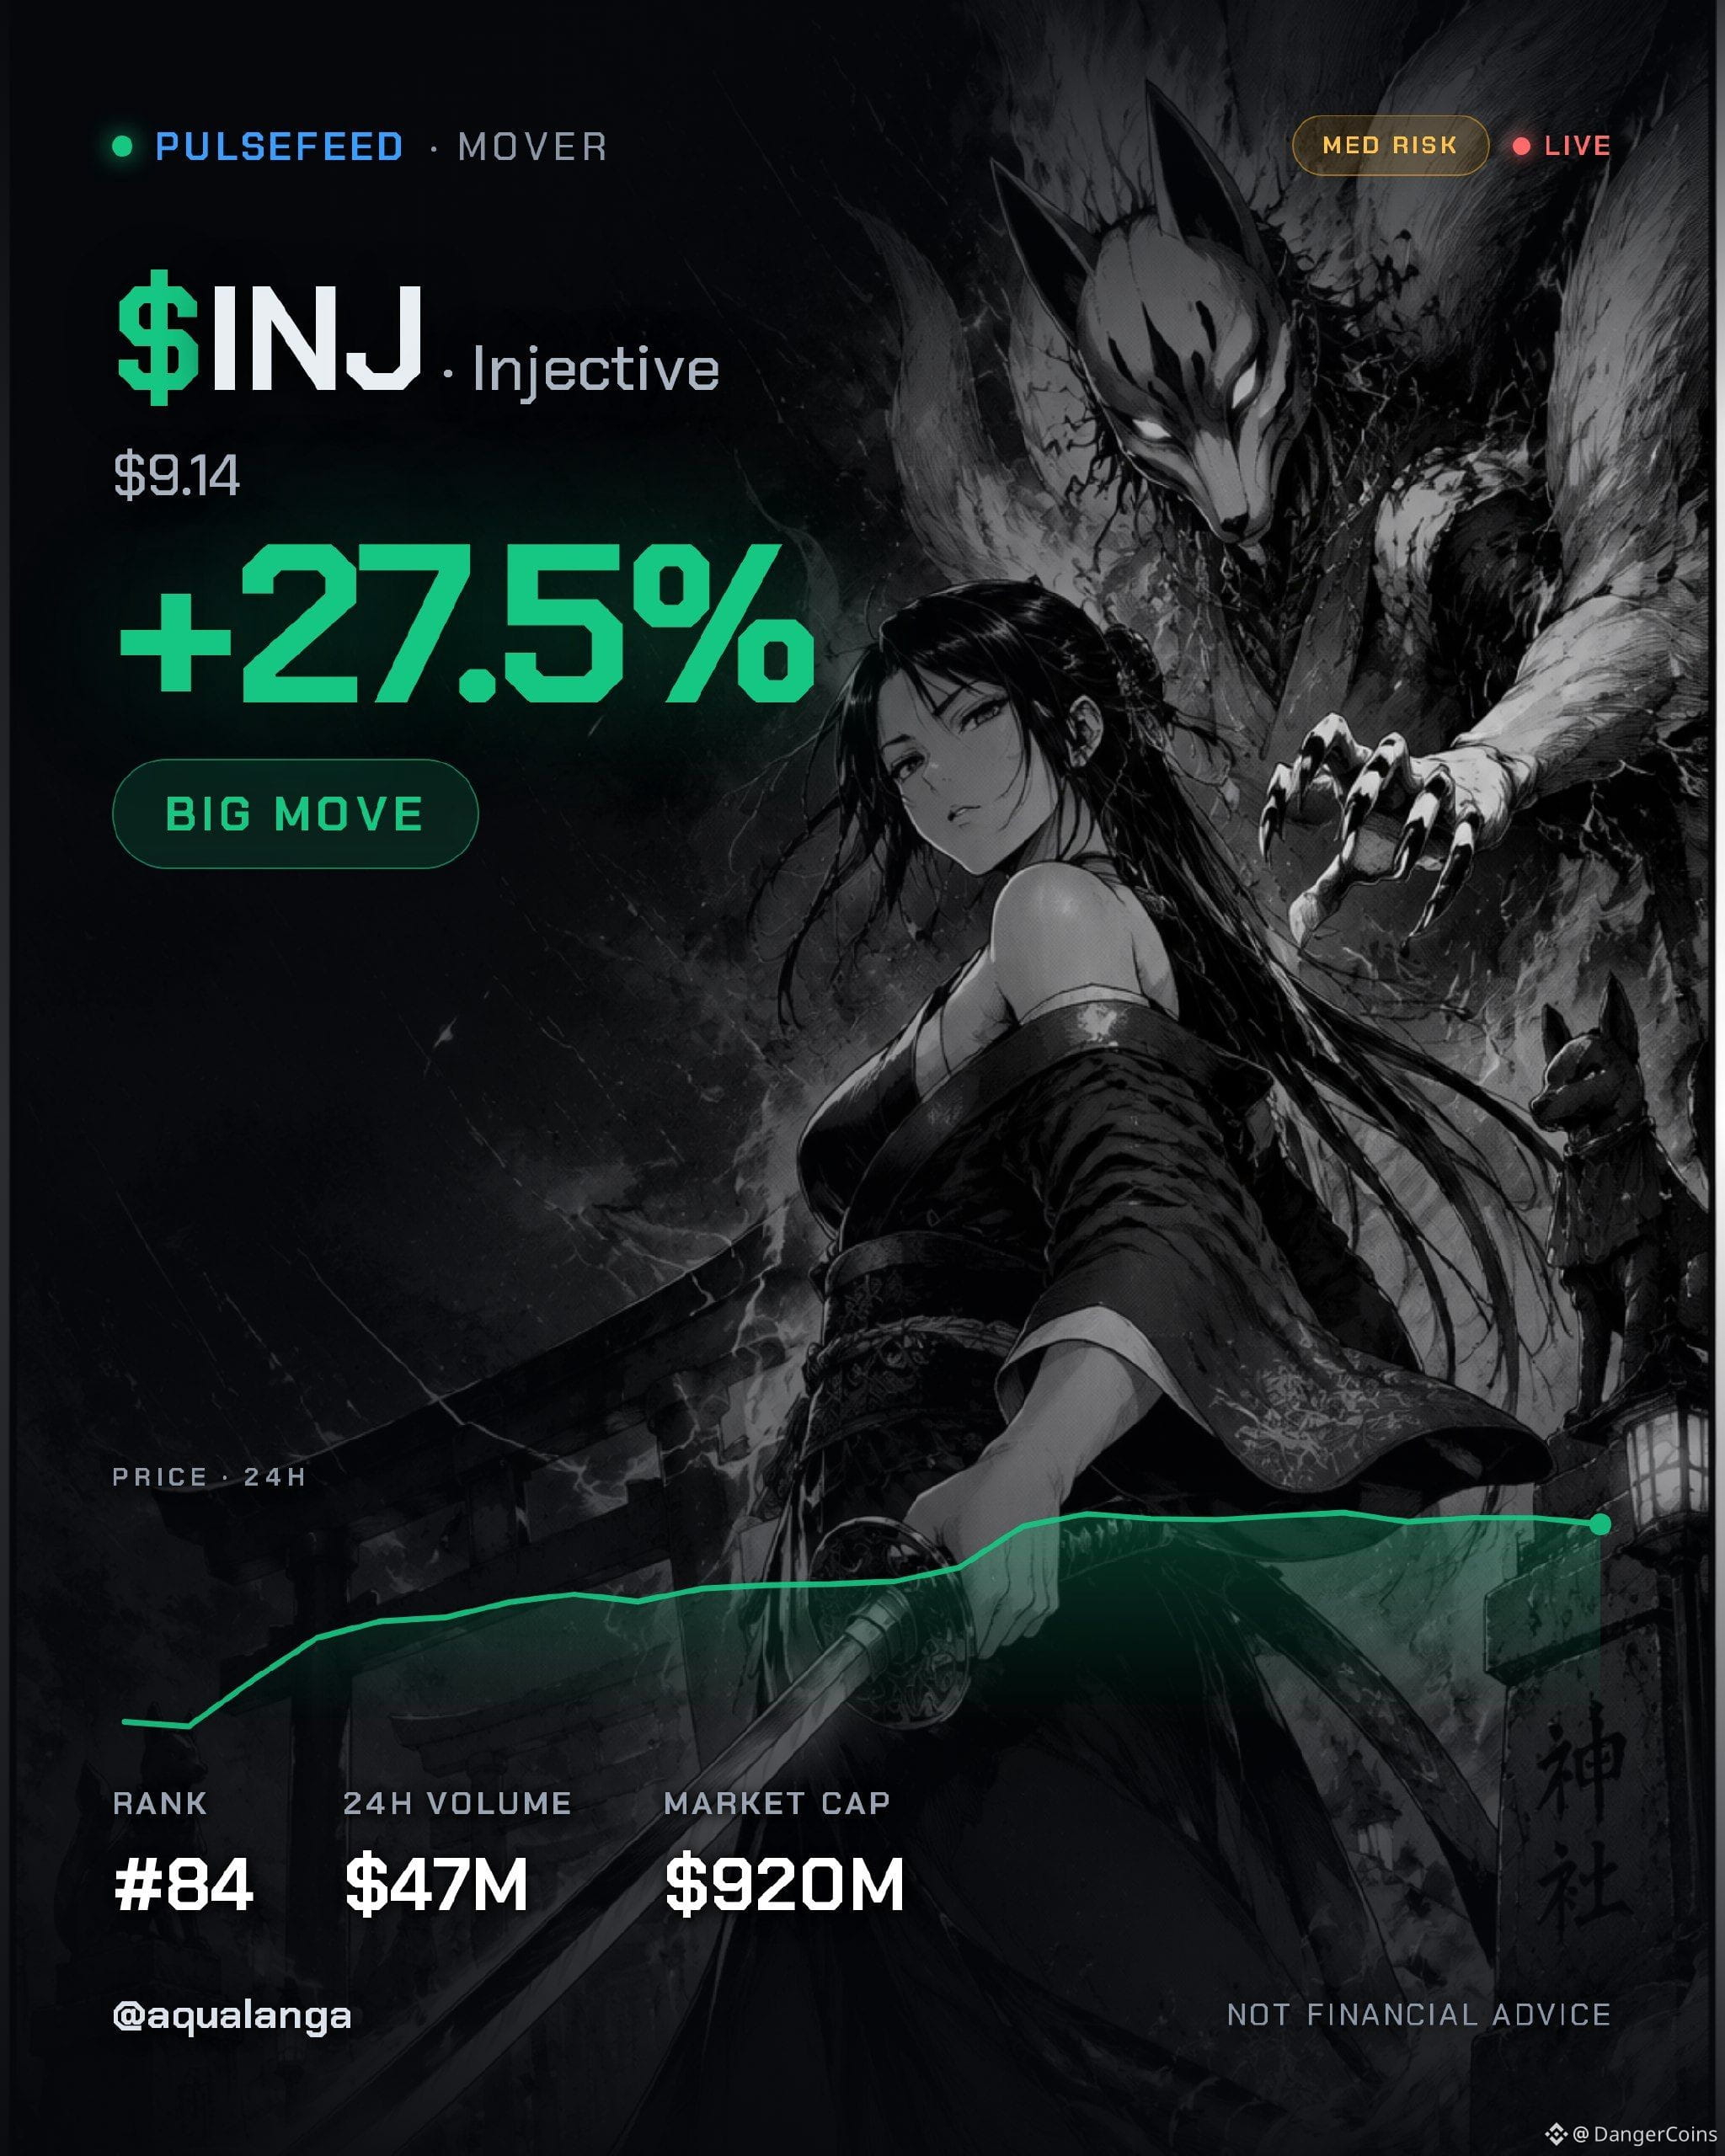
a CEO sitting down with the SEC and CFTC to talk tokenization isn't the kind of headline that usually moves a coin 27% in a day, but here we are.
$INJ at #84, $920M cap, pushing straight into its highs after grinding flat for half the day. the Chen meeting plus a staking vote and an institutional validator coming aboard gave the tape a real reason, not just vibes.
$47M changed hands today on a cap under a billion, that's over 5% of the whole market cap moving in 24 hours.
NFA
a CEO sitting down with the SEC and CFTC to talk tokenization isn't the kind of headline that usually moves a coin 27% in a day, but here we are.
$INJ at #84, $920M cap, pushing straight into its highs after grinding flat for half the day. the Chen meeting plus a staking vote and an institutional validator coming aboard gave the tape a real reason, not just vibes.
$47M changed hands today on a cap under a billion, that's over 5% of the whole market cap moving in 24 hours.
NFA
$INJ at #84, $920M cap, pushing straight into its highs after grinding flat for half the day. the Chen meeting plus a staking vote and an institutional validator coming aboard gave the tape a real reason, not just vibes.
$47M changed hands today on a cap under a billion, that's over 5% of the whole market cap moving in 24 hours.
NFA
116

·
--
TIA surges 6.4%! Is this kind of sharp rally worth chasing?15:22 (just now) TIA surged 6.4% within 5 minutes (5-minute window: 15:17→15:22). As of 15:24:46, the current price is 0.6975, up 32.9% in 24h.
📅 Data as of 15:24:46 (event trigger times are noted for each item; prices are real-time snapshots at the time of writing)
📌 In a nutshell: Short-term momentum is concentrated, and pullbacks can come quickly—placing limit orders in batches is safer than chasing a rally.
Market overview: BTC 82,226.70 (+1.45%) · ETH 2,456.46 (+3.83%); across the market, 465 assets rose / 28 fell in 24h; top 24h gainer: AGT +122.56%; top loser: EPIC -24.46%.
—— Unusual Market Activity Details ——
TIA surges 6.4%! Is this kind of sharp rally worth chasing?
15:22 (just now) TIA surged 6.4% within 5 minutes (5-minute window: 15:17→15:22). As of 15:24:46, the current price is 0.6975, up 32.9% in 24h.
📅 Data as of 15:24:46 (event trigger times are noted for each item; prices are real-time snapshots at the time of writing)
📌 In a nutshell: Short-term momentum is concentrated, and pullbacks can come quickly—placing limit orders in batches is safer than chasing a rally.
Market overview: BTC 82,226.70 (+1.45%) · ETH 2,456.46 (+3.83%); across the market, 465 assets rose / 28 fell in 24h; top 24h gainer: AGT +122.56%; top loser: EPIC -24.46%.
—— Unusual Market Activity Details ——
📅 Data as of 15:24:46 (event trigger times are noted for each item; prices are real-time snapshots at the time of writing)
📌 In a nutshell: Short-term momentum is concentrated, and pullbacks can come quickly—placing limit orders in batches is safer than chasing a rally.
Market overview: BTC 82,226.70 (+1.45%) · ETH 2,456.46 (+3.83%); across the market, 465 assets rose / 28 fell in 24h; top 24h gainer: AGT +122.56%; top loser: EPIC -24.46%.
—— Unusual Market Activity Details ——
·
--
Binance Life Suddenly Plunges 4.2% in 5 Minutes! Panic or Opportunity? Key Support Levels to WatchAt 23:18 (2 minutes ago), Binance Life fell 4.2% within 5 minutes (5-minute window: 23:13→23:18). As of 23:21:02, the current price is 0.6117, up 9.7% over 24h. Other tokens making moves around the same time include SOPH and RLC.
📅 Data as of 23:21:02 (event trigger times are noted for each item; prices are live snapshots from the time of writing)
📌 In a nutshell: Short-term momentum is concentrated, and pullbacks can come fast—placing orders in batches is safer than chasing a rally.
Market overview: BTC 83,099.90 (+0.20%) · ETH 2,507.63 (+0.01%); across the market, 243 assets rose and 248 fell in 24h; top gainer: CHIP +34.43%; biggest loser: US -38.01%.
Binance Life Suddenly Plunges 4.2% in 5 Minutes! Panic or Opportunity? Key Support Levels to Watch
At 23:18 (2 minutes ago), Binance Life fell 4.2% within 5 minutes (5-minute window: 23:13→23:18). As of 23:21:02, the current price is 0.6117, up 9.7% over 24h. Other tokens making moves around the same time include SOPH and RLC.
📅 Data as of 23:21:02 (event trigger times are noted for each item; prices are live snapshots from the time of writing)
📌 In a nutshell: Short-term momentum is concentrated, and pullbacks can come fast—placing orders in batches is safer than chasing a rally.
Market overview: BTC 83,099.90 (+0.20%) · ETH 2,507.63 (+0.01%); across the market, 243 assets rose and 248 fell in 24h; top gainer: CHIP +34.43%; biggest loser: US -38.01%.
📅 Data as of 23:21:02 (event trigger times are noted for each item; prices are live snapshots from the time of writing)
📌 In a nutshell: Short-term momentum is concentrated, and pullbacks can come fast—placing orders in batches is safer than chasing a rally.
Market overview: BTC 83,099.90 (+0.20%) · ETH 2,507.63 (+0.01%); across the market, 243 assets rose and 248 fell in 24h; top gainer: CHIP +34.43%; biggest loser: US -38.01%.
1
·
--
PYTH drops 4.7% on a spike! These support levels are worth watching22:22 (27 minutes ago) PYTH saw a 4.7% drop within 5 minutes (5-minute window 22:17→22:22). As of 22:50:08, the current price is 0.079, with a 24h gain of +11.3%. Other simultaneous movers in the same batch include HEI and AIN.
📅 Data as of 22:50:08 (event trigger time is shown in each annotation; prices are real-time snapshots at the time of writing)
📌 In one sentence: short-term momentum is concentrated, and pullbacks often come fast—placing staggered orders is more stable than chasing highs
Market overview: BTC 82,634.70(-0.37%) · ETH 2,529.78(-1.14%); 366 stocks up / 124 down across the market over the past 24h; top gainer OGN +97.08%, top loser AIOT -26.14%.
PYTH drops 4.7% on a spike! These support levels are worth watching
22:22 (27 minutes ago) PYTH saw a 4.7% drop within 5 minutes (5-minute window 22:17→22:22). As of 22:50:08, the current price is 0.079, with a 24h gain of +11.3%. Other simultaneous movers in the same batch include HEI and AIN.
📅 Data as of 22:50:08 (event trigger time is shown in each annotation; prices are real-time snapshots at the time of writing)
📌 In one sentence: short-term momentum is concentrated, and pullbacks often come fast—placing staggered orders is more stable than chasing highs
Market overview: BTC 82,634.70(-0.37%) · ETH 2,529.78(-1.14%); 366 stocks up / 124 down across the market over the past 24h; top gainer OGN +97.08%, top loser AIOT -26.14%.
📅 Data as of 22:50:08 (event trigger time is shown in each annotation; prices are real-time snapshots at the time of writing)
📌 In one sentence: short-term momentum is concentrated, and pullbacks often come fast—placing staggered orders is more stable than chasing highs
Market overview: BTC 82,634.70(-0.37%) · ETH 2,529.78(-1.14%); 366 stocks up / 124 down across the market over the past 24h; top gainer OGN +97.08%, top loser AIOT -26.14%.
79
·
--
PYTH surges 11% on a spike! Can you chase this kind of sudden rally?22:17 (2 minutes ago) PYTH surged by 11% within 15 minutes (15-minute window 22:02→22:17). As of 22:19:48, the current price is 0.08172, up 14.6% over the past 24h. Other notable movers in the same batch include ETHFI and ERA.
📅 Data as of 22:19:48 (event trigger times are marked in each item; prices are real-time snapshots at the time of writing)
📌 One-sentence takeaway: the 15-minute trend is amplified—decide in advance where to set your stop-loss before following the trend
Market overview: BTC 82,524.30(-0.59%) · ETH 2,531.24(-1.07%); across the whole market, 351 stocks up / 84 down over the past 24h; top gainer in the past 24h: OGN +91.18%, worst performer: MINA -13.62%.
PYTH surges 11% on a spike! Can you chase this kind of sudden rally?
22:17 (2 minutes ago) PYTH surged by 11% within 15 minutes (15-minute window 22:02→22:17). As of 22:19:48, the current price is 0.08172, up 14.6% over the past 24h. Other notable movers in the same batch include ETHFI and ERA.
📅 Data as of 22:19:48 (event trigger times are marked in each item; prices are real-time snapshots at the time of writing)
📌 One-sentence takeaway: the 15-minute trend is amplified—decide in advance where to set your stop-loss before following the trend
Market overview: BTC 82,524.30(-0.59%) · ETH 2,531.24(-1.07%); across the whole market, 351 stocks up / 84 down over the past 24h; top gainer in the past 24h: OGN +91.18%, worst performer: MINA -13.62%.
📅 Data as of 22:19:48 (event trigger times are marked in each item; prices are real-time snapshots at the time of writing)
📌 One-sentence takeaway: the 15-minute trend is amplified—decide in advance where to set your stop-loss before following the trend
Market overview: BTC 82,524.30(-0.59%) · ETH 2,531.24(-1.07%); across the whole market, 351 stocks up / 84 down over the past 24h; top gainer in the past 24h: OGN +91.18%, worst performer: MINA -13.62%.
38

·
--
BTC Pullback Continues 🚨Lighter (LITUSDT) is trending right now!
Rank: #84
Bitcoin is down **5488.25**, a **0.42%** drop in 24h. ETH also taking a hit at **697.55**, down **0.61%**. Market seems to be in a pullback mode. I'm thinking this might be a good buying opportunity, but we need to see some strong support levels. What do you think, will bounce back soon? 🤔
#bitcoin #ethereum #crypto
BTC Pullback Continues 🚨
Lighter (LITUSDT) is trending right now!
Rank: #84
Bitcoin is down **5488.25**, a **0.42%** drop in 24h. ETH also taking a hit at **697.55**, down **0.61%**. Market seems to be in a pullback mode. I'm thinking this might be a good buying opportunity, but we need to see some strong support levels. What do you think, will bounce back soon? 🤔
#bitcoin #ethereum #crypto
Rank: #84
Bitcoin is down **5488.25**, a **0.42%** drop in 24h. ETH also taking a hit at **697.55**, down **0.61%**. Market seems to be in a pullback mode. I'm thinking this might be a good buying opportunity, but we need to see some strong support levels. What do you think, will bounce back soon? 🤔
#bitcoin #ethereum #crypto
28

·
--
$PYTH is pricing 90.5% of RWA perps, and the coin is still ranked #84 and down 0.7% on the day.
That 90.5% is Pyth's own number from its September report, so it's a claim, not an audit. The same report says RWA perps did $638B in volume with a record $12.61B in open interest. If even half of that holds up, the usage is already there.
Pyth also says it's now an outside distributor for Nasdaq Basic, selling real-time US stock quotes through its Data Marketplace. I like that more than the volume figure. Someone has to pay for those feeds.
$PYTH trades at $0.07695 right now. if it holds $0.07657, the 24h low, i think it grinds back toward the $0.0808 24h high as the usage story gets priced in. if it loses $0.07657, i'm wrong on this and there's nothing to defend. If you're already long, that level is where you take the loss and move on.
holding $0.07657 or losing it?
follow me for more calls like this.
$PYTH is pricing 90.5% of RWA perps, and the coin is still ranked #84 and down 0.7% on the day.
That 90.5% is Pyth's own number from its September report, so it's a claim, not an audit. The same report says RWA perps did $638B in volume with a record $12.61B in open interest. If even half of that holds up, the usage is already there.
Pyth also says it's now an outside distributor for Nasdaq Basic, selling real-time US stock quotes through its Data Marketplace. I like that more than the volume figure. Someone has to pay for those feeds.
$PYTH trades at $0.07695 right now. if it holds $0.07657, the 24h low, i think it grinds back toward the $0.0808 24h high as the usage story gets priced in. if it loses $0.07657, i'm wrong on this and there's nothing to defend. If you're already long, that level is where you take the loss and move on.
holding $0.07657 or losing it?
follow me for more calls like this.
That 90.5% is Pyth's own number from its September report, so it's a claim, not an audit. The same report says RWA perps did $638B in volume with a record $12.61B in open interest. If even half of that holds up, the usage is already there.
Pyth also says it's now an outside distributor for Nasdaq Basic, selling real-time US stock quotes through its Data Marketplace. I like that more than the volume figure. Someone has to pay for those feeds.
$PYTH trades at $0.07695 right now. if it holds $0.07657, the 24h low, i think it grinds back toward the $0.0808 24h high as the usage story gets priced in. if it loses $0.07657, i'm wrong on this and there's nothing to defend. If you're already long, that level is where you take the loss and move on.
holding $0.07657 or losing it?
follow me for more calls like this.

8


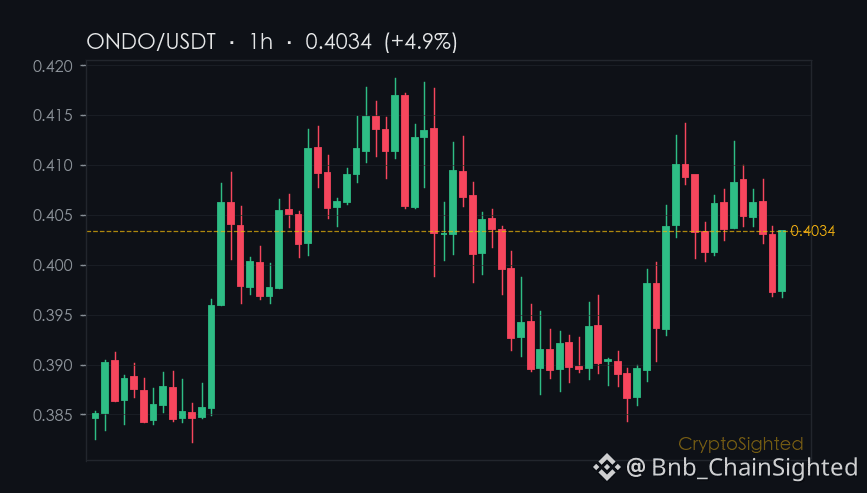
$ONDO’s pivot in 24 hours.
The project scrapped its tokenized asset blockchain plans - a move that feels like a corporate rebrand, but with crypto’s sharp edges.
You’ve seen it before: a company pivots, and the market takes notice.
Ondo’s decision to drop its private, high-speed trading network for tokenized assets is one such moment.
It’s not just a change in direction - it’s a signal.
The answer may not be in the headlines, but in the quiet shifts on-chain. And right now, ONDO is one of them.
—
Not financial advice. DYOR.
📌 News Take · #84 · #CryptoNews #CryptoSighted $ONDO
$ONDO ’s pivot in 24 hours.
The project scrapped its tokenized asset blockchain plans - a move that feels like a corporate rebrand, but with crypto’s sharp edges.
You’ve seen it before: a company pivots, and the market takes notice.
Ondo’s decision to drop its private, high-speed trading network for tokenized assets is one such moment.
It’s not just a change in direction - it’s a signal.
The answer may not be in the headlines, but in the quiet shifts on-chain. And right now, ONDO is one of them.
—
Not financial advice. DYOR.
📌 News Take · #84 · #CryptoNews #CryptoSighted $ONDO
The project scrapped its tokenized asset blockchain plans - a move that feels like a corporate rebrand, but with crypto’s sharp edges.
You’ve seen it before: a company pivots, and the market takes notice.
Ondo’s decision to drop its private, high-speed trading network for tokenized assets is one such moment.
It’s not just a change in direction - it’s a signal.
The answer may not be in the headlines, but in the quiet shifts on-chain. And right now, ONDO is one of them.
—
Not financial advice. DYOR.
📌 News Take · #84 · #CryptoNews #CryptoSighted $ONDO
196
·
--
Arbitrum (ARBUSDT) is trending on CoinGecko!
Rank: #84
**
The crypto market is showing mixed signals today, with Ethereum (ETH) maintaining steady gains while altcoins experience volatility. According to the latest Binance data, ETH is trading at **,463.88**, up **0.98%** in the last 24 hours, with a strong volume of **568.2 million USDT**.
Among the top movers, **Uniswap (UNI)** stands out with a **12.30%** surge, reaching **.78** and recording a 24-hour volume of **52.3 million USDT**. This sharp increase suggests growing interest in DeFi tokens, likely driven by positive sentiment around decentralized exchanges.
**NEAR Protocol (NEAR)** and **Polkadot (DOT)** also posted notable gains of **4.62%** and **4.10%**, respectively, indicating bullish momentum in Layer-1 solutions. Meanwhile, **Cardano (ADA)** and **Chainlink (LINK)** saw modest increases of **1.33%** and **1.14%**, reflecting a more stable but positive trend.
On the downside, **Polygon (MATIC)** experienced a slight decline of **-0.29%**, trading at **/bin/sh.3794** with relatively low volume. This minor dip could be a temporary correction in an otherwise bullish altcoin season.
**Market Insights:**
- **ETH remains a strong performer**, maintaining its position as a leading smart contract platform.
- **UNI’s surge highlights DeFi’s resurgence**, possibly due to new liquidity incentives or protocol upgrades.
- **NEAR and DOT’s gains suggest renewed interest in scalable blockchain solutions.**
- **MATIC’s minor pullback could present a buying opportunity** for trad
Arbitrum (ARBUSDT) is trending on CoinGecko!
Rank: #84
**
The crypto market is showing mixed signals today, with Ethereum (ETH) maintaining steady gains while altcoins experience volatility. According to the latest Binance data, ETH is trading at **,463.88**, up **0.98%** in the last 24 hours, with a strong volume of **568.2 million USDT**.
Among the top movers, **Uniswap (UNI)** stands out with a **12.30%** surge, reaching **.78** and recording a 24-hour volume of **52.3 million USDT**. This sharp increase suggests growing interest in DeFi tokens, likely driven by positive sentiment around decentralized exchanges.
**NEAR Protocol (NEAR)** and **Polkadot (DOT)** also posted notable gains of **4.62%** and **4.10%**, respectively, indicating bullish momentum in Layer-1 solutions. Meanwhile, **Cardano (ADA)** and **Chainlink (LINK)** saw modest increases of **1.33%** and **1.14%**, reflecting a more stable but positive trend.
On the downside, **Polygon (MATIC)** experienced a slight decline of **-0.29%**, trading at **/bin/sh.3794** with relatively low volume. This minor dip could be a temporary correction in an otherwise bullish altcoin season.
**Market Insights:**
- **ETH remains a strong performer**, maintaining its position as a leading smart contract platform.
- **UNI’s surge highlights DeFi’s resurgence**, possibly due to new liquidity incentives or protocol upgrades.
- **NEAR and DOT’s gains suggest renewed interest in scalable blockchain solutions.**
- **MATIC’s minor pullback could present a buying opportunity** for trad
Rank: #84
**
The crypto market is showing mixed signals today, with Ethereum (ETH) maintaining steady gains while altcoins experience volatility. According to the latest Binance data, ETH is trading at **,463.88**, up **0.98%** in the last 24 hours, with a strong volume of **568.2 million USDT**.
Among the top movers, **Uniswap (UNI)** stands out with a **12.30%** surge, reaching **.78** and recording a 24-hour volume of **52.3 million USDT**. This sharp increase suggests growing interest in DeFi tokens, likely driven by positive sentiment around decentralized exchanges.
**NEAR Protocol (NEAR)** and **Polkadot (DOT)** also posted notable gains of **4.62%** and **4.10%**, respectively, indicating bullish momentum in Layer-1 solutions. Meanwhile, **Cardano (ADA)** and **Chainlink (LINK)** saw modest increases of **1.33%** and **1.14%**, reflecting a more stable but positive trend.
On the downside, **Polygon (MATIC)** experienced a slight decline of **-0.29%**, trading at **/bin/sh.3794** with relatively low volume. This minor dip could be a temporary correction in an otherwise bullish altcoin season.
**Market Insights:**
- **ETH remains a strong performer**, maintaining its position as a leading smart contract platform.
- **UNI’s surge highlights DeFi’s resurgence**, possibly due to new liquidity incentives or protocol upgrades.
- **NEAR and DOT’s gains suggest renewed interest in scalable blockchain solutions.**
- **MATIC’s minor pullback could present a buying opportunity** for trad
36

·
--
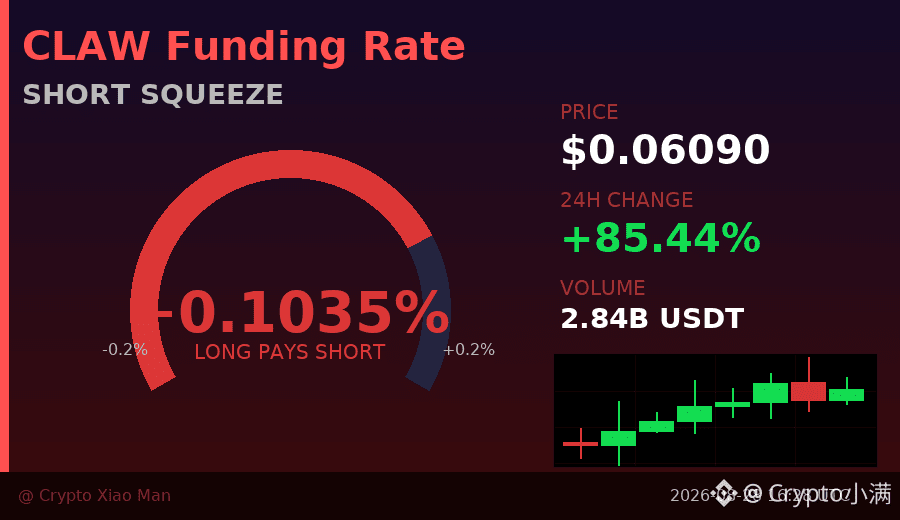
66% of people are short, but the price surged by 84% instead.
This is the most absurd moment on the LOBSTER (CLAW) chart today—the market has two-thirds of positions held by shorts. In theory, under this kind of sentiment, the price should be hard to move higher, yet it just keeps rallying.
This phenomenon has a name: short squeeze.
Simply put: the more people who are short, the more—when the price unexpectedly rises—they are forced to cut losses and buy to close their positions, which ends up fueling the push higher. The denser the shorts, the more intense the squeeze.
You can also validate this logic by looking at the candlesticks—over the past 8 hours the trend has been broadly bullish, with a peak around 0.0655. From the low of 0.0327, that’s nearly a doubling. This kind of move doesn’t look like organic buying pressure; it looks more like a wave after wave pushing shorts out of the market.
Of course, the funding rate is positive right now, which means longs have started paying shorts. This implies the cost of continuing to go long is rising, and there may be downside pullback pressure in the short term.
For the remaining shorts, if they haven’t covered yet, they’re either waiting for a better exit point—or they’re stubbornly holding on. These two outcomes correspond to completely different price action.
The key to watch tonight is whether the 0.062 level can hold.
$CLAW #空头绞杀 #84%暴涨
Click the small card below to quickly view the行情👇
66% of people are short, but the price surged by 84% instead.
This is the most absurd moment on the LOBSTER (CLAW) chart today—the market has two-thirds of positions held by shorts. In theory, under this kind of sentiment, the price should be hard to move higher, yet it just keeps rallying.
This phenomenon has a name: short squeeze.
Simply put: the more people who are short, the more—when the price unexpectedly rises—they are forced to cut losses and buy to close their positions, which ends up fueling the push higher. The denser the shorts, the more intense the squeeze.
You can also validate this logic by looking at the candlesticks—over the past 8 hours the trend has been broadly bullish, with a peak around 0.0655. From the low of 0.0327, that’s nearly a doubling. This kind of move doesn’t look like organic buying pressure; it looks more like a wave after wave pushing shorts out of the market.
Of course, the funding rate is positive right now, which means longs have started paying shorts. This implies the cost of continuing to go long is rising, and there may be downside pullback pressure in the short term.
For the remaining shorts, if they haven’t covered yet, they’re either waiting for a better exit point—or they’re stubbornly holding on. These two outcomes correspond to completely different price action.
The key to watch tonight is whether the 0.062 level can hold.
$CLAW #空头绞杀 #84%暴涨
Click the small card below to quickly view the行情👇
This is the most absurd moment on the LOBSTER (CLAW) chart today—the market has two-thirds of positions held by shorts. In theory, under this kind of sentiment, the price should be hard to move higher, yet it just keeps rallying.
This phenomenon has a name: short squeeze.
Simply put: the more people who are short, the more—when the price unexpectedly rises—they are forced to cut losses and buy to close their positions, which ends up fueling the push higher. The denser the shorts, the more intense the squeeze.
You can also validate this logic by looking at the candlesticks—over the past 8 hours the trend has been broadly bullish, with a peak around 0.0655. From the low of 0.0327, that’s nearly a doubling. This kind of move doesn’t look like organic buying pressure; it looks more like a wave after wave pushing shorts out of the market.
Of course, the funding rate is positive right now, which means longs have started paying shorts. This implies the cost of continuing to go long is rising, and there may be downside pullback pressure in the short term.
For the remaining shorts, if they haven’t covered yet, they’re either waiting for a better exit point—or they’re stubbornly holding on. These two outcomes correspond to completely different price action.
The key to watch tonight is whether the 0.062 level can hold.
$CLAW #空头绞杀 #84%暴涨
Click the small card below to quickly view the行情👇
64

$JUP +11.8% over 24h — strongest in the top-100📊 $JUP +11.8% over 24h — the strongest in the top-100
Summary: The movement is within a broader trend—7d and 30d are in the same direction.
Market context: Among 65 major coins showing notable movement over 24h—47 rose, 18 fell
Top gainer: $JUP +11.8% over 24h
Price: $0.2470 (range $0.2221–$0.2566)
Performance across timeframes: 1h -2.5%, 24h +11.8%, 7d +16.2%, 30d +45.7%
$JUP +11.8% over 24h — strongest in the top-100
📊 $JUP +11.8% over 24h — the strongest in the top-100
Summary: The movement is within a broader trend—7d and 30d are in the same direction.
Market context: Among 65 major coins showing notable movement over 24h—47 rose, 18 fell
Top gainer: $JUP +11.8% over 24h
Price: $0.2470 (range $0.2221–$0.2566)
Performance across timeframes: 1h -2.5%, 24h +11.8%, 7d +16.2%, 30d +45.7%
Summary: The movement is within a broader trend—7d and 30d are in the same direction.
Market context: Among 65 major coins showing notable movement over 24h—47 rose, 18 fell
Top gainer: $JUP +11.8% over 24h
Price: $0.2470 (range $0.2221–$0.2566)
Performance across timeframes: 1h -2.5%, 24h +11.8%, 7d +16.2%, 30d +45.7%
157
Partly True
$JUP spiked 6% today, but its 30-day holding erosion is at ↓22.4% - the move feels hollow.
This one made me double-check the numbers.
A short-term rally without leverage backing? That’s not the usual playbook.
JUP’s current price is $0.192, and its perpetual futures are sitting at 52.4 million tokens, with a funding rate of ↓0.0043% - a near-zero line.
That’s not a sign of strong conviction. The market isn’t paying extra for holding long or short - it’s barely covering costs.
What’s more telling is the 30-day holding drop.
Over a month, JUP’s on-chain holdings have fallen 22.4%, and the 7-day drop is also steep at ↓14%.
That’s capital fleeing, not inflating.
The move today doesn’t seem to have a clear catalyst either.
No major news from JUP itself, and the broader market is only up 0.3% - not enough to push a coin with such a weak holding base.
—
Not financial advice. DYOR.
📌 Gainers Radar · #84 · #Gainers #CryptoSighted $JUP
$JUP spiked 6% today, but its 30-day holding erosion is at ↓22.4% - the move feels hollow.
This one made me double-check the numbers.
A short-term rally without leverage backing? That’s not the usual playbook.
JUP’s current price is $0.192, and its perpetual futures are sitting at 52.4 million tokens, with a funding rate of ↓0.0043% - a near-zero line.
That’s not a sign of strong conviction. The market isn’t paying extra for holding long or short - it’s barely covering costs.
What’s more telling is the 30-day holding drop.
Over a month, JUP’s on-chain holdings have fallen 22.4%, and the 7-day drop is also steep at ↓14%.
That’s capital fleeing, not inflating.
The move today doesn’t seem to have a clear catalyst either.
No major news from JUP itself, and the broader market is only up 0.3% - not enough to push a coin with such a weak holding base.
—
Not financial advice. DYOR.
📌 Gainers Radar · #84 · #Gainers #CryptoSighted $JUP
This one made me double-check the numbers.
A short-term rally without leverage backing? That’s not the usual playbook.
JUP’s current price is $0.192, and its perpetual futures are sitting at 52.4 million tokens, with a funding rate of ↓0.0043% - a near-zero line.
That’s not a sign of strong conviction. The market isn’t paying extra for holding long or short - it’s barely covering costs.
What’s more telling is the 30-day holding drop.
Over a month, JUP’s on-chain holdings have fallen 22.4%, and the 7-day drop is also steep at ↓14%.
That’s capital fleeing, not inflating.
The move today doesn’t seem to have a clear catalyst either.
No major news from JUP itself, and the broader market is only up 0.3% - not enough to push a coin with such a weak holding base.
—
Not financial advice. DYOR.
📌 Gainers Radar · #84 · #Gainers #CryptoSighted $JUP
661
·
--
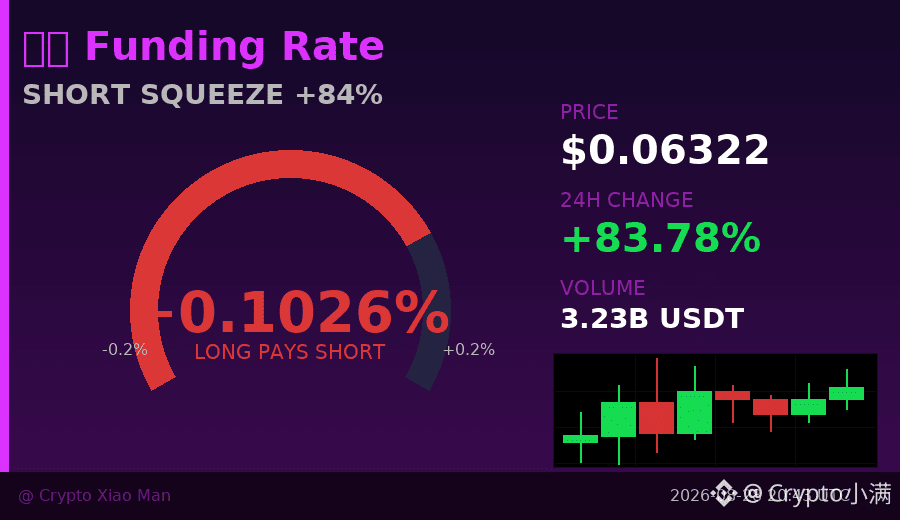
67.89% short, yet the price rose 84%.
This is the most counterintuitive scene in today’s lobster market—the majority are bearish, and yet it’s up by nearly a factor of two.
Short positions make up more than two-thirds; in theory, the logic should point to a drop. But the market goes the opposite way, rallying from the low of 0.033 all the way to 0.0655—doubling the price directly.
This situation has a specific term: "short squeeze"—those who are short are forced to close their positions, which becomes fuel for the price to rise.
Funding rate is 0.00103%, a positive rate, meaning longs are paying shorts. In other words, even if longs make up only 32%, they’re the ones paying; meanwhile shorts are the ones getting charged—but the price still leaves them taking heavy losses.
Open interest is 760 million, not small. Three consecutive hourly candlesticks are green. The most recent one shows volume starting to fade—declining from 580 million gradually down to 128 million.
After the push, momentum is being consumed. The next thing to watch is whether the shorts continue to hold their ground or back down and admit defeat. The more shorts clear out, the less resistance the rally faces. But if volume contracts further, the strength driving the surge may weaken too.
High position, many shorts, shrinking volume—when these three signals appear at the same time, it’s worth paying attention.
$CLAW #轧仓行情 #84% surges
67.89% short, yet the price rose 84%.
This is the most counterintuitive scene in today’s lobster market—the majority are bearish, and yet it’s up by nearly a factor of two.
Short positions make up more than two-thirds; in theory, the logic should point to a drop. But the market goes the opposite way, rallying from the low of 0.033 all the way to 0.0655—doubling the price directly.
This situation has a specific term: "short squeeze"—those who are short are forced to close their positions, which becomes fuel for the price to rise.
Funding rate is 0.00103%, a positive rate, meaning longs are paying shorts. In other words, even if longs make up only 32%, they’re the ones paying; meanwhile shorts are the ones getting charged—but the price still leaves them taking heavy losses.
Open interest is 760 million, not small. Three consecutive hourly candlesticks are green. The most recent one shows volume starting to fade—declining from 580 million gradually down to 128 million.
After the push, momentum is being consumed. The next thing to watch is whether the shorts continue to hold their ground or back down and admit defeat. The more shorts clear out, the less resistance the rally faces. But if volume contracts further, the strength driving the surge may weaken too.
High position, many shorts, shrinking volume—when these three signals appear at the same time, it’s worth paying attention.
$CLAW #轧仓行情 #84% surges
This is the most counterintuitive scene in today’s lobster market—the majority are bearish, and yet it’s up by nearly a factor of two.
Short positions make up more than two-thirds; in theory, the logic should point to a drop. But the market goes the opposite way, rallying from the low of 0.033 all the way to 0.0655—doubling the price directly.
This situation has a specific term: "short squeeze"—those who are short are forced to close their positions, which becomes fuel for the price to rise.
Funding rate is 0.00103%, a positive rate, meaning longs are paying shorts. In other words, even if longs make up only 32%, they’re the ones paying; meanwhile shorts are the ones getting charged—but the price still leaves them taking heavy losses.
Open interest is 760 million, not small. Three consecutive hourly candlesticks are green. The most recent one shows volume starting to fade—declining from 580 million gradually down to 128 million.
After the push, momentum is being consumed. The next thing to watch is whether the shorts continue to hold their ground or back down and admit defeat. The more shorts clear out, the less resistance the rally faces. But if volume contracts further, the strength driving the surge may weaken too.
High position, many shorts, shrinking volume—when these three signals appear at the same time, it’s worth paying attention.
$CLAW #轧仓行情 #84% surges
99
Log in to explore more content
Join global crypto users on Binance Square
⚡️ Get latest and useful information about crypto.
💬 Trusted by the world’s largest crypto exchange.
👍 Discover real insights from verified creators.
Email / Phone number
Trending Topics
1
#JobsReportRaisesHikeOdds
460,519 views
3,143 Discussing
2
#CPITestsDecemberRateOutlook
121,533 views
996 Discussing
3
#BitcoinRebounds$75KAsChipsLead
40,489 views
330 Discussing
4
#US Data Center Rules May Constrain AI Expansion
64,831 views
221 Discussing
5
#ARKPlans14ThematicETFsCoveringAIAndTokenizedMarkets
3,369 views
58 Discussing
6
#WillAnthropicListOnTime
132,159 views
1,269 Discussing
7
#WillUS-IranTensionsBoostSafe-HavenDemand?
54,251 views
434 Discussing
8
#BitcoinETFsSee$412MNetOutflows
12,335 views
68 Discussing
9
#HKSFCPlansToRestrictCryptoAndExchangeTerms
48,934 views
482 Discussing
10
#TradFiForBeginners
81,281 views
946 Discussing