
#21
21
33,309 views
129 Discussing
Hot
Latest

On this consumer electronics line, I’ve been finding it more and more appealing lately.
It’s not that it’s going to suddenly become the most ferocious theme stock. It’s more like a big-cap that everyone actually uses, whose replacement cycle is slow and gradual—so when market sentiment isn’t that wildly excited, it can move more steadily. When rotation is fast, small caps can look different day to day. But when the funds really want something that can accommodate their position size, in the end they still circle back to a name like this.
$AAPL —right now I’m slightly bullish on it.
At first glance, it hasn’t looked overly dramatic today either. In the past 24 hours it’s up 1.83%, trading at $321.3, with a range of $315.26 to $322.48. But oddly, I actually like this kind of price action. It doesn’t feel like a stock that shoots straight up and lights people’s emotions on fire. It feels more like someone is willing to keep picking it up slowly near the highs.
There’s also a detail that really hits my taste.
On Binance’s US stock perpetual futures, it ranks #12 on the upside gainers list and #21 on the trading volume list. In the last 24 hours, it has $44.92M USDT in turnover. The funding rate is still +0.0000%, and the open interest is 59,783 contracts. This vibe clearly isn’t the kind of market where longs are piling into the same side and getting overheated. Yes, the heat is there, but the sentiment hasn’t spun out of control. Anyone who’s done futures knows: the worst is when a bunch of people crowd into the same direction, and then one last needle takes you out.
I’m bullish on it—not just based on the chart.
The strongest part of a company like this is that its brand, ecosystem, and user habits are tied together extremely deeply. You can dislike that it’s expensive, or complain that it doesn’t bring surprises. But when consumption picks back up and capital wants certainty, the market always seems to bring its attention back to companies like this—ones that can keep selling products consistently and also integrate services and hardware into a single loop. To put it simply: a lot of tech stocks are fueled by stories, while $AAPL is built on long-term habits.
Of course, it’s not blind optimism.
With a stock of this size, it’s hard to surge like a small-cap. If the market suddenly switches back to high-volatility theme plays, it may end up looking a bit dull. Also, the price is already sitting close to the 24-hour high. If you chase too aggressively, the short term can also easily turn into a roller coaster.
If it were me, I’d keep standing on the slightly bullish side—but I’d rather wait until it pulls back and stabilizes. If you can’t handle volatility, don’t force it. Honestly, I’m the kind of stubborn-mouth, scared-hand person—there have been plenty of losses for me from chasing highs.
$AAPL #USstocks
These are my thoughts. Your money—your call.
It’s not that it’s going to suddenly become the most ferocious theme stock. It’s more like a big-cap that everyone actually uses, whose replacement cycle is slow and gradual—so when market sentiment isn’t that wildly excited, it can move more steadily. When rotation is fast, small caps can look different day to day. But when the funds really want something that can accommodate their position size, in the end they still circle back to a name like this.
$AAPL —right now I’m slightly bullish on it.
At first glance, it hasn’t looked overly dramatic today either. In the past 24 hours it’s up 1.83%, trading at $321.3, with a range of $315.26 to $322.48. But oddly, I actually like this kind of price action. It doesn’t feel like a stock that shoots straight up and lights people’s emotions on fire. It feels more like someone is willing to keep picking it up slowly near the highs.
There’s also a detail that really hits my taste.
On Binance’s US stock perpetual futures, it ranks #12 on the upside gainers list and #21 on the trading volume list. In the last 24 hours, it has $44.92M USDT in turnover. The funding rate is still +0.0000%, and the open interest is 59,783 contracts. This vibe clearly isn’t the kind of market where longs are piling into the same side and getting overheated. Yes, the heat is there, but the sentiment hasn’t spun out of control. Anyone who’s done futures knows: the worst is when a bunch of people crowd into the same direction, and then one last needle takes you out.
I’m bullish on it—not just based on the chart.
The strongest part of a company like this is that its brand, ecosystem, and user habits are tied together extremely deeply. You can dislike that it’s expensive, or complain that it doesn’t bring surprises. But when consumption picks back up and capital wants certainty, the market always seems to bring its attention back to companies like this—ones that can keep selling products consistently and also integrate services and hardware into a single loop. To put it simply: a lot of tech stocks are fueled by stories, while $AAPL is built on long-term habits.
Of course, it’s not blind optimism.
With a stock of this size, it’s hard to surge like a small-cap. If the market suddenly switches back to high-volatility theme plays, it may end up looking a bit dull. Also, the price is already sitting close to the 24-hour high. If you chase too aggressively, the short term can also easily turn into a roller coaster.
If it were me, I’d keep standing on the slightly bullish side—but I’d rather wait until it pulls back and stabilizes. If you can’t handle volatility, don’t force it. Honestly, I’m the kind of stubborn-mouth, scared-hand person—there have been plenty of losses for me from chasing highs.
$AAPL #USstocks
These are my thoughts. Your money—your call.

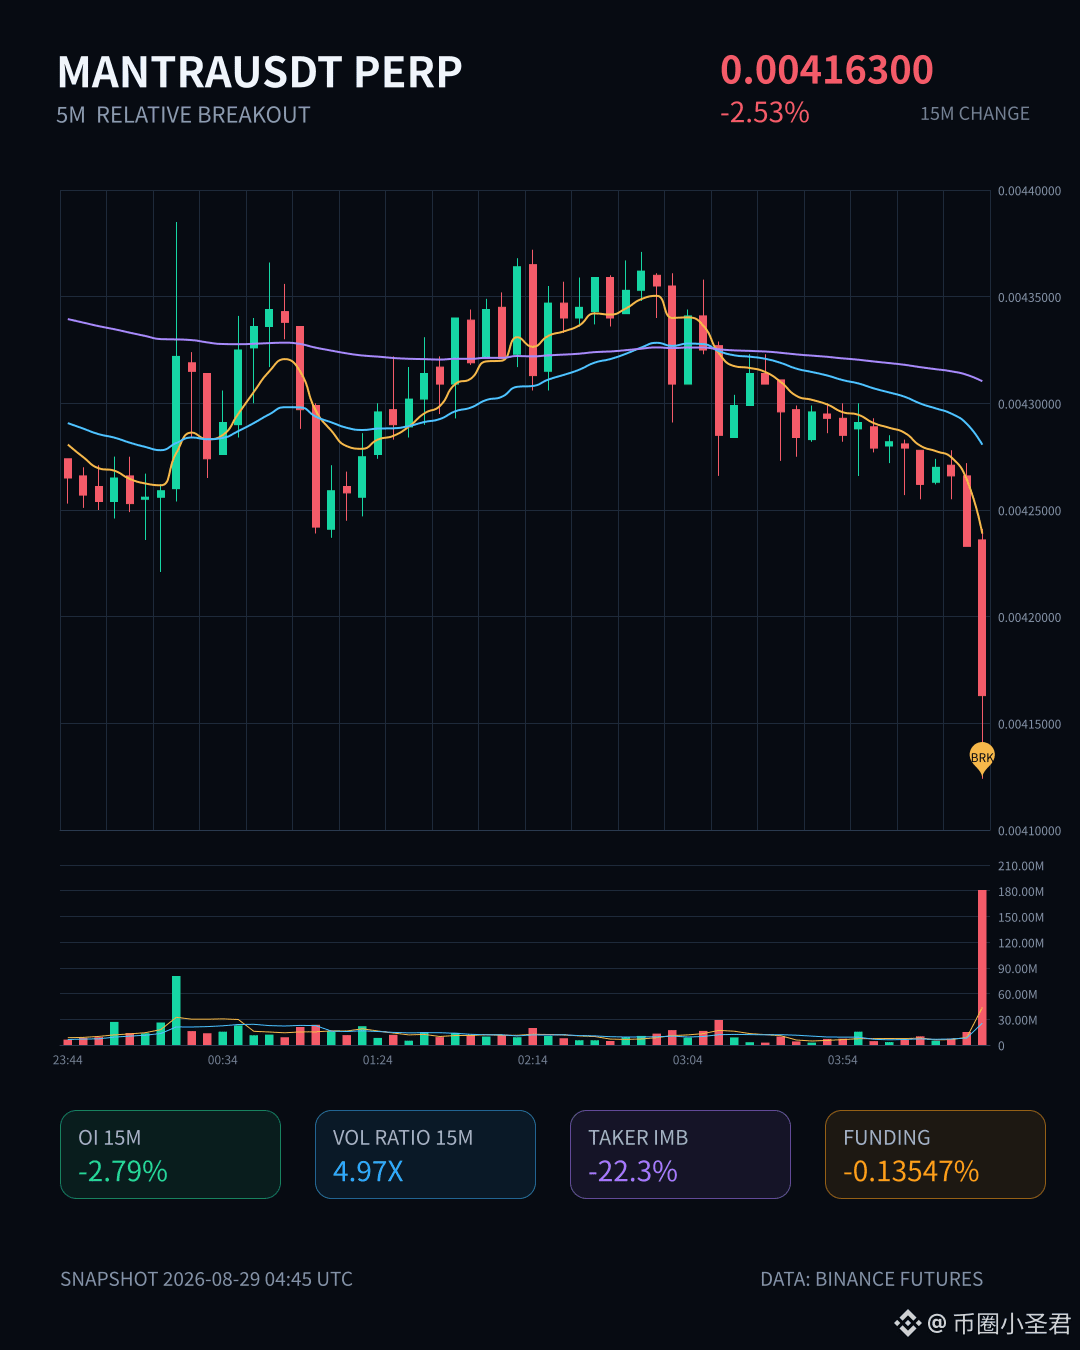
$MANTRA This sell-off is clean and decisive.
In just 15 minutes, it’s down -2.53%, with volume up to 4.97x, and the volatility Z reaching 3.36—this is a classic “high-volume breakdown” move. The key point is that OI also dropped a lot: 15m -2.79%, with nominal change -199K. This combination looks more like longs being forced to cut positions rather than new shorts rushing in to hammer the market.
The active trade spread is -22.3%, the buy/sell ratio is 0.64, and the closing price also confirms it has broken below the lower bound of the last ~20 consecutive 5m K-bars. The funding rate is still in a high percentile, which suggests the people who were long are now very uncomfortable.
The order book data is also not simple: the abnormality level in the whole pool ranks #6, and the nominal change ranks #21—neither is a small move. Moreover, this abnormal percentile is 95.6%, which puts it in a very extreme range recently.
Honestly, this setup—“high volume down + OI contraction + funding rate high”—looks more like leverage clearing than a genuine trend reversal. But the chart still has some things hanging in the air. Don’t rush to bottom-fish; first see whether it can hold the prior support zone.
In just 15 minutes, it’s down -2.53%, with volume up to 4.97x, and the volatility Z reaching 3.36—this is a classic “high-volume breakdown” move. The key point is that OI also dropped a lot: 15m -2.79%, with nominal change -199K. This combination looks more like longs being forced to cut positions rather than new shorts rushing in to hammer the market.
The active trade spread is -22.3%, the buy/sell ratio is 0.64, and the closing price also confirms it has broken below the lower bound of the last ~20 consecutive 5m K-bars. The funding rate is still in a high percentile, which suggests the people who were long are now very uncomfortable.
The order book data is also not simple: the abnormality level in the whole pool ranks #6, and the nominal change ranks #21—neither is a small move. Moreover, this abnormal percentile is 95.6%, which puts it in a very extreme range recently.
Honestly, this setup—“high volume down + OI contraction + funding rate high”—looks more like leverage clearing than a genuine trend reversal. But the chart still has some things hanging in the air. Don’t rush to bottom-fish; first see whether it can hold the prior support zone.


🎓 Every day a coin — understand the market, don’t just buy and done
Today: Bitcoin Cash ($BCH ) — #21 at market value
🏗️ It split from Bitcoin in 2017 over block-size disagreements—raising transaction capacity so it could become a cheap daily electronic cash.
💪 Truly low fees + a community that believes in daily electronic cash.
⚠️ Lost the battle for liquidity and adoption to the original Bitcoin by a huge margin.
📊 Price: $269.01 · Market cap: $5.4 billion
7 days: +31.6% · 30 days: +26.6%
📈 Resistances: $354.66 | Supports: $204.58 · $199.88
(Historical stopping zones from 90-day candles — not targets or recommendations)
What caught your attention most in Bitcoin Cash? Share your opinion 👇 $BCH
💛 Join Abu Malk’s team: register on Binance with code ABOMALAK — permanent discount on trading fees and benefit from our services and offers
#21 #BCH #Altcoins
⚠️ Educational content — not investment advice
Today: Bitcoin Cash ($BCH ) — #21 at market value
🏗️ It split from Bitcoin in 2017 over block-size disagreements—raising transaction capacity so it could become a cheap daily electronic cash.
💪 Truly low fees + a community that believes in daily electronic cash.
⚠️ Lost the battle for liquidity and adoption to the original Bitcoin by a huge margin.
📊 Price: $269.01 · Market cap: $5.4 billion
7 days: +31.6% · 30 days: +26.6%
📈 Resistances: $354.66 | Supports: $204.58 · $199.88
(Historical stopping zones from 90-day candles — not targets or recommendations)
What caught your attention most in Bitcoin Cash? Share your opinion 👇 $BCH
💛 Join Abu Malk’s team: register on Binance with code ABOMALAK — permanent discount on trading fees and benefit from our services and offers
#21 #BCH #Altcoins
⚠️ Educational content — not investment advice


$ONDO This 15-minute move has some substance.
The volume of liquidity was directly pulled to 3.46x, and the price conveniently broke through the upper bound of the range on the past ~20 five-minute K-lines. OI is also increasing; the notional change is ranked #21 in the whole pool. This structure—“price rising + leveraged longs entering”—is sturdier than simply expanding volume. The funding rate is also in a high percentile recently, suggesting market sentiment is hot, but not to the point where FOMO has completely run wild.
On the data side, the abnormality level of the whole pool is #24, and it has been continuing for several consecutive cycles—not a one-off pulse buy/sell. Active trading spread is down 8.3%, and the buy/sell ratio is 1.18. The longs are really doing the work. How much it can rise is hard to say, but if this kind of persistence holds, don’t rush to get off.
Just keep an eye on the volume/flow: if it shrinks, run.
The volume of liquidity was directly pulled to 3.46x, and the price conveniently broke through the upper bound of the range on the past ~20 five-minute K-lines. OI is also increasing; the notional change is ranked #21 in the whole pool. This structure—“price rising + leveraged longs entering”—is sturdier than simply expanding volume. The funding rate is also in a high percentile recently, suggesting market sentiment is hot, but not to the point where FOMO has completely run wild.
On the data side, the abnormality level of the whole pool is #24, and it has been continuing for several consecutive cycles—not a one-off pulse buy/sell. Active trading spread is down 8.3%, and the buy/sell ratio is 1.18. The longs are really doing the work. How much it can rise is hard to say, but if this kind of persistence holds, don’t rush to get off.
Just keep an eye on the volume/flow: if it shrinks, run.

$HYPE This downward breakout is kind of interesting.
In the last 15 minutes, it’s down 1.1%. Volume surged straight to 2.76x, and the price has also broken through the lower bound of the recent 20 five-minute K-bars. But what’s interesting is that during the drop, contract OI is still only slightly up—shorts are adding positions, yet the notional value is shrinking. In plain terms: this is new leveraged shorting that’s being used to slam the price, not a cascading liquidation.
Aggressive trades are down 31.7%, and the buy/sell ratio is 0.52—selling pressure direction is very clear. The anomaly level across the whole pool ranks at #21, and the change in notional value is even in the top three. The move by the funds on HYPE isn’t something retail investors can stir up.
Don’t rush to bottom-fish. If the shorts are actively adding and breaking support, this kind of decline usually has momentum. Unless you clearly see aggressive buying returning, don’t be the contrarian. $HYPE
In the last 15 minutes, it’s down 1.1%. Volume surged straight to 2.76x, and the price has also broken through the lower bound of the recent 20 five-minute K-bars. But what’s interesting is that during the drop, contract OI is still only slightly up—shorts are adding positions, yet the notional value is shrinking. In plain terms: this is new leveraged shorting that’s being used to slam the price, not a cascading liquidation.
Aggressive trades are down 31.7%, and the buy/sell ratio is 0.52—selling pressure direction is very clear. The anomaly level across the whole pool ranks at #21, and the change in notional value is even in the top three. The move by the funds on HYPE isn’t something retail investors can stir up.
Don’t rush to bottom-fish. If the shorts are actively adding and breaking support, this kind of decline usually has momentum. Unless you clearly see aggressive buying returning, don’t be the contrarian. $HYPE

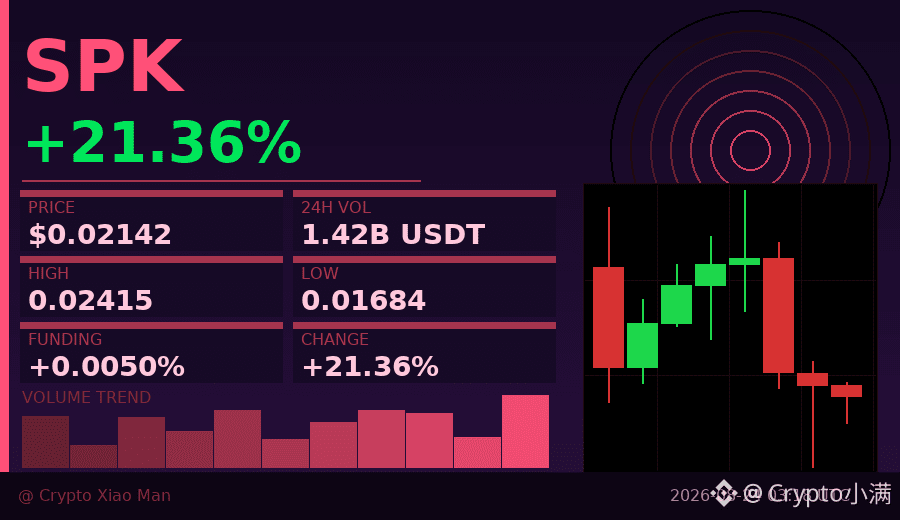
I just took a look at the trend of $SPK —it’s kind of interesting.
Today’s high hit 0.02415, and the gain briefly exceeded 21%, but now it has clearly pulled back from the peak. Three consecutive hourly candlesticks have closed bearish, and the price has shrunk to around 0.0214.
Right now, bulls and bears are almost a 50/50 split—bulls 50.4%, bears 49.6%—and there’s no clear direction consensus. At times like this, things are often the most dangerous, because once either side starts concentrating stop-losses, the price can jump around quickly.
What’s interesting is that the funding rate is only 0.005%, which is very low. This suggests that leveraged longs aren’t rushing in wildly, and chasing higher prices is still fairly restrained. With such a big move up, there hasn’t been any obvious buildup of leverage—in fact, it’s a relatively healthy signal.
However, the drop from the peak is already nearly 12%. If you chased in today, you may already feel the pressure. In the short term, after three straight bearish candles, we need to watch whether it can stabilize. If volume doesn’t keep up, it wouldn’t be surprising to see further probing downward.
Everyone can pay attention to whether the 0.020–0.021 range can hold up; if it breaks, there may be another period of consolidation/adjustment in the short run.
$SPK #加密行情 #21% surge and then pullback
Click the small card below to quickly check the market👇
Today’s high hit 0.02415, and the gain briefly exceeded 21%, but now it has clearly pulled back from the peak. Three consecutive hourly candlesticks have closed bearish, and the price has shrunk to around 0.0214.
Right now, bulls and bears are almost a 50/50 split—bulls 50.4%, bears 49.6%—and there’s no clear direction consensus. At times like this, things are often the most dangerous, because once either side starts concentrating stop-losses, the price can jump around quickly.
What’s interesting is that the funding rate is only 0.005%, which is very low. This suggests that leveraged longs aren’t rushing in wildly, and chasing higher prices is still fairly restrained. With such a big move up, there hasn’t been any obvious buildup of leverage—in fact, it’s a relatively healthy signal.
However, the drop from the peak is already nearly 12%. If you chased in today, you may already feel the pressure. In the short term, after three straight bearish candles, we need to watch whether it can stabilize. If volume doesn’t keep up, it wouldn’t be surprising to see further probing downward.
Everyone can pay attention to whether the 0.020–0.021 range can hold up; if it breaks, there may be another period of consolidation/adjustment in the short run.
$SPK #加密行情 #21% surge and then pullback
Click the small card below to quickly check the market👇

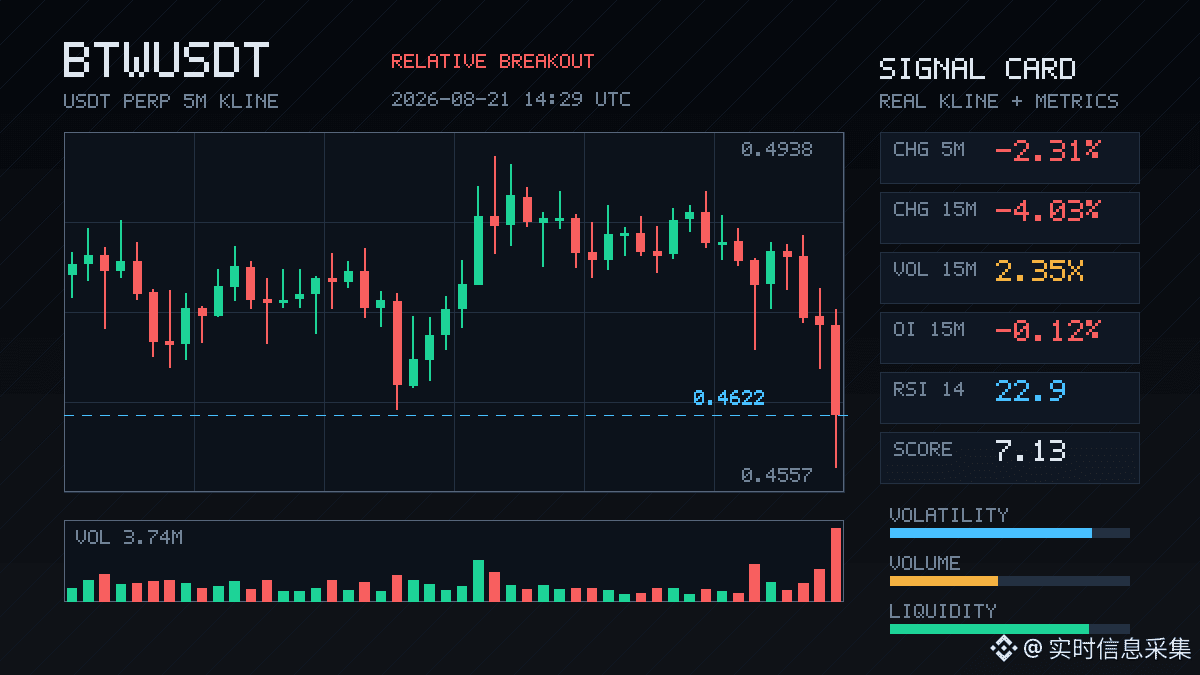
$BTW In this 15-minute move, it dropped directly by -4%. The volume increased to 2.35x, the volatility z-score is 3.36—this is a typical volume-spike dumping/hammering.
What’s interesting is that the contract open interest didn’t really move much (both 15m and 1h only fell slightly by 0.12%), but the notional value was instantly cut by nearly 4 million U. This indicates active profit-taking/stop-loss exits—not the opening of new short positions. The active trade imbalance is -6.7%, and the sell pressure is clear.
The closing price smashed through the lows of nearly 20 consecutive 5-minute K-lines. The whole pool’s abnormal ranking is #21, and the notional change surged to #3. This kind of volume-price divergence actually carries more signaling value than a simple straight selloff.
After clearing the leverage, the short-term upside elasticity may even increase. Keep an eye on whether the volume after this dump starts to contract—if it does, there may be a repair/rebound. Over the next 24h, there’s still about 300 million in turnover propping things up; the market isn’t dead—the key is that the sentiment needs to be washed out first.
What’s interesting is that the contract open interest didn’t really move much (both 15m and 1h only fell slightly by 0.12%), but the notional value was instantly cut by nearly 4 million U. This indicates active profit-taking/stop-loss exits—not the opening of new short positions. The active trade imbalance is -6.7%, and the sell pressure is clear.
The closing price smashed through the lows of nearly 20 consecutive 5-minute K-lines. The whole pool’s abnormal ranking is #21, and the notional change surged to #3. This kind of volume-price divergence actually carries more signaling value than a simple straight selloff.
After clearing the leverage, the short-term upside elasticity may even increase. Keep an eye on whether the volume after this dump starts to contract—if it does, there may be a repair/rebound. Over the next 24h, there’s still about 300 million in turnover propping things up; the market isn’t dead—the key is that the sentiment needs to be washed out first.
GRAM This move is a bit interesting.
In just 15 minutes, it pushed out 6.7x volume. The price broke above the 20 five-minute K-line highs, while OI also moved upward in tandem. This isn’t just a simple short-covering rebound—it looks more like new leveraged longs are stepping in. The high funding rate is working together with an aggressive buy-side advantage (buy/sell ratio 2.33). Momentum has continued strong across several consecutive cycles, with the abnormal percentile basically maxed out.
The only thing to watch is that this level is already close to its own historical extreme range. Chasing higher means both risk and reward are high. The total pool for $GRAM is currently changing hands and ranking around #21. There’s still a possibility of momentum carrying it higher, but keep an eye on whether OI suddenly turns. If there’s a surge in volume followed by a stall/weak advance, then you’d better be cautious.
In just 15 minutes, it pushed out 6.7x volume. The price broke above the 20 five-minute K-line highs, while OI also moved upward in tandem. This isn’t just a simple short-covering rebound—it looks more like new leveraged longs are stepping in. The high funding rate is working together with an aggressive buy-side advantage (buy/sell ratio 2.33). Momentum has continued strong across several consecutive cycles, with the abnormal percentile basically maxed out.
The only thing to watch is that this level is already close to its own historical extreme range. Chasing higher means both risk and reward are high. The total pool for $GRAM is currently changing hands and ranking around #21. There’s still a possibility of momentum carrying it higher, but keep an eye on whether OI suddenly turns. If there’s a surge in volume followed by a stall/weak advance, then you’d better be cautious.

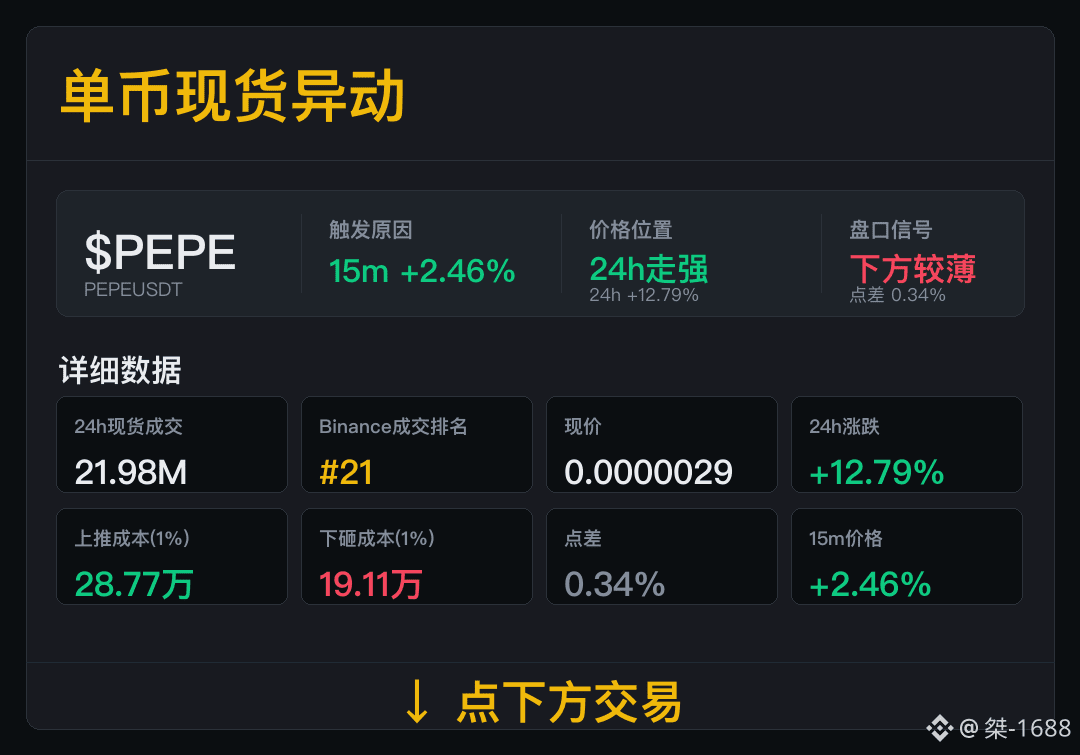
$PEPE short-term momentum is picking up—first verify the trade ranking and order book costs.
Spot trades: 21.98M; Binance trade ranking: #21. Spot trades are the current primary clue, so we’ll continue tracking participation going forward.
Now 24h change: +12.79%; spread: 0.34%; upward breakout cost: 287,700; downward breakdown cost: 191,100. Going forward, if the spread stays at the current level and trading remains active, short-term execution should run more smoothly.
Next, we’ll watch whether trading keeps holding up and whether the spread remains at the current level.
Spot trades: 21.98M; Binance trade ranking: #21. Spot trades are the current primary clue, so we’ll continue tracking participation going forward.
Now 24h change: +12.79%; spread: 0.34%; upward breakout cost: 287,700; downward breakdown cost: 191,100. Going forward, if the spread stays at the current level and trading remains active, short-term execution should run more smoothly.
Next, we’ll watch whether trading keeps holding up and whether the spread remains at the current level.
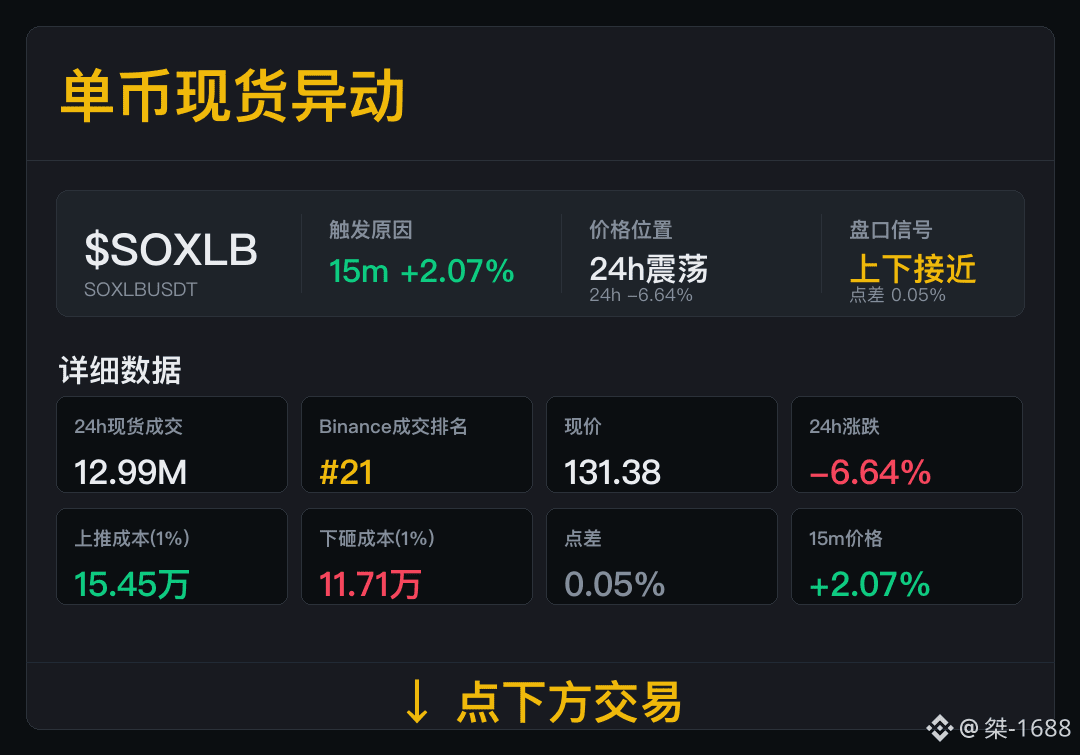
The price moved first, $SOXLB , and the trade needs subsequent confirmation.
Spot成交 12.99M, Binance trade ranking #21. The trade data is already shown in the chart; for the next round, we’ll see whether the volume can continue.
In the last 24h: -6.64%; spread 0.05%; buy-side cost increased to 154,500; sell-side cost dropped to 117,100. There is no obvious weakening in subsequent trades, so any continued short-term abnormal movement is possible.
If trade volume weakens or the spread widens, short-term signals should be downgraded.
Spot成交 12.99M, Binance trade ranking #21. The trade data is already shown in the chart; for the next round, we’ll see whether the volume can continue.
In the last 24h: -6.64%; spread 0.05%; buy-side cost increased to 154,500; sell-side cost dropped to 117,100. There is no obvious weakening in subsequent trades, so any continued short-term abnormal movement is possible.
If trade volume weakens or the spread widens, short-term signals should be downgraded.

$ACE This 15-minute move directly jumped 4.57%, with volume expanding to 2.7 times the usual level. The closing price decisively punched through the upper boundary of the range formed by nearly 20 five-minute candlesticks. Honestly, this breakout pattern is pretty clean—it’s not the kind of slow, dragging fake-out.
What I care about most is that OI is rising in sync: the 15-minute contracts’ position size increased by 1.31%, and the notional value surged by 660,000 U. This combination of price rising alongside increased positions suggests there are truly new leveraged long entries—not a fake rally caused by short-covering. Active trading is up 5.6%, the buy/sell ratio is 1.12, and the buy-side clearly has the advantage; the capital direction is very clear.
Plus, ACE is currently near its own historical extreme zone. The overall abnormality level for the whole pool ranks at #21, and the notional change has surged into the top 11. In a situation like this, once it triggers, it often leads to a run of consecutive momentum. In the past 24 hours, it already did $420 million in trading volume—this pool’s activity level is definitely there.
Chasing after a high move definitely carries risk, but this breakout setup is worth paying attention to—especially whether it can maintain follow-through.
What I care about most is that OI is rising in sync: the 15-minute contracts’ position size increased by 1.31%, and the notional value surged by 660,000 U. This combination of price rising alongside increased positions suggests there are truly new leveraged long entries—not a fake rally caused by short-covering. Active trading is up 5.6%, the buy/sell ratio is 1.12, and the buy-side clearly has the advantage; the capital direction is very clear.
Plus, ACE is currently near its own historical extreme zone. The overall abnormality level for the whole pool ranks at #21, and the notional change has surged into the top 11. In a situation like this, once it triggers, it often leads to a run of consecutive momentum. In the past 24 hours, it already did $420 million in trading volume—this pool’s activity level is definitely there.
Chasing after a high move definitely carries risk, but this breakout setup is worth paying attention to—especially whether it can maintain follow-through.
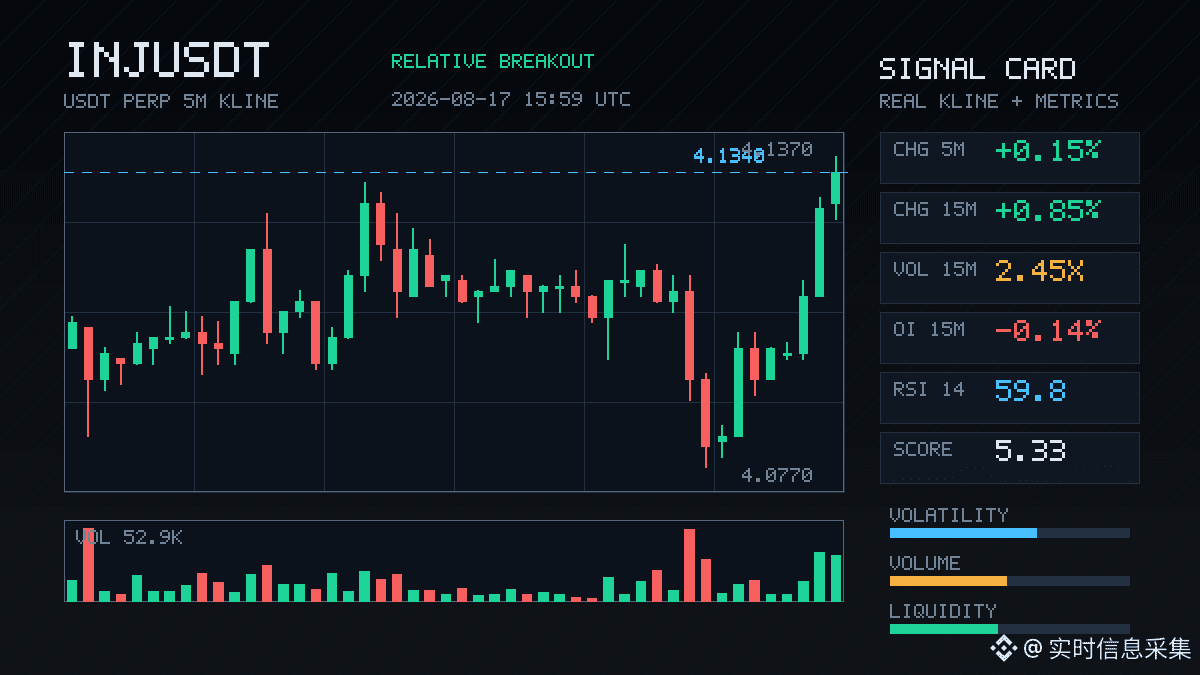
Late at night, watching the order book, I spotted the 15-minute candlestick with $INJ . The volume and energy jumped straight to 2.45x, and in one push it broke through the upper bound of nearly 20 five-minute candlesticks. Although the gain is only 0.85%, combined with the fact that OI actually dipped slightly, it feels more like a breakout driven by short covering rather than fresh long chasing. This kind of structure, ahead of the U.S. market open, often suggests there’s still more to the story in the short term.
This wave’s Z value of 2.44 isn’t outrageous, but compared with the entire pool’s abnormal ranking—#21—and its nominal change being squeezed into the top 38, it definitely deserves a closer look. The buy/sell ratio based on active trades reached 2.76, with buy pressure clearly in control. On top of that, the last 24 hours’ trading value is still supported by more than $21 million, so it doesn’t feel like a simple one-and-done push.
Still, I need to remind myself: the OI has been declining for two consecutive cycles, which indicates that the newly entered positions are limited—more like unwinding old positions. The closing price is hovering right along the extreme zone, and the high volatility may not be over yet, but if you chase, you’ve got to hold some risk in your hands.
Keep watching and see whether this move can truly succeed in taking over and completing turnover.
This wave’s Z value of 2.44 isn’t outrageous, but compared with the entire pool’s abnormal ranking—#21—and its nominal change being squeezed into the top 38, it definitely deserves a closer look. The buy/sell ratio based on active trades reached 2.76, with buy pressure clearly in control. On top of that, the last 24 hours’ trading value is still supported by more than $21 million, so it doesn’t feel like a simple one-and-done push.
Still, I need to remind myself: the OI has been declining for two consecutive cycles, which indicates that the newly entered positions are limited—more like unwinding old positions. The closing price is hovering right along the extreme zone, and the high volatility may not be over yet, but if you chase, you’ve got to hold some risk in your hands.
Keep watching and see whether this move can truly succeed in taking over and completing turnover.
BOME, this move over 15 minutes surged 1.6%, directly punching through the upper bound of the range on 20 five-minute candlesticks🔥
The key point is that the OI didn’t keep up—instead it shrank. The 15m contract is -0.08%, and the 1h is also -0.35%. Combined with a relatively strong aggressive buy side (buy/sell ratio 1.62, aggressive trade delta +23.7%), this structure looks more like short covering pushing the price up rather than fresh long entries with real conviction. The nominal change did hit the top of the entire pool at #21, and the abnormality level isn’t low either—24h trading volume is over 21 million, and the volume has indeed expanded by 2.24x.
All we can say is it’s a “strong but unstable” signal. For those chasing it in the short term, be careful: in breakouts with OI divergence, it either continues to squeeze shorts, or it turns into a long trap. Position management matters more than directional judgment.
#BOME
The key point is that the OI didn’t keep up—instead it shrank. The 15m contract is -0.08%, and the 1h is also -0.35%. Combined with a relatively strong aggressive buy side (buy/sell ratio 1.62, aggressive trade delta +23.7%), this structure looks more like short covering pushing the price up rather than fresh long entries with real conviction. The nominal change did hit the top of the entire pool at #21, and the abnormality level isn’t low either—24h trading volume is over 21 million, and the volume has indeed expanded by 2.24x.
All we can say is it’s a “strong but unstable” signal. For those chasing it in the short term, be careful: in breakouts with OI divergence, it either continues to squeeze shorts, or it turns into a long trap. Position management matters more than directional judgment.
#BOME
Just finished a cup of black coffee, and I scanned the U.S. stock perpetual leaderboard in the bottom-right corner of my screen—stopped a bit longer on Lumentum. Not because it’s the strongest mover today, but because names that can land on the gainers list at #15 and the trading value list at #21 usually indicate that money is starting to look back toward a less crowded segment of the “hard-tech chain.”
On the board, its current perpetual price is $917.38, up +1.35% over the past 24 hours, trading in a range of $876.66 to $958.3. The amplitude isn’t small, but the funding rate is still +0.0000%. I’ll pay extra attention to that. The price has elasticity, but the funding rate isn’t heating up—this suggests the move isn’t just a one-sided chase driven purely by sentiment. At least on the contract side, it hasn’t reached a one-directional, lopsided state yet. In the past 24 hours, trading value is $61.00M USDT, with open interest of 16,522 contracts. Attention is rising, but it’s not at an especially crowded level yet.
I’m generally somewhat positive on this kind of setup—not mainly because of one day’s rise or fall. As for a name like Lumentum, from what I understand, it’s broadly tied to optical communications, optical components, and network infrastructure. As long as the market keeps repeatedly trading AI compute, data center expansion, and bandwidth upgrades, this direction won’t easily fall out of the main theme. What’s truly useful isn’t story-driven companies—it’s the ones stuck in the underlying link; when the cycle improves, they’re the ones that are easier to reprice quickly.
One more thing I’ll watch: there’s a pullback from today’s high to the current price, which means there’s still selling pressure overhead. It’s not a structure where buyers are simply locking in and pushing it higher all the way. If I were to act, I wouldn’t chase at these high levels. I haven’t opened a position in $LITE yet. I’ll wait for it to come back to the middle of the day range so it can hold steadily, then consider opening a 3% starter. If later the volume drops off, I won’t move. Look, being bullish is one thing—but once the sector’s heat shifts away, pullbacks in this kind of name can come quickly.
What interests me about this one right now is that the track hasn’t broken, the contracts haven’t overheated, and funds are starting to flow back. For me, that matters more than just a few extra percentage points of gains in a single day. $LITE #USstocks
If you lose, don’t cue me—if you profit, treat me to a cup of coffee.
On the board, its current perpetual price is $917.38, up +1.35% over the past 24 hours, trading in a range of $876.66 to $958.3. The amplitude isn’t small, but the funding rate is still +0.0000%. I’ll pay extra attention to that. The price has elasticity, but the funding rate isn’t heating up—this suggests the move isn’t just a one-sided chase driven purely by sentiment. At least on the contract side, it hasn’t reached a one-directional, lopsided state yet. In the past 24 hours, trading value is $61.00M USDT, with open interest of 16,522 contracts. Attention is rising, but it’s not at an especially crowded level yet.
I’m generally somewhat positive on this kind of setup—not mainly because of one day’s rise or fall. As for a name like Lumentum, from what I understand, it’s broadly tied to optical communications, optical components, and network infrastructure. As long as the market keeps repeatedly trading AI compute, data center expansion, and bandwidth upgrades, this direction won’t easily fall out of the main theme. What’s truly useful isn’t story-driven companies—it’s the ones stuck in the underlying link; when the cycle improves, they’re the ones that are easier to reprice quickly.
One more thing I’ll watch: there’s a pullback from today’s high to the current price, which means there’s still selling pressure overhead. It’s not a structure where buyers are simply locking in and pushing it higher all the way. If I were to act, I wouldn’t chase at these high levels. I haven’t opened a position in $LITE yet. I’ll wait for it to come back to the middle of the day range so it can hold steadily, then consider opening a 3% starter. If later the volume drops off, I won’t move. Look, being bullish is one thing—but once the sector’s heat shifts away, pullbacks in this kind of name can come quickly.
What interests me about this one right now is that the track hasn’t broken, the contracts haven’t overheated, and funds are starting to flow back. For me, that matters more than just a few extra percentage points of gains in a single day. $LITE #USstocks
If you lose, don’t cue me—if you profit, treat me to a cup of coffee.
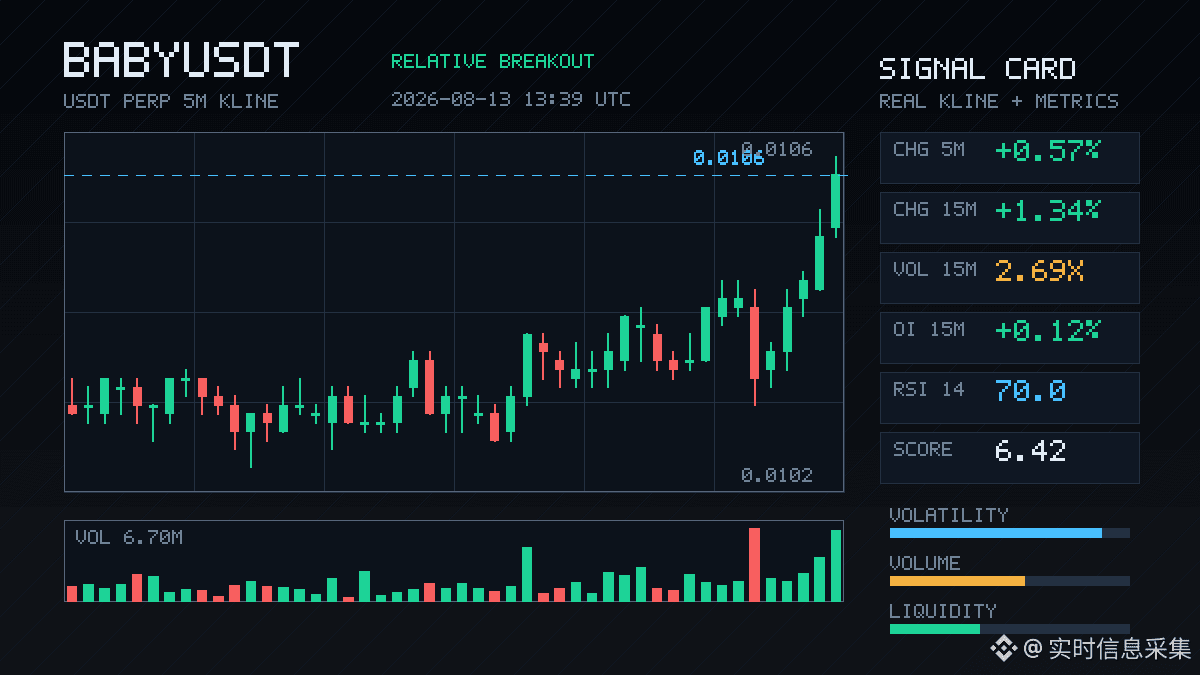
$BABY This 15-minute breakout has something to it.
Price is pushing upward and volume has directly surged to 2.7 times the normal level. Active buy orders have an overwhelming advantage (buy/sell ratio 1.77). This isn’t a fake move—it’s a clear posture of real money rushing in.
More importantly, OI hasn’t skyrocketed along with the price. The 15-minute window only shows a modest increase in positions; on the 1-hour timeframe, it’s even slightly pulled back. This suggests the move is more like a concentrated release of intraday sentiment, with new longs following in at a fairly controlled pace, with no sign of overheating.
But the OI abnormal percentile has already been pulled up to 92.9%; in the whole pool, the abnormality ranks at #21. It has been continuing across several consecutive periods. This kind of sustained divergence signal is worth paying attention to. Right now, price has broken above the upper bound of the past ~20 five-minute K-line range. The only remaining question is whether it can hold steady.
Funding rate has also been running at a high percentile recently. Market sentiment leans bullish, but the more it looks like this, the more you need to stay alert—don’t get too carried away when others are FOMO-ing.
Price is pushing upward and volume has directly surged to 2.7 times the normal level. Active buy orders have an overwhelming advantage (buy/sell ratio 1.77). This isn’t a fake move—it’s a clear posture of real money rushing in.
More importantly, OI hasn’t skyrocketed along with the price. The 15-minute window only shows a modest increase in positions; on the 1-hour timeframe, it’s even slightly pulled back. This suggests the move is more like a concentrated release of intraday sentiment, with new longs following in at a fairly controlled pace, with no sign of overheating.
But the OI abnormal percentile has already been pulled up to 92.9%; in the whole pool, the abnormality ranks at #21. It has been continuing across several consecutive periods. This kind of sustained divergence signal is worth paying attention to. Right now, price has broken above the upper bound of the past ~20 five-minute K-line range. The only remaining question is whether it can hold steady.
Funding rate has also been running at a high percentile recently. Market sentiment leans bullish, but the more it looks like this, the more you need to stay alert—don’t get too carried away when others are FOMO-ing.
$HEI In this 15-minute window, it directly surged 3 points. Volume expanded in sync to 1.47x. The active buy order ratio in the order book is 29.4%, with a buy/sell ratio of 1.83—this is not the kind of low-volume bull trap false breakout. This is a real, solid trading rhythm where genuine money is getting hammered in. 📈
More importantly, OI is rising simultaneously on both the 15-minute and 1-hour timeframes. The contract notional changes are +3.28% and +8.38% respectively—typical of incremental leveraged funds entering to chase longs, not a passive rebound from shorts closing.
The funding rate is at a recent high percentile, which suggests participation from leveraged longs is already quite crowded. Price has broken above the top of the range from the last 20 five-minute K-lines. And at this new high level, there’s deep confirmation—short-term sentiment really does have something to it.
But one reminder: the abnormality rank of OI is #21 within the whole pool, and the rank of notional change is #23. The heat is already up. The more ferocious the leveraged crowd gets, the more you need to leave room for defense. On this board, it’s fine to look for continuation with the trend, but if you chase higher, you’d better weigh the risk yourself. 🤔
More importantly, OI is rising simultaneously on both the 15-minute and 1-hour timeframes. The contract notional changes are +3.28% and +8.38% respectively—typical of incremental leveraged funds entering to chase longs, not a passive rebound from shorts closing.
The funding rate is at a recent high percentile, which suggests participation from leveraged longs is already quite crowded. Price has broken above the top of the range from the last 20 five-minute K-lines. And at this new high level, there’s deep confirmation—short-term sentiment really does have something to it.
But one reminder: the abnormality rank of OI is #21 within the whole pool, and the rank of notional change is #23. The heat is already up. The more ferocious the leveraged crowd gets, the more you need to leave room for defense. On this board, it’s fine to look for continuation with the trend, but if you chase higher, you’d better weigh the risk yourself. 🤔
$BANK Morning session: this volatility is a bit interesting 🔥
In just 15 minutes, price ripped through the upper bound of the recent range of nearly 20 5m candles. Trading volume hit 1.87x the usual level, and the volatility Z soared to 3.03—this isn’t that kind of sloppy, fake breakout.
Most importantly, OI is rising in sync. The 15-minute contract is up +0.35%, the 1-hour timeframe is +1%. Notional changes from 206K to 278K. This isn’t the kind of reduced-volume bounce from short-covering—this is solid new leveraged long exposure actually entering the market.
Aggressive volume is up 11.8%, the buy/sell ratio is 1.27, and buyers are in the lead with no real disagreement. Abnormal pool rank #21, notional change rank #26—one of those quiet setups where capital is already watching.
Over the past 24 hours, turnover is $104 million, and liquidity is sufficient. If you want to chase it in the short term, focus on whether this breakout retest can hold and stay above the upper end of the range. Don’t rush to go all-in—first see if volume can support it.
In just 15 minutes, price ripped through the upper bound of the recent range of nearly 20 5m candles. Trading volume hit 1.87x the usual level, and the volatility Z soared to 3.03—this isn’t that kind of sloppy, fake breakout.
Most importantly, OI is rising in sync. The 15-minute contract is up +0.35%, the 1-hour timeframe is +1%. Notional changes from 206K to 278K. This isn’t the kind of reduced-volume bounce from short-covering—this is solid new leveraged long exposure actually entering the market.
Aggressive volume is up 11.8%, the buy/sell ratio is 1.27, and buyers are in the lead with no real disagreement. Abnormal pool rank #21, notional change rank #26—one of those quiet setups where capital is already watching.
Over the past 24 hours, turnover is $104 million, and liquidity is sufficient. If you want to chase it in the short term, focus on whether this breakout retest can hold and stay above the upper end of the range. Don’t rush to go all-in—first see if volume can support it.

A clear feeling I have these days is that the market’s patience toward “selling shovels upstream” is improving.
During the day I’m drawing charts and adjusting requirements until my eyes ache. At night, I sit alone in the living room and scroll through the US stock rankings. The more I look, the more I feel that while many people talk about AI, computing power, and manufacturing upgrades, the segments that can truly benefit consistently are often not the hottest names in front of the stage—but the unavoidable links in the industrial chain.
$AMAT I’m also mildly bullish from this perspective.
From what I understand, it roughly sits along the semiconductor equipment and manufacturing-related line.
Companies like this aren’t particularly good at telling stories. But as long as the industry keeps moving toward more complex and higher-requirement manufacturing, the equipment end usually won’t be too peripheral.
To be honest, when I look at stocks like this, I don’t like the idea of “how much it’s up today.” What I care about is whether it has that kind of position in the core area—regardless of how the cycle shakes out.
Today it ranks #21 in Binance’s US stock perpetuals return chart and #29 in trading volume. I’ll treat that as a modest positive.
It’s not to say this heat alone explains everything.
It only suggests the market is starting to give attention to this line again—and it’s not just dead corners with no trading at all.
There’s another detail on the board that I think is fine.
It’s up only +0.34% over 24 hours—not some surge that cranks up emotions to the max. Its highs and lows are between $548.49 and $534.91. There’s some fluctuation, but it hasn’t been so exaggerated that makes me afraid to look.
This kind of state actually makes me more comfortable than a single big bullish candle. It doesn’t feel like emotion is running out of control.
One more thing I’ll pay attention to: the funding rate here is still +0.0000%.
I interpret that to mean that at least right now, it’s not the kind of situation where the longs are squeezed into an ugly position.
If people want to participate, there are also positions—3,734 lots in holdings—but the sentiment isn’t hot enough to feel scorching. That’s pretty friendly for those who are moderately bullish.
Of course, it’s not without variables.
As long as market expectations for the semiconductor chain weaken, or the entire tech sector suddenly starts slashing valuations, this kind of stock will get swept along with the move.
Also, it’s not the sort of name that’s especially suitable for chasing purely on emotion. If you get the timing wrong, it can be really grinding. You’ll genuinely regret it.
So my stance isn’t an excited chase. It’s more like—watch for pullbacks and then decide.
If you’re also looking for something that doesn’t live or die on a new story, but is instead long-term tied to industrial upgrading, $AMAT I think you can seriously add it to your watchlist.
If you lose money, don’t cue me. If you profit, please buy me a cup of coffee.$AMAT #USStocks
During the day I’m drawing charts and adjusting requirements until my eyes ache. At night, I sit alone in the living room and scroll through the US stock rankings. The more I look, the more I feel that while many people talk about AI, computing power, and manufacturing upgrades, the segments that can truly benefit consistently are often not the hottest names in front of the stage—but the unavoidable links in the industrial chain.
$AMAT I’m also mildly bullish from this perspective.
From what I understand, it roughly sits along the semiconductor equipment and manufacturing-related line.
Companies like this aren’t particularly good at telling stories. But as long as the industry keeps moving toward more complex and higher-requirement manufacturing, the equipment end usually won’t be too peripheral.
To be honest, when I look at stocks like this, I don’t like the idea of “how much it’s up today.” What I care about is whether it has that kind of position in the core area—regardless of how the cycle shakes out.
Today it ranks #21 in Binance’s US stock perpetuals return chart and #29 in trading volume. I’ll treat that as a modest positive.
It’s not to say this heat alone explains everything.
It only suggests the market is starting to give attention to this line again—and it’s not just dead corners with no trading at all.
There’s another detail on the board that I think is fine.
It’s up only +0.34% over 24 hours—not some surge that cranks up emotions to the max. Its highs and lows are between $548.49 and $534.91. There’s some fluctuation, but it hasn’t been so exaggerated that makes me afraid to look.
This kind of state actually makes me more comfortable than a single big bullish candle. It doesn’t feel like emotion is running out of control.
One more thing I’ll pay attention to: the funding rate here is still +0.0000%.
I interpret that to mean that at least right now, it’s not the kind of situation where the longs are squeezed into an ugly position.
If people want to participate, there are also positions—3,734 lots in holdings—but the sentiment isn’t hot enough to feel scorching. That’s pretty friendly for those who are moderately bullish.
Of course, it’s not without variables.
As long as market expectations for the semiconductor chain weaken, or the entire tech sector suddenly starts slashing valuations, this kind of stock will get swept along with the move.
Also, it’s not the sort of name that’s especially suitable for chasing purely on emotion. If you get the timing wrong, it can be really grinding. You’ll genuinely regret it.
So my stance isn’t an excited chase. It’s more like—watch for pullbacks and then decide.
If you’re also looking for something that doesn’t live or die on a new story, but is instead long-term tied to industrial upgrading, $AMAT I think you can seriously add it to your watchlist.
If you lose money, don’t cue me. If you profit, please buy me a cup of coffee.$AMAT #USStocks
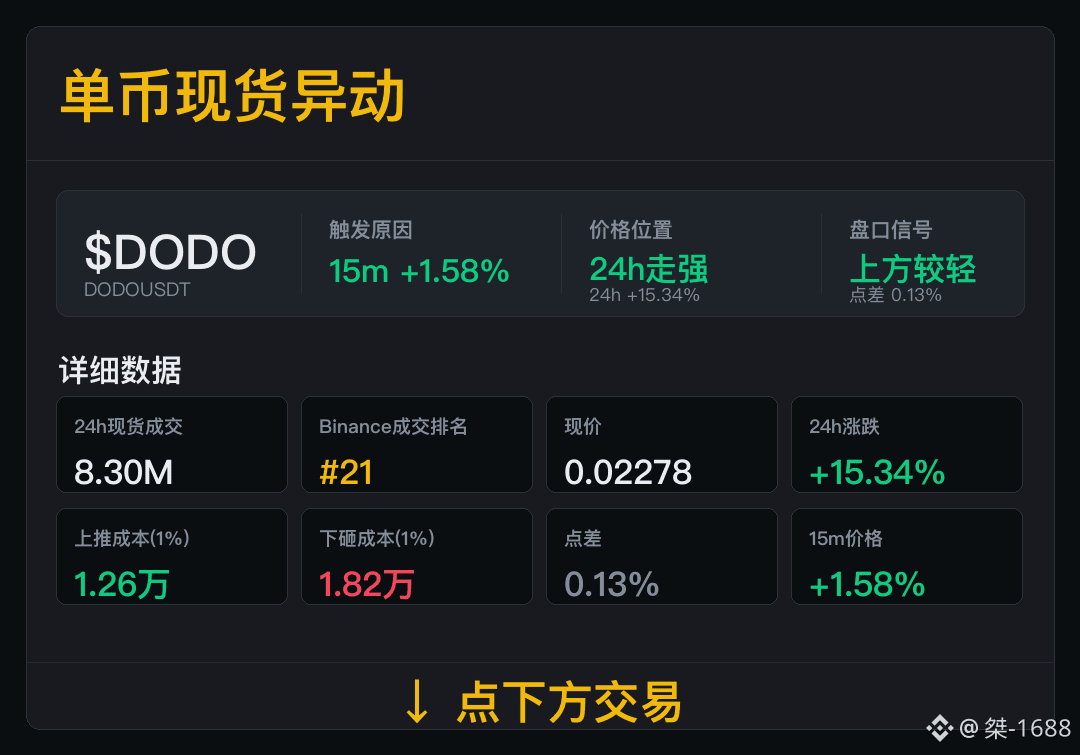
$DODO 15m Spot surge in activity; the price has jumped out—what matters most is whether the trade volume can absorb/continue.
Spot trades: 8.30M, Binance trade ranking #21. If the成交 can rank near the top, it means this isn’t just a small movement with no attention.
Now 24h change +15.34%; spread 0.13%, pushing up costs by 12.6k, while dragging down costs by 18.2k. The order book is giving a difficulty level for trading—but whether price can truly move through depends on the成交.
Going forward, watch成交 and spread: if volume can be absorbed and the spread doesn’t widen, then the chart action can continue.
Spot trades: 8.30M, Binance trade ranking #21. If the成交 can rank near the top, it means this isn’t just a small movement with no attention.
Now 24h change +15.34%; spread 0.13%, pushing up costs by 12.6k, while dragging down costs by 18.2k. The order book is giving a difficulty level for trading—but whether price can truly move through depends on the成交.
Going forward, watch成交 and spread: if volume can be absorbed and the spread doesn’t widen, then the chart action can continue.
$SYN This drop is a bit brutal—within 15 minutes, it’s already down -3.82%. Volume surged to 2.58x, the volatility Z-score is 3.02. Clearly, this isn’t a normal pullback.
Even more noteworthy is that OI over the past hour shrank by 7.55%, with notional positions down by nearly 500k U. With this combination—price falling while positions also drop—it’s basically certain that the longs are actively deleveraging. Stop-loss orders and position-reduction orders are flowing out together. The anomaly percentile for the whole pool is 97%; the notional change ranks #21, indicating that today, within the contract universe, it’s considered a “star” underlying—just not in a pleasant direction.
By the close, it has already broken below the lower bound of 20 consecutive 5-minute K-lines. Active trade is down -16.9%, buy-sell ratio is 0.71. The bears aren’t giving you even a chance to bounce—selling pressure is one-sided.
This kind of abnormal structure that persists across multiple consecutive periods has already reached its own historical extreme range. For the short term, watch from the sidelines if you should—don’t get itchy and catch a falling knife. #SYN
Even more noteworthy is that OI over the past hour shrank by 7.55%, with notional positions down by nearly 500k U. With this combination—price falling while positions also drop—it’s basically certain that the longs are actively deleveraging. Stop-loss orders and position-reduction orders are flowing out together. The anomaly percentile for the whole pool is 97%; the notional change ranks #21, indicating that today, within the contract universe, it’s considered a “star” underlying—just not in a pleasant direction.
By the close, it has already broken below the lower bound of 20 consecutive 5-minute K-lines. Active trade is down -16.9%, buy-sell ratio is 0.71. The bears aren’t giving you even a chance to bounce—selling pressure is one-sided.
This kind of abnormal structure that persists across multiple consecutive periods has already reached its own historical extreme range. For the short term, watch from the sidelines if you should—don’t get itchy and catch a falling knife. #SYN
Log in to explore more content