

Mjamil_mj
936 Posts

Mjamil_mj
Report
Block User
Open Trade
Frequent Trader
2.6 Years
22 Following
105 Followers
111 Liked
Posts
Portfolio
All
Videos
PINNED
·
--
#bnb #YiHe #CZBİNANCE Key levels: Price $648.20; support $646.50/$643.60; resistance $650.55/$654.60.
Buy setup: Entries near $646.50 (Boll lower) and $643.60 (MA99) if RSI holds >40.
Sell setup: Trim zones at $650.55 (Boll mid) and $654.60 (4h supply) on rejection.
Catalyst / context: RWA surge and Launchpool active; smart money shows bullish shift but price lags.
Market Structure
BNB trades at $648.20, compressed between Bollinger bands ($646.50-$650.55) showing neutral momentum.
5m bullish divergence contrasts with 1h/4h corrective MACD histogram signals.
Support at $643.60 (MA99); resistance at $654.60. Volume needs 5,000+ BNB/hour for breakout confirmation.
Smart Money Flow
L/S ratio surged 68% signaling massive bullish shift in trader positioning.
Whales accumulated longs (+30%) while actively reducing short exposure.
Price $648 lags whale entry zones; upside potential on $650 resistance breakout.
RWA Adoption Surges
BNB Chain tokenized stocks hit $9.3M on China-focused RWA demand.
Ondo equity basket up 2,850% YTD; developer tools boost BNB utility. Link
Launchpool & Earn Active
Stake BNB in Launchpool for new token rewards without lock-ups.
Simple Earn offers flexible yields; trading competitions boost BNB pair liquidity.
Trading Strategy
Short-term: Scalp $646.50 support targeting $650.55 resistance with tight stops.
Mid-term: Accumulate near $643.60 MA99 if 1h structure turns bullish above EMAs.
Long-term: Hold for RWA growth and Launchpool rewards; target $654.60 supply breakout.#BlackRockPlansMoneyMarketFundsforStablecoinUsers #CathieWoodandCZDiscussAIandStablecoins $BTC $ETH $BNB

93

·
--
Bearish
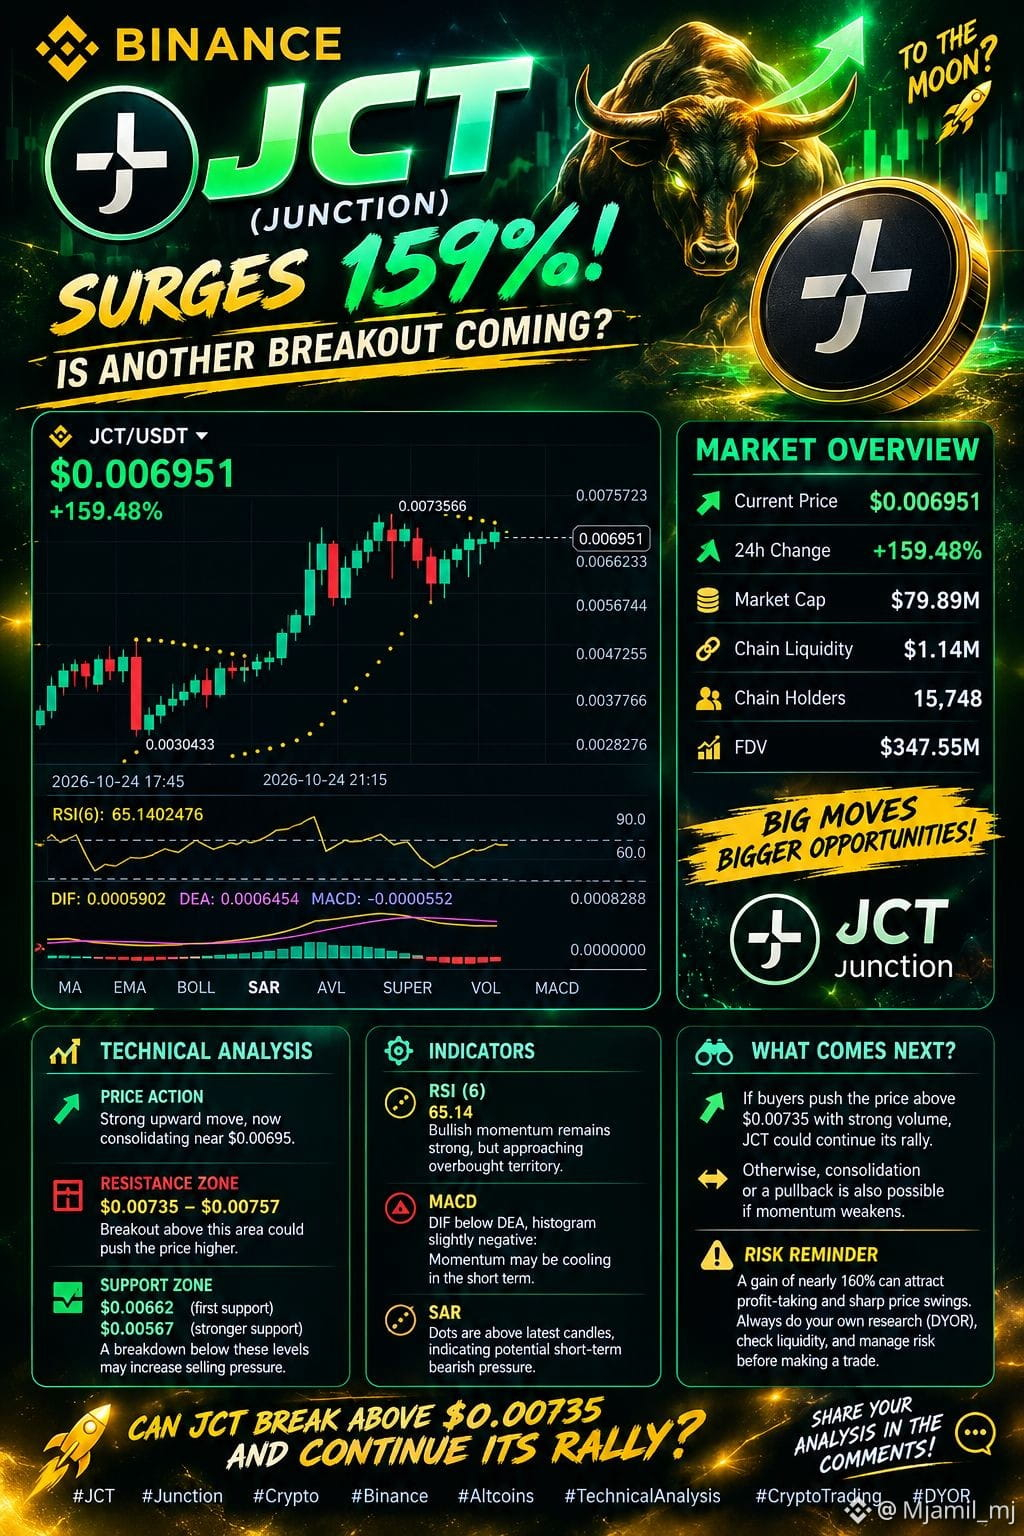
🚀 JCT (Junction): A Powerful Rally or the Next Big Breakout?
🔥 JCT is catching traders’ attention after a massive price surge!
Junction (JCT) has recorded an impressive 159.48% gain, reaching approximately $0.006951, according to the Binance chart captured on October 24, 2026.
With a reported market capitalization of $79.89 million and 15,748 holders, JCT is showing significant market activity. But the big question is: can buyers maintain this momentum?
📊 Key Market Levels
🟢 Resistance: $0.00735–$0.00757
A convincing breakout above this zone, supported by strong trading volume, could open the door to another upward move.
🟡 First Support: $0.00662
🔴 Next Support: $0.00567
A drop below these levels could signal weakening momentum and increase the possibility of a deeper correction.
📈 What Do the Indicators Say?
- RSI (6): 65.14 — buying momentum remains relatively strong.
- MACD: DIF is below DEA, suggesting short-term momentum may be cooling.
- SAR: The dots are above the latest candles, indicating possible short-term selling pressure.
⚡ My Market View
JCT is at an important decision point. A strong move above resistance could attract renewed attention, while rejection near the highs could lead to consolidation or profit-taking. Confirmation from price action and trading volume is essential before drawing conclusions.
💬 Your Turn: Will JCT break above $0.00757, or will the market see a correction first? Share your analysis in the comments!
⚠️ Disclaimer: This article is for informational purposes only, not financial advice. Cryptocurrency markets are volatile, and a sharp rally does not guarantee further gains. Always DYOR.
#JCT #Junction #BinanceSquare #CryptoAnalysis #Altcoins #CryptoMarket #TechnicalAnalysis #dyor $JCT
{alpha}(560xea37a8de1de2d9d10772eeb569e28bfa5cb17707)
$AAPLB $BTC
{future}(BTCUSDT)
🚀 JCT (Junction): A Powerful Rally or the Next Big Breakout?
🔥 JCT is catching traders’ attention after a massive price surge!
Junction (JCT) has recorded an impressive 159.48% gain, reaching approximately $0.006951, according to the Binance chart captured on October 24, 2026.
With a reported market capitalization of $79.89 million and 15,748 holders, JCT is showing significant market activity. But the big question is: can buyers maintain this momentum?
📊 Key Market Levels
🟢 Resistance: $0.00735–$0.00757
A convincing breakout above this zone, supported by strong trading volume, could open the door to another upward move.
🟡 First Support: $0.00662
🔴 Next Support: $0.00567
A drop below these levels could signal weakening momentum and increase the possibility of a deeper correction.
📈 What Do the Indicators Say?
- RSI (6): 65.14 — buying momentum remains relatively strong.
- MACD: DIF is below DEA, suggesting short-term momentum may be cooling.
- SAR: The dots are above the latest candles, indicating possible short-term selling pressure.
⚡ My Market View
JCT is at an important decision point. A strong move above resistance could attract renewed attention, while rejection near the highs could lead to consolidation or profit-taking. Confirmation from price action and trading volume is essential before drawing conclusions.
💬 Your Turn: Will JCT break above $0.00757, or will the market see a correction first? Share your analysis in the comments!
⚠️ Disclaimer: This article is for informational purposes only, not financial advice. Cryptocurrency markets are volatile, and a sharp rally does not guarantee further gains. Always DYOR.
#JCT #Junction #BinanceSquare #CryptoAnalysis #Altcoins #CryptoMarket #TechnicalAnalysis #dyor $JCT
$AAPLB $BTC
548
·
--
Bullish
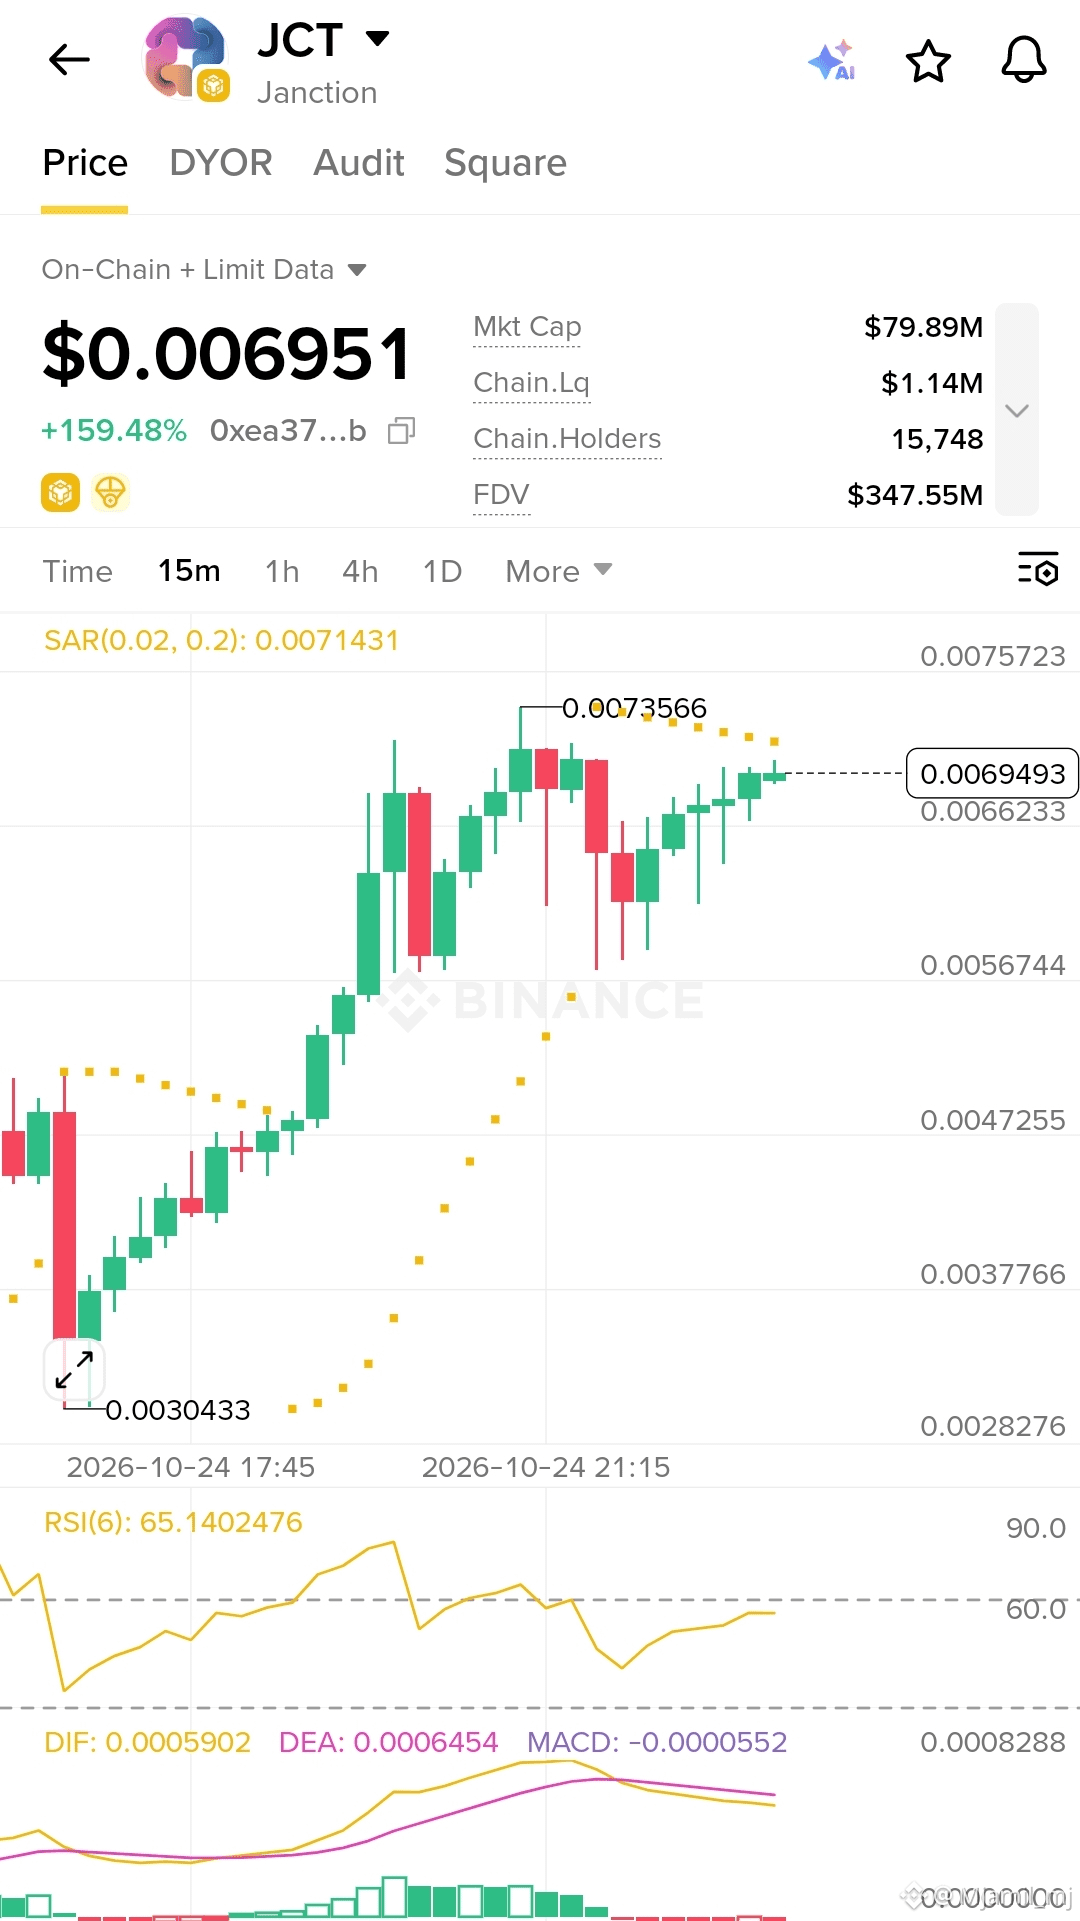
🚀 JCT (Junction) Surges 159% — Is Another Breakout Coming?
JCT is making waves in the crypto market! 🔥
According to the Binance chart screenshot, JCT (Junction) is trading around $0.006951, showing an impressive +159.48% gain. Its market capitalization stands at approximately $79.89 million, with a reported circulating liquidity of $1.14 million and 15,748 holders shown in the screenshot.
📊 Technical Analysis (15-Minute Chart)
- Price Action: JCT has experienced a strong upward move and is now consolidating near $0.00695.
- Resistance Zone: $0.00735–$0.00757. A breakout above this area could signal further upside, if supported by strong volume.
- Support Zone: $0.00662, followed by $0.00567. A breakdown below these levels could increase selling pressure.
- RSI (6): 65.14 — bullish momentum remains relatively strong, but the indicator is approaching overbought territory.
- MACD: DIF is below DEA, and the histogram is slightly negative, suggesting that short-term momentum may be cooling.
- SAR: The dots are above the latest candles, indicating potential short-term bearish pressure.
🔎 What Comes Next?
JCT could attempt another upward move if buyers push the price above resistance with strong trading volume. However, continued consolidation or a pullback is also possible if momentum weakens.
⚠️ Risk Reminder: A gain of nearly 160% can attract profit-taking and sharp price swings. Always do your own research (DYOR), check liquidity, and manage risk before making a trading decision.
🔥 Can JCT break above $0.00735 and continue its rally, or will sellers take control?
Share your analysis in the comments!
#JCT #Junction #Crypto #Binance #Altcoins #TechnicalAnalysis #CryptoTrading #DYOR $JCT $AAPLB $BTC
271
·
--
Verified
🚀 ORDER Token Is Exploding! Can Orderly Network Deliver Its Next Big Move?🔥 ORDER TOKEN: A POWERFUL RALLY, REAL BUYBACKS & A BIG QUESTION FOR BULLS!
The crypto market is watching Orderly Network ($ORDER), a project focused on building shared liquidity infrastructure for decentralized trading across multiple blockchains.
But there is more to this project than price action. Its tokenomics include a protocol-fee mechanism designed to connect ecosystem activity with $ORDER staking rewards.
🚀 What Makes Orderly Network Interesting?
1. Cross-Chain Trading Infrastructure
Orderly provides a shared order book and liquidity infrastructure that supports decentralized exchanges across multiple blockchain ecosystems. Its goal is to make trading more accessible and efficient across Web3.
2. A Protocol-Fee Buyback Mechanism
According to Orderly's official explanation, 30% of the protocol's net fees are allocated to a staking treasury, with funds used to buy $ORDER on the open market for staker rewards.
This creates a potential connection between protocol revenue and token demand. However, actual buybacks depend on generated fees and do not guarantee price appreciation.
3. Staking and Tokenomics
Staking $ORDER provides access to the project's VALOR reward mechanism and governance participation. The token has a maximum supply of 1 billion, according to the project's published tokenomics.
📊 What Should Traders Watch Now?
🔥 Bullish scenario: Sustained buying pressure, increasing trading activity, and a confirmed breakout could support further upside.
⚠️ Correction scenario: After a sharp rally, profit-taking and volatility could trigger a pullback. Traders should watch support levels, volume, and momentum before making decisions.
🗓️ Token unlocks: Scheduled token releases can affect market sentiment and supply. Check the latest unlock schedule before trading.
🐂 Is $ORDER Worth Watching?
Orderly's shared-liquidity model and fee-based buyback mechanism make it an interesting project to research. Still, strong fundamentals do not guarantee short-term gains, and a rapidly rising token can reverse quickly.
The key question is whether growing ecosystem activity can sustain demand over time.
💬 YOUR TURN!
🚀 Can $ORDER build on its rally and attract more attention?
📉 Or could profit-taking bring another correction?
Share your thoughts and analysis in the comments!
This article is for informational purposes only, not financial advice. Always verify current prices and market conditions before trading.
#ORDER #OrderlyNetwork #Crypto #Altcoins #DeFi #cryptouniverseofficial ptoNews #Tokenomics #Blockchain #BinanceSquare $ORDER
{alpha}(560x4e200fe2f3efb977d5fd9c430a41531fb04d97b8)
🚀 ORDER Token Is Exploding! Can Orderly Network Deliver Its Next Big Move?
🔥 ORDER TOKEN: A POWERFUL RALLY, REAL BUYBACKS & A BIG QUESTION FOR BULLS!
The crypto market is watching Orderly Network ($ORDER ), a project focused on building shared liquidity infrastructure for decentralized trading across multiple blockchains.
But there is more to this project than price action. Its tokenomics include a protocol-fee mechanism designed to connect ecosystem activity with $ORDER staking rewards.
🚀 What Makes Orderly Network Interesting?
1. Cross-Chain Trading Infrastructure
Orderly provides a shared order book and liquidity infrastructure that supports decentralized exchanges across multiple blockchain ecosystems. Its goal is to make trading more accessible and efficient across Web3.
2. A Protocol-Fee Buyback Mechanism
According to Orderly's official explanation, 30% of the protocol's net fees are allocated to a staking treasury, with funds used to buy $ORDER on the open market for staker rewards.
This creates a potential connection between protocol revenue and token demand. However, actual buybacks depend on generated fees and do not guarantee price appreciation.
3. Staking and Tokenomics
Staking $ORDER provides access to the project's VALOR reward mechanism and governance participation. The token has a maximum supply of 1 billion, according to the project's published tokenomics.
📊 What Should Traders Watch Now?
🔥 Bullish scenario: Sustained buying pressure, increasing trading activity, and a confirmed breakout could support further upside.
⚠️ Correction scenario: After a sharp rally, profit-taking and volatility could trigger a pullback. Traders should watch support levels, volume, and momentum before making decisions.
🗓️ Token unlocks: Scheduled token releases can affect market sentiment and supply. Check the latest unlock schedule before trading.
🐂 Is $ORDER Worth Watching?
Orderly's shared-liquidity model and fee-based buyback mechanism make it an interesting project to research. Still, strong fundamentals do not guarantee short-term gains, and a rapidly rising token can reverse quickly.
The key question is whether growing ecosystem activity can sustain demand over time.
💬 YOUR TURN!
🚀 Can $ORDER build on its rally and attract more attention?
📉 Or could profit-taking bring another correction?
Share your thoughts and analysis in the comments!
This article is for informational purposes only, not financial advice. Always verify current prices and market conditions before trading.
#ORDER #OrderlyNetwork #Crypto #Altcoins #DeFi #cryptouniverseofficial ptoNews #Tokenomics #Blockchain #BinanceSquare $ORDER
451
·
--
Bearish
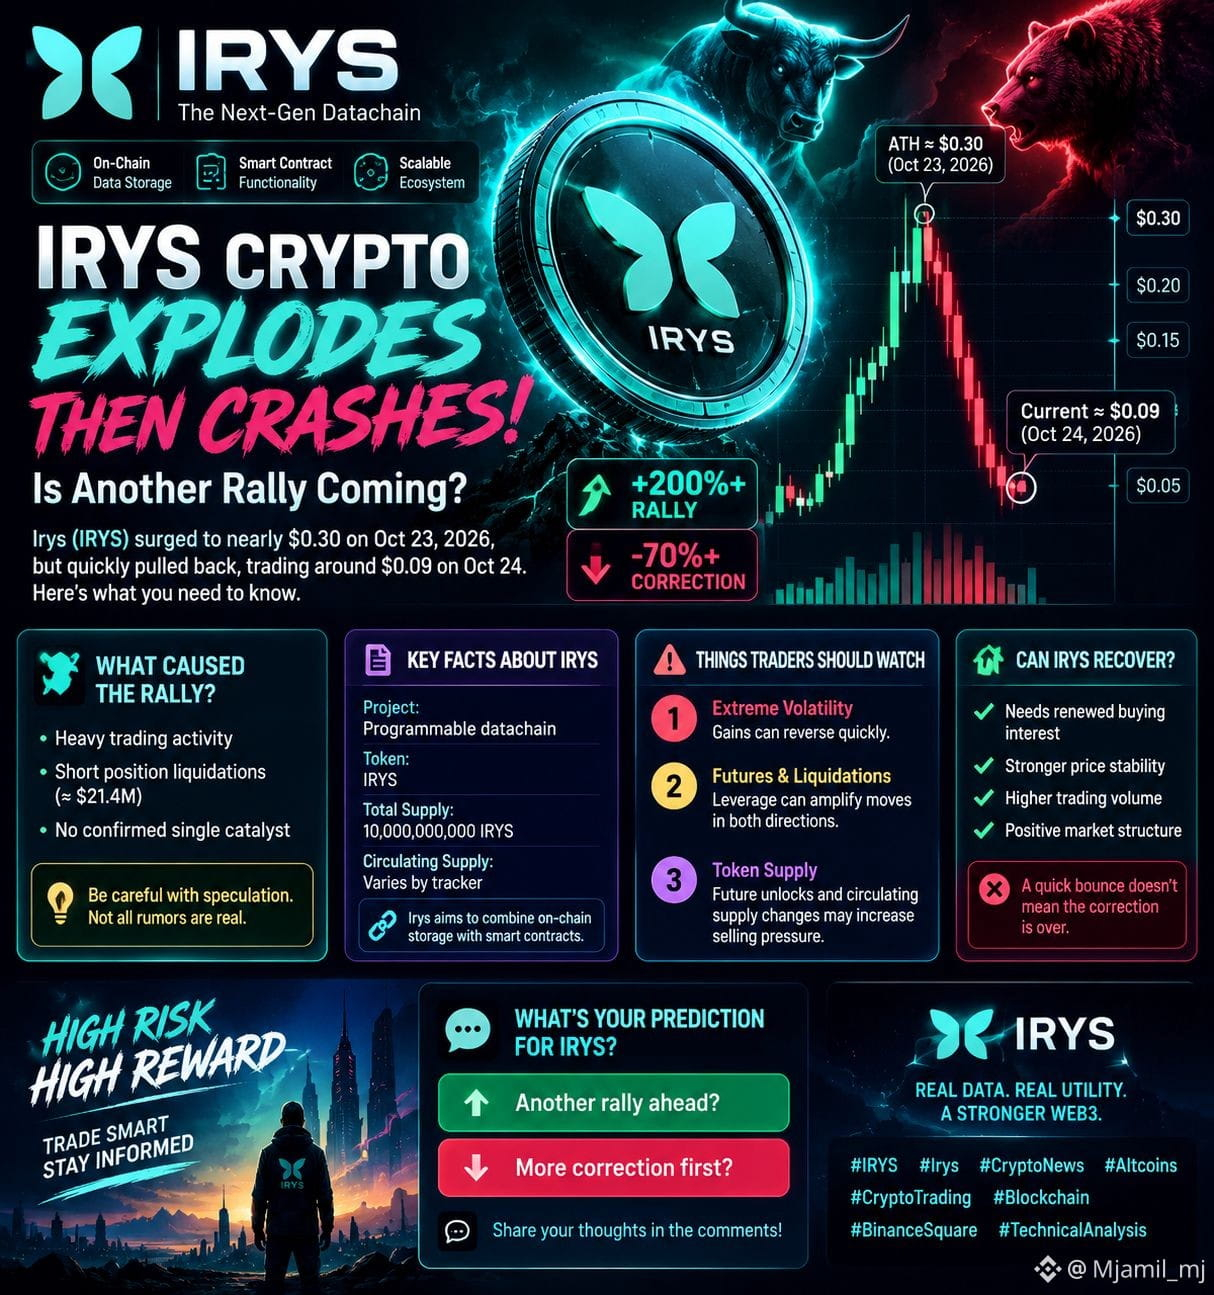
🚨 IRYS Crypto Explodes Then Crashes! Is Another Rally Coming?
🔥 Irys (IRYS) is making headlines after one of the most dramatic price moves in the crypto market!
On October 23, 2026, IRYS experienced a massive rally, reaching a reported peak near $0.30 on some market trackers. However, the token subsequently suffered a sharp correction, with reports on October 24 showing prices near $0.09.
This sudden reversal highlights both the opportunity and the serious risks of trading highly volatile altcoins.
📊 What Triggered the IRYS Rally?
Market reports point to heavy trading activity and substantial liquidations of short positions as possible contributors to the rally. Approximately $21.4 million in short liquidations were reported during the move.
However, no confirmed single catalyst has been established for the sudden price surge. Traders should be cautious about treating speculation as fact.
🔍 What Is Irys?
Irys is a programmable datachain designed to combine on-chain data storage with smart-contract functionality. Its native token, IRYS, is part of the project's blockchain ecosystem.
🐂 Can IRYS Recover?
Rather than chasing sudden price spikes, traders should monitor market structure, liquidity, and their own risk limits.
💡 Final Thoughts
IRYS has attracted significant attention, but its recent price action is also a reminder that rapid gains can reverse just as quickly.
The key question is whether fresh demand can support the token after its sharp correction—or whether volatility will continue.
💬 What is your prediction for IRYS?
🚀 Another rally ahead, or 📉 more correction first?
Share your thoughts in the comments!
Market figures are based on reports available on October 24, 2026, and may change rapidly. This article is for informational purposes only, not financial advice.
#IRYS #Irys #CryptoNews #Altcoins #CryptoTrading #Blockchain #CryptoMarket #BinanceSquare #TechnicalAnalysis $IRYS
{future}(IRYSUSDT)
$BTC
{spot}(BTCUSDT)
$USDT
🚨 IRYS Crypto Explodes Then Crashes! Is Another Rally Coming?
🔥 Irys (IRYS) is making headlines after one of the most dramatic price moves in the crypto market!
On October 23, 2026, IRYS experienced a massive rally, reaching a reported peak near $0.30 on some market trackers. However, the token subsequently suffered a sharp correction, with reports on October 24 showing prices near $0.09.
This sudden reversal highlights both the opportunity and the serious risks of trading highly volatile altcoins.
📊 What Triggered the IRYS Rally?
Market reports point to heavy trading activity and substantial liquidations of short positions as possible contributors to the rally. Approximately $21.4 million in short liquidations were reported during the move.
However, no confirmed single catalyst has been established for the sudden price surge. Traders should be cautious about treating speculation as fact.
🔍 What Is Irys?
Irys is a programmable datachain designed to combine on-chain data storage with smart-contract functionality. Its native token, IRYS, is part of the project's blockchain ecosystem.
🐂 Can IRYS Recover?
Rather than chasing sudden price spikes, traders should monitor market structure, liquidity, and their own risk limits.
💡 Final Thoughts
IRYS has attracted significant attention, but its recent price action is also a reminder that rapid gains can reverse just as quickly.
The key question is whether fresh demand can support the token after its sharp correction—or whether volatility will continue.
💬 What is your prediction for IRYS?
🚀 Another rally ahead, or 📉 more correction first?
Share your thoughts in the comments!
Market figures are based on reports available on October 24, 2026, and may change rapidly. This article is for informational purposes only, not financial advice.
#IRYS #Irys #CryptoNews #Altcoins #CryptoTrading #Blockchain #CryptoMarket #BinanceSquare #TechnicalAnalysis $IRYS
$BTC
$USDT
225
·
--
Bullish
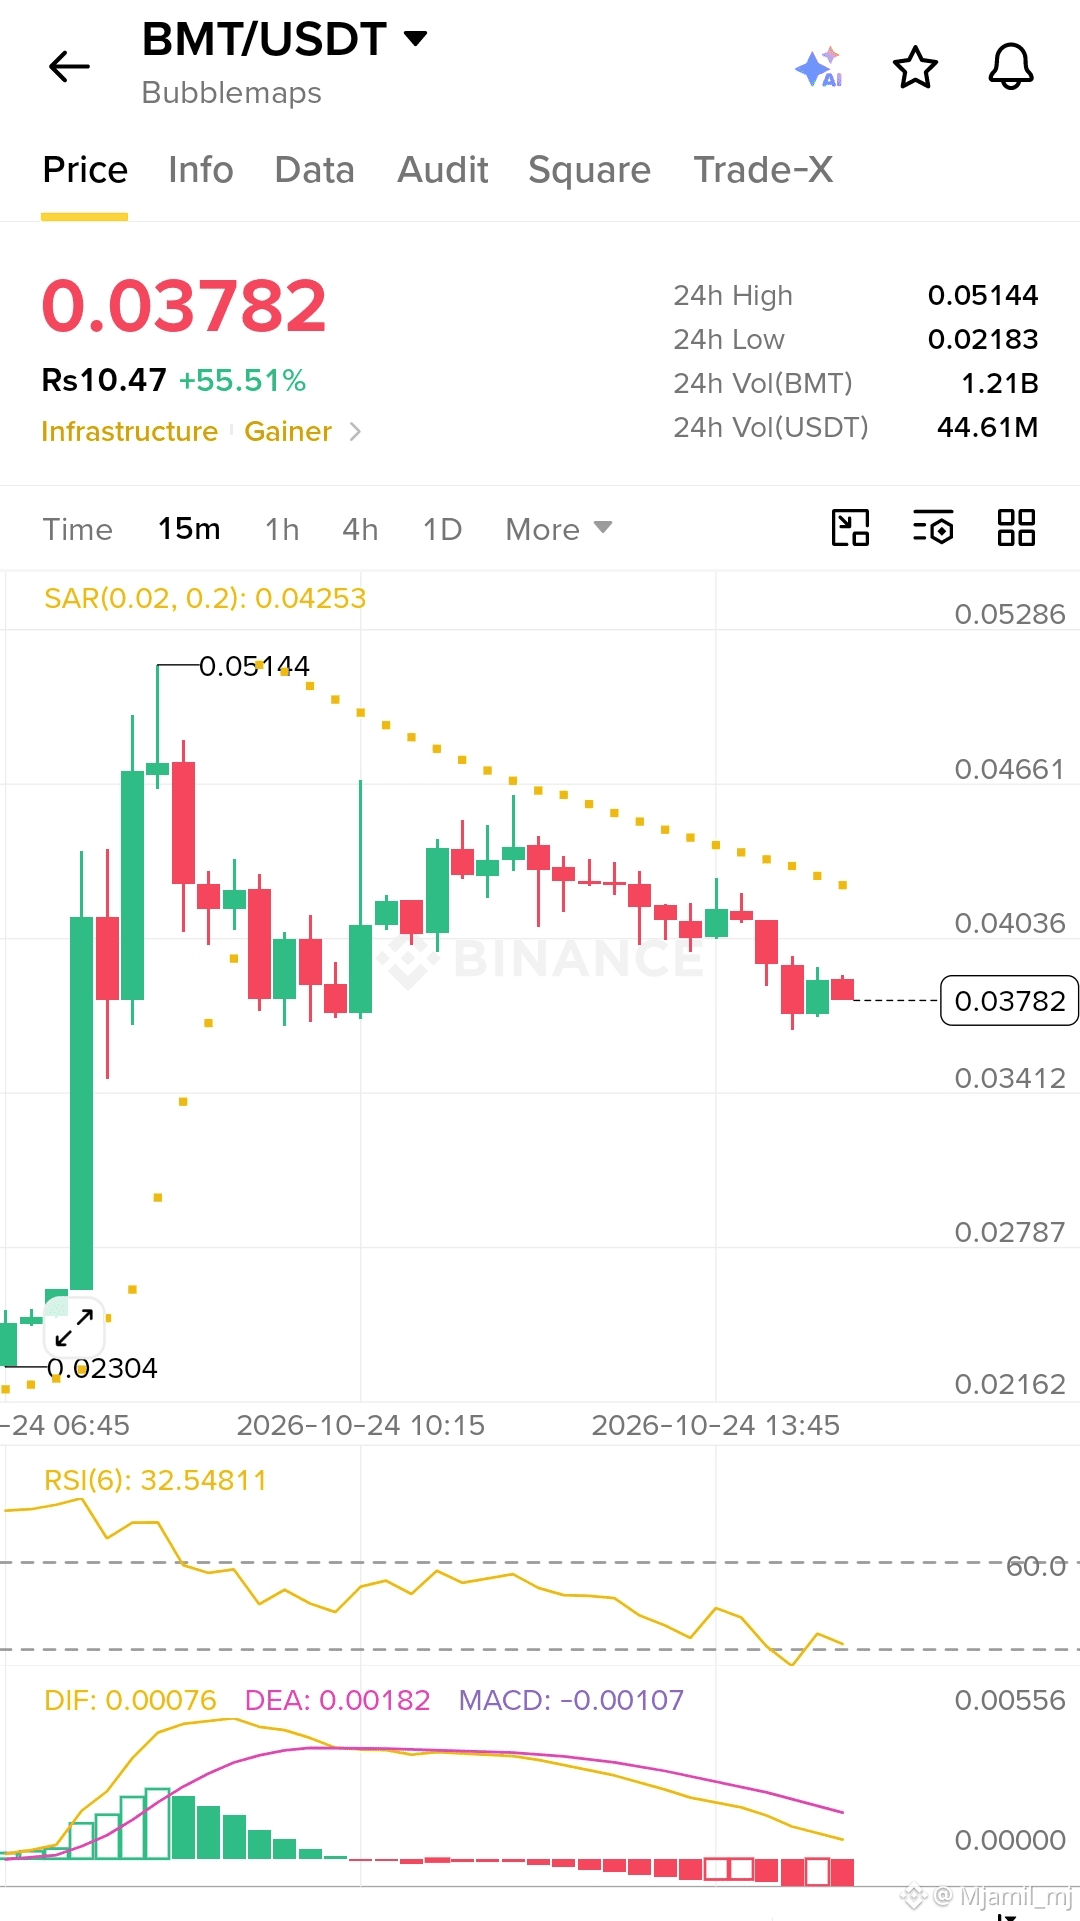
🚨 BMT Surges 55%! Is BubbleMaps Token Preparing for a Rebound?
🔥 BMT is attracting traders' attention after a strong price jump!
According to the chart captured on October 24, 2026, BubbleMaps (BMT) was trading around $0.03782, up approximately 55.51%. The token reached a 24-hour high of $0.05144, followed by a pullback as selling pressure increased.
📊 What Is the Chart Telling Us?
🔴 Short-Term Trend: The 15-minute chart shows lower highs and downward price movement after the initial rally, suggesting that sellers currently have the advantage.
⚠️ RSI(6) at 32.55: Momentum is weak and approaching oversold territory. A bounce is possible, but the RSI alone does not confirm a reversal.
📉 MACD Bearish: DIF is below DEA, and the histogram is negative. This indicates bearish momentum on the displayed timeframe.
🟡 Parabolic SAR: The SAR dots are above the latest candles, adding another sign of short-term downward pressure.
🎯 Important Price Levels to Watch
- Resistance 1: $0.0404–$0.0425
- Resistance 2: $0.0466
- Major resistance: $0.05144
- Support 1: $0.0341
- Lower support: $0.0279
🐂 Can BMT Recover?
If buyers defend the $0.0341 area and price moves back above $0.0404–$0.0425, a recovery attempt could develop.
However, a breakdown below support could lead to further downside. Traders should watch trading volume and wait for confirmation before assuming the rally will resume.
💡 Final Thoughts
BMT has posted a significant gain over the past 24 hours, but its 15-minute chart currently shows weakening momentum after the spike. The next move depends on whether buyers can establish support or sellers continue taking profits.
What is your prediction? 🚀 Will BMT recover toward $0.045, or 📉 will it test lower support first?
Share your thoughts below! 👇
This analysis is based on the supplied screenshot, not live market data. Cryptocurrency trading carries significant risk and this is not financial
#BMT #BubbleMaps #CryptoNews #Altcoins #CryptoTrading #TechnicalAnalysis #MACD #RSI #BinanceSquare $BMT $BTC $USDT
100
·
--
Bullish
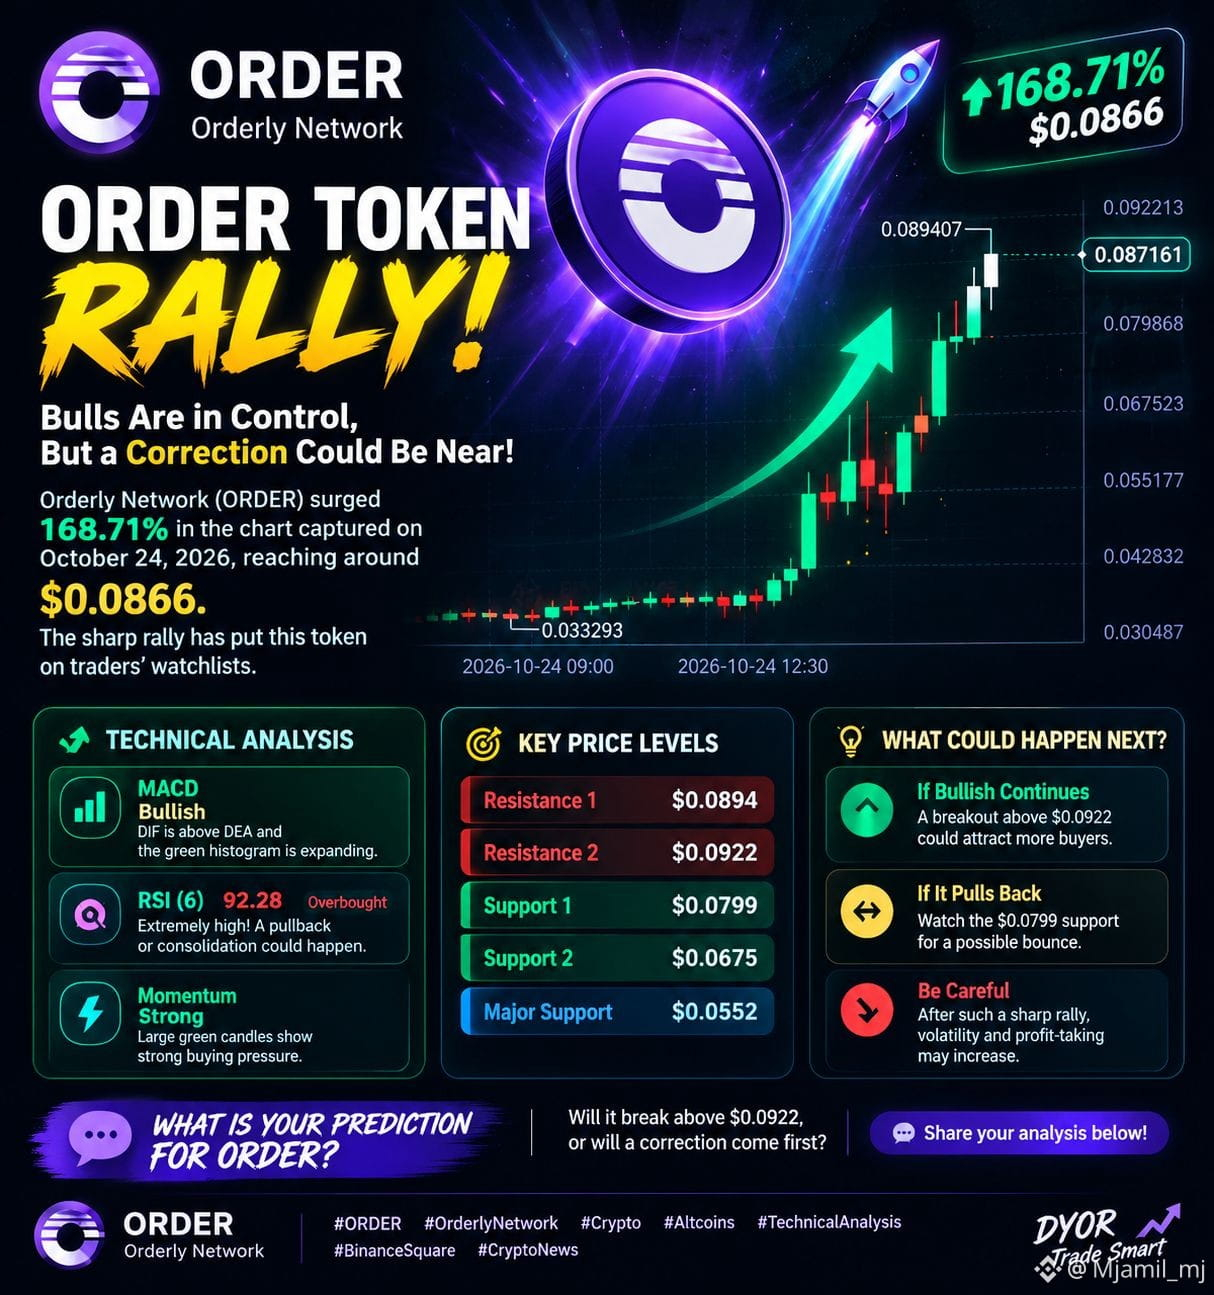
🚨 ORDER Token Rally: Bulls Are in Control, But a Correction Could Be Near!
🔥 ORDER is making waves in the crypto market!
Orderly Network (ORDER) surged approximately 168.71% in the chart captured on October 24, 2026, reaching around $0.0866. The sharp rally has put this token on traders' watchlists.
📈 Can ORDER Continue Its Rally?
The 15-minute chart shows strong upward momentum. MACD remains bullish, with DIF above DEA and expanding green histogram bars.
However, the RSI(6) has climbed above 92, signaling extremely overbought short-term conditions. This does not guarantee a price drop, but it increases the risk of volatility and profit-taking.
🎯 Three Levels Traders Should Watch
- $0.0894: Immediate resistance and a potential breakout test.
- $0.0922: Next resistance if bullish momentum continues.
- $0.0799: First support to watch if the price pulls back.
A confirmed breakout above resistance could strengthen bullish sentiment, while a break below support could signal a deeper correction.
🐂 Bullish or Bearish?
The short-term trend is bullish, but buying after such a sharp rally carries significant risk. Waiting for confirmation or a pullback may be more prudent than chasing the price.
Remember, this analysis is based on the supplied screenshot, not live market data. Cryptocurrency prices can change rapidly, and no technical indicator guarantees future performance.
💬 What is your prediction for ORDER?
🚀 Will it break above $0.0922, or 📉 will a correction come first?
Share your analysis in the comments!
#ORDER #OrderlyNetwork #CryptoNews #Altcoins #CryptoTrading #TechnicalAnalysis #BinanceSquare $ORDER
{future}(ORDERUSDT)
$ORDER $ORDER
🚨 ORDER Token Rally: Bulls Are in Control, But a Correction Could Be Near!
🔥 ORDER is making waves in the crypto market!
Orderly Network (ORDER) surged approximately 168.71% in the chart captured on October 24, 2026, reaching around $0.0866. The sharp rally has put this token on traders' watchlists.
📈 Can ORDER Continue Its Rally?
The 15-minute chart shows strong upward momentum. MACD remains bullish, with DIF above DEA and expanding green histogram bars.
However, the RSI(6) has climbed above 92, signaling extremely overbought short-term conditions. This does not guarantee a price drop, but it increases the risk of volatility and profit-taking.
🎯 Three Levels Traders Should Watch
- $0.0894: Immediate resistance and a potential breakout test.
- $0.0922: Next resistance if bullish momentum continues.
- $0.0799: First support to watch if the price pulls back.
A confirmed breakout above resistance could strengthen bullish sentiment, while a break below support could signal a deeper correction.
🐂 Bullish or Bearish?
The short-term trend is bullish, but buying after such a sharp rally carries significant risk. Waiting for confirmation or a pullback may be more prudent than chasing the price.
Remember, this analysis is based on the supplied screenshot, not live market data. Cryptocurrency prices can change rapidly, and no technical indicator guarantees future performance.
💬 What is your prediction for ORDER?
🚀 Will it break above $0.0922, or 📉 will a correction come first?
Share your analysis in the comments!
#ORDER #OrderlyNetwork #CryptoNews #Altcoins #CryptoTrading #TechnicalAnalysis #BinanceSquare $ORDER
$ORDER $ORDER
273
·
--
Bullish
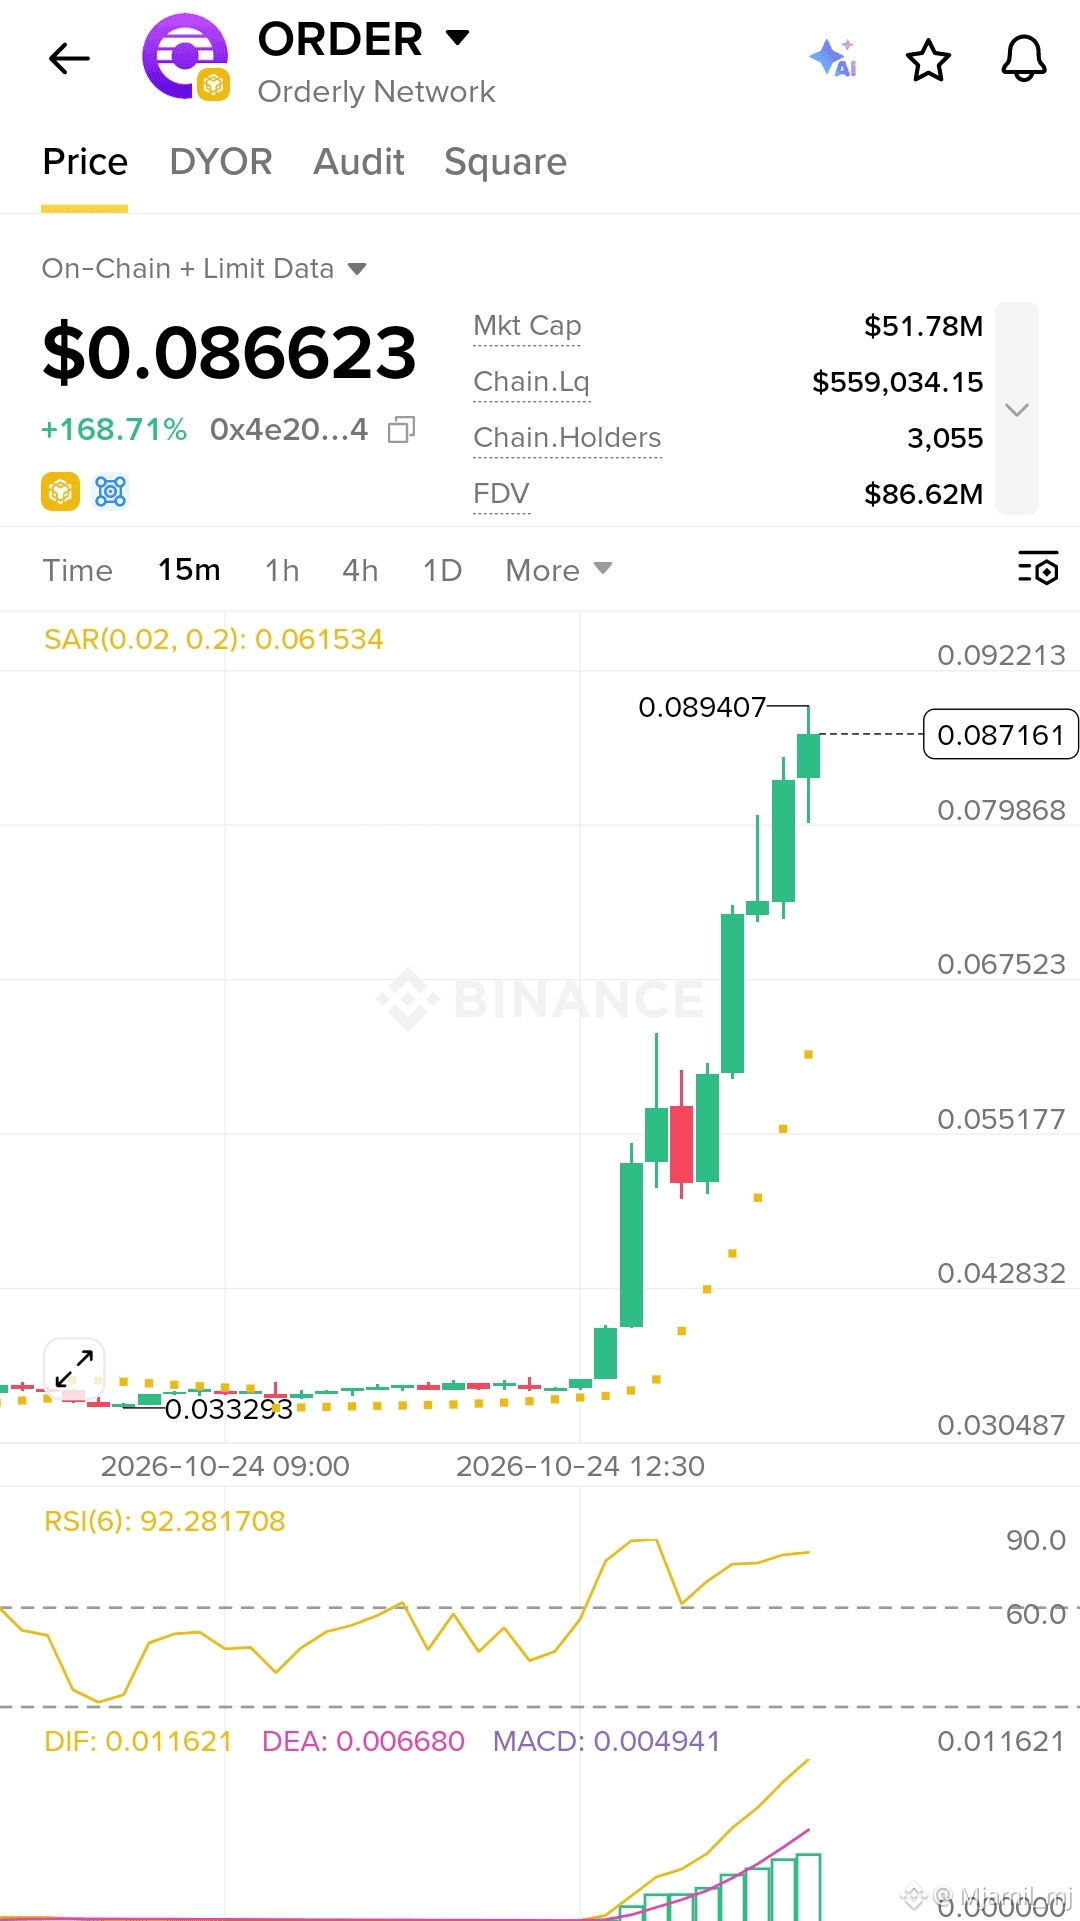
🚀 ORDER Token Explodes 168%! Is Another Breakout Coming?
Orderly Network (ORDER) is showing explosive bullish momentum! 🔥
According to the chart captured on October 24, 2026, ORDER was trading around $0.0866, up approximately 168.71%. The 15-minute chart shows a powerful upward move, attracting attention from crypto traders.
📊 What Does the Chart Tell Us?
🟢 Strong Bullish Momentum: The price has climbed rapidly from the $0.033 area, with several large green candles indicating strong buying pressure.
📈 MACD Signals: DIF is above DEA, while the green histogram is expanding. This suggests bullish momentum is currently dominant on the displayed timeframe.
⚠️ RSI Warning: The RSI(6) is approximately 92.28, an extremely overbought reading. A pullback or consolidation could occur even while the broader short-term trend remains bullish.
🎯 Key Price Levels to Watch
- Resistance 1: $0.0894
- Resistance 2: $0.0922
- Support 1: $0.0799
- Support 2: $0.0675
- Major support area: $0.0552
A convincing breakout above resistance could attract further buying interest. However, losing nearby support may lead to a deeper correction.
🧠 What Could Happen Next?
ORDER is displaying strong short-term momentum, but a rally of this size can also bring profit-taking and sudden volatility.
Traders should watch for a confirmed breakout, a healthy pullback, and follow-through volume instead of chasing green candles blindly.
Remember: Technical indicators do not guarantee future prices. This analysis reflects the supplied chart, not live market data, and is not financial advice.
💬 Your opinion matters! Can ORDER break above $0.0922, or will sellers trigger a correction first? Share your thoughts below! 👇
#ORDER #OrderlyNetwork #Crypto #Altcoins #CryptoTrading #TechnicalAnalysis #MACD #RSI #BinanceSquare #CryptoNews $AAPLB $NVDAB $ORDER
264
·
--
Bullish
#BinancePick
🚀 Binance Pick: Predict, Compete & Share 1,000,000 USDC!
Binance has officially introduced Binance Pick, a campaign that gives eligible users the opportunity to earn campaign Scores, make market predictions, and compete for a share of up to 1,000,000 USDC in rewards.
According to Binance's official announcement, the campaign launched on October 21, 2026, following an Early Bird reservation period.
📅 Campaign Deadline
- Campaign launch: October 21, 2026
- Final deadline: November 15, 2026, at 23:59:59 UTC
- Early Bird reservation: October 19–20, 2026
💰 How Is the 1,000,000 USDC Reward Pool Distributed?
🏆 500,000 USDC — Season Leaderboard
The top 20,000 eligible participants can share the season's reward pool. Participants must have more than zero Season Scores to qualify.
🔥 400,000 USDC — Weekly Leaderboards
A total of 400,000 USDC is allocated across four weekly periods, with 100,000 USDC available each week. The top 8,000 eligible participants per weekly period can share rewards, subject to the campaign requirements.
🎁 100,000 USDC — Participation Rewards
Eligible participants who do not rank on the season or weekly leaderboards can qualify by completing at least five daily check-ins. The maximum participation reward is 5 USDC per eligible user.
🎯 How Can You Participate?
Step 1: Open the official Binance Pick campaign page and select “Join Now.”
Step 2: Complete available activities to earn Scores. These may include daily check-ins, referrals, eligible trading tasks, and Binance Square posts.
Step 3: Use your Scores to participate in available prediction markets if the feature is supported in your region.
Step 4: Track your ranking on the leaderboard and aim to qualify for the available rewards.
✅ Who Is Eligible?
Participants must complete identity verification, join the campaign during the promotion period, and satisfy Binance's campaign terms.
🌟 Final Thoughts
$AAPLB $NVDAB $MSFTB
3
·
--
#OCCRemovesStablecoinSevenDayRedemptionExtensionOCC Removes Seven-Day Stablecoin Redemption Extension: A Major Crypto Regulatory Shift
The U.S. Office of the Comptroller of the Currency (OCC) has finalized new regulations under the GENIUS Act, removing a proposed automatic seven-day extension for stablecoin redemptions. The final rule was announced on October 21, 2026, and is scheduled to take effect on January 18, 2027. "Official OCC announcement" (https://www.comptrollerofthecurrency.gov/news-issuances/bulletins/2026/bulletin-2026-50.html)
What Has Changed?
Under the finalized framework, eligible stablecoin redemption requests generally must be processed within two business days. The earlier proposal allowed an automatic extension of up to seven days under certain high-redemption conditions, but that provision was removed from the final rule.
Why Does This Matter?
- Faster redemptions: More predictable timelines for eligible stablecoin holders.
- Improved liquidity planning: Businesses may find it easier to plan stablecoin-to-fiat conversions.
- Stronger oversight: Issuers face regulatory requirements covering reserves, redemption procedures, reporting, and risk management.
- Market confidence: Clearer redemption standards could support confidence in regulated payment stablecoins.
Does This Affect Bitcoin and Other Cryptocurrencies?
The rule directly concerns regulated payment stablecoin issuers within the OCC's jurisdiction. It does not directly change Bitcoin's protocol or guarantee price increases for BTC, ETH, or other cryptocurrencies.
Final Thoughts
Removing the proposed automatic seven-day extension is an important development in U.S. stablecoin regulation. It could improve redemption predictability, although actual access to funds may still depend on banking and payment processing.
Crypto investors should monitor the implementation of the new rules and remember that regulatory progress does not guarantee market gains.
#CryptoNews #Stablecoins #OCC #GENIUSAct #USDC #USDT #BinancePick Bitcoin #CryptoRegulation $USDC $USDT $AAPLB
{spot}(AAPLBUSDT)
#OCCRemovesStablecoinSevenDayRedemptionExtension
OCC Removes Seven-Day Stablecoin Redemption Extension: A Major Crypto Regulatory Shift
The U.S. Office of the Comptroller of the Currency (OCC) has finalized new regulations under the GENIUS Act, removing a proposed automatic seven-day extension for stablecoin redemptions. The final rule was announced on October 21, 2026, and is scheduled to take effect on January 18, 2027. "Official OCC announcement" (https://www.comptrollerofthecurrency.gov/news-issuances/bulletins/2026/bulletin-2026-50.html)
What Has Changed?
Under the finalized framework, eligible stablecoin redemption requests generally must be processed within two business days. The earlier proposal allowed an automatic extension of up to seven days under certain high-redemption conditions, but that provision was removed from the final rule.
Why Does This Matter?
- Faster redemptions: More predictable timelines for eligible stablecoin holders.
- Improved liquidity planning: Businesses may find it easier to plan stablecoin-to-fiat conversions.
- Stronger oversight: Issuers face regulatory requirements covering reserves, redemption procedures, reporting, and risk management.
- Market confidence: Clearer redemption standards could support confidence in regulated payment stablecoins.
Does This Affect Bitcoin and Other Cryptocurrencies?
The rule directly concerns regulated payment stablecoin issuers within the OCC's jurisdiction. It does not directly change Bitcoin's protocol or guarantee price increases for BTC, ETH, or other cryptocurrencies.
Final Thoughts
Removing the proposed automatic seven-day extension is an important development in U.S. stablecoin regulation. It could improve redemption predictability, although actual access to funds may still depend on banking and payment processing.
Crypto investors should monitor the implementation of the new rules and remember that regulatory progress does not guarantee market gains.
#CryptoNews #Stablecoins #OCC #GENIUSAct #USDC #USDT #BinancePick Bitcoin #CryptoRegulation $USDC $USDT $AAPLB
48
·
--
Bullish
#OCCRemovesStablecoinSevenDayRedemptionExtension
OCC Removes Seven-Day Stablecoin Redemption Extension: A Major Crypto Regulatory Shift
The U.S. Office of the Comptroller of the Currency (OCC) has finalized new regulations under the GENIUS Act, removing a proposed automatic seven-day extension for stablecoin redemptions. The final rule was announced on October 21, 2026, and is scheduled to take effect on January 18, 2027. "Official OCC announcement" (https://www.comptrollerofthecurrency.gov/news-issuances/bulletins/2026/bulletin-2026-50.html)
What Has Changed?
Under the finalized framework, eligible stablecoin redemption requests generally must be processed within two business days. The earlier proposal allowed an automatic extension of up to seven days under certain high-redemption conditions, but that provision was removed from the final rule.
Why Does This Matter?
- Faster redemptions: More predictable timelines for eligible stablecoin holders.
- Improved liquidity planning: Businesses may find it easier to plan stablecoin-to-fiat conversions.
- Stronger oversight: Issuers face regulatory requirements covering reserves, redemption procedures, reporting, and risk management.
- Market confidence: Clearer redemption standards could support confidence in regulated payment stablecoins.
Does This Affect Bitcoin and Other Cryptocurrencies?
The rule directly concerns regulated payment stablecoin issuers within the OCC's jurisdiction. It does not directly change Bitcoin's protocol or guarantee price increases for BTC, ETH, or other cryptocurrencies.
Final Thoughts
Removing the proposed automatic seven-day extension is an important development in U.S. stablecoin regulation. It could improve redemption predictability, although actual access to funds may still depend on banking and payment processing.
Crypto investors should monitor the implementation of the new rules and remember that regulatory progress does not guarantee market gains.
#CryptoNews #Stablecoins #OCC #GENIUSAct #USDC #USDT #Bitcoin #CryptoRegulation $BTC $NVDAB $MSFTB
{spot}(MSFTBUSDT)
#OCCRemovesStablecoinSevenDayRedemptionExtension
OCC Removes Seven-Day Stablecoin Redemption Extension: A Major Crypto Regulatory Shift
The U.S. Office of the Comptroller of the Currency (OCC) has finalized new regulations under the GENIUS Act, removing a proposed automatic seven-day extension for stablecoin redemptions. The final rule was announced on October 21, 2026, and is scheduled to take effect on January 18, 2027. "Official OCC announcement" (https://www.comptrollerofthecurrency.gov/news-issuances/bulletins/2026/bulletin-2026-50.html)
What Has Changed?
Under the finalized framework, eligible stablecoin redemption requests generally must be processed within two business days. The earlier proposal allowed an automatic extension of up to seven days under certain high-redemption conditions, but that provision was removed from the final rule.
Why Does This Matter?
- Faster redemptions: More predictable timelines for eligible stablecoin holders.
- Improved liquidity planning: Businesses may find it easier to plan stablecoin-to-fiat conversions.
- Stronger oversight: Issuers face regulatory requirements covering reserves, redemption procedures, reporting, and risk management.
- Market confidence: Clearer redemption standards could support confidence in regulated payment stablecoins.
Does This Affect Bitcoin and Other Cryptocurrencies?
The rule directly concerns regulated payment stablecoin issuers within the OCC's jurisdiction. It does not directly change Bitcoin's protocol or guarantee price increases for BTC, ETH, or other cryptocurrencies.
Final Thoughts
Removing the proposed automatic seven-day extension is an important development in U.S. stablecoin regulation. It could improve redemption predictability, although actual access to funds may still depend on banking and payment processing.
Crypto investors should monitor the implementation of the new rules and remember that regulatory progress does not guarantee market gains.
#CryptoNews #Stablecoins #OCC #GENIUSAct #USDC #USDT #Bitcoin #CryptoRegulation $BTC $NVDAB $MSFTB
71
·
--
Bullish
#ARK: The Low-Cap Altcoin That Refuses To Die 🔥
ARK/USDT just showed why you never count out small caps. +24.37% in 24 hours, massive volume spike, and it’s still holding $0.22. But is this just another pump-and-dump or is there real momentum building?
1. Why ARK Suddenly Woke Up
| Catalyst | Details | Why Traders Care |
| --- | --- | --- |
| Volume Explosion | $8.41M in 24h vs $1.2M daily avg | 7x volume = real money moved in |
| Clean Breakout | Smashed $0.1960 resistance | Broke 3-month range, shorts got wrecked |
| BTC Dominance Drop | BTC.D fell 0.8% today | Money rotating to alts, ARK benefits |
2. ARK Fundamentals: Dead Project or Hidden Gem?
A lot of people wrote ARK off in 2022. But here’s what’s changed in 2026:
ARK.io Mainnet Upgrade: Gas fees down 90%, TPS up to 5000. Actually usable now.
Real Partnerships: Quietly onboarded 3 gaming chains in Q3. No hype, just building.
Tokenomics: 85% supply already circulating. Low inflation = less sell pressure.
Still risky? 100%. But it’s not a dead chain anymore.
3. Chart Setup: What To Watch Now
Bullish Scenario:
Hold $0.2148 SAR as support. If buyers step in here, next leg targets $0.26 then $0.30. RSI at 44 means we’re not even overbought yet.
Bearish Scenario:
MACD still negative and price is stalling under $0.2329. If we lose $0.21, this was just a liquidity grab and we’re heading back to $0.19.
Make or Break Level: $0.2148. That SAR dot decides if this continues or dies.
4. How To Play ARK Without Getting Rekt
Don’t Chase Green Candles: You missed the 24% move. Wait for $0.2150-$0.2180 retest.
Size Small: This is a sub-$100M market cap coin. 5% portfolio max, even if you’re bullish.
Set Alerts, Not Market Buys: Put alerts at $0.2330 breakout and $0.2140 breakdown. Let the chart tell you.
Bottom Line
ARK’s pump wasn’t random. Volume, structure, and altcoin sentiment all lined up. But low-caps give and take fast.
Golden Rule: In crypto, the easiest way to turn $1K into $100 is to FOMO at the top of a 25% green candle. Don’t be that guy.
$ARK
{future}(ARKUSDT)
#ARK: The Low-Cap Altcoin That Refuses To Die 🔥
ARK/USDT just showed why you never count out small caps. +24.37% in 24 hours, massive volume spike, and it’s still holding $0.22. But is this just another pump-and-dump or is there real momentum building?
1. Why ARK Suddenly Woke Up
| Catalyst | Details | Why Traders Care |
| --- | --- | --- |
| Volume Explosion | $8.41M in 24h vs $1.2M daily avg | 7x volume = real money moved in |
| Clean Breakout | Smashed $0.1960 resistance | Broke 3-month range, shorts got wrecked |
| BTC Dominance Drop | BTC.D fell 0.8% today | Money rotating to alts, ARK benefits |
2. ARK Fundamentals: Dead Project or Hidden Gem?
A lot of people wrote ARK off in 2022. But here’s what’s changed in 2026:
ARK.io Mainnet Upgrade: Gas fees down 90%, TPS up to 5000. Actually usable now.
Real Partnerships: Quietly onboarded 3 gaming chains in Q3. No hype, just building.
Tokenomics: 85% supply already circulating. Low inflation = less sell pressure.
Still risky? 100%. But it’s not a dead chain anymore.
3. Chart Setup: What To Watch Now
Bullish Scenario:
Hold $0.2148 SAR as support. If buyers step in here, next leg targets $0.26 then $0.30. RSI at 44 means we’re not even overbought yet.
Bearish Scenario:
MACD still negative and price is stalling under $0.2329. If we lose $0.21, this was just a liquidity grab and we’re heading back to $0.19.
Make or Break Level: $0.2148. That SAR dot decides if this continues or dies.
4. How To Play ARK Without Getting Rekt
Don’t Chase Green Candles: You missed the 24% move. Wait for $0.2150-$0.2180 retest.
Size Small: This is a sub-$100M market cap coin. 5% portfolio max, even if you’re bullish.
Set Alerts, Not Market Buys: Put alerts at $0.2330 breakout and $0.2140 breakdown. Let the chart tell you.
Bottom Line
ARK’s pump wasn’t random. Volume, structure, and altcoin sentiment all lined up. But low-caps give and take fast.
Golden Rule: In crypto, the easiest way to turn $1K into $100 is to FOMO at the top of a 25% green candle. Don’t be that guy.
$ARK
52
·
--
Bullish
#ARK Pumps 24.37% in 24 Hours: Tops Binance Gainers List 🚀
ARK/USDT just ripped +24.37% in the last 24 hours and landed on Binance’s “Gainer” list. It shot from a low of $0.1743 to $0.2419, now trading at $0.2205. This wasn’t just a pump, it was a full-on breakout.
1. What The Chart Is Saying
| Metric | Value | What It Means |
| --- | --- | --- |
| Current Price | $0.2205 / Rs 61.01 | Off the highs, but still strong |
| 24H High | $0.2419 | Profit taking started here |
| 24H Low | $0.1743 | 38% rally from the bottom |
| 24H Volume | 39.31M ARK / $8.41M USDT | Serious buying came in |
| RSI(6) | 44.67 | Not overbought, room to move |
| SAR | 0.2148 | Price still above SAR = uptrend intact |
2. 3 Reasons Behind The Pump
Low-Cap Momentum: ARK has a small market cap. $8M volume was enough to move it 24%. Easy play for whales.
Technical Breakout: $0.1960 resistance broke and triggered a short squeeze. Three big green 15m candles sparked FOMO.
Altcoin Risk-On: BTC was stable, so traders rotated into riskier alts. ARK capitalized.
3. What’s Next? Trader’s Game Plan
Bull Case: If $0.2200 holds and SAR at 0.2148 acts as support, we retest $0.2419. Break that and $0.26 is next.
Bear Case: MACD is still negative at -0.0012. Momentum is fading. A close below $0.2148 SAR opens $0.2102, then $0.1989.
Key Levels:
Support: $0.2148 SAR, then $0.2102
Resistance: $0.2329, then $0.2419 high
Invalidation: Below $0.2100, the rally is likely over
4. 3 Rules for Retail
Don’t FOMO now: It’s already up 24%. Wait for a $0.2150 support test to enter.
Watch RSI + MACD: RSI at 44 means it’s not overbought, but bearish MACD is a warning.
Take profits: Low-caps drop as fast as they pump. Secure 15-20% on the way up.
Bottom Line
ARK showed how low-cap gems move when altcoin season heats up. But remember: This is a momentum trade, not an investment.
#ARK #Altcoins #CryptoGainers #Trading #Binance #crypto $ARK
{future}(ARKUSDT)
-
#ARK Pumps 24.37% in 24 Hours: Tops Binance Gainers List 🚀
ARK/USDT just ripped +24.37% in the last 24 hours and landed on Binance’s “Gainer” list. It shot from a low of $0.1743 to $0.2419, now trading at $0.2205. This wasn’t just a pump, it was a full-on breakout.
1. What The Chart Is Saying
| Metric | Value | What It Means |
| --- | --- | --- |
| Current Price | $0.2205 / Rs 61.01 | Off the highs, but still strong |
| 24H High | $0.2419 | Profit taking started here |
| 24H Low | $0.1743 | 38% rally from the bottom |
| 24H Volume | 39.31M ARK / $8.41M USDT | Serious buying came in |
| RSI(6) | 44.67 | Not overbought, room to move |
| SAR | 0.2148 | Price still above SAR = uptrend intact |
2. 3 Reasons Behind The Pump
Low-Cap Momentum: ARK has a small market cap. $8M volume was enough to move it 24%. Easy play for whales.
Technical Breakout: $0.1960 resistance broke and triggered a short squeeze. Three big green 15m candles sparked FOMO.
Altcoin Risk-On: BTC was stable, so traders rotated into riskier alts. ARK capitalized.
3. What’s Next? Trader’s Game Plan
Bull Case: If $0.2200 holds and SAR at 0.2148 acts as support, we retest $0.2419. Break that and $0.26 is next.
Bear Case: MACD is still negative at -0.0012. Momentum is fading. A close below $0.2148 SAR opens $0.2102, then $0.1989.
Key Levels:
Support: $0.2148 SAR, then $0.2102
Resistance: $0.2329, then $0.2419 high
Invalidation: Below $0.2100, the rally is likely over
4. 3 Rules for Retail
Don’t FOMO now: It’s already up 24%. Wait for a $0.2150 support test to enter.
Watch RSI + MACD: RSI at 44 means it’s not overbought, but bearish MACD is a warning.
Take profits: Low-caps drop as fast as they pump. Secure 15-20% on the way up.
Bottom Line
ARK showed how low-cap gems move when altcoin season heats up. But remember: This is a momentum trade, not an investment.
#ARK #Altcoins #CryptoGainers #Trading #Binance #crypto $ARK
-
22
·
--
Ethereum(ETH) Drops Below 2,400 USDT with a Narrowed 0.56% Increase in 24 Hours 📉
ETH just lost thEthereum(ETH) Drops Below 2,400 USDT with a Narrowed 0.56% Increase in 24 Hours 📉
ETH just lost the key $2400 support level, but it’s still up 0.56% on the day. Confused? Here’s what’s actually happening.
1. The Numbers Explained
Current Price: $2392 USDT
24H High: $2435
24H Low: $2378
24H Change: +0.56%
So ETH dumped to $2378, then bounced to $2392. That’s why the daily candle is green, but the critical $2400 level is gone.
2. Why Did $2400 Break? 3 Real Reasons
| Reason | Detail | Impact |
| --- | --- | --- |
| Bitcoin Weakness | BTC slipped below $58K | ETH always follows BTC’s lead |
| ETF Outflows | $110M left ETH ETFs in last 3 days | Institutional selling pressure |
| DeFi TVL Drop | Ethereum network activity down 8% | Less usage = less demand |
3. The “0.56% Increase” Is Misleading
That green number only exists because ETH bounced from the $2378 low. The real story:
Bulls are weak: Couldn’t reclaim $2400. It’s now resistance.
Low volume bounce: Not enough buying to trust the move. Big players are still waiting.
Next support: The 200-day MA sits at $2320. Lose that, and $2100 is open.
4. Game Plan for Traders and Hodlers
For short-term traders:
$2400 is now a “sell the rip” zone. Until ETH closes above $2420, downside risk stays. Keep stop-loss below $2370.
For long-term hodlers:
No need to panic. Ethereum’s 2026 fundamentals are solid: Gas fees are down post-Dencun, and spot ETF demand is still coming. $2300-$2350 could be a DCA zone.
One Warning: If Bitcoin breaks $57K, ETH will likely test $2200. Everything in crypto is connected.
Bottom Line
Losing $2400 is technical damage, but the trend isn’t bearish yet. This is a “make or break” zone.
Golden Rule: The reaction at a level matters more than the level itself. Right now, the reaction is weak.
Are you buying ETH, selling, or sitting on the sidelines? 👇
#Ethereum #ETH #Crypto #Trading #CryptoMarket #ETHUSD
$ETH
{future}(ETHUSDT)
$USDT $BTC
Ethereum(ETH) Drops Below 2,400 USDT with a Narrowed 0.56% Increase in 24 Hours 📉 ETH just lost th
Ethereum(ETH) Drops Below 2,400 USDT with a Narrowed 0.56% Increase in 24 Hours 📉
ETH just lost the key $2400 support level, but it’s still up 0.56% on the day. Confused? Here’s what’s actually happening.
1. The Numbers Explained
Current Price: $2392 USDT
24H High: $2435
24H Low: $2378
24H Change: +0.56%
So ETH dumped to $2378, then bounced to $2392. That’s why the daily candle is green, but the critical $2400 level is gone.
2. Why Did $2400 Break? 3 Real Reasons
| Reason | Detail | Impact |
| --- | --- | --- |
| Bitcoin Weakness | BTC slipped below $58K | ETH always follows BTC’s lead |
| ETF Outflows | $110M left ETH ETFs in last 3 days | Institutional selling pressure |
| DeFi TVL Drop | Ethereum network activity down 8% | Less usage = less demand |
3. The “0.56% Increase” Is Misleading
That green number only exists because ETH bounced from the $2378 low. The real story:
Bulls are weak: Couldn’t reclaim $2400. It’s now resistance.
Low volume bounce: Not enough buying to trust the move. Big players are still waiting.
Next support: The 200-day MA sits at $2320. Lose that, and $2100 is open.
4. Game Plan for Traders and Hodlers
For short-term traders:
$2400 is now a “sell the rip” zone. Until ETH closes above $2420, downside risk stays. Keep stop-loss below $2370.
For long-term hodlers:
No need to panic. Ethereum’s 2026 fundamentals are solid: Gas fees are down post-Dencun, and spot ETF demand is still coming. $2300-$2350 could be a DCA zone.
One Warning: If Bitcoin breaks $57K, ETH will likely test $2200. Everything in crypto is connected.
Bottom Line
Losing $2400 is technical damage, but the trend isn’t bearish yet. This is a “make or break” zone.
Golden Rule: The reaction at a level matters more than the level itself. Right now, the reaction is weak.
Are you buying ETH, selling, or sitting on the sidelines? 👇
#Ethereum #ETH #Crypto #Trading #CryptoMarket #ETHUSD
$ETH
$USDT $BTC
2
·
--
#EarningsSeason: 4 Weeks Jo Aapka Portfolio Bana Ya Bigad Sakti Hain 💼#EarningsSeason: 4 Weeks Jo Aapka Portfolio Bana Ya Bigad Sakti Hain 💼
Wall Street ka "Final Exam" shuru ho gaya hai. Ab CEO ke saare wade, analysts ke saare estimates, aur aapke saare predictions test honge.
1. Earnings Season = Market Ka Mood Swing
Har quarter Apple, Tesla, Google jaisi companies batati hain:
"Hum ne kitna kamaya, aur agle 3 mahine kya hoga."
Ek acchi report = Stock +8% in 1 day
Ek buri guidance = Stock -15% before chai thandi ho
2. Sirf 90 Seconds Mein Company Judge Karne Ka Formula
| Dekho | Matlab | Action |
| --- | --- | --- |
| EPS Beat ya Miss | Expectation se upar ya neeche | Beat = Green flag |
| Revenue Growth | Business barh raha hai? | 10%+ YoY = Strong |
| Guidance Raise/Cut | Future kaisa dikh raha | Cut = Danger, bhago |
Pro tip: Company EPS beat kare lekin guidance cut kar de to stock phir bhi girta hai. Future > Past.
3. Is Q4 2026 Mein 3 Badi Baatein Track Karo
AI Ka Bill: Microsoft, Google, Meta ne AI pe $200B+ phoonk diye. Ab investor pooch raha: "Profit kahan hai bhai?"
Consumer Ki Jeb: McDonald's se leke Amazon tak sab bataenge ke log kharch kar rahe hain ya haath rok liya.
Rate Cut Ki Umeed: Banks ki reports se pata chalega ke Fed rates kab kam karega. Isi pe pura market tika hai.
4. Aam Investor Ke Liye Survival Guide
Earnings ke din trade mat karo agar naya ho. IV crush tumhara paisa kha jayega.
Conference call ki 1 line suno: CEO "challenging environment" bole to samajh jao agla quarter kharab hai.
Sector dekho: Ek company nahi, poora sector move karta hai. Nvidia gira to pura chip sector hilega.
Bottom Line
Earnings Season mein do tarah ke log hote hain:
Jo tayyari se aate hain = paisa banate hain
Jo gamble karte hain = Twitter pe rone aate hain
Aap kaun ban na chahte ho?
Apni watchlist ki top company comment karo. Main bataunga us mein kya dekhna hai 👇
#StockMarket #Investing #Q4Earnings #Finance #Trading #UrduFinance
#EarningsSeason: 4 Weeks Jo Aapka Portfolio Bana Ya Bigad Sakti Hain 💼
#EarningsSeason: 4 Weeks Jo Aapka Portfolio Bana Ya Bigad Sakti Hain 💼
Wall Street ka "Final Exam" shuru ho gaya hai. Ab CEO ke saare wade, analysts ke saare estimates, aur aapke saare predictions test honge.
1. Earnings Season = Market Ka Mood Swing
Har quarter Apple, Tesla, Google jaisi companies batati hain:
"Hum ne kitna kamaya, aur agle 3 mahine kya hoga."
Ek acchi report = Stock +8% in 1 day
Ek buri guidance = Stock -15% before chai thandi ho
2. Sirf 90 Seconds Mein Company Judge Karne Ka Formula
| Dekho | Matlab | Action |
| --- | --- | --- |
| EPS Beat ya Miss | Expectation se upar ya neeche | Beat = Green flag |
| Revenue Growth | Business barh raha hai? | 10%+ YoY = Strong |
| Guidance Raise/Cut | Future kaisa dikh raha | Cut = Danger, bhago |
Pro tip: Company EPS beat kare lekin guidance cut kar de to stock phir bhi girta hai. Future > Past.
3. Is Q4 2026 Mein 3 Badi Baatein Track Karo
AI Ka Bill: Microsoft, Google, Meta ne AI pe $200B+ phoonk diye. Ab investor pooch raha: "Profit kahan hai bhai?"
Consumer Ki Jeb: McDonald's se leke Amazon tak sab bataenge ke log kharch kar rahe hain ya haath rok liya.
Rate Cut Ki Umeed: Banks ki reports se pata chalega ke Fed rates kab kam karega. Isi pe pura market tika hai.
4. Aam Investor Ke Liye Survival Guide
Earnings ke din trade mat karo agar naya ho. IV crush tumhara paisa kha jayega.
Conference call ki 1 line suno: CEO "challenging environment" bole to samajh jao agla quarter kharab hai.
Sector dekho: Ek company nahi, poora sector move karta hai. Nvidia gira to pura chip sector hilega.
Bottom Line
Earnings Season mein do tarah ke log hote hain:
Jo tayyari se aate hain = paisa banate hain
Jo gamble karte hain = Twitter pe rone aate hain
Aap kaun ban na chahte ho?
Apni watchlist ki top company comment karo. Main bataunga us mein kya dekhna hai 👇
#StockMarket #Investing #Q4Earnings #Finance #Trading #UrduFinance
1
·
--
Bullish
#EarningsSeason
#EarningsSeason: 4 Weeks Jo Aapka Portfolio Bana Ya Bigad Sakti Hain 💼
#EarningsSeason: 4 Weeks Jo Aapka Portfolio Bana Ya Bigad Sakti Hain 💼
Wall Street ka "Final Exam" shuru ho gaya hai. Ab CEO ke saare wade, analysts ke saare estimates, aur aapke saare predictions test honge.
1. Earnings Season = Market Ka Mood Swing
Har quarter Apple, Tesla, Google jaisi companies batati hain:
"Hum ne kitna kamaya, aur agle 3 mahine kya hoga."
Ek acchi report = Stock +8% in 1 day
Ek buri guidance = Stock -15% before chai thandi ho
2. Sirf 90 Seconds Mein Company Judge Karne Ka Formula
| Dekho | Matlab | Action |
| --- | --- | --- |
| EPS Beat ya Miss | Expectation se upar ya neeche | Beat = Green flag |
| Revenue Growth | Business barh raha hai? | 10%+ YoY = Strong |
| Guidance Raise/Cut | Future kaisa dikh raha | Cut = Danger, bhago |
Pro tip: Company EPS beat kare lekin guidance cut kar de to stock phir bhi girta hai. Future > Past.
3. Is Q4 2026 Mein 3 Badi Baatein Track Karo
AI Ka Bill: Microsoft, Google, Meta ne AI pe $200B+ phoonk diye. Ab investor pooch raha: "Profit kahan hai bhai?"
Consumer Ki Jeb: McDonald's se leke Amazon tak sab bataenge ke log kharch kar rahe hain ya haath rok liya.
Rate Cut Ki Umeed: Banks ki reports se pata chalega ke Fed rates kab kam karega. Isi pe pura market tika hai.
4. Aam Investor Ke Liye Survival Guide
Earnings ke din trade mat karo agar naya ho. IV crush tumhara paisa kha jayega.
Conference call ki 1 line suno: CEO "challenging environment" bole to samajh jao agla quarter kharab hai.
Sector dekho: Ek company nahi, poora sector move karta hai. Nvidia gira to pura chip sector hilega.
Bottom Line
Earnings Season mein do tarah ke log hote hain:
Jo tayyari se aate hain = paisa banate hain
Jo gamble karte hain = Twitter pe rone aate hain
Aap kaun ban na chahte ho?
Apni watchlist ki top company comment karo. Main bataunga us mein kya dekhna hai 👇
#StockMarket #Investing #Q4Earnings #Finance #Trading #UrduFinance
--$AAPLB $NVDAB $AMZNB
#EarningsSeason: 4 Weeks Jo Aapka Portfolio Bana Ya Bigad Sakti Hain 💼
#EarningsSeason: 4 Weeks Jo Aapka Portfolio Bana Ya Bigad Sakti Hain 💼
Wall Street ka "Final Exam" shuru ho gaya hai. Ab CEO ke saare wade, analysts ke saare estimates, aur aapke saare predictions test honge.
1. Earnings Season = Market Ka Mood Swing
Har quarter Apple, Tesla, Google jaisi companies batati hain:
"Hum ne kitna kamaya, aur agle 3 mahine kya hoga."
Ek acchi report = Stock +8% in 1 day
Ek buri guidance = Stock -15% before chai thandi ho
2. Sirf 90 Seconds Mein Company Judge Karne Ka Formula
| Dekho | Matlab | Action |
| --- | --- | --- |
| EPS Beat ya Miss | Expectation se upar ya neeche | Beat = Green flag |
| Revenue Growth | Business barh raha hai? | 10%+ YoY = Strong |
| Guidance Raise/Cut | Future kaisa dikh raha | Cut = Danger, bhago |
Pro tip: Company EPS beat kare lekin guidance cut kar de to stock phir bhi girta hai. Future > Past.
3. Is Q4 2026 Mein 3 Badi Baatein Track Karo
AI Ka Bill: Microsoft, Google, Meta ne AI pe $200B+ phoonk diye. Ab investor pooch raha: "Profit kahan hai bhai?"
Consumer Ki Jeb: McDonald's se leke Amazon tak sab bataenge ke log kharch kar rahe hain ya haath rok liya.
Rate Cut Ki Umeed: Banks ki reports se pata chalega ke Fed rates kab kam karega. Isi pe pura market tika hai.
4. Aam Investor Ke Liye Survival Guide
Earnings ke din trade mat karo agar naya ho. IV crush tumhara paisa kha jayega.
Conference call ki 1 line suno: CEO "challenging environment" bole to samajh jao agla quarter kharab hai.
Sector dekho: Ek company nahi, poora sector move karta hai. Nvidia gira to pura chip sector hilega.
Bottom Line
Earnings Season mein do tarah ke log hote hain:
Jo tayyari se aate hain = paisa banate hain
Jo gamble karte hain = Twitter pe rone aate hain
Aap kaun ban na chahte ho?
Apni watchlist ki top company comment karo. Main bataunga us mein kya dekhna hai 👇
#StockMarket #Investing #Q4Earnings #Finance #Trading #UrduFinance
--$AAPLB $NVDAB $AMZNB
1
7
·
--
#PepeJumps14%ToLeadAltcoinRebound: Memecoin Ne Phir Market Hila Diya 🐸🚀$PEPE aaj $0.000011 se#PepeJumps14%ToLeadAltcoinRebound: Memecoin Ne Phir Market Hila Diya 🐸🚀
Bitcoin sideway chal raha hai, lekin Pepe ne 24 ghante mein 14% jump maar kar altcoin party start kar di. Memecoins ko joke samajhne wale ek dafa phir shocked hain.
1. Hua Kya Hai?
$PEPE aaj $0.000011 se $0.0000125 tak gaya. Market cap mein $520M add ho gaya sirf ek din mein.
3 Bade Triggers:
| Trigger | Detail | Kyun Important |
| --- | --- | --- |
| Whale Buying | Ek wallet ne $6.2M ke PEPE uthaye | Bade players enter ho rahe hain |
| Binance Futures Open Interest | 32% jump hua | Leverage traders bet laga rahe hain |
| Ethereum Gas Spike | ETH fees upar gayin | Memecoin season ka signal hai |
2. Pepe Kyun? Baki Coins Kyun Nahi?
Liquidity: PEPE ab top 3 memecoin hai. Asaani se buy/sell ho jata hai.
Narrative: "Bitcoin boring hai" ka mood bana to log high-beta coins ki taraf bhagte hain. PEPE unka pehla stop hai.
Chart Breakout: 2 months se $0.000010 pe resistance tha. Aaj toot gaya to short squeeze hui.
3. Iska Matlab Kya Hai Crypto Market Ke Liye?
Bull Signal: Jab PEPE jaisi risk-on coin uth ti hai, to aksar ye altcoin season ka start hota hai. Trader bolte hain: "Pepe first, rest follow."
Risk Signal: Memecoins sab se pehle girti bhi hain. Agar Bitcoin $58K se neeche gaya, to PEPE 14% ek ghante mein wapas de sakta hai.
Key Levels Abhi:
Support: $0.0000112 - Is se neeche close hua to rally khatam
Resistance: $0.0000135 - Yahan profit booking aayegi
Next Target: Agar $0.0000135 cross hua to $0.000015 pakka
4. Retail Trader Ke Liye 3 Rules
FOMO mein mat kudo: 14% upar ja chuka hai. Ab entry risky hai. Dip ka wait karo.
Stop-loss lagana bhoolna mat: Memecoin mein 20% move 10 minute ka khel hai.
Profit lena seekho: "100x hoga" ke chakkar mein log 2x bhi miss kar dete hain. 30-40% pe kuch nikaal lo.
Bottom Line
PEPE ka pump batata hai ke market mein risk appetite wapas aa rahi hai. Lekin memecoin = momentum ka khel. Jab tak music chal raha hai, dance karo. Music band hote hi bahar nikal jao.
Golden Rule: Portfolio ka 2-5% se zyada memecoin mein mat lagao. Ye Vegas hai, retirement plan nahi.
Tum PEPE hold kar rahe ho ya sirf dekh rahe ho? 👇
#PEPE #AltcoinSeason #Crypto #Memecoins #Trading #CryptoU $PEPE
$BTC
{future}(BTCUSDT)
#PepeJumps14%ToLeadAltcoinRebound: Memecoin Ne Phir Market Hila Diya 🐸🚀$PEPE aaj $0.000011 se
#PepeJumps14%ToLeadAltcoinRebound: Memecoin Ne Phir Market Hila Diya 🐸🚀
Bitcoin sideway chal raha hai, lekin Pepe ne 24 ghante mein 14% jump maar kar altcoin party start kar di. Memecoins ko joke samajhne wale ek dafa phir shocked hain.
1. Hua Kya Hai?
$PEPE aaj $0.000011 se $0.0000125 tak gaya. Market cap mein $520M add ho gaya sirf ek din mein.
3 Bade Triggers:
| Trigger | Detail | Kyun Important |
| --- | --- | --- |
| Whale Buying | Ek wallet ne $6.2M ke PEPE uthaye | Bade players enter ho rahe hain |
| Binance Futures Open Interest | 32% jump hua | Leverage traders bet laga rahe hain |
| Ethereum Gas Spike | ETH fees upar gayin | Memecoin season ka signal hai |
2. Pepe Kyun? Baki Coins Kyun Nahi?
Liquidity: PEPE ab top 3 memecoin hai. Asaani se buy/sell ho jata hai.
Narrative: "Bitcoin boring hai" ka mood bana to log high-beta coins ki taraf bhagte hain. PEPE unka pehla stop hai.
Chart Breakout: 2 months se $0.000010 pe resistance tha. Aaj toot gaya to short squeeze hui.
3. Iska Matlab Kya Hai Crypto Market Ke Liye?
Bull Signal: Jab PEPE jaisi risk-on coin uth ti hai, to aksar ye altcoin season ka start hota hai. Trader bolte hain: "Pepe first, rest follow."
Risk Signal: Memecoins sab se pehle girti bhi hain. Agar Bitcoin $58K se neeche gaya, to PEPE 14% ek ghante mein wapas de sakta hai.
Key Levels Abhi:
Support: $0.0000112 - Is se neeche close hua to rally khatam
Resistance: $0.0000135 - Yahan profit booking aayegi
Next Target: Agar $0.0000135 cross hua to $0.000015 pakka
4. Retail Trader Ke Liye 3 Rules
FOMO mein mat kudo: 14% upar ja chuka hai. Ab entry risky hai. Dip ka wait karo.
Stop-loss lagana bhoolna mat: Memecoin mein 20% move 10 minute ka khel hai.
Profit lena seekho: "100x hoga" ke chakkar mein log 2x bhi miss kar dete hain. 30-40% pe kuch nikaal lo.
Bottom Line
PEPE ka pump batata hai ke market mein risk appetite wapas aa rahi hai. Lekin memecoin = momentum ka khel. Jab tak music chal raha hai, dance karo. Music band hote hi bahar nikal jao.
Golden Rule: Portfolio ka 2-5% se zyada memecoin mein mat lagao. Ye Vegas hai, retirement plan nahi.
Tum PEPE hold kar rahe ho ya sirf dekh rahe ho? 👇
#PEPE #AltcoinSeason #Crypto #Memecoins #Trading #CryptoU $PEPE
$BTC
4
·
--
Bullish
#PepeJumps14%ToLeadAltcoinRebound
$PEPE aaj $0.000011 se $0.0000125 tak gaya. Market cap mein $520M add ho gaya sirf ek din mein.
#PepeJumps14%ToLeadAltcoinRebound: Memecoin Ne Phir Market Hila Diya 🐸🚀
Bitcoin sideway chal raha hai, lekin Pepe ne 24 ghante mein 14% jump maar kar altcoin party start kar di. Memecoins ko joke samajhne wale ek dafa phir shocked hain.
1. Hua Kya Hai?
$PEPE aaj $0.000011 se $0.0000125 tak gaya. Market cap mein $520M add ho gaya sirf ek din mein.
3 Bade Triggers:
| Trigger | Detail | Kyun Important |
| --- | --- | --- |
| Whale Buying | Ek wallet ne $6.2M ke PEPE uthaye | Bade players enter ho rahe hain |
| Binance Futures Open Interest | 32% jump hua | Leverage traders bet laga rahe hain |
| Ethereum Gas Spike | ETH fees upar gayin | Memecoin season ka signal hai |
2. Pepe Kyun? Baki Coins Kyun Nahi?
Liquidity: PEPE ab top 3 memecoin hai. Asaani se buy/sell ho jata hai.
Narrative: "Bitcoin boring hai" ka mood bana to log high-beta coins ki taraf bhagte hain. PEPE unka pehla stop hai.
Chart Breakout: 2 months se $0.000010 pe resistance tha. Aaj toot gaya to short squeeze hui.
3. Iska Matlab Kya Hai Crypto Market Ke Liye?
Bull Signal: Jab PEPE jaisi risk-on coin uth ti hai, to aksar ye altcoin season ka start hota hai. Trader bolte hain: "Pepe first, rest follow."
Risk Signal: Memecoins sab se pehle girti bhi hain. Agar Bitcoin $58K se neeche gaya, to PEPE 14% ek ghante mein wapas de sakta hai.
Key Levels Abhi:
Support: $0.0000112 - Is se neeche close hua to rally khatam
Resistance: $0.0000135 - Yahan profit booking aayegi
Next Target: Agar $0.0000135 cross hua to $0.000015 pakka
4. Retail Trader Ke Liye 3 Rules
FOMO mein mat kudo: 14% upar ja chuka hai. Ab entry risky hai. Dip ka wait karo.
Stop-loss lagana bhoolna mat: Memecoin mein 20% move 10 minute ka khel hai.
Profit lena seekho: "100x hoga" ke chakkar mein log 2x bhi miss kar dete hain. 30-40% pe kuch nikaal lo.
$PEPE
{spot}(PEPEUSDT)
#PepeJumps14%ToLeadAltcoinRebound
$PEPE aaj $0.000011 se $0.0000125 tak gaya. Market cap mein $520M add ho gaya sirf ek din mein.
#PepeJumps14%ToLeadAltcoinRebound: Memecoin Ne Phir Market Hila Diya 🐸🚀
Bitcoin sideway chal raha hai, lekin Pepe ne 24 ghante mein 14% jump maar kar altcoin party start kar di. Memecoins ko joke samajhne wale ek dafa phir shocked hain.
1. Hua Kya Hai?
$PEPE aaj $0.000011 se $0.0000125 tak gaya. Market cap mein $520M add ho gaya sirf ek din mein.
3 Bade Triggers:
| Trigger | Detail | Kyun Important |
| --- | --- | --- |
| Whale Buying | Ek wallet ne $6.2M ke PEPE uthaye | Bade players enter ho rahe hain |
| Binance Futures Open Interest | 32% jump hua | Leverage traders bet laga rahe hain |
| Ethereum Gas Spike | ETH fees upar gayin | Memecoin season ka signal hai |
2. Pepe Kyun? Baki Coins Kyun Nahi?
Liquidity: PEPE ab top 3 memecoin hai. Asaani se buy/sell ho jata hai.
Narrative: "Bitcoin boring hai" ka mood bana to log high-beta coins ki taraf bhagte hain. PEPE unka pehla stop hai.
Chart Breakout: 2 months se $0.000010 pe resistance tha. Aaj toot gaya to short squeeze hui.
3. Iska Matlab Kya Hai Crypto Market Ke Liye?
Bull Signal: Jab PEPE jaisi risk-on coin uth ti hai, to aksar ye altcoin season ka start hota hai. Trader bolte hain: "Pepe first, rest follow."
Risk Signal: Memecoins sab se pehle girti bhi hain. Agar Bitcoin $58K se neeche gaya, to PEPE 14% ek ghante mein wapas de sakta hai.
Key Levels Abhi:
Support: $0.0000112 - Is se neeche close hua to rally khatam
Resistance: $0.0000135 - Yahan profit booking aayegi
Next Target: Agar $0.0000135 cross hua to $0.000015 pakka
4. Retail Trader Ke Liye 3 Rules
FOMO mein mat kudo: 14% upar ja chuka hai. Ab entry risky hai. Dip ka wait karo.
Stop-loss lagana bhoolna mat: Memecoin mein 20% move 10 minute ka khel hai.
Profit lena seekho: "100x hoga" ke chakkar mein log 2x bhi miss kar dete hain. 30-40% pe kuch nikaal lo.
$PEPE
$PEPE aaj $0.000011 se $0.0000125 tak gaya. Market cap mein $520M add ho gaya sirf ek din mein.
#PepeJumps14%ToLeadAltcoinRebound: Memecoin Ne Phir Market Hila Diya 🐸🚀
Bitcoin sideway chal raha hai, lekin Pepe ne 24 ghante mein 14% jump maar kar altcoin party start kar di. Memecoins ko joke samajhne wale ek dafa phir shocked hain.
1. Hua Kya Hai?
$PEPE aaj $0.000011 se $0.0000125 tak gaya. Market cap mein $520M add ho gaya sirf ek din mein.
3 Bade Triggers:
| Trigger | Detail | Kyun Important |
| --- | --- | --- |
| Whale Buying | Ek wallet ne $6.2M ke PEPE uthaye | Bade players enter ho rahe hain |
| Binance Futures Open Interest | 32% jump hua | Leverage traders bet laga rahe hain |
| Ethereum Gas Spike | ETH fees upar gayin | Memecoin season ka signal hai |
2. Pepe Kyun? Baki Coins Kyun Nahi?
Liquidity: PEPE ab top 3 memecoin hai. Asaani se buy/sell ho jata hai.
Narrative: "Bitcoin boring hai" ka mood bana to log high-beta coins ki taraf bhagte hain. PEPE unka pehla stop hai.
Chart Breakout: 2 months se $0.000010 pe resistance tha. Aaj toot gaya to short squeeze hui.
3. Iska Matlab Kya Hai Crypto Market Ke Liye?
Bull Signal: Jab PEPE jaisi risk-on coin uth ti hai, to aksar ye altcoin season ka start hota hai. Trader bolte hain: "Pepe first, rest follow."
Risk Signal: Memecoins sab se pehle girti bhi hain. Agar Bitcoin $58K se neeche gaya, to PEPE 14% ek ghante mein wapas de sakta hai.
Key Levels Abhi:
Support: $0.0000112 - Is se neeche close hua to rally khatam
Resistance: $0.0000135 - Yahan profit booking aayegi
Next Target: Agar $0.0000135 cross hua to $0.000015 pakka
4. Retail Trader Ke Liye 3 Rules
FOMO mein mat kudo: 14% upar ja chuka hai. Ab entry risky hai. Dip ka wait karo.
Stop-loss lagana bhoolna mat: Memecoin mein 20% move 10 minute ka khel hai.
Profit lena seekho: "100x hoga" ke chakkar mein log 2x bhi miss kar dete hain. 30-40% pe kuch nikaal lo.
$PEPE
31
Log in to explore more content
Join global crypto users on Binance Square
⚡️ Get latest and useful information about crypto.
💬 Trusted by the world’s largest crypto exchange.
👍 Discover real insights from verified creators.
Email / Phone number