

TRADE FUEL
5.2k Posts

TRADE FUEL
Report
Block User
🔥Professional Crypto Trader 📈 | Market Analyst 🔎 | Crypto Influencer 🌍 | Sharing Trading Tips & Market Strategies 🚀 Follow For More 💚 "Trade_Fuel

#BinanceTurns7 task 2

#BinanceTurns7
Open Trade
Occasional Trader
3.9 Years
21 Following
11.8K+ Followers
27.9K+ Liked
2 Badges
Posts
Portfolio
All
Quotes
Videos
Live
PINNED
·
--
Verified
#nil $NIL @nillionnetwork
🔥🔥 The NIL token is the native utility, staking, and governance cryptocurrency powering the Nillion Network. Launched in March 2025 via major exchange pools, Nillion functions as a decentralized privacy computing platform—often described as a "Blind Computer". It allows nodes to store sensitive information and perform computations on encrypted data without ever exposing the underlying plaintext.
In March 2026, the project underwent a significant upgrade (Nillion 2.0), migrating the NIL token from its original Cosmos-based "nilChain" to an Ethereum ERC-20 framework. This shifts Nillion's architecture toward an Ethereum Layer-2 execution model to maximize decentralized accessibility and market composability.
#nil $NIL @Nillion
🔥🔥 The NIL token is the native utility, staking, and governance cryptocurrency powering the Nillion Network. Launched in March 2025 via major exchange pools, Nillion functions as a decentralized privacy computing platform—often described as a "Blind Computer". It allows nodes to store sensitive information and perform computations on encrypted data without ever exposing the underlying plaintext.
In March 2026, the project underwent a significant upgrade (Nillion 2.0), migrating the NIL token from its original Cosmos-based "nilChain" to an Ethereum ERC-20 framework. This shifts Nillion's architecture toward an Ethereum Layer-2 execution model to maximize decentralized accessibility and market composability.

1
1
1.5k
·
--
JUST IN: 🇺🇸 US national debt reaches new all-time high of $40.5 trillion.
#EarningsSeason $META $TSLA
JUST IN: 🇺🇸 US national debt reaches new all-time high of $40.5 trillion.
#EarningsSeason $META $TSLA
#EarningsSeason $META $TSLA
524
·
--
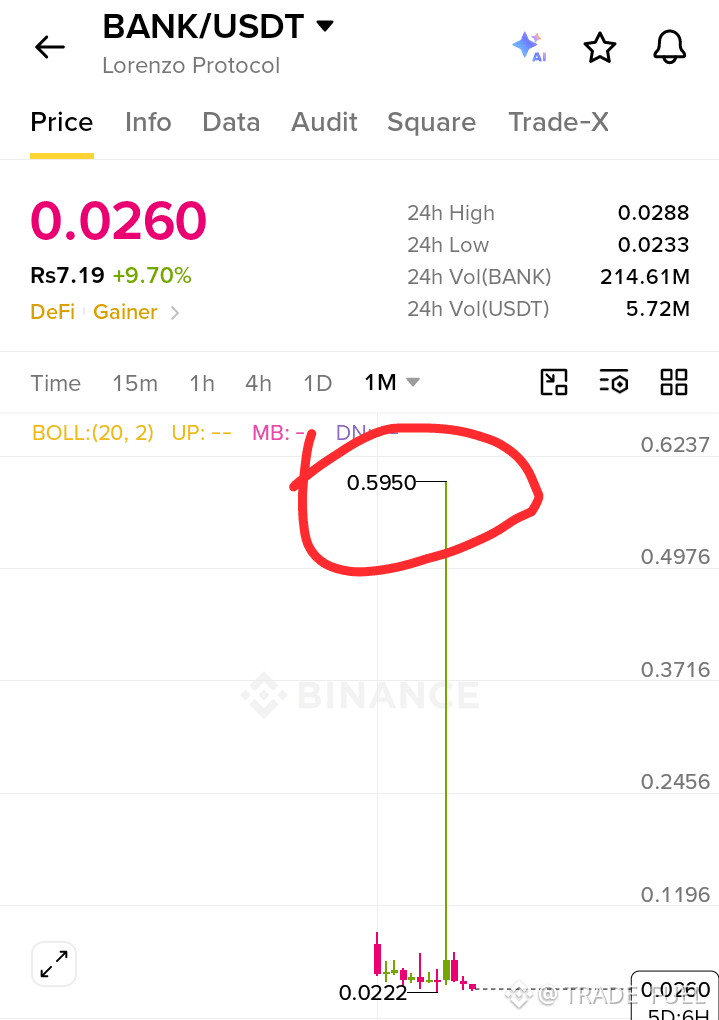
$BANK have potential to regain this price again .
Next target for long term vision .
#BinancePick #EarningsSeason $META $TSLA
$BANK have potential to regain this price again .
Next target for long term vision .
#BinancePick #EarningsSeason $META $TSLA
Next target for long term vision .
#BinancePick #EarningsSeason $META $TSLA
810
·
--
$DOT
🔥🔥 Will Polkadot (DOT) Ever Regain Its All-Time High? 🤔
Taking a hard look at this Polkadot (DOT/USDT) monthly chart, we are seeing one of the most brutal retracements in crypto. Here is a concise breakdown of what’s happening:
📊 The Current State
Massive Retracement: DOT is currently hovering around $1.01—nearly 98% down from its historical all-time high (ATH) of $55.09.
Finding a Floor: The price found historical capitulation lows around $0.63 before seeing very minor stabilization, but the trend remains heavily suppressed underneath key moving averages.
The Volume Factor: While 24h trading volume sits at around 4.45M DOT (~$4.54M), it lacks the explosive, sustained momentum needed to break this multi-year downtrend.
📈 Can it reach $55 again? (The Reality Check)
The Math is Massive: To get from $1 back to $55, DOT would need a 5,400% increase (55x). While crypto is known for insane bull runs, this requires massive liquidity and capital injection.
Dilution & Inflation: Remember, Polkadot has an inflationary supply model. There are far more tokens in circulation now than during the 2021 bull run, meaning DOT needs a significantly larger market cap to reach $55 than it did previously.
The Catalyst Needed: For DOT to ever reclaim its glory, it needs massive adoption of its parachains, a surge in Web3 utility, and a macro bull market that aggressively rotates back into layer-1/layer-2 networks.
Conclusion: A full return to $55 would require a gargantuan effort, massive network adoption, and favorable tokenomics changes. While a strong bounce from these deeply oversold levels is highly possible, reclaiming the ATH is an incredibly uphill battle.
#BinancePick #EarningsSeason $META $TSLA

438
·
--
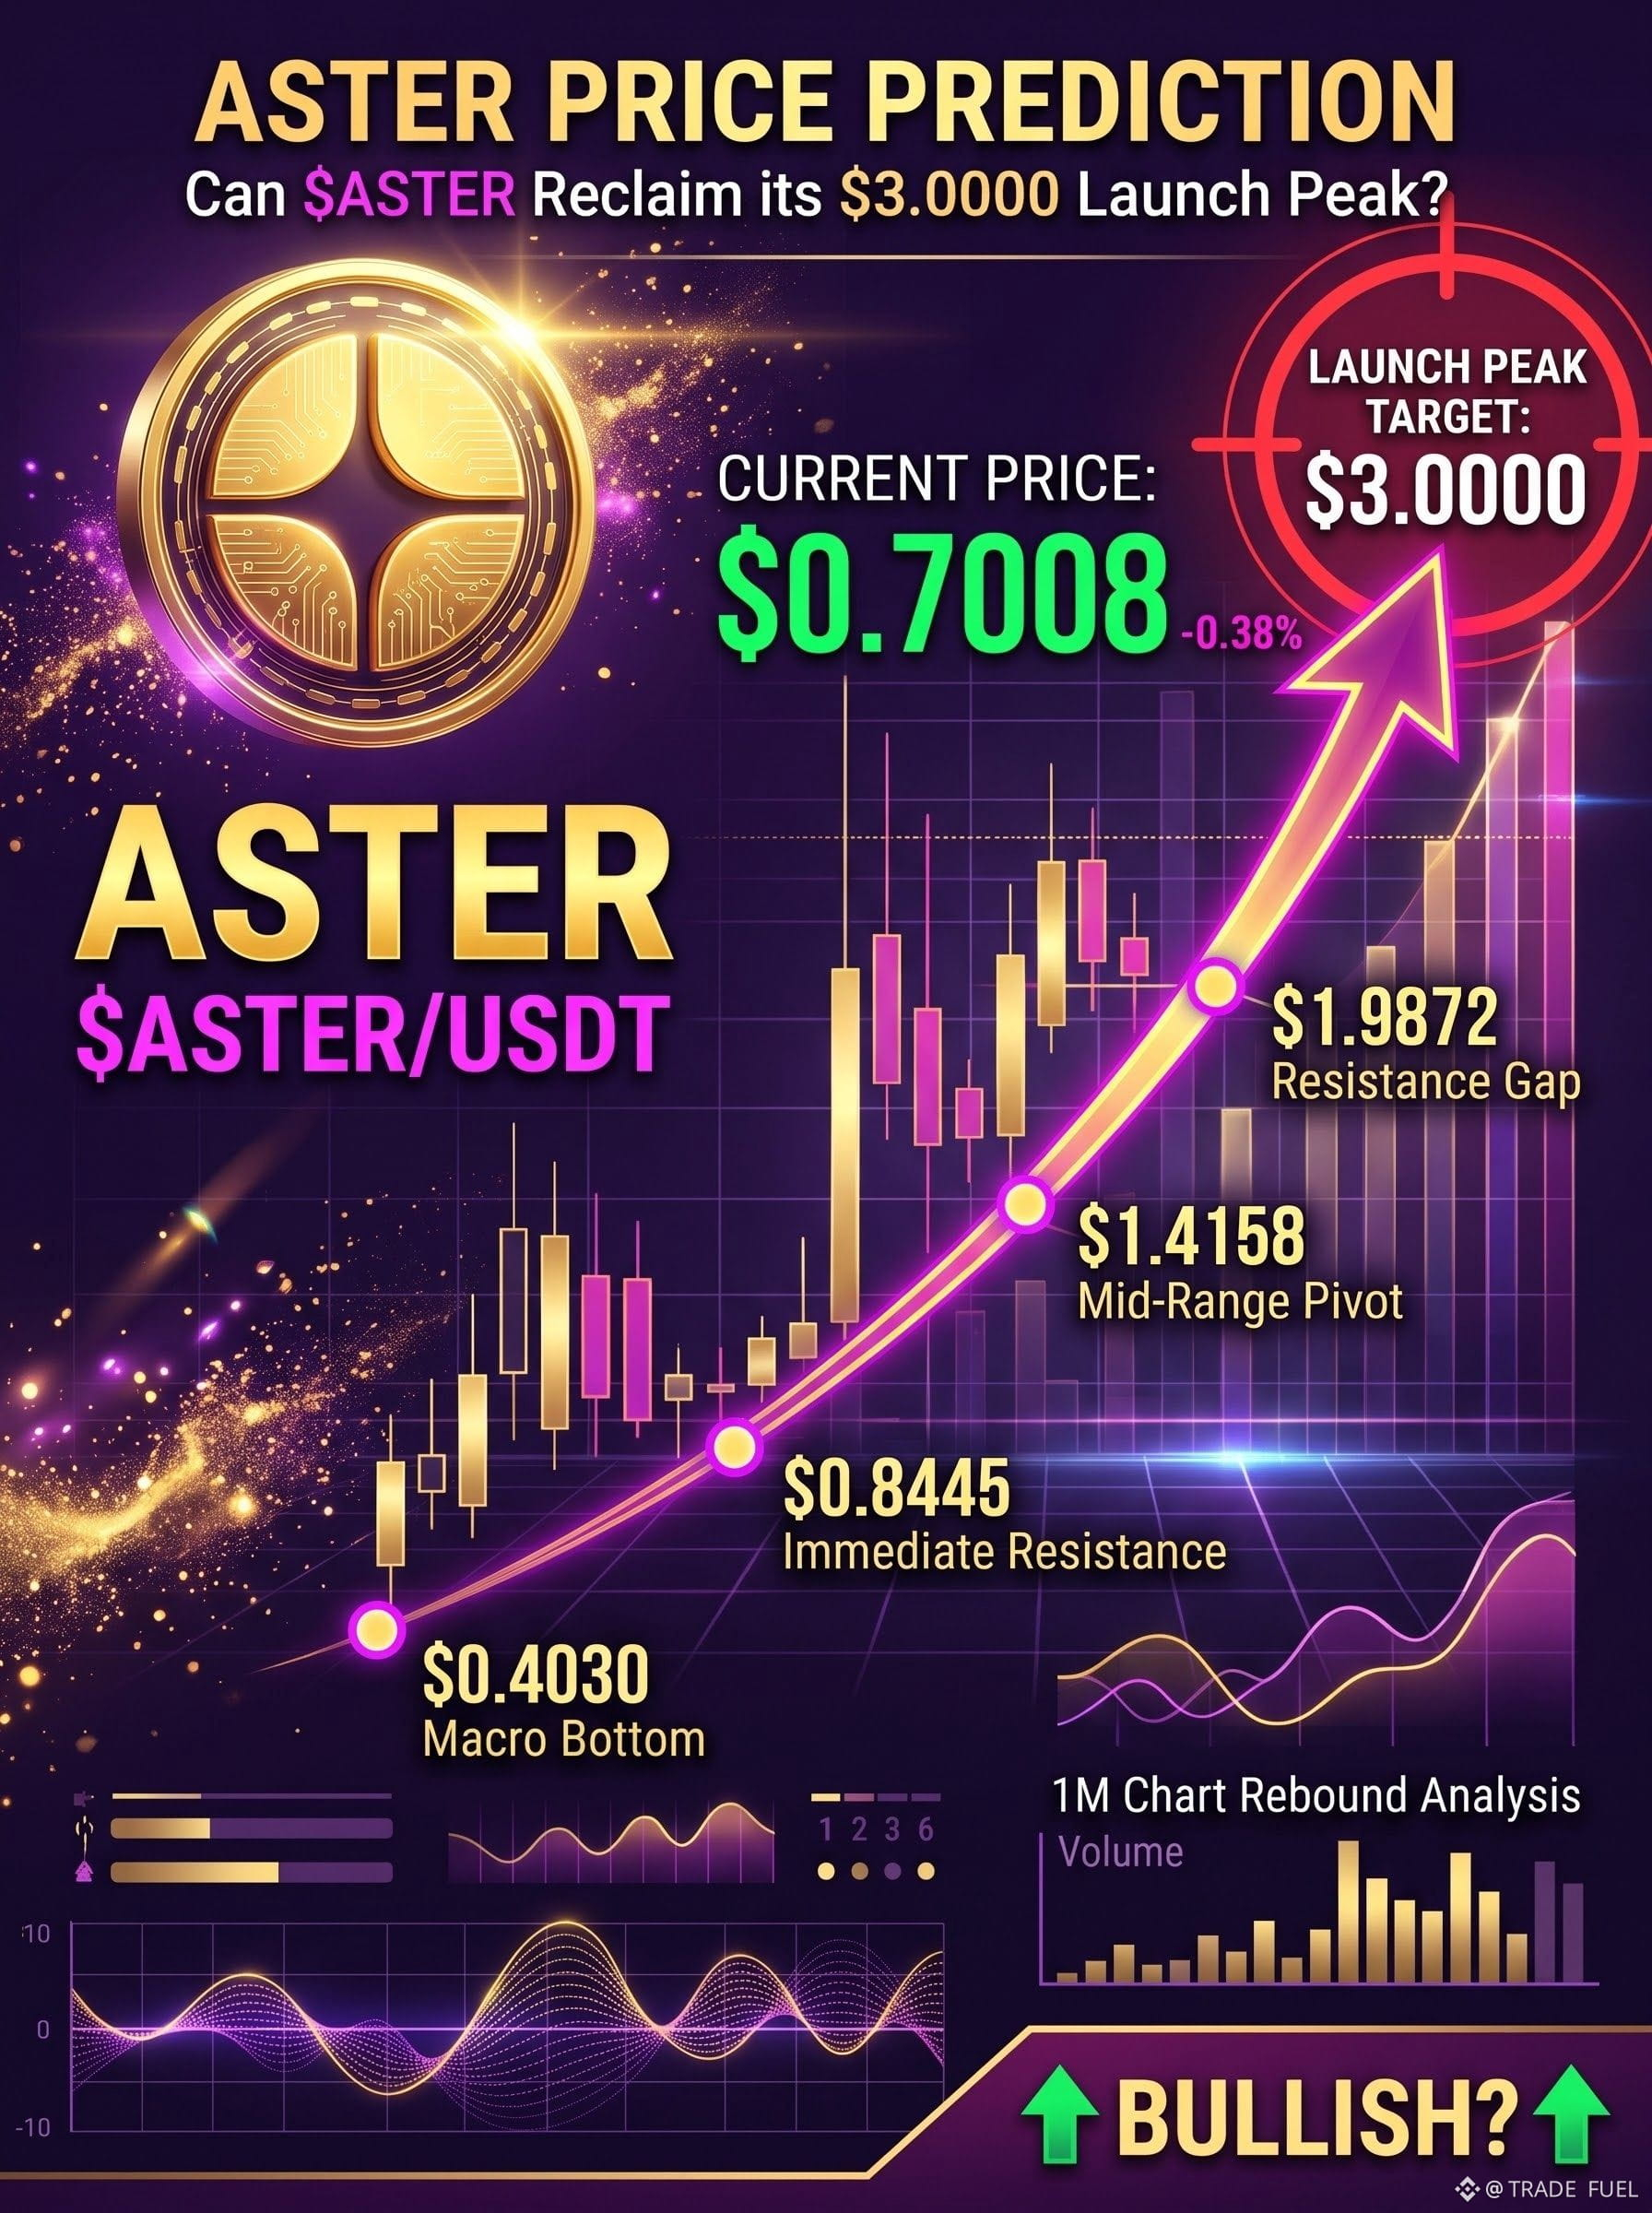
🚀 Can $ASTER Reclaim Its $3.00 Launch Peak?
Taking a look at this high-timeframe 1M chart for ASTER/USDT (image_8.png), the price is currently consolidating around $0.7008 (down -0.38% on the session, trading at ~Rs193.95).
The screenshot highlights the launch wick peak at $3.0000. After a steep initial correction down to its macro bottom around $0.4030, ASTER has spent months accumulating and building a base.
Let's examine the technical levels and what it would take for ASTER to mount a return to that $3.00 mark:
📊 The Numbers to Reach $3.0000
Current Price: ~$0.7008
Target Launch Peak: ~$3.0000
Required Rally: ~4.28x (about a +328% return).
🔑 Key Structural Levels & Resistance Hurdles
To build momentum back toward $3.00, ASTER must navigate several key price levels marked on the monthly chart:
1️⃣ $0.8445 – $1.0000 (Immediate Resistance): The lower structural resistance from post-launch consolidation. A clean weekly close above $0.8445 and reclaiming the $1.00 psychological barrier is the first prerequisite for a broader trend reversal.
2️⃣ $1.4158 (Mid-Range Pivot): The middle boundary of the initial crash candle. Clearing this level usually signals strong institutional buying interest.
3️⃣ $1.9872 – $2.5585 (Major Resistance Gap): Historical supply zone where selling pressure concentrated during the initial drop. Reclaiming $2.55 leaves very thin resistance up to $3.0000.
🛡️ Core Support Floor:
$0.4030: As highlighted at the bottom of your chart, this represents ASTER’s absolute macro bottom. Holding well above $0.4030 keeps the ongoing accumulation structure valid.
Are you accumulating ASTER during this consolidation phase, or waiting for a confirmed breakout above $1.00? Drop your targets below! 👇
⚠️Disclaimer: Cryptocurrencies carry high volatility. This post is for educational purposes only and not financial advice!).
#BinancePick #EarningsSeason $TSLA $META #aster
{future}(ASTERUSDT)
🚀 Can $ASTER Reclaim Its $3.00 Launch Peak?
Taking a look at this high-timeframe 1M chart for ASTER/USDT (image_8.png), the price is currently consolidating around $0.7008 (down -0.38% on the session, trading at ~Rs193.95).
The screenshot highlights the launch wick peak at $3.0000. After a steep initial correction down to its macro bottom around $0.4030, ASTER has spent months accumulating and building a base.
Let's examine the technical levels and what it would take for ASTER to mount a return to that $3.00 mark:
📊 The Numbers to Reach $3.0000
Current Price: ~$0.7008
Target Launch Peak: ~$3.0000
Required Rally: ~4.28x (about a +328% return).
🔑 Key Structural Levels & Resistance Hurdles
To build momentum back toward $3.00, ASTER must navigate several key price levels marked on the monthly chart:
1️⃣ $0.8445 – $1.0000 (Immediate Resistance): The lower structural resistance from post-launch consolidation. A clean weekly close above $0.8445 and reclaiming the $1.00 psychological barrier is the first prerequisite for a broader trend reversal.
2️⃣ $1.4158 (Mid-Range Pivot): The middle boundary of the initial crash candle. Clearing this level usually signals strong institutional buying interest.
3️⃣ $1.9872 – $2.5585 (Major Resistance Gap): Historical supply zone where selling pressure concentrated during the initial drop. Reclaiming $2.55 leaves very thin resistance up to $3.0000.
🛡️ Core Support Floor:
$0.4030: As highlighted at the bottom of your chart, this represents ASTER’s absolute macro bottom. Holding well above $0.4030 keeps the ongoing accumulation structure valid.
Are you accumulating ASTER during this consolidation phase, or waiting for a confirmed breakout above $1.00? Drop your targets below! 👇
⚠️Disclaimer: Cryptocurrencies carry high volatility. This post is for educational purposes only and not financial advice!).
#BinancePick #EarningsSeason $TSLA $META #aster
322
·
--
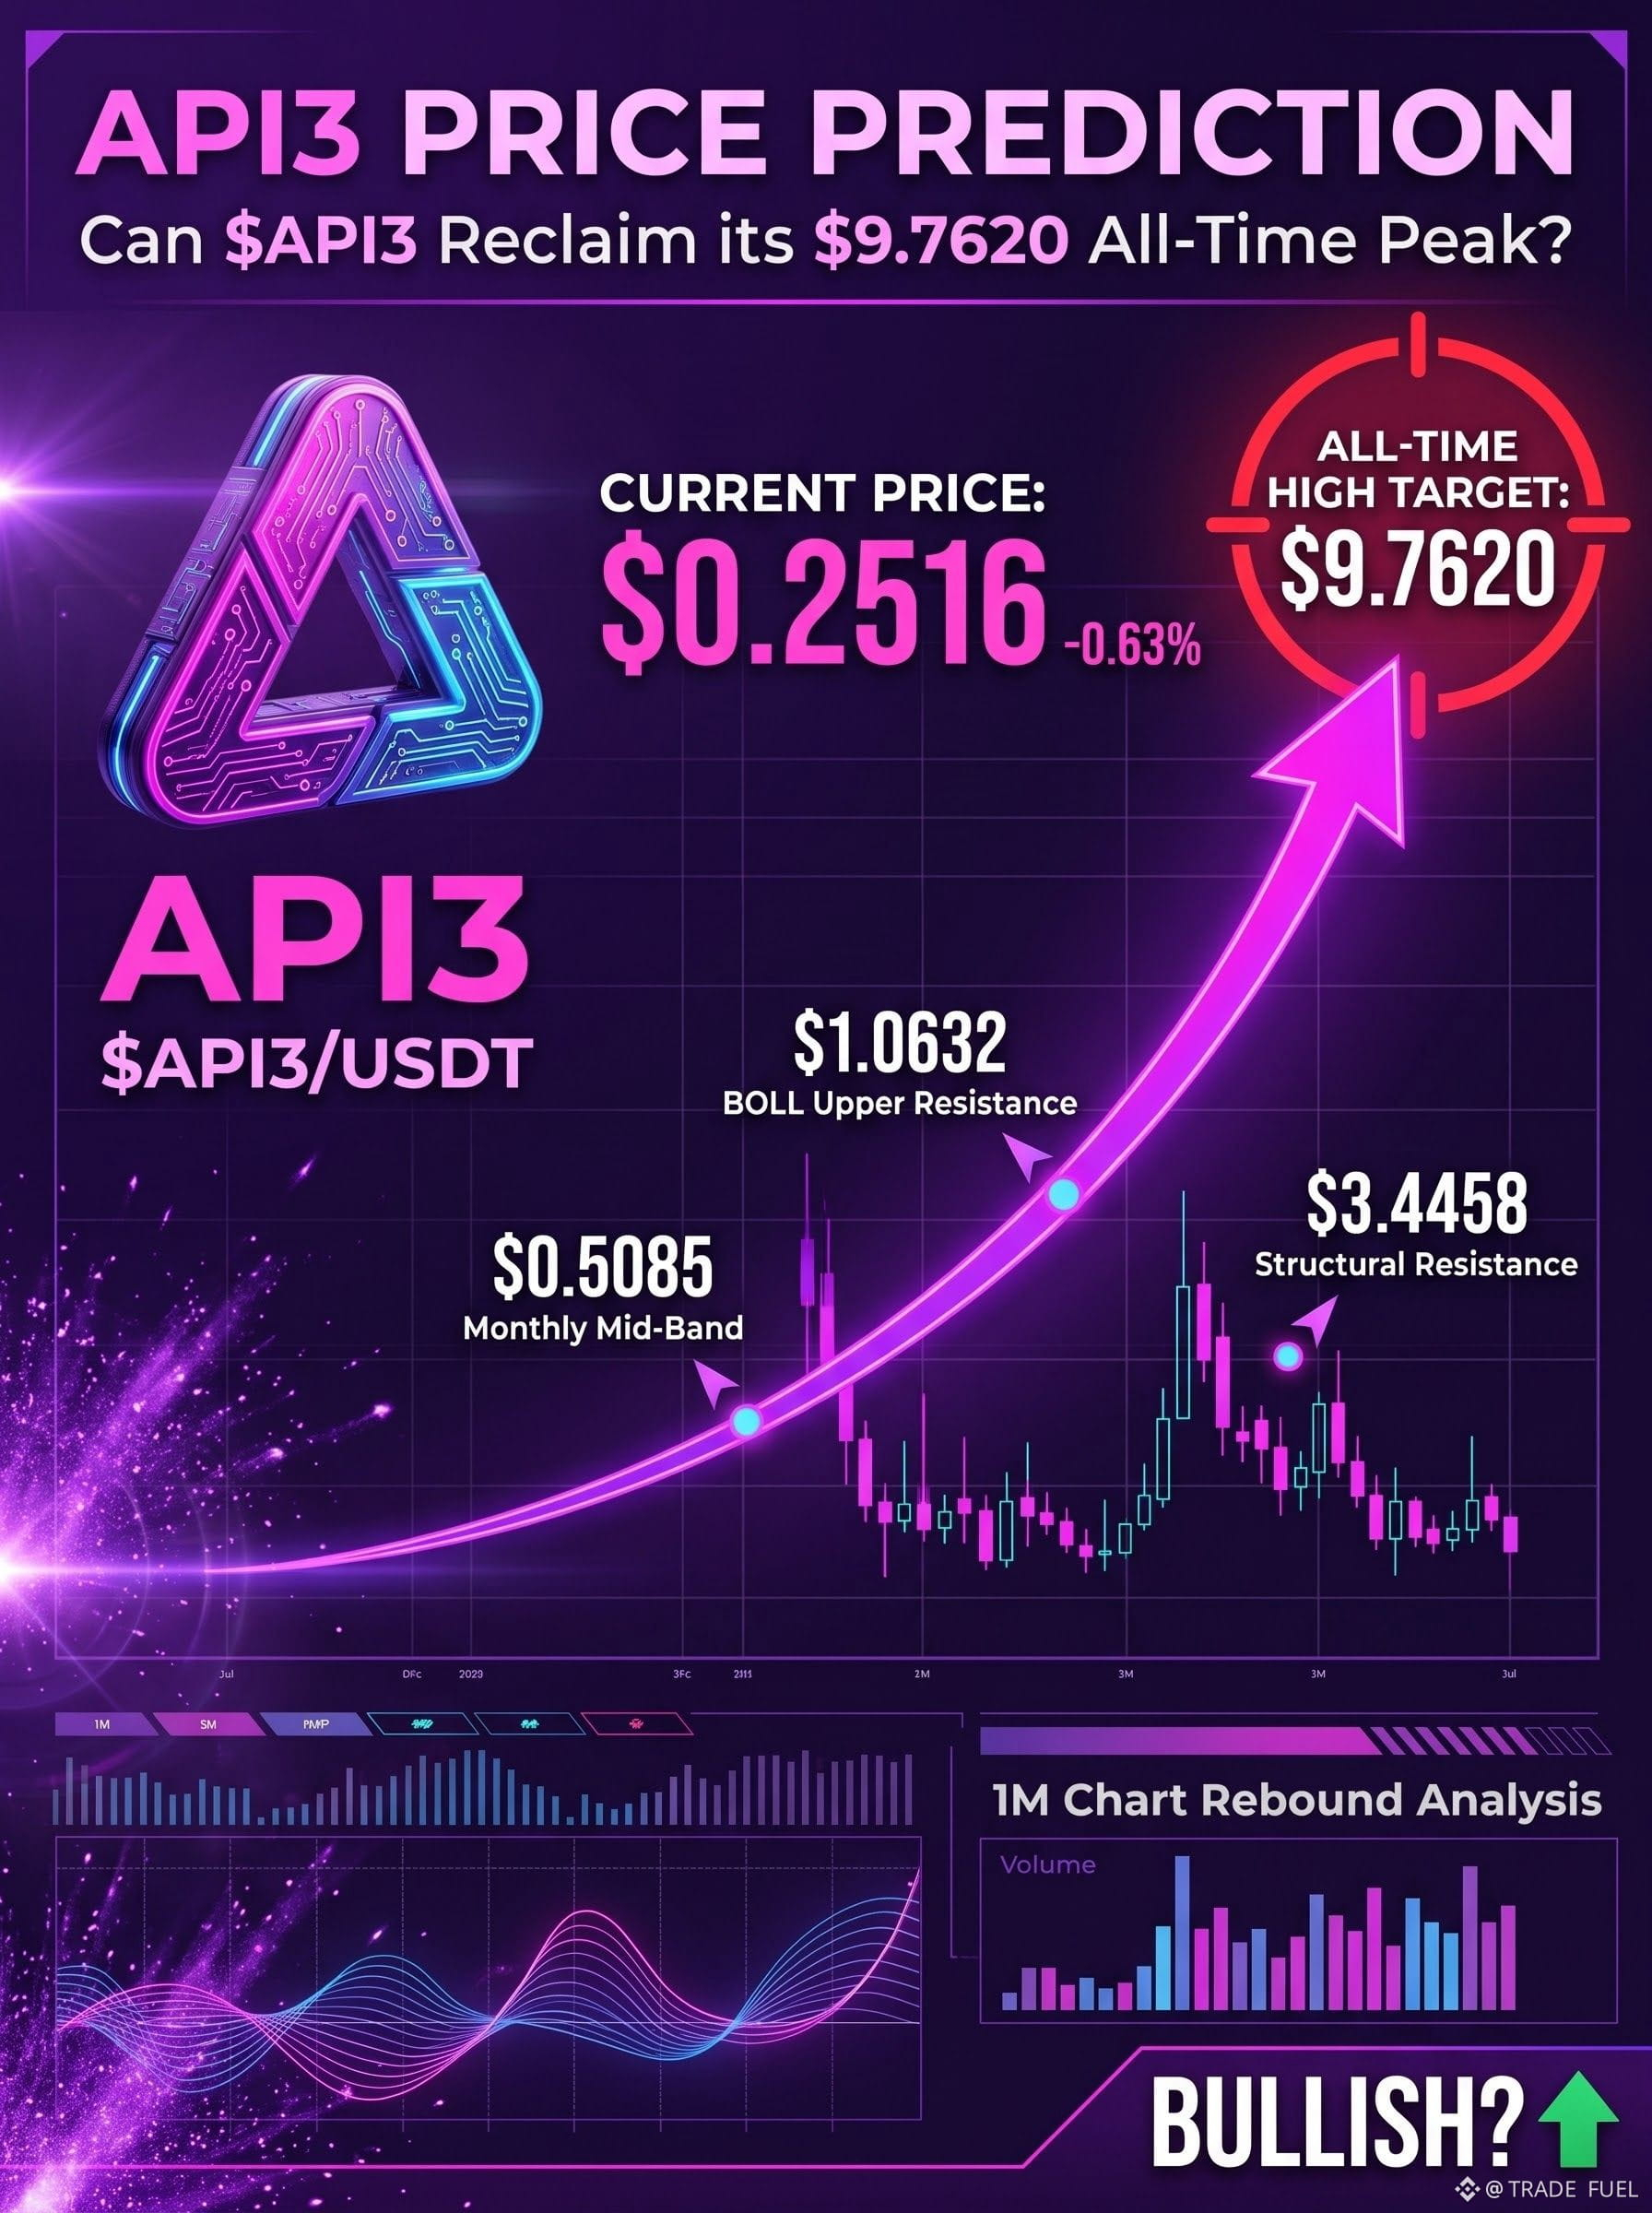
Can $API3 Reclaim Its Legendary $9.762 Peak? 🚀📈
Taking a look at this high-timeframe monthly 1M chart for API3/USDT (image_6.png), the price sits near an all-time low consolidation around $0.2516 (down Rs69.63, -0.63% on the day).
Meanwhile, the highlighted peak at $9.7620 represents the token’s historical bull run summit. A potential run back to this level represents a massive, cycle-defining journey.
Let's break down the technicals and what it would take for API3 to achieve this:
📊 The Numbers: What It Takes to Reach $9.762
Current Price: ~$0.2516
All-Time Peak: ~$9.7620
Required Gain: ~38x (about a +3,780% return)
🚀 The Bull Case: Eyes on $9.762
To mount a generational recovery, API3 will need to conquer several historical key resistance levels:
1️⃣ $0.5085 (The MB Zone): The monthly Bollinger mid-band serves as the first macro pivot. Reclamation here is essential to spark any uptrend.
2️⃣ $1.0632 (BOLL UP): Clearing the monthly Bollinger upper band will shift macro sentiment from bearish to firmly bullish, opening the path for the real double-digit run.
3️⃣ $1.18 - $3.44: Key historical support-turned-resistance regions. Once API3 breaks past $3.44, historical volume gap windows can allow fast movement back to $5.71 and ultimately $7.97 on its way to retesting $9.7620.
💎 Fundamental Support
As a leading "First-Party Oracle" (API3) competing with the likes of Chainlink, its long-term potential hinges on increasing dApp integrations, Web3 infrastructure demand, and massive on-chain data adoption.
🛡️ Major Support to Watch
The macro bottom support is hovering tight at $0.1606. As long as API3 holds above this floor, it maintains the baseline required to accumulate and prepare for its next cycle.
Do you think API3 can capture another 30x+ run in the next major altcoin season? Let us know in the comments below! 👇
(Disclaimer: Cryptocurrencies carry high risk and volatility. This is for educational purposes only and is not financial advice!)
#BinancePick #EarningsSeason $TSLA $META
197
·
--
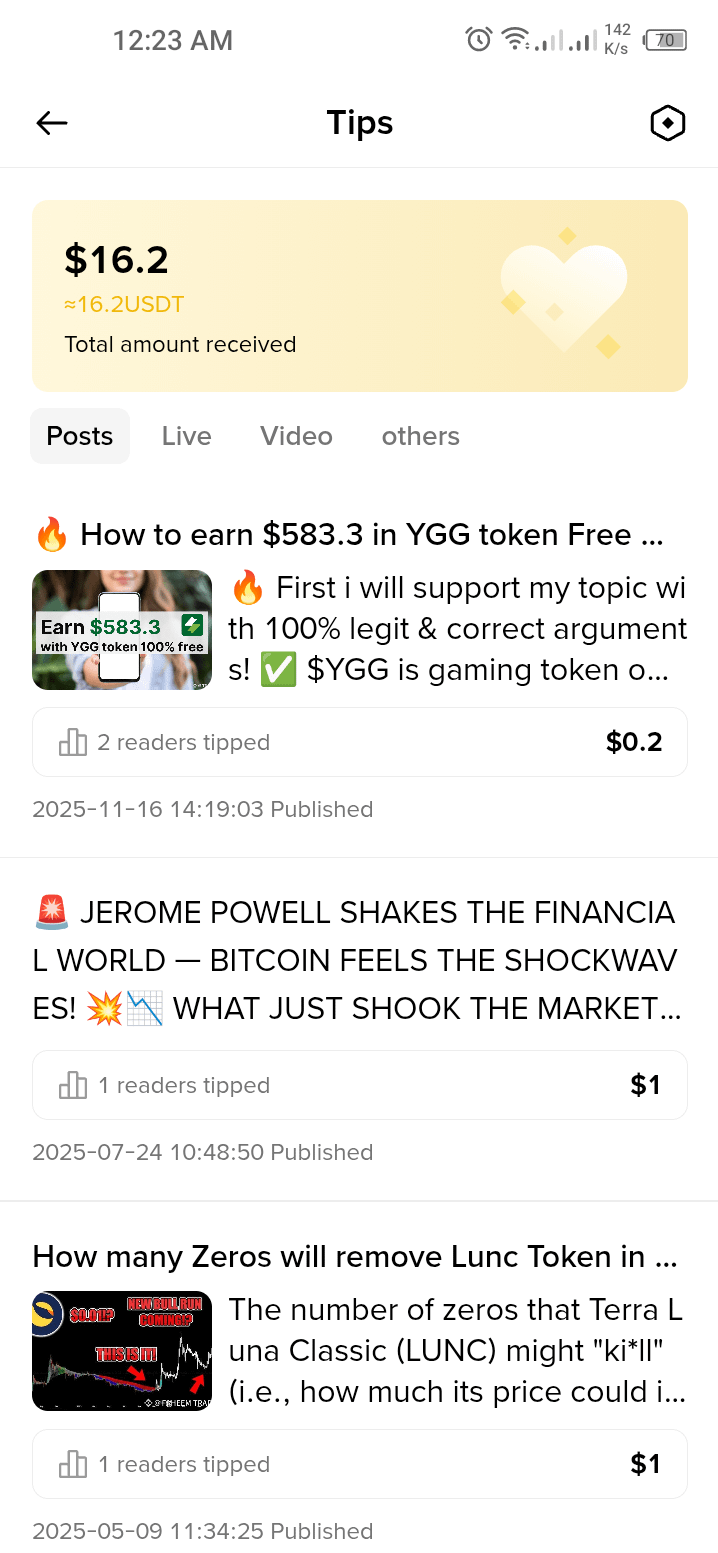
🔥🔥 Generous people on Binance Thanks for your supporting me to grow on binance square.....
❤️ Again Thanks ❤️
#EarningsSeason $TSLA $META
🔥🔥 Generous people on Binance Thanks for your supporting me to grow on binance square.....
❤️ Again Thanks ❤️
#EarningsSeason $TSLA $META
❤️ Again Thanks ❤️
#EarningsSeason $TSLA $META
1
1
246
·
--
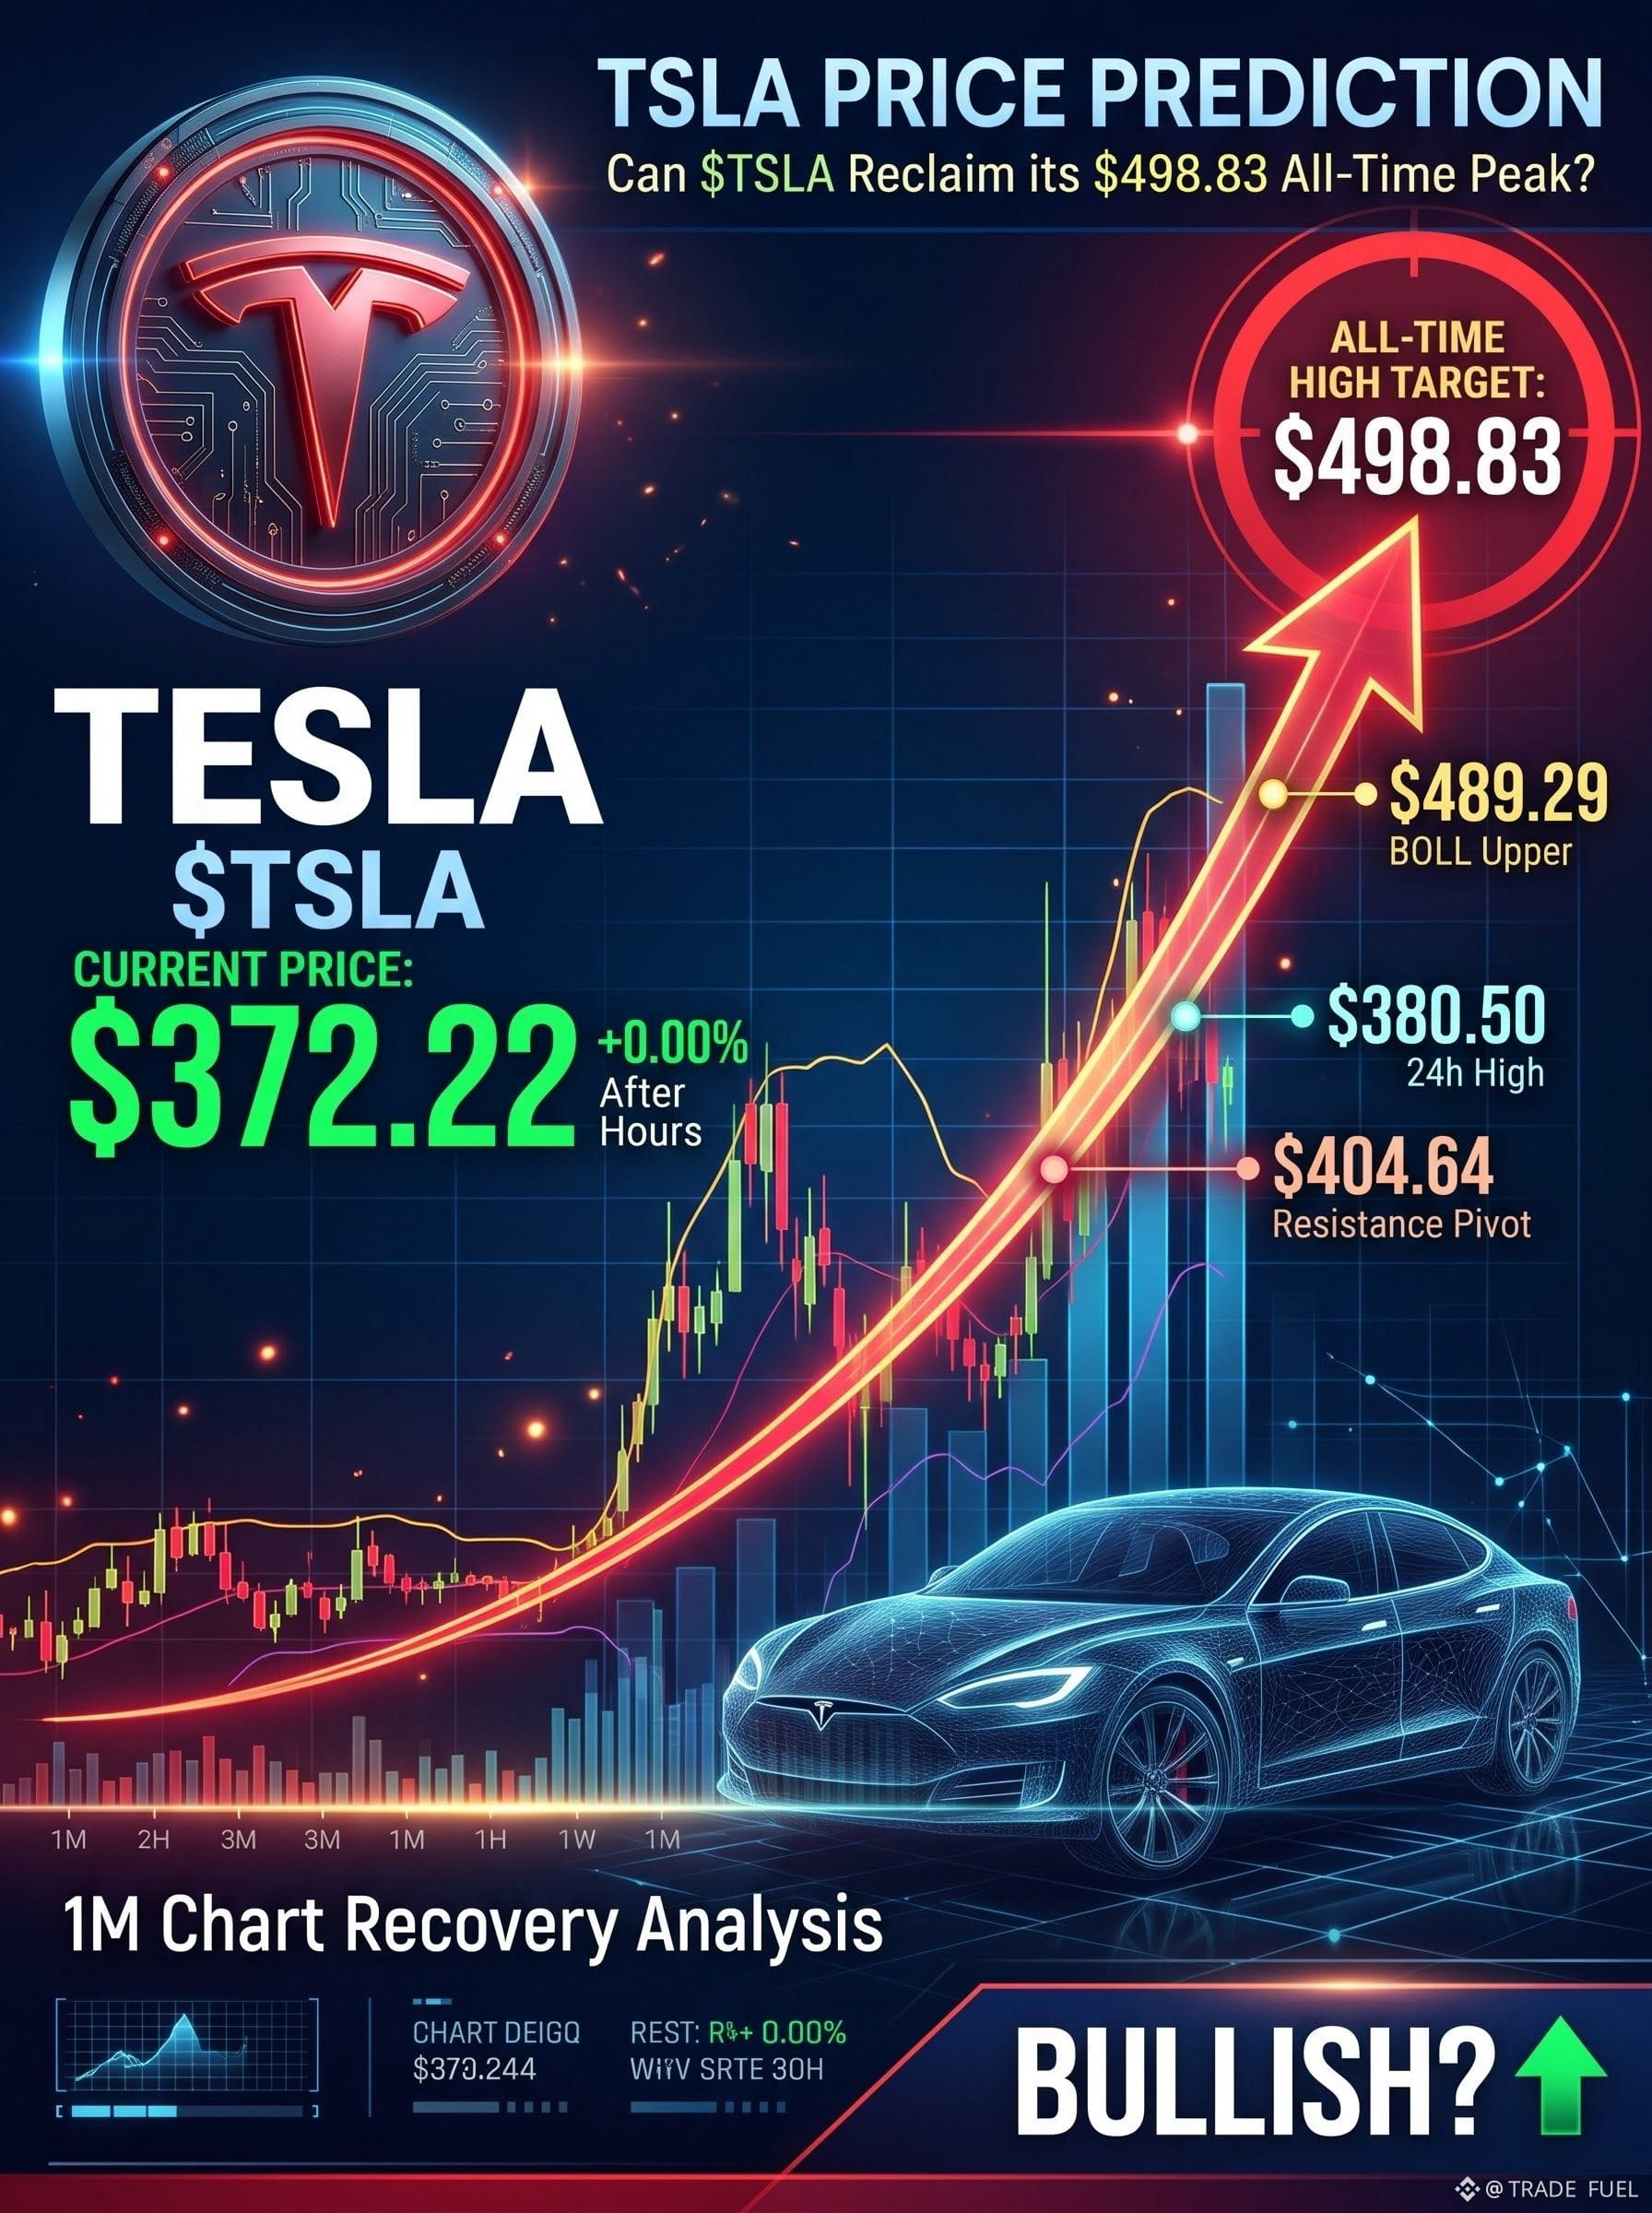
🔥🔥 Can Tesla ($TSLA ) Reclaim Its $498.83 All-Time Peak? 🚗💨
Tesla, Inc. Common Stock ($TSLA) is currently consolidating around $372.22 at close (Oct 23, 2026), recovering from historical bottoms to find a solid footing in its upper-mid range.
With a massive historical peak of $498.83 highlighted, let's explore if TSLA has the horsepower to mount a full recovery:
📈 The Journey Back to $498.83
To push its way back to its all-time highs, $TSLA faces a +34% (~1.34x) gain. Unlike the hyper-extended runs of the past, this path will require clearing several major key zones step-by-step:
1️⃣ $380.00 - $404.64: This immediate supply zone and 24h high has acted as a key psychological resistance. A firm weekly close above $404.64 could shift macro sentiment and open the door to double-digit gains.
2️⃣ $440.00: Historical mid-range resistance from previous rally attempts.
3️⃣ $489.29 (BOLL Upper): The upper limit of Bollinger Bands on this timeframe. Moving past this will put $498.83 on the immediate horizon.
🌟 The Bull Case
With Tesla's evolving strategic focuses on AI, Robotics (Optimus), and potential synergies (such as the discussed Tesla-SpaceX merger/AI ventures), investor hype and innovation cycles could act as major catalysts. If Tesla's upcoming product execution delivers on its margin targets, institutional capital rotation could easily spark the final push back toward $498.83.
🛡️ Major Support to Hold
For the bullish structure to remain intact, $tsla needs to hold its critical mid-band support around $286.10 to $258.48.
Are you a bull or a bear at these levels? Let’s hear your targets! 👇
(Disclaimer: Stock markets are volatile. Analysis is for educational purposes only and not financial advice!)
#EarningsSeason $META
🔥🔥 Can Tesla ($TSLA ) Reclaim Its $498.83 All-Time Peak? 🚗💨
Tesla, Inc. Common Stock ($TSLA ) is currently consolidating around $372.22 at close (Oct 23, 2026), recovering from historical bottoms to find a solid footing in its upper-mid range.
With a massive historical peak of $498.83 highlighted, let's explore if TSLA has the horsepower to mount a full recovery:
📈 The Journey Back to $498.83
To push its way back to its all-time highs, $TSLA faces a +34% (~1.34x) gain. Unlike the hyper-extended runs of the past, this path will require clearing several major key zones step-by-step:
1️⃣ $380.00 - $404.64: This immediate supply zone and 24h high has acted as a key psychological resistance. A firm weekly close above $404.64 could shift macro sentiment and open the door to double-digit gains.
2️⃣ $440.00: Historical mid-range resistance from previous rally attempts.
3️⃣ $489.29 (BOLL Upper): The upper limit of Bollinger Bands on this timeframe. Moving past this will put $498.83 on the immediate horizon.
🌟 The Bull Case
With Tesla's evolving strategic focuses on AI, Robotics (Optimus), and potential synergies (such as the discussed Tesla-SpaceX merger/AI ventures), investor hype and innovation cycles could act as major catalysts. If Tesla's upcoming product execution delivers on its margin targets, institutional capital rotation could easily spark the final push back toward $498.83.
🛡️ Major Support to Hold
For the bullish structure to remain intact, $tsla needs to hold its critical mid-band support around $286.10 to $258.48.
Are you a bull or a bear at these levels? Let’s hear your targets! 👇
(Disclaimer: Stock markets are volatile. Analysis is for educational purposes only and not financial advice!)
#EarningsSeason $META
228
·
--
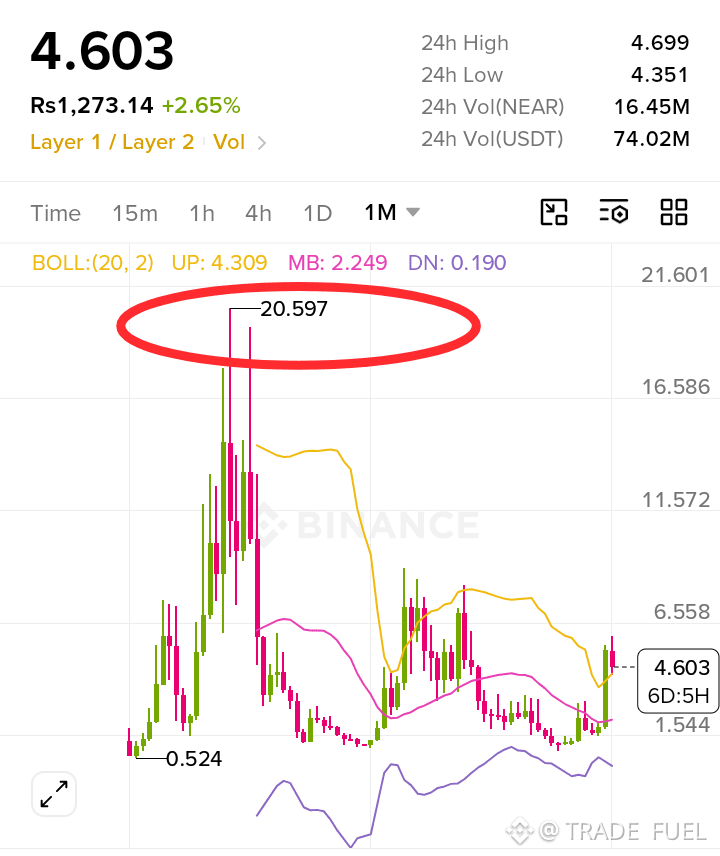
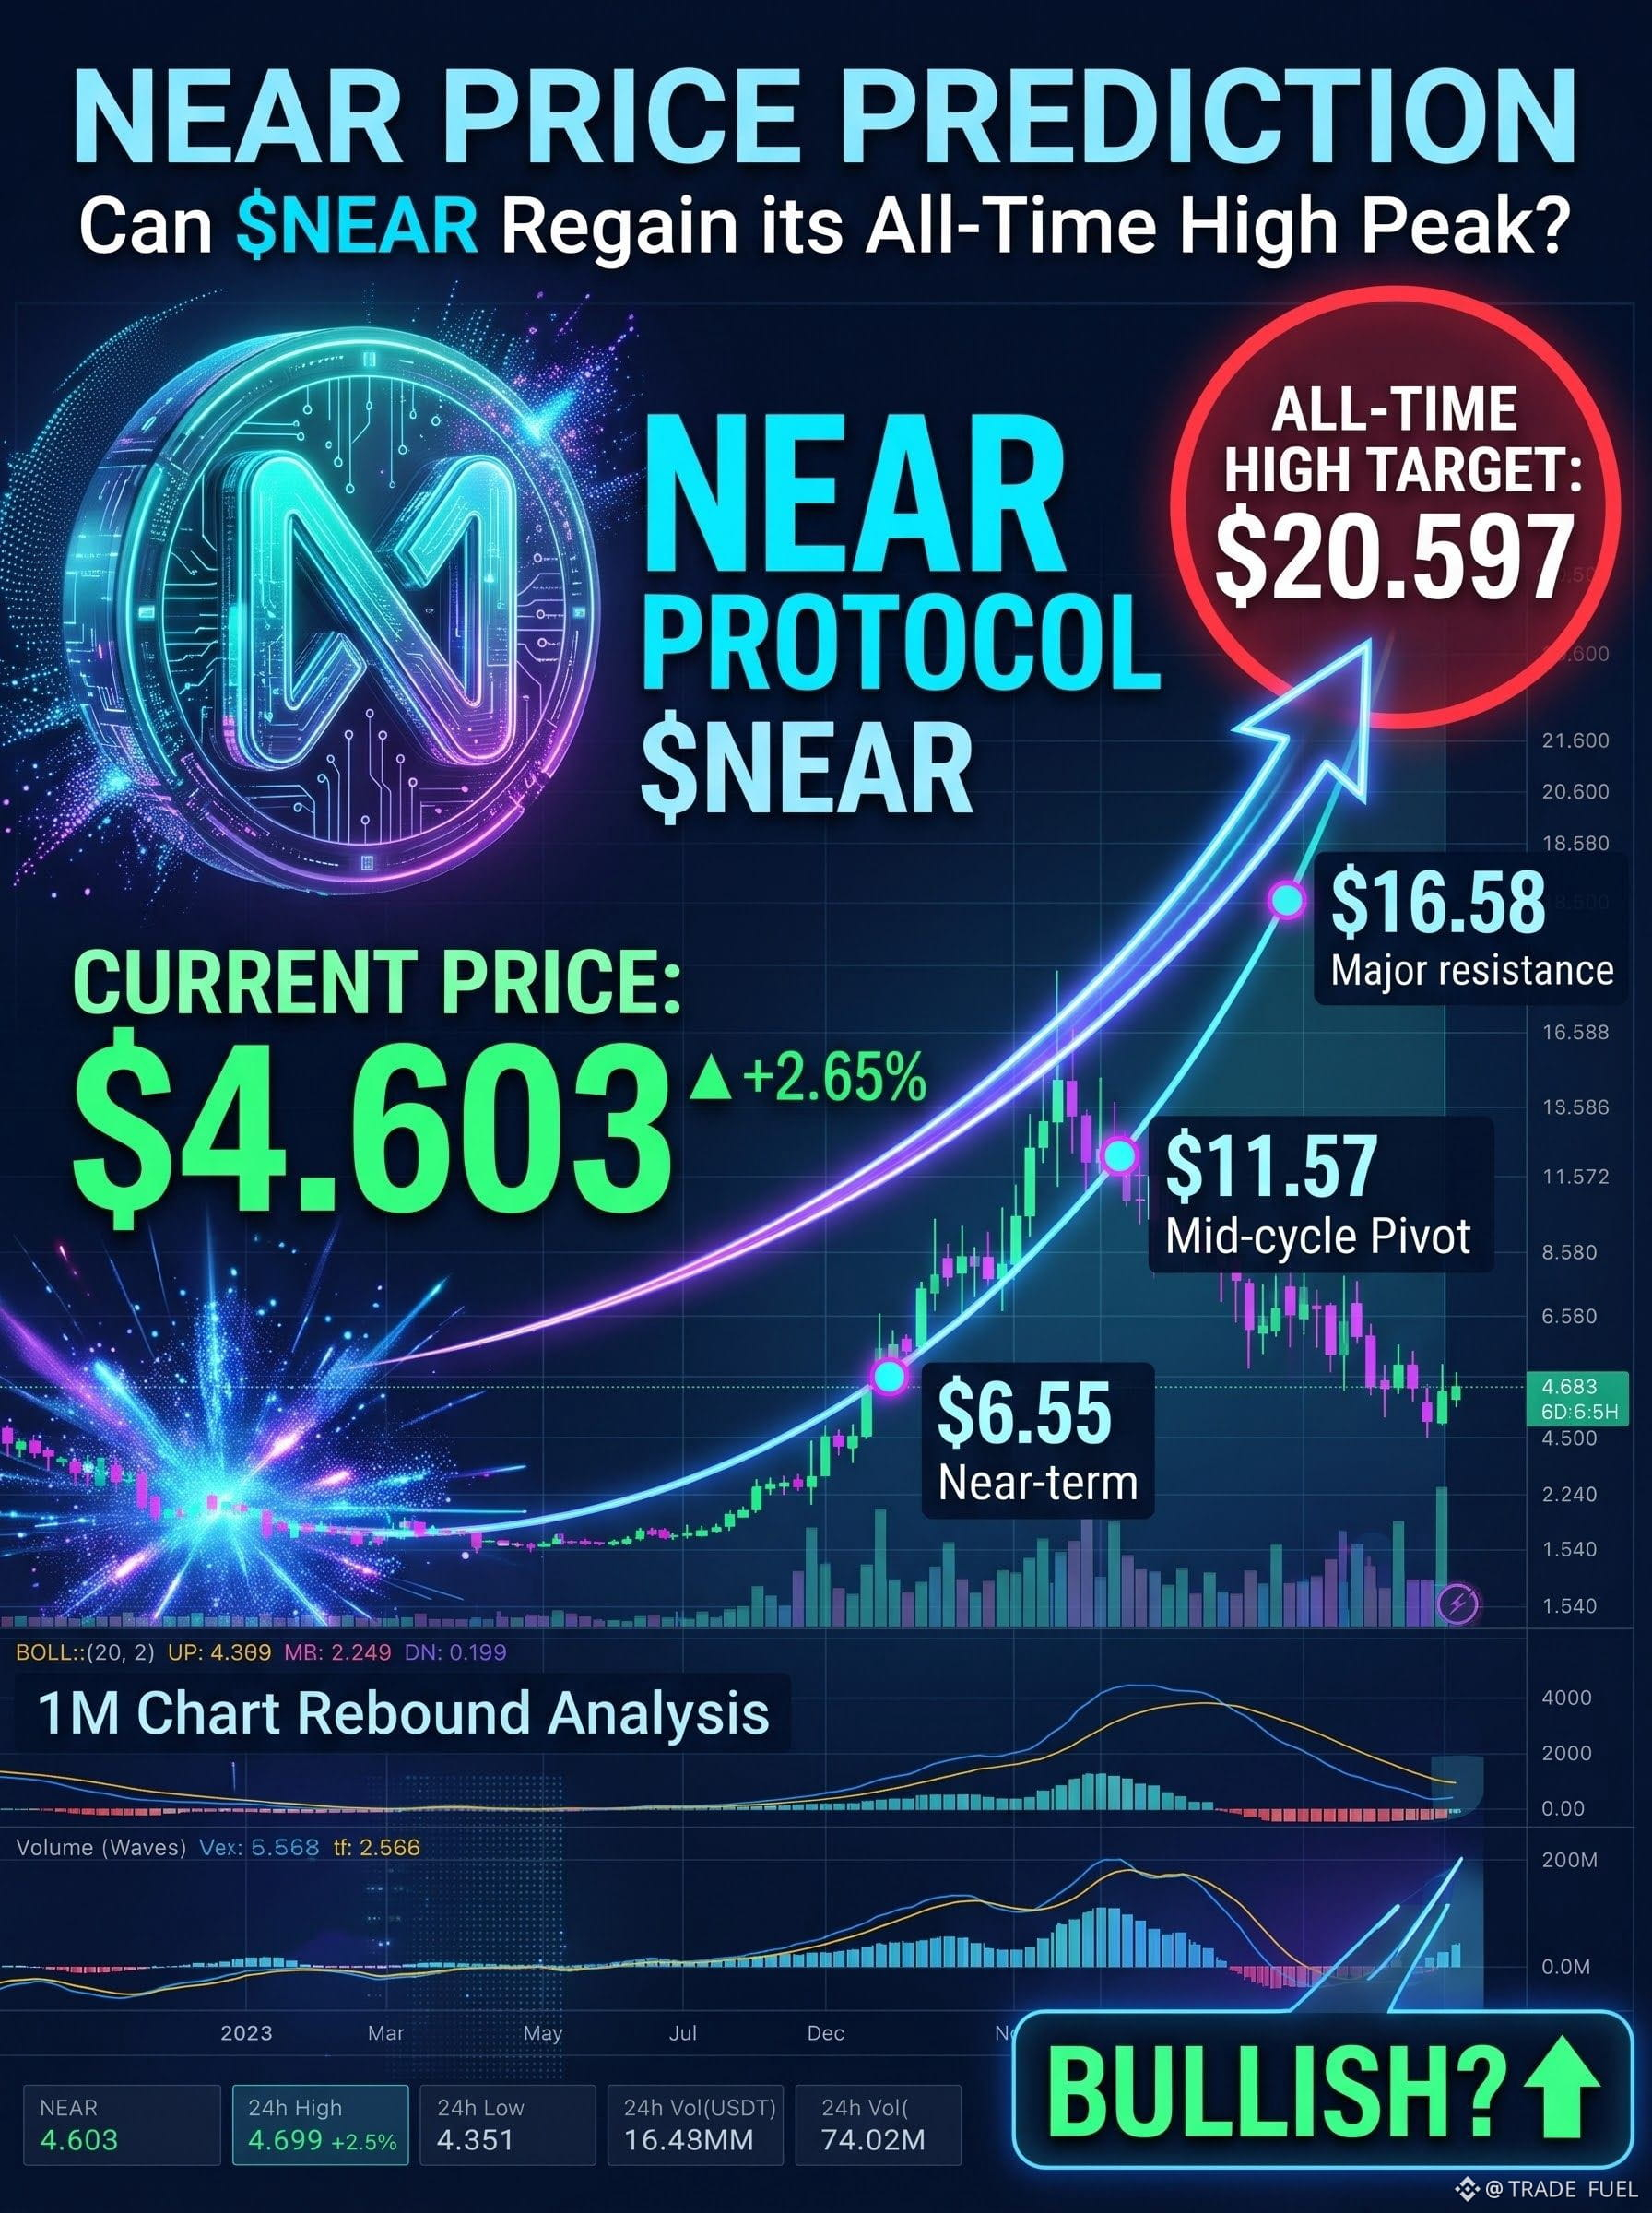
🔥🔥 Can $NEAR hit $20.59 again? 🚀📈
Looking at the monthly 1M chart, NEAR Protocol is consolidating near $4.60. Retesting its all-time high of $20.597 would require roughly a 4.5x (+348%) gain—a target well within reach during a macro bull cycle!
Key Roadmap to $20.59:
1️⃣ Clear $6.55 – $7.00 (Immediate Resistance)
2️⃣ Break $11.57 (Mid-Cycle Pivot)
3️⃣ Push past $16.58 to challenge the peak
With NEAR's growing focus on Chain Abstraction and AI integration, a return to the top remains on the radar.
What’s your price target for NEAR in this cycle? Drop your predictions below! 👇
(Educational analysis only. NFA/DYOR)
#EarningsSeason $TSLA $META
3
1.2k
·
--
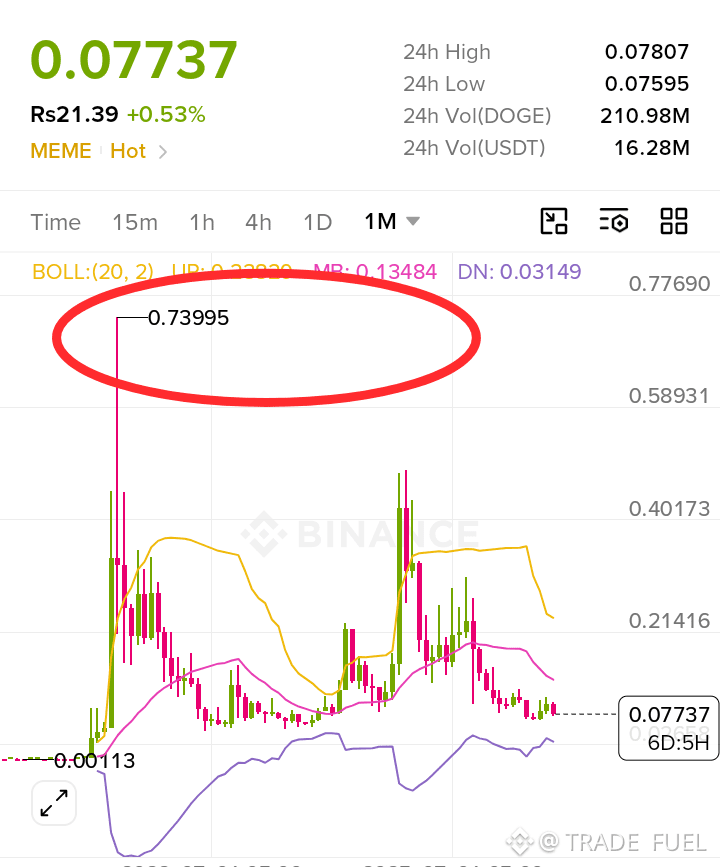
🔥🔥Can Dogecoin (DOGE) Run Back to Its $0.73995 Peak? 🐕😱😱😱😱 $DOGE
Take a look at this high-timeframe 1M chart for DOGE (image_0.png). The current price sits around $0.07737, consolidating after a massive historical peak. The highlighted level at $0.73995 represents DOGE’s ultimate historical target and major psychological resistance from its explosive bull run.
Here is a quick look at the potential for DOGE:
💎 The Bull Case: Eyes on $0.73995
To hit the $0.73995 mark again, DOGE would need to break through significant
resistance levels:
The Next Steps: Immediate resistance lies near $0.21 and $0.40 (based on past highs). If buying volume spikes on the weekly and monthly charts, DOGE could capture the momentum needed to target $0.58 and ultimately push toward its $0.73995 all-time highs.
A Massive Potential Gain: Moving from ~$0.077 to ~$0.74 represents roughly a 10x (900%+) return, a move DOGE has proven it is capable of during viral, high-liquidity meme cycles.
⚠️ Key Support to Watch
If the market remains slow, DOGE’s key support remains at its low levels around $0.075 - $0.07 to maintain its long-term bullish structure. Staying above these levels keeps the historical breakout dream alive.
Are you holding DOGE for the next massive run? 🚀 Let’s hear your predictions below! 👇
(Disclaimer: This is for educational purposes only. Always do your own research before trading or investing in crypto!)
#EarningsSeason $TSLA $META #doge

1
2
992
·
--
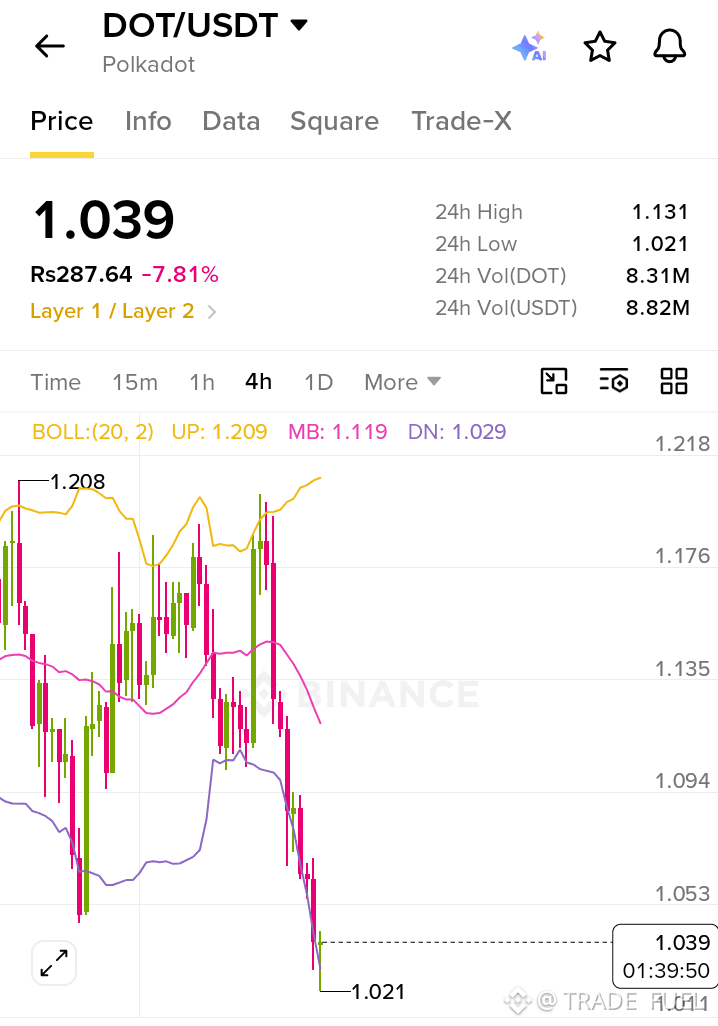
🛑 IS $DOT Crushing ?
👀 DOT Market Outlook: Bearish Pressure Intensifies
Rising Middle East tensions and surging oil prices are driving risk aversion across altcoins ahead of the Federal Reserve’s interest rate decision.
DOT faces heavy selling pressure, with $1.1M in net outflows recorded in the latest hour, including $506K in large-order distribution. The price has also dropped below the lower Bollinger Band, signaling continued downside risk.
Despite community approval of a 2.1B DOT supply cap, broader macroeconomic headwinds continue to weigh on market sentiment.
DOT remains under pressure as traders watch for the next market move.
#Polkadot
#DOTAnalysis #EarningsSeason #crushingmarket
3
1.2k
·
--
$TSLA $META $XAUT
🚀 TSLA BULLISH MOMENTUM! 📈🔥
Tesla is showing bullish price action, with buyers pushing toward new highs. ⚡🐂
Will TSLA continue its upward rally? 👀
📊 Watch the levels. Trade smart. Manage risk.
#TSLA #Tesla #StockMarket
#EarningsSeason
{future}(TSLAUSDT)
$TSLA $META $XAUT
🚀 TSLA BULLISH MOMENTUM! 📈🔥
Tesla is showing bullish price action, with buyers pushing toward new highs. ⚡🐂
Will TSLA continue its upward rally? 👀
📊 Watch the levels. Trade smart. Manage risk.
#TSLA #Tesla #StockMarket
#EarningsSeason
🚀 TSLA BULLISH MOMENTUM! 📈🔥
Tesla is showing bullish price action, with buyers pushing toward new highs. ⚡🐂
Will TSLA continue its upward rally? 👀
📊 Watch the levels. Trade smart. Manage risk.
#TSLA #Tesla #StockMarket
#EarningsSeason

442
·
--
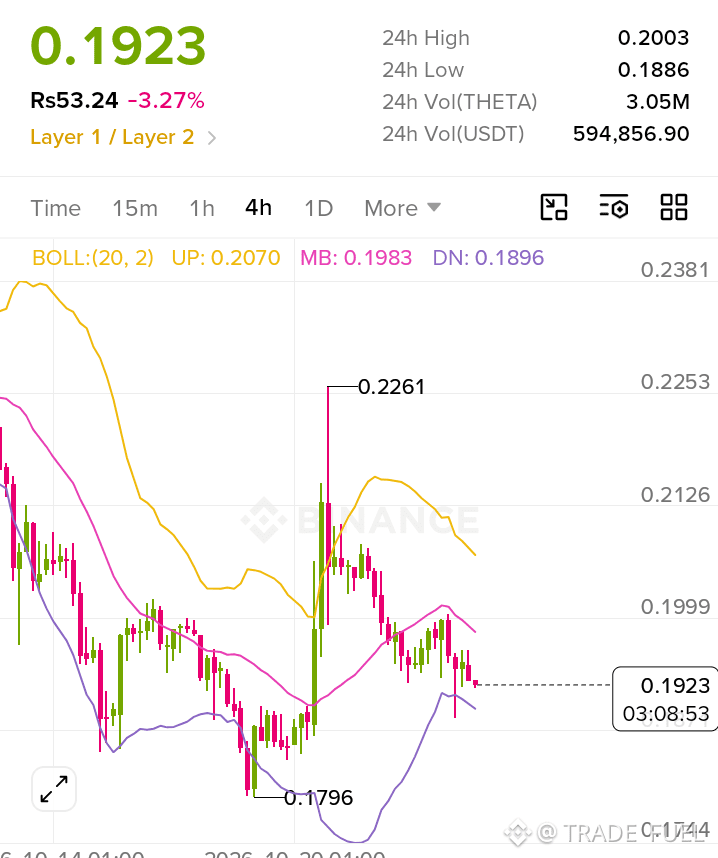
$THETA
🔥🔥 CAPITAL OUTFLOWS (HIGH) Heavy spot dumping saw cumulative net outflows exceeding $150K over key trading hours, accelerating the drop toward the $0.1902 intraday low.
BEARISH TECHNICAL CONTINUATION (MEDIUM) Price rejected at the EMA 99 ($0.1979) and failed to sustain above the midline ($0.1954). The MACD histogram flipped back negative (-0.00003).
MUTED FUNDAMENTAL CATALYST (LOW) EdgeCloud AI integration with Qwen models provided slight stabilization near $0.1940, but lacked follow-through buy volume.
#EarningsSeason $META $TSLA
237
·
--
132
·
--
🏆 Your traffic reward has arrived! Your post under #EarningsSeason has unlocked a traffic reward. Looking forward to seeing more of your content on trending topics!
Needs your support 🙏
#EarningsSeason $TSLA $META
🏆 Your traffic reward has arrived! Your post under #EarningsSeason has unlocked a traffic reward. Looking forward to seeing more of your content on trending topics!
Needs your support 🙏
#EarningsSeason $TSLA $META
Needs your support 🙏
#EarningsSeason $TSLA $META

107
·
--
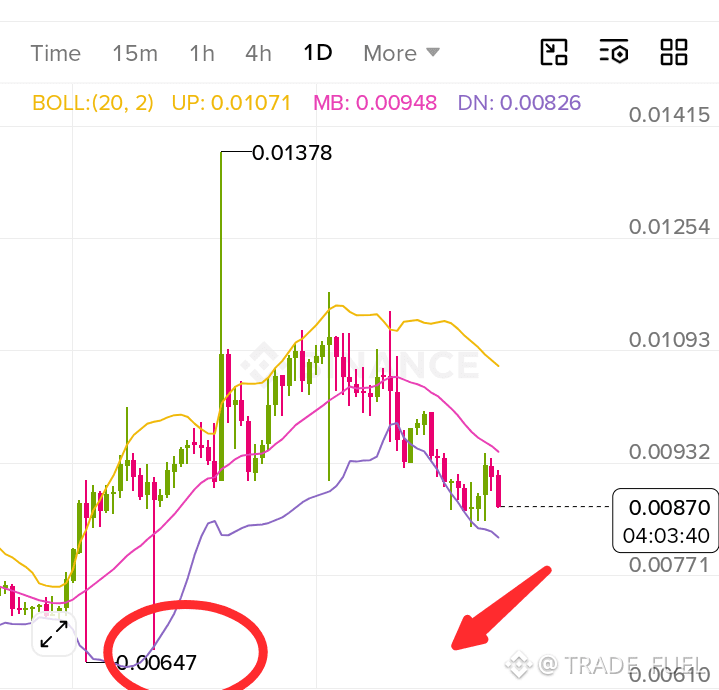
$TFUEL
🔥🔥 Large Order Sell-Offs (High): Spikes in Large Net Outflows of -$5.4K and -$9.5K Triggered Sharp Price Drops Toward $0.0087
Technical Breakdown (Medium): Price Fell Below EMA 7, EMA 25, and EMA 99, While the MACD Histogram Widened Negatively, Intensifying Downward Momentum
Edge Node Expansion Offset (Low): Over 30,000 Active Edge Nodes Sharing GPU Power Failed to Counteract Localized Spot Selling Pressure
Topic: Bearish Market Pressure and Large Sell-Offs
#EarningsSeason $TSLA $META
83
·
--
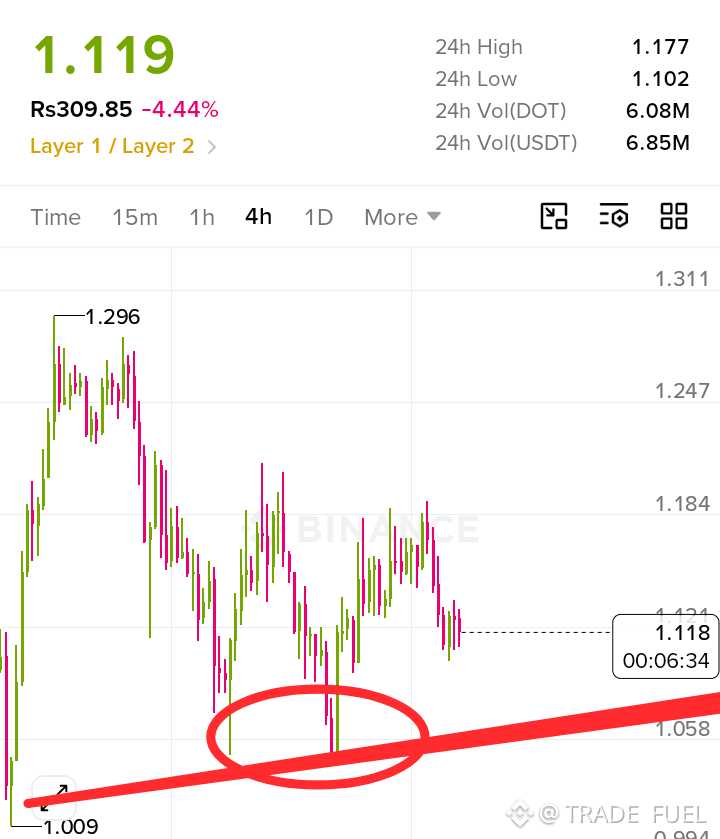
$DOT
🔥🔥 Security Exploit Alert (High): Third Party Fearless Wallet Key Vulnerability Disclosure Triggered Holder Panic and Intensified Selling Pressure Across the Ecosystem
Technical Breakdown (High): Sharp Drop Below Key Moving Averages With EMA 7 Crossing Below EMA 25 Pushed Prices Toward $1.11 Support
Capital Flight (Medium): Large Net Outflows Peaking Near -$486K Accelerated the Intraday Pullback From $1.17 Highs
#EarningsSeason $TSLA $META
262
·
--
🔥 BREAKING:
$100 billion US dollar Is coming from AI stock toward Bitcoin and Crypto stocks due to heavy debt-funded data center costs, high borrowing costs, and sky-high valuations that have raised fears of an AI bubble.
#EarningsSeason $TSLA $META
🔥 BREAKING:
$100 billion US dollar Is coming from AI stock toward Bitcoin and Crypto stocks due to heavy debt-funded data center costs, high borrowing costs, and sky-high valuations that have raised fears of an AI bubble.
#EarningsSeason $TSLA $META
$100 billion US dollar Is coming from AI stock toward Bitcoin and Crypto stocks due to heavy debt-funded data center costs, high borrowing costs, and sky-high valuations that have raised fears of an AI bubble.
#EarningsSeason $TSLA $META
144
·
--
TODAY: 🇺🇸 President Donald Trump is expected to host an event today to highlight government seizures of fraudulent crypto investment websites.
#EarningsSeason $TSLA $META
TODAY: 🇺🇸 President Donald Trump is expected to host an event today to highlight government seizures of fraudulent crypto investment websites.
#EarningsSeason $TSLA $META
#EarningsSeason $TSLA $META
224

Log in to explore more content
Join global crypto users on Binance Square
⚡️ Get latest and useful information about crypto.
💬 Trusted by the world’s largest crypto exchange.
👍 Discover real insights from verified creators.
Email / Phone number