

Muhamamd Adeel
329 Posts

Muhamamd Adeel
Report
Block User
Daily provide Latest News.
10 Following
50 Followers
58 Liked
Posts
All
Quotes
Article
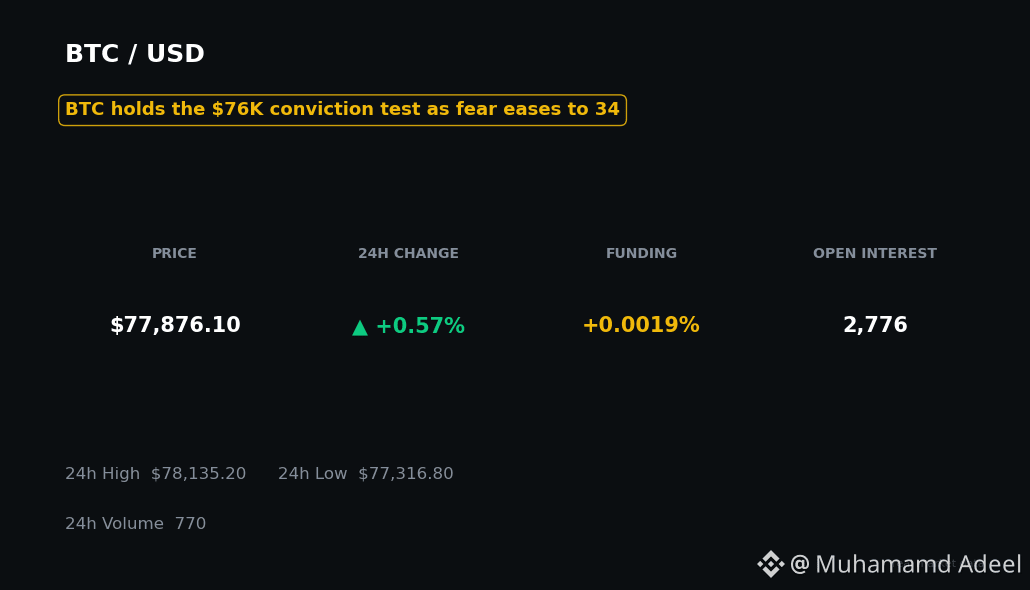
After the $6.3B hack, BTC held $76K — is November the reset?November didn't open with fireworks. It opened with a test — and Bitcoin is sitting right on it.
After the $6.3B Binance hack and a brutal October close, you'd expect panic or a relief rally. Instead: calm on the surface, capitulation underneath.
Here's the number that matters most today. Short-term holders — the people who bought this rally — now sit at breakeven. Their average cost basis is around $76K, according to CryptoQuant contributor Darkfost, with Glassnode putting the same line near $75.8K. On 31 October, that cohort crystallized about $1.115 billion in realized losses, against just $519 million in profits, and pushed more than 36,600 BTC toward exchanges. Over half of short-term-holder supply is now underwater.
That's the market's conviction test.
Why hasn't price collapsed? Because $BTC is still holding that zone — trading around $77.5K–$77.9K on 1 November after closing October at $77,424, down 7.3% for the month, its weakest October in years. Holding is not the same as healing, though. Coins are still moving at a loss in aggregate (SOPR 0.9933), and volume dropped nearly 48% even as price ticked up.
Then there's the Binance reopening — the day's big question mark. Withdrawals resumed in phases on 1 November, and Binance says around 95% of stolen assets have been replaced, with ten major assets fully backed. Whale Alert flagged roughly $2 billion in large transfers out of Binance in the first few hours — 10,000 BTC, nearly $1 billion in USDT, $200 million in USDC and 30,000 ETH. But nobody has confirmed what those transfers were. Customer withdrawals, internal moves to new proof-of-reserves wallets, or a mix — the data doesn't say. Anyone telling you it proves an exodus, or proves confidence, is guessing.
Sentiment tells the same split story. The Fear & Greed Index ticked up to 34 (Fear) from 30, and Santiment's social data shows just 0.22 bullish comments per bearish one for BTC. Fear is easing, not gone.
Institutions haven't voted yet either. US spot ETFs saw $643 million leave Bitcoin funds and $156 million leave $ETH funds on Friday 30 October — the latest completed session. The next print lands Monday, and that's the verdict to watch.
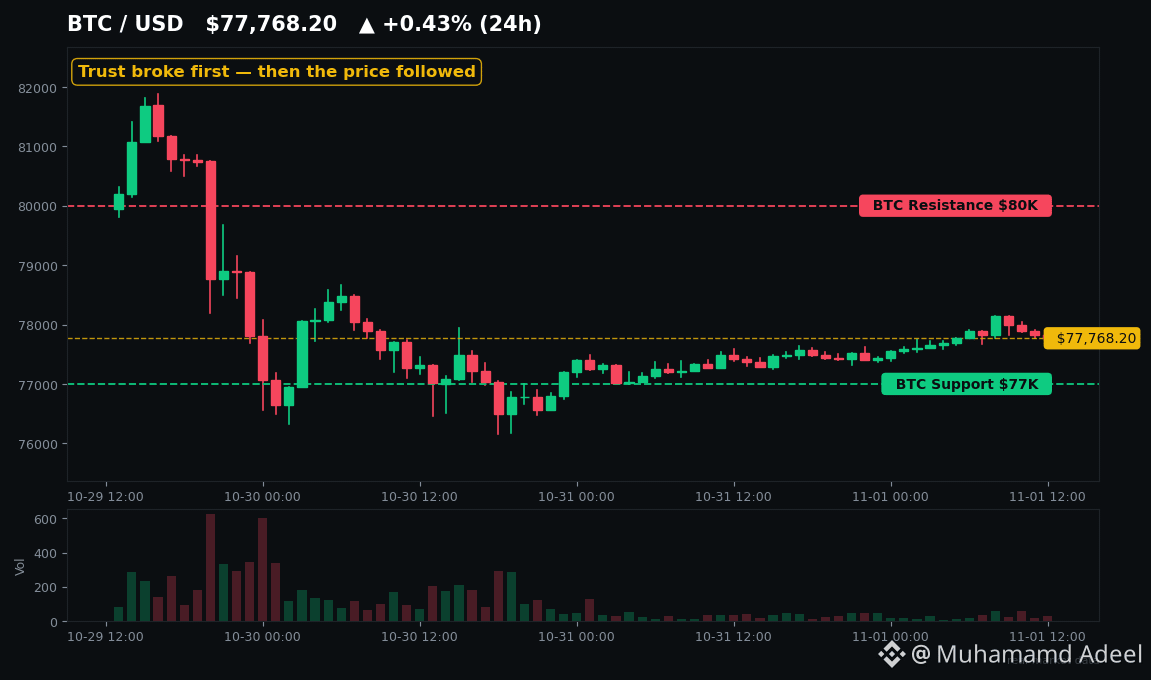
Here's what it really means. If $BTC holds the ~$76K zone, the capitulation hands coins from shaky recent buyers to stronger hands — the classic reset pattern. If it breaks, the $78K–$86K underwater cohort becomes the next pool of forced sellers, with $74K and then $73K as downside markers. Above, the recovery ladder runs $78K, then $80K, then $82.5K.
History warns against calling this early. After the Bybit hack in February 2025, Bitcoin took 18 days to bottom, 22% below its pre-hack close — and three months to reach a new high. And November after a red October has risen in only two of the last five years.
So no, November isn't a reset yet. It's a test. Worth watching on the $BTC chart as the first November signals settle.
Not financial advice. DYOR.
After the $6.3B hack, BTC held $76K — is November the reset?
November didn't open with fireworks. It opened with a test — and Bitcoin is sitting right on it.
After the $6.3B Binance hack and a brutal October close, you'd expect panic or a relief rally. Instead: calm on the surface, capitulation underneath.
Here's the number that matters most today. Short-term holders — the people who bought this rally — now sit at breakeven. Their average cost basis is around $76K, according to CryptoQuant contributor Darkfost, with Glassnode putting the same line near $75.8K. On 31 October, that cohort crystallized about $1.115 billion in realized losses, against just $519 million in profits, and pushed more than 36,600 BTC toward exchanges. Over half of short-term-holder supply is now underwater.
That's the market's conviction test.
Why hasn't price collapsed? Because $BTC is still holding that zone — trading around $77.5K–$77.9K on 1 November after closing October at $77,424, down 7.3% for the month, its weakest October in years. Holding is not the same as healing, though. Coins are still moving at a loss in aggregate (SOPR 0.9933), and volume dropped nearly 48% even as price ticked up.
Then there's the Binance reopening — the day's big question mark. Withdrawals resumed in phases on 1 November, and Binance says around 95% of stolen assets have been replaced, with ten major assets fully backed. Whale Alert flagged roughly $2 billion in large transfers out of Binance in the first few hours — 10,000 BTC, nearly $1 billion in USDT, $200 million in USDC and 30,000 ETH. But nobody has confirmed what those transfers were. Customer withdrawals, internal moves to new proof-of-reserves wallets, or a mix — the data doesn't say. Anyone telling you it proves an exodus, or proves confidence, is guessing.
Sentiment tells the same split story. The Fear & Greed Index ticked up to 34 (Fear) from 30, and Santiment's social data shows just 0.22 bullish comments per bearish one for BTC. Fear is easing, not gone.
Institutions haven't voted yet either. US spot ETFs saw $643 million leave Bitcoin funds and $156 million leave $ETH funds on Friday 30 October — the latest completed session. The next print lands Monday, and that's the verdict to watch.
Here's what it really means. If $BTC holds the ~$76K zone, the capitulation hands coins from shaky recent buyers to stronger hands — the classic reset pattern. If it breaks, the $78K–$86K underwater cohort becomes the next pool of forced sellers, with $74K and then $73K as downside markers. Above, the recovery ladder runs $78K, then $80K, then $82.5K.
History warns against calling this early. After the Bybit hack in February 2025, Bitcoin took 18 days to bottom, 22% below its pre-hack close — and three months to reach a new high. And November after a red October has risen in only two of the last five years.
So no, November isn't a reset yet. It's a test. Worth watching on the $BTC chart as the first November signals settle.
Not financial advice. DYOR.
After the $6.3B Binance hack and a brutal October close, you'd expect panic or a relief rally. Instead: calm on the surface, capitulation underneath.
Here's the number that matters most today. Short-term holders — the people who bought this rally — now sit at breakeven. Their average cost basis is around $76K, according to CryptoQuant contributor Darkfost, with Glassnode putting the same line near $75.8K. On 31 October, that cohort crystallized about $1.115 billion in realized losses, against just $519 million in profits, and pushed more than 36,600 BTC toward exchanges. Over half of short-term-holder supply is now underwater.
That's the market's conviction test.
Why hasn't price collapsed? Because $BTC is still holding that zone — trading around $77.5K–$77.9K on 1 November after closing October at $77,424, down 7.3% for the month, its weakest October in years. Holding is not the same as healing, though. Coins are still moving at a loss in aggregate (SOPR 0.9933), and volume dropped nearly 48% even as price ticked up.
Then there's the Binance reopening — the day's big question mark. Withdrawals resumed in phases on 1 November, and Binance says around 95% of stolen assets have been replaced, with ten major assets fully backed. Whale Alert flagged roughly $2 billion in large transfers out of Binance in the first few hours — 10,000 BTC, nearly $1 billion in USDT, $200 million in USDC and 30,000 ETH. But nobody has confirmed what those transfers were. Customer withdrawals, internal moves to new proof-of-reserves wallets, or a mix — the data doesn't say. Anyone telling you it proves an exodus, or proves confidence, is guessing.
Sentiment tells the same split story. The Fear & Greed Index ticked up to 34 (Fear) from 30, and Santiment's social data shows just 0.22 bullish comments per bearish one for BTC. Fear is easing, not gone.
Institutions haven't voted yet either. US spot ETFs saw $643 million leave Bitcoin funds and $156 million leave $ETH funds on Friday 30 October — the latest completed session. The next print lands Monday, and that's the verdict to watch.
Here's what it really means. If $BTC holds the ~$76K zone, the capitulation hands coins from shaky recent buyers to stronger hands — the classic reset pattern. If it breaks, the $78K–$86K underwater cohort becomes the next pool of forced sellers, with $74K and then $73K as downside markers. Above, the recovery ladder runs $78K, then $80K, then $82.5K.
History warns against calling this early. After the Bybit hack in February 2025, Bitcoin took 18 days to bottom, 22% below its pre-hack close — and three months to reach a new high. And November after a red October has risen in only two of the last five years.
So no, November isn't a reset yet. It's a test. Worth watching on the $BTC chart as the first November signals settle.
Not financial advice. DYOR.
2
Article
Bitcoin just had its worst October in a decade. Here's what November holds.October is supposed to be Bitcoin's month. This one just broke the script.
$BTC closed October at $77,424 — down 7.3% from September's $83,556 close. That's the weakest October in at least a decade, the second losing October in a row, and it leaves Bitcoin about 39% below its $126,223 record high and down 11.5% on the year.
So what killed "Uptober"? It wasn't one thing. It was a pile-up. The Fed held rates at 3.75–4.00% on October 28, with two officials dissenting in favour of a hike. The next evening, hackers drained about $6.3 billion from Binance's hot wallets — the largest crypto theft on record. Then Friday delivered the knockout: the Nasdaq fell 2.86%, Bitcoin touched a monthly low near $76,100, and US spot Bitcoin ETFs saw $643 million walk out the door in a single day, wiping out a four-day, $441 million inflow run in one session.
And it wasn't just Bitcoin. $ETH fell 16.1% in October. $SOL fell 19.2%. When the biggest asset posts the smallest fall, that's not a rotation story — that's a risk-off month.
But here's the twist — and it's why November isn't just October part two.
This weekend, the hack story started turning. Binance reopened Bitcoin withdrawals in phases on Sunday and says about 95% of the stolen assets are replenished, with ten major assets fully backed. The FBI on Saturday blamed North Korea's TraderTraitor actors for the theft. And Binance's full proof-of-reserves — promised for Monday — is now expected around Tuesday. Trust gets rebuilt in public, or not at all, and this week is the test.
On-chain, the market is sitting on a knife's edge, not in free fall. Short-term holders bought at an average near $76,000, so today's price sits right on their breakeven. Coins moving on-chain are changing hands at a slight loss, not a deep capitulation. Fear is real — the Fear & Greed Index sits at 34 — but over 70% of derivatives accounts are still long. That's fear, not surrender.
And history refuses to settle the argument. After the only three red Octobers before this one, November bounced once (up 13% in 2014) and fell twice (down 37% in 2018, down 17.5% in 2025). Three examples is not a forecast. It's a warning against lazy pattern-matching.
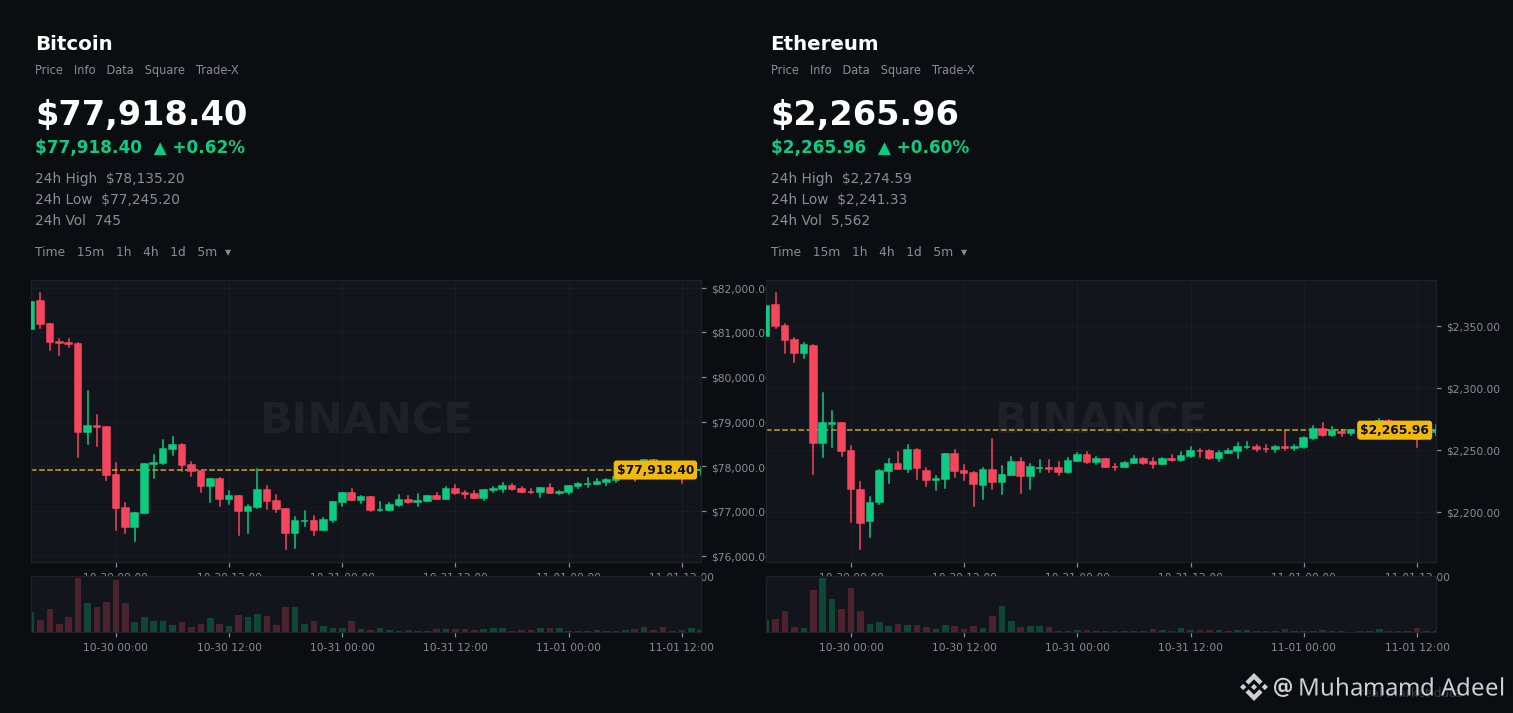
So here's what I'm actually watching. Pull up $BTC's chart and watch the $76,000 zone: holding it keeps the "washout, not breakdown" case alive. Reclaiming $80,000–$82,000 flips the frame. Losing $76,000 puts the low $70,000s back in play. $ETH near $2,265 is your risk-appetite tell, and $SOL near $95 tells you whether high-beta appetite is coming back at all.
The dates that matter: proof-of-reserves around Tuesday, US midterms on November 3, the jobs report on November 6, CPI on November 10. Note what November does not have: a Fed meeting. The next decision is December 8–9, with a hike still priced around 70%.
October's verdict is in. The easy "Uptober" trade is dead. November doesn't reward hoping — it rewards watching the data.
Not financial advice. DYOR.
Bitcoin just had its worst October in a decade. Here's what November holds.
October is supposed to be Bitcoin's month. This one just broke the script.
$BTC closed October at $77,424 — down 7.3% from September's $83,556 close. That's the weakest October in at least a decade, the second losing October in a row, and it leaves Bitcoin about 39% below its $126,223 record high and down 11.5% on the year.
So what killed "Uptober"? It wasn't one thing. It was a pile-up. The Fed held rates at 3.75–4.00% on October 28, with two officials dissenting in favour of a hike. The next evening, hackers drained about $6.3 billion from Binance's hot wallets — the largest crypto theft on record. Then Friday delivered the knockout: the Nasdaq fell 2.86%, Bitcoin touched a monthly low near $76,100, and US spot Bitcoin ETFs saw $643 million walk out the door in a single day, wiping out a four-day, $441 million inflow run in one session.
And it wasn't just Bitcoin. $ETH fell 16.1% in October. $SOL fell 19.2%. When the biggest asset posts the smallest fall, that's not a rotation story — that's a risk-off month.
But here's the twist — and it's why November isn't just October part two.
This weekend, the hack story started turning. Binance reopened Bitcoin withdrawals in phases on Sunday and says about 95% of the stolen assets are replenished, with ten major assets fully backed. The FBI on Saturday blamed North Korea's TraderTraitor actors for the theft. And Binance's full proof-of-reserves — promised for Monday — is now expected around Tuesday. Trust gets rebuilt in public, or not at all, and this week is the test.
On-chain, the market is sitting on a knife's edge, not in free fall. Short-term holders bought at an average near $76,000, so today's price sits right on their breakeven. Coins moving on-chain are changing hands at a slight loss, not a deep capitulation. Fear is real — the Fear & Greed Index sits at 34 — but over 70% of derivatives accounts are still long. That's fear, not surrender.
And history refuses to settle the argument. After the only three red Octobers before this one, November bounced once (up 13% in 2014) and fell twice (down 37% in 2018, down 17.5% in 2025). Three examples is not a forecast. It's a warning against lazy pattern-matching.
So here's what I'm actually watching. Pull up $BTC 's chart and watch the $76,000 zone: holding it keeps the "washout, not breakdown" case alive. Reclaiming $80,000–$82,000 flips the frame. Losing $76,000 puts the low $70,000s back in play. $ETH near $2,265 is your risk-appetite tell, and $SOL near $95 tells you whether high-beta appetite is coming back at all.
The dates that matter: proof-of-reserves around Tuesday, US midterms on November 3, the jobs report on November 6, CPI on November 10. Note what November does not have: a Fed meeting. The next decision is December 8–9, with a hike still priced around 70%.
October's verdict is in. The easy "Uptober" trade is dead. November doesn't reward hoping — it rewards watching the data.
Not financial advice. DYOR.
$BTC closed October at $77,424 — down 7.3% from September's $83,556 close. That's the weakest October in at least a decade, the second losing October in a row, and it leaves Bitcoin about 39% below its $126,223 record high and down 11.5% on the year.
So what killed "Uptober"? It wasn't one thing. It was a pile-up. The Fed held rates at 3.75–4.00% on October 28, with two officials dissenting in favour of a hike. The next evening, hackers drained about $6.3 billion from Binance's hot wallets — the largest crypto theft on record. Then Friday delivered the knockout: the Nasdaq fell 2.86%, Bitcoin touched a monthly low near $76,100, and US spot Bitcoin ETFs saw $643 million walk out the door in a single day, wiping out a four-day, $441 million inflow run in one session.
And it wasn't just Bitcoin. $ETH fell 16.1% in October. $SOL fell 19.2%. When the biggest asset posts the smallest fall, that's not a rotation story — that's a risk-off month.
But here's the twist — and it's why November isn't just October part two.
This weekend, the hack story started turning. Binance reopened Bitcoin withdrawals in phases on Sunday and says about 95% of the stolen assets are replenished, with ten major assets fully backed. The FBI on Saturday blamed North Korea's TraderTraitor actors for the theft. And Binance's full proof-of-reserves — promised for Monday — is now expected around Tuesday. Trust gets rebuilt in public, or not at all, and this week is the test.
On-chain, the market is sitting on a knife's edge, not in free fall. Short-term holders bought at an average near $76,000, so today's price sits right on their breakeven. Coins moving on-chain are changing hands at a slight loss, not a deep capitulation. Fear is real — the Fear & Greed Index sits at 34 — but over 70% of derivatives accounts are still long. That's fear, not surrender.
And history refuses to settle the argument. After the only three red Octobers before this one, November bounced once (up 13% in 2014) and fell twice (down 37% in 2018, down 17.5% in 2025). Three examples is not a forecast. It's a warning against lazy pattern-matching.
So here's what I'm actually watching. Pull up $BTC 's chart and watch the $76,000 zone: holding it keeps the "washout, not breakdown" case alive. Reclaiming $80,000–$82,000 flips the frame. Losing $76,000 puts the low $70,000s back in play. $ETH near $2,265 is your risk-appetite tell, and $SOL near $95 tells you whether high-beta appetite is coming back at all.
The dates that matter: proof-of-reserves around Tuesday, US midterms on November 3, the jobs report on November 6, CPI on November 10. Note what November does not have: a Fed meeting. The next decision is December 8–9, with a hike still priced around 70%.
October's verdict is in. The easy "Uptober" trade is dead. November doesn't reward hoping — it rewards watching the data.
Not financial advice. DYOR.
3
Article
Hong Kong Just Let Retail Trade Tokenized Funds 24/7 — While $ONDO Holds $0.40Hong Kong just did what Wall Street has been debating for years.
From tomorrow, retail investors there can trade tokenized funds around the clock — 24/7, on a licensed platform, like crypto. Not a pilot for institutions. Not a press release. Actual secondary trading.
Here's the setup: two ChinaAMC tokenized money market funds (one HKD, one USD) started trading on PantherTrade on 26 October, and retail access opens via Futu's Futubull app from 2 November. Hong Kong now counts around $1.3 billion across 17 retail tokenized products, up 78% year on year, according to SFC figures cited in local coverage.
Why should you care if you don't live in Hong Kong? Because this is the first time a major regulator has let ordinary investors trade tokenized funds on a secondary market. This is the moment tokenization stops being a demo and starts being a market.
And the timing is wild. The same week, NEAR and Ondo announced tokenized US stocks and ETFs will flow through NEAR's 1Click swap API, building on 20 products launched in September. Tokenized stocks overall hit $3.77 billion in distributed value, up nearly 18% in 30 days.
But here's the part nobody's hyping: activity is going the other way. Monthly active addresses fell almost 40% to about 2.12 million, and transfer volume collapsed nearly 87% to $10.14 billion. Value up, usage down. That's the chart of a market still searching for real users.
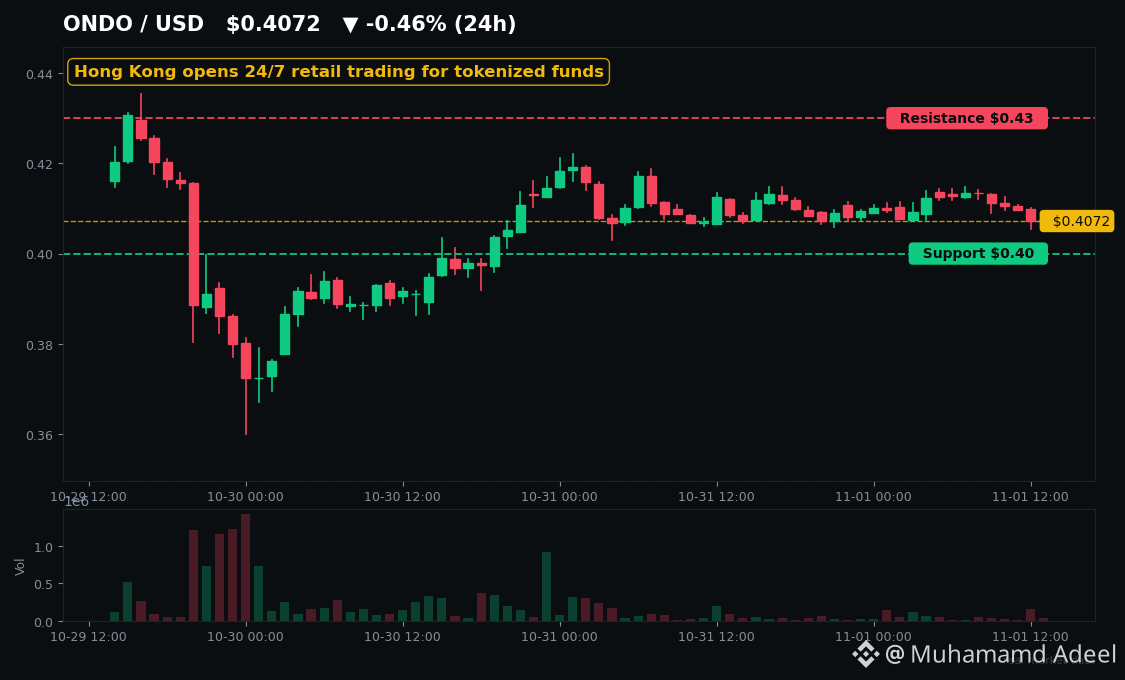
So what does this mean for the trade? Watch $ONDO, sitting around $0.41. The level that matters is $0.40 — traders flipped it to support, and holding it keeps the door open to $0.43, then the bigger $0.50 test everyone is watching. Lose $0.40 and the bounce story falls apart fast. Pull up the $ONDO chart and you'll see the fight playing out right there.
$LINK matters here too — it's the plumbing. Hanwha Investment & Securities adopted Chainlink's data standard for its RWA platform on 29 October, and Chainlink's compliance engine just landed in Abu Dhabi's ADGM. Tokenization doesn't work without trusted data, and that's LINK's lane.
Now the honest part. This market has died before — Binance killed its stock tokens in 2021 after regulators stepped in, and FTX's stock tokens went to zero with the exchange. Today, 33 issuers including JPMorgan and Coca-Cola have objected to a tokenized-stock venue, and just three issuers control about 85% of tokenized stocks. A tokenized stock is only real equity if its legal structure says so — some are just price exposure. And $ONDO holders own governance, not revenue, with a ~1.7 billion-token unlock due in January 2027.
The IMF's warning sums it up: tokenized stocks run about 1.5x the volatility of the shares themselves, even as most trading happens outside US hours. The demand is real. The plumbing is still fragile.
Hong Kong just proved the model can go live for retail. The question now is whether the rest of the world follows — or watches another cycle stall.
Not financial advice. DYOR.
Hong Kong Just Let Retail Trade Tokenized Funds 24/7 — While $ONDO Holds $0.40
Hong Kong just did what Wall Street has been debating for years.
From tomorrow, retail investors there can trade tokenized funds around the clock — 24/7, on a licensed platform, like crypto. Not a pilot for institutions. Not a press release. Actual secondary trading.
Here's the setup: two ChinaAMC tokenized money market funds (one HKD, one USD) started trading on PantherTrade on 26 October, and retail access opens via Futu's Futubull app from 2 November. Hong Kong now counts around $1.3 billion across 17 retail tokenized products, up 78% year on year, according to SFC figures cited in local coverage.
Why should you care if you don't live in Hong Kong? Because this is the first time a major regulator has let ordinary investors trade tokenized funds on a secondary market. This is the moment tokenization stops being a demo and starts being a market.
And the timing is wild. The same week, NEAR and Ondo announced tokenized US stocks and ETFs will flow through NEAR's 1Click swap API, building on 20 products launched in September. Tokenized stocks overall hit $3.77 billion in distributed value, up nearly 18% in 30 days.
But here's the part nobody's hyping: activity is going the other way. Monthly active addresses fell almost 40% to about 2.12 million, and transfer volume collapsed nearly 87% to $10.14 billion. Value up, usage down. That's the chart of a market still searching for real users.
So what does this mean for the trade? Watch $ONDO , sitting around $0.41. The level that matters is $0.40 — traders flipped it to support, and holding it keeps the door open to $0.43, then the bigger $0.50 test everyone is watching. Lose $0.40 and the bounce story falls apart fast. Pull up the $ONDO chart and you'll see the fight playing out right there.
$LINK matters here too — it's the plumbing. Hanwha Investment & Securities adopted Chainlink's data standard for its RWA platform on 29 October, and Chainlink's compliance engine just landed in Abu Dhabi's ADGM. Tokenization doesn't work without trusted data, and that's LINK's lane.
Now the honest part. This market has died before — Binance killed its stock tokens in 2021 after regulators stepped in, and FTX's stock tokens went to zero with the exchange. Today, 33 issuers including JPMorgan and Coca-Cola have objected to a tokenized-stock venue, and just three issuers control about 85% of tokenized stocks. A tokenized stock is only real equity if its legal structure says so — some are just price exposure. And $ONDO holders own governance, not revenue, with a ~1.7 billion-token unlock due in January 2027.
The IMF's warning sums it up: tokenized stocks run about 1.5x the volatility of the shares themselves, even as most trading happens outside US hours. The demand is real. The plumbing is still fragile.
Hong Kong just proved the model can go live for retail. The question now is whether the rest of the world follows — or watches another cycle stall.
Not financial advice. DYOR.
From tomorrow, retail investors there can trade tokenized funds around the clock — 24/7, on a licensed platform, like crypto. Not a pilot for institutions. Not a press release. Actual secondary trading.
Here's the setup: two ChinaAMC tokenized money market funds (one HKD, one USD) started trading on PantherTrade on 26 October, and retail access opens via Futu's Futubull app from 2 November. Hong Kong now counts around $1.3 billion across 17 retail tokenized products, up 78% year on year, according to SFC figures cited in local coverage.
Why should you care if you don't live in Hong Kong? Because this is the first time a major regulator has let ordinary investors trade tokenized funds on a secondary market. This is the moment tokenization stops being a demo and starts being a market.
And the timing is wild. The same week, NEAR and Ondo announced tokenized US stocks and ETFs will flow through NEAR's 1Click swap API, building on 20 products launched in September. Tokenized stocks overall hit $3.77 billion in distributed value, up nearly 18% in 30 days.
But here's the part nobody's hyping: activity is going the other way. Monthly active addresses fell almost 40% to about 2.12 million, and transfer volume collapsed nearly 87% to $10.14 billion. Value up, usage down. That's the chart of a market still searching for real users.
So what does this mean for the trade? Watch $ONDO , sitting around $0.41. The level that matters is $0.40 — traders flipped it to support, and holding it keeps the door open to $0.43, then the bigger $0.50 test everyone is watching. Lose $0.40 and the bounce story falls apart fast. Pull up the $ONDO chart and you'll see the fight playing out right there.
$LINK matters here too — it's the plumbing. Hanwha Investment & Securities adopted Chainlink's data standard for its RWA platform on 29 October, and Chainlink's compliance engine just landed in Abu Dhabi's ADGM. Tokenization doesn't work without trusted data, and that's LINK's lane.
Now the honest part. This market has died before — Binance killed its stock tokens in 2021 after regulators stepped in, and FTX's stock tokens went to zero with the exchange. Today, 33 issuers including JPMorgan and Coca-Cola have objected to a tokenized-stock venue, and just three issuers control about 85% of tokenized stocks. A tokenized stock is only real equity if its legal structure says so — some are just price exposure. And $ONDO holders own governance, not revenue, with a ~1.7 billion-token unlock due in January 2027.
The IMF's warning sums it up: tokenized stocks run about 1.5x the volatility of the shares themselves, even as most trading happens outside US hours. The demand is real. The plumbing is still fragile.
Hong Kong just proved the model can go live for retail. The question now is whether the rest of the world follows — or watches another cycle stall.
Not financial advice. DYOR.
4
Article
ZachXBT Flags 42M AXIS Dump — Did Insiders Crash Binance's New Robot Token 40%?You bought the Binance listing. Someone else sold 42 million $AXIS into you.
Eight days after its Binance Alpha debut, the token crashed roughly 40% in a day — and the chain trail is the whole story.
WHAT AXIS IS
Axis Robotics is a Physical AI project — it pays contributors for robot-training data. Its token is an ERC-20 on Base with a fixed supply of 1 billion, of which just 165 million (16.5%) circulated at launch.
Binance Alpha listed it first on October 21, after a September community sale at $0.10. By October 24 it had run to about $0.37.
WHAT HAPPENED
On-chain investigator ZachXBT alleged that suspected insiders received more than 76 million AXIS — worth over $12 million — from the team's multisig wallet. One entity, he said, took about 42 million AXIS across six addresses and sold it for 5.04 million USDC on Base DEXs within 24 hours.
That single sale was roughly a quarter of everything tradable at launch. Today $AXIS trades around $0.13, with a market cap near $22 million — about 64% below its peak, roughly half gone in a week.
THE OTHER SIDE
Axis denies it outright. The team says no team or investor tokens were sold. The tokens, it claims, came from the ecosystem allocation inside the initial circulating supply, handed to a single unnamed OTC counterparty under a written lock-up deal — and that counterparty allegedly broke it, dumping through hundreds of fresh addresses within hours of delivery.
Axis says it has cut ties and is pursuing legal remedies. It also points to 835 million AXIS — 83.5% of supply — still sitting in a vesting contract co-managed with Binance, needing 4-of-6 multisig approval.
Here's what this really means: both stories can be partly true. ZachXBT traces where the tokens came from; Axis describes where it says they went. Nobody has proven who controlled the selling wallets, and the counterparty still has no name. What is proven is the structure — a thin float, a huge locked pile behind a handful of signatures, and a lock-up enforced by paper, not code.
THE LEVELS THAT MATTER
Check the $AXIS chart. Around $0.13 is the line to hold — lose it and there's no nearby floor. Reclaiming $0.15 would be the first sign sellers are exhausted. The old $0.37 high is a distant memory, not a target.
And November adds pressure of its own: roughly 20 million more ecosystem tokens unlock this month, about 12% of the launch float.
History says this is the rule for Alpha listings, not the exception: most fade hard from their peaks, and ZKJ and KOGE lost 80–90% in a day in 2025. AXIS fell less — but its concentration makes it just as dangerous.
So is this an $AXIS-only story, or part of a wider risk-off mood? Watch $BTC for the answer. On a 16.5% float, one seller is a market event.
Would you buy this dip, or wait until the team names the seller?
Not financial advice. DYOR.
ZachXBT Flags 42M AXIS Dump — Did Insiders Crash Binance's New Robot Token 40%?
You bought the Binance listing. Someone else sold 42 million $AXIS into you.
Eight days after its Binance Alpha debut, the token crashed roughly 40% in a day — and the chain trail is the whole story.
WHAT AXIS IS
Axis Robotics is a Physical AI project — it pays contributors for robot-training data. Its token is an ERC-20 on Base with a fixed supply of 1 billion, of which just 165 million (16.5%) circulated at launch.
Binance Alpha listed it first on October 21, after a September community sale at $0.10. By October 24 it had run to about $0.37.
WHAT HAPPENED
On-chain investigator ZachXBT alleged that suspected insiders received more than 76 million AXIS — worth over $12 million — from the team's multisig wallet. One entity, he said, took about 42 million AXIS across six addresses and sold it for 5.04 million USDC on Base DEXs within 24 hours.
That single sale was roughly a quarter of everything tradable at launch. Today $AXIS trades around $0.13, with a market cap near $22 million — about 64% below its peak, roughly half gone in a week.
THE OTHER SIDE
Axis denies it outright. The team says no team or investor tokens were sold. The tokens, it claims, came from the ecosystem allocation inside the initial circulating supply, handed to a single unnamed OTC counterparty under a written lock-up deal — and that counterparty allegedly broke it, dumping through hundreds of fresh addresses within hours of delivery.
Axis says it has cut ties and is pursuing legal remedies. It also points to 835 million AXIS — 83.5% of supply — still sitting in a vesting contract co-managed with Binance, needing 4-of-6 multisig approval.
Here's what this really means: both stories can be partly true. ZachXBT traces where the tokens came from; Axis describes where it says they went. Nobody has proven who controlled the selling wallets, and the counterparty still has no name. What is proven is the structure — a thin float, a huge locked pile behind a handful of signatures, and a lock-up enforced by paper, not code.
THE LEVELS THAT MATTER
Check the $AXIS chart. Around $0.13 is the line to hold — lose it and there's no nearby floor. Reclaiming $0.15 would be the first sign sellers are exhausted. The old $0.37 high is a distant memory, not a target.
And November adds pressure of its own: roughly 20 million more ecosystem tokens unlock this month, about 12% of the launch float.
History says this is the rule for Alpha listings, not the exception: most fade hard from their peaks, and ZKJ and KOGE lost 80–90% in a day in 2025. AXIS fell less — but its concentration makes it just as dangerous.
So is this an $AXIS -only story, or part of a wider risk-off mood? Watch $BTC for the answer. On a 16.5% float, one seller is a market event.
Would you buy this dip, or wait until the team names the seller?
Not financial advice. DYOR.
Eight days after its Binance Alpha debut, the token crashed roughly 40% in a day — and the chain trail is the whole story.
WHAT AXIS IS
Axis Robotics is a Physical AI project — it pays contributors for robot-training data. Its token is an ERC-20 on Base with a fixed supply of 1 billion, of which just 165 million (16.5%) circulated at launch.
Binance Alpha listed it first on October 21, after a September community sale at $0.10. By October 24 it had run to about $0.37.
WHAT HAPPENED
On-chain investigator ZachXBT alleged that suspected insiders received more than 76 million AXIS — worth over $12 million — from the team's multisig wallet. One entity, he said, took about 42 million AXIS across six addresses and sold it for 5.04 million USDC on Base DEXs within 24 hours.
That single sale was roughly a quarter of everything tradable at launch. Today $AXIS trades around $0.13, with a market cap near $22 million — about 64% below its peak, roughly half gone in a week.
THE OTHER SIDE
Axis denies it outright. The team says no team or investor tokens were sold. The tokens, it claims, came from the ecosystem allocation inside the initial circulating supply, handed to a single unnamed OTC counterparty under a written lock-up deal — and that counterparty allegedly broke it, dumping through hundreds of fresh addresses within hours of delivery.
Axis says it has cut ties and is pursuing legal remedies. It also points to 835 million AXIS — 83.5% of supply — still sitting in a vesting contract co-managed with Binance, needing 4-of-6 multisig approval.
Here's what this really means: both stories can be partly true. ZachXBT traces where the tokens came from; Axis describes where it says they went. Nobody has proven who controlled the selling wallets, and the counterparty still has no name. What is proven is the structure — a thin float, a huge locked pile behind a handful of signatures, and a lock-up enforced by paper, not code.
THE LEVELS THAT MATTER
Check the $AXIS chart. Around $0.13 is the line to hold — lose it and there's no nearby floor. Reclaiming $0.15 would be the first sign sellers are exhausted. The old $0.37 high is a distant memory, not a target.
And November adds pressure of its own: roughly 20 million more ecosystem tokens unlock this month, about 12% of the launch float.
History says this is the rule for Alpha listings, not the exception: most fade hard from their peaks, and ZKJ and KOGE lost 80–90% in a day in 2025. AXIS fell less — but its concentration makes it just as dangerous.
So is this an $AXIS -only story, or part of a wider risk-off mood? Watch $BTC for the answer. On a 16.5% float, one seller is a market event.
Would you buy this dip, or wait until the team names the seller?
Not financial advice. DYOR.
Article
While ETFs Dumped $431M, 1.23M ETH Queued to Stake — Someone Knows SomethingWhile Wall Street's ETH ETFs bled $431 million in a single week, something strange happened on-chain. 1.23 million ETH — worth roughly $2.8 billion — lined up to be staked.
The exit queue? Just 1,682 ETH.
Read that again. For every 1 ETH waiting to leave staking, about 730 are waiting to get in. That is not a market giving up on Ethereum. That is a market quietly locking it away.
THE QUEUE THAT BROKE THE BEAR CASE
Total staked ETH just hit a record of about 43.8 million — roughly 36% of all ETH in existence, according to CryptoQuant data cited by crypto.news. The entry queue carries a wait of around 21 days, and it is still growing even after ETH slid about 5% on the week.
And this is happening while US spot ETH ETFs just logged 23 straight sessions of outflows — the longest streak since they launched — with more than $1 billion leaving in October alone. Institutions sold. Stakers bought the dip. One of those two groups is wrong.
History says don't dismiss the stakers too fast. In September 2025, the exit queue swelled to 2.67 million ETH and everyone braced for a flood of selling. Within months it had collapsed to near zero — and the entry queue took over. Queue extremes have marked turning points before, not continuations.
THE RATIO TEST
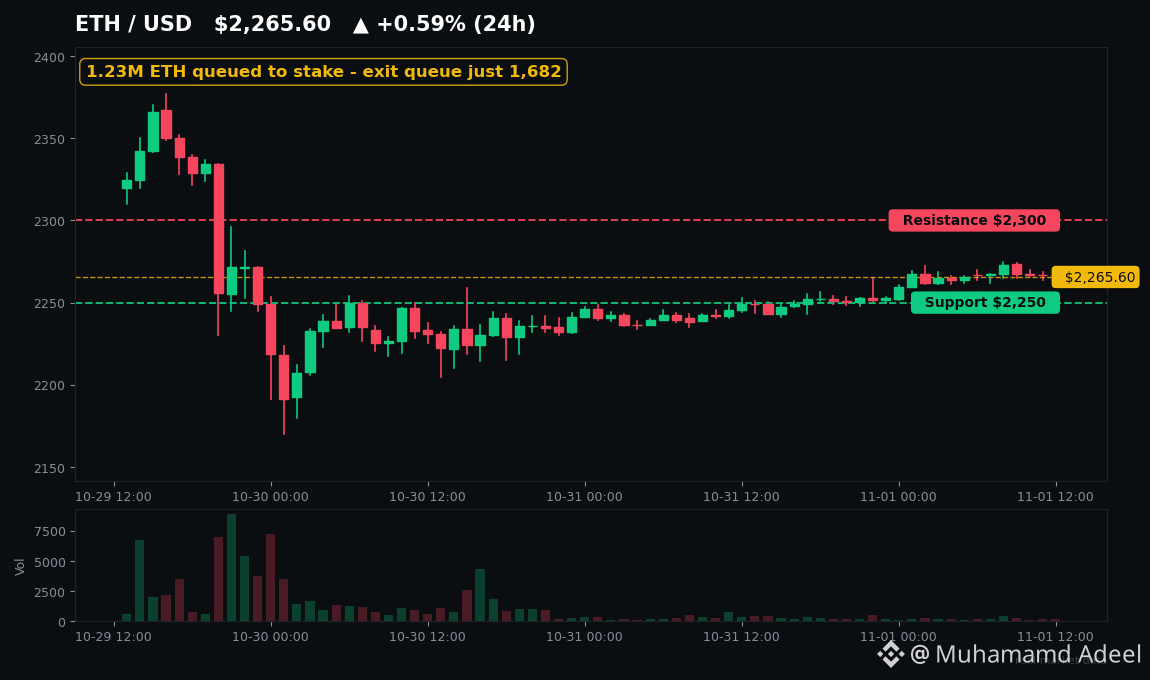
Here's the other half of the setup. $ETH is trading around $2,265, up about 1% on the day after reclaiming $2,250, while the ETH/BTC ratio sits near 0.029 — close to multi-year lows. $BTC has beaten ETH by roughly 8% over the past month.
Traders are watching two lines: $2,250 as the support to hold, $2,300 as the resistance to reclaim. A clean break above $2,300 opens the path toward $2,400. A failure at $2,250 puts the recent $2,170 low back in play. Either way, this is the range where the next move gets decided — worth keeping $ETH's chart open this week.
THE HONEST RISKS
Now the part the bulls skip. Staking yield has compressed to about 2.63%, well below the ~4.2% on short-term US Treasuries. The biggest corporate buyer, BitMine, now holds over 6 million ETH — nearly 5% of supply — and is close to its own self-imposed buying cap. And Ethereum's next upgrade catalyst, Glamsterdam, just saw its Hoodi testnet step halted with no new date set.
So no, this is not a guaranteed reversal. It is a standoff: record on-chain conviction on one side, institutional selling and fading yield on the other.
But here's what this really means: when the people closest to the asset lock up 36% of it while everyone else panics, that divergence is usually the story. Watch the queue, watch $2,300, and watch whether ETF flows finally stop bleeding in the week ahead.
Not financial advice. DYOR.
While ETFs Dumped $431M, 1.23M ETH Queued to Stake — Someone Knows Something
While Wall Street's ETH ETFs bled $431 million in a single week, something strange happened on-chain. 1.23 million ETH — worth roughly $2.8 billion — lined up to be staked.
The exit queue? Just 1,682 ETH.
Read that again. For every 1 ETH waiting to leave staking, about 730 are waiting to get in. That is not a market giving up on Ethereum. That is a market quietly locking it away.
THE QUEUE THAT BROKE THE BEAR CASE
Total staked ETH just hit a record of about 43.8 million — roughly 36% of all ETH in existence, according to CryptoQuant data cited by crypto.news. The entry queue carries a wait of around 21 days, and it is still growing even after ETH slid about 5% on the week.
And this is happening while US spot ETH ETFs just logged 23 straight sessions of outflows — the longest streak since they launched — with more than $1 billion leaving in October alone. Institutions sold. Stakers bought the dip. One of those two groups is wrong.
History says don't dismiss the stakers too fast. In September 2025, the exit queue swelled to 2.67 million ETH and everyone braced for a flood of selling. Within months it had collapsed to near zero — and the entry queue took over. Queue extremes have marked turning points before, not continuations.
THE RATIO TEST
Here's the other half of the setup. $ETH is trading around $2,265, up about 1% on the day after reclaiming $2,250, while the ETH/BTC ratio sits near 0.029 — close to multi-year lows. $BTC has beaten ETH by roughly 8% over the past month.
Traders are watching two lines: $2,250 as the support to hold, $2,300 as the resistance to reclaim. A clean break above $2,300 opens the path toward $2,400. A failure at $2,250 puts the recent $2,170 low back in play. Either way, this is the range where the next move gets decided — worth keeping $ETH 's chart open this week.
THE HONEST RISKS
Now the part the bulls skip. Staking yield has compressed to about 2.63%, well below the ~4.2% on short-term US Treasuries. The biggest corporate buyer, BitMine, now holds over 6 million ETH — nearly 5% of supply — and is close to its own self-imposed buying cap. And Ethereum's next upgrade catalyst, Glamsterdam, just saw its Hoodi testnet step halted with no new date set.
So no, this is not a guaranteed reversal. It is a standoff: record on-chain conviction on one side, institutional selling and fading yield on the other.
But here's what this really means: when the people closest to the asset lock up 36% of it while everyone else panics, that divergence is usually the story. Watch the queue, watch $2,300, and watch whether ETF flows finally stop bleeding in the week ahead.
Not financial advice. DYOR.
The exit queue? Just 1,682 ETH.
Read that again. For every 1 ETH waiting to leave staking, about 730 are waiting to get in. That is not a market giving up on Ethereum. That is a market quietly locking it away.
THE QUEUE THAT BROKE THE BEAR CASE
Total staked ETH just hit a record of about 43.8 million — roughly 36% of all ETH in existence, according to CryptoQuant data cited by crypto.news. The entry queue carries a wait of around 21 days, and it is still growing even after ETH slid about 5% on the week.
And this is happening while US spot ETH ETFs just logged 23 straight sessions of outflows — the longest streak since they launched — with more than $1 billion leaving in October alone. Institutions sold. Stakers bought the dip. One of those two groups is wrong.
History says don't dismiss the stakers too fast. In September 2025, the exit queue swelled to 2.67 million ETH and everyone braced for a flood of selling. Within months it had collapsed to near zero — and the entry queue took over. Queue extremes have marked turning points before, not continuations.
THE RATIO TEST
Here's the other half of the setup. $ETH is trading around $2,265, up about 1% on the day after reclaiming $2,250, while the ETH/BTC ratio sits near 0.029 — close to multi-year lows. $BTC has beaten ETH by roughly 8% over the past month.
Traders are watching two lines: $2,250 as the support to hold, $2,300 as the resistance to reclaim. A clean break above $2,300 opens the path toward $2,400. A failure at $2,250 puts the recent $2,170 low back in play. Either way, this is the range where the next move gets decided — worth keeping $ETH 's chart open this week.
THE HONEST RISKS
Now the part the bulls skip. Staking yield has compressed to about 2.63%, well below the ~4.2% on short-term US Treasuries. The biggest corporate buyer, BitMine, now holds over 6 million ETH — nearly 5% of supply — and is close to its own self-imposed buying cap. And Ethereum's next upgrade catalyst, Glamsterdam, just saw its Hoodi testnet step halted with no new date set.
So no, this is not a guaranteed reversal. It is a standoff: record on-chain conviction on one side, institutional selling and fading yield on the other.
But here's what this really means: when the people closest to the asset lock up 36% of it while everyone else panics, that divergence is usually the story. Watch the queue, watch $2,300, and watch whether ETF flows finally stop bleeding in the week ahead.
Not financial advice. DYOR.
1
Article
The $1.5B Flush Ended. The Leverage Rebuild Hasn't BegunThe $1.5B flush is over. Here's the uncomfortable part: the leverage never really left.
On 29-30 October, roughly $1.5B in leveraged crypto bets got wiped out in 24 hours — about 84% of them longs — after Binance disclosed a ~$6.3B security incident. $BTC fell to a six-week low near $76,460 and lost $80K. It felt like a reset. The tape since then tells a different story.
Liquidations have collapsed more than 90%, to under ~$100M a day. The forced selling is done. But total open interest fell only about 3%, to ~$136B. Compare that to real resets: open interest fell ~50% in December 2021 and ~43% in the October 2025 flush. This one barely dented the leverage pile. It cleared the weakest hands, not the leverage itself.
And look at who's left standing. On Binance, 71.6% of accounts are long — a 2.52 long/short ratio — while $BTC sits pinned near $78K, under $80K. BTC funding is only mildly positive, around +0.01% per 8 hours on Binance: longs are paying, but nobody's euphoric. $ETH is the split worth watching — funding is mixed to negative on the big venues, meaning shorts are crowded there, which is exactly the setup that can snap back hard if price turns.
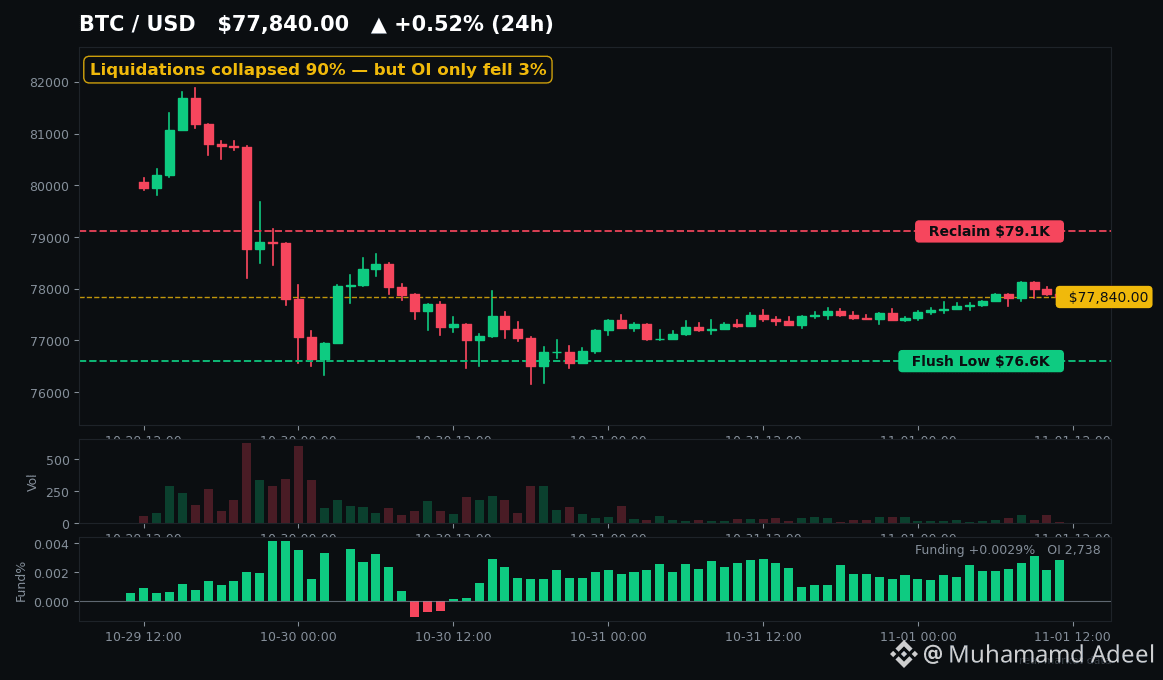
So the market isn't rebuilt and it isn't clean. It's coiled. The liquidation map shows why: roughly $434M in short liquidity stacked just above, the biggest cluster near $78,257, and about $421M in long liquidity below, thickest near $76,789. That's a squeeze box with $76.6K support underneath and $79.1K resistance on top. A break either way doesn't just move price — it feeds on itself.
History is blunt about partial resets like this. December 2021 chopped for weeks after its flush, then broke down. May 2021 chopped for months. The fast V-recoveries came only when the shock was purely external and spot buyers came straight back. This time, spot hasn't: US Bitcoin ETFs saw $643M of outflows on 30 October, coinciding with the chaos, and Binance's withdrawal reopening is still phased — 15 networks on Sunday, with full restoration and proof-of-reserves still pending.
So here's what this really means. Don't mistake a quiet book for a healthy one. Watch $79.1K above — a reclaim there starts chewing through those stacked shorts. Watch $76.6K below — a loss there unwinds the crowded longs. And watch Monday's ETF flows and the full withdrawal reopening: until spot demand returns, every derivatives bounce is guilty until proven innocent. High-beta names like $SOL will follow whichever way $BTC breaks, not lead it.
Not financial advice. DYOR.
The $1.5B Flush Ended. The Leverage Rebuild Hasn't Begun
The $1.5B flush is over. Here's the uncomfortable part: the leverage never really left.
On 29-30 October, roughly $1.5B in leveraged crypto bets got wiped out in 24 hours — about 84% of them longs — after Binance disclosed a ~$6.3B security incident. $BTC fell to a six-week low near $76,460 and lost $80K. It felt like a reset. The tape since then tells a different story.
Liquidations have collapsed more than 90%, to under ~$100M a day. The forced selling is done. But total open interest fell only about 3%, to ~$136B. Compare that to real resets: open interest fell ~50% in December 2021 and ~43% in the October 2025 flush. This one barely dented the leverage pile. It cleared the weakest hands, not the leverage itself.
And look at who's left standing. On Binance, 71.6% of accounts are long — a 2.52 long/short ratio — while $BTC sits pinned near $78K, under $80K. BTC funding is only mildly positive, around +0.01% per 8 hours on Binance: longs are paying, but nobody's euphoric. $ETH is the split worth watching — funding is mixed to negative on the big venues, meaning shorts are crowded there, which is exactly the setup that can snap back hard if price turns.
So the market isn't rebuilt and it isn't clean. It's coiled. The liquidation map shows why: roughly $434M in short liquidity stacked just above, the biggest cluster near $78,257, and about $421M in long liquidity below, thickest near $76,789. That's a squeeze box with $76.6K support underneath and $79.1K resistance on top. A break either way doesn't just move price — it feeds on itself.
History is blunt about partial resets like this. December 2021 chopped for weeks after its flush, then broke down. May 2021 chopped for months. The fast V-recoveries came only when the shock was purely external and spot buyers came straight back. This time, spot hasn't: US Bitcoin ETFs saw $643M of outflows on 30 October, coinciding with the chaos, and Binance's withdrawal reopening is still phased — 15 networks on Sunday, with full restoration and proof-of-reserves still pending.
So here's what this really means. Don't mistake a quiet book for a healthy one. Watch $79.1K above — a reclaim there starts chewing through those stacked shorts. Watch $76.6K below — a loss there unwinds the crowded longs. And watch Monday's ETF flows and the full withdrawal reopening: until spot demand returns, every derivatives bounce is guilty until proven innocent. High-beta names like $SOL will follow whichever way $BTC breaks, not lead it.
Not financial advice. DYOR.
On 29-30 October, roughly $1.5B in leveraged crypto bets got wiped out in 24 hours — about 84% of them longs — after Binance disclosed a ~$6.3B security incident. $BTC fell to a six-week low near $76,460 and lost $80K. It felt like a reset. The tape since then tells a different story.
Liquidations have collapsed more than 90%, to under ~$100M a day. The forced selling is done. But total open interest fell only about 3%, to ~$136B. Compare that to real resets: open interest fell ~50% in December 2021 and ~43% in the October 2025 flush. This one barely dented the leverage pile. It cleared the weakest hands, not the leverage itself.
And look at who's left standing. On Binance, 71.6% of accounts are long — a 2.52 long/short ratio — while $BTC sits pinned near $78K, under $80K. BTC funding is only mildly positive, around +0.01% per 8 hours on Binance: longs are paying, but nobody's euphoric. $ETH is the split worth watching — funding is mixed to negative on the big venues, meaning shorts are crowded there, which is exactly the setup that can snap back hard if price turns.
So the market isn't rebuilt and it isn't clean. It's coiled. The liquidation map shows why: roughly $434M in short liquidity stacked just above, the biggest cluster near $78,257, and about $421M in long liquidity below, thickest near $76,789. That's a squeeze box with $76.6K support underneath and $79.1K resistance on top. A break either way doesn't just move price — it feeds on itself.
History is blunt about partial resets like this. December 2021 chopped for weeks after its flush, then broke down. May 2021 chopped for months. The fast V-recoveries came only when the shock was purely external and spot buyers came straight back. This time, spot hasn't: US Bitcoin ETFs saw $643M of outflows on 30 October, coinciding with the chaos, and Binance's withdrawal reopening is still phased — 15 networks on Sunday, with full restoration and proof-of-reserves still pending.
So here's what this really means. Don't mistake a quiet book for a healthy one. Watch $79.1K above — a reclaim there starts chewing through those stacked shorts. Watch $76.6K below — a loss there unwinds the crowded longs. And watch Monday's ETF flows and the full withdrawal reopening: until spot demand returns, every derivatives bounce is guilty until proven innocent. High-beta names like $SOL will follow whichever way $BTC breaks, not lead it.
Not financial advice. DYOR.
Article
BNB held $700 after a $6.3B hack. Withdrawals are back — but is demand really back?BNB held $700 after a $6.3B hack. Withdrawals are back today — but is demand really back?
Today wasn't a victory lap. It was a test — and BNB passed the first hour of it.
Here's what actually happened. Binance reopened withdrawals in phases this morning, 06:00–09:00 UTC, across 15 networks. Bitcoin went first. Then Ethereum and BNB Smart Chain routes — USDC, USDT, ETH and BNB moving again. Co-CEO Richard Teng says around 95% of impacted assets are now replenished, up from 90% yesterday. That word matters: replenished, not recovered. About $3B of stolen funds was frozen by issuers and partners. The rest was covered by Binance itself, from treasury, a partial SAFU draw and the futures insurance fund.
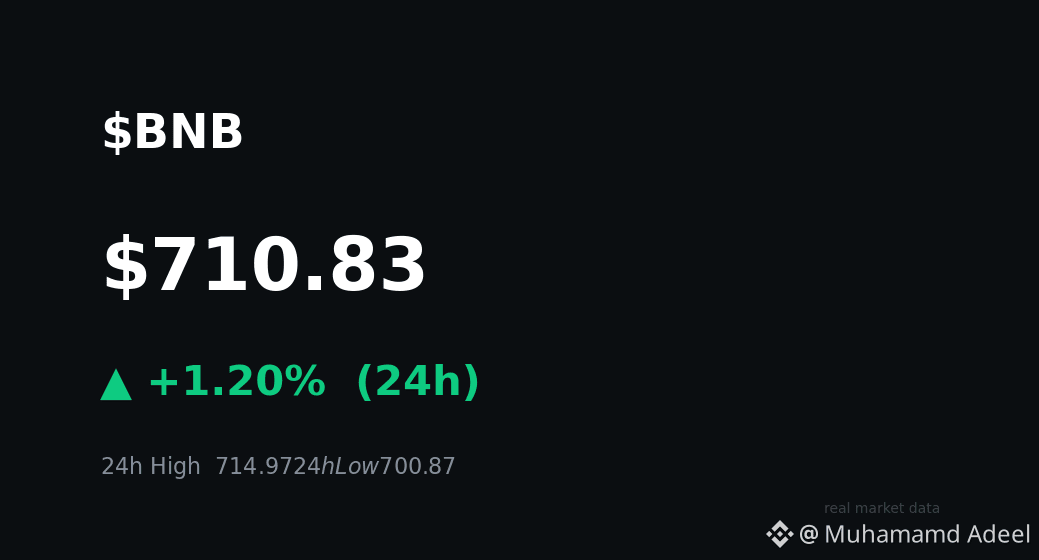
And $BNB? It traded roughly $698–$716 today, sitting near $706 — up slightly on the day, down about 5% on the week. It dipped under $700 intraday and clawed back above it.
The levels tell the real story
$700 is the line. Below it sits a $694–$700 support cluster, then a $680–$690 bounce zone analysts keep pointing to. Break that, and $650 comes into view. Above, $710 is the pivot — BNB has stayed under it, and while it does, the short-term bias stays bearish. Only above $715 does any real recovery conversation start.
So check the $BNB chart yourself at $700 — that line is the market voting, in real time, on whether it trusts Binance again.
The exit door is the real test
The reopening itself is the stress test. If users rush for the exits en masse, that's a confidence vote against the exchange — and BNB, as the venue token, feels it first. So far, no dump on reopening. But phase one covers only 15 networks. Everyone else is still waiting, with no fixed timetable.
And the chain? The hack hit Binance's exchange hot wallets, not BNB Chain itself, which kept running throughout. TVL sits at about $5.23B — flat on reopening day, not a drain. DEX volume ran near $545M in 24 hours; stablecoins on BNB Chain: $13.09B, flat. That's demand holding, not surging.
But be honest about the other side. Full cryptographic proof of reserves isn't due until Tuesday 3 November, so the 100%-backed claim on majors like $BTC and $ETH is Binance's word, not independent verification yet. SAFU was partly drawn and must be rebuilt to ~$1B.
History rhymes, but it doesn't guarantee. After the 2019 hack, BNB fell 17.5% in three days, then hit a fresh high within a month. After the 2022 bridge exploit, it gained 20% in 30 days. Both times, what decided it was whether withdrawals reopened smoothly — and this time the scale is 11 times bigger than 2022.
Here's what this really means: BNB surviving the first withdrawal window is a signal, not a verdict. If phase one stays orderly and the 3 November proof lands clean, $710 flips the story. If either wobbles, $680 gets tested fast.
So — is demand back, or are holders just being patient? Watch $700.
Not financial advice. DYOR.
BNB held $700 after a $6.3B hack. Withdrawals are back — but is demand really back?
BNB held $700 after a $6.3B hack. Withdrawals are back today — but is demand really back?
Today wasn't a victory lap. It was a test — and BNB passed the first hour of it.
Here's what actually happened. Binance reopened withdrawals in phases this morning, 06:00–09:00 UTC, across 15 networks. Bitcoin went first. Then Ethereum and BNB Smart Chain routes — USDC, USDT, ETH and BNB moving again. Co-CEO Richard Teng says around 95% of impacted assets are now replenished, up from 90% yesterday. That word matters: replenished, not recovered. About $3B of stolen funds was frozen by issuers and partners. The rest was covered by Binance itself, from treasury, a partial SAFU draw and the futures insurance fund.
And $BNB ? It traded roughly $698–$716 today, sitting near $706 — up slightly on the day, down about 5% on the week. It dipped under $700 intraday and clawed back above it.
The levels tell the real story
$700 is the line. Below it sits a $694–$700 support cluster, then a $680–$690 bounce zone analysts keep pointing to. Break that, and $650 comes into view. Above, $710 is the pivot — BNB has stayed under it, and while it does, the short-term bias stays bearish. Only above $715 does any real recovery conversation start.
So check the $BNB chart yourself at $700 — that line is the market voting, in real time, on whether it trusts Binance again.
The exit door is the real test
The reopening itself is the stress test. If users rush for the exits en masse, that's a confidence vote against the exchange — and BNB, as the venue token, feels it first. So far, no dump on reopening. But phase one covers only 15 networks. Everyone else is still waiting, with no fixed timetable.
And the chain? The hack hit Binance's exchange hot wallets, not BNB Chain itself, which kept running throughout. TVL sits at about $5.23B — flat on reopening day, not a drain. DEX volume ran near $545M in 24 hours; stablecoins on BNB Chain: $13.09B, flat. That's demand holding, not surging.
But be honest about the other side. Full cryptographic proof of reserves isn't due until Tuesday 3 November, so the 100%-backed claim on majors like $BTC and $ETH is Binance's word, not independent verification yet. SAFU was partly drawn and must be rebuilt to ~$1B.
History rhymes, but it doesn't guarantee. After the 2019 hack, BNB fell 17.5% in three days, then hit a fresh high within a month. After the 2022 bridge exploit, it gained 20% in 30 days. Both times, what decided it was whether withdrawals reopened smoothly — and this time the scale is 11 times bigger than 2022.
Here's what this really means: BNB surviving the first withdrawal window is a signal, not a verdict. If phase one stays orderly and the 3 November proof lands clean, $710 flips the story. If either wobbles, $680 gets tested fast.
So — is demand back, or are holders just being patient? Watch $700.
Not financial advice. DYOR.
Today wasn't a victory lap. It was a test — and BNB passed the first hour of it.
Here's what actually happened. Binance reopened withdrawals in phases this morning, 06:00–09:00 UTC, across 15 networks. Bitcoin went first. Then Ethereum and BNB Smart Chain routes — USDC, USDT, ETH and BNB moving again. Co-CEO Richard Teng says around 95% of impacted assets are now replenished, up from 90% yesterday. That word matters: replenished, not recovered. About $3B of stolen funds was frozen by issuers and partners. The rest was covered by Binance itself, from treasury, a partial SAFU draw and the futures insurance fund.
And $BNB ? It traded roughly $698–$716 today, sitting near $706 — up slightly on the day, down about 5% on the week. It dipped under $700 intraday and clawed back above it.
The levels tell the real story
$700 is the line. Below it sits a $694–$700 support cluster, then a $680–$690 bounce zone analysts keep pointing to. Break that, and $650 comes into view. Above, $710 is the pivot — BNB has stayed under it, and while it does, the short-term bias stays bearish. Only above $715 does any real recovery conversation start.
So check the $BNB chart yourself at $700 — that line is the market voting, in real time, on whether it trusts Binance again.
The exit door is the real test
The reopening itself is the stress test. If users rush for the exits en masse, that's a confidence vote against the exchange — and BNB, as the venue token, feels it first. So far, no dump on reopening. But phase one covers only 15 networks. Everyone else is still waiting, with no fixed timetable.
And the chain? The hack hit Binance's exchange hot wallets, not BNB Chain itself, which kept running throughout. TVL sits at about $5.23B — flat on reopening day, not a drain. DEX volume ran near $545M in 24 hours; stablecoins on BNB Chain: $13.09B, flat. That's demand holding, not surging.
But be honest about the other side. Full cryptographic proof of reserves isn't due until Tuesday 3 November, so the 100%-backed claim on majors like $BTC and $ETH is Binance's word, not independent verification yet. SAFU was partly drawn and must be rebuilt to ~$1B.
History rhymes, but it doesn't guarantee. After the 2019 hack, BNB fell 17.5% in three days, then hit a fresh high within a month. After the 2022 bridge exploit, it gained 20% in 30 days. Both times, what decided it was whether withdrawals reopened smoothly — and this time the scale is 11 times bigger than 2022.
Here's what this really means: BNB surviving the first withdrawal window is a signal, not a verdict. If phase one stays orderly and the 3 November proof lands clean, $710 flips the story. If either wobbles, $680 gets tested fast.
So — is demand back, or are holders just being patient? Watch $700.
Not financial advice. DYOR.
1
Article
NEAR Votes Tomorrow on Cutting Inflation — Chart at a Decision PointTomorrow, $NEAR holders vote on something most chains never dare to touch: cutting their own token's inflation. And the chart is sitting right on the edge while they decide.
Here's why this vote actually matters.
Proposal HSP-029 would cut NEAR's maximum annual issuance from 2.5% to 1.6% over 24 months. Modelled staking yield would fall from about 5.27% to 3.37% — stakers get less yield, but every holder gets less dilution. The vote closes on 2 November, and here's the honest part: even a "yes" doesn't flip the switch overnight. It would still need a separate validator protocol upgrade before it takes effect. This is a proposal, not a done deal — and the market knows it.
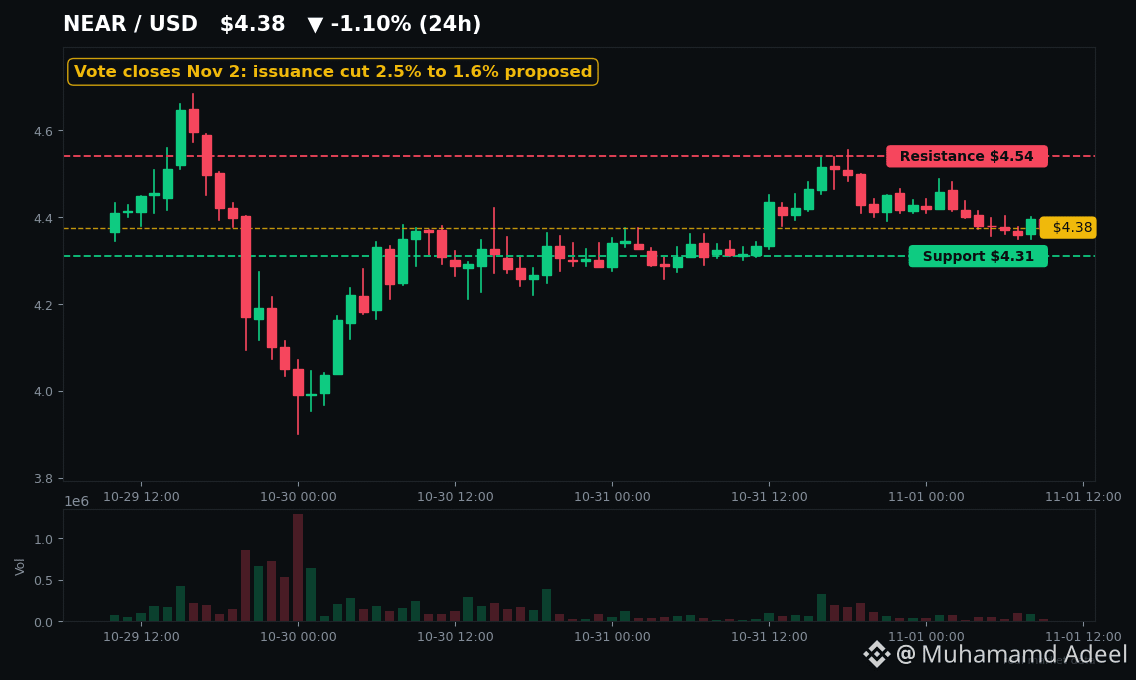
That's what makes the timing so interesting. NEAR trades around $4.40 today, after closing 31 October at $4.44. It is caught between support near $4.22–$4.31 and resistance at $4.52–$4.54. Trader Michaël van de Poppe flagged $4.20 as flipped support on 31 October, and a decisive move above $4.60 as the trigger that opens the path to fresh Q4 highs. Check $NEAR's chart around those levels — a break above $4.54–$4.60 changes the whole conversation, while a loss of $4.22 puts $4.11 in focus.
And NEAR isn't walking into this vote empty-handed. On 31 October, NEAR and Ondo Finance announced plans to bring Ondo's tokenized US stocks and ETFs to NEAR's 1Click Swap API — a route, not a finished product yet, but it follows Ondo Stocks going live on near.com in September. The same day, NEAR reportedly returned to the Bitwise 10 Crypto Index ETF, weeks after the first US spot NEAR ETF launched on 29 September. Meanwhile NEAR Intents did $10.41 billion in Q3 volume, and over 1 million NEAR is now staked for AI inference.
Now the part most posts would skip. NEAR is still trading below every short-term moving average, it's roughly 24% off its October high near $6, and its supply has no cap — the 2.5% issuance is still running today. The AI story is real but crowded: rival AI tokens like $TAO are fighting for the same rotation money, and NEAR's DeFi TVL is only about $202 million against a ~$5.8 billion market cap. Even the Intents exploit in late September — about $3.87 million — is worth remembering, though the funds were fully recovered within days.
So here's the real setup. A chain that went vertical in September (+177.8% that month) is now asking its holders to vote for less inflation, right as its price coils between two levels everyone can see. If the vote passes and the chart breaks higher, that's a story. If either fails, the pullback has room.
What to watch: the vote result on 2 November, whether $4.54 breaks, and whether Intents volume keeps climbing. Which side are you on — is this the AI dip to buy, or a correction with room left to run?
Not financial advice. DYOR.
NEAR Votes Tomorrow on Cutting Inflation — Chart at a Decision Point
Tomorrow, $NEAR holders vote on something most chains never dare to touch: cutting their own token's inflation. And the chart is sitting right on the edge while they decide.
Here's why this vote actually matters.
Proposal HSP-029 would cut NEAR's maximum annual issuance from 2.5% to 1.6% over 24 months. Modelled staking yield would fall from about 5.27% to 3.37% — stakers get less yield, but every holder gets less dilution. The vote closes on 2 November, and here's the honest part: even a "yes" doesn't flip the switch overnight. It would still need a separate validator protocol upgrade before it takes effect. This is a proposal, not a done deal — and the market knows it.
That's what makes the timing so interesting. NEAR trades around $4.40 today, after closing 31 October at $4.44. It is caught between support near $4.22–$4.31 and resistance at $4.52–$4.54. Trader Michaël van de Poppe flagged $4.20 as flipped support on 31 October, and a decisive move above $4.60 as the trigger that opens the path to fresh Q4 highs. Check $NEAR 's chart around those levels — a break above $4.54–$4.60 changes the whole conversation, while a loss of $4.22 puts $4.11 in focus.
And NEAR isn't walking into this vote empty-handed. On 31 October, NEAR and Ondo Finance announced plans to bring Ondo's tokenized US stocks and ETFs to NEAR's 1Click Swap API — a route, not a finished product yet, but it follows Ondo Stocks going live on near.com in September. The same day, NEAR reportedly returned to the Bitwise 10 Crypto Index ETF, weeks after the first US spot NEAR ETF launched on 29 September. Meanwhile NEAR Intents did $10.41 billion in Q3 volume, and over 1 million NEAR is now staked for AI inference.
Now the part most posts would skip. NEAR is still trading below every short-term moving average, it's roughly 24% off its October high near $6, and its supply has no cap — the 2.5% issuance is still running today. The AI story is real but crowded: rival AI tokens like $TAO are fighting for the same rotation money, and NEAR's DeFi TVL is only about $202 million against a ~$5.8 billion market cap. Even the Intents exploit in late September — about $3.87 million — is worth remembering, though the funds were fully recovered within days.
So here's the real setup. A chain that went vertical in September (+177.8% that month) is now asking its holders to vote for less inflation, right as its price coils between two levels everyone can see. If the vote passes and the chart breaks higher, that's a story. If either fails, the pullback has room.
What to watch: the vote result on 2 November, whether $4.54 breaks, and whether Intents volume keeps climbing. Which side are you on — is this the AI dip to buy, or a correction with room left to run?
Not financial advice. DYOR.
Here's why this vote actually matters.
Proposal HSP-029 would cut NEAR's maximum annual issuance from 2.5% to 1.6% over 24 months. Modelled staking yield would fall from about 5.27% to 3.37% — stakers get less yield, but every holder gets less dilution. The vote closes on 2 November, and here's the honest part: even a "yes" doesn't flip the switch overnight. It would still need a separate validator protocol upgrade before it takes effect. This is a proposal, not a done deal — and the market knows it.
That's what makes the timing so interesting. NEAR trades around $4.40 today, after closing 31 October at $4.44. It is caught between support near $4.22–$4.31 and resistance at $4.52–$4.54. Trader Michaël van de Poppe flagged $4.20 as flipped support on 31 October, and a decisive move above $4.60 as the trigger that opens the path to fresh Q4 highs. Check $NEAR 's chart around those levels — a break above $4.54–$4.60 changes the whole conversation, while a loss of $4.22 puts $4.11 in focus.
And NEAR isn't walking into this vote empty-handed. On 31 October, NEAR and Ondo Finance announced plans to bring Ondo's tokenized US stocks and ETFs to NEAR's 1Click Swap API — a route, not a finished product yet, but it follows Ondo Stocks going live on near.com in September. The same day, NEAR reportedly returned to the Bitwise 10 Crypto Index ETF, weeks after the first US spot NEAR ETF launched on 29 September. Meanwhile NEAR Intents did $10.41 billion in Q3 volume, and over 1 million NEAR is now staked for AI inference.
Now the part most posts would skip. NEAR is still trading below every short-term moving average, it's roughly 24% off its October high near $6, and its supply has no cap — the 2.5% issuance is still running today. The AI story is real but crowded: rival AI tokens like $TAO are fighting for the same rotation money, and NEAR's DeFi TVL is only about $202 million against a ~$5.8 billion market cap. Even the Intents exploit in late September — about $3.87 million — is worth remembering, though the funds were fully recovered within days.
So here's the real setup. A chain that went vertical in September (+177.8% that month) is now asking its holders to vote for less inflation, right as its price coils between two levels everyone can see. If the vote passes and the chart breaks higher, that's a story. If either fails, the pullback has room.
What to watch: the vote result on 2 November, whether $4.54 breaks, and whether Intents volume keeps climbing. Which side are you on — is this the AI dip to buy, or a correction with room left to run?
Not financial advice. DYOR.
10
Article
Binance Reopens in Phases as ETFs Dump $643M — Who Is Right?Binance just reopened withdrawals this morning — after the biggest hack in crypto history.
And Wall Street just dumped $643 million of Bitcoin in a single day.
So who is right — the exchange asking for trust again, or the institutions walking out?
1. Withdrawals are back — in phases, not all at once
Phase one opened this morning (11:00 AM–2:00 PM PKT), starting with Bitcoin across 15 networks. Binance says about 95% of the roughly $6.3 billion stolen on 29 October is replenished, up from 90% a day earlier, with its top ten assets 100% backed. Full proof of reserves is due by 3 November.
Here is what this really means: a restart, not a clean bill of health. That 95% is Binance's own number — not independently audited yet — and the last 5% sits in less-liquid tokens. Watch $BNB as the first batches land: the purest read on whether users stay or leave.
2. The FBI just named the attacker
On Saturday the FBI formally blamed North Korea's TraderTraitor unit — the same group behind the $1.5 billion Bybit hack — publishing 600+ wallet addresses for exchanges and DeFi apps to block. Around $3 billion of the stolen funds has already been frozen with industry partners.
As Wirex's Paul Chapman put it: "Bitcoin itself hasn't been hacked — this was an attack on one company's systems, not the network." A crime story just became a state-actor manhunt — much harder to launder through.
3. Wall Street's answer: a $643 million exit — but do not over-read it
Friday's session (30 October — US ETFs do not trade Saturdays) saw spot Bitcoin ETFs lose $643 million, their biggest one-day exit since June, while ether ETFs shed $156 million for a fifth straight day — $799 million combined.
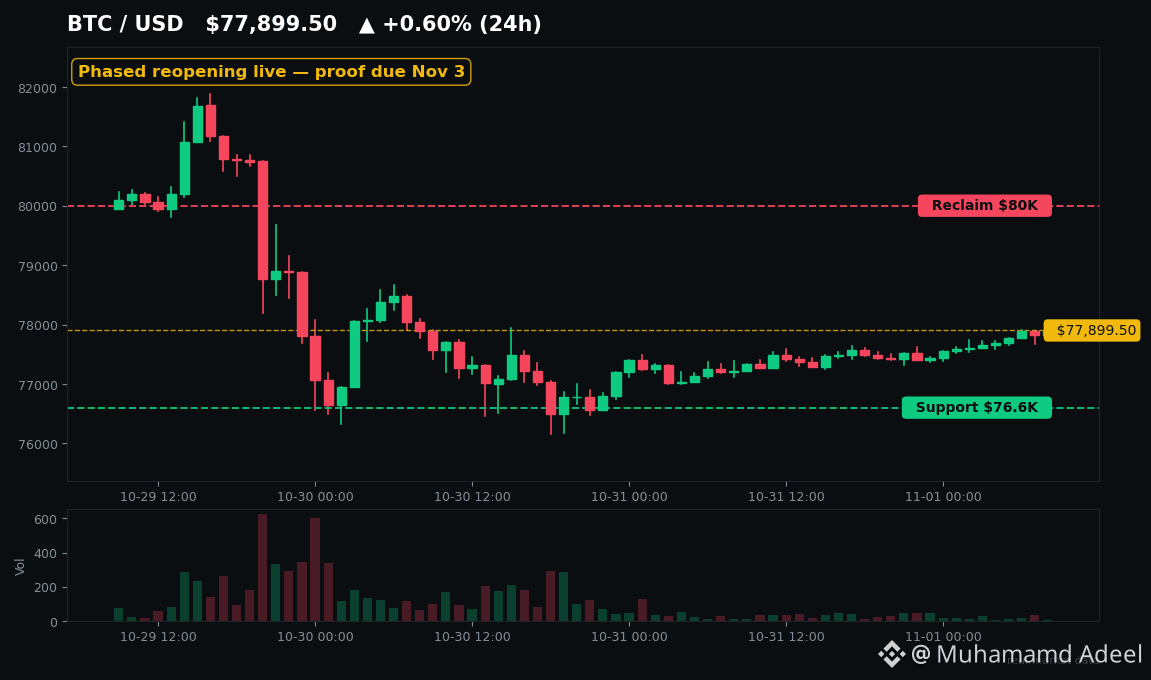
But context the headlines skip: $643 million is roughly 0.7% of Bitcoin ETF assets, and the week still ended only about $202 million net negative after four inflow days. One brutal day, not an exodus. The level that decides it: $BTC at $76.6K support. Hold it and this was a shakeout; lose it and $73K comes into play; reclaim $80K and the bulls take it back. Check the chart at those levels before you decide what this was.
4. So what is the tape actually saying?
Forced selling has cooled: liquidations ran about $77 million in 24 hours, versus $1.5 billion at the flush peak. Fear & Greed sits at 34 — still Fear, not panic. Bitcoin holds around $77.9K, ether slightly firmer near $2.27K. Watch $ETH: five straight ETF outflow days against a firmer bounce is the kind of split that resolves sharply.
History warns: Bybit plugged its $1.5 billion hole in about 72 hours in February 2025 — yet Bitcoin still slid 18 more days before bottoming. Exchanges recover in days; prices take weeks. Do not confuse a working withdrawal button with a market bottom.
November opens with a phased reopening, a proof deadline on 3 November, and midterm voting Tuesday. That is the real test.
Not financial advice. DYOR.
Binance Reopens in Phases as ETFs Dump $643M — Who Is Right?
Binance just reopened withdrawals this morning — after the biggest hack in crypto history.
And Wall Street just dumped $643 million of Bitcoin in a single day.
So who is right — the exchange asking for trust again, or the institutions walking out?
1. Withdrawals are back — in phases, not all at once
Phase one opened this morning (11:00 AM–2:00 PM PKT), starting with Bitcoin across 15 networks. Binance says about 95% of the roughly $6.3 billion stolen on 29 October is replenished, up from 90% a day earlier, with its top ten assets 100% backed. Full proof of reserves is due by 3 November.
Here is what this really means: a restart, not a clean bill of health. That 95% is Binance's own number — not independently audited yet — and the last 5% sits in less-liquid tokens. Watch $BNB as the first batches land: the purest read on whether users stay or leave.
2. The FBI just named the attacker
On Saturday the FBI formally blamed North Korea's TraderTraitor unit — the same group behind the $1.5 billion Bybit hack — publishing 600+ wallet addresses for exchanges and DeFi apps to block. Around $3 billion of the stolen funds has already been frozen with industry partners.
As Wirex's Paul Chapman put it: "Bitcoin itself hasn't been hacked — this was an attack on one company's systems, not the network." A crime story just became a state-actor manhunt — much harder to launder through.
3. Wall Street's answer: a $643 million exit — but do not over-read it
Friday's session (30 October — US ETFs do not trade Saturdays) saw spot Bitcoin ETFs lose $643 million, their biggest one-day exit since June, while ether ETFs shed $156 million for a fifth straight day — $799 million combined.
But context the headlines skip: $643 million is roughly 0.7% of Bitcoin ETF assets, and the week still ended only about $202 million net negative after four inflow days. One brutal day, not an exodus. The level that decides it: $BTC at $76.6K support. Hold it and this was a shakeout; lose it and $73K comes into play; reclaim $80K and the bulls take it back. Check the chart at those levels before you decide what this was.
4. So what is the tape actually saying?
Forced selling has cooled: liquidations ran about $77 million in 24 hours, versus $1.5 billion at the flush peak. Fear & Greed sits at 34 — still Fear, not panic. Bitcoin holds around $77.9K, ether slightly firmer near $2.27K. Watch $ETH : five straight ETF outflow days against a firmer bounce is the kind of split that resolves sharply.
History warns: Bybit plugged its $1.5 billion hole in about 72 hours in February 2025 — yet Bitcoin still slid 18 more days before bottoming. Exchanges recover in days; prices take weeks. Do not confuse a working withdrawal button with a market bottom.
November opens with a phased reopening, a proof deadline on 3 November, and midterm voting Tuesday. That is the real test.
Not financial advice. DYOR.
And Wall Street just dumped $643 million of Bitcoin in a single day.
So who is right — the exchange asking for trust again, or the institutions walking out?
1. Withdrawals are back — in phases, not all at once
Phase one opened this morning (11:00 AM–2:00 PM PKT), starting with Bitcoin across 15 networks. Binance says about 95% of the roughly $6.3 billion stolen on 29 October is replenished, up from 90% a day earlier, with its top ten assets 100% backed. Full proof of reserves is due by 3 November.
Here is what this really means: a restart, not a clean bill of health. That 95% is Binance's own number — not independently audited yet — and the last 5% sits in less-liquid tokens. Watch $BNB as the first batches land: the purest read on whether users stay or leave.
2. The FBI just named the attacker
On Saturday the FBI formally blamed North Korea's TraderTraitor unit — the same group behind the $1.5 billion Bybit hack — publishing 600+ wallet addresses for exchanges and DeFi apps to block. Around $3 billion of the stolen funds has already been frozen with industry partners.
As Wirex's Paul Chapman put it: "Bitcoin itself hasn't been hacked — this was an attack on one company's systems, not the network." A crime story just became a state-actor manhunt — much harder to launder through.
3. Wall Street's answer: a $643 million exit — but do not over-read it
Friday's session (30 October — US ETFs do not trade Saturdays) saw spot Bitcoin ETFs lose $643 million, their biggest one-day exit since June, while ether ETFs shed $156 million for a fifth straight day — $799 million combined.
But context the headlines skip: $643 million is roughly 0.7% of Bitcoin ETF assets, and the week still ended only about $202 million net negative after four inflow days. One brutal day, not an exodus. The level that decides it: $BTC at $76.6K support. Hold it and this was a shakeout; lose it and $73K comes into play; reclaim $80K and the bulls take it back. Check the chart at those levels before you decide what this was.
4. So what is the tape actually saying?
Forced selling has cooled: liquidations ran about $77 million in 24 hours, versus $1.5 billion at the flush peak. Fear & Greed sits at 34 — still Fear, not panic. Bitcoin holds around $77.9K, ether slightly firmer near $2.27K. Watch $ETH : five straight ETF outflow days against a firmer bounce is the kind of split that resolves sharply.
History warns: Bybit plugged its $1.5 billion hole in about 72 hours in February 2025 — yet Bitcoin still slid 18 more days before bottoming. Exchanges recover in days; prices take weeks. Do not confuse a working withdrawal button with a market bottom.
November opens with a phased reopening, a proof deadline on 3 November, and midterm voting Tuesday. That is the real test.
Not financial advice. DYOR.
Article
5 Banks Chose zkSync for $600B in Deposits. $ZK Is Still a PennyFive US banks just picked zkSync to move $600B of deposits. The token? It trades at about a penny.
Read that again. Huntington, First Horizon, M&T, KeyCorp and Old National — banks holding more than $600 billion in deposits between them — are building Cari Network, a tokenized-deposit network on zkSync's Prividium. Each bank runs its own governed chain, posting settlement proofs to $ETH, with testing through 2026.
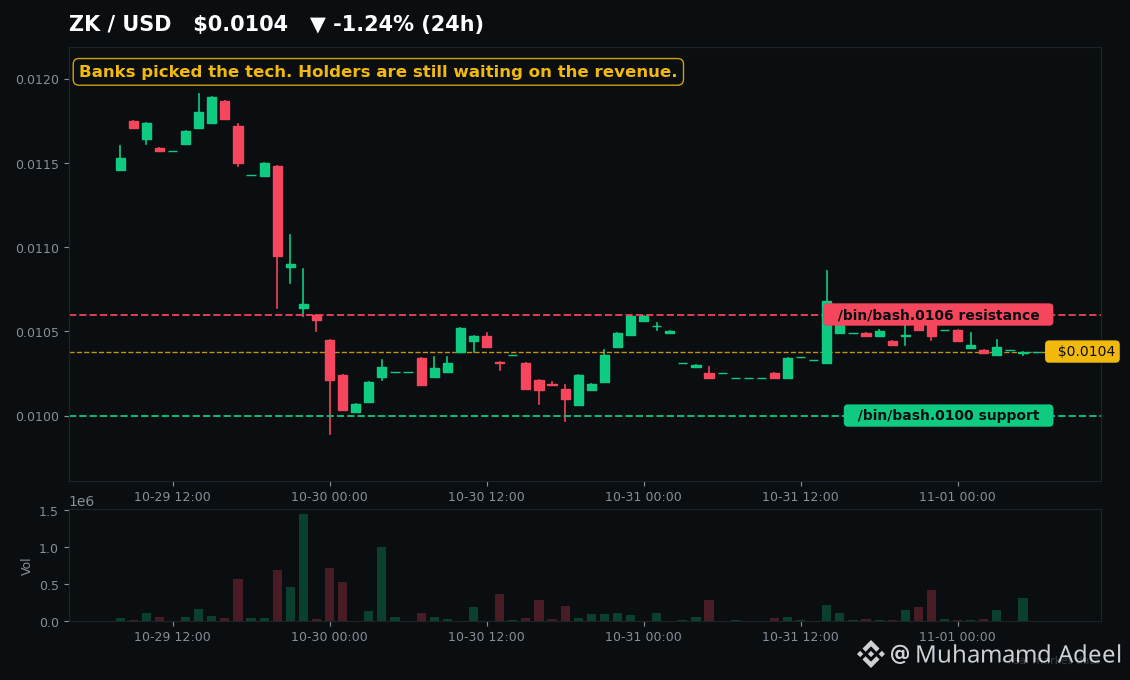
And $ZK sits at $0.0104. Down roughly 15% this week, down about 20% over the last month, and roughly 97% below its June 2024 peak.
So what's going on? This is the sharpest paradox in Layer 2 right now — and the twist comes from zkSync's own CEO.
**The part nobody wants to say out loud**
When Matter Labs launched Prividium Commander on October 21 — the control plane that lets banks run digital-asset operations — CEO Alex Gluchowski said the revenue goes to Matter Labs as a company. Not to $ZK holders.
That's the whole story in one sentence. The tech is winning boardrooms. The token isn't getting paid for it.
The adoption itself is real. Days after Cari, zkSync partnered with DTCC on Prividium privacy features. But the honest test for every enterprise headline is: pilot, test, or live deployment moving real volume? So far, pilots and tests. That $600 billion is deposits these banks hold — not money already tokenized or settled on-chain.
**Now look at the chain itself**
This is where the story gets humbling. zkSync Era's DeFi TVL is just $13.5 million. Daily DEX volume is around $126,000. Chain fees run about $233 a day. Yes — $233.
But $1.2 billion of real-world assets already sit on Era, and $230 million of value remains secured through the bridge. The chain isn't dead — it's becoming a regulated-finance chain, and the market hasn't priced what that's worth to a governance token.
**The levels and the date that matter**
Watch $ZK against $0.0100 support and $0.0106 resistance. A hold above $0.0106 with real volume would be the first sign this penny-price story is turning. A slip back toward $0.0100 — with the August low near $0.0071 not far below — keeps the downtrend intact.
Then there's November 17: 173 million ZK unlocks to investors — about $1.8 million at today's price, 0.83% of total supply. Before you panic: this is a routine monthly drip running to June 2028, and past unlocks have historically been low-volatility events. The risk isn't one day. It's the slow drip while holders wait for a fee-capture redesign that is still a proposal, not a reality.
History warns against chasing the hype: a mid-October Vitalik post spiked ZK, then it faded 27% in 11 days — the same pattern as the November 2025 Atlas rally.
So here's the take: zkSync keeps winning the rooms that matter for the next decade of finance. $ZK keeps asking one question nobody has answered — when does any of that revenue reach the token? Until then, every bank headline is a reason to watch, not a reason to chase. Rival L2s like $ARB still measure their DeFi in billions, so Era has a long climb back on that front too.
The unlock countdown is on. Which side blinks first?
Not financial advice. DYOR.
5 Banks Chose zkSync for $600B in Deposits. $ZK Is Still a Penny
Five US banks just picked zkSync to move $600B of deposits. The token? It trades at about a penny.
Read that again. Huntington, First Horizon, M&T, KeyCorp and Old National — banks holding more than $600 billion in deposits between them — are building Cari Network, a tokenized-deposit network on zkSync's Prividium. Each bank runs its own governed chain, posting settlement proofs to $ETH , with testing through 2026.
And $ZK sits at $0.0104. Down roughly 15% this week, down about 20% over the last month, and roughly 97% below its June 2024 peak.
So what's going on? This is the sharpest paradox in Layer 2 right now — and the twist comes from zkSync's own CEO.
**The part nobody wants to say out loud**
When Matter Labs launched Prividium Commander on October 21 — the control plane that lets banks run digital-asset operations — CEO Alex Gluchowski said the revenue goes to Matter Labs as a company. Not to $ZK holders.
That's the whole story in one sentence. The tech is winning boardrooms. The token isn't getting paid for it.
The adoption itself is real. Days after Cari, zkSync partnered with DTCC on Prividium privacy features. But the honest test for every enterprise headline is: pilot, test, or live deployment moving real volume? So far, pilots and tests. That $600 billion is deposits these banks hold — not money already tokenized or settled on-chain.
**Now look at the chain itself**
This is where the story gets humbling. zkSync Era's DeFi TVL is just $13.5 million. Daily DEX volume is around $126,000. Chain fees run about $233 a day. Yes — $233.
But $1.2 billion of real-world assets already sit on Era, and $230 million of value remains secured through the bridge. The chain isn't dead — it's becoming a regulated-finance chain, and the market hasn't priced what that's worth to a governance token.
**The levels and the date that matter**
Watch $ZK against $0.0100 support and $0.0106 resistance. A hold above $0.0106 with real volume would be the first sign this penny-price story is turning. A slip back toward $0.0100 — with the August low near $0.0071 not far below — keeps the downtrend intact.
Then there's November 17: 173 million ZK unlocks to investors — about $1.8 million at today's price, 0.83% of total supply. Before you panic: this is a routine monthly drip running to June 2028, and past unlocks have historically been low-volatility events. The risk isn't one day. It's the slow drip while holders wait for a fee-capture redesign that is still a proposal, not a reality.
History warns against chasing the hype: a mid-October Vitalik post spiked ZK, then it faded 27% in 11 days — the same pattern as the November 2025 Atlas rally.
So here's the take: zkSync keeps winning the rooms that matter for the next decade of finance. $ZK keeps asking one question nobody has answered — when does any of that revenue reach the token? Until then, every bank headline is a reason to watch, not a reason to chase. Rival L2s like $ARB still measure their DeFi in billions, so Era has a long climb back on that front too.
The unlock countdown is on. Which side blinks first?
Not financial advice. DYOR.
Read that again. Huntington, First Horizon, M&T, KeyCorp and Old National — banks holding more than $600 billion in deposits between them — are building Cari Network, a tokenized-deposit network on zkSync's Prividium. Each bank runs its own governed chain, posting settlement proofs to $ETH , with testing through 2026.
And $ZK sits at $0.0104. Down roughly 15% this week, down about 20% over the last month, and roughly 97% below its June 2024 peak.
So what's going on? This is the sharpest paradox in Layer 2 right now — and the twist comes from zkSync's own CEO.
**The part nobody wants to say out loud**
When Matter Labs launched Prividium Commander on October 21 — the control plane that lets banks run digital-asset operations — CEO Alex Gluchowski said the revenue goes to Matter Labs as a company. Not to $ZK holders.
That's the whole story in one sentence. The tech is winning boardrooms. The token isn't getting paid for it.
The adoption itself is real. Days after Cari, zkSync partnered with DTCC on Prividium privacy features. But the honest test for every enterprise headline is: pilot, test, or live deployment moving real volume? So far, pilots and tests. That $600 billion is deposits these banks hold — not money already tokenized or settled on-chain.
**Now look at the chain itself**
This is where the story gets humbling. zkSync Era's DeFi TVL is just $13.5 million. Daily DEX volume is around $126,000. Chain fees run about $233 a day. Yes — $233.
But $1.2 billion of real-world assets already sit on Era, and $230 million of value remains secured through the bridge. The chain isn't dead — it's becoming a regulated-finance chain, and the market hasn't priced what that's worth to a governance token.
**The levels and the date that matter**
Watch $ZK against $0.0100 support and $0.0106 resistance. A hold above $0.0106 with real volume would be the first sign this penny-price story is turning. A slip back toward $0.0100 — with the August low near $0.0071 not far below — keeps the downtrend intact.
Then there's November 17: 173 million ZK unlocks to investors — about $1.8 million at today's price, 0.83% of total supply. Before you panic: this is a routine monthly drip running to June 2028, and past unlocks have historically been low-volatility events. The risk isn't one day. It's the slow drip while holders wait for a fee-capture redesign that is still a proposal, not a reality.
History warns against chasing the hype: a mid-October Vitalik post spiked ZK, then it faded 27% in 11 days — the same pattern as the November 2025 Atlas rally.
So here's the take: zkSync keeps winning the rooms that matter for the next decade of finance. $ZK keeps asking one question nobody has answered — when does any of that revenue reach the token? Until then, every bank headline is a reason to watch, not a reason to chase. Rival L2s like $ARB still measure their DeFi in billions, so Era has a long climb back on that front too.
The unlock countdown is on. Which side blinks first?
Not financial advice. DYOR.
8
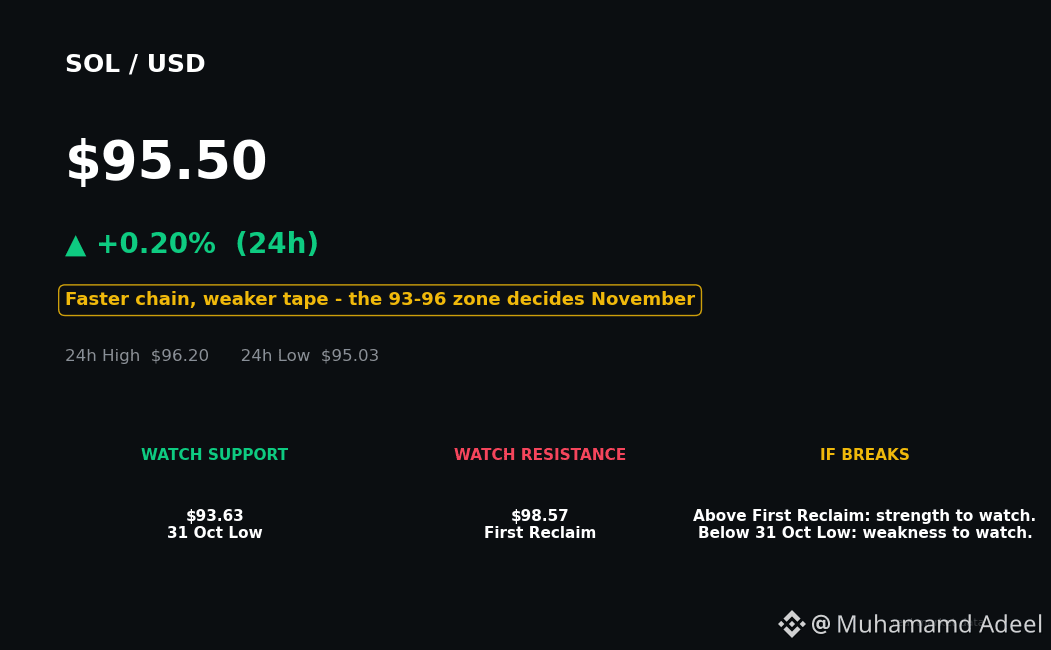
Article
Solana Just Got Faster — So Why Is SOL Still Stuck Near $95?Solana just got a serious speed upgrade — and the market yawned.
While $SOL sits pinned near $95, below the $100 level everyone watches, the real story isn't the upgrade. It's the standoff.
What actually changed
Alpenglow, Solana's big consensus upgrade, was activated on 21–22 October. It targets around 150 milliseconds for finality under normal conditions, down from multi-second waits before, by letting validators exchange votes directly.
And yet, since it went live, SOL has gone sideways-to-down, not up.
The sellers are still in control — for now
SOL is trading around $95.51, roughly 15–20% lower over the past month, and it sits below all of its short-term moving averages. On 31 October it traded between $93.62 and $98.25 and closed near $95.95 — right on the $96 area one analyst had flagged as a key retest.
Meanwhile, US spot SOL ETFs have seen five straight outflow days through 30 October, including about $27.7 million on 29 October and about $10.7 million on 30 October. Cumulative inflows are still around $1.47 billion, so this is not an exodus. It is a demand story that has stalled at exactly the wrong moment.
The backdrop has not helped. The market is still digesting Binance's roughly $6.3 billion hack, disclosed on 30 October, with around $3 billion frozen with partners and withdrawals paused. Fear is in the air — the Crypto Fear & Greed Index was at 35 — and $BTC, near $77,895, has held up better than SOL through the same storm.
Here's the twist, though
The network itself has not gone quiet. Solana's DeFi TVL is about $5.41 billion, 24-hour DEX volume is about $1.26 billion, and stablecoins on the chain total about $15.24 billion, according to DeFiLlama on 1 November. That is the divergence to watch: usage holding up while the price bleeds.
History also warns against expecting a quick V-shape. The last time SOL sat near $100 after a long drawdown, it stalled for months before its next leg — and November has delivered both huge Solana rebounds and brutal months.
Levels to watch
This is now a zone trade, not a prediction. The $93.63 low from 31 October is the nearby floor traders are defending. Lose it, and analysts point to $91.31, then the $88.85 area around the 200-day average. Hold it, and the first reclaim to watch is $98.57, then the psychological $100 level.
What this really means
Solana got faster, but fast does not pay the bills when ETF buyers step back and fear dominates the tape. The upgrade removes a technical excuse for weakness; what is left is a pure demand test.
Breakpoint London, on 15–17 November, is the next scheduled catalyst. For now, the question is simple: do buyers defend $93–$96, or does this slow bleed find a lower floor? Pull up the $SOL chart and watch how that zone behaves this week.
Not financial advice. DYOR.
Solana Just Got Faster — So Why Is SOL Still Stuck Near $95?
Solana just got a serious speed upgrade — and the market yawned.
While $SOL sits pinned near $95, below the $100 level everyone watches, the real story isn't the upgrade. It's the standoff.
What actually changed
Alpenglow, Solana's big consensus upgrade, was activated on 21–22 October. It targets around 150 milliseconds for finality under normal conditions, down from multi-second waits before, by letting validators exchange votes directly.
And yet, since it went live, SOL has gone sideways-to-down, not up.
The sellers are still in control — for now
SOL is trading around $95.51, roughly 15–20% lower over the past month, and it sits below all of its short-term moving averages. On 31 October it traded between $93.62 and $98.25 and closed near $95.95 — right on the $96 area one analyst had flagged as a key retest.
Meanwhile, US spot SOL ETFs have seen five straight outflow days through 30 October, including about $27.7 million on 29 October and about $10.7 million on 30 October. Cumulative inflows are still around $1.47 billion, so this is not an exodus. It is a demand story that has stalled at exactly the wrong moment.
The backdrop has not helped. The market is still digesting Binance's roughly $6.3 billion hack, disclosed on 30 October, with around $3 billion frozen with partners and withdrawals paused. Fear is in the air — the Crypto Fear & Greed Index was at 35 — and $BTC , near $77,895, has held up better than SOL through the same storm.
Here's the twist, though
The network itself has not gone quiet. Solana's DeFi TVL is about $5.41 billion, 24-hour DEX volume is about $1.26 billion, and stablecoins on the chain total about $15.24 billion, according to DeFiLlama on 1 November. That is the divergence to watch: usage holding up while the price bleeds.
History also warns against expecting a quick V-shape. The last time SOL sat near $100 after a long drawdown, it stalled for months before its next leg — and November has delivered both huge Solana rebounds and brutal months.
Levels to watch
This is now a zone trade, not a prediction. The $93.63 low from 31 October is the nearby floor traders are defending. Lose it, and analysts point to $91.31, then the $88.85 area around the 200-day average. Hold it, and the first reclaim to watch is $98.57, then the psychological $100 level.
What this really means
Solana got faster, but fast does not pay the bills when ETF buyers step back and fear dominates the tape. The upgrade removes a technical excuse for weakness; what is left is a pure demand test.
Breakpoint London, on 15–17 November, is the next scheduled catalyst. For now, the question is simple: do buyers defend $93–$96, or does this slow bleed find a lower floor? Pull up the $SOL chart and watch how that zone behaves this week.
Not financial advice. DYOR.
While $SOL sits pinned near $95, below the $100 level everyone watches, the real story isn't the upgrade. It's the standoff.
What actually changed
Alpenglow, Solana's big consensus upgrade, was activated on 21–22 October. It targets around 150 milliseconds for finality under normal conditions, down from multi-second waits before, by letting validators exchange votes directly.
And yet, since it went live, SOL has gone sideways-to-down, not up.
The sellers are still in control — for now
SOL is trading around $95.51, roughly 15–20% lower over the past month, and it sits below all of its short-term moving averages. On 31 October it traded between $93.62 and $98.25 and closed near $95.95 — right on the $96 area one analyst had flagged as a key retest.
Meanwhile, US spot SOL ETFs have seen five straight outflow days through 30 October, including about $27.7 million on 29 October and about $10.7 million on 30 October. Cumulative inflows are still around $1.47 billion, so this is not an exodus. It is a demand story that has stalled at exactly the wrong moment.
The backdrop has not helped. The market is still digesting Binance's roughly $6.3 billion hack, disclosed on 30 October, with around $3 billion frozen with partners and withdrawals paused. Fear is in the air — the Crypto Fear & Greed Index was at 35 — and $BTC , near $77,895, has held up better than SOL through the same storm.
Here's the twist, though
The network itself has not gone quiet. Solana's DeFi TVL is about $5.41 billion, 24-hour DEX volume is about $1.26 billion, and stablecoins on the chain total about $15.24 billion, according to DeFiLlama on 1 November. That is the divergence to watch: usage holding up while the price bleeds.
History also warns against expecting a quick V-shape. The last time SOL sat near $100 after a long drawdown, it stalled for months before its next leg — and November has delivered both huge Solana rebounds and brutal months.
Levels to watch
This is now a zone trade, not a prediction. The $93.63 low from 31 October is the nearby floor traders are defending. Lose it, and analysts point to $91.31, then the $88.85 area around the 200-day average. Hold it, and the first reclaim to watch is $98.57, then the psychological $100 level.
What this really means
Solana got faster, but fast does not pay the bills when ETF buyers step back and fear dominates the tape. The upgrade removes a technical excuse for weakness; what is left is a pure demand test.
Breakpoint London, on 15–17 November, is the next scheduled catalyst. For now, the question is simple: do buyers defend $93–$96, or does this slow bleed find a lower floor? Pull up the $SOL chart and watch how that zone behaves this week.
Not financial advice. DYOR.
27
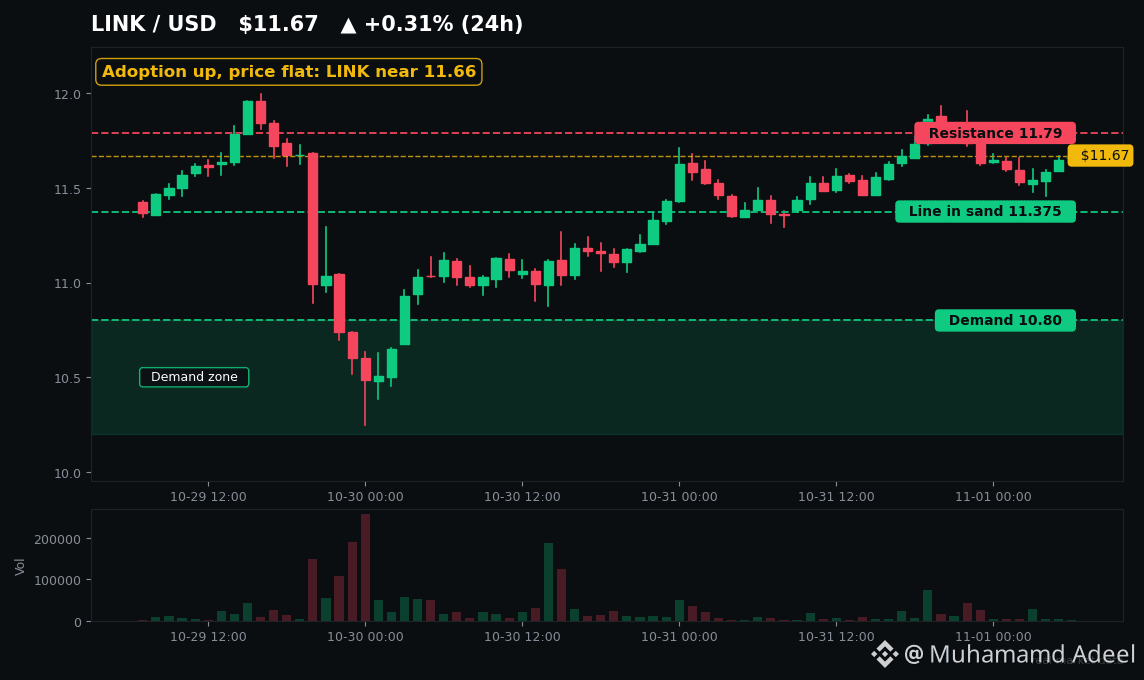
Article
Wall Street just moved onto Chainlink — so why is LINK still stuck at 1.66?Wall Street just moved onto Chainlink — so why is $LINK still stuck near $11.66?
In a single week, S&P put risk data onchain, a Korean finance giant picked Chainlink for tokenization, and Polymarket launched gold markets on its oracle. The token? Down about 17% in a month. That gap is the whole story right now.
The week Wall Street plugged in
On 28 October, S&P Global Ratings made its Vault Risk Assessment data available onchain through Chainlink DataLink and the Chainlink Runtime Environment, with Base as the first chain. S&P puts lending-vault deposits at roughly $10 billion in September 2026, up from $1.5 billion two years earlier. This is risk analysis for the vaults where DeFi lending happens — not a credit rating, but real institutional plumbing.
A day later, Hanwha Investment & Securities said it will adopt Chainlink's data standards and CCIP as the official data and interoperability infrastructure for its global real-world-asset tokenization platform. Chainlink supplies pricing and net-asset-value data; CCIP moves assets across chains. Caveat: the platform is still being built, with no launch date or named assets yet.
The same day, Polymarket launched 15-minute gold and silver markets with Chainlink as official oracle. Chainlink also rolled out 24/7 pricing for tokenized assets, with $AAVE's Horizon lending market as launch partner.
What this really means
Oracles used to be DeFi plumbing. This week they became institutional rails. Chainlink says over $15 billion in token value migrated to CCIP during 2026, with over $85 billion secured through it, and its Reserve added 427,577 LINK in October to date, to 6,475,076 LINK. The infrastructure is being bought and used. The token just isn't pricing it yet.
The other side of the trade
But stay sceptical. LINK traded $11.40 to $11.90 through 31 October, still about 78% below its May 2021 high. Every short- and medium-term moving average sits overhead, and 63.7% of Binance accounts were net long on 31 October — a crowded trade. October's real sell shock: the Binance breach attacker sold 2.57 million LINK for about $26 million at $10.14. And 18 straight days of LINK outflows from Binance failed to lift the price — outflows are not automatically accumulation. Open interest has fallen from around $900 million to about $570 million. Adoption headlines do not, by themselves, create token demand.
Levels to watch
The line in the sand is $11.375. CoinGabbar's 31 October levels put $11.566 then $11.893 above it — moving-average levels, not a bullish call, with the setup bearish below $12.016 — and resistance at $11.79 and $12.18. If $LINK holds $11.375 and clears $11.79, the chart has room to breathe. Lose $11.375, and demand at $10.20 to $10.80 comes into play, with the 200-day average near $10.02 underneath. Check the $LINK chart against those levels — and watch $ETH too, because LINK rarely runs alone.
September taught the same lesson: CCIP 2.0 popped LINK to $15.78, then it slid all October. So is this week the repricing, or another headline the market shrugs at?
Not financial advice. DYOR.
Wall Street just moved onto Chainlink — so why is LINK still stuck at 1.66?
Wall Street just moved onto Chainlink — so why is $LINK still stuck near $11.66?
In a single week, S&P put risk data onchain, a Korean finance giant picked Chainlink for tokenization, and Polymarket launched gold markets on its oracle. The token? Down about 17% in a month. That gap is the whole story right now.
The week Wall Street plugged in
On 28 October, S&P Global Ratings made its Vault Risk Assessment data available onchain through Chainlink DataLink and the Chainlink Runtime Environment, with Base as the first chain. S&P puts lending-vault deposits at roughly $10 billion in September 2026, up from $1.5 billion two years earlier. This is risk analysis for the vaults where DeFi lending happens — not a credit rating, but real institutional plumbing.
A day later, Hanwha Investment & Securities said it will adopt Chainlink's data standards and CCIP as the official data and interoperability infrastructure for its global real-world-asset tokenization platform. Chainlink supplies pricing and net-asset-value data; CCIP moves assets across chains. Caveat: the platform is still being built, with no launch date or named assets yet.
The same day, Polymarket launched 15-minute gold and silver markets with Chainlink as official oracle. Chainlink also rolled out 24/7 pricing for tokenized assets, with $AAVE 's Horizon lending market as launch partner.
What this really means
Oracles used to be DeFi plumbing. This week they became institutional rails. Chainlink says over $15 billion in token value migrated to CCIP during 2026, with over $85 billion secured through it, and its Reserve added 427,577 LINK in October to date, to 6,475,076 LINK. The infrastructure is being bought and used. The token just isn't pricing it yet.
The other side of the trade
But stay sceptical. LINK traded $11.40 to $11.90 through 31 October, still about 78% below its May 2021 high. Every short- and medium-term moving average sits overhead, and 63.7% of Binance accounts were net long on 31 October — a crowded trade. October's real sell shock: the Binance breach attacker sold 2.57 million LINK for about $26 million at $10.14. And 18 straight days of LINK outflows from Binance failed to lift the price — outflows are not automatically accumulation. Open interest has fallen from around $900 million to about $570 million. Adoption headlines do not, by themselves, create token demand.
Levels to watch
The line in the sand is $11.375. CoinGabbar's 31 October levels put $11.566 then $11.893 above it — moving-average levels, not a bullish call, with the setup bearish below $12.016 — and resistance at $11.79 and $12.18. If $LINK holds $11.375 and clears $11.79, the chart has room to breathe. Lose $11.375, and demand at $10.20 to $10.80 comes into play, with the 200-day average near $10.02 underneath. Check the $LINK chart against those levels — and watch $ETH too, because LINK rarely runs alone.
September taught the same lesson: CCIP 2.0 popped LINK to $15.78, then it slid all October. So is this week the repricing, or another headline the market shrugs at?
Not financial advice. DYOR.
In a single week, S&P put risk data onchain, a Korean finance giant picked Chainlink for tokenization, and Polymarket launched gold markets on its oracle. The token? Down about 17% in a month. That gap is the whole story right now.
The week Wall Street plugged in
On 28 October, S&P Global Ratings made its Vault Risk Assessment data available onchain through Chainlink DataLink and the Chainlink Runtime Environment, with Base as the first chain. S&P puts lending-vault deposits at roughly $10 billion in September 2026, up from $1.5 billion two years earlier. This is risk analysis for the vaults where DeFi lending happens — not a credit rating, but real institutional plumbing.
A day later, Hanwha Investment & Securities said it will adopt Chainlink's data standards and CCIP as the official data and interoperability infrastructure for its global real-world-asset tokenization platform. Chainlink supplies pricing and net-asset-value data; CCIP moves assets across chains. Caveat: the platform is still being built, with no launch date or named assets yet.
The same day, Polymarket launched 15-minute gold and silver markets with Chainlink as official oracle. Chainlink also rolled out 24/7 pricing for tokenized assets, with $AAVE 's Horizon lending market as launch partner.
What this really means
Oracles used to be DeFi plumbing. This week they became institutional rails. Chainlink says over $15 billion in token value migrated to CCIP during 2026, with over $85 billion secured through it, and its Reserve added 427,577 LINK in October to date, to 6,475,076 LINK. The infrastructure is being bought and used. The token just isn't pricing it yet.
The other side of the trade
But stay sceptical. LINK traded $11.40 to $11.90 through 31 October, still about 78% below its May 2021 high. Every short- and medium-term moving average sits overhead, and 63.7% of Binance accounts were net long on 31 October — a crowded trade. October's real sell shock: the Binance breach attacker sold 2.57 million LINK for about $26 million at $10.14. And 18 straight days of LINK outflows from Binance failed to lift the price — outflows are not automatically accumulation. Open interest has fallen from around $900 million to about $570 million. Adoption headlines do not, by themselves, create token demand.
Levels to watch
The line in the sand is $11.375. CoinGabbar's 31 October levels put $11.566 then $11.893 above it — moving-average levels, not a bullish call, with the setup bearish below $12.016 — and resistance at $11.79 and $12.18. If $LINK holds $11.375 and clears $11.79, the chart has room to breathe. Lose $11.375, and demand at $10.20 to $10.80 comes into play, with the 200-day average near $10.02 underneath. Check the $LINK chart against those levels — and watch $ETH too, because LINK rarely runs alone.
September taught the same lesson: CCIP 2.0 popped LINK to $15.78, then it slid all October. So is this week the repricing, or another headline the market shrugs at?
Not financial advice. DYOR.
28
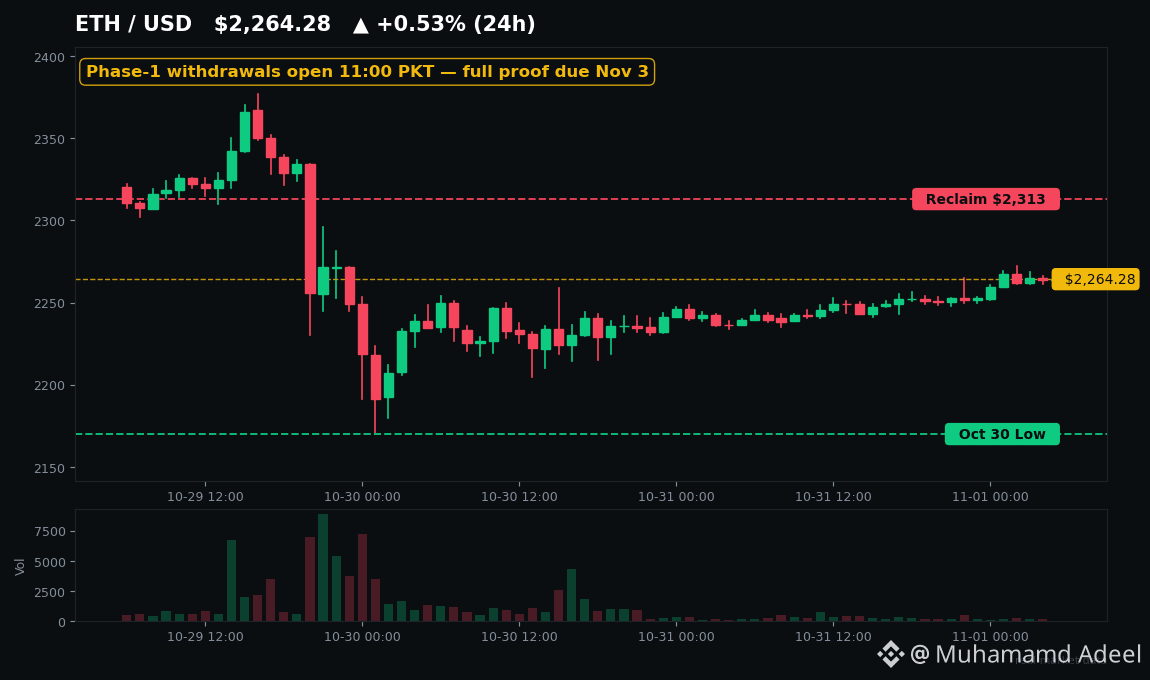
Article
Binance Reopens Withdrawals Today — ETH's $2,190 Line Is the VerdictToday is the day Binance has to prove it.
In a few hours, phase-one withdrawals reopen after the biggest hack in crypto history — and every $ETH holder will be watching the queue, not the headlines.
Here's the story so far. On October 29, around $6.3 billion was drained from Binance's hot wallets in about 20 minutes — the largest exchange theft ever recorded. Binance says it has since replaced roughly 95% of the stolen crypto from its own treasury, a partial SAFU drawdown and its futures insurance fund, and claims ten majors including ETH are now 100% backed.
But the full cryptographic proof-of-reserves isn't due until November 3. A snapshot was taken on October 31, but CertiK has said it can't yet verify the replacement claim. Until that proof lands, "100% backed" is a promise, not a verified fact.
Phase one opens between 11:00 and 14:00 PKT on 15 networks — ETH, BTC, BNB, SOL, XRP and others — and Binance itself is warning of delays under heavy traffic. History says the queue is the verdict. When Binance reopened after its 2019 hack, with users made whole, BNB ripped to a yearly high. When OKEx reopened in 2020 after a freeze with no loss at all, users still fled in a record outflow wave. So watch net outflows today, not the press release. Some pent-up withdrawals are normal. A sustained rush for the exit is not.
ETH is trading near $2,264 this morning after closing October at $2,253, with the October 30 low at $2,170. The line in the sand is $2,190 — the rising trendline ETH is sitting on. Hold it through today's reopening and the first reclaim target is $2,313, then $2,389. Lose $2,190 on a daily close and $2,050 comes into view fast. Pull up $ETH's chart — this coil is tight.
The majors are telling the same trust story in different ways. $BNB near $703 is the direct proxy for confidence in Binance itself — its reaction today is the cleanest sentiment read. $SOL near $95.50 is the laggard, down about 6% on the week and still stuck below $100, while XRP near $1.25 has been the most resilient major of the group.
And let's be honest about the risks stacked against any relief rally. US spot ETH ETFs just logged 23 straight days of outflows — over $1 billion in October alone, including $431 million in the final week. Analytics firms link the attack to North Korea-linked actors, and Elliptic estimates roughly $3.3 billion of the stolen funds is still moving, much of it reportedly being converted into ETH. Add a brutal macro week — US midterms on November 3, the same day the proof is due, then payrolls on November 6 — and even a smooth reopening might not flip sentiment on its own.
Two checkpoints: withdrawals hold today, proof lands November 3. Pass both and this becomes a relief story. Slip on either and the exit wave writes the next chapter.
Not financial advice. DYOR.
Binance Reopens Withdrawals Today — ETH's $2,190 Line Is the Verdict
Today is the day Binance has to prove it.
In a few hours, phase-one withdrawals reopen after the biggest hack in crypto history — and every $ETH holder will be watching the queue, not the headlines.
Here's the story so far. On October 29, around $6.3 billion was drained from Binance's hot wallets in about 20 minutes — the largest exchange theft ever recorded. Binance says it has since replaced roughly 95% of the stolen crypto from its own treasury, a partial SAFU drawdown and its futures insurance fund, and claims ten majors including ETH are now 100% backed.
But the full cryptographic proof-of-reserves isn't due until November 3. A snapshot was taken on October 31, but CertiK has said it can't yet verify the replacement claim. Until that proof lands, "100% backed" is a promise, not a verified fact.
Phase one opens between 11:00 and 14:00 PKT on 15 networks — ETH, BTC, BNB, SOL, XRP and others — and Binance itself is warning of delays under heavy traffic. History says the queue is the verdict. When Binance reopened after its 2019 hack, with users made whole, BNB ripped to a yearly high. When OKEx reopened in 2020 after a freeze with no loss at all, users still fled in a record outflow wave. So watch net outflows today, not the press release. Some pent-up withdrawals are normal. A sustained rush for the exit is not.
ETH is trading near $2,264 this morning after closing October at $2,253, with the October 30 low at $2,170. The line in the sand is $2,190 — the rising trendline ETH is sitting on. Hold it through today's reopening and the first reclaim target is $2,313, then $2,389. Lose $2,190 on a daily close and $2,050 comes into view fast. Pull up $ETH 's chart — this coil is tight.
The majors are telling the same trust story in different ways. $BNB near $703 is the direct proxy for confidence in Binance itself — its reaction today is the cleanest sentiment read. $SOL near $95.50 is the laggard, down about 6% on the week and still stuck below $100, while XRP near $1.25 has been the most resilient major of the group.
And let's be honest about the risks stacked against any relief rally. US spot ETH ETFs just logged 23 straight days of outflows — over $1 billion in October alone, including $431 million in the final week. Analytics firms link the attack to North Korea-linked actors, and Elliptic estimates roughly $3.3 billion of the stolen funds is still moving, much of it reportedly being converted into ETH. Add a brutal macro week — US midterms on November 3, the same day the proof is due, then payrolls on November 6 — and even a smooth reopening might not flip sentiment on its own.
Two checkpoints: withdrawals hold today, proof lands November 3. Pass both and this becomes a relief story. Slip on either and the exit wave writes the next chapter.
Not financial advice. DYOR.
In a few hours, phase-one withdrawals reopen after the biggest hack in crypto history — and every $ETH holder will be watching the queue, not the headlines.
Here's the story so far. On October 29, around $6.3 billion was drained from Binance's hot wallets in about 20 minutes — the largest exchange theft ever recorded. Binance says it has since replaced roughly 95% of the stolen crypto from its own treasury, a partial SAFU drawdown and its futures insurance fund, and claims ten majors including ETH are now 100% backed.
But the full cryptographic proof-of-reserves isn't due until November 3. A snapshot was taken on October 31, but CertiK has said it can't yet verify the replacement claim. Until that proof lands, "100% backed" is a promise, not a verified fact.
Phase one opens between 11:00 and 14:00 PKT on 15 networks — ETH, BTC, BNB, SOL, XRP and others — and Binance itself is warning of delays under heavy traffic. History says the queue is the verdict. When Binance reopened after its 2019 hack, with users made whole, BNB ripped to a yearly high. When OKEx reopened in 2020 after a freeze with no loss at all, users still fled in a record outflow wave. So watch net outflows today, not the press release. Some pent-up withdrawals are normal. A sustained rush for the exit is not.
ETH is trading near $2,264 this morning after closing October at $2,253, with the October 30 low at $2,170. The line in the sand is $2,190 — the rising trendline ETH is sitting on. Hold it through today's reopening and the first reclaim target is $2,313, then $2,389. Lose $2,190 on a daily close and $2,050 comes into view fast. Pull up $ETH 's chart — this coil is tight.
The majors are telling the same trust story in different ways. $BNB near $703 is the direct proxy for confidence in Binance itself — its reaction today is the cleanest sentiment read. $SOL near $95.50 is the laggard, down about 6% on the week and still stuck below $100, while XRP near $1.25 has been the most resilient major of the group.
And let's be honest about the risks stacked against any relief rally. US spot ETH ETFs just logged 23 straight days of outflows — over $1 billion in October alone, including $431 million in the final week. Analytics firms link the attack to North Korea-linked actors, and Elliptic estimates roughly $3.3 billion of the stolen funds is still moving, much of it reportedly being converted into ETH. Add a brutal macro week — US midterms on November 3, the same day the proof is due, then payrolls on November 6 — and even a smooth reopening might not flip sentiment on its own.
Two checkpoints: withdrawals hold today, proof lands November 3. Pass both and this becomes a relief story. Slip on either and the exit wave writes the next chapter.
Not financial advice. DYOR.
42
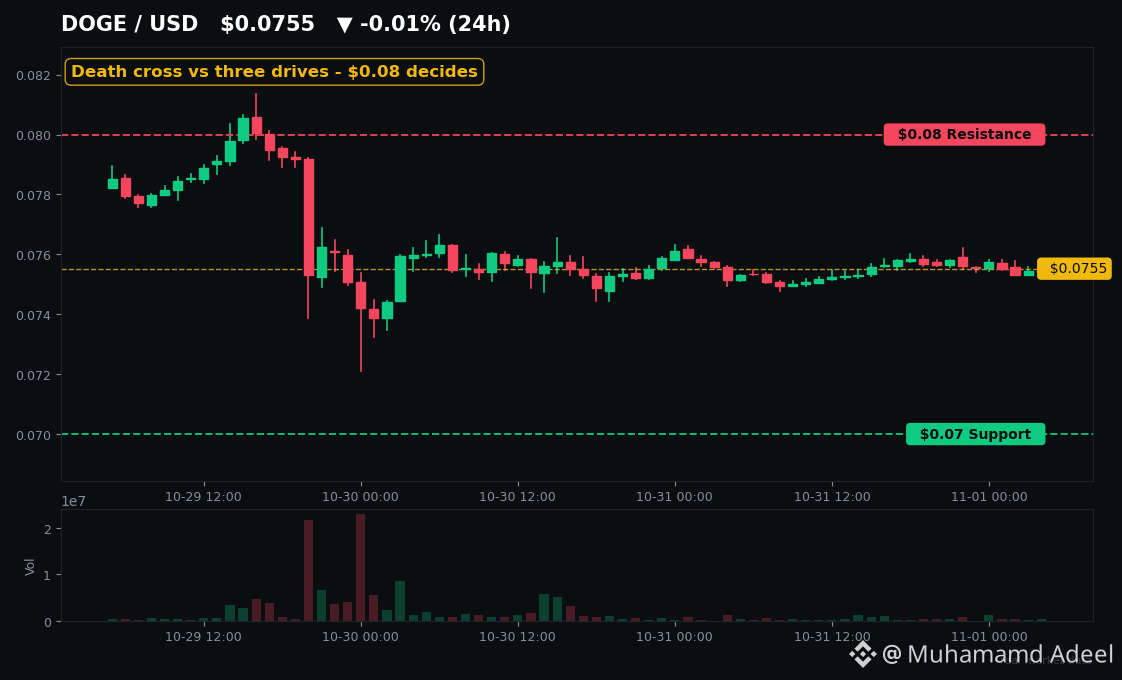
Article
DOGE's Chart Is at War: Death Cross vs. a Reversal SignalDOGE's chart is at war with itself — and you're watching the fight live.
One signal says the sell-off is exhausted. The other says the trend just broke. They can't both be right, and the next few candles will pick a winner.
Here's the setup. $DOGE is sitting around $0.0755 this morning, down roughly 20% in October. That wipeout gave back most of a Q3 rally that had closed September at $0.09447. October was supposed to be "Uptober." Instead, it was the second straight year the month bled DOGE by about a fifth. The coin now trades roughly 90% below its $0.74 all-time high from May 2021.
So why are traders suddenly paying attention again? Because two chart signals collided in the same week.
First, the bear case printed in ink: DOGE confirmed its first death cross of 2026 in late October, with the 50-day average crossing below the 200-day average. The twist? The golden cross it replaced had formed only on 5 October — barely three weeks earlier. That's an unusually fast flip, and it came with price sliding to $0.072 on 30 October, its lowest since August. Price is still below its key moving averages, and the RSI (around 35) is hovering near oversold without actually getting there yet.
Then came the counter-punch. Analyst Trader Tardigrade flagged a "three drives" pattern on the daily chart — three successive down-legs that, in textbook terms, can signal a downtrend running out of steam. The catch: the pattern only means anything if price reclaims the $0.08 area. Until then, it's a hypothesis, not a reversal.
And then the whales showed up. A single transfer of 403 million DOGE — about $30.5 million — moved on 30–31 October and set off a round of speculation. Here's the honest version: nobody in the reporting knows whether it was buying, selling, custody, or an internal wallet shuffle. Treat it as a question mark, not a buy signal.
The levels that matter
This is a tight, trade-relevant battleground:
- Support: $0.075 right under current price, then $0.07, with about $0.069 below that if selling picks up.
- Resistance: $0.08 first, then the $0.081–$0.082 zone. A daily close above that would be the first real sign of strength in weeks.
A break below $0.07 opens the door to a deeper slide. A reclaim of $0.08 flips the story to the reversal crowd. Both scenarios are live — this is analysis, not a prediction.
One more warning sign: conviction is thin. On Kraken, DOGE's 31 October volume was just $0.77 million across 2,582 trades — the quietest day of October on that venue, versus a $3.96 million daily average. Thin days make moves unreliable, so any breakout here needs rising volume to be believed. Spot DOGE ETFs also saw about $538,000 in net outflows in the week ended 24 October — no institutional rescue either.
Zoom out and the rotation picture is just as cold. $BTC is holding around $77,500 while memecoins lag, and $SHIB is down too. Nobody is rotating into memes yet — DOGE has to earn its own bounce.
My take: this is the most interesting DOGE setup in weeks precisely because it's unresolved. The death cross says "trend broken." The three drives pattern says "selling exhausted." The whale move says "someone big just repositioned." One of those stories is about to look very smart, and the $0.07–$0.08 range is where we'll find out which one.
Pull up $DOGE's chart and watch those two lines — $0.07 below, $0.08 above. That's the whole trade right now.
Not financial advice. DYOR.
DOGE's Chart Is at War: Death Cross vs. a Reversal Signal
DOGE's chart is at war with itself — and you're watching the fight live.
One signal says the sell-off is exhausted. The other says the trend just broke. They can't both be right, and the next few candles will pick a winner.
Here's the setup. $DOGE is sitting around $0.0755 this morning, down roughly 20% in October. That wipeout gave back most of a Q3 rally that had closed September at $0.09447. October was supposed to be "Uptober." Instead, it was the second straight year the month bled DOGE by about a fifth. The coin now trades roughly 90% below its $0.74 all-time high from May 2021.
So why are traders suddenly paying attention again? Because two chart signals collided in the same week.
First, the bear case printed in ink: DOGE confirmed its first death cross of 2026 in late October, with the 50-day average crossing below the 200-day average. The twist? The golden cross it replaced had formed only on 5 October — barely three weeks earlier. That's an unusually fast flip, and it came with price sliding to $0.072 on 30 October, its lowest since August. Price is still below its key moving averages, and the RSI (around 35) is hovering near oversold without actually getting there yet.
Then came the counter-punch. Analyst Trader Tardigrade flagged a "three drives" pattern on the daily chart — three successive down-legs that, in textbook terms, can signal a downtrend running out of steam. The catch: the pattern only means anything if price reclaims the $0.08 area. Until then, it's a hypothesis, not a reversal.
And then the whales showed up. A single transfer of 403 million DOGE — about $30.5 million — moved on 30–31 October and set off a round of speculation. Here's the honest version: nobody in the reporting knows whether it was buying, selling, custody, or an internal wallet shuffle. Treat it as a question mark, not a buy signal.
The levels that matter
This is a tight, trade-relevant battleground:
- Support: $0.075 right under current price, then $0.07, with about $0.069 below that if selling picks up.
- Resistance: $0.08 first, then the $0.081–$0.082 zone. A daily close above that would be the first real sign of strength in weeks.
A break below $0.07 opens the door to a deeper slide. A reclaim of $0.08 flips the story to the reversal crowd. Both scenarios are live — this is analysis, not a prediction.
One more warning sign: conviction is thin. On Kraken, DOGE's 31 October volume was just $0.77 million across 2,582 trades — the quietest day of October on that venue, versus a $3.96 million daily average. Thin days make moves unreliable, so any breakout here needs rising volume to be believed. Spot DOGE ETFs also saw about $538,000 in net outflows in the week ended 24 October — no institutional rescue either.
Zoom out and the rotation picture is just as cold. $BTC is holding around $77,500 while memecoins lag, and $SHIB is down too. Nobody is rotating into memes yet — DOGE has to earn its own bounce.
My take: this is the most interesting DOGE setup in weeks precisely because it's unresolved. The death cross says "trend broken." The three drives pattern says "selling exhausted." The whale move says "someone big just repositioned." One of those stories is about to look very smart, and the $0.07–$0.08 range is where we'll find out which one.
Pull up $DOGE 's chart and watch those two lines — $0.07 below, $0.08 above. That's the whole trade right now.
Not financial advice. DYOR.
One signal says the sell-off is exhausted. The other says the trend just broke. They can't both be right, and the next few candles will pick a winner.
Here's the setup. $DOGE is sitting around $0.0755 this morning, down roughly 20% in October. That wipeout gave back most of a Q3 rally that had closed September at $0.09447. October was supposed to be "Uptober." Instead, it was the second straight year the month bled DOGE by about a fifth. The coin now trades roughly 90% below its $0.74 all-time high from May 2021.
So why are traders suddenly paying attention again? Because two chart signals collided in the same week.
First, the bear case printed in ink: DOGE confirmed its first death cross of 2026 in late October, with the 50-day average crossing below the 200-day average. The twist? The golden cross it replaced had formed only on 5 October — barely three weeks earlier. That's an unusually fast flip, and it came with price sliding to $0.072 on 30 October, its lowest since August. Price is still below its key moving averages, and the RSI (around 35) is hovering near oversold without actually getting there yet.
Then came the counter-punch. Analyst Trader Tardigrade flagged a "three drives" pattern on the daily chart — three successive down-legs that, in textbook terms, can signal a downtrend running out of steam. The catch: the pattern only means anything if price reclaims the $0.08 area. Until then, it's a hypothesis, not a reversal.
And then the whales showed up. A single transfer of 403 million DOGE — about $30.5 million — moved on 30–31 October and set off a round of speculation. Here's the honest version: nobody in the reporting knows whether it was buying, selling, custody, or an internal wallet shuffle. Treat it as a question mark, not a buy signal.
The levels that matter
This is a tight, trade-relevant battleground:
- Support: $0.075 right under current price, then $0.07, with about $0.069 below that if selling picks up.
- Resistance: $0.08 first, then the $0.081–$0.082 zone. A daily close above that would be the first real sign of strength in weeks.
A break below $0.07 opens the door to a deeper slide. A reclaim of $0.08 flips the story to the reversal crowd. Both scenarios are live — this is analysis, not a prediction.
One more warning sign: conviction is thin. On Kraken, DOGE's 31 October volume was just $0.77 million across 2,582 trades — the quietest day of October on that venue, versus a $3.96 million daily average. Thin days make moves unreliable, so any breakout here needs rising volume to be believed. Spot DOGE ETFs also saw about $538,000 in net outflows in the week ended 24 October — no institutional rescue either.
Zoom out and the rotation picture is just as cold. $BTC is holding around $77,500 while memecoins lag, and $SHIB is down too. Nobody is rotating into memes yet — DOGE has to earn its own bounce.
My take: this is the most interesting DOGE setup in weeks precisely because it's unresolved. The death cross says "trend broken." The three drives pattern says "selling exhausted." The whale move says "someone big just repositioned." One of those stories is about to look very smart, and the $0.07–$0.08 range is where we'll find out which one.
Pull up $DOGE 's chart and watch those two lines — $0.07 below, $0.08 above. That's the whole trade right now.
Not financial advice. DYOR.
52
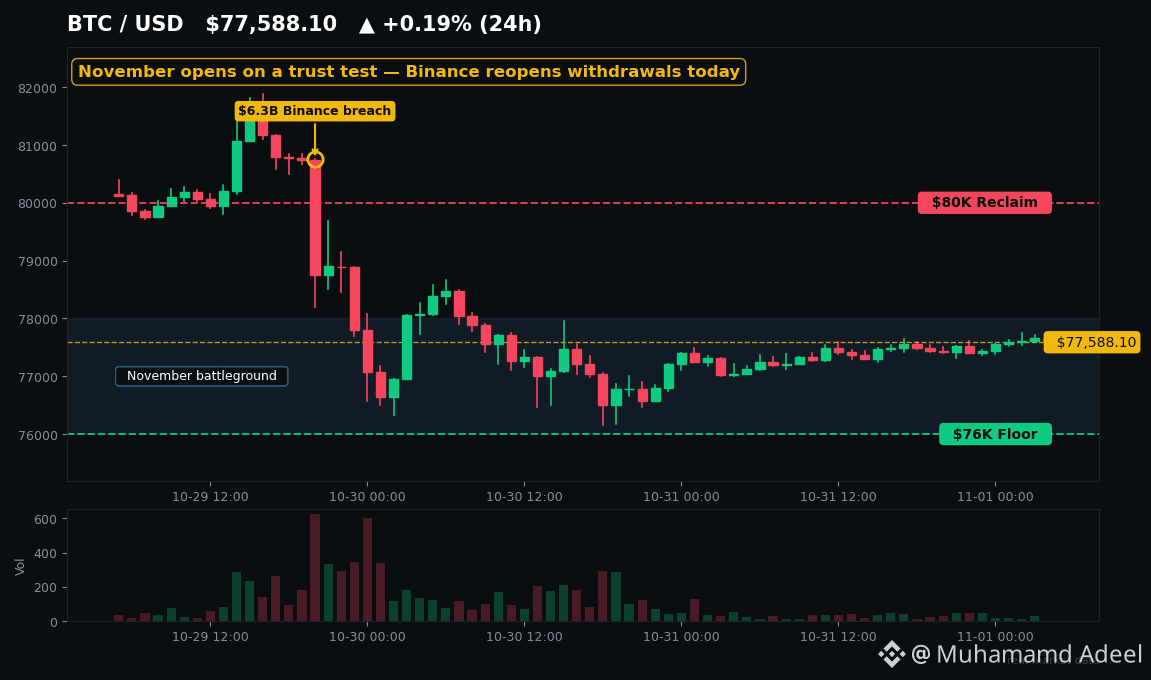
Article
November Opens on a Trust Test: Can Bitcoin Hold $77K?October was supposed to be Uptober. It ended as REKtober — and Bitcoin ($BTC) closed the month at around $77,400.
So here's the question November has to answer: is $77K a floor, or just a pause before the next leg down?
Let's be honest about the damage. Bitcoin opened October near $83,500 and finished roughly 7.5% lower — its worst October since 2014. The month's low came in the chaos after a roughly $6.3B breach at Binance, with Bitcoin dipping to about $76,443. More than $1.5B in leveraged positions got wiped out in a day. Ethereum ($ETH) closed October near $2,253, and sentiment gauges are stuck in fear territory. Bitcoin now trades about 39% below its peak near $126,000.
It wasn't one thing. U.S. spot Bitcoin ETFs pulled around $643M on October 30 alone — the biggest single-day outflow since June — wiping out four straight days of inflows. At the same time, tech stocks sold off and a hawkish Fed kept a December hike heavily priced. Bitcoin traded like a tech stock, not a hedge.
What decides November? The levels, not the noise. Holding the $76K zone keeps the recovery story alive — first reclaim $78K, then $80K. But the real line in the sand is higher: $83,000, the level whose loss on weekly closes started this slide. Lose $76K and the next stops are the $75,718 weekly pivot, then $73,000–$75,000, with $71,000 below that. Pull up the $BTC chart — a coin parked between a floor everyone is watching and a ceiling nobody has reclaimed.
And today is the live test. Binance says it has replenished 90% of the stolen funds and aims to reopen withdrawals today, with a full proof of reserves due in the coming days. If withdrawals reopen smoothly, trust rebuilds fast. If they stall, that's a fresh panic trigger — no chart pattern saves you from that. For $BNB watchers, this is your week too. Then come the U.S. midterms on Tuesday and jobs data on Friday.
History is not kind to this setup: the last two red Octobers — 2018 and 2025 — were followed by Novembers down roughly 37% and 18%. After the Bybit hack in February 2025, the deeper low came 18 days later, not on day one. After FTX, Bitcoin didn't V-shape — it ground sideways for weeks. November is famous for bounces, but mostly after green Octobers, not red ones.
Here's the twist: while ETFs sold on October 30, coins kept leaving exchanges for a third straight day. Whales weren't panic-dumping into the crash — they were pulling Bitcoin off exchanges through it. That's not a bottom call. It's a split market: institutions sold, long-term holders quietly accumulated. One analyst summed it up: $60,000 or $100,000 — possibly both before year-end.
So no, I'm not calling the bottom. November gives Bitcoin two paths: hold $76K, rebuild trust this week, and take a shot at $80K — or lose it and let history repeat. Which one are you watching? Check the $BTC chart and decide for yourself.
Not financial advice. DYOR.
November Opens on a Trust Test: Can Bitcoin Hold $77K?
October was supposed to be Uptober. It ended as REKtober — and Bitcoin ($BTC ) closed the month at around $77,400.
So here's the question November has to answer: is $77K a floor, or just a pause before the next leg down?
Let's be honest about the damage. Bitcoin opened October near $83,500 and finished roughly 7.5% lower — its worst October since 2014. The month's low came in the chaos after a roughly $6.3B breach at Binance, with Bitcoin dipping to about $76,443. More than $1.5B in leveraged positions got wiped out in a day. Ethereum ($ETH ) closed October near $2,253, and sentiment gauges are stuck in fear territory. Bitcoin now trades about 39% below its peak near $126,000.
It wasn't one thing. U.S. spot Bitcoin ETFs pulled around $643M on October 30 alone — the biggest single-day outflow since June — wiping out four straight days of inflows. At the same time, tech stocks sold off and a hawkish Fed kept a December hike heavily priced. Bitcoin traded like a tech stock, not a hedge.
What decides November? The levels, not the noise. Holding the $76K zone keeps the recovery story alive — first reclaim $78K, then $80K. But the real line in the sand is higher: $83,000, the level whose loss on weekly closes started this slide. Lose $76K and the next stops are the $75,718 weekly pivot, then $73,000–$75,000, with $71,000 below that. Pull up the $BTC chart — a coin parked between a floor everyone is watching and a ceiling nobody has reclaimed.
And today is the live test. Binance says it has replenished 90% of the stolen funds and aims to reopen withdrawals today, with a full proof of reserves due in the coming days. If withdrawals reopen smoothly, trust rebuilds fast. If they stall, that's a fresh panic trigger — no chart pattern saves you from that. For $BNB watchers, this is your week too. Then come the U.S. midterms on Tuesday and jobs data on Friday.
History is not kind to this setup: the last two red Octobers — 2018 and 2025 — were followed by Novembers down roughly 37% and 18%. After the Bybit hack in February 2025, the deeper low came 18 days later, not on day one. After FTX, Bitcoin didn't V-shape — it ground sideways for weeks. November is famous for bounces, but mostly after green Octobers, not red ones.
Here's the twist: while ETFs sold on October 30, coins kept leaving exchanges for a third straight day. Whales weren't panic-dumping into the crash — they were pulling Bitcoin off exchanges through it. That's not a bottom call. It's a split market: institutions sold, long-term holders quietly accumulated. One analyst summed it up: $60,000 or $100,000 — possibly both before year-end.
So no, I'm not calling the bottom. November gives Bitcoin two paths: hold $76K, rebuild trust this week, and take a shot at $80K — or lose it and let history repeat. Which one are you watching? Check the $BTC chart and decide for yourself.
Not financial advice. DYOR.
So here's the question November has to answer: is $77K a floor, or just a pause before the next leg down?
Let's be honest about the damage. Bitcoin opened October near $83,500 and finished roughly 7.5% lower — its worst October since 2014. The month's low came in the chaos after a roughly $6.3B breach at Binance, with Bitcoin dipping to about $76,443. More than $1.5B in leveraged positions got wiped out in a day. Ethereum ($ETH ) closed October near $2,253, and sentiment gauges are stuck in fear territory. Bitcoin now trades about 39% below its peak near $126,000.
It wasn't one thing. U.S. spot Bitcoin ETFs pulled around $643M on October 30 alone — the biggest single-day outflow since June — wiping out four straight days of inflows. At the same time, tech stocks sold off and a hawkish Fed kept a December hike heavily priced. Bitcoin traded like a tech stock, not a hedge.
What decides November? The levels, not the noise. Holding the $76K zone keeps the recovery story alive — first reclaim $78K, then $80K. But the real line in the sand is higher: $83,000, the level whose loss on weekly closes started this slide. Lose $76K and the next stops are the $75,718 weekly pivot, then $73,000–$75,000, with $71,000 below that. Pull up the $BTC chart — a coin parked between a floor everyone is watching and a ceiling nobody has reclaimed.
And today is the live test. Binance says it has replenished 90% of the stolen funds and aims to reopen withdrawals today, with a full proof of reserves due in the coming days. If withdrawals reopen smoothly, trust rebuilds fast. If they stall, that's a fresh panic trigger — no chart pattern saves you from that. For $BNB watchers, this is your week too. Then come the U.S. midterms on Tuesday and jobs data on Friday.
History is not kind to this setup: the last two red Octobers — 2018 and 2025 — were followed by Novembers down roughly 37% and 18%. After the Bybit hack in February 2025, the deeper low came 18 days later, not on day one. After FTX, Bitcoin didn't V-shape — it ground sideways for weeks. November is famous for bounces, but mostly after green Octobers, not red ones.
Here's the twist: while ETFs sold on October 30, coins kept leaving exchanges for a third straight day. Whales weren't panic-dumping into the crash — they were pulling Bitcoin off exchanges through it. That's not a bottom call. It's a split market: institutions sold, long-term holders quietly accumulated. One analyst summed it up: $60,000 or $100,000 — possibly both before year-end.
So no, I'm not calling the bottom. November gives Bitcoin two paths: hold $76K, rebuild trust this week, and take a shot at $80K — or lose it and let history repeat. Which one are you watching? Check the $BTC chart and decide for yourself.
Not financial advice. DYOR.
73
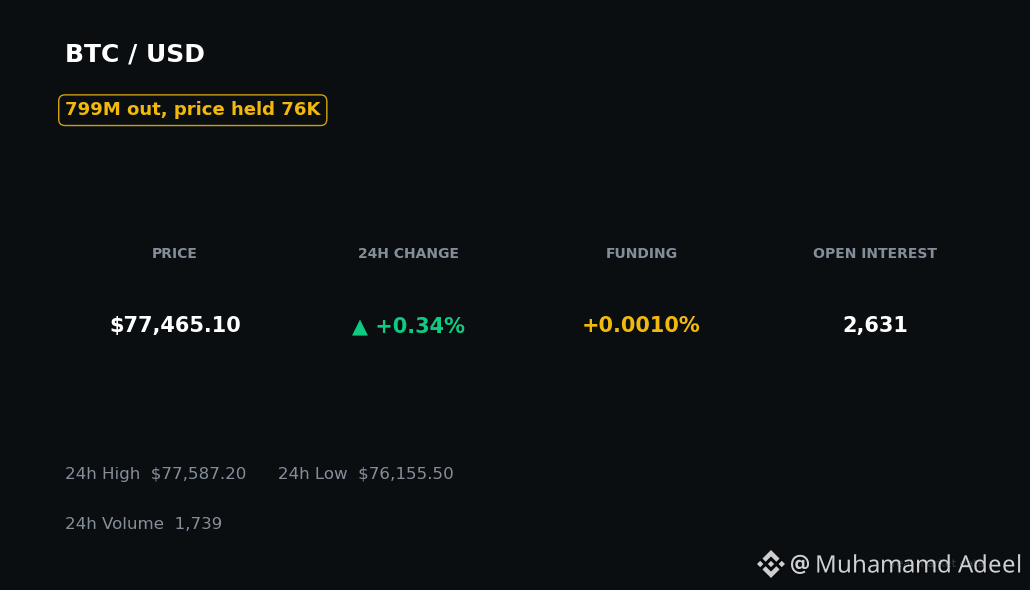
Article
$799M Fled ETFs in One Day — Then BTC Bounced. Panic or Capitulation?$799M fled crypto ETFs in a single day. And $BTC still refused to break $76K.
So which side is lying — the money walking out, or the price holding up?
Let's start with the number, because it's huge. On 30 October, US spot Bitcoin ETFs lost $643 million and Ethereum ETFs lost $156 million — roughly $799 million combined. BlackRock's IBIT alone shed about $234 million, Fidelity's FBTC about $201 million. It was the biggest Bitcoin ETF exit since June, and it wiped out the entire four-day inflow streak from 26–29 October ($440.8 million) in one session. For $ETH, it was a fifth straight day of outflows.
That's the panic headline. But look one layer deeper and the tape splits.
While institutions were exiting, 1,900 BTC — about $148 million — moved into nine brand-new wallets via Galaxy Digital right in the middle of the crash. Now be careful: a transfer into fresh wallets is not proof someone bought. It could be custody, OTC settlement, or client allocation. But it is not what capitulation usually looks like either. And the forced selling cooled fast: liquidations collapsed from roughly $1.5 billion on 30 October to about $427 million in the 24 hours to today. The flush got smaller, not bigger.
Sentiment? Fearful, but not broken. The Crypto Fear & Greed Index sits at 30 — Fear, flat on yesterday, down from 51 Neutral a week ago. That's fear, not the Extreme Fear that usually marks true capitulation. Social is split down the middle: retail voices are loudly buying the dip at $76K, while analysts are mostly waiting lower — one well-known analyst says he'd only reassess a dip buy near the 200-day average around $73,000. Even one whale sold two-thirds of his position at $76,000, planning to rebuy between $76,000 and $78,000. Nobody is all-in on either side.
There's one more stabiliser in the background. Binance said today it has now replenished 90% of the crypto stolen in the $6.3 billion breach, with a phased restart of withdrawals targeted for Sunday. But withdrawals are still paused as this is written — so this bounce is happening on a market that hasn't fully reopened yet. Keep that in mind before calling it a recovery.
History refuses to pick a side too. Big ETF outflows marked local bottoms in November 2024 — twice. But the record February 2025 outflow marked acceleration lower, not a bottom. And after June 2026's $691.7 million exit, recovery took a whole quarter, not a weekend. One green day proves nothing.
So here's what actually matters now. For $BTC, $76,000 is the line: it's roughly where short-term holders break even and where September's low sits. Hold above it, and a reclaim of $78,500 opens a relief move toward $80,000. Lose it on a daily close, and $75,000 — then $73,000 — comes into play fast. For $ETH, watch $2,170 below and $2,350 above. And the real verdict lands Monday 2 November: it's a Saturday, so no new ETF flow data exists today. If outflows print a second straight heavy day, 30 October was a trend. If flows flatten, it was a flush.
Pull up $BTC's chart and watch that $76K line with me — because the market is about to tell us which story was true.
Are you reading this as panic selling, or the start of capitulation?
Not financial advice. DYOR.
$799M Fled ETFs in One Day — Then BTC Bounced. Panic or Capitulation?
$799M fled crypto ETFs in a single day. And $BTC still refused to break $76K.
So which side is lying — the money walking out, or the price holding up?
Let's start with the number, because it's huge. On 30 October, US spot Bitcoin ETFs lost $643 million and Ethereum ETFs lost $156 million — roughly $799 million combined. BlackRock's IBIT alone shed about $234 million, Fidelity's FBTC about $201 million. It was the biggest Bitcoin ETF exit since June, and it wiped out the entire four-day inflow streak from 26–29 October ($440.8 million) in one session. For $ETH , it was a fifth straight day of outflows.
That's the panic headline. But look one layer deeper and the tape splits.
While institutions were exiting, 1,900 BTC — about $148 million — moved into nine brand-new wallets via Galaxy Digital right in the middle of the crash. Now be careful: a transfer into fresh wallets is not proof someone bought. It could be custody, OTC settlement, or client allocation. But it is not what capitulation usually looks like either. And the forced selling cooled fast: liquidations collapsed from roughly $1.5 billion on 30 October to about $427 million in the 24 hours to today. The flush got smaller, not bigger.
Sentiment? Fearful, but not broken. The Crypto Fear & Greed Index sits at 30 — Fear, flat on yesterday, down from 51 Neutral a week ago. That's fear, not the Extreme Fear that usually marks true capitulation. Social is split down the middle: retail voices are loudly buying the dip at $76K, while analysts are mostly waiting lower — one well-known analyst says he'd only reassess a dip buy near the 200-day average around $73,000. Even one whale sold two-thirds of his position at $76,000, planning to rebuy between $76,000 and $78,000. Nobody is all-in on either side.
There's one more stabiliser in the background. Binance said today it has now replenished 90% of the crypto stolen in the $6.3 billion breach, with a phased restart of withdrawals targeted for Sunday. But withdrawals are still paused as this is written — so this bounce is happening on a market that hasn't fully reopened yet. Keep that in mind before calling it a recovery.
History refuses to pick a side too. Big ETF outflows marked local bottoms in November 2024 — twice. But the record February 2025 outflow marked acceleration lower, not a bottom. And after June 2026's $691.7 million exit, recovery took a whole quarter, not a weekend. One green day proves nothing.
So here's what actually matters now. For $BTC , $76,000 is the line: it's roughly where short-term holders break even and where September's low sits. Hold above it, and a reclaim of $78,500 opens a relief move toward $80,000. Lose it on a daily close, and $75,000 — then $73,000 — comes into play fast. For $ETH , watch $2,170 below and $2,350 above. And the real verdict lands Monday 2 November: it's a Saturday, so no new ETF flow data exists today. If outflows print a second straight heavy day, 30 October was a trend. If flows flatten, it was a flush.
Pull up $BTC 's chart and watch that $76K line with me — because the market is about to tell us which story was true.
Are you reading this as panic selling, or the start of capitulation?
Not financial advice. DYOR.
So which side is lying — the money walking out, or the price holding up?
Let's start with the number, because it's huge. On 30 October, US spot Bitcoin ETFs lost $643 million and Ethereum ETFs lost $156 million — roughly $799 million combined. BlackRock's IBIT alone shed about $234 million, Fidelity's FBTC about $201 million. It was the biggest Bitcoin ETF exit since June, and it wiped out the entire four-day inflow streak from 26–29 October ($440.8 million) in one session. For $ETH , it was a fifth straight day of outflows.
That's the panic headline. But look one layer deeper and the tape splits.
While institutions were exiting, 1,900 BTC — about $148 million — moved into nine brand-new wallets via Galaxy Digital right in the middle of the crash. Now be careful: a transfer into fresh wallets is not proof someone bought. It could be custody, OTC settlement, or client allocation. But it is not what capitulation usually looks like either. And the forced selling cooled fast: liquidations collapsed from roughly $1.5 billion on 30 October to about $427 million in the 24 hours to today. The flush got smaller, not bigger.
Sentiment? Fearful, but not broken. The Crypto Fear & Greed Index sits at 30 — Fear, flat on yesterday, down from 51 Neutral a week ago. That's fear, not the Extreme Fear that usually marks true capitulation. Social is split down the middle: retail voices are loudly buying the dip at $76K, while analysts are mostly waiting lower — one well-known analyst says he'd only reassess a dip buy near the 200-day average around $73,000. Even one whale sold two-thirds of his position at $76,000, planning to rebuy between $76,000 and $78,000. Nobody is all-in on either side.
There's one more stabiliser in the background. Binance said today it has now replenished 90% of the crypto stolen in the $6.3 billion breach, with a phased restart of withdrawals targeted for Sunday. But withdrawals are still paused as this is written — so this bounce is happening on a market that hasn't fully reopened yet. Keep that in mind before calling it a recovery.
History refuses to pick a side too. Big ETF outflows marked local bottoms in November 2024 — twice. But the record February 2025 outflow marked acceleration lower, not a bottom. And after June 2026's $691.7 million exit, recovery took a whole quarter, not a weekend. One green day proves nothing.
So here's what actually matters now. For $BTC , $76,000 is the line: it's roughly where short-term holders break even and where September's low sits. Hold above it, and a reclaim of $78,500 opens a relief move toward $80,000. Lose it on a daily close, and $75,000 — then $73,000 — comes into play fast. For $ETH , watch $2,170 below and $2,350 above. And the real verdict lands Monday 2 November: it's a Saturday, so no new ETF flow data exists today. If outflows print a second straight heavy day, 30 October was a trend. If flows flatten, it was a flush.
Pull up $BTC 's chart and watch that $76K line with me — because the market is about to tell us which story was true.
Are you reading this as panic selling, or the start of capitulation?
Not financial advice. DYOR.
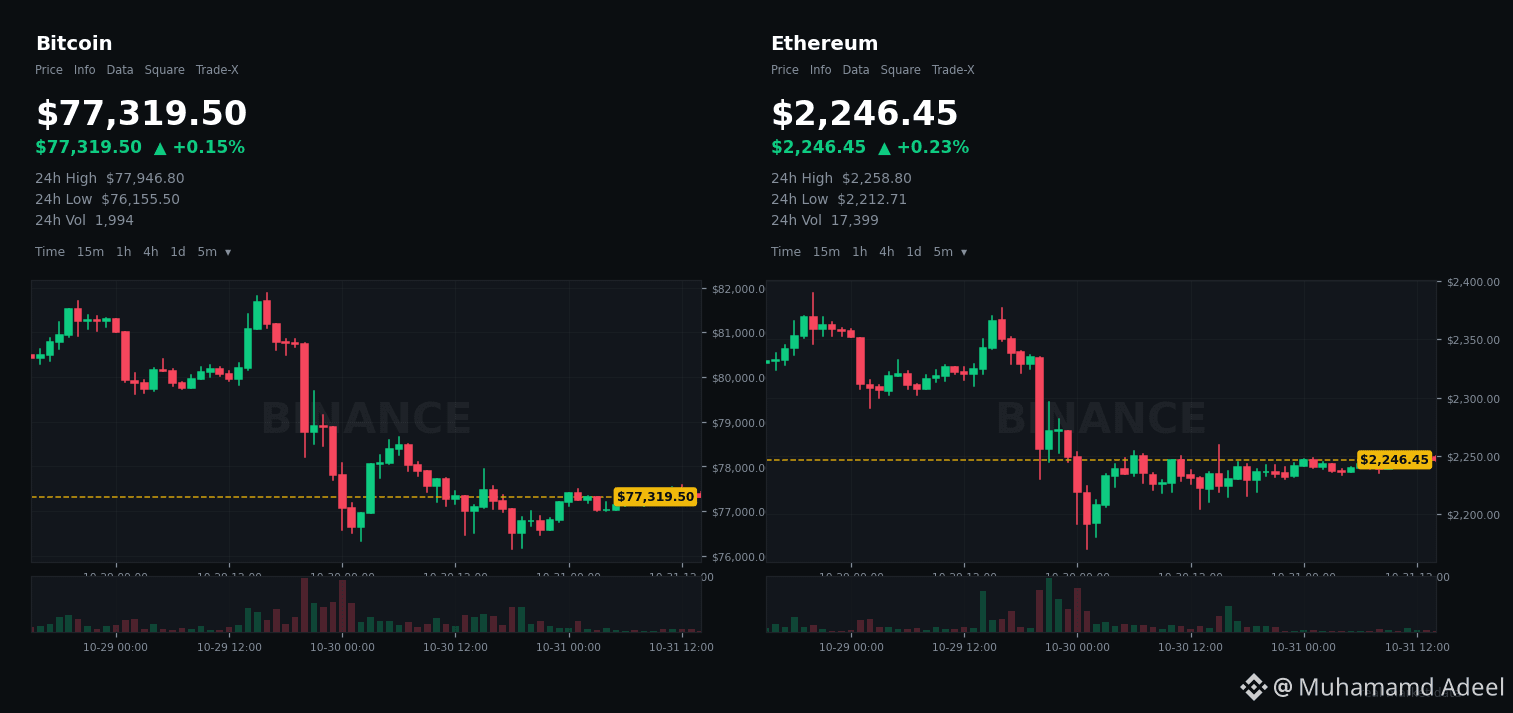
Article
$799M Fled Crypto ETFs in One Day — And BTC Still Bounced$799 million walked out of US spot crypto ETFs in a single day.
And $BTC still bounced. That contradiction is the whole story.
On 30 October, the final numbers landed: $643 million out of spot Bitcoin ETFs and $156 million out of spot Ethereum ETFs. Combined, $799 million — in one session.
It wiped out the entire four-day inflow streak that came before it. From 26 to 29 October, Bitcoin ETFs had pulled in $440.8 million. One bad Friday erased all of it, plus another $202 million on top. BlackRock's IBIT led the exits at $234 million, with Fidelity's FBTC close behind at $201 million.
So what actually happened? Bitcoin fell to $76,368 on 30 October, its lowest in six weeks, while Ethereum touched $2,178, a two-month low. Then both steadied — Bitcoin near $77,300 and Ethereum near $2,240 on 31 October.
Here's what this really means — and what it doesn't.
First, do not read this as institutions fleeing crypto because of the Binance hack. The timing is loud: the outflows came in the first full session after Binance reported a roughly $6.3 billion breach. But no data confirms the hack caused the redemptions, and ETF coins do not sit on Binance at all. They sit with regulated custodians. The fear may have travelled; the coins did not.
Second, check the scale before you panic. That $643 million is about 0.7% of the $98 billion sitting in spot Bitcoin ETFs, against $57 billion of cumulative inflows since January 2024. That is a dent, not a demolition. One day of trimming is not an exodus.
Third, Ethereum is telling a different story from Bitcoin. Bitcoin's outflow ended a four-day inflow run. Ethereum's was its fifth straight day of outflows — $431 million across the week. One is an event-driven wobble. The other is a steady bleed. Do not treat them as the same trade.
The backdrop matters too. The Fed held rates at 3.75%–4.00% on 28 October in a 10–2 vote, with two officials dissenting for a hike, and markets now price roughly a 70–75% chance of a December hike. The 10-year Treasury closed 30 October at 4.93%, off its 5.31% peak earlier in the month. And fear is back: the Fear & Greed Index sits at 30, down from 51 a week earlier.
So what do I watch next?
For $BTC, hold above $76,300 and the bounce has legs; lose $75,900 and the sellers get their second wind. For $ETH, $2,208 is the line underneath, with $2,300 the first level a real recovery has to reclaim. Pull up the $BTC chart and you can see the fight playing out in real time.
History's honest warning: after the last print this big, on 22 October, Bitcoin kept sliding for another week.
Monday's ETF print, on 2 November, is the verdict. If inflows return, 30 October was a risk-off Friday. If they don't, the bleed is real.
Not financial advice. DYOR.
$799M Fled Crypto ETFs in One Day — And BTC Still Bounced
$799 million walked out of US spot crypto ETFs in a single day.
And $BTC still bounced. That contradiction is the whole story.
On 30 October, the final numbers landed: $643 million out of spot Bitcoin ETFs and $156 million out of spot Ethereum ETFs. Combined, $799 million — in one session.
It wiped out the entire four-day inflow streak that came before it. From 26 to 29 October, Bitcoin ETFs had pulled in $440.8 million. One bad Friday erased all of it, plus another $202 million on top. BlackRock's IBIT led the exits at $234 million, with Fidelity's FBTC close behind at $201 million.
So what actually happened? Bitcoin fell to $76,368 on 30 October, its lowest in six weeks, while Ethereum touched $2,178, a two-month low. Then both steadied — Bitcoin near $77,300 and Ethereum near $2,240 on 31 October.
Here's what this really means — and what it doesn't.
First, do not read this as institutions fleeing crypto because of the Binance hack. The timing is loud: the outflows came in the first full session after Binance reported a roughly $6.3 billion breach. But no data confirms the hack caused the redemptions, and ETF coins do not sit on Binance at all. They sit with regulated custodians. The fear may have travelled; the coins did not.
Second, check the scale before you panic. That $643 million is about 0.7% of the $98 billion sitting in spot Bitcoin ETFs, against $57 billion of cumulative inflows since January 2024. That is a dent, not a demolition. One day of trimming is not an exodus.
Third, Ethereum is telling a different story from Bitcoin. Bitcoin's outflow ended a four-day inflow run. Ethereum's was its fifth straight day of outflows — $431 million across the week. One is an event-driven wobble. The other is a steady bleed. Do not treat them as the same trade.
The backdrop matters too. The Fed held rates at 3.75%–4.00% on 28 October in a 10–2 vote, with two officials dissenting for a hike, and markets now price roughly a 70–75% chance of a December hike. The 10-year Treasury closed 30 October at 4.93%, off its 5.31% peak earlier in the month. And fear is back: the Fear & Greed Index sits at 30, down from 51 a week earlier.
So what do I watch next?
For $BTC , hold above $76,300 and the bounce has legs; lose $75,900 and the sellers get their second wind. For $ETH , $2,208 is the line underneath, with $2,300 the first level a real recovery has to reclaim. Pull up the $BTC chart and you can see the fight playing out in real time.
History's honest warning: after the last print this big, on 22 October, Bitcoin kept sliding for another week.
Monday's ETF print, on 2 November, is the verdict. If inflows return, 30 October was a risk-off Friday. If they don't, the bleed is real.
Not financial advice. DYOR.
And $BTC still bounced. That contradiction is the whole story.
On 30 October, the final numbers landed: $643 million out of spot Bitcoin ETFs and $156 million out of spot Ethereum ETFs. Combined, $799 million — in one session.
It wiped out the entire four-day inflow streak that came before it. From 26 to 29 October, Bitcoin ETFs had pulled in $440.8 million. One bad Friday erased all of it, plus another $202 million on top. BlackRock's IBIT led the exits at $234 million, with Fidelity's FBTC close behind at $201 million.
So what actually happened? Bitcoin fell to $76,368 on 30 October, its lowest in six weeks, while Ethereum touched $2,178, a two-month low. Then both steadied — Bitcoin near $77,300 and Ethereum near $2,240 on 31 October.
Here's what this really means — and what it doesn't.
First, do not read this as institutions fleeing crypto because of the Binance hack. The timing is loud: the outflows came in the first full session after Binance reported a roughly $6.3 billion breach. But no data confirms the hack caused the redemptions, and ETF coins do not sit on Binance at all. They sit with regulated custodians. The fear may have travelled; the coins did not.
Second, check the scale before you panic. That $643 million is about 0.7% of the $98 billion sitting in spot Bitcoin ETFs, against $57 billion of cumulative inflows since January 2024. That is a dent, not a demolition. One day of trimming is not an exodus.
Third, Ethereum is telling a different story from Bitcoin. Bitcoin's outflow ended a four-day inflow run. Ethereum's was its fifth straight day of outflows — $431 million across the week. One is an event-driven wobble. The other is a steady bleed. Do not treat them as the same trade.
The backdrop matters too. The Fed held rates at 3.75%–4.00% on 28 October in a 10–2 vote, with two officials dissenting for a hike, and markets now price roughly a 70–75% chance of a December hike. The 10-year Treasury closed 30 October at 4.93%, off its 5.31% peak earlier in the month. And fear is back: the Fear & Greed Index sits at 30, down from 51 a week earlier.
So what do I watch next?
For $BTC , hold above $76,300 and the bounce has legs; lose $75,900 and the sellers get their second wind. For $ETH , $2,208 is the line underneath, with $2,300 the first level a real recovery has to reclaim. Pull up the $BTC chart and you can see the fight playing out in real time.
History's honest warning: after the last print this big, on 22 October, Bitcoin kept sliding for another week.
Monday's ETF print, on 2 November, is the verdict. If inflows return, 30 October was a risk-off Friday. If they don't, the bleed is real.
Not financial advice. DYOR.
2
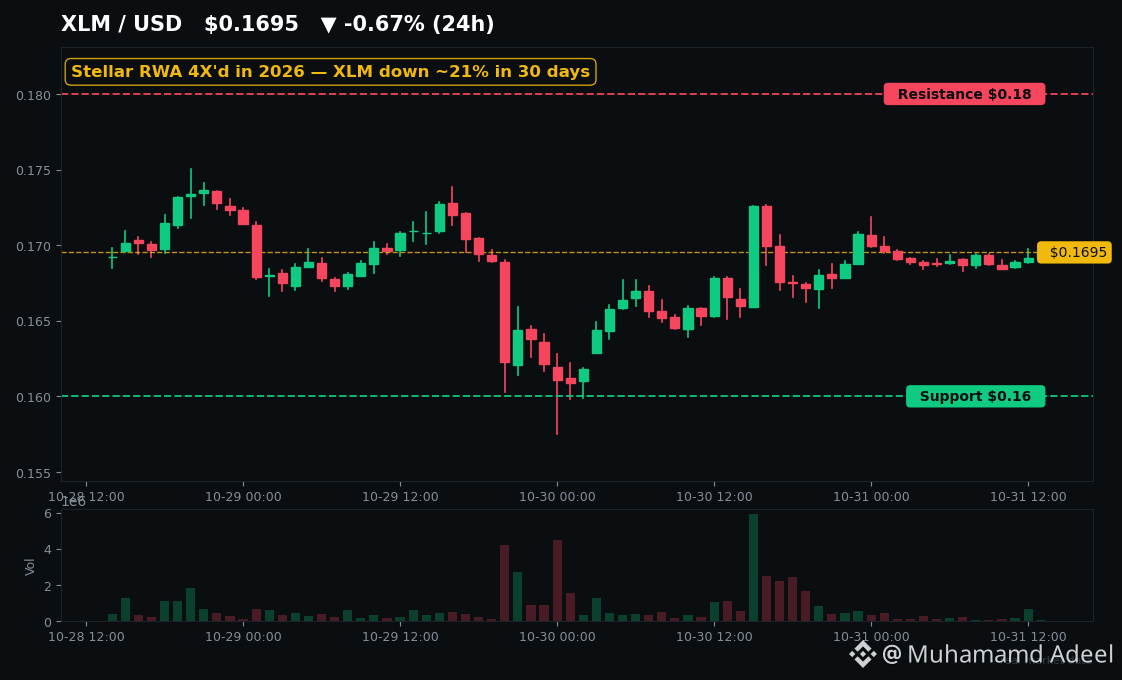
Article
Stellar Holds $4B of Real Assets — But $XLM Is Still Stuck at $0.17Wall Street poured billions onto Stellar this year. So why is $XLM still sitting around $0.17?
That contradiction is the whole story. Stellar now hosts about $4.1 billion in tokenized real-world assets, according to the Stellar Development Foundation's Q3 report — up 36% in a single quarter and 548% year over year. At the start of 2026 that figure was under $900 million. The rails are winning. The token is not.
Let's be precise about what "winning" means. Franklin Templeton — a $1.79 trillion asset manager — launched its BENJI tokenized money market fund on Stellar in April 2021, the first US-registered fund to run on a public chain. Its own case study puts $654 million of BENJI on Stellar. Add Spiko, Realiz and WisdomTree, and you get a chain quietly becoming the institutional fund shelf of crypto.
And the plot thickened last week. On 21–22 October, Franklin added about $150 million of its Singapore fund, sgBENJI, on the XRP Ledger, lifting its XRPL balance to nearly 193 million shares, worth around $200 million. Here's the catch most headlines skipped: all of it went to a single wallet, it pairs with Ripple's RLUSD — not XRP — and it creates no direct buying pressure on $XRP or $XLM. Institutions are buying the fund, not the token.
Then came the genuinely fresh catalyst. On 29 October, MetaMask made Stellar a default network, and Curve Finance launched its StableSwap on Stellar — its first native deployment outside EVM chains. The network itself clocked 14.16 million transactions on 23 October, its busiest day of the month, while Q3 stablecoin volume hit $25.1 billion, up 121% quarter over quarter.
So what would actually close the gap? Watch the levels. $XLM is pinned between support near $0.16 and resistance at $0.18 — it sits below its major daily moving averages, down roughly a fifth over the last month. A reclaim of $0.18 would be the first sign the market is repricing the rails story; a break below $0.16 puts $0.15 in focus. Check the $XLM chart yourself at those two lines — that's where this thesis lives or dies.
And keep the honest risk in view. Only about 0.1% of Stellar's tokenized assets are actually used as DeFi lending collateral, and roughly 83% have no on-chain market to sell into. Franklin's fund took two years just to pass $270 million after its 2021 launch — infrastructure builds slowly, and past Stellar pops, like the MoneyGram deal in 2021, faded. The next real test is the DTCC link planned for the first half of 2027, not tomorrow. Meanwhile $BTC is still digesting the $6.3 billion Binance hack around $77,000, so even a great rails story needs a price trigger.
Here's my take: Stellar is the quiet winner of tokenization's infrastructure race — but until tokenized assets create real demand for XLM itself, the token stays a show-me story. The $0.18 reclaim is the show-me moment. Until then, you're betting on the rails, not the ride.
Is Stellar the quiet winner of tokenization, or does the token never catch the rails?
Not financial advice. DYOR.
Stellar Holds $4B of Real Assets — But $XLM Is Still Stuck at $0.17
Wall Street poured billions onto Stellar this year. So why is $XLM still sitting around $0.17?
That contradiction is the whole story. Stellar now hosts about $4.1 billion in tokenized real-world assets, according to the Stellar Development Foundation's Q3 report — up 36% in a single quarter and 548% year over year. At the start of 2026 that figure was under $900 million. The rails are winning. The token is not.
Let's be precise about what "winning" means. Franklin Templeton — a $1.79 trillion asset manager — launched its BENJI tokenized money market fund on Stellar in April 2021, the first US-registered fund to run on a public chain. Its own case study puts $654 million of BENJI on Stellar. Add Spiko, Realiz and WisdomTree, and you get a chain quietly becoming the institutional fund shelf of crypto.
And the plot thickened last week. On 21–22 October, Franklin added about $150 million of its Singapore fund, sgBENJI, on the XRP Ledger, lifting its XRPL balance to nearly 193 million shares, worth around $200 million. Here's the catch most headlines skipped: all of it went to a single wallet, it pairs with Ripple's RLUSD — not XRP — and it creates no direct buying pressure on $XRP or $XLM . Institutions are buying the fund, not the token.
Then came the genuinely fresh catalyst. On 29 October, MetaMask made Stellar a default network, and Curve Finance launched its StableSwap on Stellar — its first native deployment outside EVM chains. The network itself clocked 14.16 million transactions on 23 October, its busiest day of the month, while Q3 stablecoin volume hit $25.1 billion, up 121% quarter over quarter.
So what would actually close the gap? Watch the levels. $XLM is pinned between support near $0.16 and resistance at $0.18 — it sits below its major daily moving averages, down roughly a fifth over the last month. A reclaim of $0.18 would be the first sign the market is repricing the rails story; a break below $0.16 puts $0.15 in focus. Check the $XLM chart yourself at those two lines — that's where this thesis lives or dies.
And keep the honest risk in view. Only about 0.1% of Stellar's tokenized assets are actually used as DeFi lending collateral, and roughly 83% have no on-chain market to sell into. Franklin's fund took two years just to pass $270 million after its 2021 launch — infrastructure builds slowly, and past Stellar pops, like the MoneyGram deal in 2021, faded. The next real test is the DTCC link planned for the first half of 2027, not tomorrow. Meanwhile $BTC is still digesting the $6.3 billion Binance hack around $77,000, so even a great rails story needs a price trigger.
Here's my take: Stellar is the quiet winner of tokenization's infrastructure race — but until tokenized assets create real demand for XLM itself, the token stays a show-me story. The $0.18 reclaim is the show-me moment. Until then, you're betting on the rails, not the ride.
Is Stellar the quiet winner of tokenization, or does the token never catch the rails?
Not financial advice. DYOR.
That contradiction is the whole story. Stellar now hosts about $4.1 billion in tokenized real-world assets, according to the Stellar Development Foundation's Q3 report — up 36% in a single quarter and 548% year over year. At the start of 2026 that figure was under $900 million. The rails are winning. The token is not.
Let's be precise about what "winning" means. Franklin Templeton — a $1.79 trillion asset manager — launched its BENJI tokenized money market fund on Stellar in April 2021, the first US-registered fund to run on a public chain. Its own case study puts $654 million of BENJI on Stellar. Add Spiko, Realiz and WisdomTree, and you get a chain quietly becoming the institutional fund shelf of crypto.
And the plot thickened last week. On 21–22 October, Franklin added about $150 million of its Singapore fund, sgBENJI, on the XRP Ledger, lifting its XRPL balance to nearly 193 million shares, worth around $200 million. Here's the catch most headlines skipped: all of it went to a single wallet, it pairs with Ripple's RLUSD — not XRP — and it creates no direct buying pressure on $XRP or $XLM . Institutions are buying the fund, not the token.
Then came the genuinely fresh catalyst. On 29 October, MetaMask made Stellar a default network, and Curve Finance launched its StableSwap on Stellar — its first native deployment outside EVM chains. The network itself clocked 14.16 million transactions on 23 October, its busiest day of the month, while Q3 stablecoin volume hit $25.1 billion, up 121% quarter over quarter.
So what would actually close the gap? Watch the levels. $XLM is pinned between support near $0.16 and resistance at $0.18 — it sits below its major daily moving averages, down roughly a fifth over the last month. A reclaim of $0.18 would be the first sign the market is repricing the rails story; a break below $0.16 puts $0.15 in focus. Check the $XLM chart yourself at those two lines — that's where this thesis lives or dies.
And keep the honest risk in view. Only about 0.1% of Stellar's tokenized assets are actually used as DeFi lending collateral, and roughly 83% have no on-chain market to sell into. Franklin's fund took two years just to pass $270 million after its 2021 launch — infrastructure builds slowly, and past Stellar pops, like the MoneyGram deal in 2021, faded. The next real test is the DTCC link planned for the first half of 2027, not tomorrow. Meanwhile $BTC is still digesting the $6.3 billion Binance hack around $77,000, so even a great rails story needs a price trigger.
Here's my take: Stellar is the quiet winner of tokenization's infrastructure race — but until tokenized assets create real demand for XLM itself, the token stays a show-me story. The $0.18 reclaim is the show-me moment. Until then, you're betting on the rails, not the ride.
Is Stellar the quiet winner of tokenization, or does the token never catch the rails?
Not financial advice. DYOR.
13
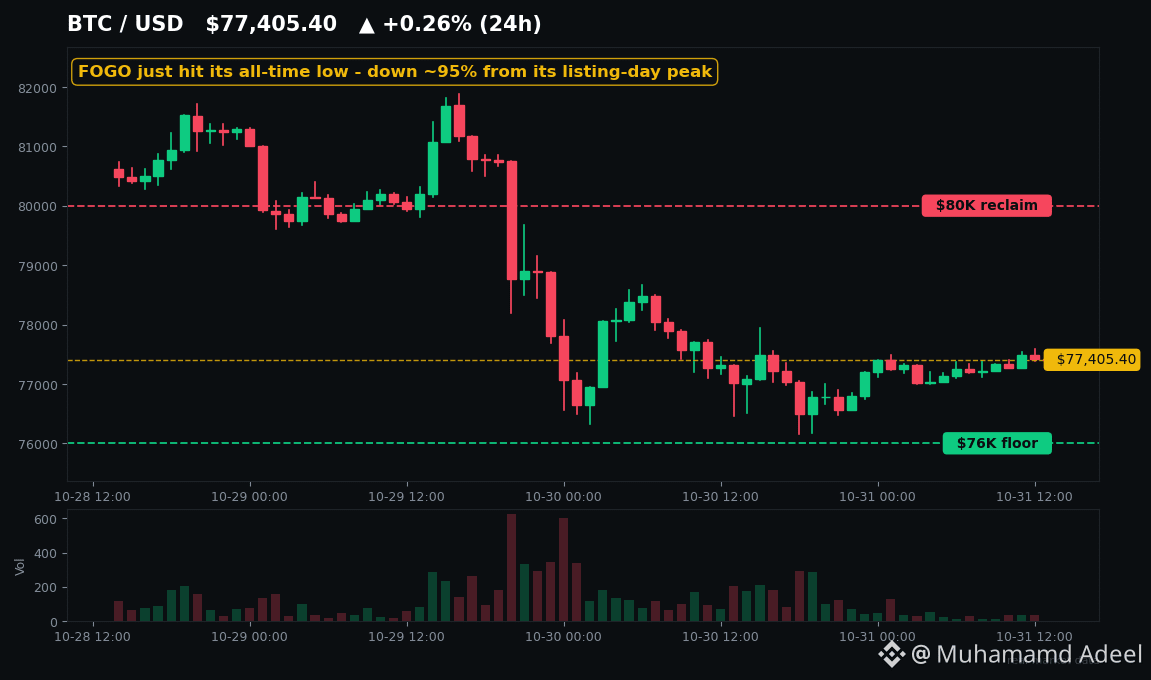
Article
FOGO Hit a Fresh All-Time Low - 95% Below Its Binance Listing PeakBinance listed $FOGO in January. Yesterday, it printed a fresh all-time low.
Down roughly 95% from its listing-day peak — and almost nobody is talking about it anymore.
**What FOGO is**
Fogo is a high-performance Layer 1 on the Solana Virtual Machine, built for on-chain trading, with roughly 40-millisecond blocks. It launched mainnet in January 2026 with a handful of apps, including the Valiant DEX.
**The listing — and why this isn't a "new listing" post**
Honesty first: no fresh Binance spot listing exists this week. The big one, PREDICT, was postponed on listing day. So here's the listing desk's real chart instead: a token that did list, and has bled ever since.
$FOGO opened on Binance spot on January 15, 2026, with a Seed Tag and USDT, USDC and TRY pairs. A pre-TGE sale had moved 200 million tokens at $0.035, raising about $7 million. On listing day it touched roughly $0.0625. It has never been back.
**The slide to a fresh low**
The numbers are brutal, and verified. $FOGO is down about 31% in the last week and about 49% in the last month. On October 30 it hit a new all-time low near $0.00259. Today it trades near $0.00275, only a few percent above that low, with a market cap around $15 million. Pull up the $FOGO chart and you'll see the shape: a listing-day spike, then months of lower highs. Only 10 of the last 30 days were green, and RSI sits deep in oversold.
**What to watch from here**
The line that matters is the all-time low zone near $0.00259. A reclaim of roughly $0.00297 would be the first sign of a pause; about $0.00323 is next. A break below the low means fresh territory with no historical floor underneath.
The next unlock lands November 26 — about 164 million $FOGO, roughly $470,000 at today's price, part of a monthly drip that runs for years. And the wider market sets the mood: $BTC is steadying near $77K, while $SOL is the SVM benchmark Fogo is measured against.
**The honest risks**
In late August, the Foundation said an unknown actor took 400 million FOGO (~4% of genesis supply) from a Foundation wallet; validators halted the chain, and it restarted days later. Critics called it a governance discount: a chain that can be stopped by its own validators is a different bet than a purely decentralised one.
Then there's adoption. DeFiLlama shows TVL of just $326,358 and 24-hour DEX volume of about $8,099, almost all on one venue. Add insider-heavy tokenomics — roughly two-thirds of supply to core contributors and the Foundation — and the picture is complete.
History agrees: HYPE faded after its spot debut, AXIS dropped 40% in a day in week two, MarsCoin gave back ~75% in eight weeks. Listings create moments, not floors.
So this isn't a "buy the ATL" story. It's what happens when listing hype fades, the chain stays quiet, and unlocks keep coming.
Not financial advice. DYOR.
FOGO Hit a Fresh All-Time Low - 95% Below Its Binance Listing Peak
Binance listed $FOGO in January. Yesterday, it printed a fresh all-time low.
Down roughly 95% from its listing-day peak — and almost nobody is talking about it anymore.
**What FOGO is**
Fogo is a high-performance Layer 1 on the Solana Virtual Machine, built for on-chain trading, with roughly 40-millisecond blocks. It launched mainnet in January 2026 with a handful of apps, including the Valiant DEX.
**The listing — and why this isn't a "new listing" post**
Honesty first: no fresh Binance spot listing exists this week. The big one, PREDICT, was postponed on listing day. So here's the listing desk's real chart instead: a token that did list, and has bled ever since.
$FOGO opened on Binance spot on January 15, 2026, with a Seed Tag and USDT, USDC and TRY pairs. A pre-TGE sale had moved 200 million tokens at $0.035, raising about $7 million. On listing day it touched roughly $0.0625. It has never been back.
**The slide to a fresh low**
The numbers are brutal, and verified. $FOGO is down about 31% in the last week and about 49% in the last month. On October 30 it hit a new all-time low near $0.00259. Today it trades near $0.00275, only a few percent above that low, with a market cap around $15 million. Pull up the $FOGO chart and you'll see the shape: a listing-day spike, then months of lower highs. Only 10 of the last 30 days were green, and RSI sits deep in oversold.
**What to watch from here**
The line that matters is the all-time low zone near $0.00259. A reclaim of roughly $0.00297 would be the first sign of a pause; about $0.00323 is next. A break below the low means fresh territory with no historical floor underneath.
The next unlock lands November 26 — about 164 million $FOGO , roughly $470,000 at today's price, part of a monthly drip that runs for years. And the wider market sets the mood: $BTC is steadying near $77K, while $SOL is the SVM benchmark Fogo is measured against.
**The honest risks**
In late August, the Foundation said an unknown actor took 400 million FOGO (~4% of genesis supply) from a Foundation wallet; validators halted the chain, and it restarted days later. Critics called it a governance discount: a chain that can be stopped by its own validators is a different bet than a purely decentralised one.
Then there's adoption. DeFiLlama shows TVL of just $326,358 and 24-hour DEX volume of about $8,099, almost all on one venue. Add insider-heavy tokenomics — roughly two-thirds of supply to core contributors and the Foundation — and the picture is complete.
History agrees: HYPE faded after its spot debut, AXIS dropped 40% in a day in week two, MarsCoin gave back ~75% in eight weeks. Listings create moments, not floors.
So this isn't a "buy the ATL" story. It's what happens when listing hype fades, the chain stays quiet, and unlocks keep coming.
Not financial advice. DYOR.
Down roughly 95% from its listing-day peak — and almost nobody is talking about it anymore.
**What FOGO is**
Fogo is a high-performance Layer 1 on the Solana Virtual Machine, built for on-chain trading, with roughly 40-millisecond blocks. It launched mainnet in January 2026 with a handful of apps, including the Valiant DEX.
**The listing — and why this isn't a "new listing" post**
Honesty first: no fresh Binance spot listing exists this week. The big one, PREDICT, was postponed on listing day. So here's the listing desk's real chart instead: a token that did list, and has bled ever since.
$FOGO opened on Binance spot on January 15, 2026, with a Seed Tag and USDT, USDC and TRY pairs. A pre-TGE sale had moved 200 million tokens at $0.035, raising about $7 million. On listing day it touched roughly $0.0625. It has never been back.
**The slide to a fresh low**
The numbers are brutal, and verified. $FOGO is down about 31% in the last week and about 49% in the last month. On October 30 it hit a new all-time low near $0.00259. Today it trades near $0.00275, only a few percent above that low, with a market cap around $15 million. Pull up the $FOGO chart and you'll see the shape: a listing-day spike, then months of lower highs. Only 10 of the last 30 days were green, and RSI sits deep in oversold.
**What to watch from here**
The line that matters is the all-time low zone near $0.00259. A reclaim of roughly $0.00297 would be the first sign of a pause; about $0.00323 is next. A break below the low means fresh territory with no historical floor underneath.
The next unlock lands November 26 — about 164 million $FOGO , roughly $470,000 at today's price, part of a monthly drip that runs for years. And the wider market sets the mood: $BTC is steadying near $77K, while $SOL is the SVM benchmark Fogo is measured against.
**The honest risks**
In late August, the Foundation said an unknown actor took 400 million FOGO (~4% of genesis supply) from a Foundation wallet; validators halted the chain, and it restarted days later. Critics called it a governance discount: a chain that can be stopped by its own validators is a different bet than a purely decentralised one.
Then there's adoption. DeFiLlama shows TVL of just $326,358 and 24-hour DEX volume of about $8,099, almost all on one venue. Add insider-heavy tokenomics — roughly two-thirds of supply to core contributors and the Foundation — and the picture is complete.
History agrees: HYPE faded after its spot debut, AXIS dropped 40% in a day in week two, MarsCoin gave back ~75% in eight weeks. Listings create moments, not floors.
So this isn't a "buy the ATL" story. It's what happens when listing hype fades, the chain stays quiet, and unlocks keep coming.
Not financial advice. DYOR.
14
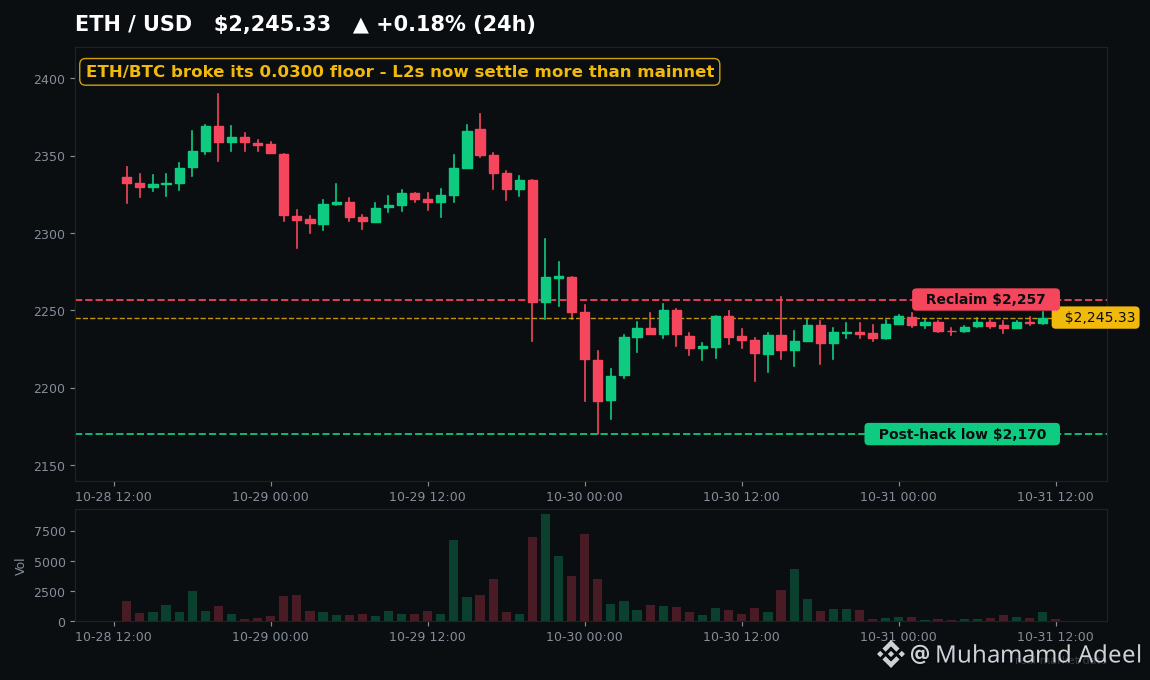
Article
ETH/BTC Broke Its August Floor — L2s Are Doing the Heavy LiftingEveryone keeps asking when ETH finally catches up to Bitcoin.
Here's the uncomfortable answer: right now, it's not even trying — and the network underneath it is doing all the work anyway.
$ETH is trading around $2,244, and the number that actually matters isn't the dollar price. It's the ratio. One ETH now buys roughly 0.029 $BTC — below the 0.0300 floor that held all the way since August. The last time the ratio broke a floor like this, in mid-October, it slid straight to its weakest close since August 11. This isn't a one-day wobble. It's a slow bleed, and it's been going on for weeks while ETF money walked out the door.
But here's the twist nobody's talking about: Ethereum the network is busier than ever. It's just not happening where you'd expect.
Between mid-July and mid-October, Ethereum and its layer-2s settled $16.75 trillion in stablecoin transfers — 77% of all stablecoin volume across every chain. And Base alone moved $8.5 trillion of it, more than Ethereum mainnet's $7.1 trillion. Read that again. The layer-2 now settles more value than the chain it sits on.
The same pattern showed up in October's activity spike. On October 21, Arbitrum ($ARB) logged 571,767 daily active addresses — a 30-day high — while Base jumped 82.5% in a single day to 629,142. The users are there. The transactions are there. The fees, though? Those mostly stay on the L2s. A trillion dollars moving on Base generates fees on Base first, not on mainnet. That's the real tension in this trade.
So what does this actually mean for the market? Two scenarios, and the ratio decides which one you get.
If $ETH reclaims $2,257 and then $2,355, the ratio gets a real shot at climbing back above 0.0300 — and that's the first sign the bleed is over. But if $2,204 gives way and the post-hack low near $2,170 breaks, the next stop on the ratio chart is the June low of 0.0258, and the "ETH is dead money" crowd gets louder.
History says don't write the obituary too early. The ratio hit 0.018 in April 2025 — its lowest in over five years — and bounced to 0.042 by August. Ratios this stretched have a habit of snapping back hard. But history also says the snapback takes months, not days, and it needs a catalyst.
So watch the ratio, not just the price. Check $ETH against $BTC this week: a reclaim of 0.0300 is the first real "something changed" signal. Until then, the honest read is this — Ethereum's ecosystem is winning while its token is losing, and that gap is the whole trade.
Not financial advice. DYOR.
ETH/BTC Broke Its August Floor — L2s Are Doing the Heavy Lifting
Everyone keeps asking when ETH finally catches up to Bitcoin.
Here's the uncomfortable answer: right now, it's not even trying — and the network underneath it is doing all the work anyway.
$ETH is trading around $2,244, and the number that actually matters isn't the dollar price. It's the ratio. One ETH now buys roughly 0.029 $BTC — below the 0.0300 floor that held all the way since August. The last time the ratio broke a floor like this, in mid-October, it slid straight to its weakest close since August 11. This isn't a one-day wobble. It's a slow bleed, and it's been going on for weeks while ETF money walked out the door.
But here's the twist nobody's talking about: Ethereum the network is busier than ever. It's just not happening where you'd expect.
Between mid-July and mid-October, Ethereum and its layer-2s settled $16.75 trillion in stablecoin transfers — 77% of all stablecoin volume across every chain. And Base alone moved $8.5 trillion of it, more than Ethereum mainnet's $7.1 trillion. Read that again. The layer-2 now settles more value than the chain it sits on.
The same pattern showed up in October's activity spike. On October 21, Arbitrum ($ARB ) logged 571,767 daily active addresses — a 30-day high — while Base jumped 82.5% in a single day to 629,142. The users are there. The transactions are there. The fees, though? Those mostly stay on the L2s. A trillion dollars moving on Base generates fees on Base first, not on mainnet. That's the real tension in this trade.
So what does this actually mean for the market? Two scenarios, and the ratio decides which one you get.
If $ETH reclaims $2,257 and then $2,355, the ratio gets a real shot at climbing back above 0.0300 — and that's the first sign the bleed is over. But if $2,204 gives way and the post-hack low near $2,170 breaks, the next stop on the ratio chart is the June low of 0.0258, and the "ETH is dead money" crowd gets louder.
History says don't write the obituary too early. The ratio hit 0.018 in April 2025 — its lowest in over five years — and bounced to 0.042 by August. Ratios this stretched have a habit of snapping back hard. But history also says the snapback takes months, not days, and it needs a catalyst.
So watch the ratio, not just the price. Check $ETH against $BTC this week: a reclaim of 0.0300 is the first real "something changed" signal. Until then, the honest read is this — Ethereum's ecosystem is winning while its token is losing, and that gap is the whole trade.
Not financial advice. DYOR.
Here's the uncomfortable answer: right now, it's not even trying — and the network underneath it is doing all the work anyway.
$ETH is trading around $2,244, and the number that actually matters isn't the dollar price. It's the ratio. One ETH now buys roughly 0.029 $BTC — below the 0.0300 floor that held all the way since August. The last time the ratio broke a floor like this, in mid-October, it slid straight to its weakest close since August 11. This isn't a one-day wobble. It's a slow bleed, and it's been going on for weeks while ETF money walked out the door.
But here's the twist nobody's talking about: Ethereum the network is busier than ever. It's just not happening where you'd expect.
Between mid-July and mid-October, Ethereum and its layer-2s settled $16.75 trillion in stablecoin transfers — 77% of all stablecoin volume across every chain. And Base alone moved $8.5 trillion of it, more than Ethereum mainnet's $7.1 trillion. Read that again. The layer-2 now settles more value than the chain it sits on.
The same pattern showed up in October's activity spike. On October 21, Arbitrum ($ARB ) logged 571,767 daily active addresses — a 30-day high — while Base jumped 82.5% in a single day to 629,142. The users are there. The transactions are there. The fees, though? Those mostly stay on the L2s. A trillion dollars moving on Base generates fees on Base first, not on mainnet. That's the real tension in this trade.
So what does this actually mean for the market? Two scenarios, and the ratio decides which one you get.
If $ETH reclaims $2,257 and then $2,355, the ratio gets a real shot at climbing back above 0.0300 — and that's the first sign the bleed is over. But if $2,204 gives way and the post-hack low near $2,170 breaks, the next stop on the ratio chart is the June low of 0.0258, and the "ETH is dead money" crowd gets louder.
History says don't write the obituary too early. The ratio hit 0.018 in April 2025 — its lowest in over five years — and bounced to 0.042 by August. Ratios this stretched have a habit of snapping back hard. But history also says the snapback takes months, not days, and it needs a catalyst.
So watch the ratio, not just the price. Check $ETH against $BTC this week: a reclaim of 0.0300 is the first real "something changed" signal. Until then, the honest read is this — Ethereum's ecosystem is winning while its token is losing, and that gap is the whole trade.
Not financial advice. DYOR.
5
Log in to explore more content
Join global crypto users on Binance Square
⚡️ Get latest and useful information about crypto.
💬 Trusted by the world’s largest crypto exchange.
👍 Discover real insights from verified creators.
Email / Phone number
Trending Topics
WithdrawalsBack: 15 networks live
1,952 views
63 Discussing
Binance News Update | Binance Reopens Withdrawals for BTC, ETH, USDT and More Across 15 Networks, Meeting Its Sunday Target
Binance News
·33 Likes
·12.9k views
BinanceUpdatesProofofReservesAddresses
52,992 views
983 Discussing
BinanceToResumePhaseOneOfWithdrawals
87,954 views
1,206 Discussing