
Trading Different
2k Posts

Trading Different
Enhance your investments and trading strategy with our indicators.
Optimize your entry points.
Extend your take profits.
Minimize your stop loss.
117 Following
3.3K+ Followers
2.7K Liked
Posts
All
Quotes
Videos
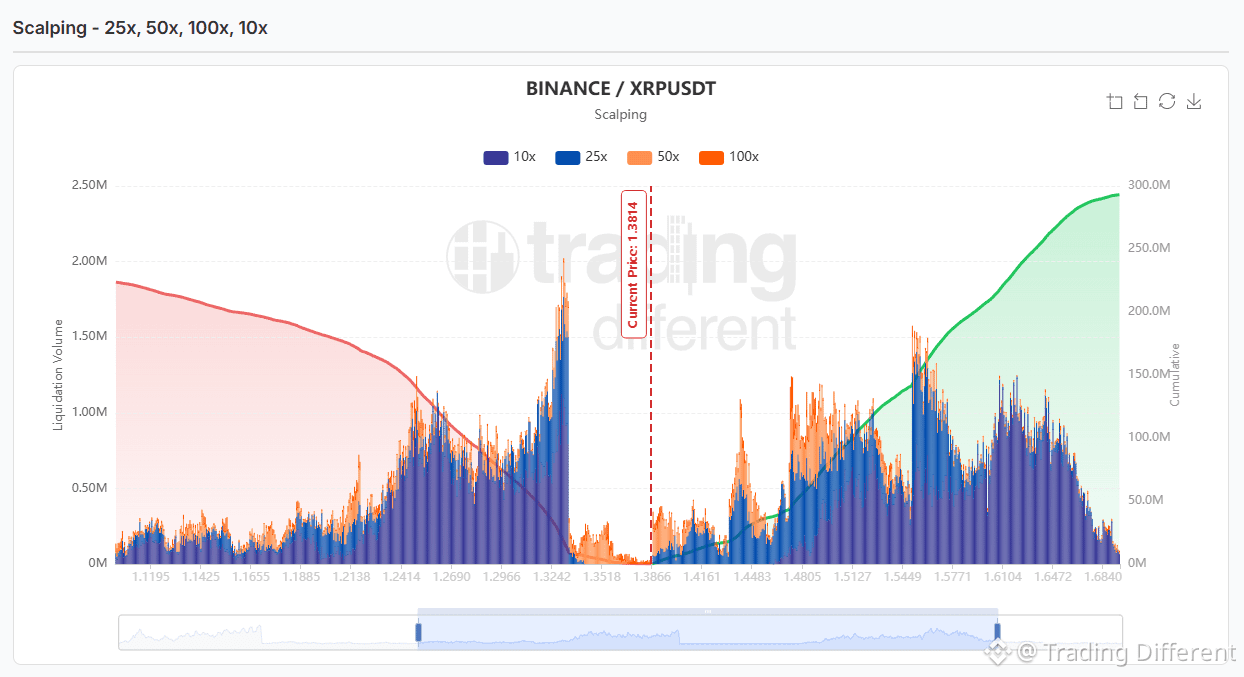
#xrp shows a major imbalance in liquidations upward. 👀
With XRP around $1.3814, the Scalping Simple Map shows concentrations of leveraged traders on both sides, but the most significant cumulative amount is currently above the price.
🔥 The exposure of shorters starts to grow at approximately $1.44–$1.48 and becomes much more relevant between $1.50 and $1.65, with leveraged positions at 10X, 25X, 50X, and 100X.
The upper cumulative total is nearing 300M, while below the price the potential long liquidations reach a bit over 200M.
The most heavily loaded lower area appears around $1.24–$1.33, with a particularly strong peak near $1.32.
⚠️ The map does not determine direction. But if #XRP regains ground and moves back above $1.45–$1.50, it would start traversing a substantial structure of exposed shorters.
Right now, the largest accumulated concentration is at the top.
🔗 tradingdifferent.com/es/dashboard/liquidation-heatmap?code=binance-square
With XRP around $1.3814, the Scalping Simple Map shows concentrations of leveraged traders on both sides, but the most significant cumulative amount is currently above the price.
🔥 The exposure of shorters starts to grow at approximately $1.44–$1.48 and becomes much more relevant between $1.50 and $1.65, with leveraged positions at 10X, 25X, 50X, and 100X.
The upper cumulative total is nearing 300M, while below the price the potential long liquidations reach a bit over 200M.
The most heavily loaded lower area appears around $1.24–$1.33, with a particularly strong peak near $1.32.
⚠️ The map does not determine direction. But if #XRP regains ground and moves back above $1.45–$1.50, it would start traversing a substantial structure of exposed shorters.
Right now, the largest accumulated concentration is at the top.
🔗 tradingdifferent.com/es/dashboard/liquidation-heatmap?code=binance-square
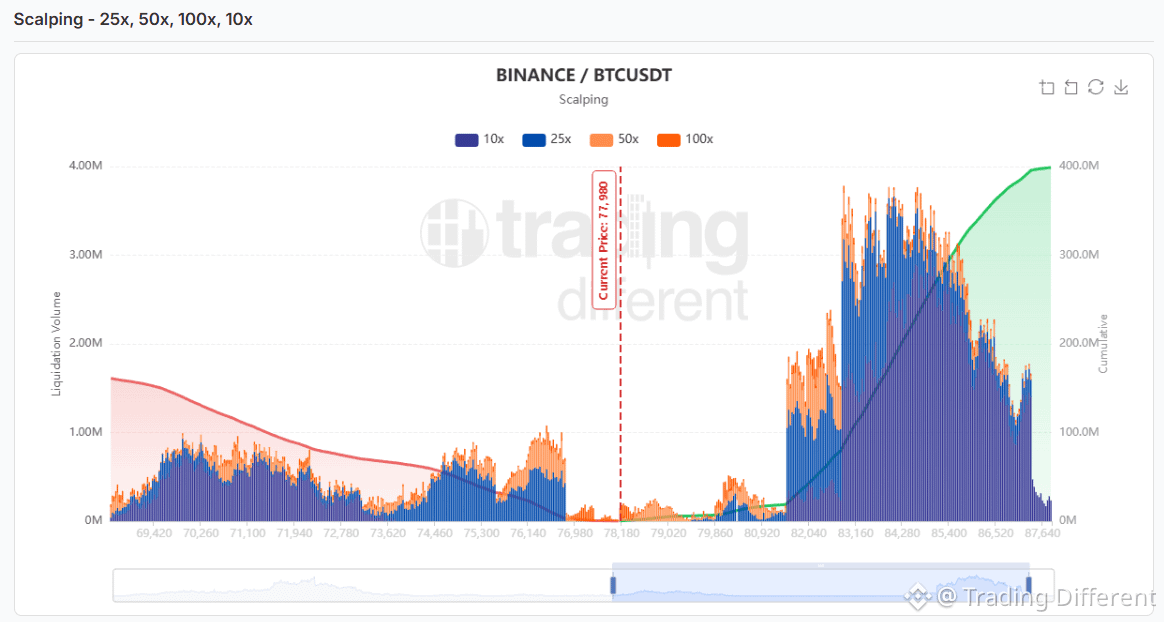
#BTC shows an extreme imbalance of liquidations upward. 👀
With Bitcoin around 77,980 USD, Scalping’s Simple Map leaves a very clear picture: the highest concentration of leveraged traders is currently above the price.
🔥 From 81,000–82,000 USD onward, the shorters’ liquidation volume in 10X, 25X, 50X, and 100X starts to grow strongly.
The most heavily loaded core appears approximately between 83,000 and 85,500 USD, with individual peaks near 4M and a higher cumulative amount that approaches 400M toward the edge of the map.
Below #BTC there are also long liquidations, mainly between 69,000 and 77,000 USD, but the visible cumulative total is considerably smaller.
⚠️ The map doesn’t say that Bitcoin necessarily will go up. What it does show is that if price manages to break above 80K–82K, it would enter an enormous concentration of shorters, where a sequence of liquidations could accelerate the move.
Right now, the biggest fuel is up top.
🔗 tradingdifferent.com/es/dashboard/liquidation-heatmap?code=binance-square
With Bitcoin around 77,980 USD, Scalping’s Simple Map leaves a very clear picture: the highest concentration of leveraged traders is currently above the price.
🔥 From 81,000–82,000 USD onward, the shorters’ liquidation volume in 10X, 25X, 50X, and 100X starts to grow strongly.
The most heavily loaded core appears approximately between 83,000 and 85,500 USD, with individual peaks near 4M and a higher cumulative amount that approaches 400M toward the edge of the map.
Below #BTC there are also long liquidations, mainly between 69,000 and 77,000 USD, but the visible cumulative total is considerably smaller.
⚠️ The map doesn’t say that Bitcoin necessarily will go up. What it does show is that if price manages to break above 80K–82K, it would enter an enormous concentration of shorters, where a sequence of liquidations could accelerate the move.
Right now, the biggest fuel is up top.
🔗 tradingdifferent.com/es/dashboard/liquidation-heatmap?code=binance-square
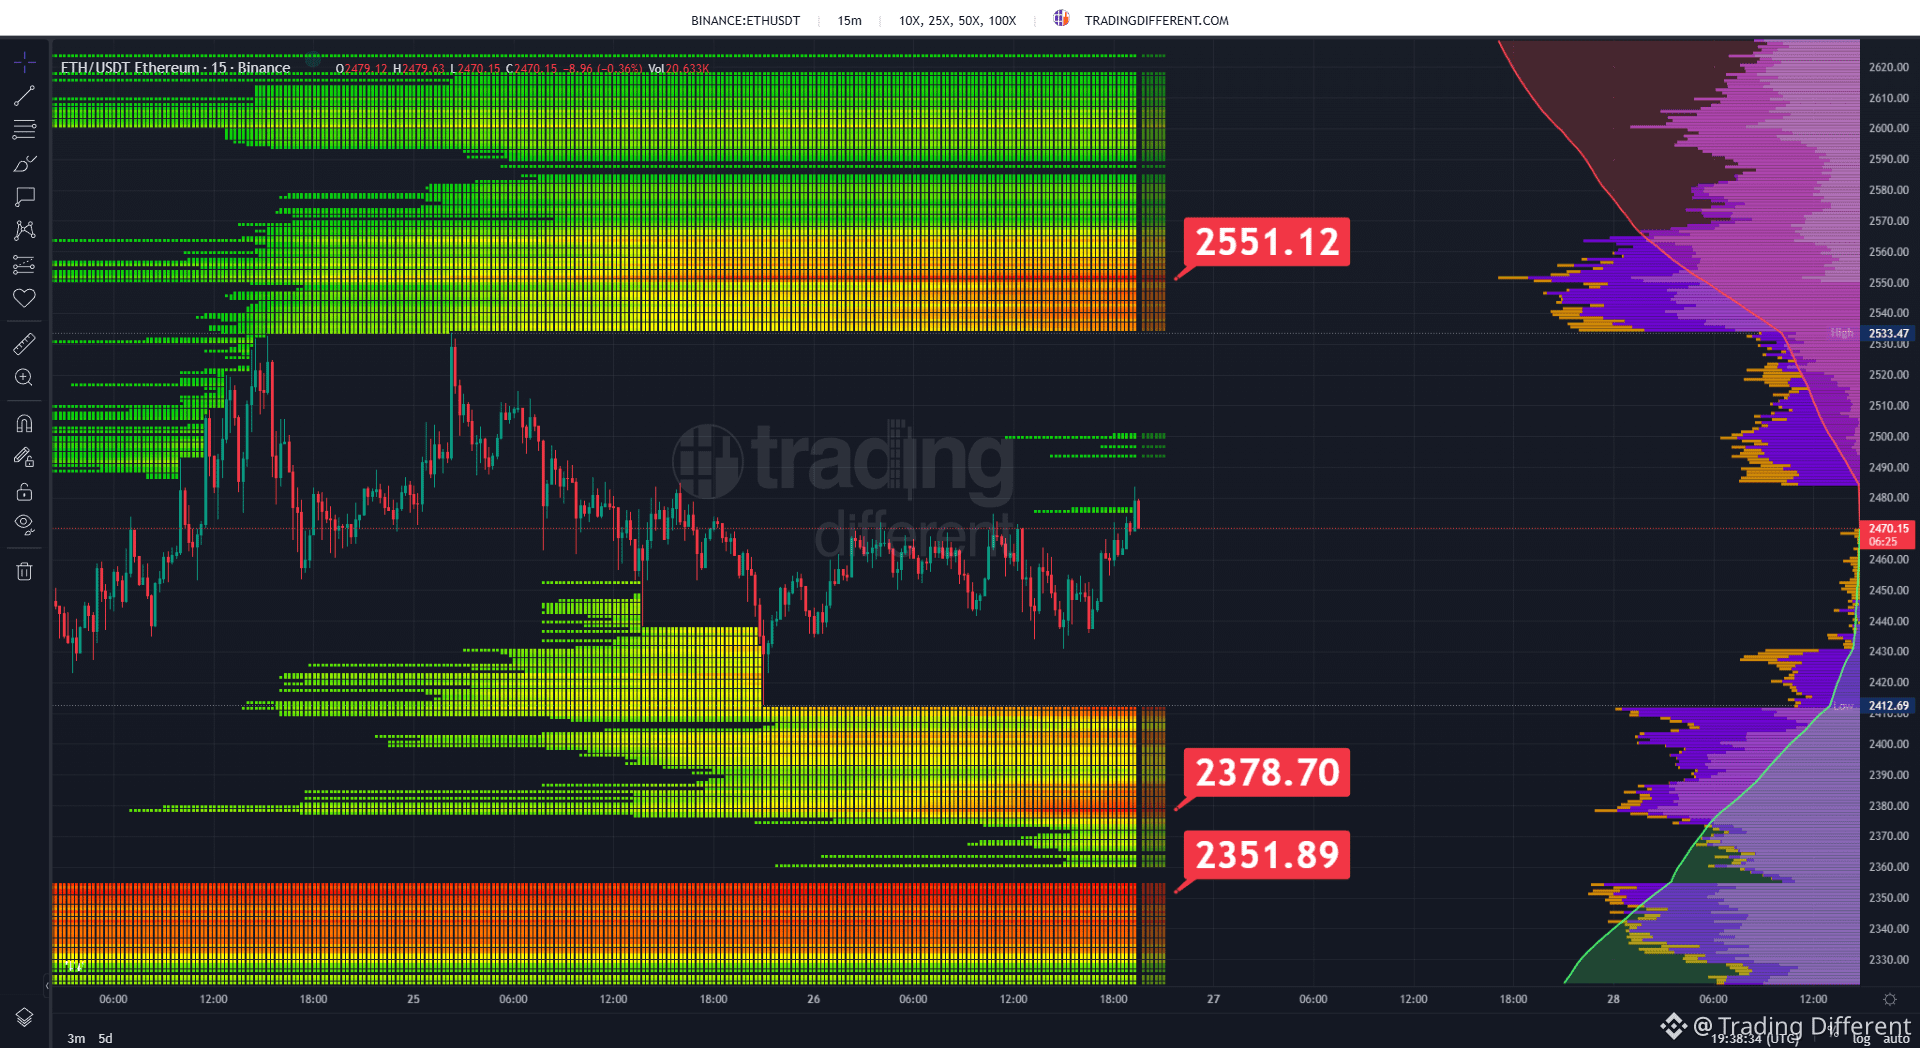
#ETH returns to stand in front of an important zone of short liquidations. 🔥
Ethereum trades near $2,100 after a strong rebound, and the Heatmap shows that the price is again very close to relevant concentration areas of leveraged traders at 10X, 25X, 50X, and 100X.
The immediate upper zone is the one that deserves attention: if #ETH continues advancing, it could begin to sweep through new layers of short liquidations and generate acceleration as those positions are forced to close.
Below, long liquidation pools remain in place too, so the map maintains exposure in both directions. However, after the latest push, the immediate battle is again on the side of the shorters positioned above the price.
⚠️ The key point now is to watch whether ETH manages to break through and hold within that upper block. If it does, liquidations could once again become fuel for the move.
The Heatmap does not show buy or sell orders: it shows where leveraged traders would be liquidated if the price reaches those levels.
🔗 tradingdifferent.com/es/dashboard/liquidation-heatmap?code=binance-square
Ethereum trades near $2,100 after a strong rebound, and the Heatmap shows that the price is again very close to relevant concentration areas of leveraged traders at 10X, 25X, 50X, and 100X.
The immediate upper zone is the one that deserves attention: if #ETH continues advancing, it could begin to sweep through new layers of short liquidations and generate acceleration as those positions are forced to close.
Below, long liquidation pools remain in place too, so the map maintains exposure in both directions. However, after the latest push, the immediate battle is again on the side of the shorters positioned above the price.
⚠️ The key point now is to watch whether ETH manages to break through and hold within that upper block. If it does, liquidations could once again become fuel for the move.
The Heatmap does not show buy or sell orders: it shows where leveraged traders would be liquidated if the price reaches those levels.
🔗 tradingdifferent.com/es/dashboard/liquidation-heatmap?code=binance-square
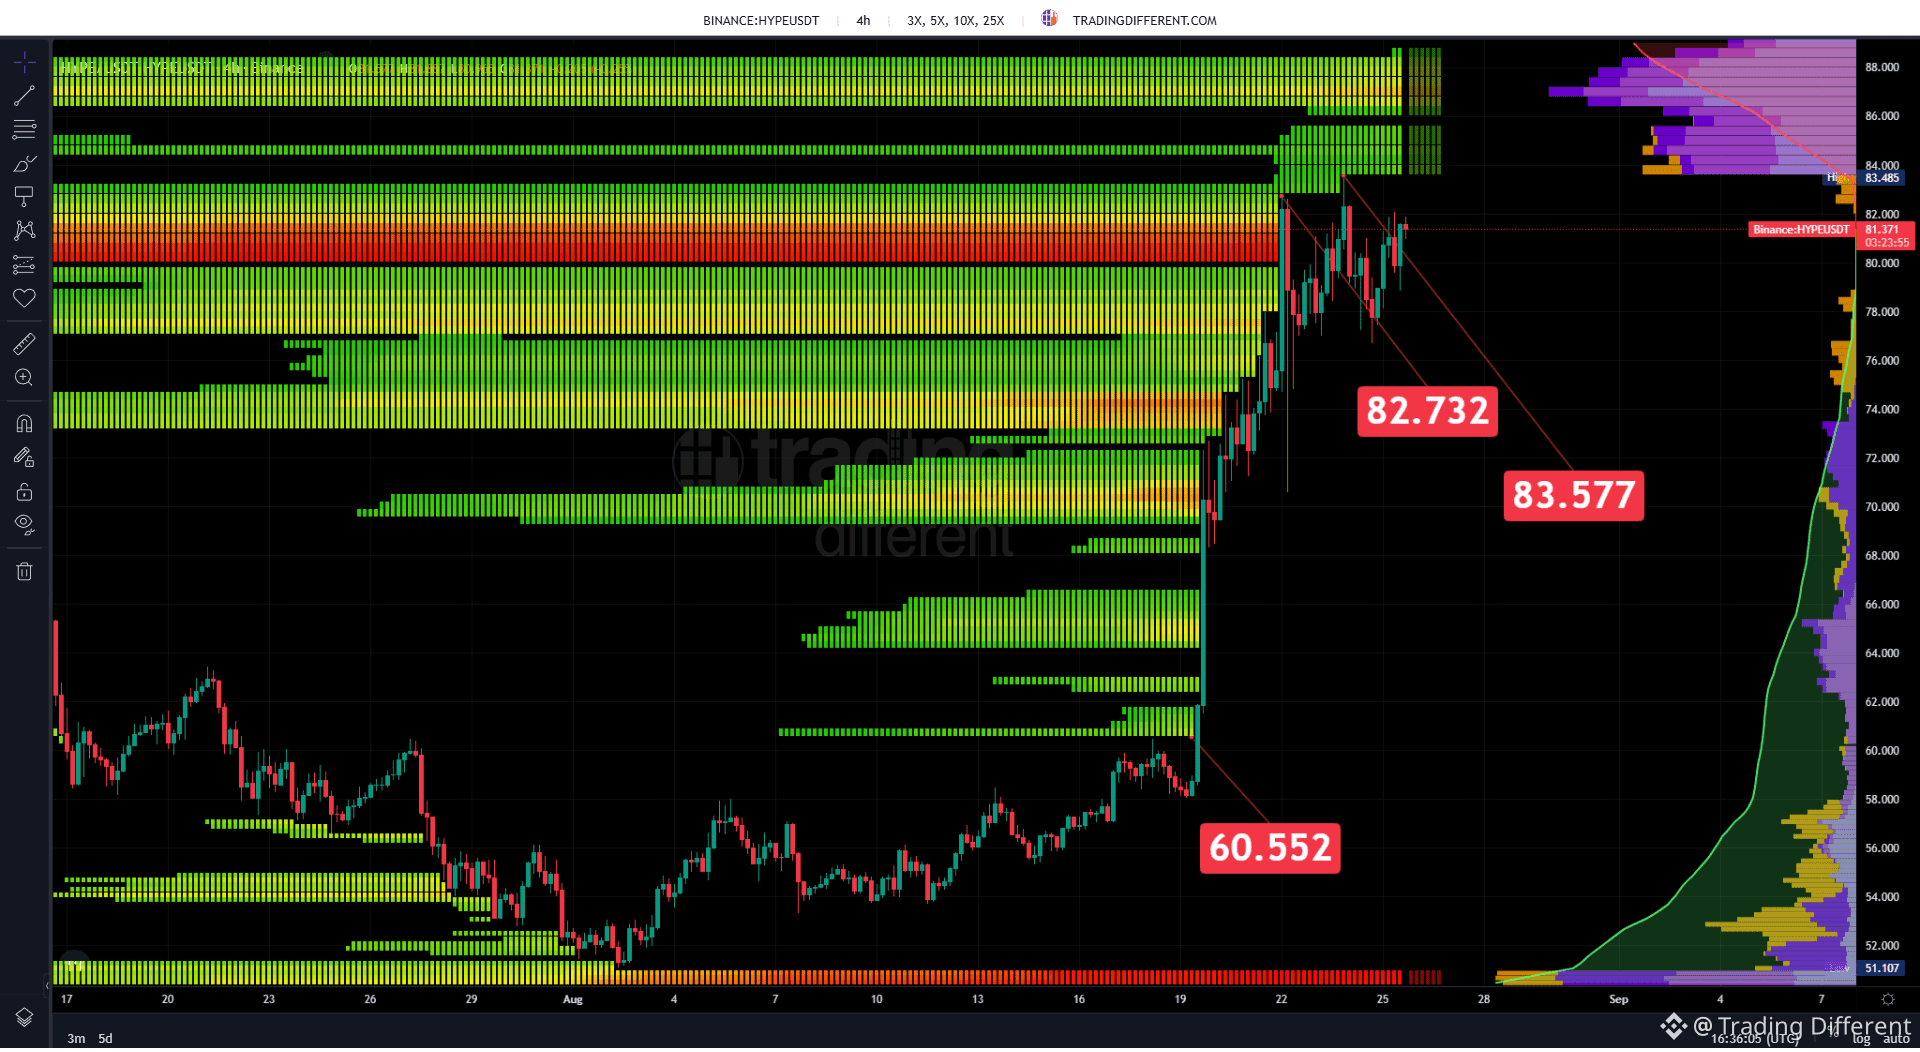
#hype comes from a real wave of short liquidations. 🔥
The price moved from approximately $60.55 to over $82 in just a few days, crossing major clusters of liquidations from leveraged traders one after another.
The 4-hour Heatmap shows how the move consumed complete blocks of shorters at 3X, 5X, 10X, and 25X, especially between $70 and $82.
Now HYPE is trading near $81.37, and the immediate references are at $82.73 and $83.58. Above that, there are still relevant concentrations extending toward $86–$88.
The read is interesting: after such an expansion, the price is consolidating just below new short liquidation zones. If it regains momentum and breaks above $83.5, it would move back into territory loaded with leverage.
⚠️ The rally has already done a lot of damage to shorters, but the map shows there are still vulnerable positions above.
The Heatmap does not show buy or sell orders; it shows where leveraged traders would be forced to close their positions if the price reaches those levels.
🔗 tradingdifferent.com/es/dashboard/liquidation-heatmap?code=binance-square
The price moved from approximately $60.55 to over $82 in just a few days, crossing major clusters of liquidations from leveraged traders one after another.
The 4-hour Heatmap shows how the move consumed complete blocks of shorters at 3X, 5X, 10X, and 25X, especially between $70 and $82.
Now HYPE is trading near $81.37, and the immediate references are at $82.73 and $83.58. Above that, there are still relevant concentrations extending toward $86–$88.
The read is interesting: after such an expansion, the price is consolidating just below new short liquidation zones. If it regains momentum and breaks above $83.5, it would move back into territory loaded with leverage.
⚠️ The rally has already done a lot of damage to shorters, but the map shows there are still vulnerable positions above.
The Heatmap does not show buy or sell orders; it shows where leveraged traders would be forced to close their positions if the price reaches those levels.
🔗 tradingdifferent.com/es/dashboard/liquidation-heatmap?code=binance-square
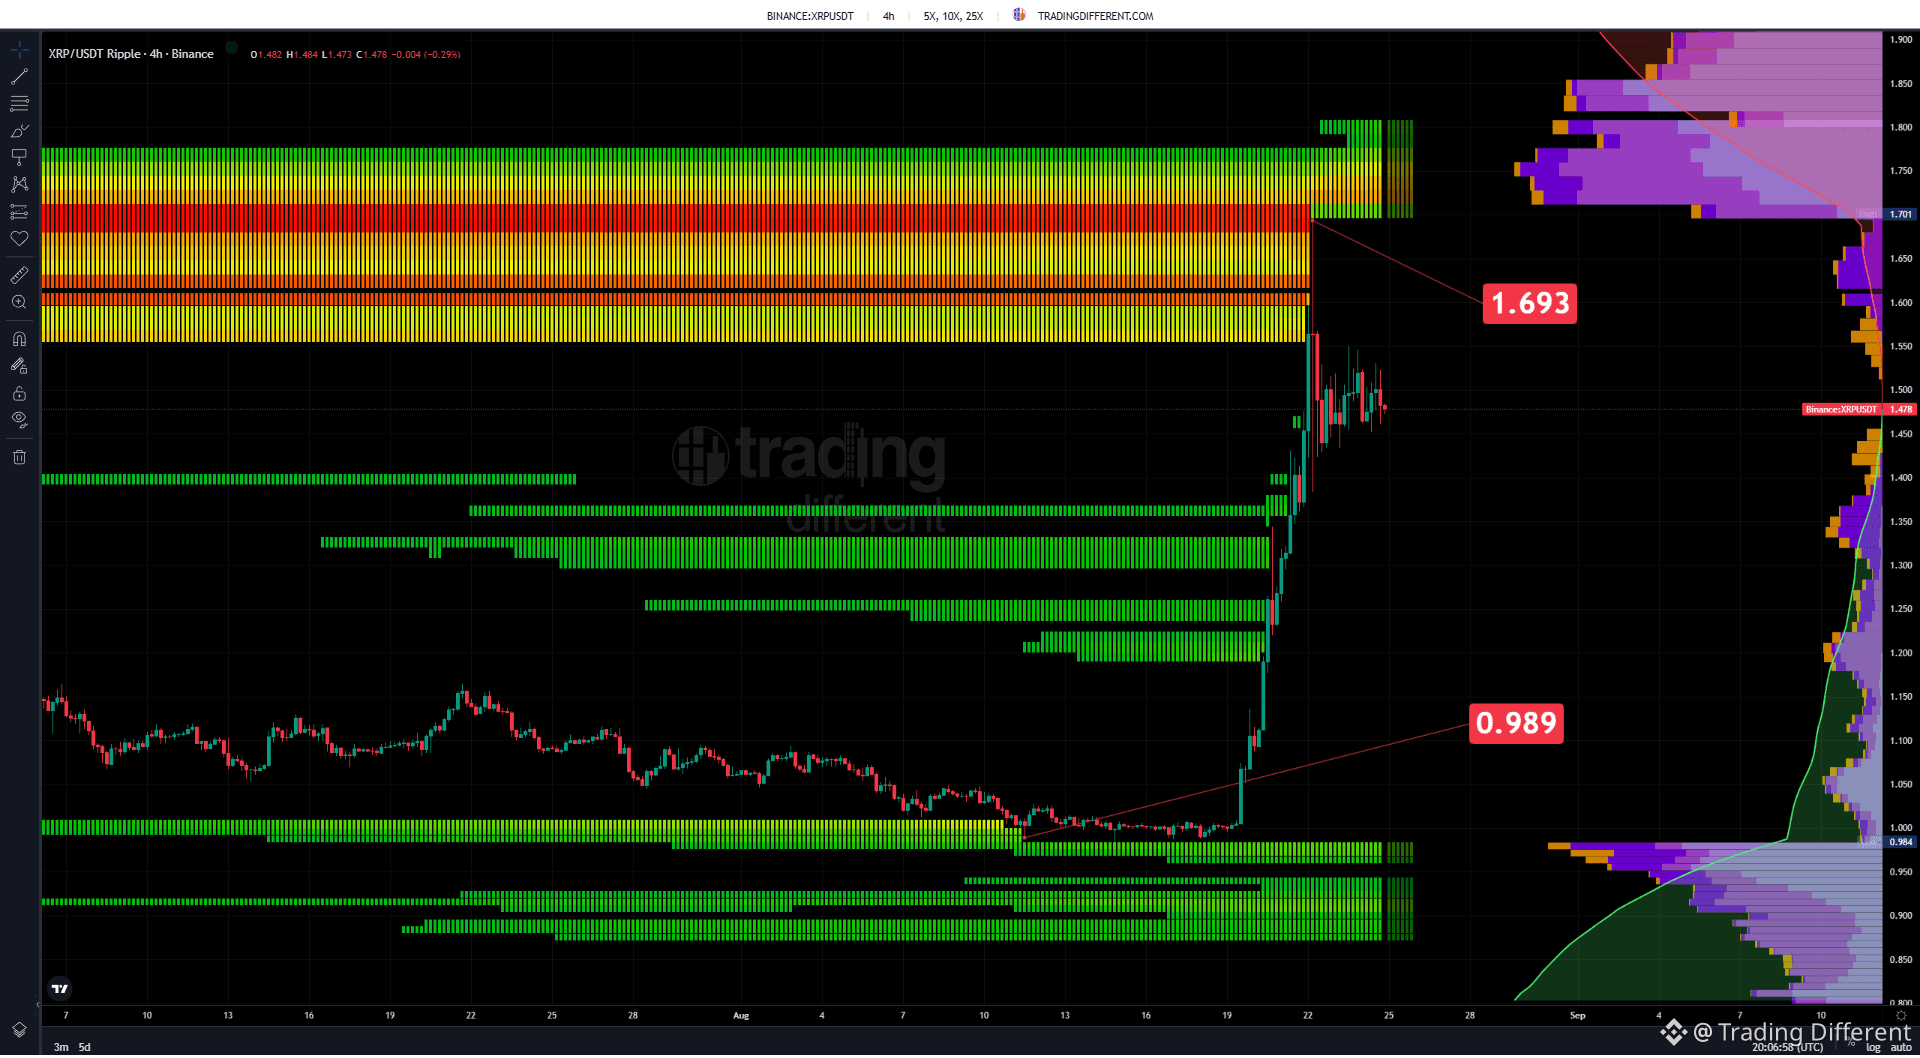
#xrp comes from an extraordinary move: from 0.989 USD up to the 1.50 USD area, with a massive cleanout of shorters during the run. 🔥
The 4-hour Heatmap lets you see the magnitude of the displacement. XRP moved through the zones where leveraged traders were exposed and is now consolidating around 1.478 USD.
But the map leaves something important ahead: between approximately 1.58 and 1.75 USD there is a huge concentration of short liquidations at 5X, 10X, and 25X. Within that block, 1.693 USD stands out as a reference.
That is, despite everything XRP has already risen, there is still a considerable number of shorters exposed above the current price.
Below, the picture is very different. The old reference at 0.989 USD is extremely far away after this expansion, while several intermediate zones were traversed during the rally.
⚠️ If XRP manages to resume the bullish momentum, 1.60–1.70 USD will be a particularly interesting area: that’s where one of the biggest remaining short liquidation pools visible on this Heatmap begins.
The Heatmap does not show buy or sell orders; it shows where leveraged traders would be forced to close if the price reaches those levels.
🔗 tradingdifferent.com/es/dashboard/liquidation-heatmap?code=binance-square
The 4-hour Heatmap lets you see the magnitude of the displacement. XRP moved through the zones where leveraged traders were exposed and is now consolidating around 1.478 USD.
But the map leaves something important ahead: between approximately 1.58 and 1.75 USD there is a huge concentration of short liquidations at 5X, 10X, and 25X. Within that block, 1.693 USD stands out as a reference.
That is, despite everything XRP has already risen, there is still a considerable number of shorters exposed above the current price.
Below, the picture is very different. The old reference at 0.989 USD is extremely far away after this expansion, while several intermediate zones were traversed during the rally.
⚠️ If XRP manages to resume the bullish momentum, 1.60–1.70 USD will be a particularly interesting area: that’s where one of the biggest remaining short liquidation pools visible on this Heatmap begins.
The Heatmap does not show buy or sell orders; it shows where leveraged traders would be forced to close if the price reaches those levels.
🔗 tradingdifferent.com/es/dashboard/liquidation-heatmap?code=binance-square
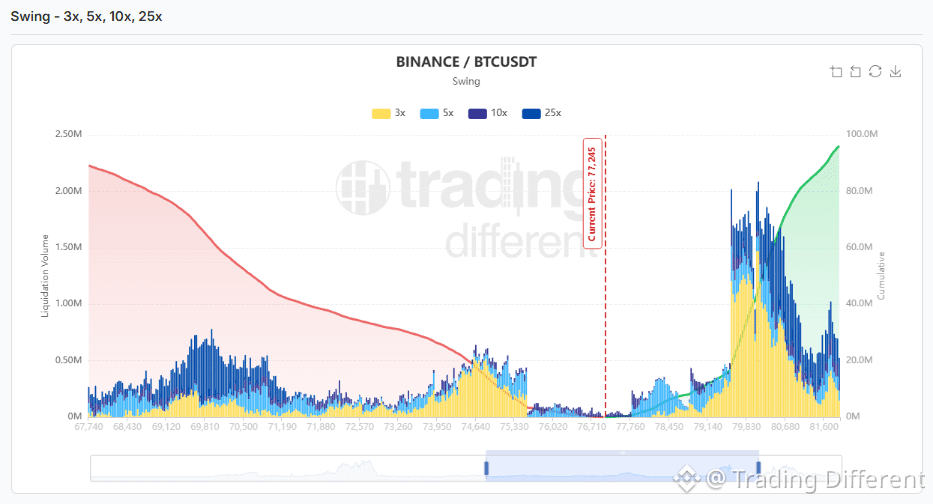
#BTC shows a very strong imbalance of liquidations in the Swing Map. 👀
With Bitcoin around 77,245 USD, the highest concentration of leveraged traders appears clearly above the current price.
Between approximately 79,400 and 80,700 USD, the most important liquidation block for shorters in 3X, 5X, 10X, and 25X is concentrated, with individual peaks well exceeding 2M in liquidation volume.
Below that, long liquidations are distributed mainly between 67,700 and 75,500 USD, but their accumulated concentration is considerably smaller.
The standout takeaway is the total: the map shows nearly 100M in potential liquidations upward versus a much lower concentration downward.
🔥 If #BTC starts accelerating again above 79K, it would move directly into the zone where the Swing Map’s biggest pool of shorters’ fuel is located.
This doesn’t mean the price necessarily will move there: the map identifies where leveraged traders are vulnerable and where a price expansion could trigger cascading liquidations.
🔗 tradingdifferent.com/en/dashboard/liquidation-heatmap?code=binance-square
With Bitcoin around 77,245 USD, the highest concentration of leveraged traders appears clearly above the current price.
Between approximately 79,400 and 80,700 USD, the most important liquidation block for shorters in 3X, 5X, 10X, and 25X is concentrated, with individual peaks well exceeding 2M in liquidation volume.
Below that, long liquidations are distributed mainly between 67,700 and 75,500 USD, but their accumulated concentration is considerably smaller.
The standout takeaway is the total: the map shows nearly 100M in potential liquidations upward versus a much lower concentration downward.
🔥 If #BTC starts accelerating again above 79K, it would move directly into the zone where the Swing Map’s biggest pool of shorters’ fuel is located.
This doesn’t mean the price necessarily will move there: the map identifies where leveraged traders are vulnerable and where a price expansion could trigger cascading liquidations.
🔗 tradingdifferent.com/en/dashboard/liquidation-heatmap?code=binance-square
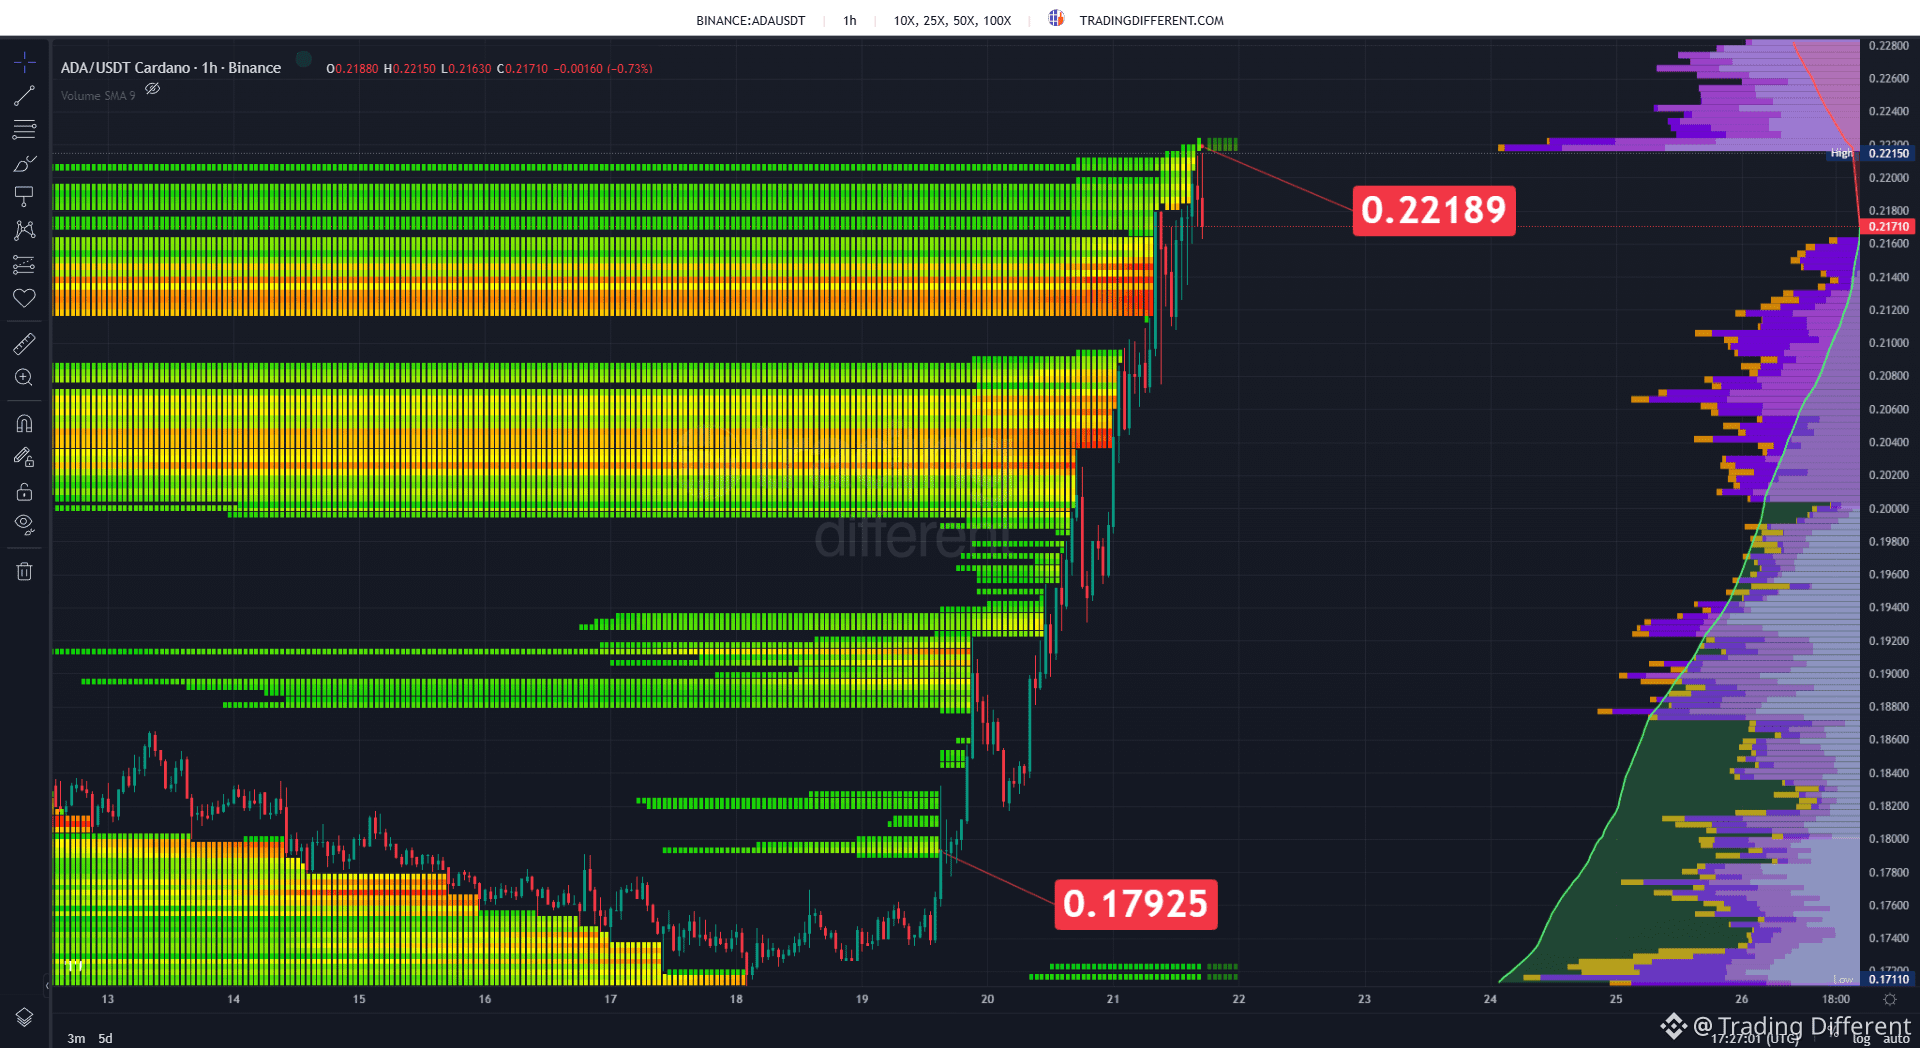
#ADA is starring in a brutal cleanup of short positions. 🔥
Cardano surged from approximately $0.179 to $0.221, consecutively sweeping through massive liquidation clusters of leveraged traders using 10X, 25X, 50X, and 100X.
The move was practically vertical: as the price advanced, it entered each new band of shorters that had been exposed. Now #ADA is trading near $0.217 after reaching the zone marked at $0.22189.
What’s interesting is that a large portion of the concentrations that were below the recent high have already been traversed by the price. The immediate upper zone is still key to determine whether new short liquidations appear, or whether the momentum starts to lose strength.
Below that, the map also helps gauge how far the market moved: $0.17925 remains as the reference point for the start of this strong expansion.
⚠️ In just a few days, ADA went from sweeping lower pools to directly attacking the zones where the shorters were concentrated.
The Heatmap doesn’t show buy or sell orders: it shows where leveraged traders would be forced to close their positions if the price reaches those levels.
🔗 tradingdifferent.com/es/dashboard/liquidation-heatmap?code=binance-square
Cardano surged from approximately $0.179 to $0.221, consecutively sweeping through massive liquidation clusters of leveraged traders using 10X, 25X, 50X, and 100X.
The move was practically vertical: as the price advanced, it entered each new band of shorters that had been exposed. Now #ADA is trading near $0.217 after reaching the zone marked at $0.22189.
What’s interesting is that a large portion of the concentrations that were below the recent high have already been traversed by the price. The immediate upper zone is still key to determine whether new short liquidations appear, or whether the momentum starts to lose strength.
Below that, the map also helps gauge how far the market moved: $0.17925 remains as the reference point for the start of this strong expansion.
⚠️ In just a few days, ADA went from sweeping lower pools to directly attacking the zones where the shorters were concentrated.
The Heatmap doesn’t show buy or sell orders: it shows where leveraged traders would be forced to close their positions if the price reaches those levels.
🔗 tradingdifferent.com/es/dashboard/liquidation-heatmap?code=binance-square
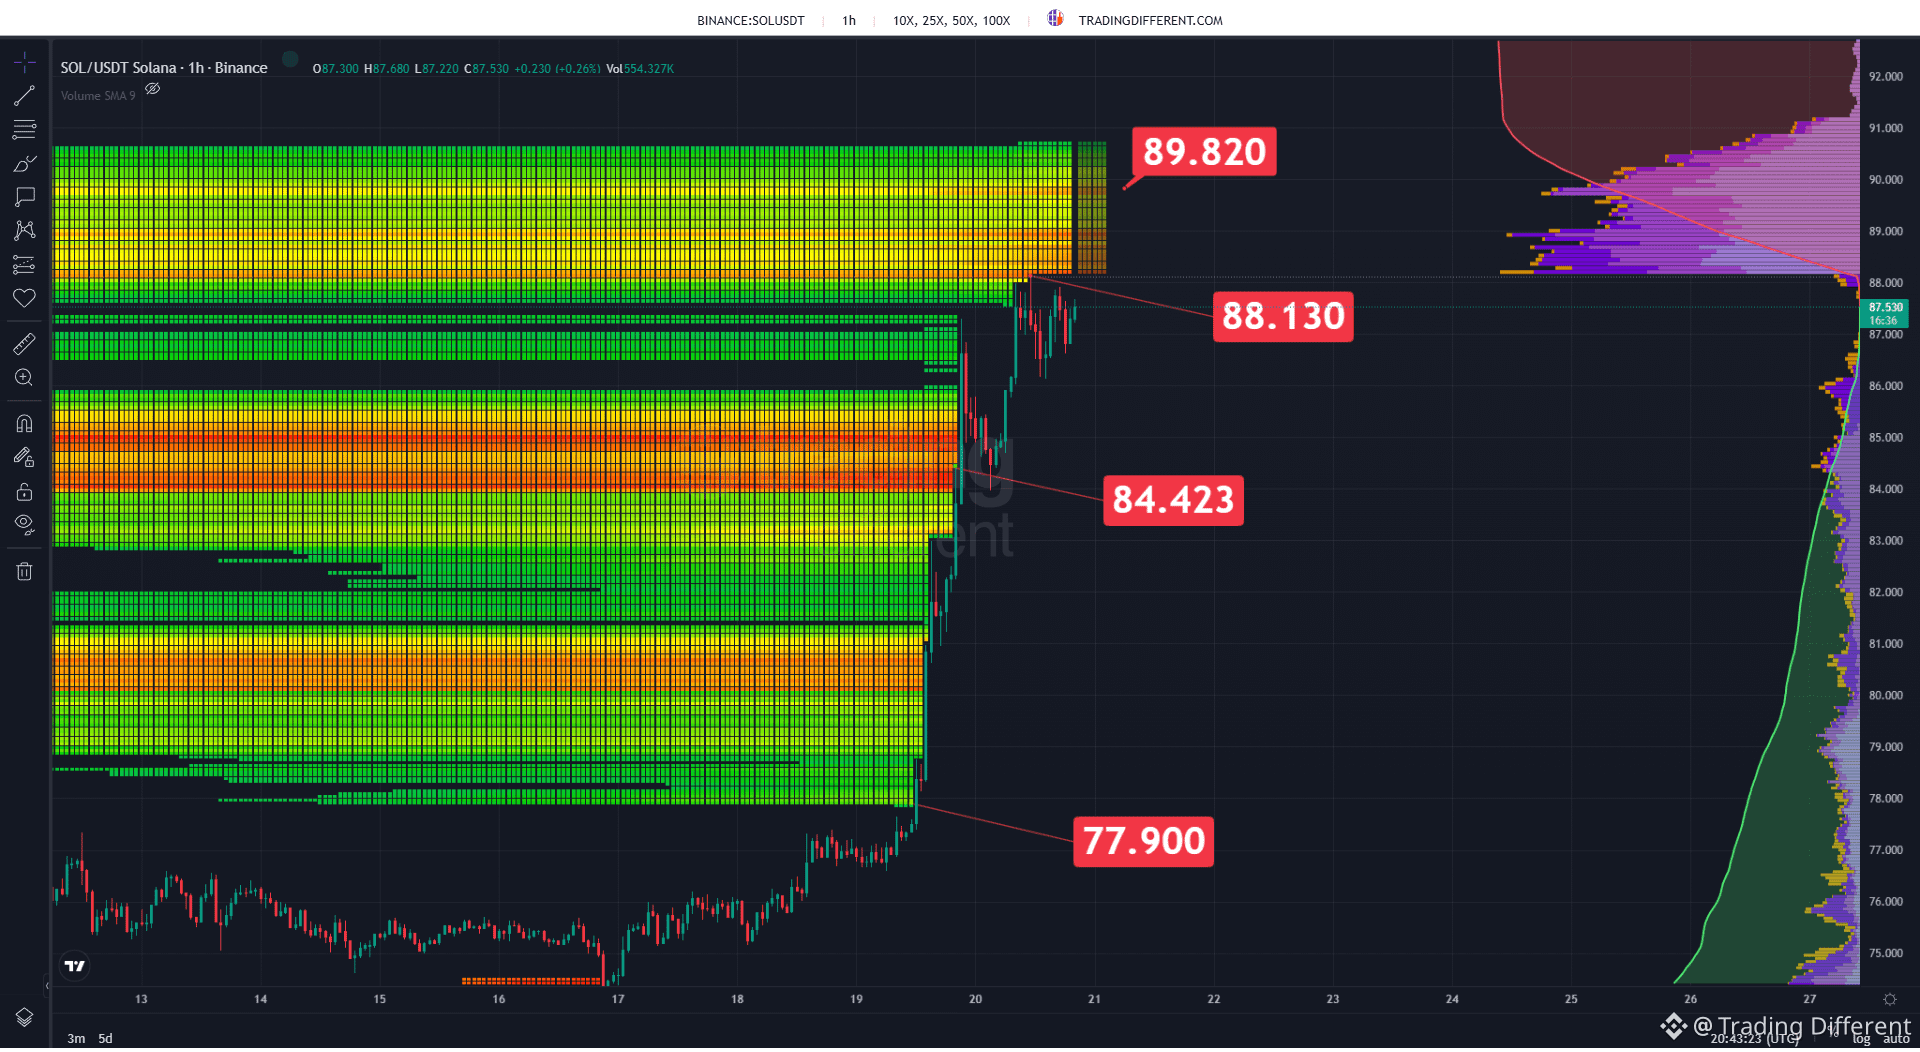
#sol protagonized an explosive move and went straight to target the leveraged positions. 🔥
The price accelerated from the 77.90 USD zone to break above 87 USD, sequentially clearing large concentrations of short liquidations on 10X, 25X, 50X, and 100X.
The 84.42 USD area was fully swept during the impulse, and SOL reached 88.13 USD, where it began to encounter a new concentration of exposed positions.
Now the Heatmap leaves a very clear target above: around 89.82 USD remains one of the most important blocks of short liquidations on the map.
With SOL trading near 87.53 USD, there are still shorts exposed above. If the price accelerates again, that 88–90 USD range will be key to watching for potential new liquidations in a chain.
The Heatmap doesn’t show buy or sell orders: it shows where leveraged traders would be forced to close their positions if the price reaches those levels.
🔗 tradingdifferent.com/es/dashboard/liquidation-heatmap?code=binance-square
The price accelerated from the 77.90 USD zone to break above 87 USD, sequentially clearing large concentrations of short liquidations on 10X, 25X, 50X, and 100X.
The 84.42 USD area was fully swept during the impulse, and SOL reached 88.13 USD, where it began to encounter a new concentration of exposed positions.
Now the Heatmap leaves a very clear target above: around 89.82 USD remains one of the most important blocks of short liquidations on the map.
With SOL trading near 87.53 USD, there are still shorts exposed above. If the price accelerates again, that 88–90 USD range will be key to watching for potential new liquidations in a chain.
The Heatmap doesn’t show buy or sell orders: it shows where leveraged traders would be forced to close their positions if the price reaches those levels.
🔗 tradingdifferent.com/es/dashboard/liquidation-heatmap?code=binance-square
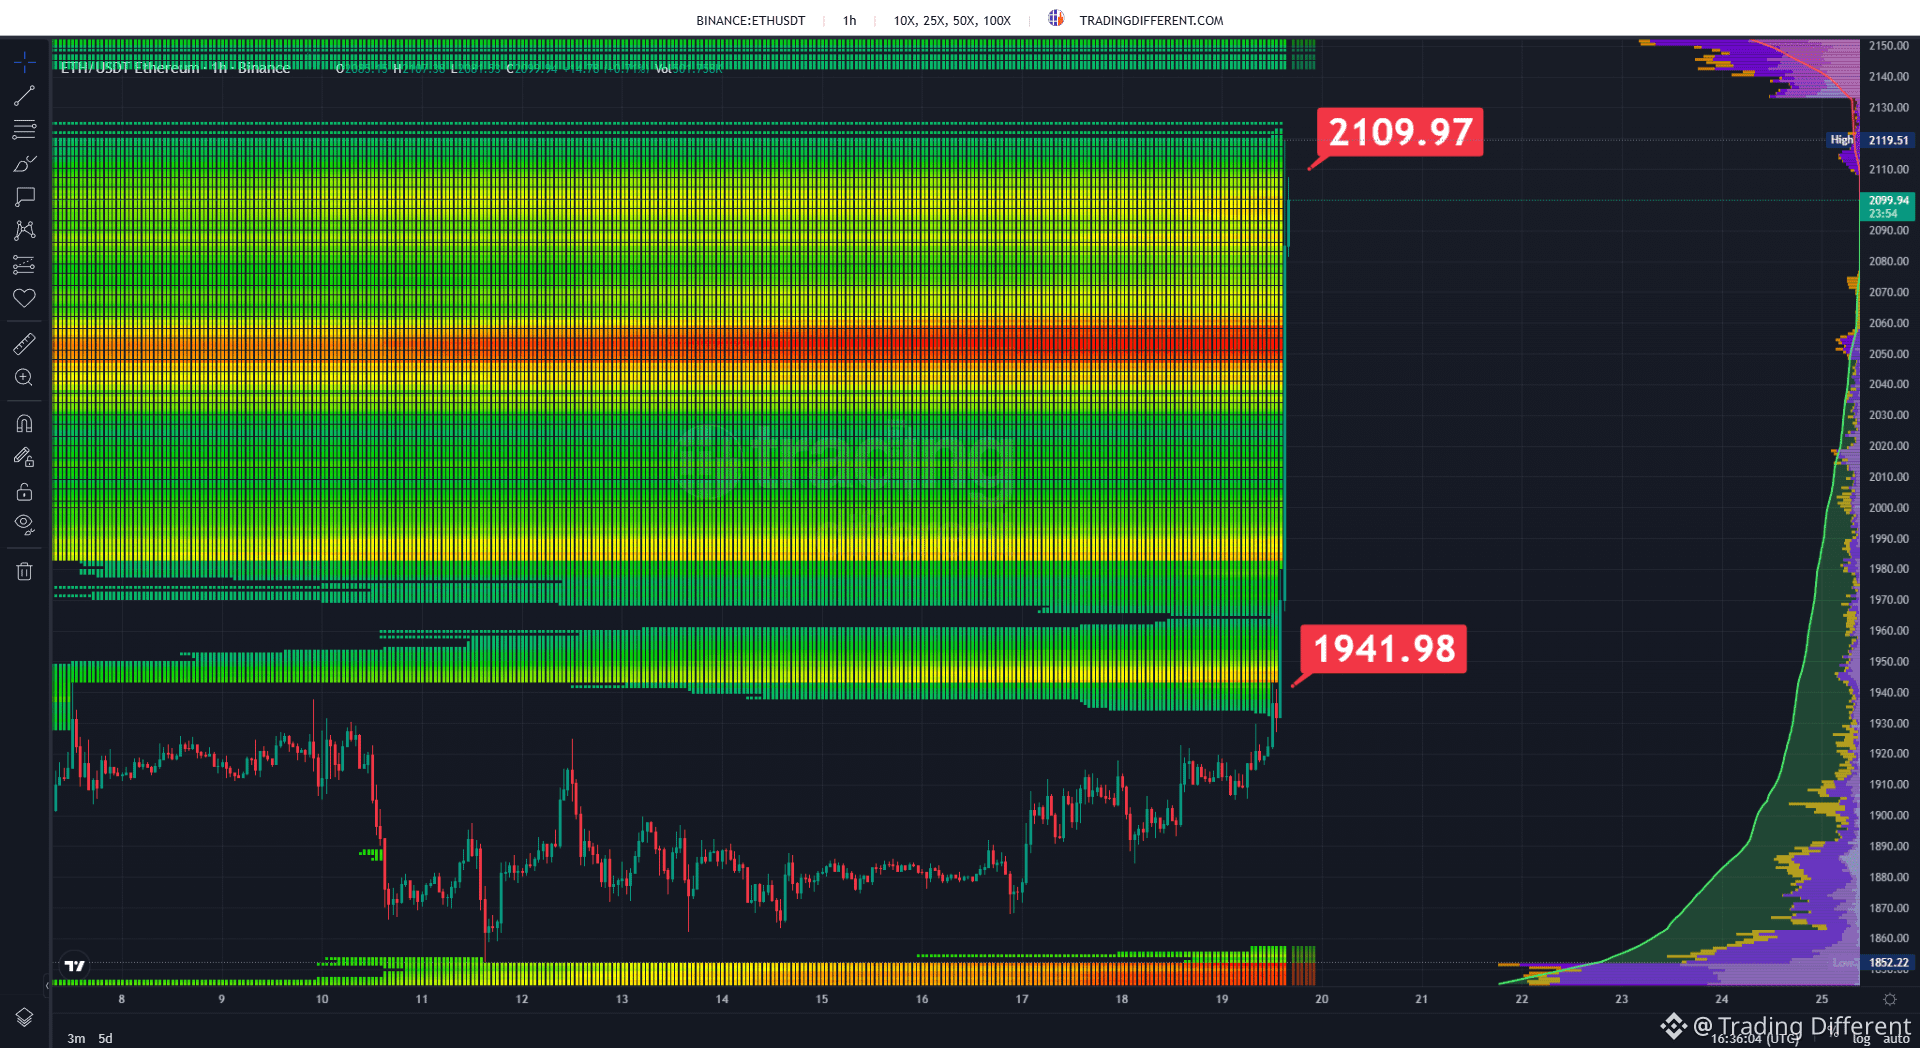
#ETH acaba de entrar con violencia en una enorme zona de liquidaciones short. 🔥
Ethereum jumped from approximately $1,930 to $2,100, directly cutting through multiple layers of leveraged traders at 10X, 25X, 50X, and 100X.
The Heatmap shows something very clear: the move is already running through the large upper block of shorters, but there’s still concentration ahead. The marked reference is at $2,109.97—practically above the current price—and the map keeps exposure even above that zone.
The especially intense band around $2,050–$2,060 was already breached during the acceleration, showing how price consumed successive liquidation levels.
Below, $1,941.98 remains an important reference where concentration of leveraged long-side traders reappears.
⚠️ ETH is now inside the territory of the shorters. The question is whether the move has enough fuel to continue clearing the top portion of the map.
The Heatmap doesn’t show buy or sell orders: it shows where leveraged traders would be forced to close their positions if price reaches those levels.
🔗 tradingdifferent.com/es/dashboard/liquidation-heatmap?code=binance-square
#ETH
Ethereum jumped from approximately $1,930 to $2,100, directly cutting through multiple layers of leveraged traders at 10X, 25X, 50X, and 100X.
The Heatmap shows something very clear: the move is already running through the large upper block of shorters, but there’s still concentration ahead. The marked reference is at $2,109.97—practically above the current price—and the map keeps exposure even above that zone.
The especially intense band around $2,050–$2,060 was already breached during the acceleration, showing how price consumed successive liquidation levels.
Below, $1,941.98 remains an important reference where concentration of leveraged long-side traders reappears.
⚠️ ETH is now inside the territory of the shorters. The question is whether the move has enough fuel to continue clearing the top portion of the map.
The Heatmap doesn’t show buy or sell orders: it shows where leveraged traders would be forced to close their positions if price reaches those levels.
🔗 tradingdifferent.com/es/dashboard/liquidation-heatmap?code=binance-square
#ETH
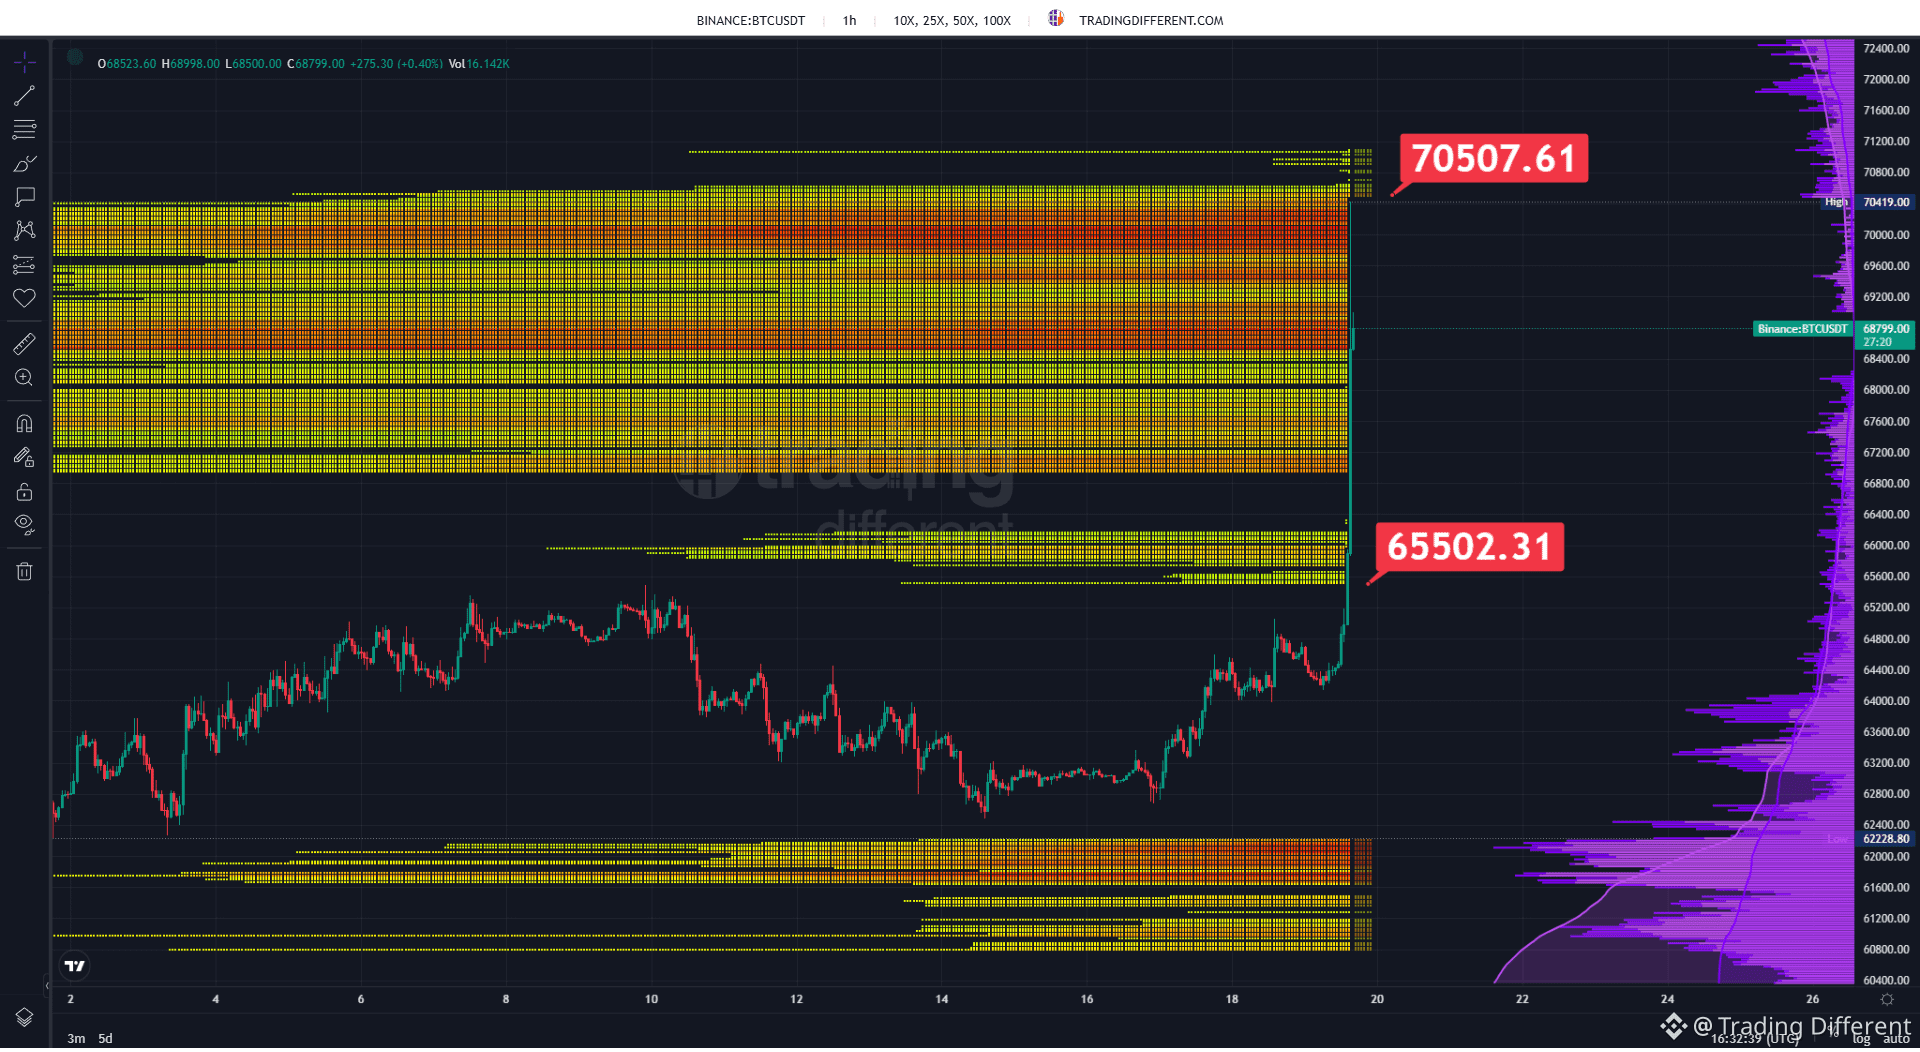
#BTC acaba to have been the protagonist of a violent move and fully plunged into a massive concentration of short liquidations.
Bitcoin jumped from the 65,500 USD zone to trade near 68,800 USD, cutting through the first layers of leveraged shorters and directly entering the large upper liquidation block.
And the Heatmap shows there’s still a lot more ahead: between approximately 67,000 and 70,500 USD, an extraordinarily dense concentration of short liquidations in 10X, 25X, 50X, and 100X extends. The marked upper reference appears at 70,508 USD.
Below, the structure is completely different: after this move, the immediate zone of 65,502 USD remains the reference, while the large pools of long liquidations are considerably lower.
🔥 BTC is already inside the pool of shorters. Now the question is how much of that leverage will end up clearing the market.
The Heatmap does not show buy or sell orders: it shows where leveraged traders would be forced to close their positions if the price reaches those levels.
🔗 tradingdifferent.com/es/dashboard/liquidation-heatmap?code=binance-square
#BTC
Bitcoin jumped from the 65,500 USD zone to trade near 68,800 USD, cutting through the first layers of leveraged shorters and directly entering the large upper liquidation block.
And the Heatmap shows there’s still a lot more ahead: between approximately 67,000 and 70,500 USD, an extraordinarily dense concentration of short liquidations in 10X, 25X, 50X, and 100X extends. The marked upper reference appears at 70,508 USD.
Below, the structure is completely different: after this move, the immediate zone of 65,502 USD remains the reference, while the large pools of long liquidations are considerably lower.
🔥 BTC is already inside the pool of shorters. Now the question is how much of that leverage will end up clearing the market.
The Heatmap does not show buy or sell orders: it shows where leveraged traders would be forced to close their positions if the price reaches those levels.
🔗 tradingdifferent.com/es/dashboard/liquidation-heatmap?code=binance-square
#BTC
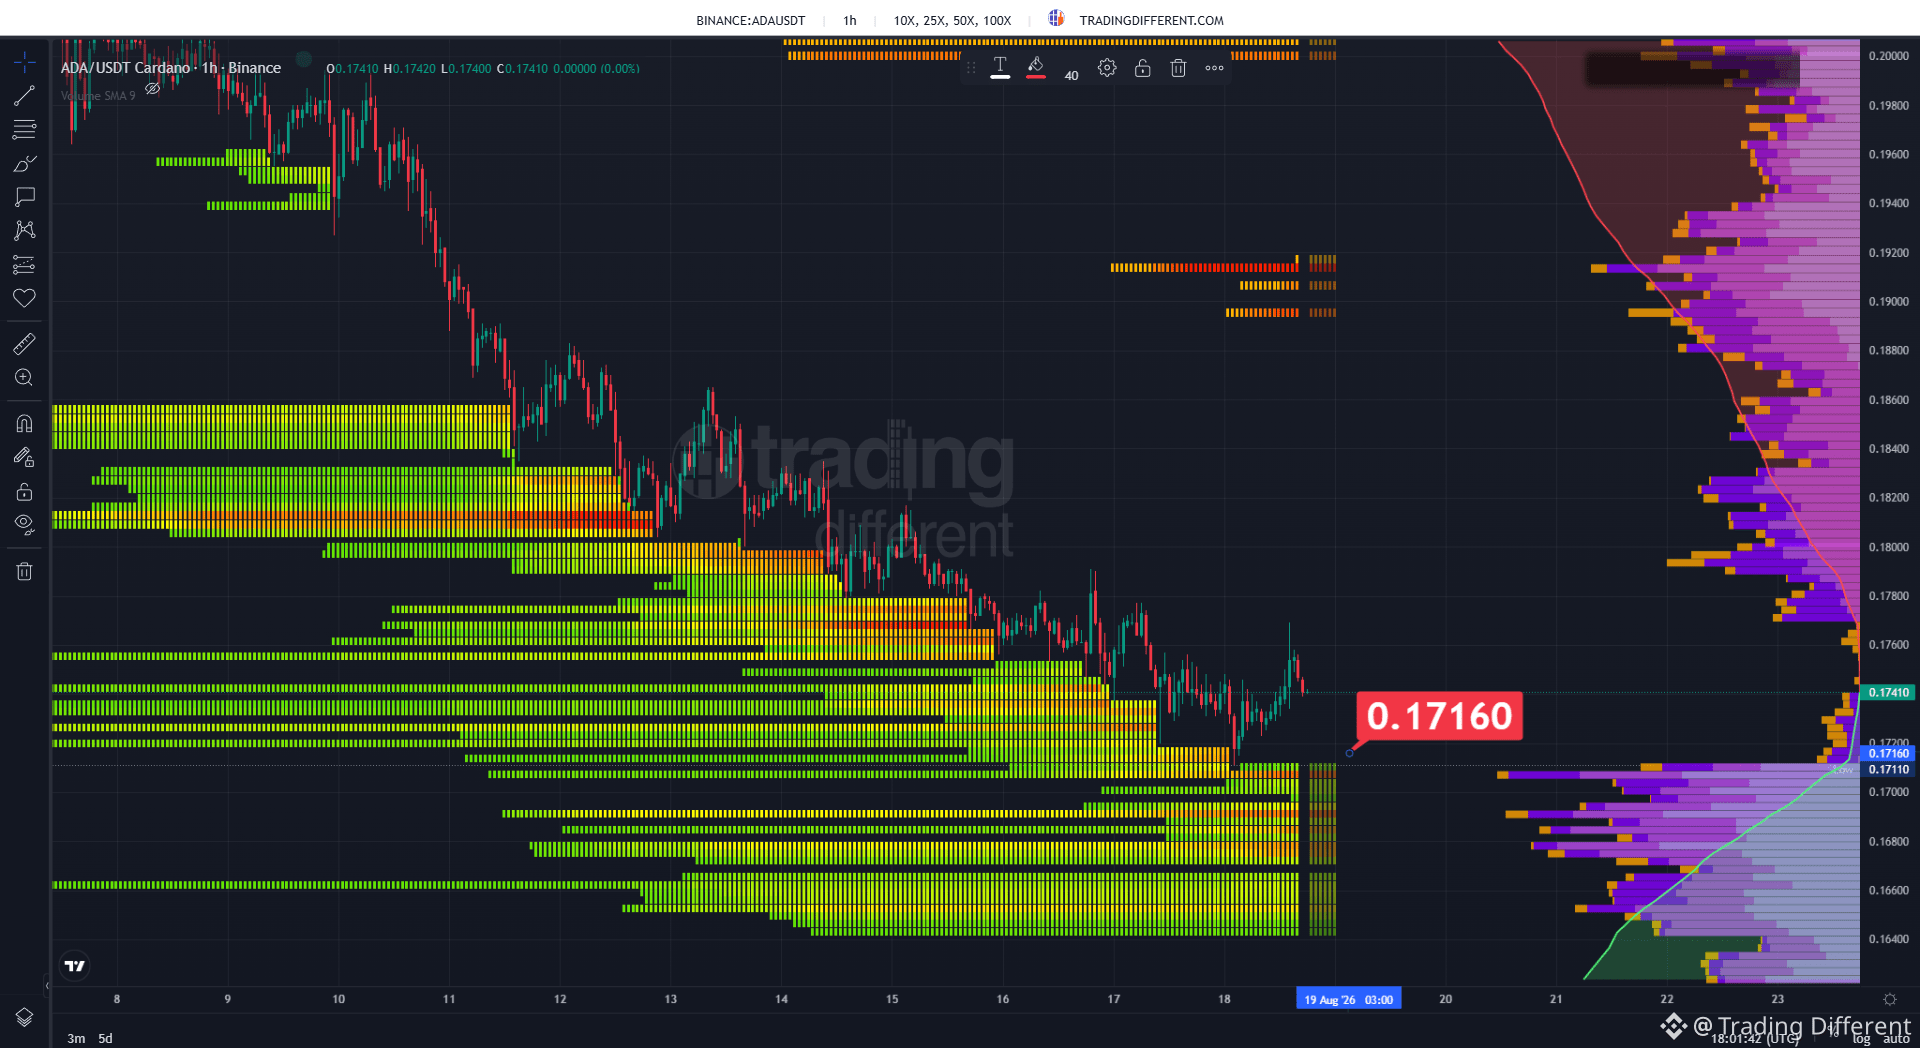
#ADA keep showing a clearly structured liquidation pattern long below the price.
With Cardano trading near $0.1741, the Heatmap shows that the drop over the past few days has been moving through and successively clearing different layers of leveraged positions.
Now the immediate reference point appears around $0.1716, but the most relevant data is below: between approximately $0.170 and $0.164, there remains a large concentration of long liquidations across 10X, 25X, 50X, and 100X.
On the upside, short liquidations are much farther away, with new visible concentrations mainly starting from the $0.19 area.
As long as ADA stays at these levels, the map maintains a clear exposure imbalance to the downside. That doesn’t necessarily mean the price must travel through those zones, but rather that a significant amount of leverage remains vulnerable there in case of another drop.
🔗 tradingdifferent.com/es/dashboard/liquidation-heatmap?code=binance-square
#ADA
With Cardano trading near $0.1741, the Heatmap shows that the drop over the past few days has been moving through and successively clearing different layers of leveraged positions.
Now the immediate reference point appears around $0.1716, but the most relevant data is below: between approximately $0.170 and $0.164, there remains a large concentration of long liquidations across 10X, 25X, 50X, and 100X.
On the upside, short liquidations are much farther away, with new visible concentrations mainly starting from the $0.19 area.
As long as ADA stays at these levels, the map maintains a clear exposure imbalance to the downside. That doesn’t necessarily mean the price must travel through those zones, but rather that a significant amount of leverage remains vulnerable there in case of another drop.
🔗 tradingdifferent.com/es/dashboard/liquidation-heatmap?code=binance-square
#ADA
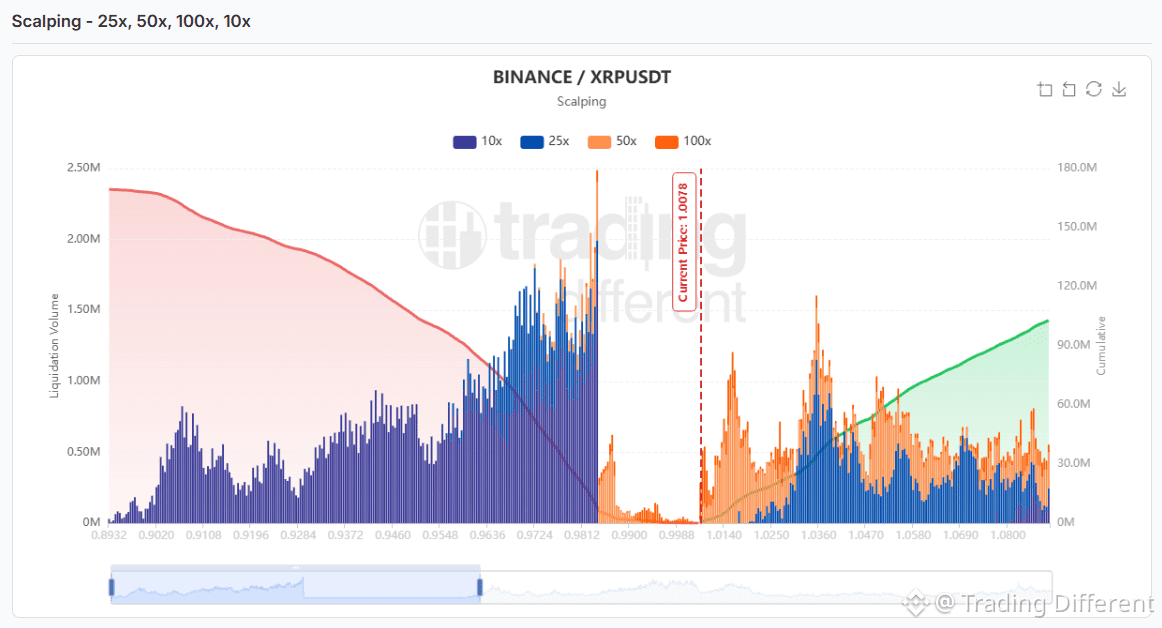
#XRP shows an interesting imbalance in liquidations in Scalping.
With the current price near 1.0078 USD, the 10X, 25X, 50X, and 100X map shows a clearly greater accumulated concentration below the price. In other words, there is significant exposure from long positions that would be liquidated in the event of a drop.
Above, there are also pools of shorters, especially from approximately 1.014–1.05 USD, although the total visible accumulated amount is smaller than what remains below.
The takeaway is clear: leverage is available in both directions, but the accumulated imbalance overwhelmingly favors the lower zone.
This does not mean that XRP has to fall; the map simply helps identify where liquidation risk is concentrated if the price moves.
🔗 tradingdifferent.com/es/dashboard/liquidation-heatmap?code=binance-square
#XRP
The imbalance favors the lower zone, so the key reference becomes which long liquidation levels lie just below 1.0078 USD before assessing any bounce.
With the current price near 1.0078 USD, the 10X, 25X, 50X, and 100X map shows a clearly greater accumulated concentration below the price. In other words, there is significant exposure from long positions that would be liquidated in the event of a drop.
Above, there are also pools of shorters, especially from approximately 1.014–1.05 USD, although the total visible accumulated amount is smaller than what remains below.
The takeaway is clear: leverage is available in both directions, but the accumulated imbalance overwhelmingly favors the lower zone.
This does not mean that XRP has to fall; the map simply helps identify where liquidation risk is concentrated if the price moves.
🔗 tradingdifferent.com/es/dashboard/liquidation-heatmap?code=binance-square
#XRP
The imbalance favors the lower zone, so the key reference becomes which long liquidation levels lie just below 1.0078 USD before assessing any bounce.
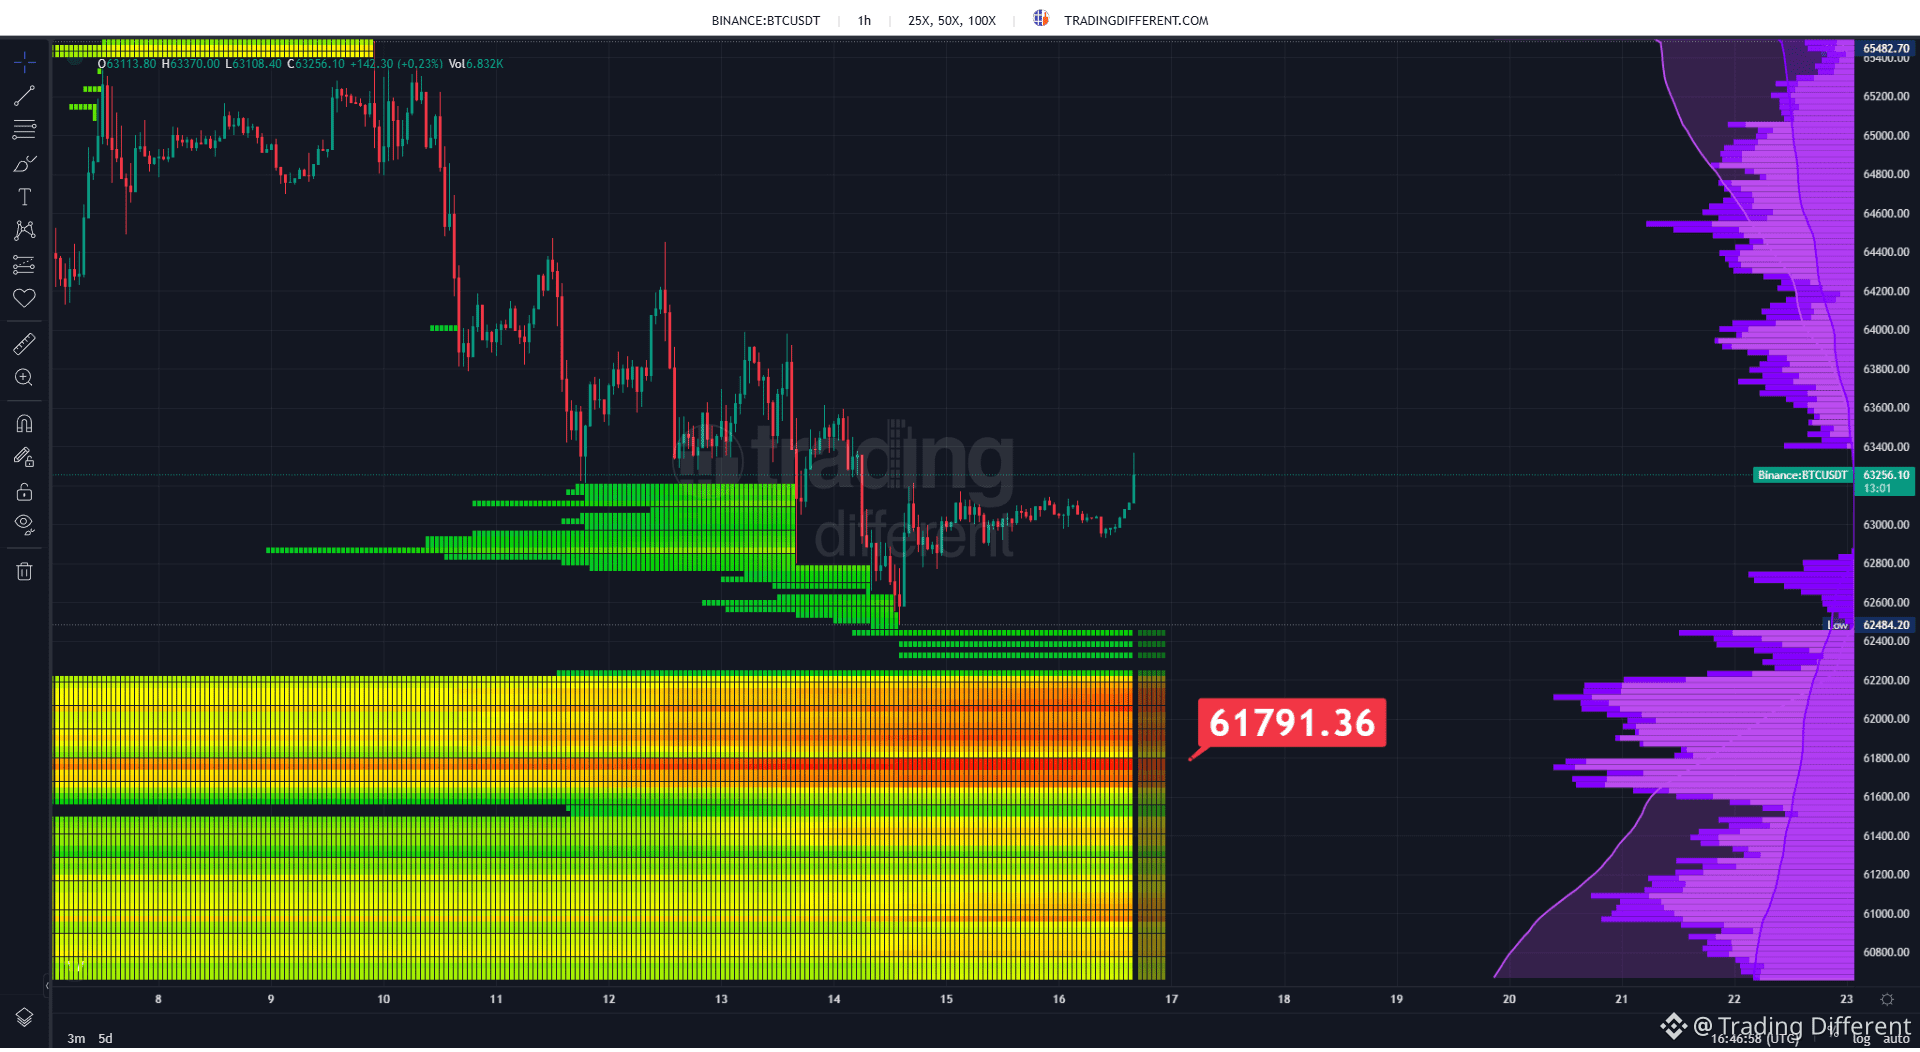
#BTC maintains a heavily loaded long liquidation zone below the price.
With Bitcoin near 63,250 USD, the Heatmap shows that the closest liquidations are concentrated around 62.4K–62.8K, levels that were already partially targeted during the recent sell-offs.
But the real exposure block continues further down: around 61,791 USD there is an extremely dense concentration of leveraged long positions at 25X, 50X, and 100X.
For now, BTC is trying to regain ground above 63K, but as long as that large pool remains intact, 61.8K is still a key area to monitor in case of another bearish acceleration.
The Heatmap does not indicate that BTC necessarily has to go there—it shows where forced liquidations would occur if the price reaches that level.
🔗 tradingdifferent.com/es/dashboard/liquidation-heatmap?code=binance-square
#BTC
With Bitcoin near 63,250 USD, the Heatmap shows that the closest liquidations are concentrated around 62.4K–62.8K, levels that were already partially targeted during the recent sell-offs.
But the real exposure block continues further down: around 61,791 USD there is an extremely dense concentration of leveraged long positions at 25X, 50X, and 100X.
For now, BTC is trying to regain ground above 63K, but as long as that large pool remains intact, 61.8K is still a key area to monitor in case of another bearish acceleration.
The Heatmap does not indicate that BTC necessarily has to go there—it shows where forced liquidations would occur if the price reaches that level.
🔗 tradingdifferent.com/es/dashboard/liquidation-heatmap?code=binance-square
#BTC
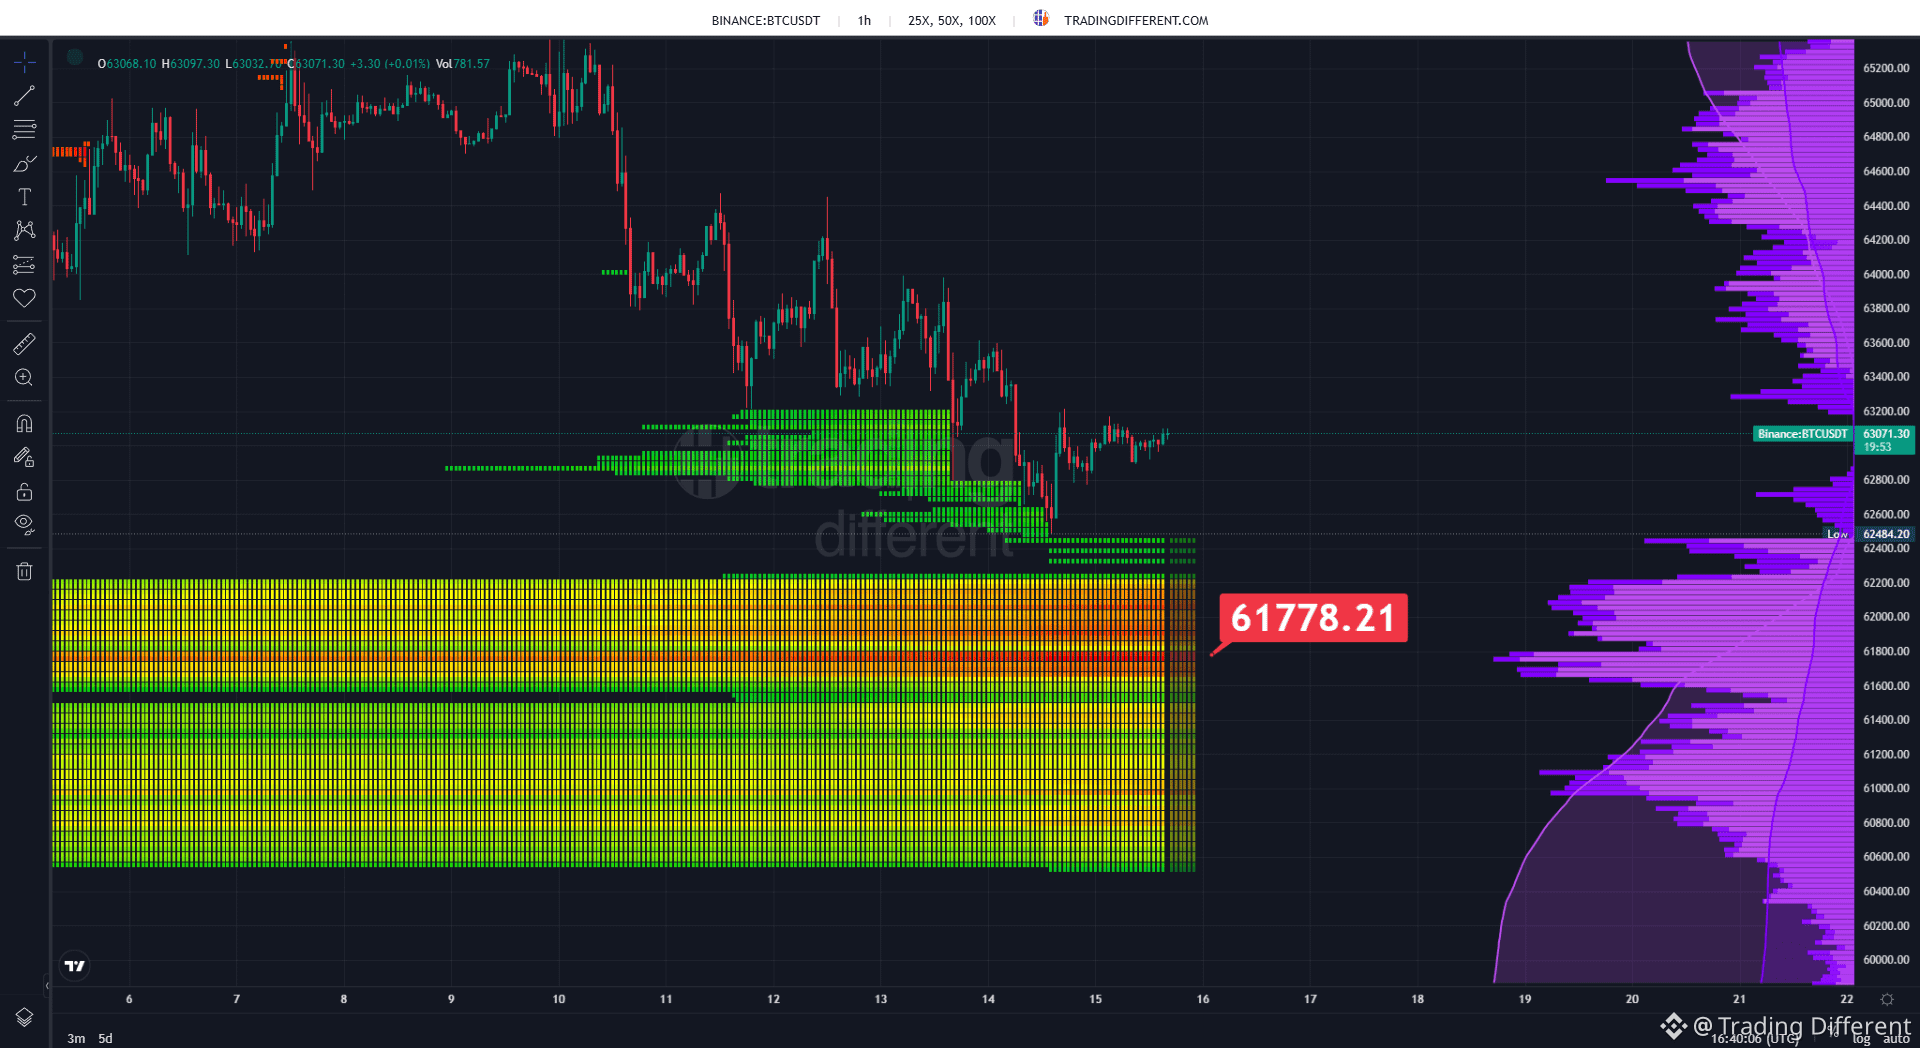
#BTC returns to approach an important liquidation zone for long positions.
With the price near 63.070 USD, the Heatmap shows that during the last drop, different leverage layers in the 63K–62.5K area were already being targeted.
But the heaviest block continues lower: around 61.778 USD there is a much greater and denser concentration of long liquidations, with exposure at 25X, 50X, and 100X.
As long as BTC remains above it, that liquidity stays pending. If the price accelerates downward again, 61.778 USD is clearly one of the main zones to watch.
The map doesn’t predict that price has to reach there: it shows where leveraged positions would become exposed if it does.
🔗 tradingdifferent.com/es/dashboard/liquidation-heatmap?code=binance-square
#BTC
With the price near 63.070 USD, the Heatmap shows that during the last drop, different leverage layers in the 63K–62.5K area were already being targeted.
But the heaviest block continues lower: around 61.778 USD there is a much greater and denser concentration of long liquidations, with exposure at 25X, 50X, and 100X.
As long as BTC remains above it, that liquidity stays pending. If the price accelerates downward again, 61.778 USD is clearly one of the main zones to watch.
The map doesn’t predict that price has to reach there: it shows where leveraged positions would become exposed if it does.
🔗 tradingdifferent.com/es/dashboard/liquidation-heatmap?code=binance-square
#BTC
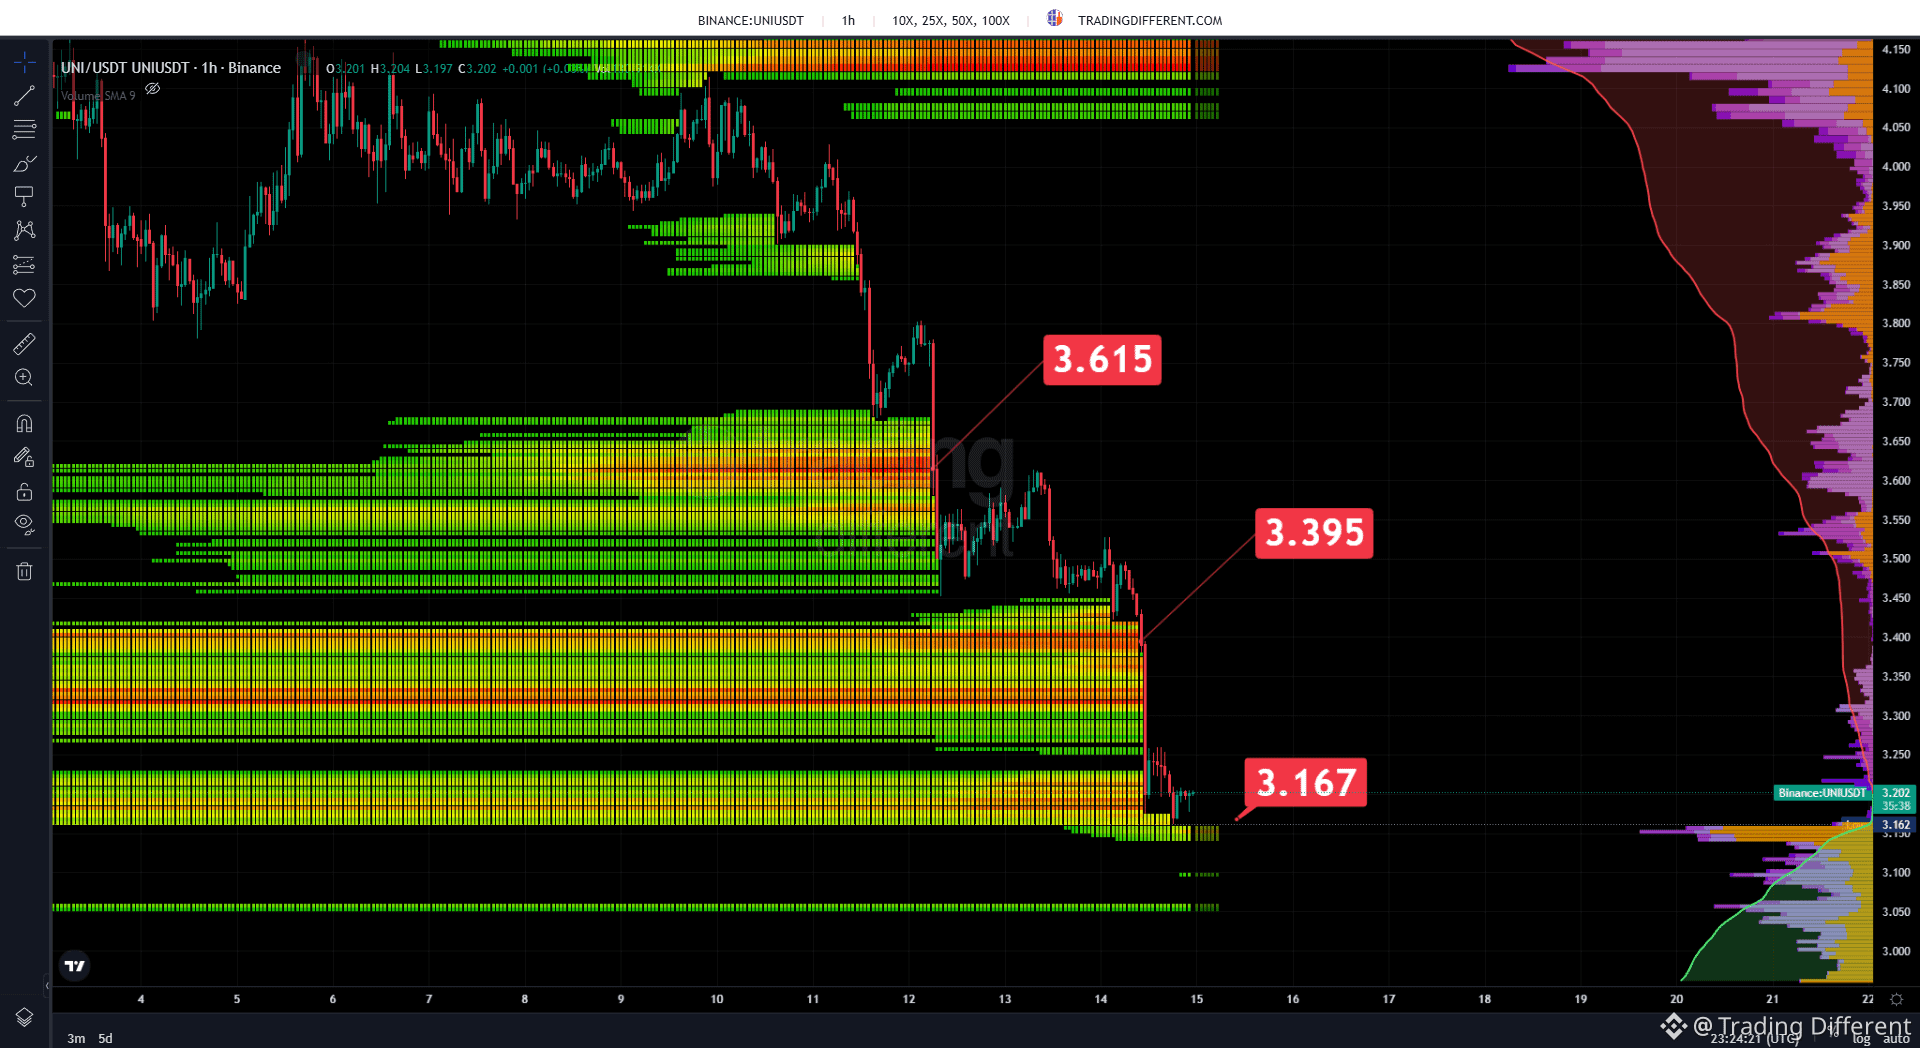
#UNI está showing a very aggressive cleanup of leveraged long positions.
The price fell from the 3.61 USD area, successively broke through large liquidation concentrations, and ended up attacking the lower block around 3,167 USD. It is currently trading near 3,20 USD, just above that level.
What’s interesting about the Heatmap is everything that was left behind: during the drop, important long pools around 3,615 USD and 3,395 USD disappeared, indicating that a large portion of those leveraged positions have already been liquidated.
Now the immediate focus is on 3,167 USD. If the price breaks back below that zone, more liquidation levels still appear further down. If it bounces, the map shows how much leverage has just been wiped out during this move.
A good example of how a liquidation cascade can accompany and accelerate a move.
🔗 tradingdifferent.com/es/dashboard/liquidation-heatmap?code=binance-square
#UNI
The price fell from the 3.61 USD area, successively broke through large liquidation concentrations, and ended up attacking the lower block around 3,167 USD. It is currently trading near 3,20 USD, just above that level.
What’s interesting about the Heatmap is everything that was left behind: during the drop, important long pools around 3,615 USD and 3,395 USD disappeared, indicating that a large portion of those leveraged positions have already been liquidated.
Now the immediate focus is on 3,167 USD. If the price breaks back below that zone, more liquidation levels still appear further down. If it bounces, the map shows how much leverage has just been wiped out during this move.
A good example of how a liquidation cascade can accompany and accelerate a move.
🔗 tradingdifferent.com/es/dashboard/liquidation-heatmap?code=binance-square
#UNI
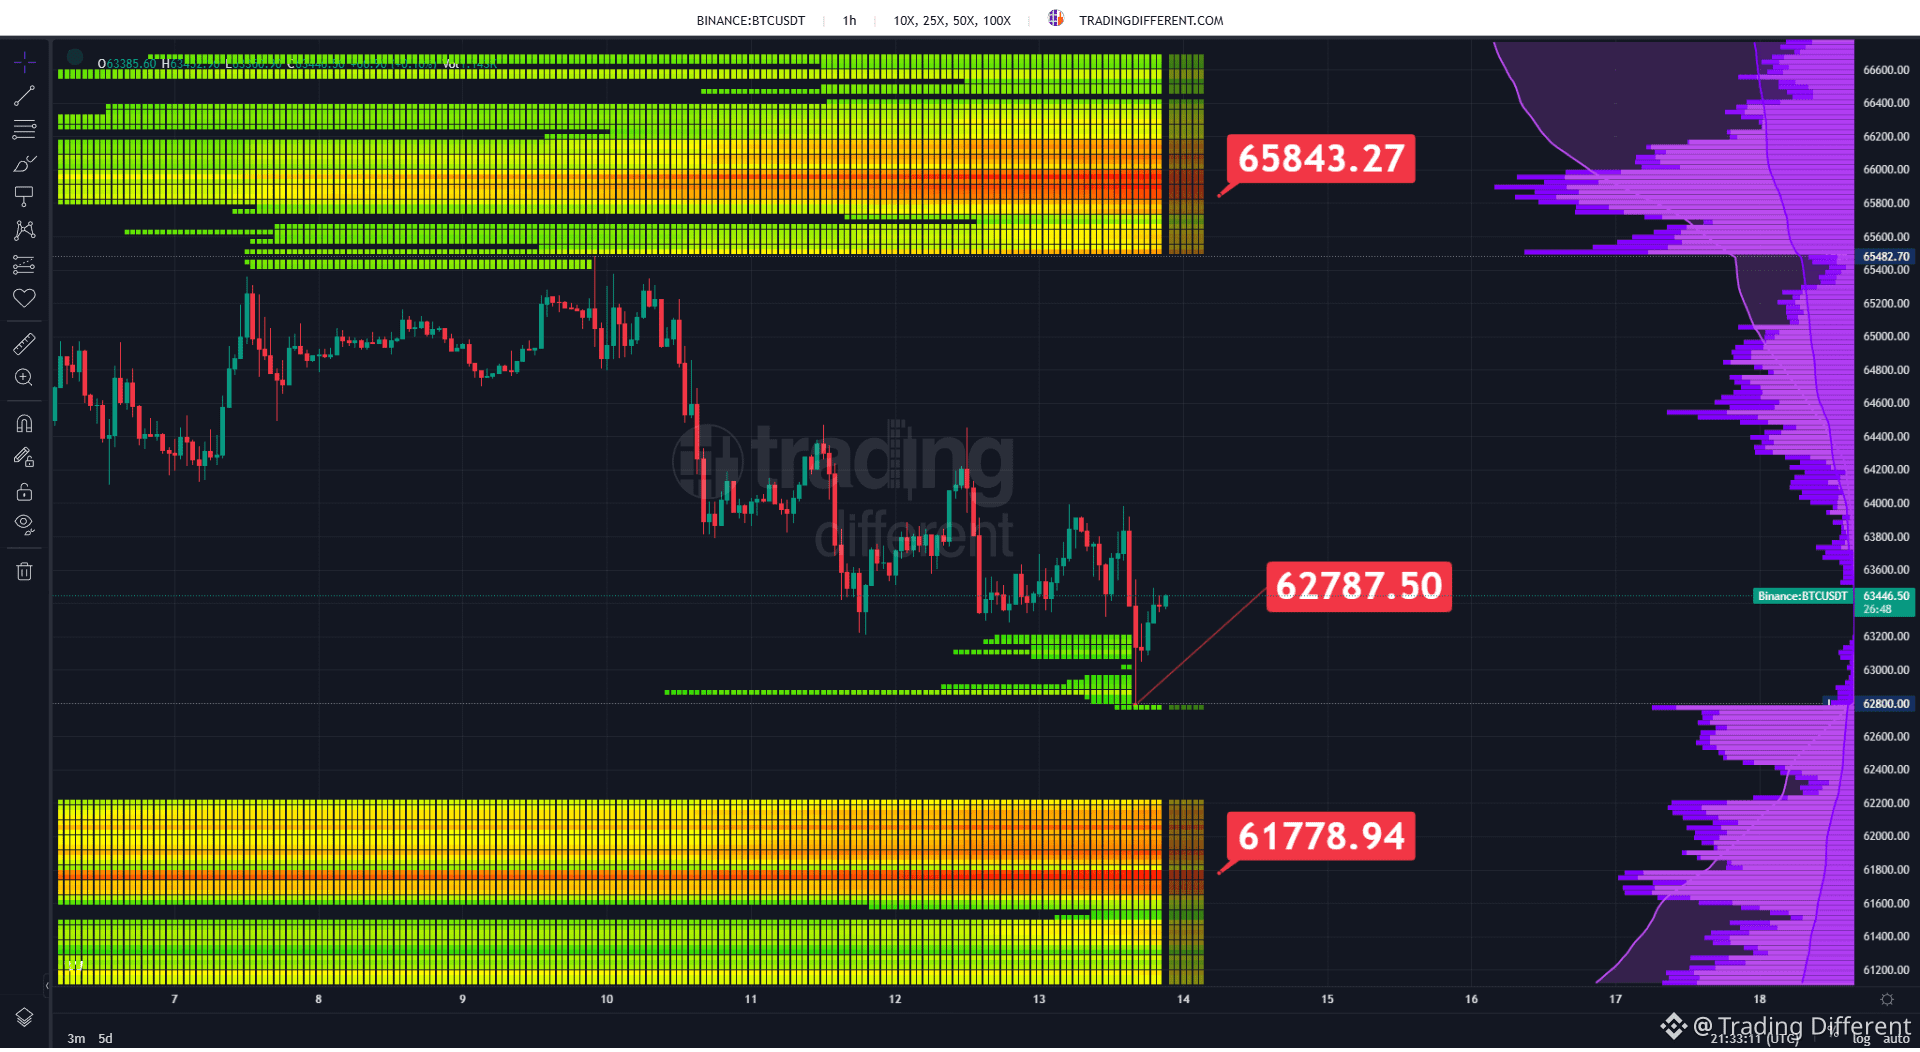
#BTC you get trapped again between two large zones of leveraged liquidations.
With the price near 63,450 USD, immediate pressure appears below: around 62,788 USD is the first level where long positions would be exposed. Lower down, the truly heavy pool is kept near 61,779 USD, with a clearly higher liquidation density.
On the upside, the shorters also aren’t comfortable. The main concentration stays around 65,843 USD, where the Heatmap shows a heavily loaded block of leveraged positions that are vulnerable if BTC regains ground.
The market is in the middle of the map: 62,788–61,779 USD below and 65,843 USD above. The next strong move could find fuel at either end.
🔗 tradingdifferent.com/en/dashboard/liquidation-heatmap?code=binance-square
#BTC
With the price near 63,450 USD, immediate pressure appears below: around 62,788 USD is the first level where long positions would be exposed. Lower down, the truly heavy pool is kept near 61,779 USD, with a clearly higher liquidation density.
On the upside, the shorters also aren’t comfortable. The main concentration stays around 65,843 USD, where the Heatmap shows a heavily loaded block of leveraged positions that are vulnerable if BTC regains ground.
The market is in the middle of the map: 62,788–61,779 USD below and 65,843 USD above. The next strong move could find fuel at either end.
🔗 tradingdifferent.com/en/dashboard/liquidation-heatmap?code=binance-square
#BTC
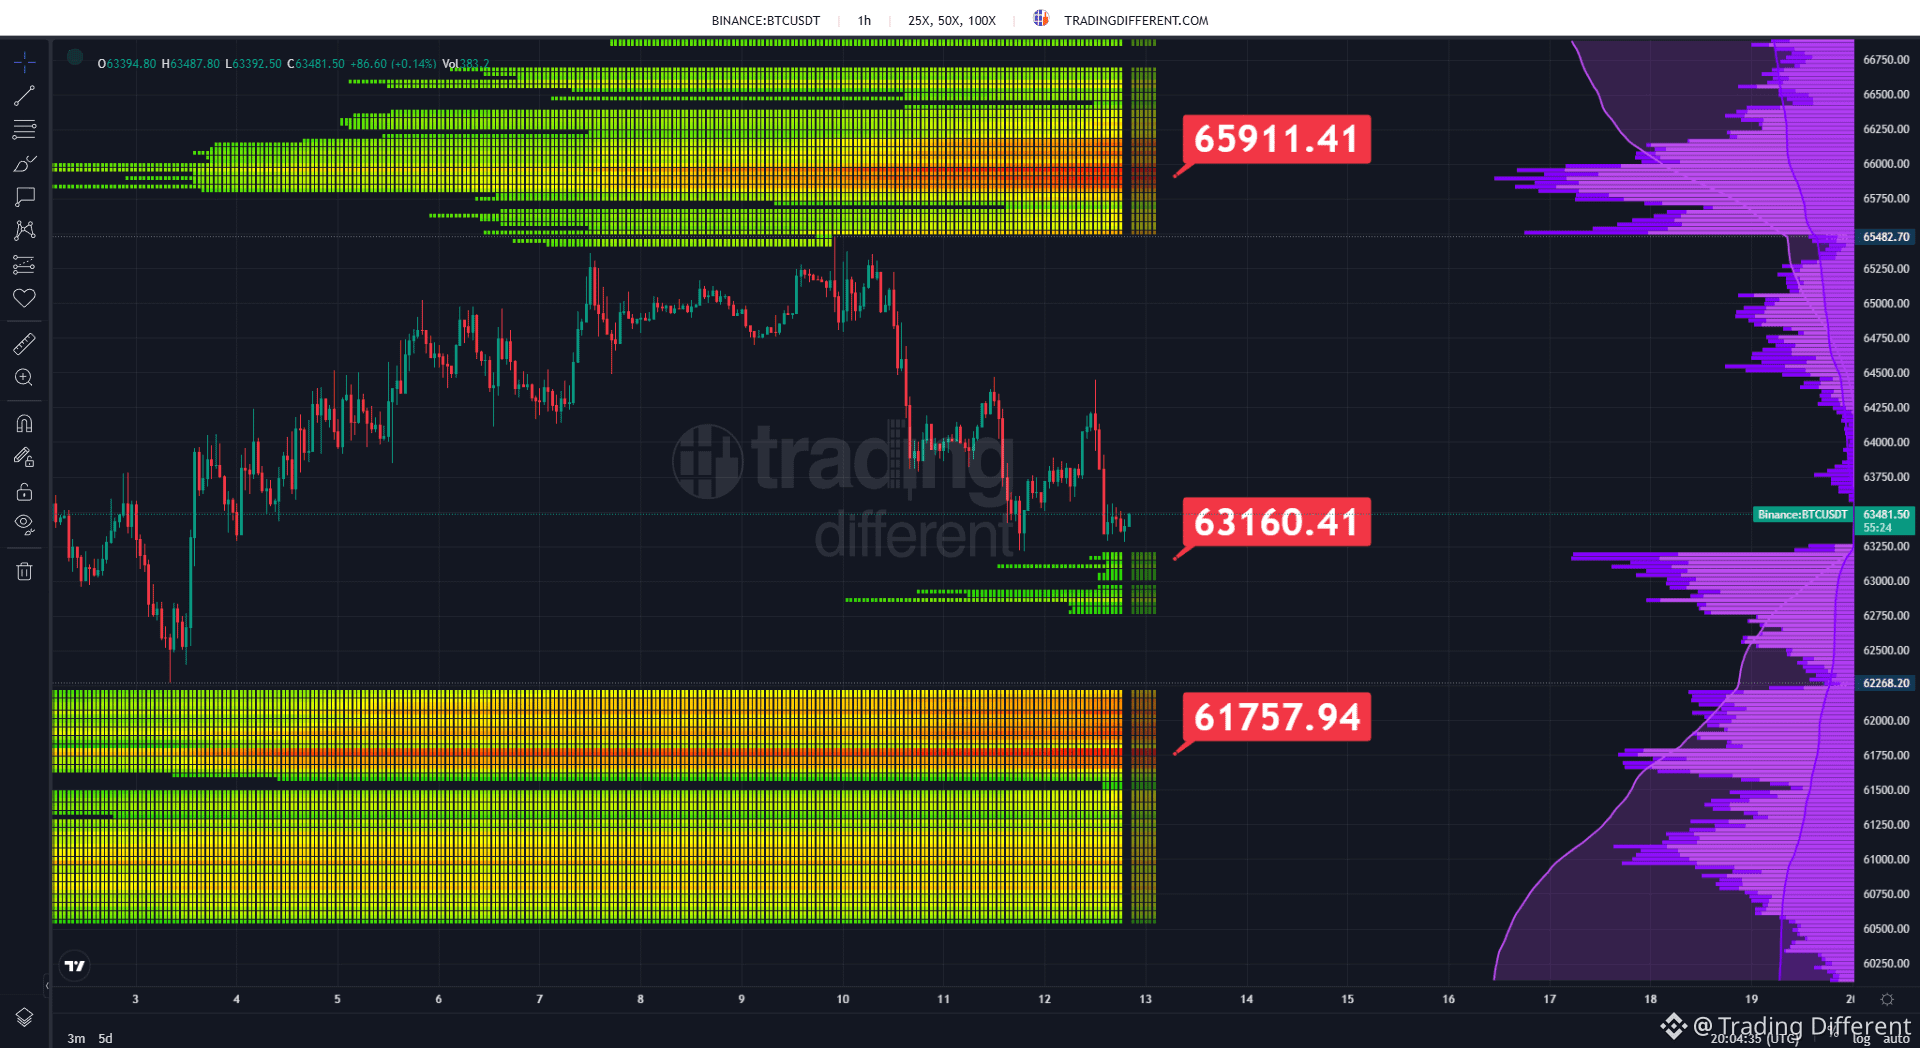
#BTC cotiza cerca de 63.480 USD, ubicado entre zonas de liquidación apalancada claramente definidas.
Below the current price, the first concentration of liquidation for long positions appears around 63.160 USD, while a much larger and denser pool remains near 61.758 USD.
Above the price, we also find a significant concentration. A wide pool of liquidation for short positions accumulates around 65.911 USD, becoming the main area to monitor on the upside.
With BTC currently between these pools, both sides remain exposed. A move toward either extreme could trigger forced liquidations and accelerate volatility.
https://tradingdifferent.com/es/dashboard/liquidation-heatmap?code=binance-square
Below the current price, the first concentration of liquidation for long positions appears around 63.160 USD, while a much larger and denser pool remains near 61.758 USD.
Above the price, we also find a significant concentration. A wide pool of liquidation for short positions accumulates around 65.911 USD, becoming the main area to monitor on the upside.
With BTC currently between these pools, both sides remain exposed. A move toward either extreme could trigger forced liquidations and accelerate volatility.
https://tradingdifferent.com/es/dashboard/liquidation-heatmap?code=binance-square
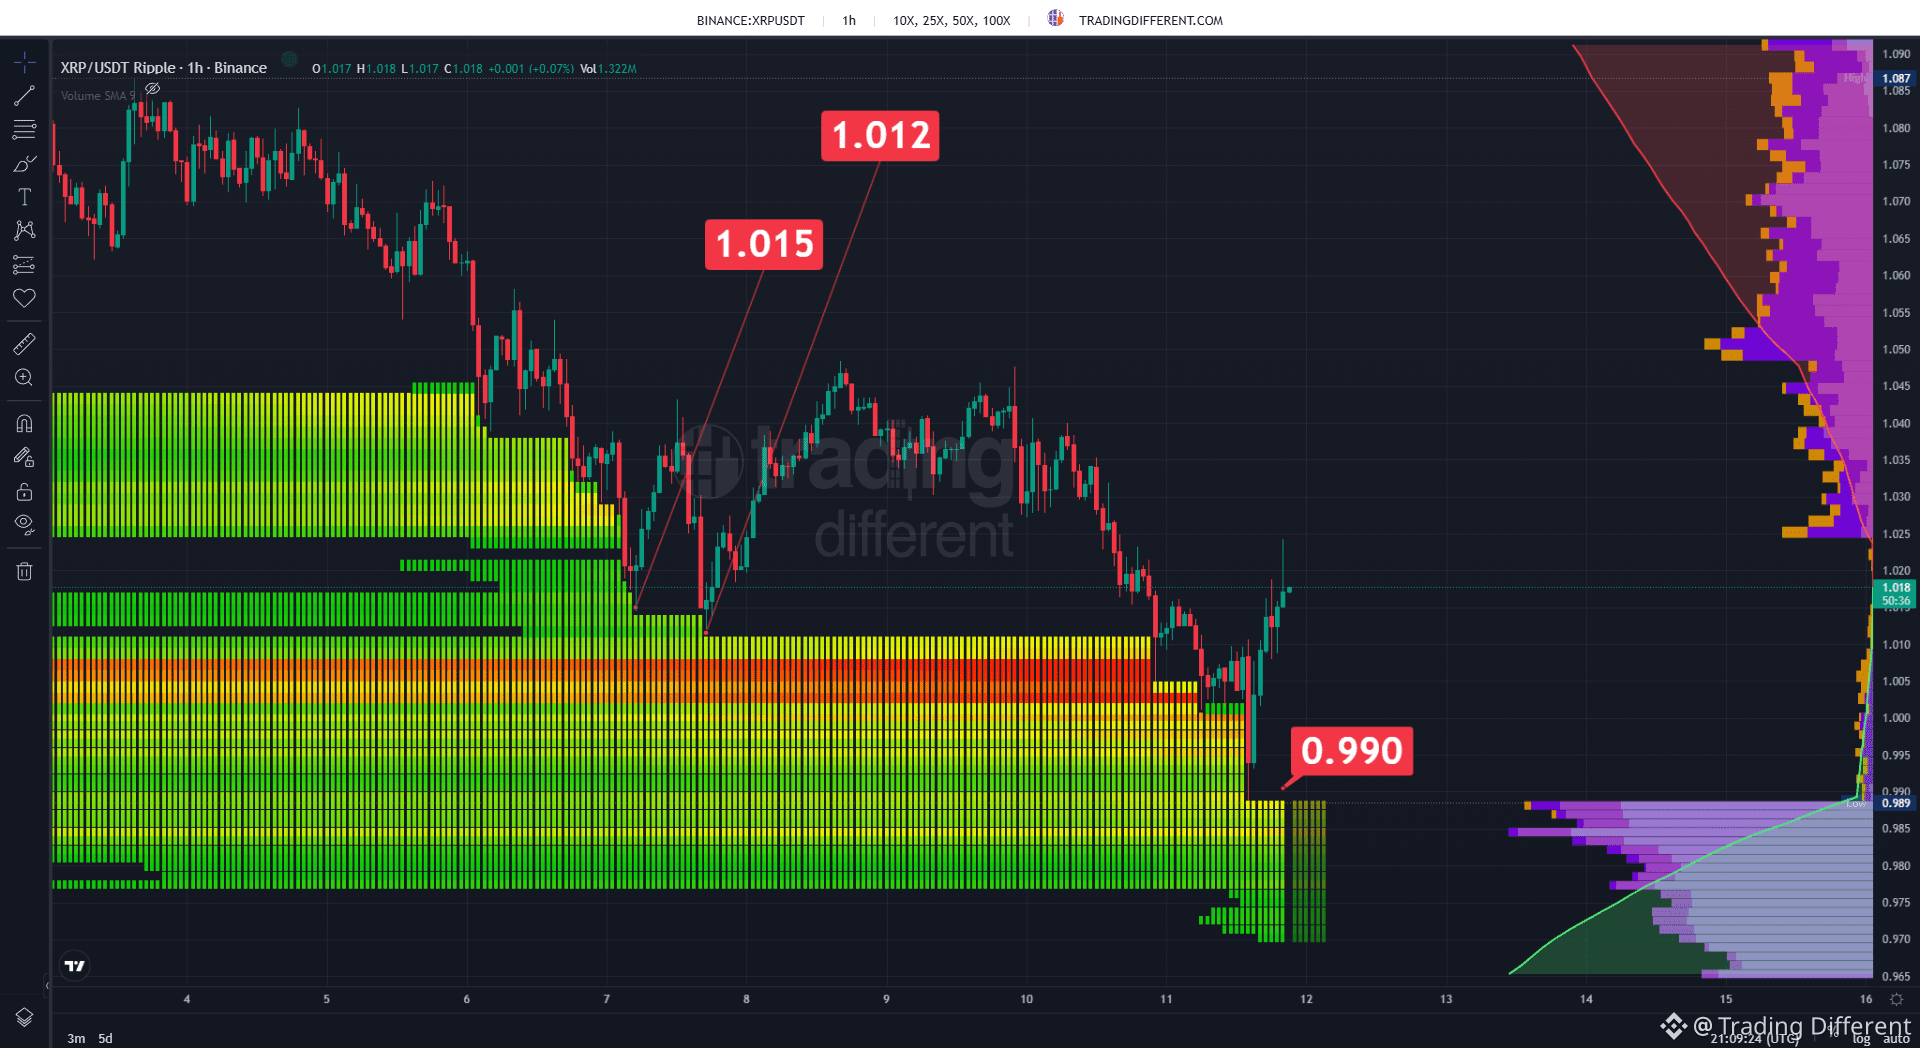
#xrp reacted strongly after falling to the 0.990 zone, where the price reached a significant concentration of leveraged long positions and began to rebound.
After this long cleanup, XRP quickly regained the 1.018 zone. Above that, the market is again finding exposure to short positions, with increasing concentrations from 1.025 and more relevant blocks toward 1.05.
The reaction from 0.990 shows how price responded again after reaching a high-liquidity area. If the rebound keeps its strength, attention now shifts to the short liquidations accumulated above.
https://tradingdifferent.com/es/dashboard/liquidation-heatmap?code=binance-square
After this long cleanup, XRP quickly regained the 1.018 zone. Above that, the market is again finding exposure to short positions, with increasing concentrations from 1.025 and more relevant blocks toward 1.05.
The reaction from 0.990 shows how price responded again after reaching a high-liquidity area. If the rebound keeps its strength, attention now shifts to the short liquidations accumulated above.
https://tradingdifferent.com/es/dashboard/liquidation-heatmap?code=binance-square
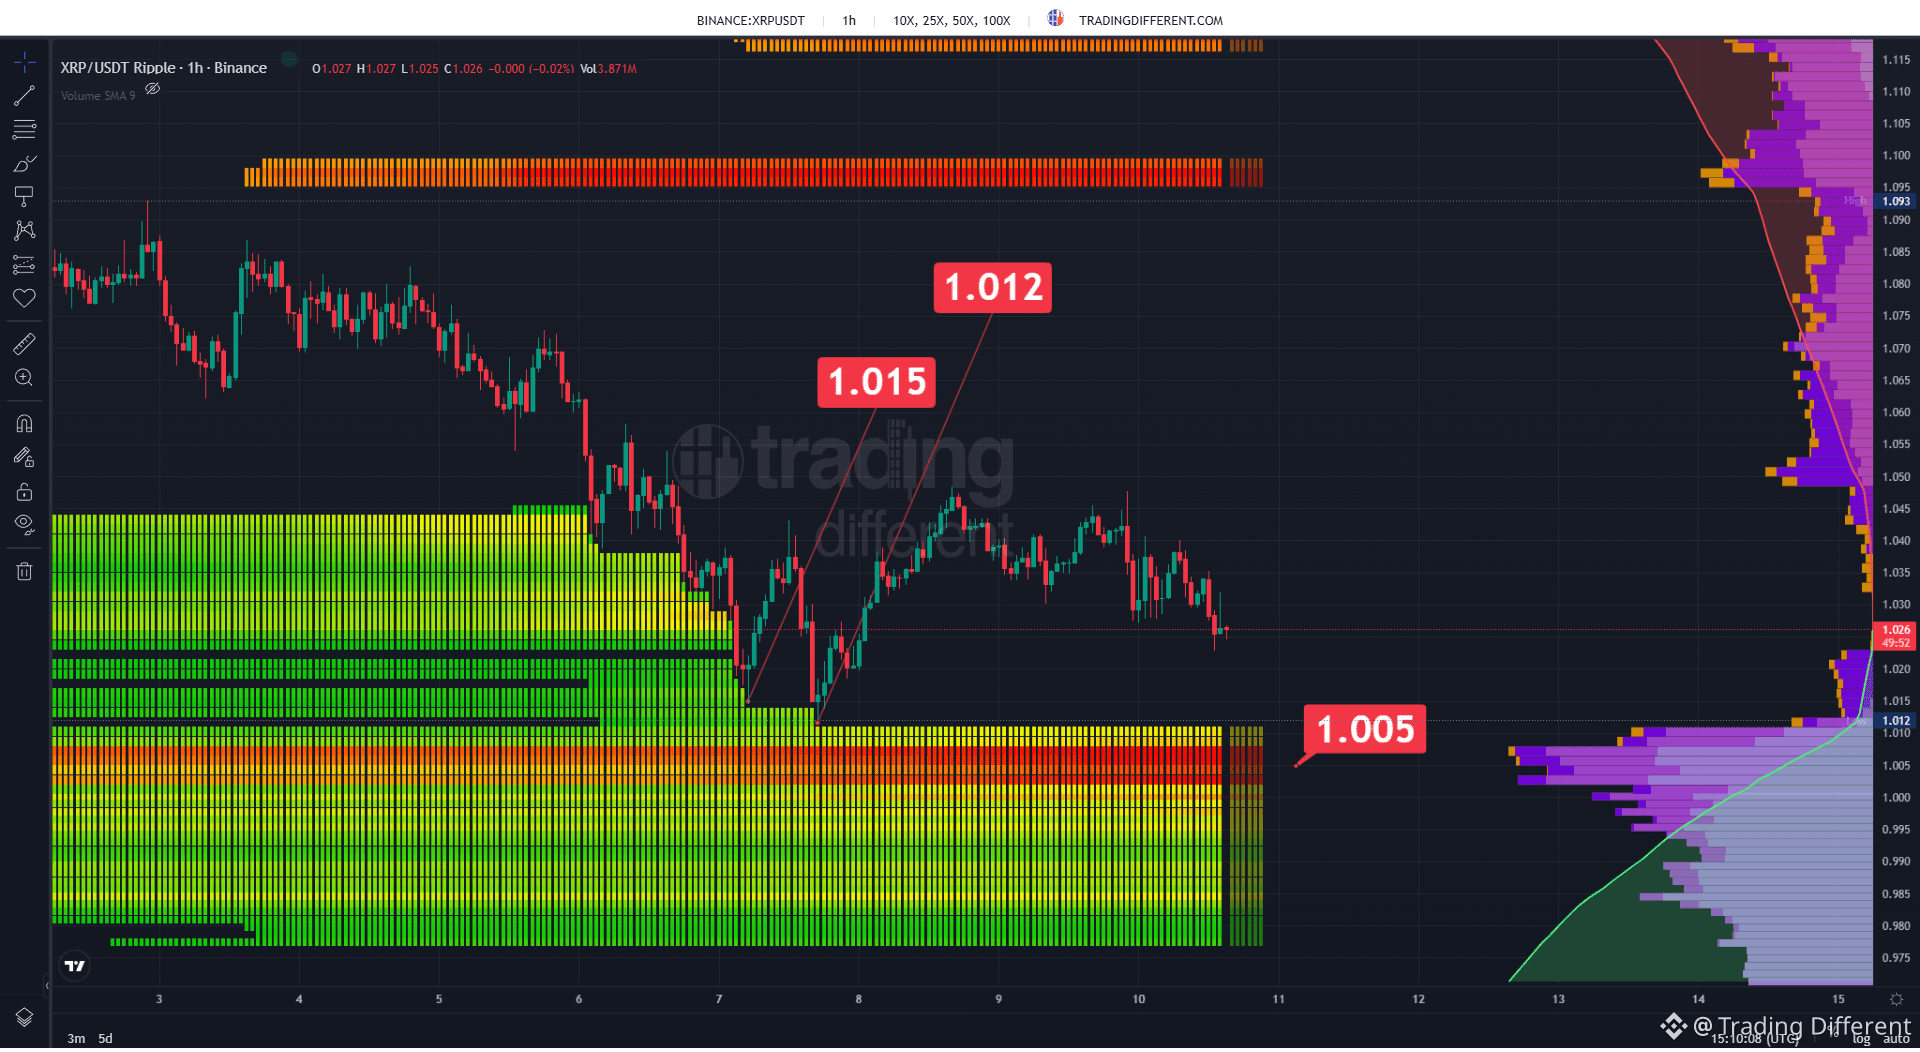
#xrp continues under bearish pressure and trades around 1.026, approaching again an important concentration of leveraged long positions.
Below, the 1.005 area concentrates the main liquidity block and could become the next target if selling pressure continues. Price previously reacted from this region, but longs are once again exposed to a new drop. Above, the first short liquidation zones appear around 1.05, while a much larger concentration remains near 1.09–1.10.
With XRP moving again toward lower liquidity, the reaction at 1.005 will be key to determining whether another bounce appears or whether a new cascade of long liquidations occurs.
https://tradingdifferent.com/es/dashboard/liquidation-heatmap?code=binance-square
Below, the 1.005 area concentrates the main liquidity block and could become the next target if selling pressure continues. Price previously reacted from this region, but longs are once again exposed to a new drop. Above, the first short liquidation zones appear around 1.05, while a much larger concentration remains near 1.09–1.10.
With XRP moving again toward lower liquidity, the reaction at 1.005 will be key to determining whether another bounce appears or whether a new cascade of long liquidations occurs.
https://tradingdifferent.com/es/dashboard/liquidation-heatmap?code=binance-square
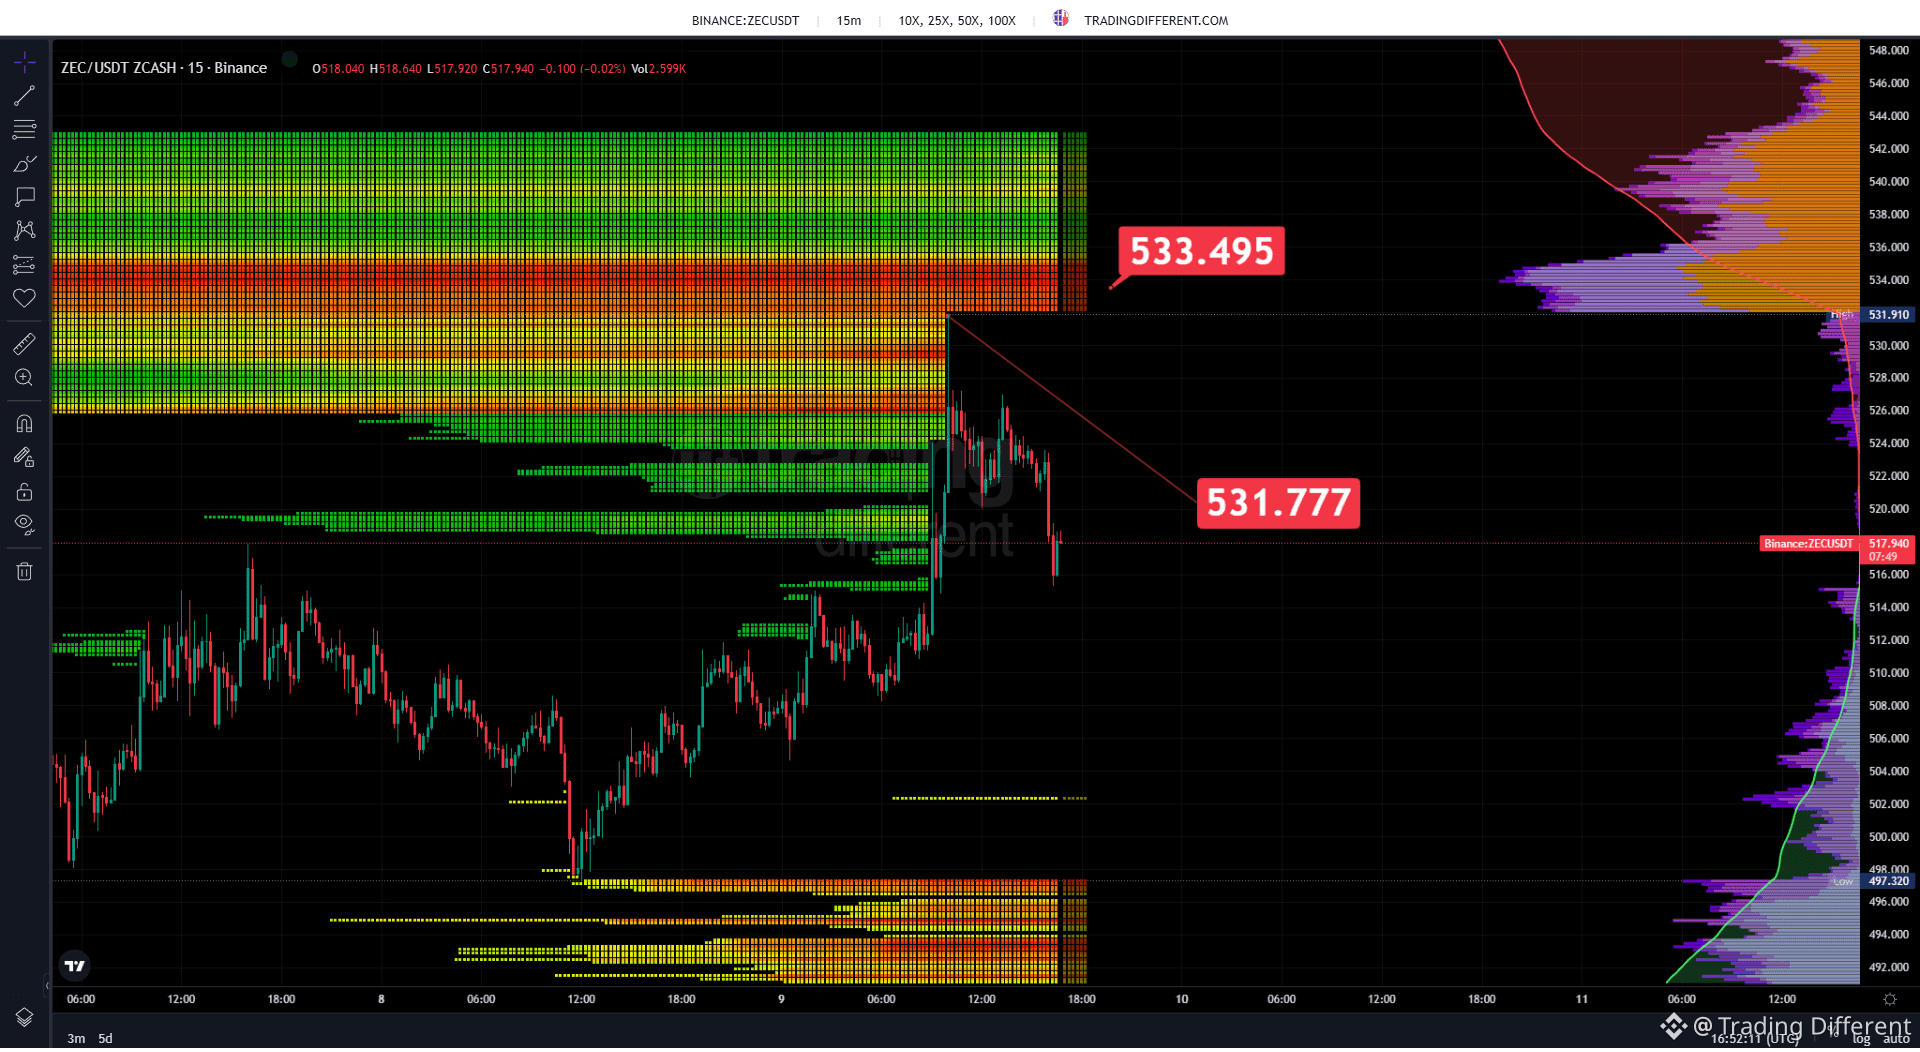
#zec backed off forcefully back into the 518 zone after a bullish impulse that pushed the price above 526, leaving again a significant concentration of liquidity above.
The 531.8–533.5 region concentrates a large block of leveraged short positions that remains exposed. If ZEC manages to regain momentum, that area could become the next target and trigger another cascade of short liquidations.
Below, the main concentrations of long positions are much farther away, around 497–492. After the current correction, attention shifts to whether the price can stabilize and once again attack the liquidity accumulated above 531.
https://tradingdifferent.com/es/dashboard/liquidation-heatmap?code=binance-square
The 531.8–533.5 region concentrates a large block of leveraged short positions that remains exposed. If ZEC manages to regain momentum, that area could become the next target and trigger another cascade of short liquidations.
Below, the main concentrations of long positions are much farther away, around 497–492. After the current correction, attention shifts to whether the price can stabilize and once again attack the liquidity accumulated above 531.
https://tradingdifferent.com/es/dashboard/liquidation-heatmap?code=binance-square
Log in to explore more content