

Eric SJ
3.5k Posts

Eric SJ
 Square Verified+
Report
Block User
推特@sjbtc9丨内容输出:美股相关(科普和财报分析)、二级市场技术分析、Web3项目观点

Creator Awards 2024

原创之星
65 Following
56.6K+ Followers
140.8K+ Liked
3 Badges
Posts
All
Quotes
Videos
Live
Trending
·
--

Article
Taking Binance Square as an example, let’s think about: What strategic value does a content community have for a platform?For an exchange, its product form is essentially a trading tool. At the peak of the domestic Internet era, someone once said: "A good product should be used and then gone."
However, when a platform has gone through the initial growth period of high expansion, especially when the industry is currently in the stage of transitioning from high growth to stock, good products should not be used and then gone.
So what strategic value does the Binance Square product have for Binance?
🗝️Article title
1. Discuss the rationality of Binance Square
2. Why is this a product moat that is difficult to replicate?
Taking Binance Square as an example, let’s think about: What strategic value does a content community have for a platform?
For an exchange, its product form is essentially a trading tool. At the peak of the domestic Internet era, someone once said: "A good product should be used and then gone."
However, when a platform has gone through the initial growth period of high expansion, especially when the industry is currently in the stage of transitioning from high growth to stock, good products should not be used and then gone.
So what strategic value does the Binance Square product have for Binance?
🗝️Article title
1. Discuss the rationality of Binance Square
2. Why is this a product moat that is difficult to replicate?
However, when a platform has gone through the initial growth period of high expansion, especially when the industry is currently in the stage of transitioning from high growth to stock, good products should not be used and then gone.
So what strategic value does the Binance Square product have for Binance?
🗝️Article title
1. Discuss the rationality of Binance Square
2. Why is this a product moat that is difficult to replicate?
44
13
922
3.3M
·
--
I know
Pump fun$PUMP is going to get criticized again
{future}(PUMPUSDT)
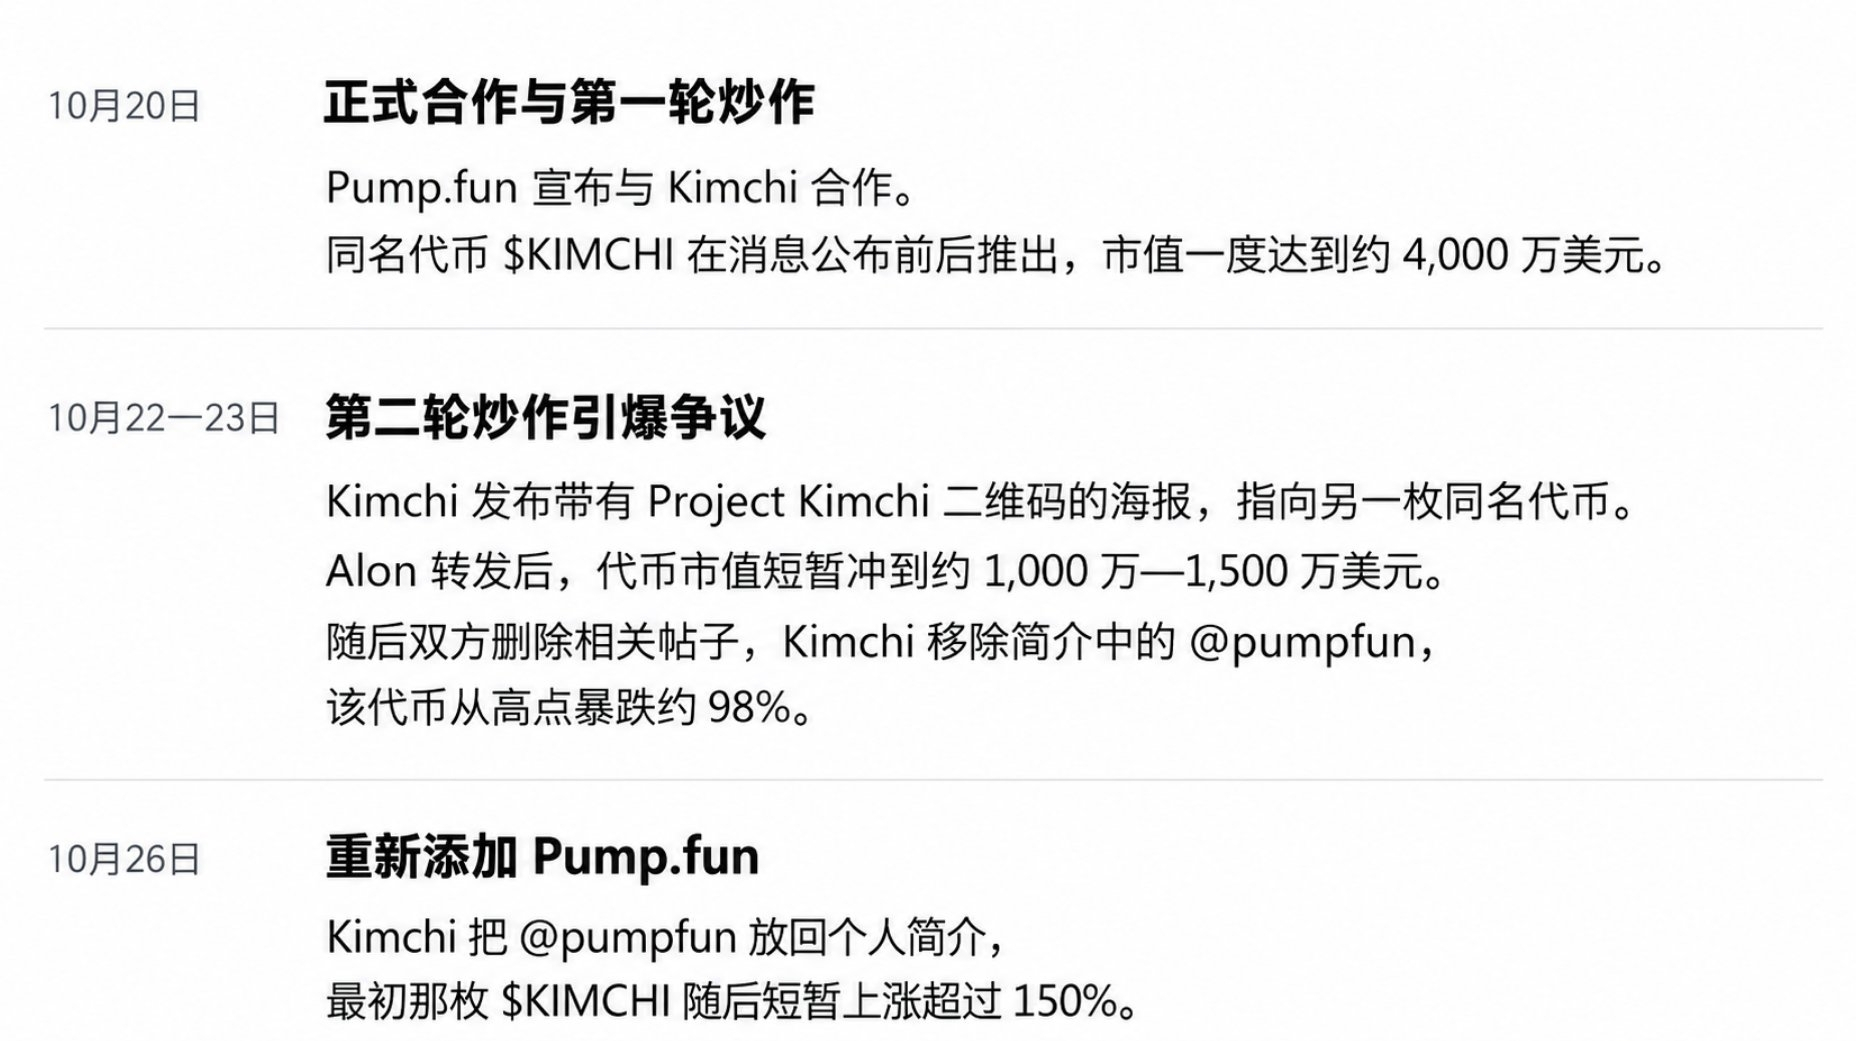
The collaboration between @pumpfun and @kimchi1x these past few days has gotten more and more bizarre.
Today, kimchi added pumpfun back to their bio.
To this day, I still don't know whether this farcical collaboration is over or if something just went wrong along the way 🤡
Here’s a line from a post by @FabianoSolana a few days ago:
“If you still support Pump Fun, I’ve completely lost respect for you.”
I know
Pump fun$PUMP is going to get criticized again
The collaboration between @pumpfun and @kimchi1x these past few days has gotten more and more bizarre.
Today, kimchi added pumpfun back to their bio.
To this day, I still don't know whether this farcical collaboration is over or if something just went wrong along the way 🤡
Here’s a line from a post by @FabianoSolana a few days ago:
“If you still support Pump Fun, I’ve completely lost respect for you.”
Pump fun$PUMP is going to get criticized again
The collaboration between @pumpfun and @kimchi1x these past few days has gotten more and more bizarre.
Today, kimchi added pumpfun back to their bio.
To this day, I still don't know whether this farcical collaboration is over or if something just went wrong along the way 🤡
Here’s a line from a post by @FabianoSolana a few days ago:
“If you still support Pump Fun, I’ve completely lost respect for you.”
1
1.7k
·
--
The Air Force has no idea what it's about to go through right now.
The Air Force has no idea what it's about to go through right now.
1
1
3
1k
·
--
Verified
Putting the financial reports aside
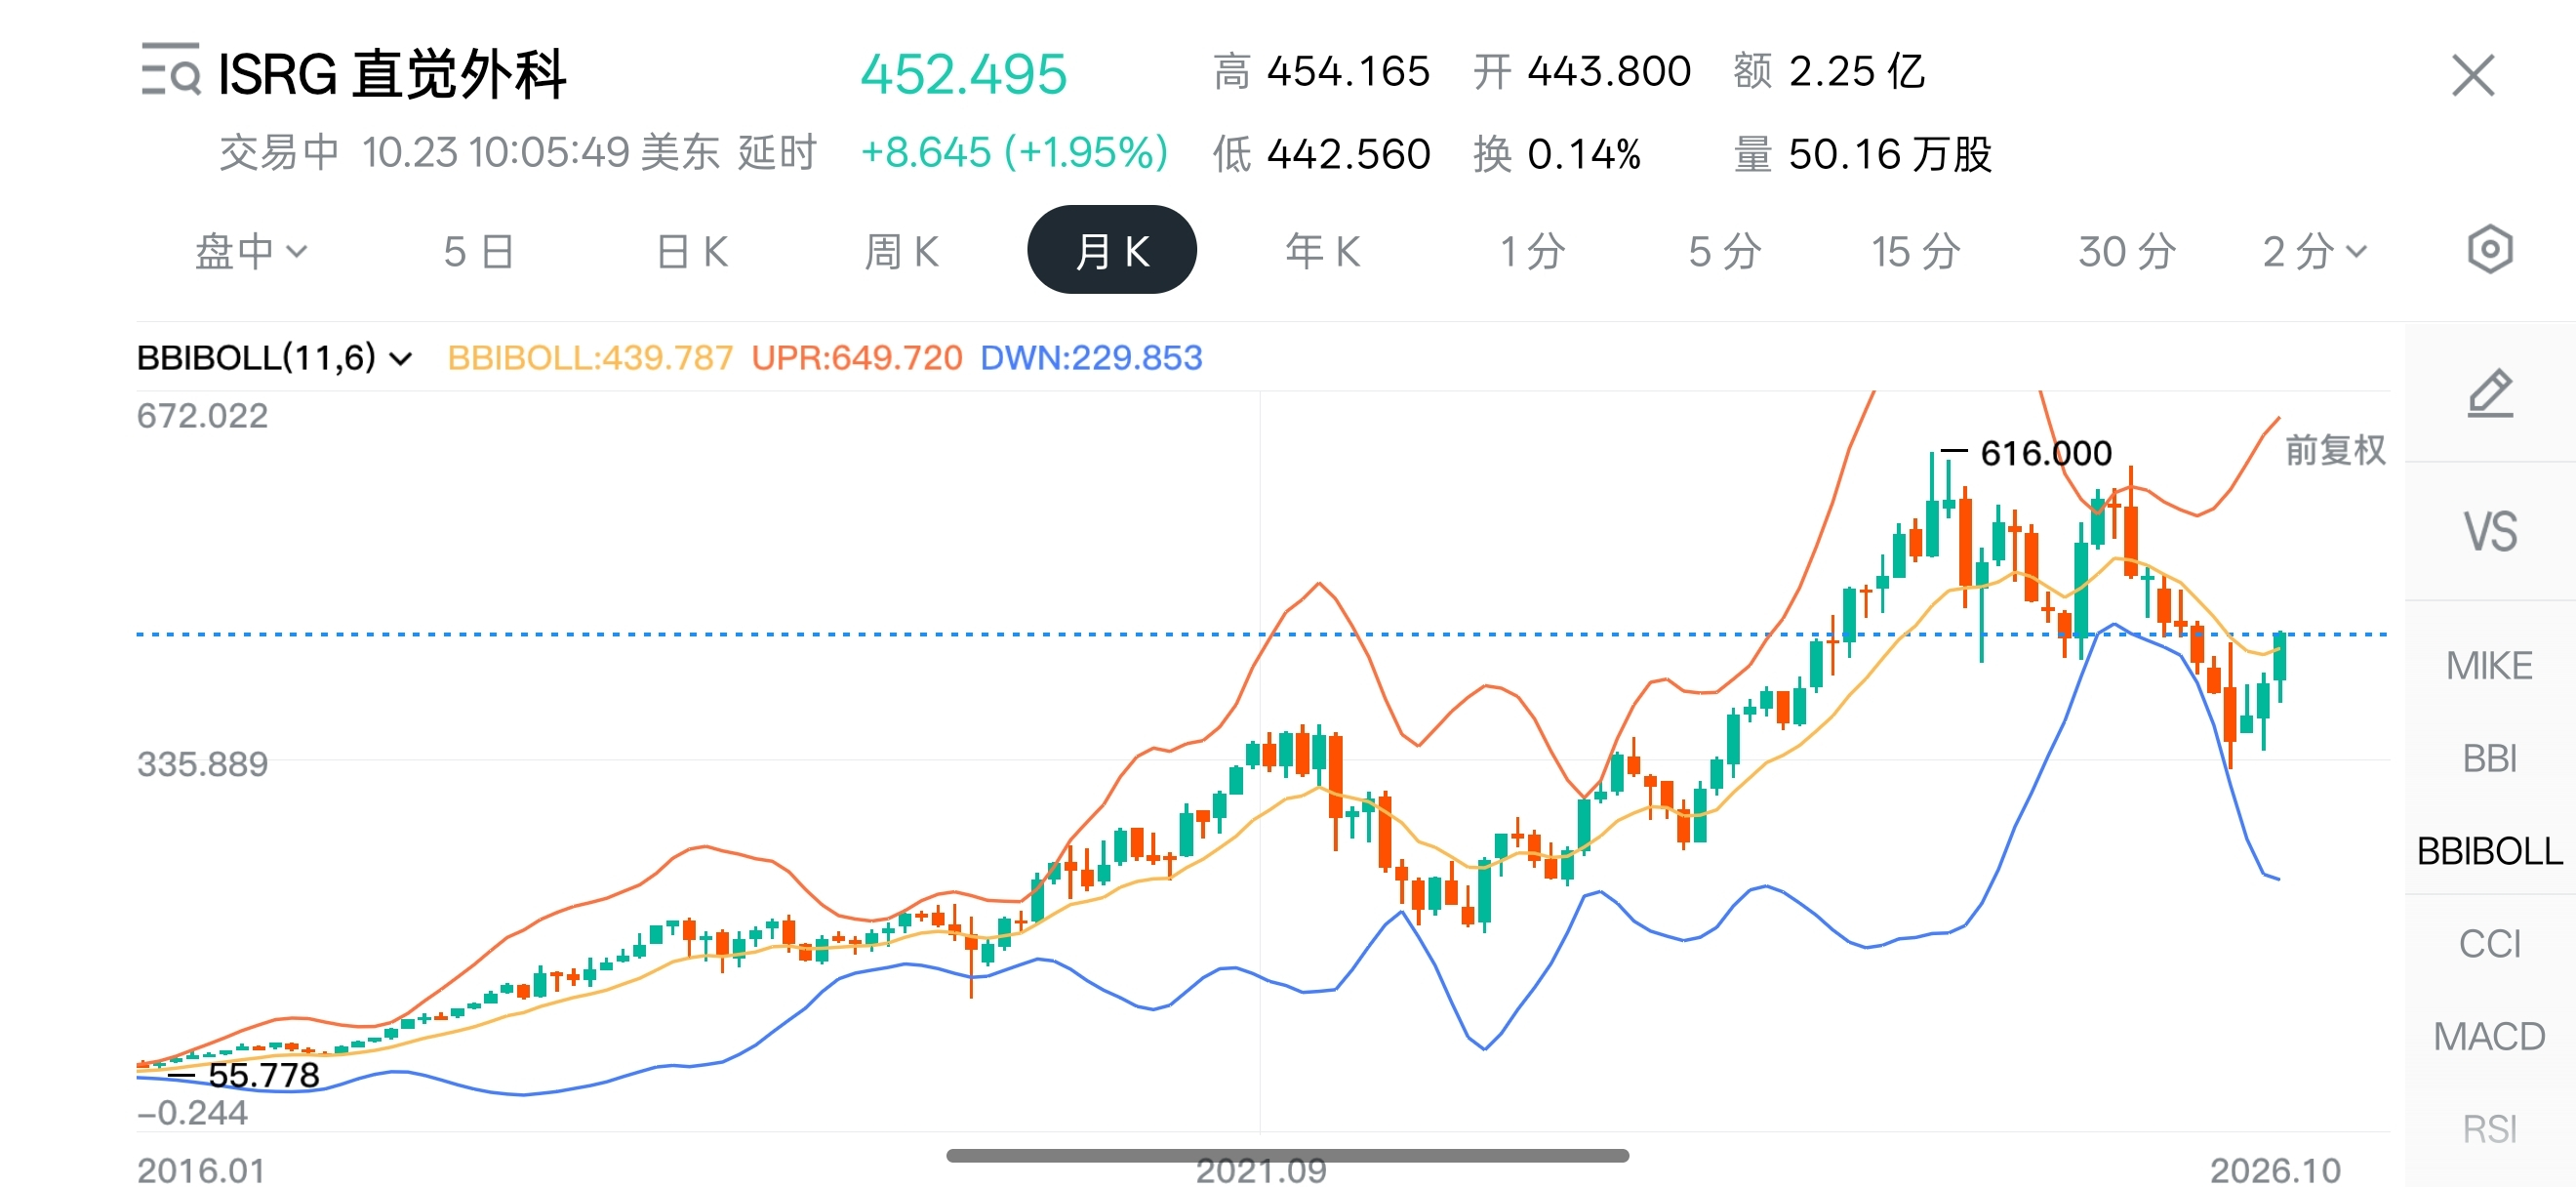
$ISRG.US is also a medical technology company well worth investing in for the long term
{stock_us}(ISRG.US)
1. Its business model is stable and clear
2. Its competitive moat deepens as the market grows
3. The development of AI will also give this company an even greater advantage
Its surgical robot was developed before the boom in large AI models
Previously, the robot mainly helped doctors perform surgeries with greater precision and consistency
But with the support of today’s AI, it can make robots easier for doctors to learn and use, encouraging more hospitals and doctors to perform robotic surgeries
It can also improve the utilization of existing equipment, giving each robot the opportunity to perform more surgeries
Lower barriers to entry = more customers
More surgeries = more consumables
It can attack when advancing and defend when retreating—either way, it wins
#股票财报季
Putting the financial reports aside
$ISRG.US is also a medical technology company well worth investing in for the long term
1. Its business model is stable and clear
2. Its competitive moat deepens as the market grows
3. The development of AI will also give this company an even greater advantage
Its surgical robot was developed before the boom in large AI models
Previously, the robot mainly helped doctors perform surgeries with greater precision and consistency
But with the support of today’s AI, it can make robots easier for doctors to learn and use, encouraging more hospitals and doctors to perform robotic surgeries
It can also improve the utilization of existing equipment, giving each robot the opportunity to perform more surgeries
Lower barriers to entry = more customers
More surgeries = more consumables
It can attack when advancing and defend when retreating—either way, it wins
#股票财报季
$ISRG.US is also a medical technology company well worth investing in for the long term
1. Its business model is stable and clear
2. Its competitive moat deepens as the market grows
3. The development of AI will also give this company an even greater advantage
Its surgical robot was developed before the boom in large AI models
Previously, the robot mainly helped doctors perform surgeries with greater precision and consistency
But with the support of today’s AI, it can make robots easier for doctors to learn and use, encouraging more hospitals and doctors to perform robotic surgeries
It can also improve the utilization of existing equipment, giving each robot the opportunity to perform more surgeries
Lower barriers to entry = more customers
More surgeries = more consumables
It can attack when advancing and defend when retreating—either way, it wins
#股票财报季
Eric SJ
·
--
Intuitive Surgical is voluntarily cutting prices—what’s the strategy?
A company that gets nearly 60% of its revenue from surgical instruments and consumables is actually preparing to voluntarily reduce the consumables revenue it earns per procedure.
This is what Intuitive Surgical $ISRG.US disclosed during its latest earnings call.
According to management:
“Once the next round of instrument pricing adjustments and policy-driven price reductions in China have been fully implemented, revenue from instruments and accessories per da Vinci (our flagship product) procedure is expected to decline by approximately 3%–5%, assuming the mix of procedures, geographies, and products remains unchanged.”
If you understand Intuitive Surgical’s business model, you’ll know that its most profitable business isn’t simply selling robots to hospitals. The bulk of its profits comes from the services and consumables that follow.
This is what Intuitive Surgical $ISRG.US disclosed during its latest earnings call.
According to management:
“Once the next round of instrument pricing adjustments and policy-driven price reductions in China have been fully implemented, revenue from instruments and accessories per da Vinci (our flagship product) procedure is expected to decline by approximately 3%–5%, assuming the mix of procedures, geographies, and products remains unchanged.”
If you understand Intuitive Surgical’s business model, you’ll know that its most profitable business isn’t simply selling robots to hospitals. The bulk of its profits comes from the services and consumables that follow.
ISRGUS+0.92%
6
1.8k
·
--
Bitcoin $BTC can't fall any further
If you don't cash in your short today,
you'll have to take out a nude loan tomorrow.
Bitcoin $BTC can't fall any further
If you don't cash in your short today,
you'll have to take out a nude loan tomorrow.
If you don't cash in your short today,
you'll have to take out a nude loan tomorrow.
6
8
1.6k
·
--
Verified
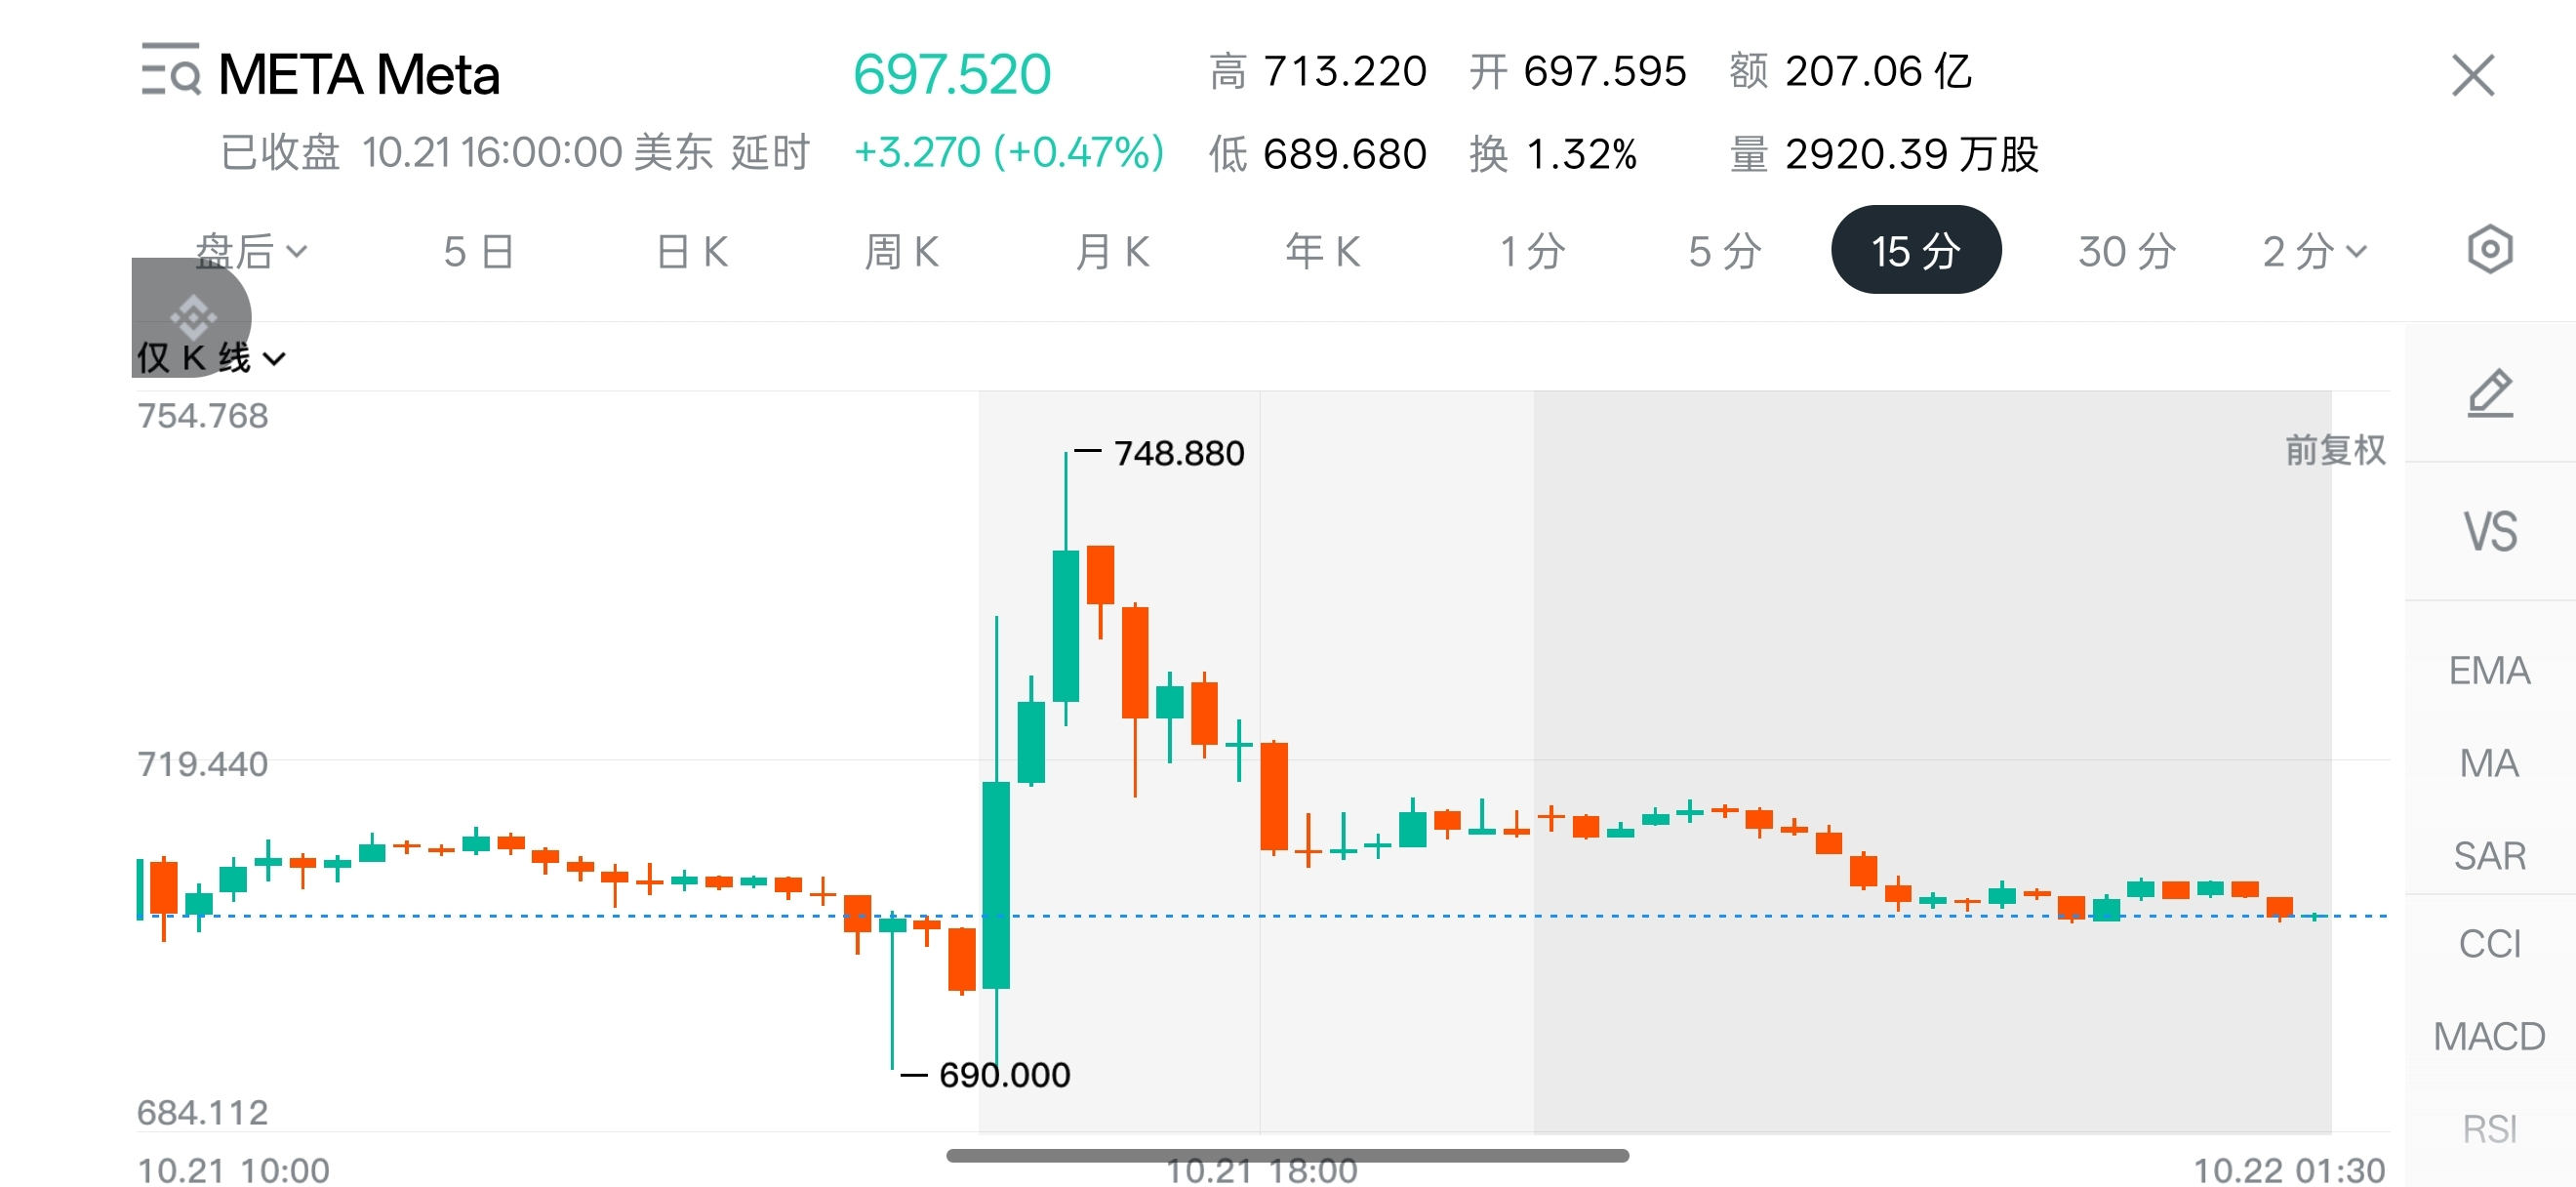
At this point, the gains after $META 's earnings are almost completely wiped out
A quick aside
The market is no longer as bullish on AI as it was before; attention is shifting back to tech stocks themselves
Most other tech giants have a clear, easy-to-understand core business, but Meta's is rather vague
The last time Meta's story felt “sexy” to me was when it changed its name. Unfortunately, the metaverse has yet to prove itself (or perhaps it was simply too far ahead of its time)
Since then, it has made bets in several areas, including virtual reality, AI glasses, large language models, and AI agents
But so far, none of them have really taken off
The vast majority of Meta's revenue today comes from advertising
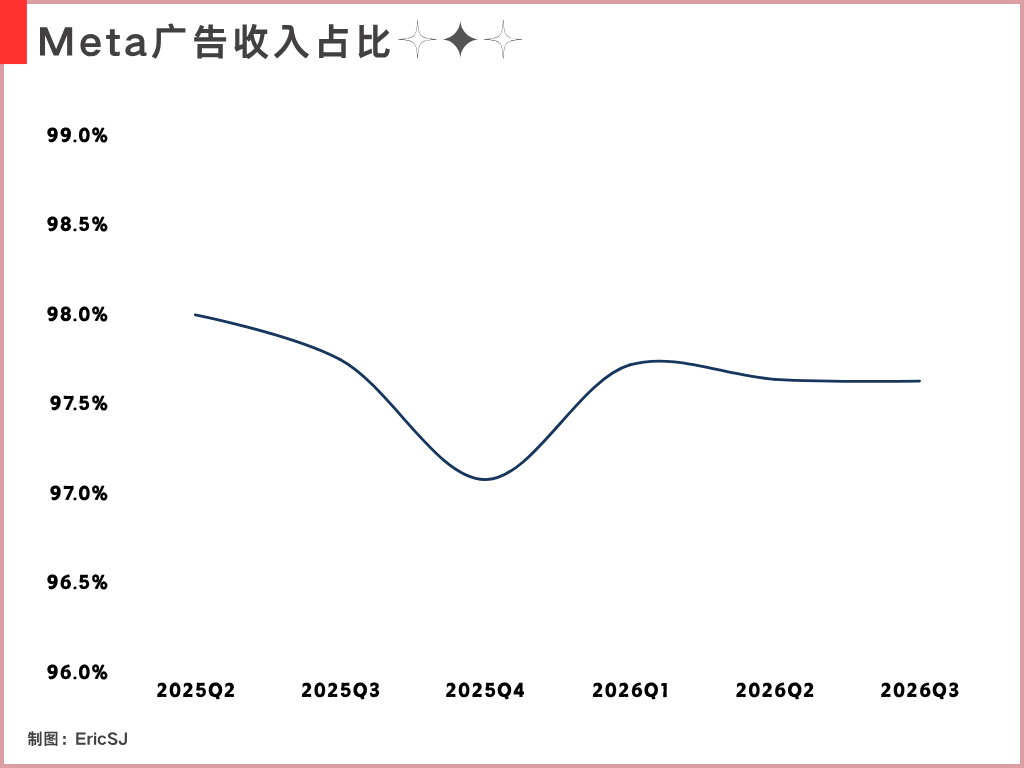
This was especially clear in its recently released Q3 earnings report: advertising accounted for nearly 98% of Meta's total revenue
Looking at Meta's revenue mix over the past six quarters, this share has barely fluctuated. In Q3, it fell by just 0.12 percentage points
Although Google earns more from advertising, Meta is undoubtedly more reliant on this business and is therefore more vulnerable to platform rules (in its annual report last year, it explicitly listed its reliance on third-party platforms such as Android and iOS as a significant business risk)
Perhaps it's also because Meta's products just don't really resonate with me compared with those of other tech giants
So in my eyes, although it's a very profitable advertising company, Meta still feels like the most ordinary of the major tech giants
#股票财报季
At this point, the gains after $META 's earnings are almost completely wiped out
A quick aside
The market is no longer as bullish on AI as it was before; attention is shifting back to tech stocks themselves
Most other tech giants have a clear, easy-to-understand core business, but Meta's is rather vague
The last time Meta's story felt “sexy” to me was when it changed its name. Unfortunately, the metaverse has yet to prove itself (or perhaps it was simply too far ahead of its time)
Since then, it has made bets in several areas, including virtual reality, AI glasses, large language models, and AI agents
But so far, none of them have really taken off
The vast majority of Meta's revenue today comes from advertising
This was especially clear in its recently released Q3 earnings report: advertising accounted for nearly 98% of Meta's total revenue
Looking at Meta's revenue mix over the past six quarters, this share has barely fluctuated. In Q3, it fell by just 0.12 percentage points
Although Google earns more from advertising, Meta is undoubtedly more reliant on this business and is therefore more vulnerable to platform rules (in its annual report last year, it explicitly listed its reliance on third-party platforms such as Android and iOS as a significant business risk)
Perhaps it's also because Meta's products just don't really resonate with me compared with those of other tech giants
So in my eyes, although it's a very profitable advertising company, Meta still feels like the most ordinary of the major tech giants
#股票财报季
A quick aside
The market is no longer as bullish on AI as it was before; attention is shifting back to tech stocks themselves
Most other tech giants have a clear, easy-to-understand core business, but Meta's is rather vague
The last time Meta's story felt “sexy” to me was when it changed its name. Unfortunately, the metaverse has yet to prove itself (or perhaps it was simply too far ahead of its time)
Since then, it has made bets in several areas, including virtual reality, AI glasses, large language models, and AI agents
But so far, none of them have really taken off
The vast majority of Meta's revenue today comes from advertising
This was especially clear in its recently released Q3 earnings report: advertising accounted for nearly 98% of Meta's total revenue
Looking at Meta's revenue mix over the past six quarters, this share has barely fluctuated. In Q3, it fell by just 0.12 percentage points
Although Google earns more from advertising, Meta is undoubtedly more reliant on this business and is therefore more vulnerable to platform rules (in its annual report last year, it explicitly listed its reliance on third-party platforms such as Android and iOS as a significant business risk)
Perhaps it's also because Meta's products just don't really resonate with me compared with those of other tech giants
So in my eyes, although it's a very profitable advertising company, Meta still feels like the most ordinary of the major tech giants
#股票财报季
32
24.3k
·
--
Verified

Article
Intuitive Surgical is voluntarily cutting prices—what’s the strategy?A company that gets nearly 60% of its revenue from surgical instruments and consumables is actually preparing to voluntarily reduce the consumables revenue it earns per procedure.
This is what Intuitive Surgical $ISRG.US disclosed during its latest earnings call.
According to management:
“Once the next round of instrument pricing adjustments and policy-driven price reductions in China have been fully implemented, revenue from instruments and accessories per da Vinci (our flagship product) procedure is expected to decline by approximately 3%–5%, assuming the mix of procedures, geographies, and products remains unchanged.”
If you understand Intuitive Surgical’s business model, you’ll know that its most profitable business isn’t simply selling robots to hospitals. The bulk of its profits comes from the services and consumables that follow.
Intuitive Surgical is voluntarily cutting prices—what’s the strategy?
A company that gets nearly 60% of its revenue from surgical instruments and consumables is actually preparing to voluntarily reduce the consumables revenue it earns per procedure.
This is what Intuitive Surgical $ISRG.US disclosed during its latest earnings call.
According to management:
“Once the next round of instrument pricing adjustments and policy-driven price reductions in China have been fully implemented, revenue from instruments and accessories per da Vinci (our flagship product) procedure is expected to decline by approximately 3%–5%, assuming the mix of procedures, geographies, and products remains unchanged.”
If you understand Intuitive Surgical’s business model, you’ll know that its most profitable business isn’t simply selling robots to hospitals. The bulk of its profits comes from the services and consumables that follow.
This is what Intuitive Surgical $ISRG.US disclosed during its latest earnings call.
According to management:
“Once the next round of instrument pricing adjustments and policy-driven price reductions in China have been fully implemented, revenue from instruments and accessories per da Vinci (our flagship product) procedure is expected to decline by approximately 3%–5%, assuming the mix of procedures, geographies, and products remains unchanged.”
If you understand Intuitive Surgical’s business model, you’ll know that its most profitable business isn’t simply selling robots to hospitals. The bulk of its profits comes from the services and consumables that follow.
ISRGUS+0.92%
1
2
2.1k
·
--
Recently, 𝕏 has been acting weird.
Blue-check subscriptions are taking a long time to get approved.
They used to show up within an hour.
So now, when I see projects on-chain whose Twitter accounts don't have a subscription checkmark, I wait and watch for a while first.
That’s saved me quite a bit of money lately.
Recently, 𝕏 has been acting weird.
Blue-check subscriptions are taking a long time to get approved.
They used to show up within an hour.
So now, when I see projects on-chain whose Twitter accounts don't have a subscription checkmark, I wait and watch for a while first.
That’s saved me quite a bit of money lately.
Blue-check subscriptions are taking a long time to get approved.
They used to show up within an hour.
So now, when I see projects on-chain whose Twitter accounts don't have a subscription checkmark, I wait and watch for a while first.
That’s saved me quite a bit of money lately.
1
4
1.5k
·
--
Verified
Boss, is looking at financial reports really useful at this stage when we’re buying $SPCX ?
{future}(SPCXUSDT)
I’ve seen a lot of people discussing its latest financial report, especially the fact that revenue from its AI business surged 830% year over year.
To be sure, by its second earnings report after going public, SpaceX had already turned profitable.
The numbers are certainly impressive.
But at least at this stage, I don’t think SpaceX’s investment value has much to do with how much it earns in any given quarter.
There are plenty of companies on the market that make more money and have higher profit margins.
Why is the market willing to give SpaceX such a high valuation?
So we should focus more on whether the reasons underpinning the company’s high valuation have actually been validated.
SpaceX already has several businesses generating real revenue,
to the point that many people have lost sight of its original core narrative.
In a nutshell, the question is whether SpaceX, under Musk’s leadership, can reduce the cost of reaching space enough to give rise to a whole range of new commercial markets.
If you’re going to follow the business, Starship is actually the area that most needs to be tracked over the long term in its financial reports.
Whether it’s expanding the Starlink network or deploying AI data centers in space, a lot of equipment needs to be sent into orbit.
If every launch comes at a high cost, the scale of these businesses will be limited.
Getting something into space and being able to do it repeatedly, at a sufficiently low cost and high frequency, are two entirely different things.
That’s the key to the [space infrastructure operator] narrative.
➠ In late September, Starship completed its first orbital flight, deploying 26 V3 Starlink satellites in a single launch.
Starship hasn’t yet reached the point where it can validate the core narrative; it has only demonstrated that it can reliably deliver actual commercial payloads.
Musk also said on the earnings call that the next Starship test flight would attempt to successfully recover both the rocket’s first-stage booster and its second-stage spacecraft.
So, looking again at the growth in the AI business reported this time,
it shows that SpaceX can make money from the AI market, but it has little to do with the main story of space transportation.
In fact, this is precisely what I think we should be most careful not to conflate.
#股票财报季
Boss, is looking at financial reports really useful at this stage when we’re buying $SPCX ?
I’ve seen a lot of people discussing its latest financial report, especially the fact that revenue from its AI business surged 830% year over year.
To be sure, by its second earnings report after going public, SpaceX had already turned profitable.
The numbers are certainly impressive.
But at least at this stage, I don’t think SpaceX’s investment value has much to do with how much it earns in any given quarter.
There are plenty of companies on the market that make more money and have higher profit margins.
Why is the market willing to give SpaceX such a high valuation?
So we should focus more on whether the reasons underpinning the company’s high valuation have actually been validated.
SpaceX already has several businesses generating real revenue,
to the point that many people have lost sight of its original core narrative.
In a nutshell, the question is whether SpaceX, under Musk’s leadership, can reduce the cost of reaching space enough to give rise to a whole range of new commercial markets.
If you’re going to follow the business, Starship is actually the area that most needs to be tracked over the long term in its financial reports.
Whether it’s expanding the Starlink network or deploying AI data centers in space, a lot of equipment needs to be sent into orbit.
If every launch comes at a high cost, the scale of these businesses will be limited.
Getting something into space and being able to do it repeatedly, at a sufficiently low cost and high frequency, are two entirely different things.
That’s the key to the [space infrastructure operator] narrative.
➠ In late September, Starship completed its first orbital flight, deploying 26 V3 Starlink satellites in a single launch.
Starship hasn’t yet reached the point where it can validate the core narrative; it has only demonstrated that it can reliably deliver actual commercial payloads.
Musk also said on the earnings call that the next Starship test flight would attempt to successfully recover both the rocket’s first-stage booster and its second-stage spacecraft.
So, looking again at the growth in the AI business reported this time,
it shows that SpaceX can make money from the AI market, but it has little to do with the main story of space transportation.
In fact, this is precisely what I think we should be most careful not to conflate.
#股票财报季
I’ve seen a lot of people discussing its latest financial report, especially the fact that revenue from its AI business surged 830% year over year.
To be sure, by its second earnings report after going public, SpaceX had already turned profitable.
The numbers are certainly impressive.
But at least at this stage, I don’t think SpaceX’s investment value has much to do with how much it earns in any given quarter.
There are plenty of companies on the market that make more money and have higher profit margins.
Why is the market willing to give SpaceX such a high valuation?
So we should focus more on whether the reasons underpinning the company’s high valuation have actually been validated.
SpaceX already has several businesses generating real revenue,
to the point that many people have lost sight of its original core narrative.
In a nutshell, the question is whether SpaceX, under Musk’s leadership, can reduce the cost of reaching space enough to give rise to a whole range of new commercial markets.
If you’re going to follow the business, Starship is actually the area that most needs to be tracked over the long term in its financial reports.
Whether it’s expanding the Starlink network or deploying AI data centers in space, a lot of equipment needs to be sent into orbit.
If every launch comes at a high cost, the scale of these businesses will be limited.
Getting something into space and being able to do it repeatedly, at a sufficiently low cost and high frequency, are two entirely different things.
That’s the key to the [space infrastructure operator] narrative.
➠ In late September, Starship completed its first orbital flight, deploying 26 V3 Starlink satellites in a single launch.
Starship hasn’t yet reached the point where it can validate the core narrative; it has only demonstrated that it can reliably deliver actual commercial payloads.
Musk also said on the earnings call that the next Starship test flight would attempt to successfully recover both the rocket’s first-stage booster and its second-stage spacecraft.
So, looking again at the growth in the AI business reported this time,
it shows that SpaceX can make money from the AI market, but it has little to do with the main story of space transportation.
In fact, this is precisely what I think we should be most careful not to conflate.
#股票财报季
2
17
25.8k
·
--
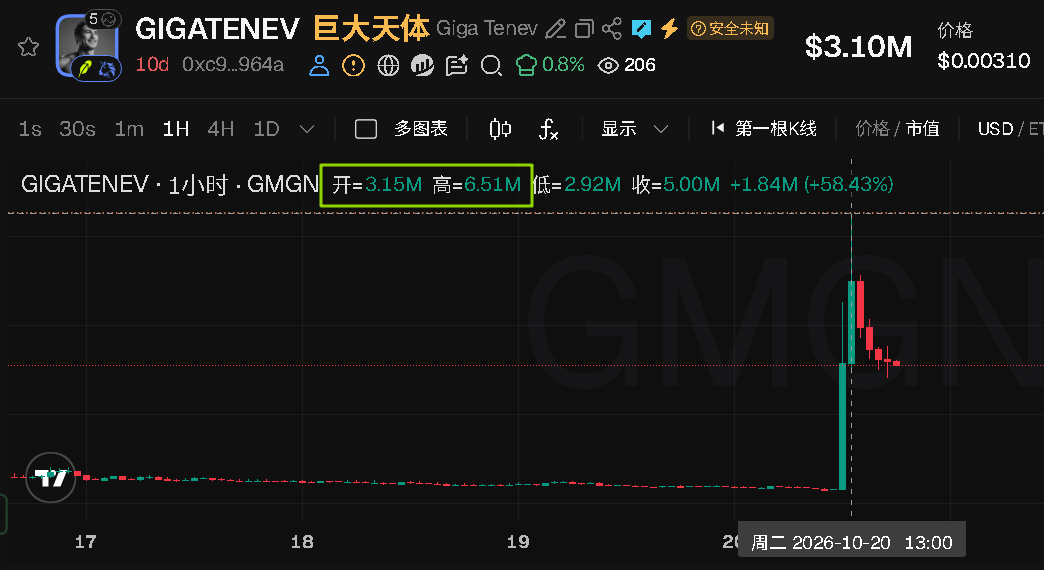
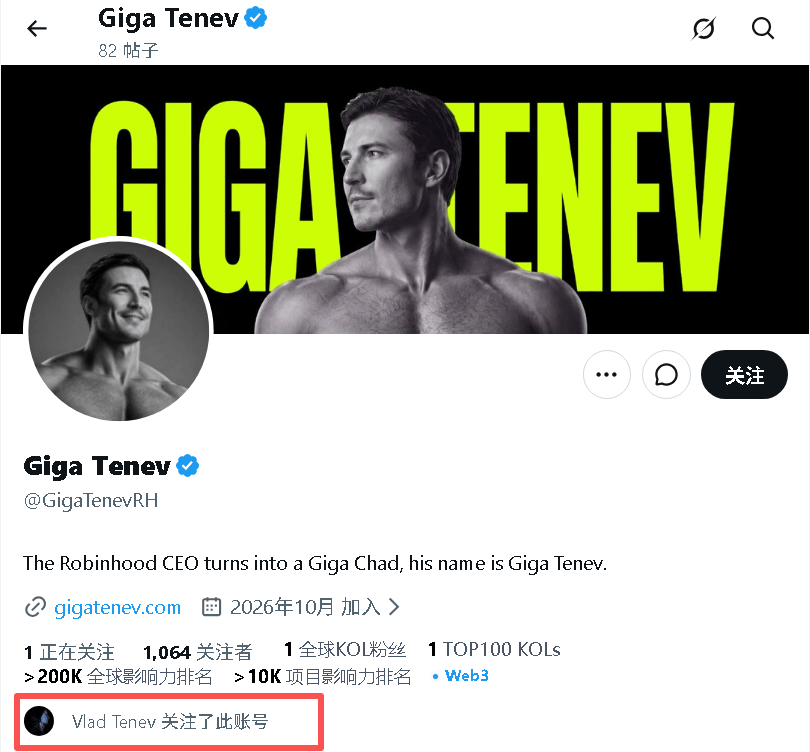
RH chain @vladtenev — one follow, whether it was intentional or just a fat-finger.
And just like that, it went from 300k to 6.5M.
So,
Robinhood can’t possibly do nothing in the final quarter of this year, right?
$PONS has really got me bagholding to the point where I can barely take it anymore.
“Waiting for the storm”
RH chain @vladtenev — one follow, whether it was intentional or just a fat-finger.
And just like that, it went from 300k to 6.5M.
So,
Robinhood can’t possibly do nothing in the final quarter of this year, right?
$PONS has really got me bagholding to the point where I can barely take it anymore.
“Waiting for the storm”
And just like that, it went from 300k to 6.5M.
So,
Robinhood can’t possibly do nothing in the final quarter of this year, right?
$PONS has really got me bagholding to the point where I can barely take it anymore.
“Waiting for the storm”
5
4.6k
·
--
Verified
Musk will be handing out tens of billions of dollars next year???
Interesting.
SpaceX is releasing its financial results tomorrow.
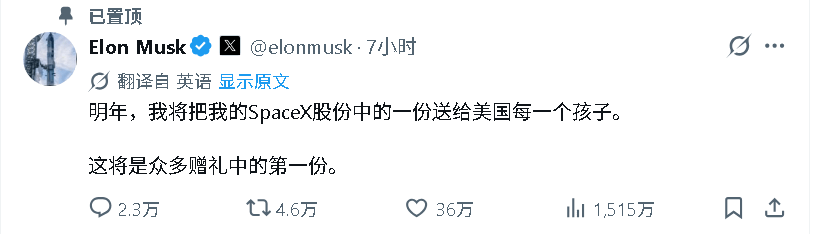
At this point, Musk announced that next year he’ll collectively airdrop one share of $SPCX to American children (possibly meaning anyone under 18?). What does this mean?
It’s estimated that there are about 72 million U.S. residents under the age of 18.
At the current price, the shares being distributed are worth over $10 billion.
It looks like a giveaway, but really it’s telling the market, “Guys, next year I’m effectively locking up some of my $SPCX shares.”
➠ (New rules announced by the U.S. Treasury on September 30, 2026, allow eligible stocks to be donated directly into children’s investment accounts, subject to a specific minimum holding period.)
I used AI to look up these rules. For eligible stocks contributed directly to these accounts, the minimum holding period lasts until whichever of these two dates comes first:
(1) Five years after the stock enters the account
(2) The account holder turns 18
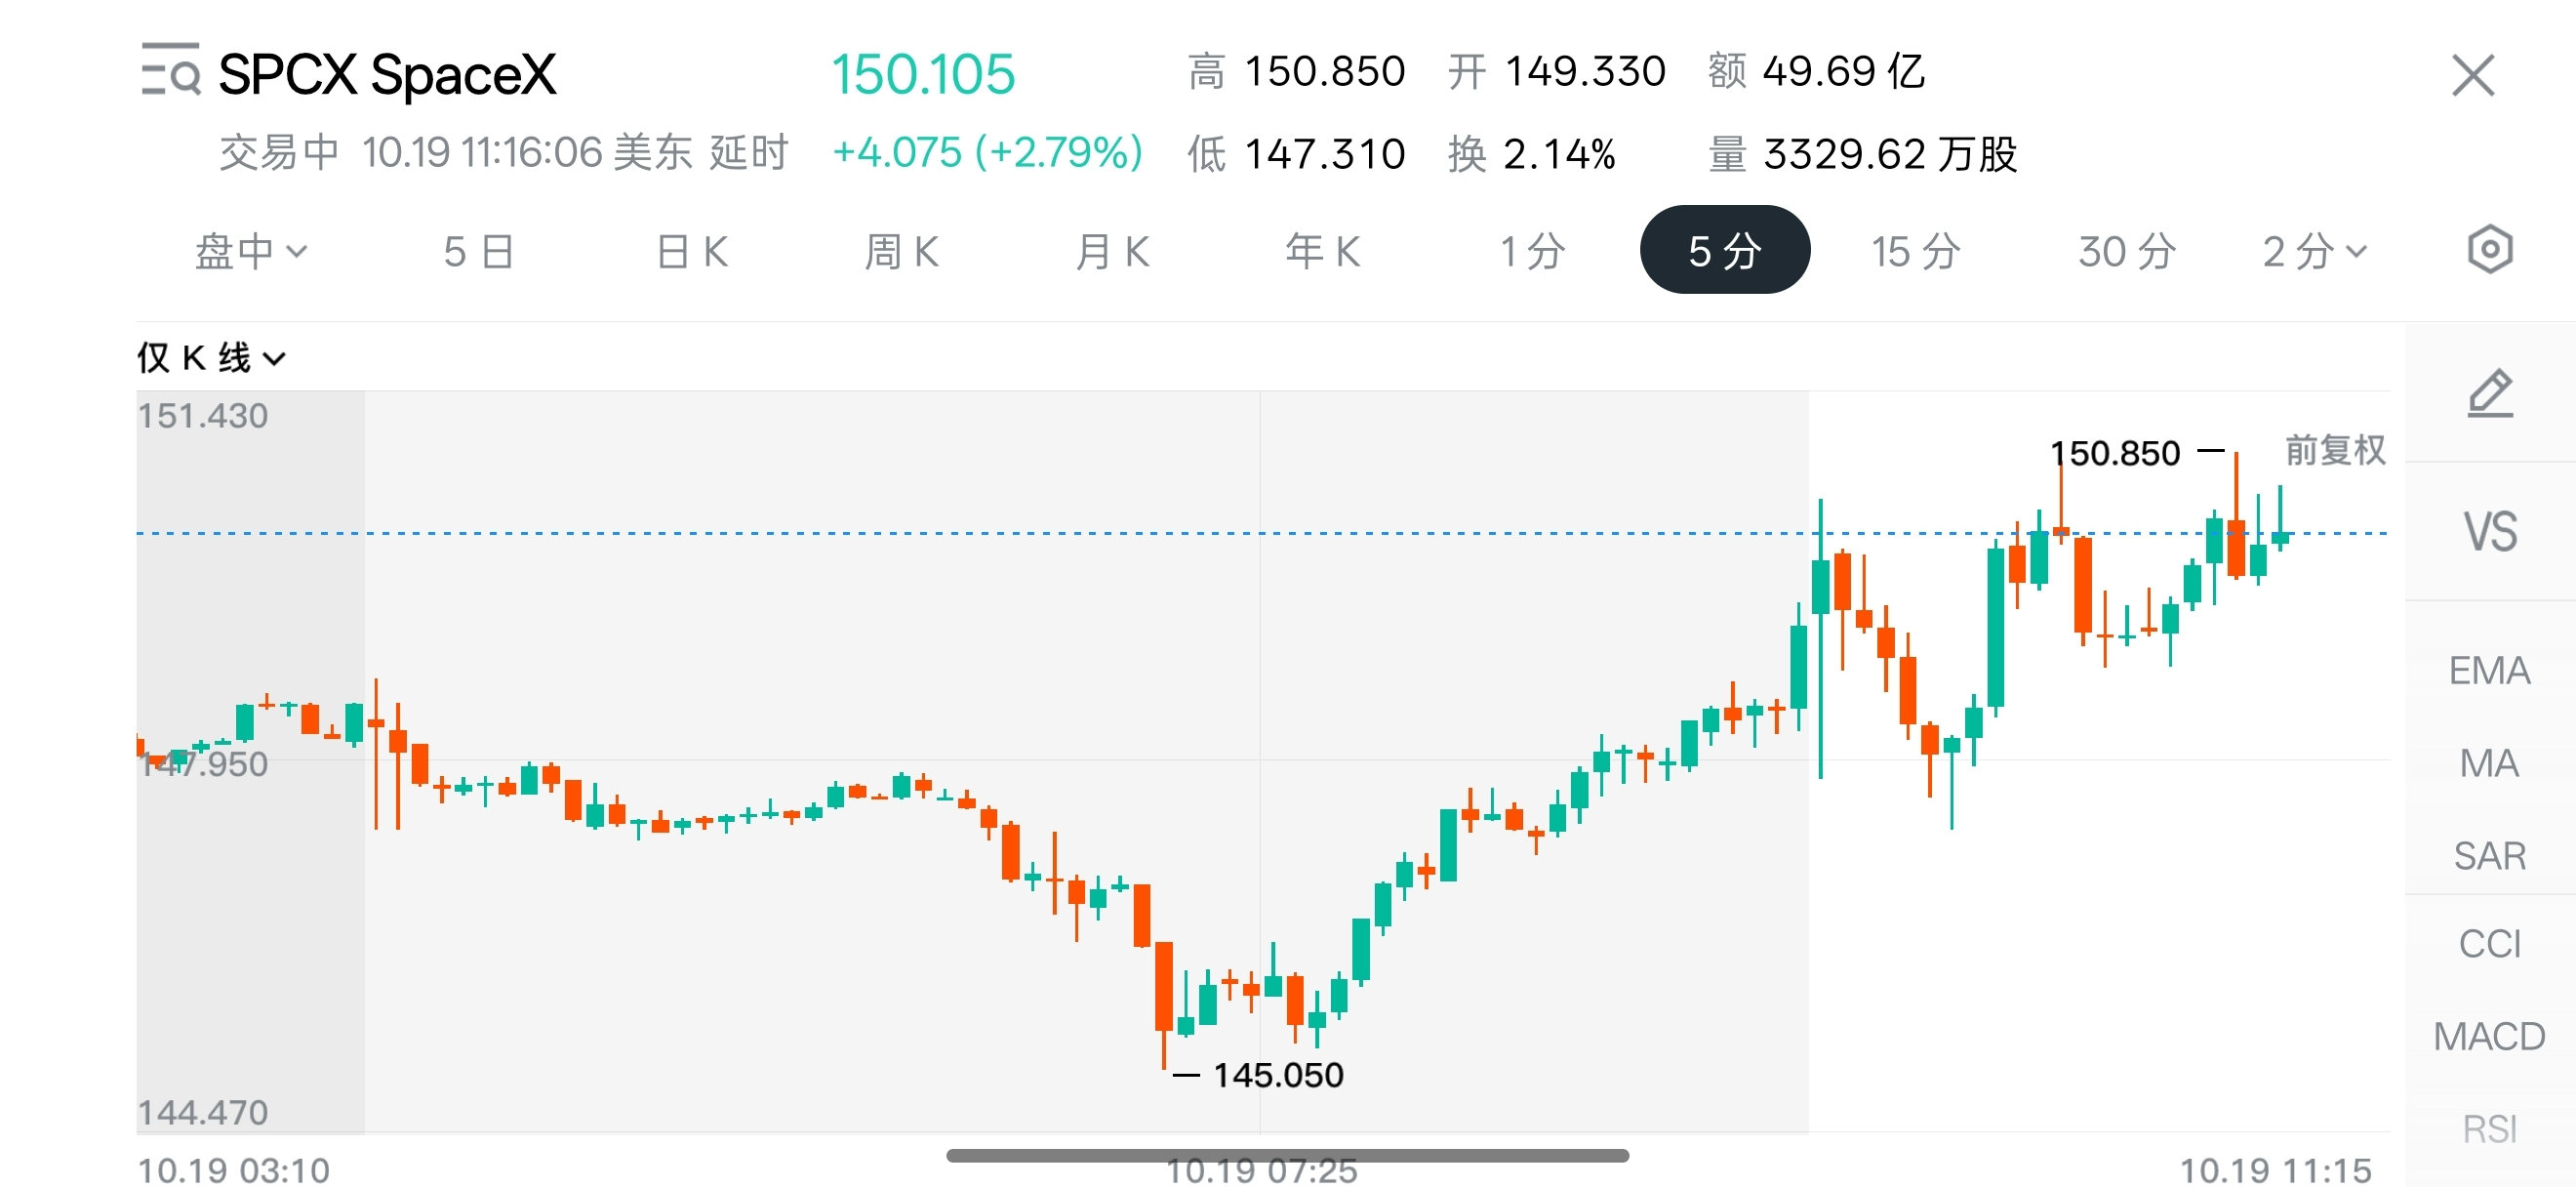
Thanks to this news, SPCX is temporarily trending upward today.
However, based on Musk’s personal ownership stake, even if the shares are distributed to 72 million people, it would amount to less than 2% of his personal holdings.
So, looking at it purely from a trading perspective, I don’t think this is a lockup measure substantial enough to noticeably drive up SpaceX’s share price.
But because the airdrop is so broad, it will also greatly expand SpaceX’s long-term influence among ordinary American families.
Could think of it as spending tens of billions on a long-term brand-awareness campaign???
{future}(SPCXUSDT)
Musk will be handing out tens of billions of dollars next year???
Interesting.
SpaceX is releasing its financial results tomorrow.
At this point, Musk announced that next year he’ll collectively airdrop one share of $SPCX to American children (possibly meaning anyone under 18?). What does this mean?
It’s estimated that there are about 72 million U.S. residents under the age of 18.
At the current price, the shares being distributed are worth over $10 billion.
It looks like a giveaway, but really it’s telling the market, “Guys, next year I’m effectively locking up some of my $SPCX shares.”
➠ (New rules announced by the U.S. Treasury on September 30, 2026, allow eligible stocks to be donated directly into children’s investment accounts, subject to a specific minimum holding period.)
I used AI to look up these rules. For eligible stocks contributed directly to these accounts, the minimum holding period lasts until whichever of these two dates comes first:
(1) Five years after the stock enters the account
(2) The account holder turns 18
Thanks to this news, SPCX is temporarily trending upward today.
However, based on Musk’s personal ownership stake, even if the shares are distributed to 72 million people, it would amount to less than 2% of his personal holdings.
So, looking at it purely from a trading perspective, I don’t think this is a lockup measure substantial enough to noticeably drive up SpaceX’s share price.
But because the airdrop is so broad, it will also greatly expand SpaceX’s long-term influence among ordinary American families.
Could think of it as spending tens of billions on a long-term brand-awareness campaign???
Interesting.
SpaceX is releasing its financial results tomorrow.
At this point, Musk announced that next year he’ll collectively airdrop one share of $SPCX to American children (possibly meaning anyone under 18?). What does this mean?
It’s estimated that there are about 72 million U.S. residents under the age of 18.
At the current price, the shares being distributed are worth over $10 billion.
It looks like a giveaway, but really it’s telling the market, “Guys, next year I’m effectively locking up some of my $SPCX shares.”
➠ (New rules announced by the U.S. Treasury on September 30, 2026, allow eligible stocks to be donated directly into children’s investment accounts, subject to a specific minimum holding period.)
I used AI to look up these rules. For eligible stocks contributed directly to these accounts, the minimum holding period lasts until whichever of these two dates comes first:
(1) Five years after the stock enters the account
(2) The account holder turns 18
Thanks to this news, SPCX is temporarily trending upward today.
However, based on Musk’s personal ownership stake, even if the shares are distributed to 72 million people, it would amount to less than 2% of his personal holdings.
So, looking at it purely from a trading perspective, I don’t think this is a lockup measure substantial enough to noticeably drive up SpaceX’s share price.
But because the airdrop is so broad, it will also greatly expand SpaceX’s long-term influence among ordinary American families.
Could think of it as spending tens of billions on a long-term brand-awareness campaign???
1
2.8k
·
--
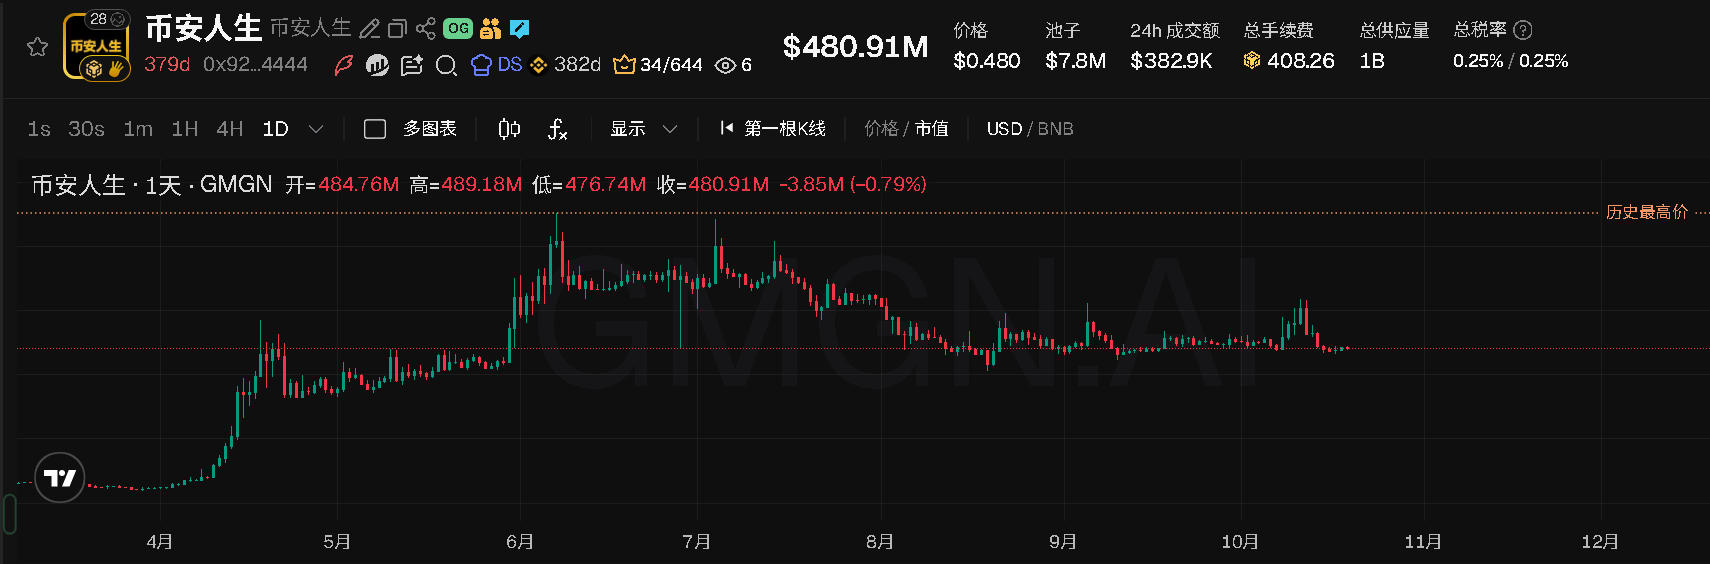
$币安人生 What the hell is going on?
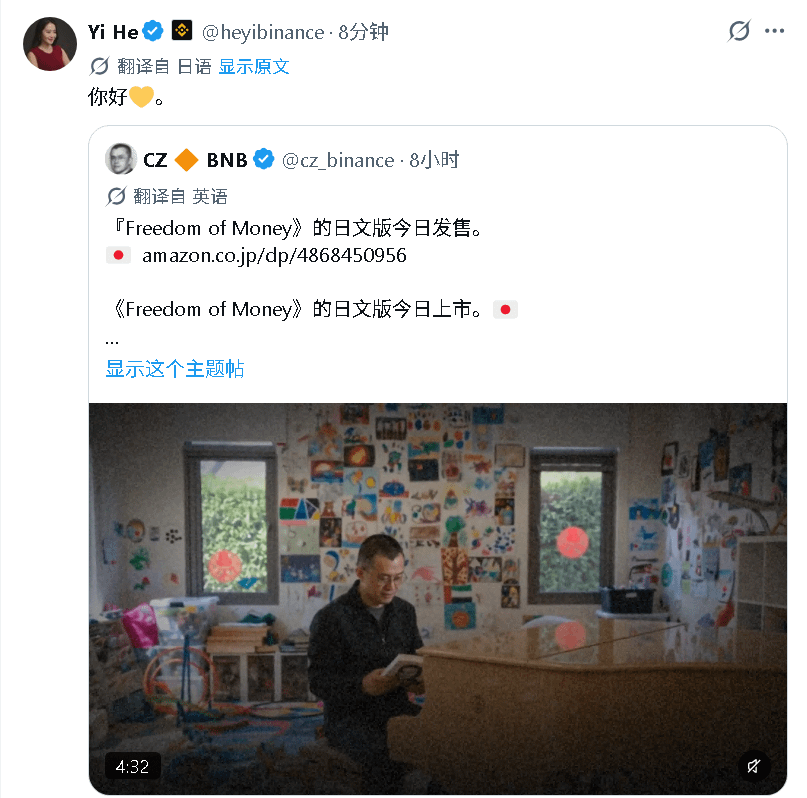
I just saw a top female influencer retweet CZ's post about the Japanese version of Binance Life going on sale.
That was already 8 hours ago.
Got curious and checked the price action.
tm
Not moving at all?
Has liquidity dried up, or is the market maker trapped too?
$币安人生 What the hell is going on?
I just saw a top female influencer retweet CZ's post about the Japanese version of Binance Life going on sale.
That was already 8 hours ago.
Got curious and checked the price action.
tm
Not moving at all?
Has liquidity dried up, or is the market maker trapped too?
I just saw a top female influencer retweet CZ's post about the Japanese version of Binance Life going on sale.
That was already 8 hours ago.
Got curious and checked the price action.
tm
Not moving at all?
Has liquidity dried up, or is the market maker trapped too?
3
1
11.8k
·
--
Partly True

Article
What are this week’s earnings reports from the four largest U.S. banks telling us?The four largest U.S. banks together added about $6.852 billion in revenue in the third quarter, but their net interest income increased by $6.895 billion.
In other words, nearly all of the four banks’ combined revenue growth came from net interest income.
So here’s the question:
Other businesses that were still growing in the first half of the year—why did they suddenly lose momentum in the third quarter?
First, let’s explain what net interest income is:
Banks take in customer deposits and use the funds to invest in interest-earning assets, such as bonds and loans. The interest these assets and products generate, minus the interest banks pay to depositors and other providers of funds, is net interest income.
What are this week’s earnings reports from the four largest U.S. banks telling us?
The four largest U.S. banks together added about $6.852 billion in revenue in the third quarter, but their net interest income increased by $6.895 billion.
In other words, nearly all of the four banks’ combined revenue growth came from net interest income.
So here’s the question:
Other businesses that were still growing in the first half of the year—why did they suddenly lose momentum in the third quarter?
First, let’s explain what net interest income is:
Banks take in customer deposits and use the funds to invest in interest-earning assets, such as bonds and loans. The interest these assets and products generate, minus the interest banks pay to depositors and other providers of funds, is net interest income.
In other words, nearly all of the four banks’ combined revenue growth came from net interest income.
So here’s the question:
Other businesses that were still growing in the first half of the year—why did they suddenly lose momentum in the third quarter?
First, let’s explain what net interest income is:
Banks take in customer deposits and use the funds to invest in interest-earning assets, such as bonds and loans. The interest these assets and products generate, minus the interest banks pay to depositors and other providers of funds, is net interest income.
4
3.4k
·
--
Charlie Munger once said: Go fishing where the fish are.
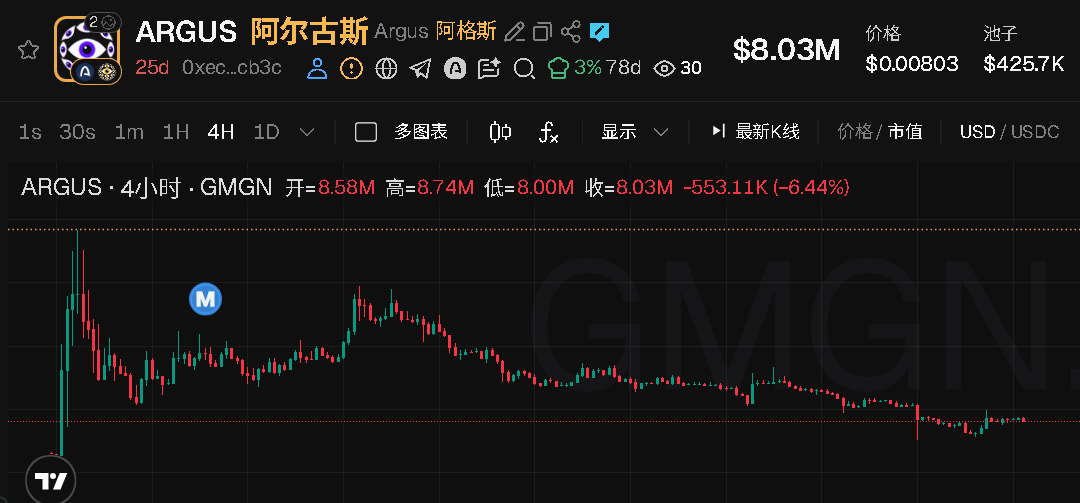
It’s been exactly one month since ARC launched.
Longyi $ARGUS isn’t even at 10M yet, and a few days ago it almost fell below 5M.
If you’re still paying too much attention to ARC right now,
then I don’t want to talk to you!
Charlie Munger once said: Go fishing where the fish are.
It’s been exactly one month since ARC launched.
Longyi $ARGUS isn’t even at 10M yet, and a few days ago it almost fell below 5M.
If you’re still paying too much attention to ARC right now,
then I don’t want to talk to you!
It’s been exactly one month since ARC launched.
Longyi $ARGUS isn’t even at 10M yet, and a few days ago it almost fell below 5M.
If you’re still paying too much attention to ARC right now,
then I don’t want to talk to you!
1
2
2.4k
·
--
Verified
However, TSMC's $TSM HPC growth has been rapid for some time; this is not a new development that began in the third quarter.
In each of the first two quarters, HPC grew by at least 20% quarter over quarter. What makes this especially impressive is that it has continued to grow by around 20% per quarter even as it has come to account for nearly 70% of total revenue.
Is HPC contributing such a large share of incremental revenue because TSMC is selling more wafers, or because these orders generate more revenue to begin with?
Considering the gap between wafer shipment growth and revenue growth discussed earlier, I’m inclined to think the latter is playing an increasingly important role in this growth cycle.
The revenue mix of advanced process nodes this quarter also offers some supporting evidence.
For example, wafers made using the 2nm process accounted for just 3% of revenue last quarter, but that share rose to 8% this quarter. The share for 3nm also increased, from 30% to 33%.
Together, the two now account for 41% of wafer revenue, up 8 percentage points from last quarter.
Looking at the data from the past few quarters, one possible interpretation is that TSMC may no longer need wafer shipments to grow at the same rate in order to generate higher revenue.
Growth is highly concentrated in high-performance computing and related demand for advanced manufacturing.
And because advanced manufacturing demand is the main driver of growth, TSMC's results alone cannot be taken as proof that the semiconductor industry as a whole is recovering in tandem.
That is also why many market observers say the semiconductor industry has yet to recover.
After all, for manufacturers that mainly produce chips using mature process nodes, customer demand and market conditions may be an entirely different story.
{future}(TSMUSDT)
However, TSMC's $TSM HPC growth has been rapid for some time; this is not a new development that began in the third quarter.
In each of the first two quarters, HPC grew by at least 20% quarter over quarter. What makes this especially impressive is that it has continued to grow by around 20% per quarter even as it has come to account for nearly 70% of total revenue.
Is HPC contributing such a large share of incremental revenue because TSMC is selling more wafers, or because these orders generate more revenue to begin with?
Considering the gap between wafer shipment growth and revenue growth discussed earlier, I’m inclined to think the latter is playing an increasingly important role in this growth cycle.
The revenue mix of advanced process nodes this quarter also offers some supporting evidence.
For example, wafers made using the 2nm process accounted for just 3% of revenue last quarter, but that share rose to 8% this quarter. The share for 3nm also increased, from 30% to 33%.
Together, the two now account for 41% of wafer revenue, up 8 percentage points from last quarter.
Looking at the data from the past few quarters, one possible interpretation is that TSMC may no longer need wafer shipments to grow at the same rate in order to generate higher revenue.
Growth is highly concentrated in high-performance computing and related demand for advanced manufacturing.
And because advanced manufacturing demand is the main driver of growth, TSMC's results alone cannot be taken as proof that the semiconductor industry as a whole is recovering in tandem.
That is also why many market observers say the semiconductor industry has yet to recover.
After all, for manufacturers that mainly produce chips using mature process nodes, customer demand and market conditions may be an entirely different story.
In each of the first two quarters, HPC grew by at least 20% quarter over quarter. What makes this especially impressive is that it has continued to grow by around 20% per quarter even as it has come to account for nearly 70% of total revenue.
Is HPC contributing such a large share of incremental revenue because TSMC is selling more wafers, or because these orders generate more revenue to begin with?
Considering the gap between wafer shipment growth and revenue growth discussed earlier, I’m inclined to think the latter is playing an increasingly important role in this growth cycle.
The revenue mix of advanced process nodes this quarter also offers some supporting evidence.
For example, wafers made using the 2nm process accounted for just 3% of revenue last quarter, but that share rose to 8% this quarter. The share for 3nm also increased, from 30% to 33%.
Together, the two now account for 41% of wafer revenue, up 8 percentage points from last quarter.
Looking at the data from the past few quarters, one possible interpretation is that TSMC may no longer need wafer shipments to grow at the same rate in order to generate higher revenue.
Growth is highly concentrated in high-performance computing and related demand for advanced manufacturing.
And because advanced manufacturing demand is the main driver of growth, TSMC's results alone cannot be taken as proof that the semiconductor industry as a whole is recovering in tandem.
That is also why many market observers say the semiconductor industry has yet to recover.
After all, for manufacturers that mainly produce chips using mature process nodes, customer demand and market conditions may be an entirely different story.
Eric SJ
·
--
TSMC's latest earnings data is out
$TSM
Net profit has hit a new record for six consecutive quarters
But
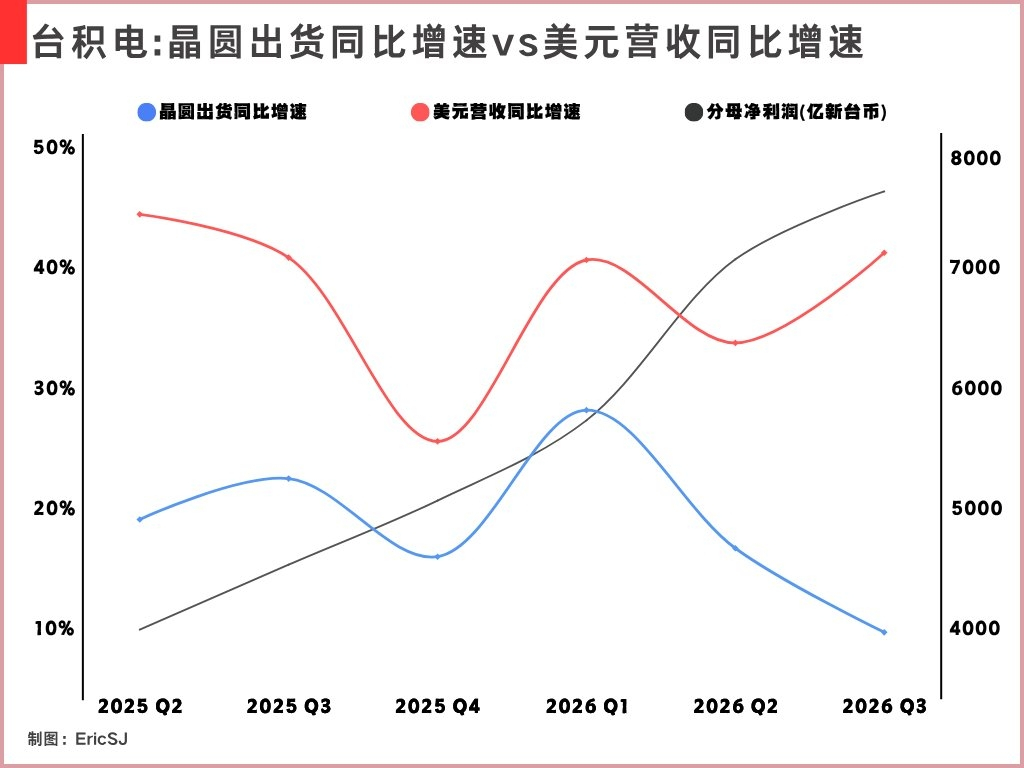
we can see that in the third quarter, TSMC's wafer shipments grew just 9.6% year over year—the lowest level in these six quarters
The figures that contrast with this are not only net profit, but also revenue growth
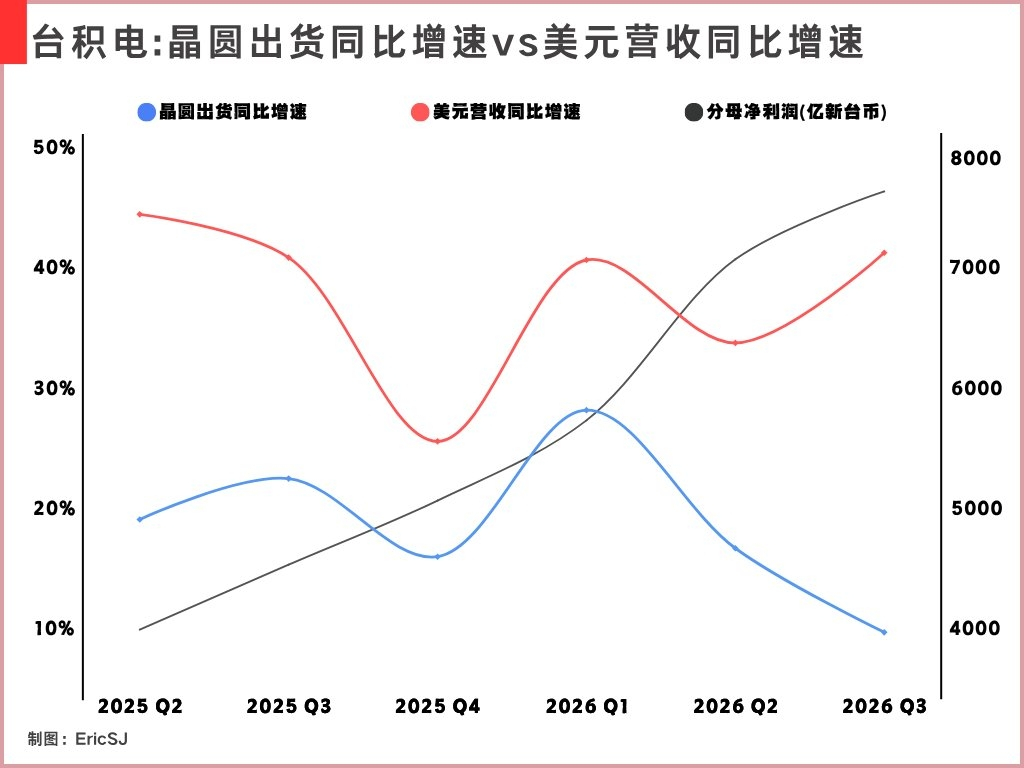
As shown in my chart, the red and blue lines have moved almost in tandem over the past few quarters. This quarter, however, they diverged far more sharply than in recent quarters
(1) Year-over-year wafer shipment growth slowed further, from 16.6% to 9.6%, while revenue growth in U.S. dollars rose from 33.7% to 41.2%
(2) The gap between them was 31.6 percentage points—the widest divergence in the past six quarters
If this were simply a broad recovery in the semiconductor industry, bringing in more chip orders,
we would expect to see wafer shipment volumes rise in tandem
But revenue is now growing far faster than shipment volumes. This suggests that simply shipping more wafers is not enough to explain this growth, nor does it support the conclusion that the semiconductor industry is broadly recovering
A more likely explanation is a shift in the mix of products customers are buying
So, what type of customer is driving this shift?
The answer is high-performance computing (HPC)
HPC is a business category TSMC defines by end application. It includes AI accelerators, server processors, and other chips related to high-performance computing
These chips typically have demanding performance, power consumption, and manufacturing requirements. Many products require advanced process nodes, and some also need complex advanced packaging
In the same quarter last year, HPC accounted for 57% of TSMC's total revenue. In its latest earnings data, that figure had risen to 68%
Based on a rough estimate using quarterly revenue and business mix, HPC revenue grew approximately 80% year over year in the third quarter
Even more strikingly, HPC growth can explain nearly 90% of TSMC's year-over-year revenue increase this quarter
In other words, other businesses are certainly generating revenue too, but the growth driving TSMC is now heavily concentrated in orders related to high-performance computing
This also explains why TSMC's revenue and wafer shipment volumes are becoming increasingly out of proportion
$TSM
Net profit has hit a new record for six consecutive quarters
But
we can see that in the third quarter, TSMC's wafer shipments grew just 9.6% year over year—the lowest level in these six quarters
The figures that contrast with this are not only net profit, but also revenue growth
As shown in my chart, the red and blue lines have moved almost in tandem over the past few quarters. This quarter, however, they diverged far more sharply than in recent quarters
(1) Year-over-year wafer shipment growth slowed further, from 16.6% to 9.6%, while revenue growth in U.S. dollars rose from 33.7% to 41.2%
(2) The gap between them was 31.6 percentage points—the widest divergence in the past six quarters
If this were simply a broad recovery in the semiconductor industry, bringing in more chip orders,
we would expect to see wafer shipment volumes rise in tandem
But revenue is now growing far faster than shipment volumes. This suggests that simply shipping more wafers is not enough to explain this growth, nor does it support the conclusion that the semiconductor industry is broadly recovering
A more likely explanation is a shift in the mix of products customers are buying
So, what type of customer is driving this shift?
The answer is high-performance computing (HPC)
HPC is a business category TSMC defines by end application. It includes AI accelerators, server processors, and other chips related to high-performance computing
These chips typically have demanding performance, power consumption, and manufacturing requirements. Many products require advanced process nodes, and some also need complex advanced packaging
In the same quarter last year, HPC accounted for 57% of TSMC's total revenue. In its latest earnings data, that figure had risen to 68%
Based on a rough estimate using quarterly revenue and business mix, HPC revenue grew approximately 80% year over year in the third quarter
Even more strikingly, HPC growth can explain nearly 90% of TSMC's year-over-year revenue increase this quarter
In other words, other businesses are certainly generating revenue too, but the growth driving TSMC is now heavily concentrated in orders related to high-performance computing
This also explains why TSMC's revenue and wafer shipment volumes are becoming increasingly out of proportion
1.3k
·
--
Verified
TSMC's latest earnings data is out
$TSM
{future}(TSMUSDT)
Net profit has hit a new record for six consecutive quarters
But
we can see that in the third quarter, TSMC's wafer shipments grew just 9.6% year over year—the lowest level in these six quarters
The figures that contrast with this are not only net profit, but also revenue growth
As shown in my chart, the red and blue lines have moved almost in tandem over the past few quarters. This quarter, however, they diverged far more sharply than in recent quarters
(1) Year-over-year wafer shipment growth slowed further, from 16.6% to 9.6%, while revenue growth in U.S. dollars rose from 33.7% to 41.2%
(2) The gap between them was 31.6 percentage points—the widest divergence in the past six quarters
If this were simply a broad recovery in the semiconductor industry, bringing in more chip orders,
we would expect to see wafer shipment volumes rise in tandem
But revenue is now growing far faster than shipment volumes. This suggests that simply shipping more wafers is not enough to explain this growth, nor does it support the conclusion that the semiconductor industry is broadly recovering
A more likely explanation is a shift in the mix of products customers are buying
So, what type of customer is driving this shift?
The answer is high-performance computing (HPC)
HPC is a business category TSMC defines by end application. It includes AI accelerators, server processors, and other chips related to high-performance computing
These chips typically have demanding performance, power consumption, and manufacturing requirements. Many products require advanced process nodes, and some also need complex advanced packaging
In the same quarter last year, HPC accounted for 57% of TSMC's total revenue. In its latest earnings data, that figure had risen to 68%
Based on a rough estimate using quarterly revenue and business mix, HPC revenue grew approximately 80% year over year in the third quarter
Even more strikingly, HPC growth can explain nearly 90% of TSMC's year-over-year revenue increase this quarter
In other words, other businesses are certainly generating revenue too, but the growth driving TSMC is now heavily concentrated in orders related to high-performance computing
This also explains why TSMC's revenue and wafer shipment volumes are becoming increasingly out of proportion
TSMC's latest earnings data is out
$TSM
Net profit has hit a new record for six consecutive quarters
But
we can see that in the third quarter, TSMC's wafer shipments grew just 9.6% year over year—the lowest level in these six quarters
The figures that contrast with this are not only net profit, but also revenue growth
As shown in my chart, the red and blue lines have moved almost in tandem over the past few quarters. This quarter, however, they diverged far more sharply than in recent quarters
(1) Year-over-year wafer shipment growth slowed further, from 16.6% to 9.6%, while revenue growth in U.S. dollars rose from 33.7% to 41.2%
(2) The gap between them was 31.6 percentage points—the widest divergence in the past six quarters
If this were simply a broad recovery in the semiconductor industry, bringing in more chip orders,
we would expect to see wafer shipment volumes rise in tandem
But revenue is now growing far faster than shipment volumes. This suggests that simply shipping more wafers is not enough to explain this growth, nor does it support the conclusion that the semiconductor industry is broadly recovering
A more likely explanation is a shift in the mix of products customers are buying
So, what type of customer is driving this shift?
The answer is high-performance computing (HPC)
HPC is a business category TSMC defines by end application. It includes AI accelerators, server processors, and other chips related to high-performance computing
These chips typically have demanding performance, power consumption, and manufacturing requirements. Many products require advanced process nodes, and some also need complex advanced packaging
In the same quarter last year, HPC accounted for 57% of TSMC's total revenue. In its latest earnings data, that figure had risen to 68%
Based on a rough estimate using quarterly revenue and business mix, HPC revenue grew approximately 80% year over year in the third quarter
Even more strikingly, HPC growth can explain nearly 90% of TSMC's year-over-year revenue increase this quarter
In other words, other businesses are certainly generating revenue too, but the growth driving TSMC is now heavily concentrated in orders related to high-performance computing
This also explains why TSMC's revenue and wafer shipment volumes are becoming increasingly out of proportion
$TSM
Net profit has hit a new record for six consecutive quarters
But
we can see that in the third quarter, TSMC's wafer shipments grew just 9.6% year over year—the lowest level in these six quarters
The figures that contrast with this are not only net profit, but also revenue growth
As shown in my chart, the red and blue lines have moved almost in tandem over the past few quarters. This quarter, however, they diverged far more sharply than in recent quarters
(1) Year-over-year wafer shipment growth slowed further, from 16.6% to 9.6%, while revenue growth in U.S. dollars rose from 33.7% to 41.2%
(2) The gap between them was 31.6 percentage points—the widest divergence in the past six quarters
If this were simply a broad recovery in the semiconductor industry, bringing in more chip orders,
we would expect to see wafer shipment volumes rise in tandem
But revenue is now growing far faster than shipment volumes. This suggests that simply shipping more wafers is not enough to explain this growth, nor does it support the conclusion that the semiconductor industry is broadly recovering
A more likely explanation is a shift in the mix of products customers are buying
So, what type of customer is driving this shift?
The answer is high-performance computing (HPC)
HPC is a business category TSMC defines by end application. It includes AI accelerators, server processors, and other chips related to high-performance computing
These chips typically have demanding performance, power consumption, and manufacturing requirements. Many products require advanced process nodes, and some also need complex advanced packaging
In the same quarter last year, HPC accounted for 57% of TSMC's total revenue. In its latest earnings data, that figure had risen to 68%
Based on a rough estimate using quarterly revenue and business mix, HPC revenue grew approximately 80% year over year in the third quarter
Even more strikingly, HPC growth can explain nearly 90% of TSMC's year-over-year revenue increase this quarter
In other words, other businesses are certainly generating revenue too, but the growth driving TSMC is now heavily concentrated in orders related to high-performance computing
This also explains why TSMC's revenue and wafer shipment volumes are becoming increasingly out of proportion
1
3
2.3k
·
--
Partly True
Is the endgame of Web3 just stablecoins???
The market as a whole warmed up somewhat in Q3
Under normal circumstances, market sentiment should have improved as well
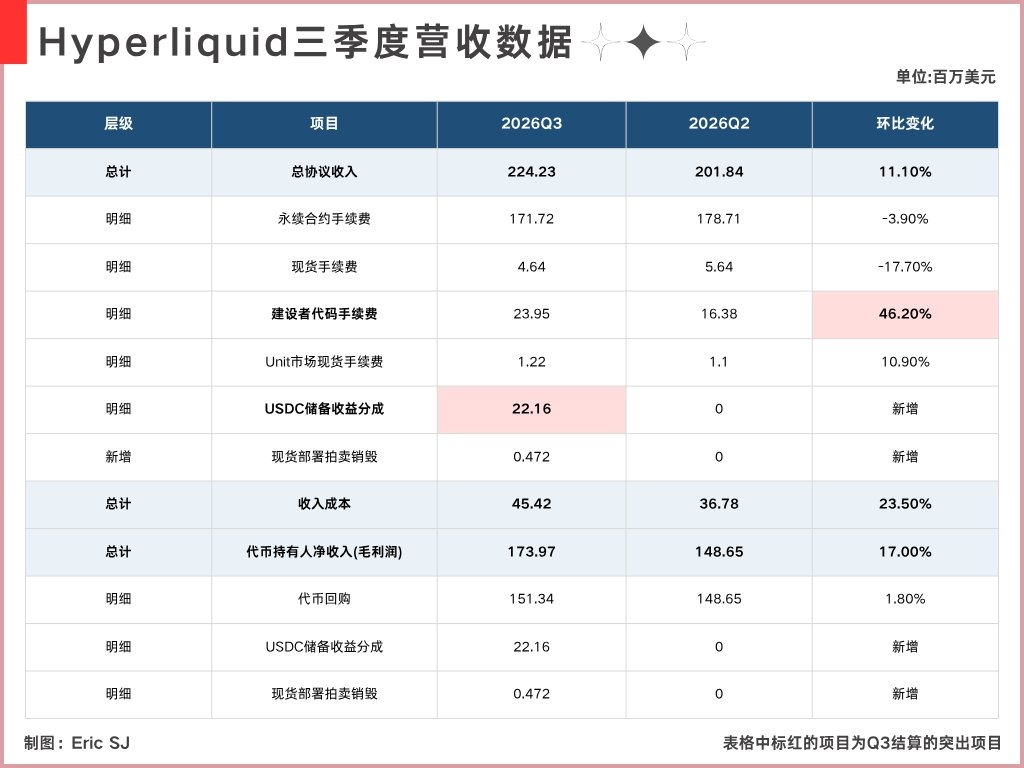
But Hyperliquid's core revenue didn't grow accordingly—instead, it fell nearly 4% quarter over quarter
What drove growth for the quarter was reserve income from USDC, something many people overlooked
This is also one of the clearest revenue-sharing deals from the USDC channel apart from Coinbase
And last quarter, this income was only counted for a little over a month, not the full 90 days
The reserve income currently attributable to Hyperliquid averages around $530,000 a day
If the scale of USDC and the effective interest rate stay at current levels, a static estimate suggests it could generate nearly $48 million in revenue in Q4
For a single quarter, that would amount to roughly a quarter of its perpetuals trading fees...
Put that way, it really feels like the endgame of Web3 is stablecoins
In the past, Hyperliquid could only collect fees when users traded
Now, as long as billions of dollars in USDC remain on the platform, the cash and Treasury reserves backing it will keep generating income and buying back $HYPE
{future}(HYPEUSDT)
Is the endgame of Web3 just stablecoins???
The market as a whole warmed up somewhat in Q3
Under normal circumstances, market sentiment should have improved as well
But Hyperliquid's core revenue didn't grow accordingly—instead, it fell nearly 4% quarter over quarter
What drove growth for the quarter was reserve income from USDC, something many people overlooked
This is also one of the clearest revenue-sharing deals from the USDC channel apart from Coinbase
And last quarter, this income was only counted for a little over a month, not the full 90 days
The reserve income currently attributable to Hyperliquid averages around $530,000 a day
If the scale of USDC and the effective interest rate stay at current levels, a static estimate suggests it could generate nearly $48 million in revenue in Q4
For a single quarter, that would amount to roughly a quarter of its perpetuals trading fees...
Put that way, it really feels like the endgame of Web3 is stablecoins
In the past, Hyperliquid could only collect fees when users traded
Now, as long as billions of dollars in USDC remain on the platform, the cash and Treasury reserves backing it will keep generating income and buying back $HYPE
The market as a whole warmed up somewhat in Q3
Under normal circumstances, market sentiment should have improved as well
But Hyperliquid's core revenue didn't grow accordingly—instead, it fell nearly 4% quarter over quarter
What drove growth for the quarter was reserve income from USDC, something many people overlooked
This is also one of the clearest revenue-sharing deals from the USDC channel apart from Coinbase
And last quarter, this income was only counted for a little over a month, not the full 90 days
The reserve income currently attributable to Hyperliquid averages around $530,000 a day
If the scale of USDC and the effective interest rate stay at current levels, a static estimate suggests it could generate nearly $48 million in revenue in Q4
For a single quarter, that would amount to roughly a quarter of its perpetuals trading fees...
Put that way, it really feels like the endgame of Web3 is stablecoins
In the past, Hyperliquid could only collect fees when users traded
Now, as long as billions of dollars in USDC remain on the platform, the cash and Treasury reserves backing it will keep generating income and buying back $HYPE
Eric SJ
·
--
As the Market Rebounds in Q3, Is Circle Behind Hyperliquid’s Revenue Growth?
One expense in Hyperliquid’s third-quarter revenue figures stands out for its significant growth: Builder Code Fees rose from $16.38 million in the second quarter to $23.95 million.
That’s an increase of $7.57 million in a single quarter, or about 46.2% quarter over quarter.
To clarify, this money is shared with third-party apps. For example, fomo uses Hyperliquid as the underlying infrastructure for its on-chain contracts. When users trade through fomo, some of the fees go to fomo, while the rest are underlying transaction fees collected by Hyperliquid.
That’s an increase of $7.57 million in a single quarter, or about 46.2% quarter over quarter.
To clarify, this money is shared with third-party apps. For example, fomo uses Hyperliquid as the underlying infrastructure for its on-chain contracts. When users trade through fomo, some of the fees go to fomo, while the rest are underlying transaction fees collected by Hyperliquid.
2
2.9k
·
--
Partly True
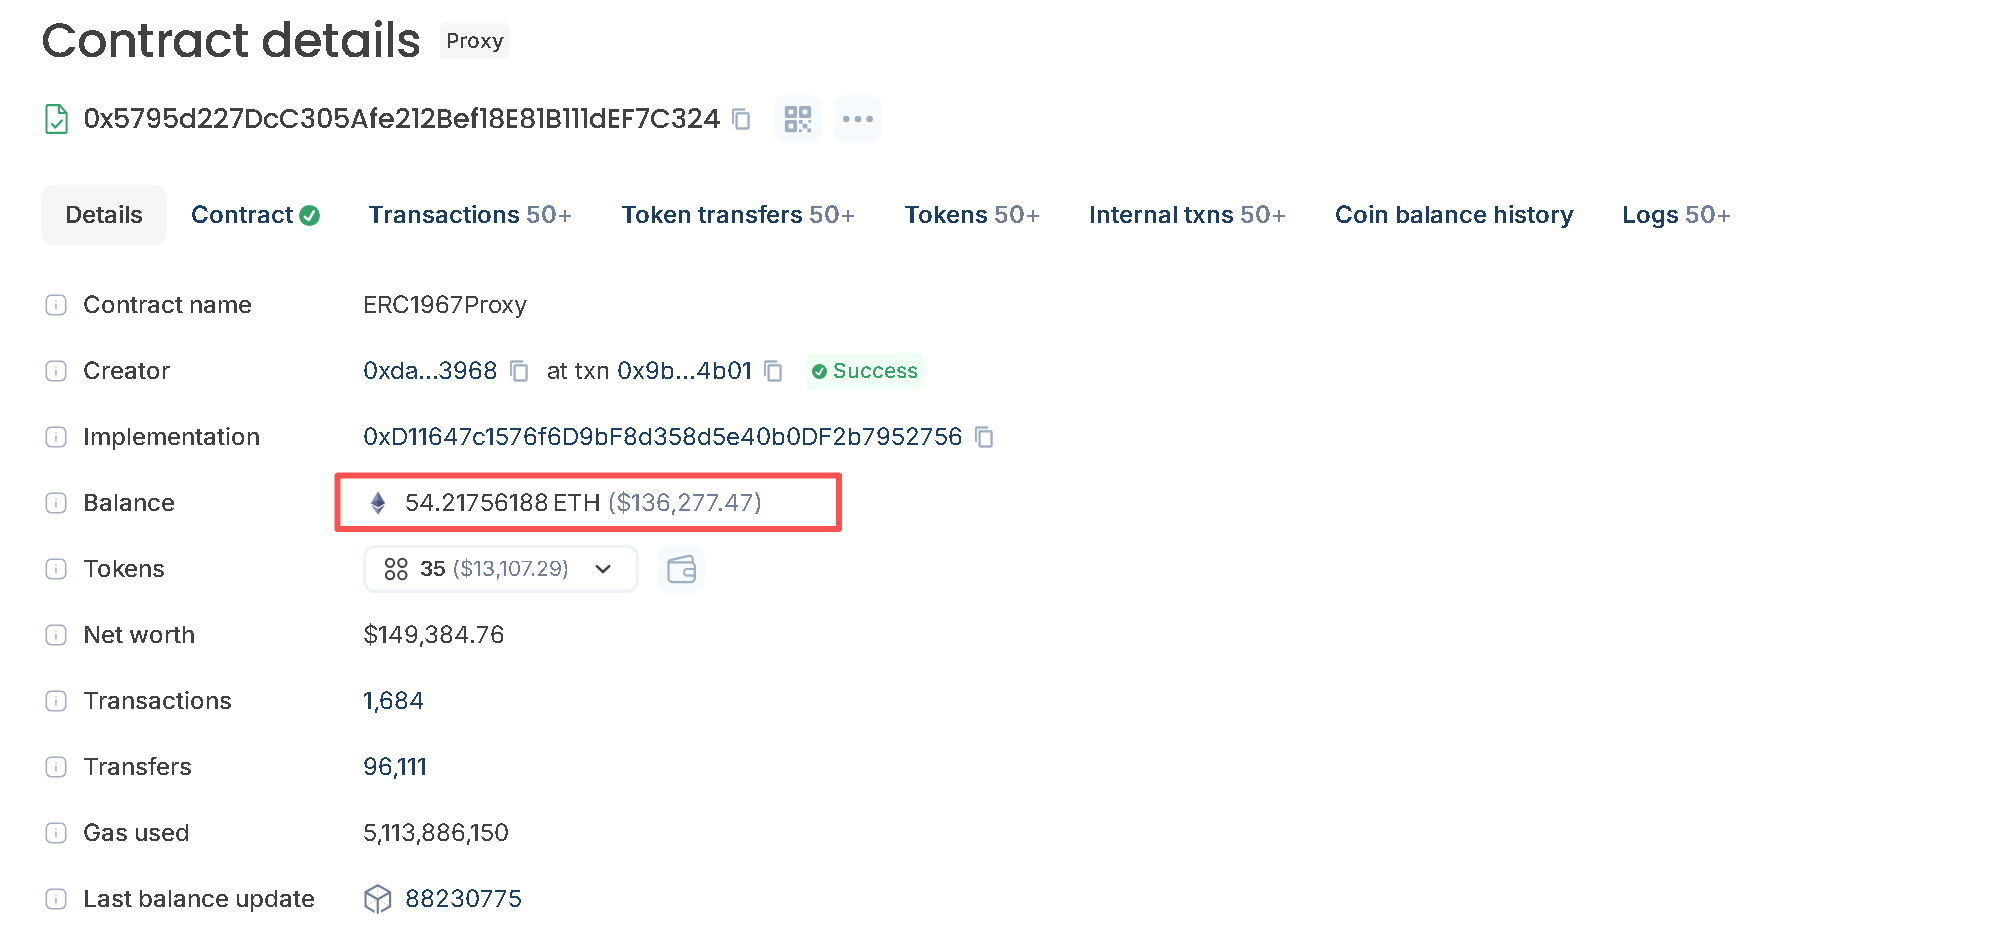
There’s currently about $136,000 remaining in the buyback execution contract for $PONS
{alpha}(46630x39dbed3a2bd333467115de45665cc57f813c4571)
I’ve been wondering whether, in protocols that are actually executing buybacks, a more flexible buyback design might be better than mechanical automatic buybacks, @MEADGod
For example, when looking at historical trends, if the current market is identified as being in a downtrend, execute a larger proportion of buybacks.
Conversely, if it’s identified as being in an uptrend, reduce that proportion.
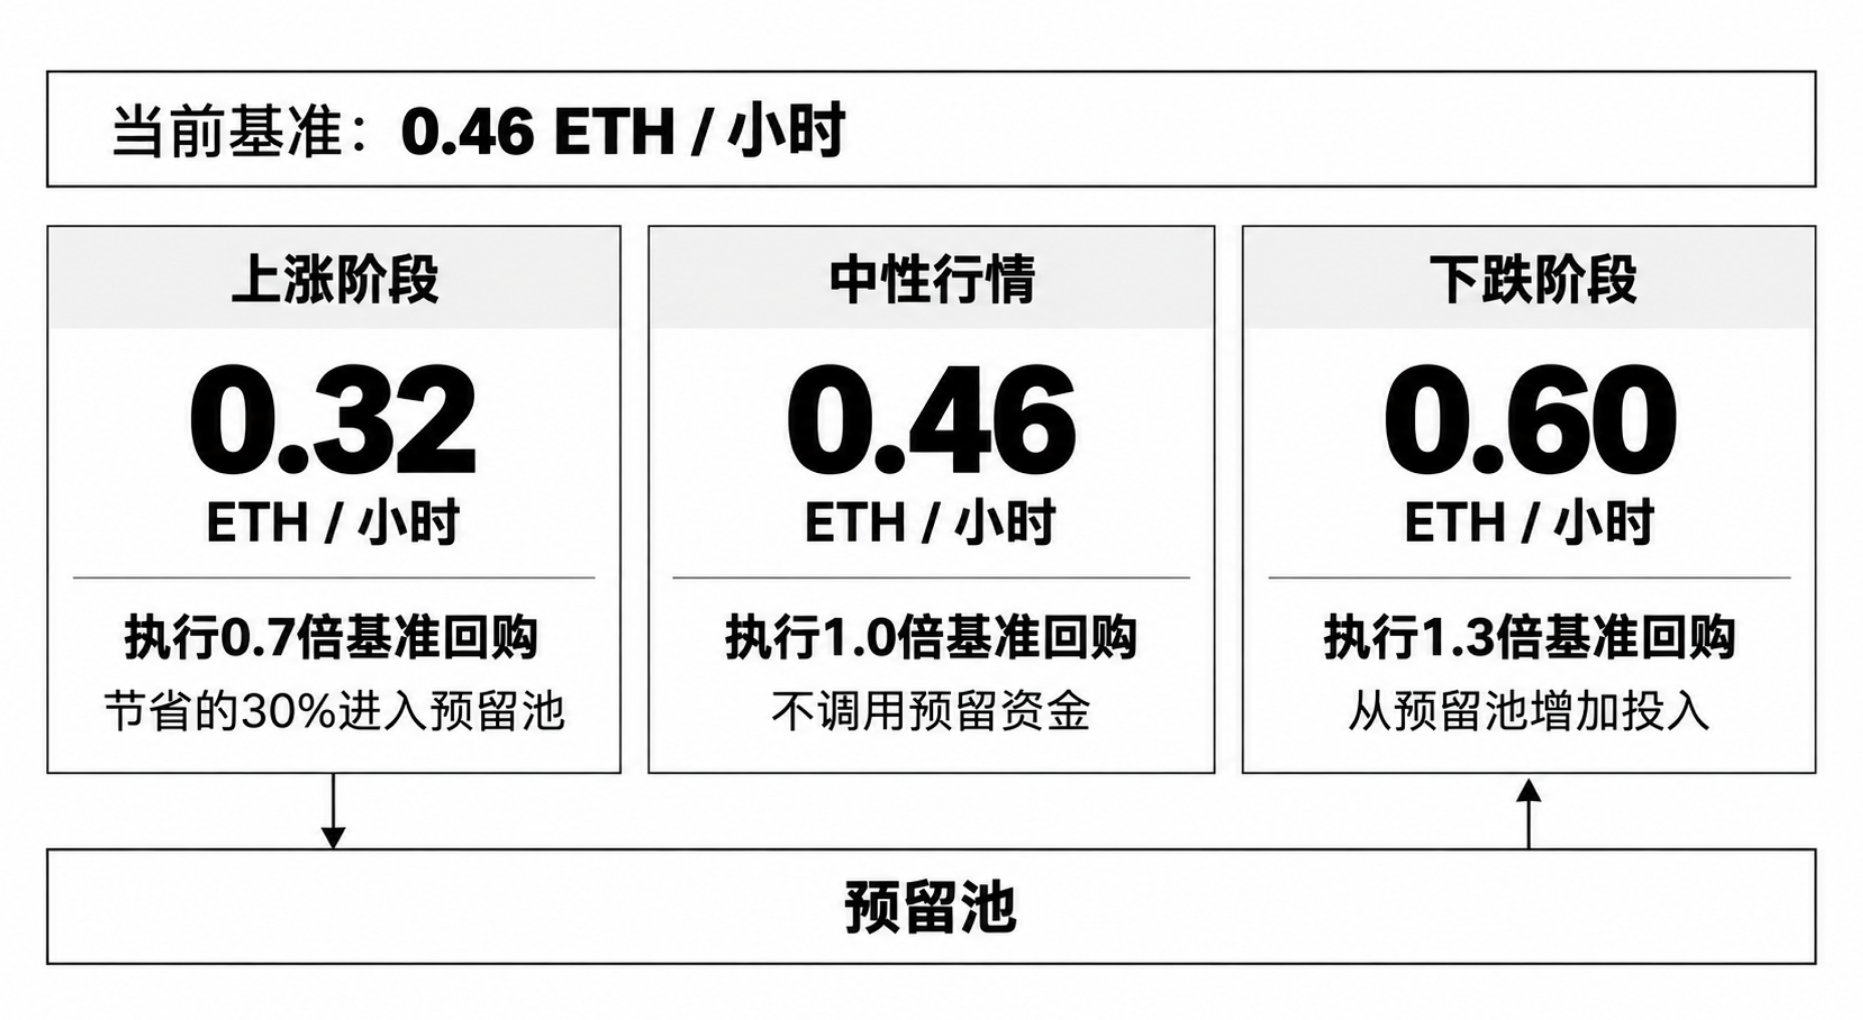
For example, PONS buybacks are currently around 0.46e per hour. This is the hourly baseline for the current cycle.
(1) If the trend formed by the past 20 hourly candles is identified as a downtrend, the buyback amount would be 0.6e/hour (1.3 times the baseline amount).
(2) In an uptrend, the buyback amount would be adjusted to 0.32e/hour (0.7 times the baseline amount).
(3) In a neutral market, the buyback amount would stay at the baseline.
I had AI make a simple chart to help everyone understand.
The key here isn’t to have the protocol allocate more than the budget, but to change how the same budget is allocated across different price ranges.
The amount spent less during an uptrend goes into a separate buyback pool, and then more is drawn from this pool during a downtrend. This way, buybacks can continue as usual, while at lower prices the same amount of money can buy back more PONS and carry out more burns.
Using only the past 20 hourly candles is just an example. The mechanism itself is easy to implement—I could build one with Codex, since I implemented similar trend detection for my market-monitoring bot.
A more sensible approach would be to analyze the price trend of $PONS over the past week before executing each cycle.
There is one issue with this design: if the market remains in a downtrend for a prolonged period, the funds will be depleted faster.
So it would be best to use this flexible mechanism during an uptrend, while keeping the original 30% of the pool in reserve.
It could also be implemented at this stage by adding a condition to the contract: before executing each cycle, check the balance of the reserve pool. If the balance is less than 0.3 × the total funds for the cycle, the buyback for the current cycle defaults to the baseline amount.
➠ In other words, suppose 10E is available for buybacks this cycle. If the reserve pool balance carried over from the previous cycle is less than 3E, then the total buyback amount for this cycle defaults to 10E rather than 13E.
There’s currently about $136,000 remaining in the buyback execution contract for $PONS
I’ve been wondering whether, in protocols that are actually executing buybacks, a more flexible buyback design might be better than mechanical automatic buybacks, @MEADGod
For example, when looking at historical trends, if the current market is identified as being in a downtrend, execute a larger proportion of buybacks.
Conversely, if it’s identified as being in an uptrend, reduce that proportion.
For example, PONS buybacks are currently around 0.46e per hour. This is the hourly baseline for the current cycle.
(1) If the trend formed by the past 20 hourly candles is identified as a downtrend, the buyback amount would be 0.6e/hour (1.3 times the baseline amount).
(2) In an uptrend, the buyback amount would be adjusted to 0.32e/hour (0.7 times the baseline amount).
(3) In a neutral market, the buyback amount would stay at the baseline.
I had AI make a simple chart to help everyone understand.
The key here isn’t to have the protocol allocate more than the budget, but to change how the same budget is allocated across different price ranges.
The amount spent less during an uptrend goes into a separate buyback pool, and then more is drawn from this pool during a downtrend. This way, buybacks can continue as usual, while at lower prices the same amount of money can buy back more PONS and carry out more burns.
Using only the past 20 hourly candles is just an example. The mechanism itself is easy to implement—I could build one with Codex, since I implemented similar trend detection for my market-monitoring bot.
A more sensible approach would be to analyze the price trend of $PONS over the past week before executing each cycle.
There is one issue with this design: if the market remains in a downtrend for a prolonged period, the funds will be depleted faster.
So it would be best to use this flexible mechanism during an uptrend, while keeping the original 30% of the pool in reserve.
It could also be implemented at this stage by adding a condition to the contract: before executing each cycle, check the balance of the reserve pool. If the balance is less than 0.3 × the total funds for the cycle, the buyback for the current cycle defaults to the baseline amount.
➠ In other words, suppose 10E is available for buybacks this cycle. If the reserve pool balance carried over from the previous cycle is less than 3E, then the total buyback amount for this cycle defaults to 10E rather than 13E.
I’ve been wondering whether, in protocols that are actually executing buybacks, a more flexible buyback design might be better than mechanical automatic buybacks, @MEADGod
For example, when looking at historical trends, if the current market is identified as being in a downtrend, execute a larger proportion of buybacks.
Conversely, if it’s identified as being in an uptrend, reduce that proportion.
For example, PONS buybacks are currently around 0.46e per hour. This is the hourly baseline for the current cycle.
(1) If the trend formed by the past 20 hourly candles is identified as a downtrend, the buyback amount would be 0.6e/hour (1.3 times the baseline amount).
(2) In an uptrend, the buyback amount would be adjusted to 0.32e/hour (0.7 times the baseline amount).
(3) In a neutral market, the buyback amount would stay at the baseline.
I had AI make a simple chart to help everyone understand.
The key here isn’t to have the protocol allocate more than the budget, but to change how the same budget is allocated across different price ranges.
The amount spent less during an uptrend goes into a separate buyback pool, and then more is drawn from this pool during a downtrend. This way, buybacks can continue as usual, while at lower prices the same amount of money can buy back more PONS and carry out more burns.
Using only the past 20 hourly candles is just an example. The mechanism itself is easy to implement—I could build one with Codex, since I implemented similar trend detection for my market-monitoring bot.
A more sensible approach would be to analyze the price trend of $PONS over the past week before executing each cycle.
There is one issue with this design: if the market remains in a downtrend for a prolonged period, the funds will be depleted faster.
So it would be best to use this flexible mechanism during an uptrend, while keeping the original 30% of the pool in reserve.
It could also be implemented at this stage by adding a condition to the contract: before executing each cycle, check the balance of the reserve pool. If the balance is less than 0.3 × the total funds for the cycle, the buyback for the current cycle defaults to the baseline amount.
➠ In other words, suppose 10E is available for buybacks this cycle. If the reserve pool balance carried over from the previous cycle is less than 3E, then the total buyback amount for this cycle defaults to 10E rather than 13E.
1
2
3k
·
--
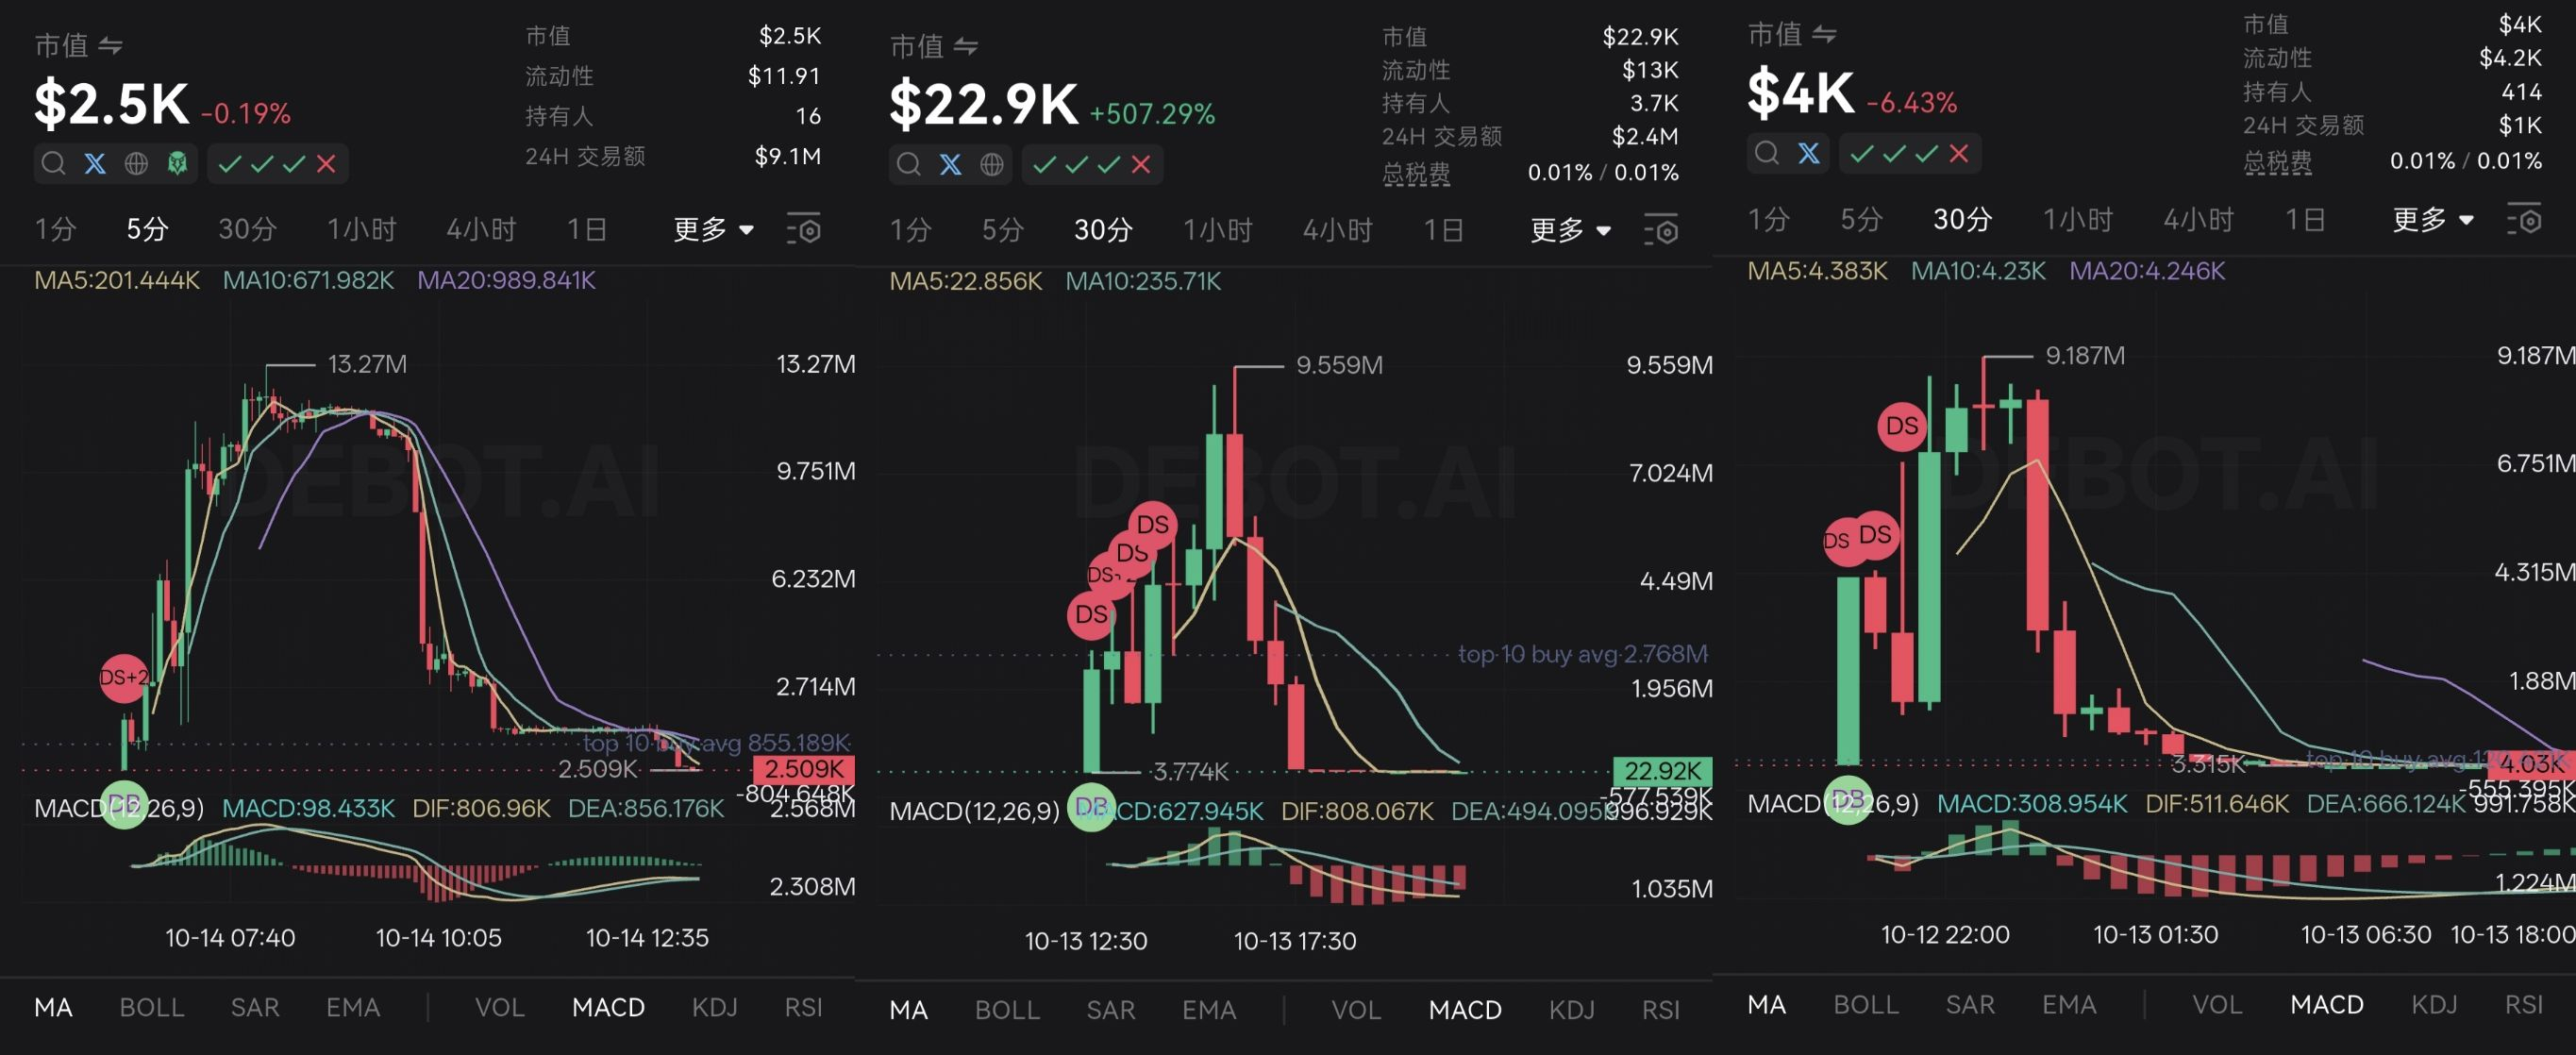
The team's trading tactics have changed since yesterday. Maybe more people are watching, and they're closing positions faster.
Everyone knows something's off—it's basically playing with fire.
You ask if you can get in? They can too.
You ask if I'd dare put money in? Absolutely not.
Ever since I posted about it yesterday, this team has been putting out trades more frequently, too.
Most likely the trading really is wash trading; otherwise, with this kind of high-frequency activity and turnover,
there's no way it wouldn't be able to generate buzz around Robinhood Chain 😮💨
The team's trading tactics have changed since yesterday. Maybe more people are watching, and they're closing positions faster.
Everyone knows something's off—it's basically playing with fire.
You ask if you can get in? They can too.
You ask if I'd dare put money in? Absolutely not.
Ever since I posted about it yesterday, this team has been putting out trades more frequently, too.
Most likely the trading really is wash trading; otherwise, with this kind of high-frequency activity and turnover,
there's no way it wouldn't be able to generate buzz around Robinhood Chain 😮💨
Everyone knows something's off—it's basically playing with fire.
You ask if you can get in? They can too.
You ask if I'd dare put money in? Absolutely not.
Ever since I posted about it yesterday, this team has been putting out trades more frequently, too.
Most likely the trading really is wash trading; otherwise, with this kind of high-frequency activity and turnover,
there's no way it wouldn't be able to generate buzz around Robinhood Chain 😮💨
Eric SJ
·
--
Sharing an on-chain observation
Last night, several sizable tokens launched on Robinhood Chain in quick succession.
Their peak market caps ranged from $6M to $30M, and they got there pretty fast. They had a few things in common:
1. They were all launched through Uniswap
2. None were original IPs
3. Their trading tactics were almost identical
They all launched with over 100K in liquidity. Early wallets held a large share of the supply, while also steadily distributing large amounts.
As their market caps grew, liquidity stayed between 100K and 300K.
It felt really shady—like I’d stumbled into a money-laundering operation.
Just when you thought they were about to dump, inexplicable funds would come in and push the price higher.
Search their CAs on 𝕏 and you’ll find that Memes in this market-cap range barely have any community buzz.
0x370dd1181288392843bf52d998eb85c735d91688
0xde09eec6f12311d98d982b07c2e0f9360dd002f9
0xe3e3df8bfb891d269a78ee33a456d36fb7344ec1
After noticing that the first and second had similar tactics, I didn’t hesitate much when the third one appeared—I went in to give it a try.
When I woke up, sure enough, it hadn’t dumped. I sold everything and left it at that; just a small test.
After that, I couldn’t make sense of what was going on.
Sharing this for discussion.
Last night, several sizable tokens launched on Robinhood Chain in quick succession.
Their peak market caps ranged from $6M to $30M, and they got there pretty fast. They had a few things in common:
1. They were all launched through Uniswap
2. None were original IPs
3. Their trading tactics were almost identical
They all launched with over 100K in liquidity. Early wallets held a large share of the supply, while also steadily distributing large amounts.
As their market caps grew, liquidity stayed between 100K and 300K.
It felt really shady—like I’d stumbled into a money-laundering operation.
Just when you thought they were about to dump, inexplicable funds would come in and push the price higher.
Search their CAs on 𝕏 and you’ll find that Memes in this market-cap range barely have any community buzz.
0x370dd1181288392843bf52d998eb85c735d91688
0xde09eec6f12311d98d982b07c2e0f9360dd002f9
0xe3e3df8bfb891d269a78ee33a456d36fb7344ec1
After noticing that the first and second had similar tactics, I didn’t hesitate much when the third one appeared—I went in to give it a try.
When I woke up, sure enough, it hadn’t dumped. I sold everything and left it at that; just a small test.
After that, I couldn’t make sense of what was going on.
Sharing this for discussion.
2
1.7k
Log in to explore more content
Join global crypto users on Binance Square
⚡️ Get latest and useful information about crypto.
💬 Trusted by the world’s largest crypto exchange.
👍 Discover real insights from verified creators.
Email / Phone number