
AiCoin小编
343 Posts

AiCoin小编
Report
Block User
盯数据,看主力,偶尔聊点盘口之外的思考
1 Following
73 Followers
114 Liked
Posts
All
Quotes
Videos
·
--
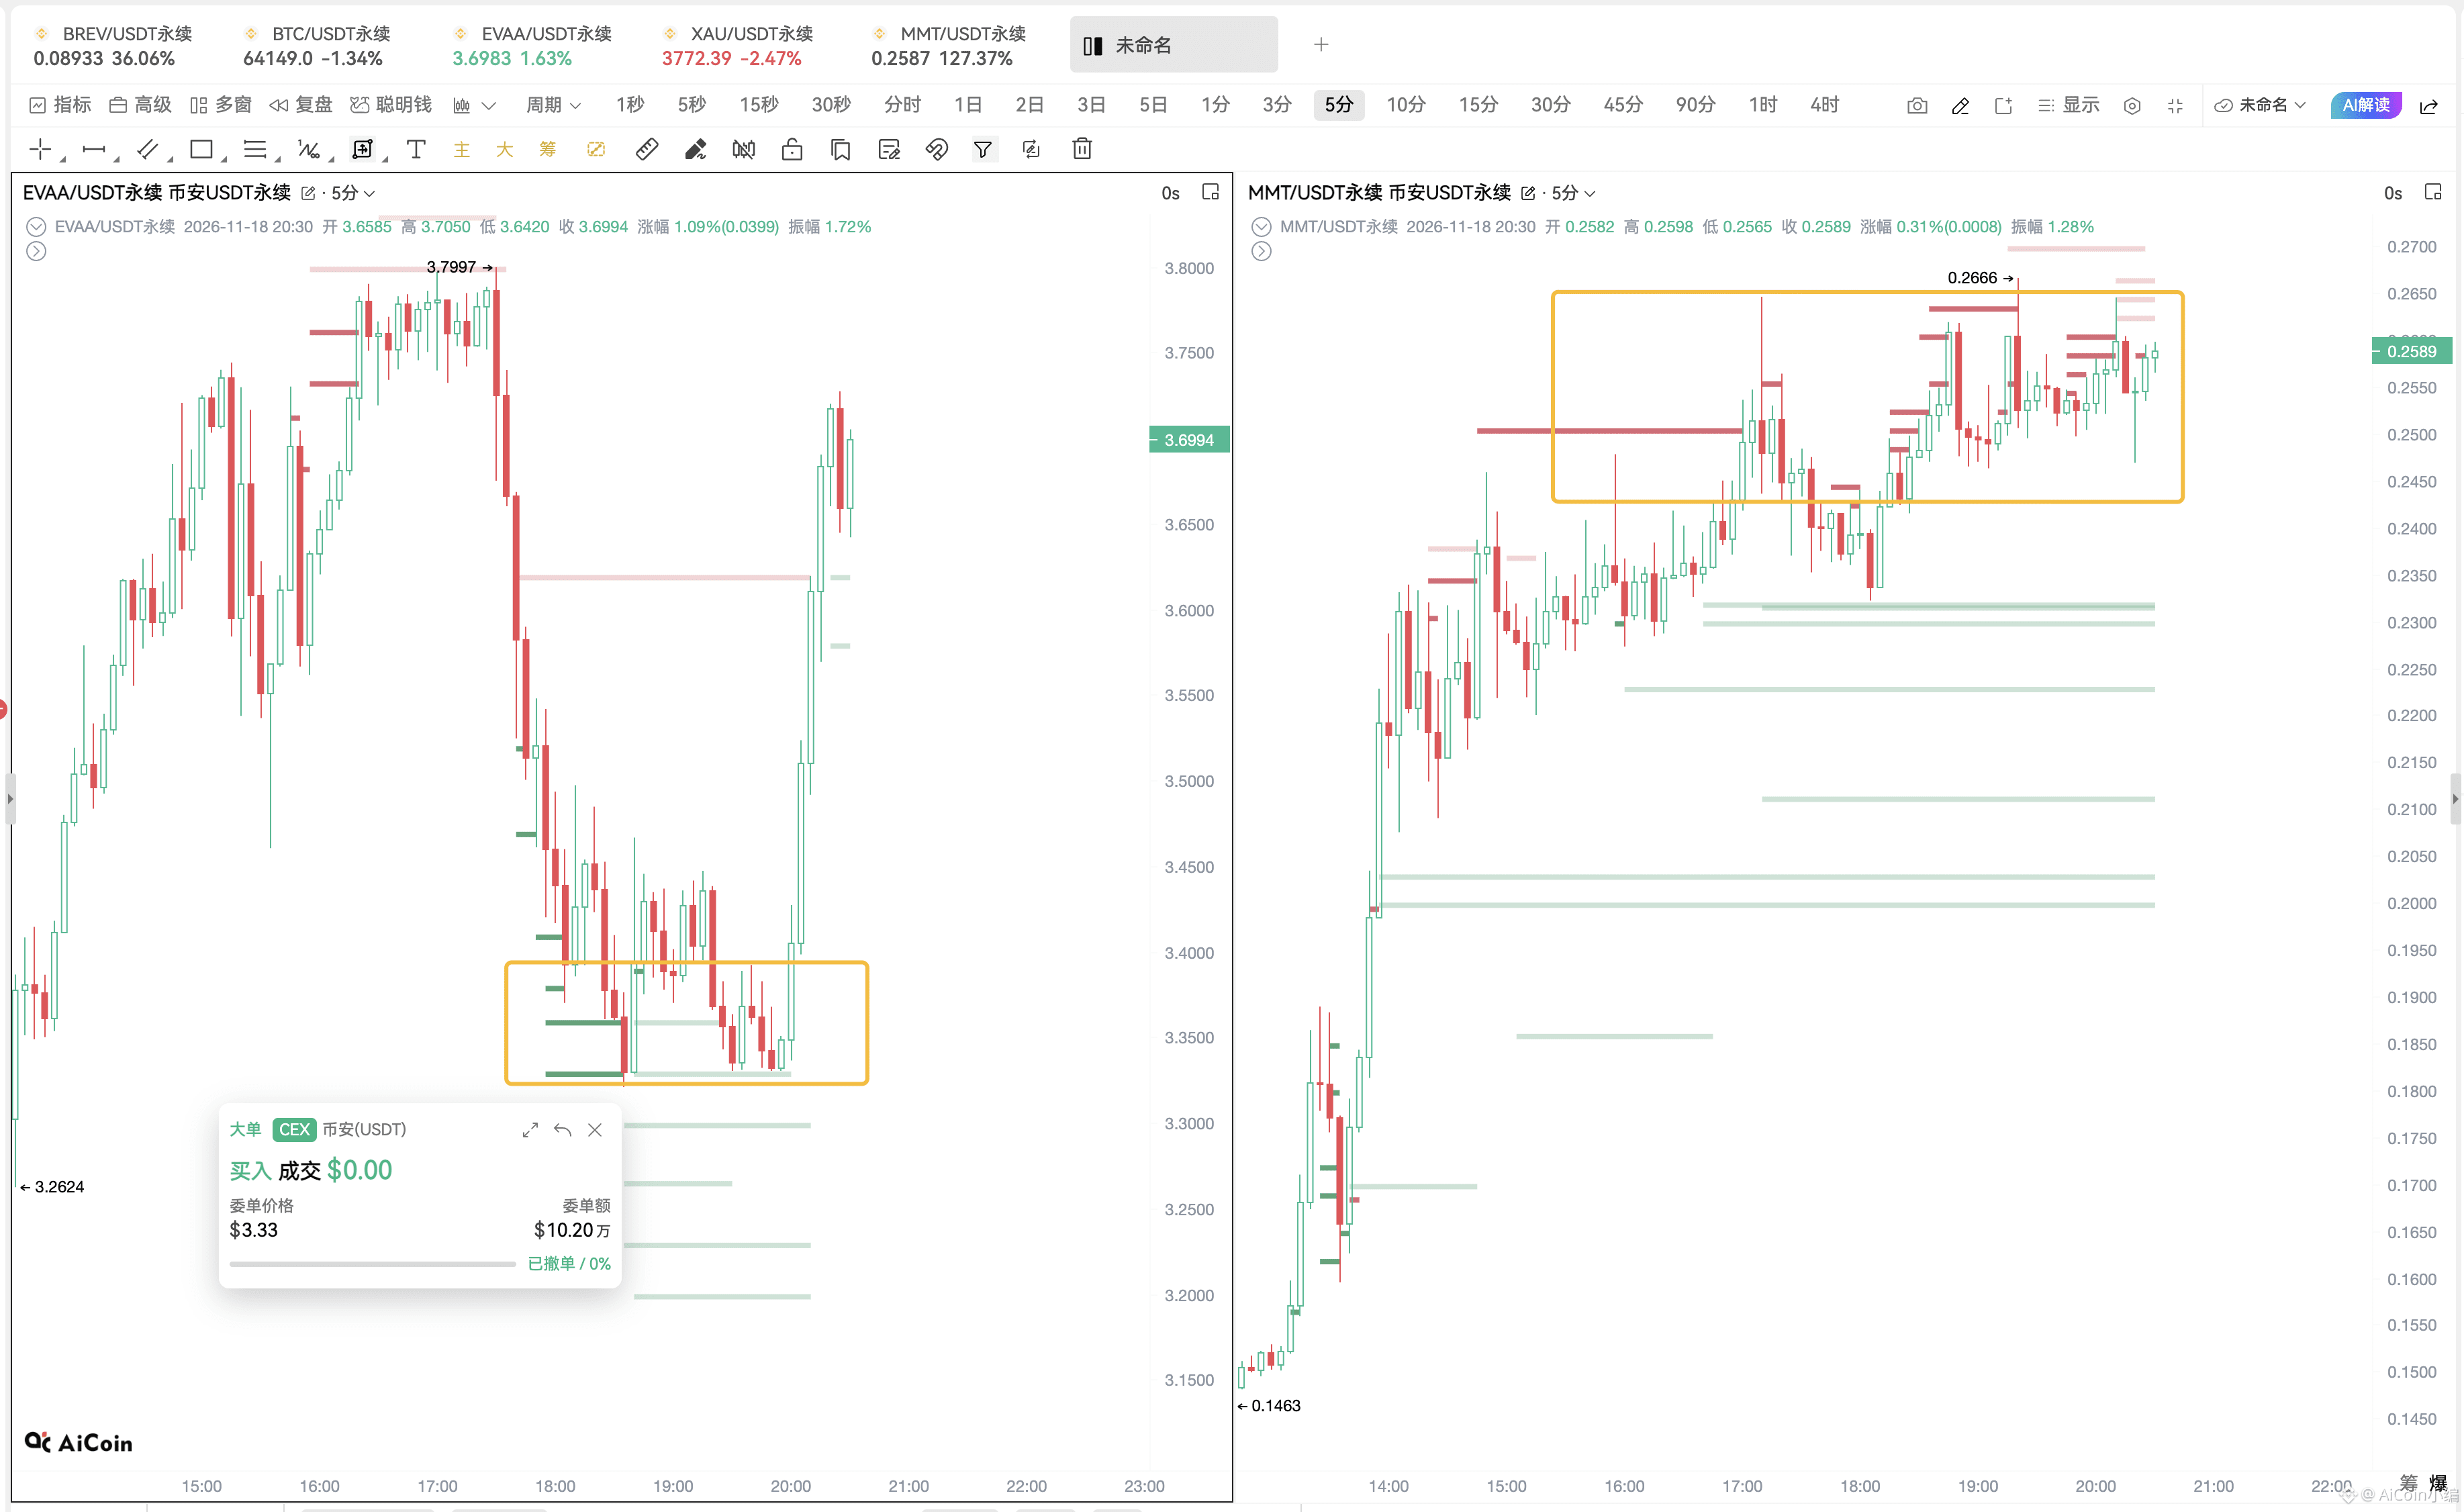
$EVAA has large buy orders providing support. I kept waiting for confirmation of buying pressure in the evening, but it shot up while I was having dinner 😅. Now waiting for buy orders around 3.62–3.54~
$MMT : Large orders closing long positions keep getting filled near the current price—the big players are taking profits. I’ll wait for a confirmed breakout above 2.66 before considering it.
$EVAA has large buy orders providing support. I kept waiting for confirmation of buying pressure in the evening, but it shot up while I was having dinner 😅. Now waiting for buy orders around 3.62–3.54~
$MMT : Large orders closing long positions keep getting filled near the current price—the big players are taking profits. I’ll wait for a confirmed breakout above 2.66 before considering it.
$MMT : Large orders closing long positions keep getting filled near the current price—the big players are taking profits. I’ll wait for a confirmed breakout above 2.66 before considering it.
804
·
--
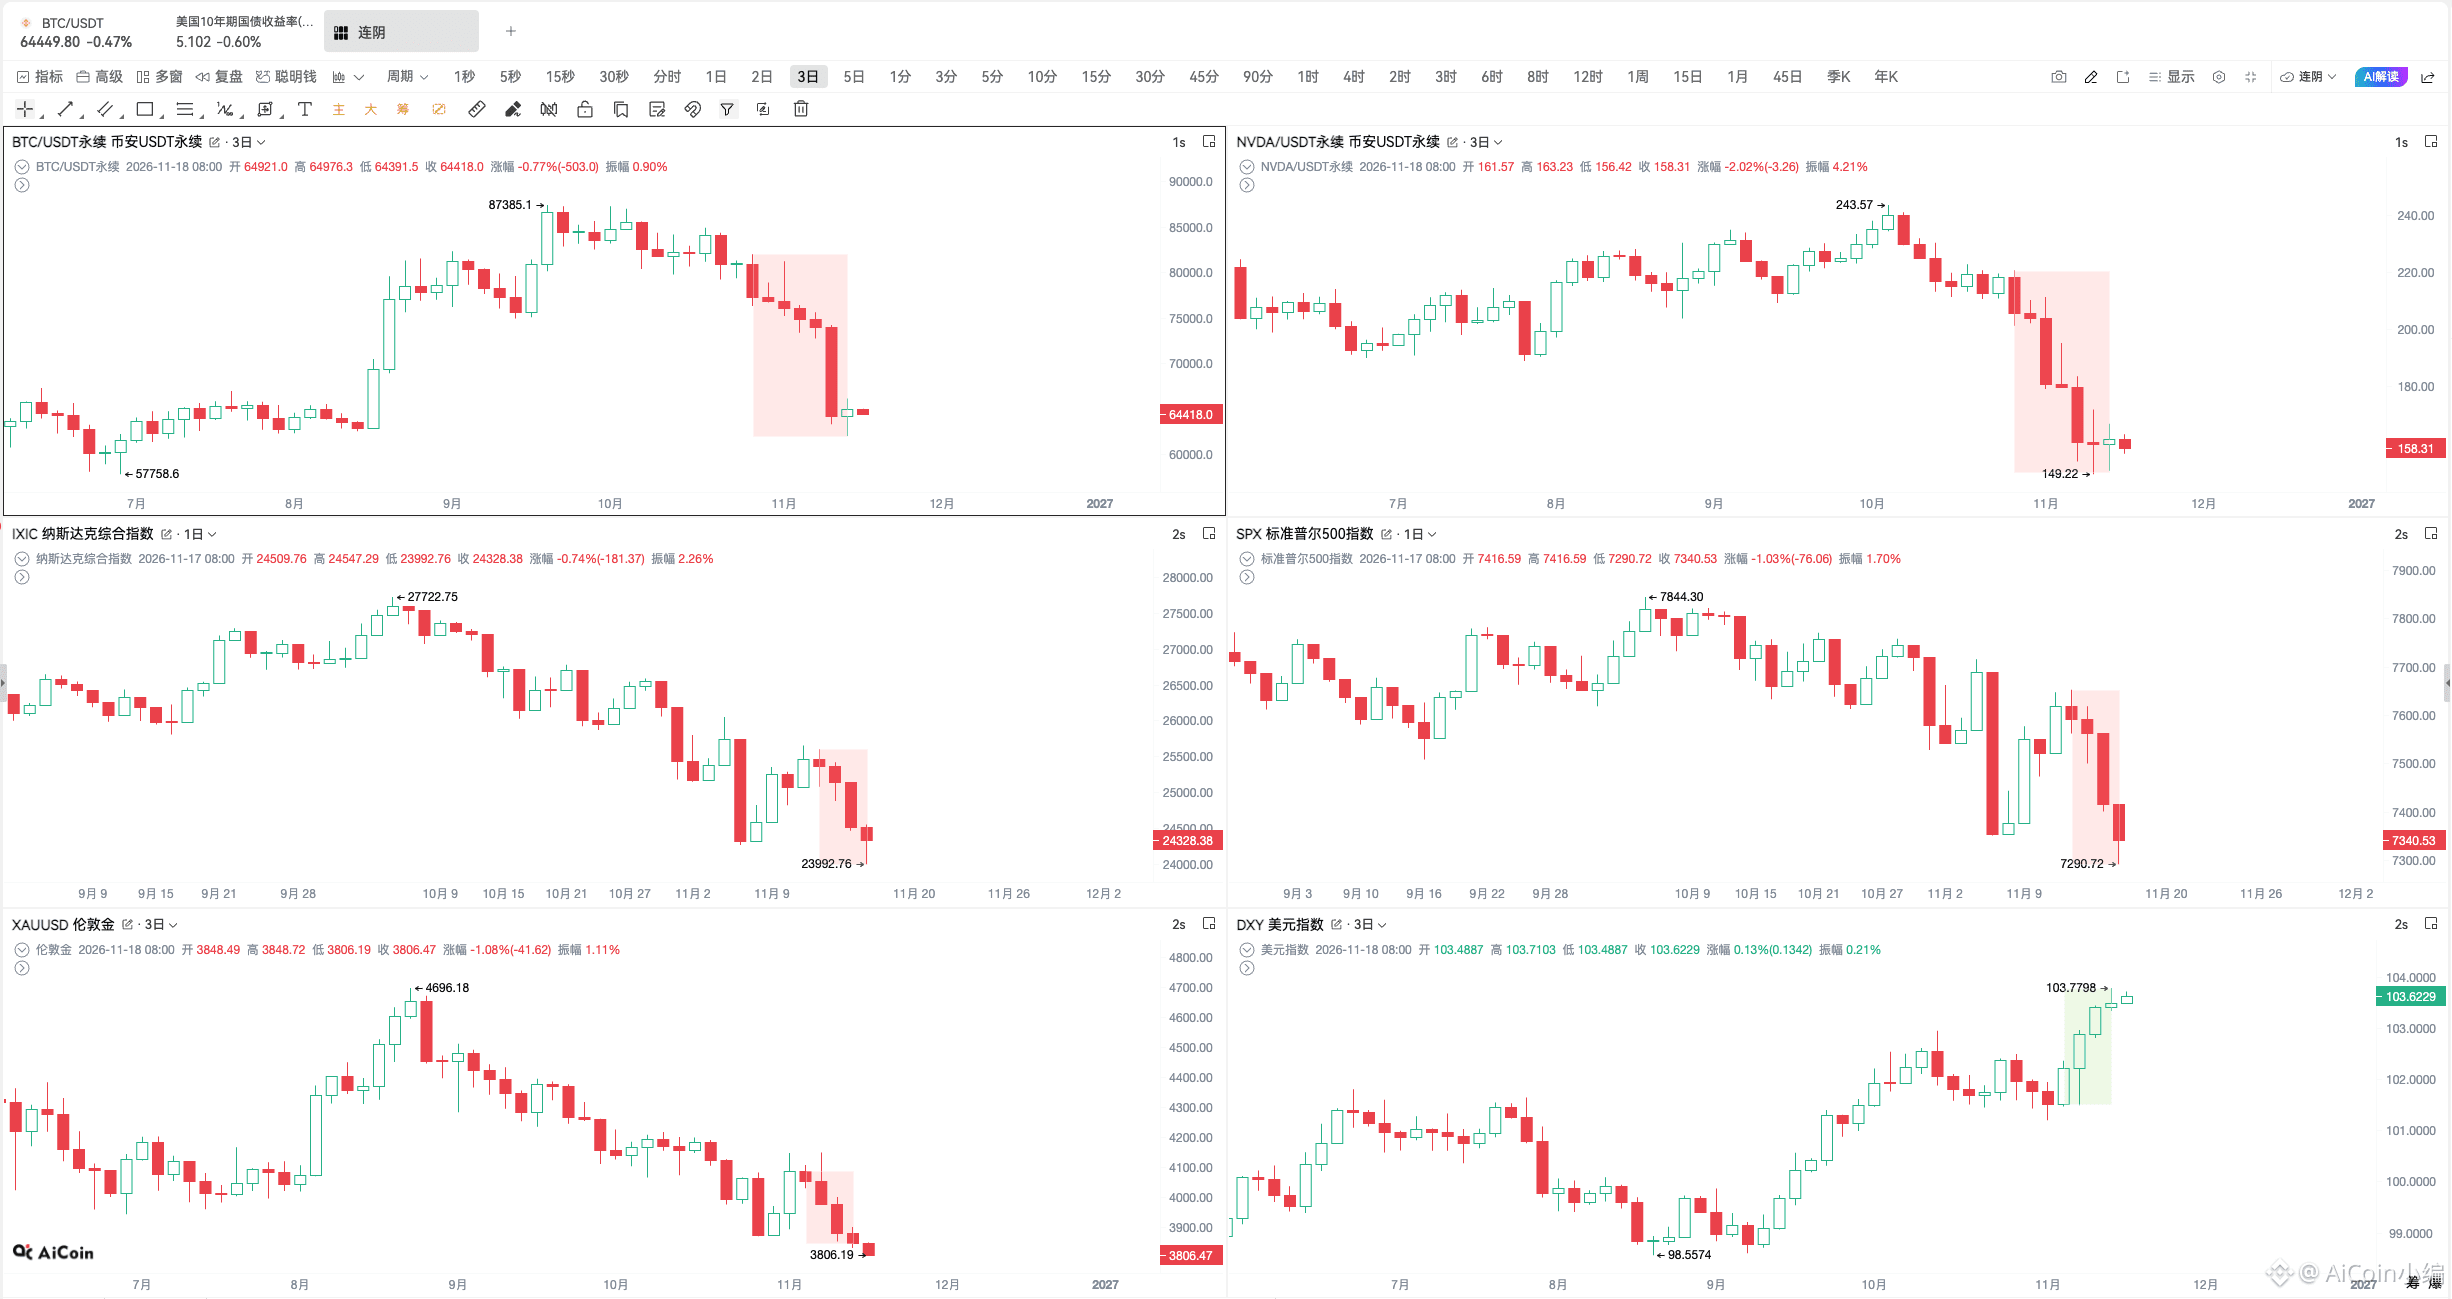
$BTC , $NVDA ended a 6-candle losing streak on the 3-day chart 🤩
BTC first swept down through the $63,860–$63,630 long liquidation zone last night, then rebounded.
NVDA, meanwhile, got a boost from its earnings report.
- Revenue: $115.8 billion, about 6% above expectations;
- Data center: $107.6 billion, about 5.6% above expectations;
- EPS: $2.68, about 8.5% above expectations;
- Q4 guidance: $130 billion, about 4% above expectations.
But the broader market still hasn't turned around. 🥲
The Nasdaq and S&P 500 are now on 4-day losing streaks on the daily chart, and London gold is also on a 4-candle losing streak on the 3-day chart.
So last night's move looked more like a brief breather for the two assets that had fallen hardest recently. Risk appetite hasn't really returned yet.
BTC is still on a 6-week losing streak on the weekly chart.
If it can close the week back in the green, that would carry more weight than ending its 6-candle losing streak on the 3-day chart last night.
Note: NVDA data is based on the Binance NVDA/USDT perpetual contract, not U.S. stock spot prices.
$BTC , $NVDA ended a 6-candle losing streak on the 3-day chart 🤩
BTC first swept down through the $63,860–$63,630 long liquidation zone last night, then rebounded.
NVDA, meanwhile, got a boost from its earnings report.
- Revenue: $115.8 billion, about 6% above expectations;
- Data center: $107.6 billion, about 5.6% above expectations;
- EPS: $2.68, about 8.5% above expectations;
- Q4 guidance: $130 billion, about 4% above expectations.
But the broader market still hasn't turned around. 🥲
The Nasdaq and S&P 500 are now on 4-day losing streaks on the daily chart, and London gold is also on a 4-candle losing streak on the 3-day chart.
So last night's move looked more like a brief breather for the two assets that had fallen hardest recently. Risk appetite hasn't really returned yet.
BTC is still on a 6-week losing streak on the weekly chart.
If it can close the week back in the green, that would carry more weight than ending its 6-candle losing streak on the 3-day chart last night.
Note: NVDA data is based on the Binance NVDA/USDT perpetual contract, not U.S. stock spot prices.
BTC first swept down through the $63,860–$63,630 long liquidation zone last night, then rebounded.
NVDA, meanwhile, got a boost from its earnings report.
- Revenue: $115.8 billion, about 6% above expectations;
- Data center: $107.6 billion, about 5.6% above expectations;
- EPS: $2.68, about 8.5% above expectations;
- Q4 guidance: $130 billion, about 4% above expectations.
But the broader market still hasn't turned around. 🥲
The Nasdaq and S&P 500 are now on 4-day losing streaks on the daily chart, and London gold is also on a 4-candle losing streak on the 3-day chart.
So last night's move looked more like a brief breather for the two assets that had fallen hardest recently. Risk appetite hasn't really returned yet.
BTC is still on a 6-week losing streak on the weekly chart.
If it can close the week back in the green, that would carry more weight than ending its 6-candle losing streak on the 3-day chart last night.
Note: NVDA data is based on the Binance NVDA/USDT perpetual contract, not U.S. stock spot prices.
425
·
--
Bullish
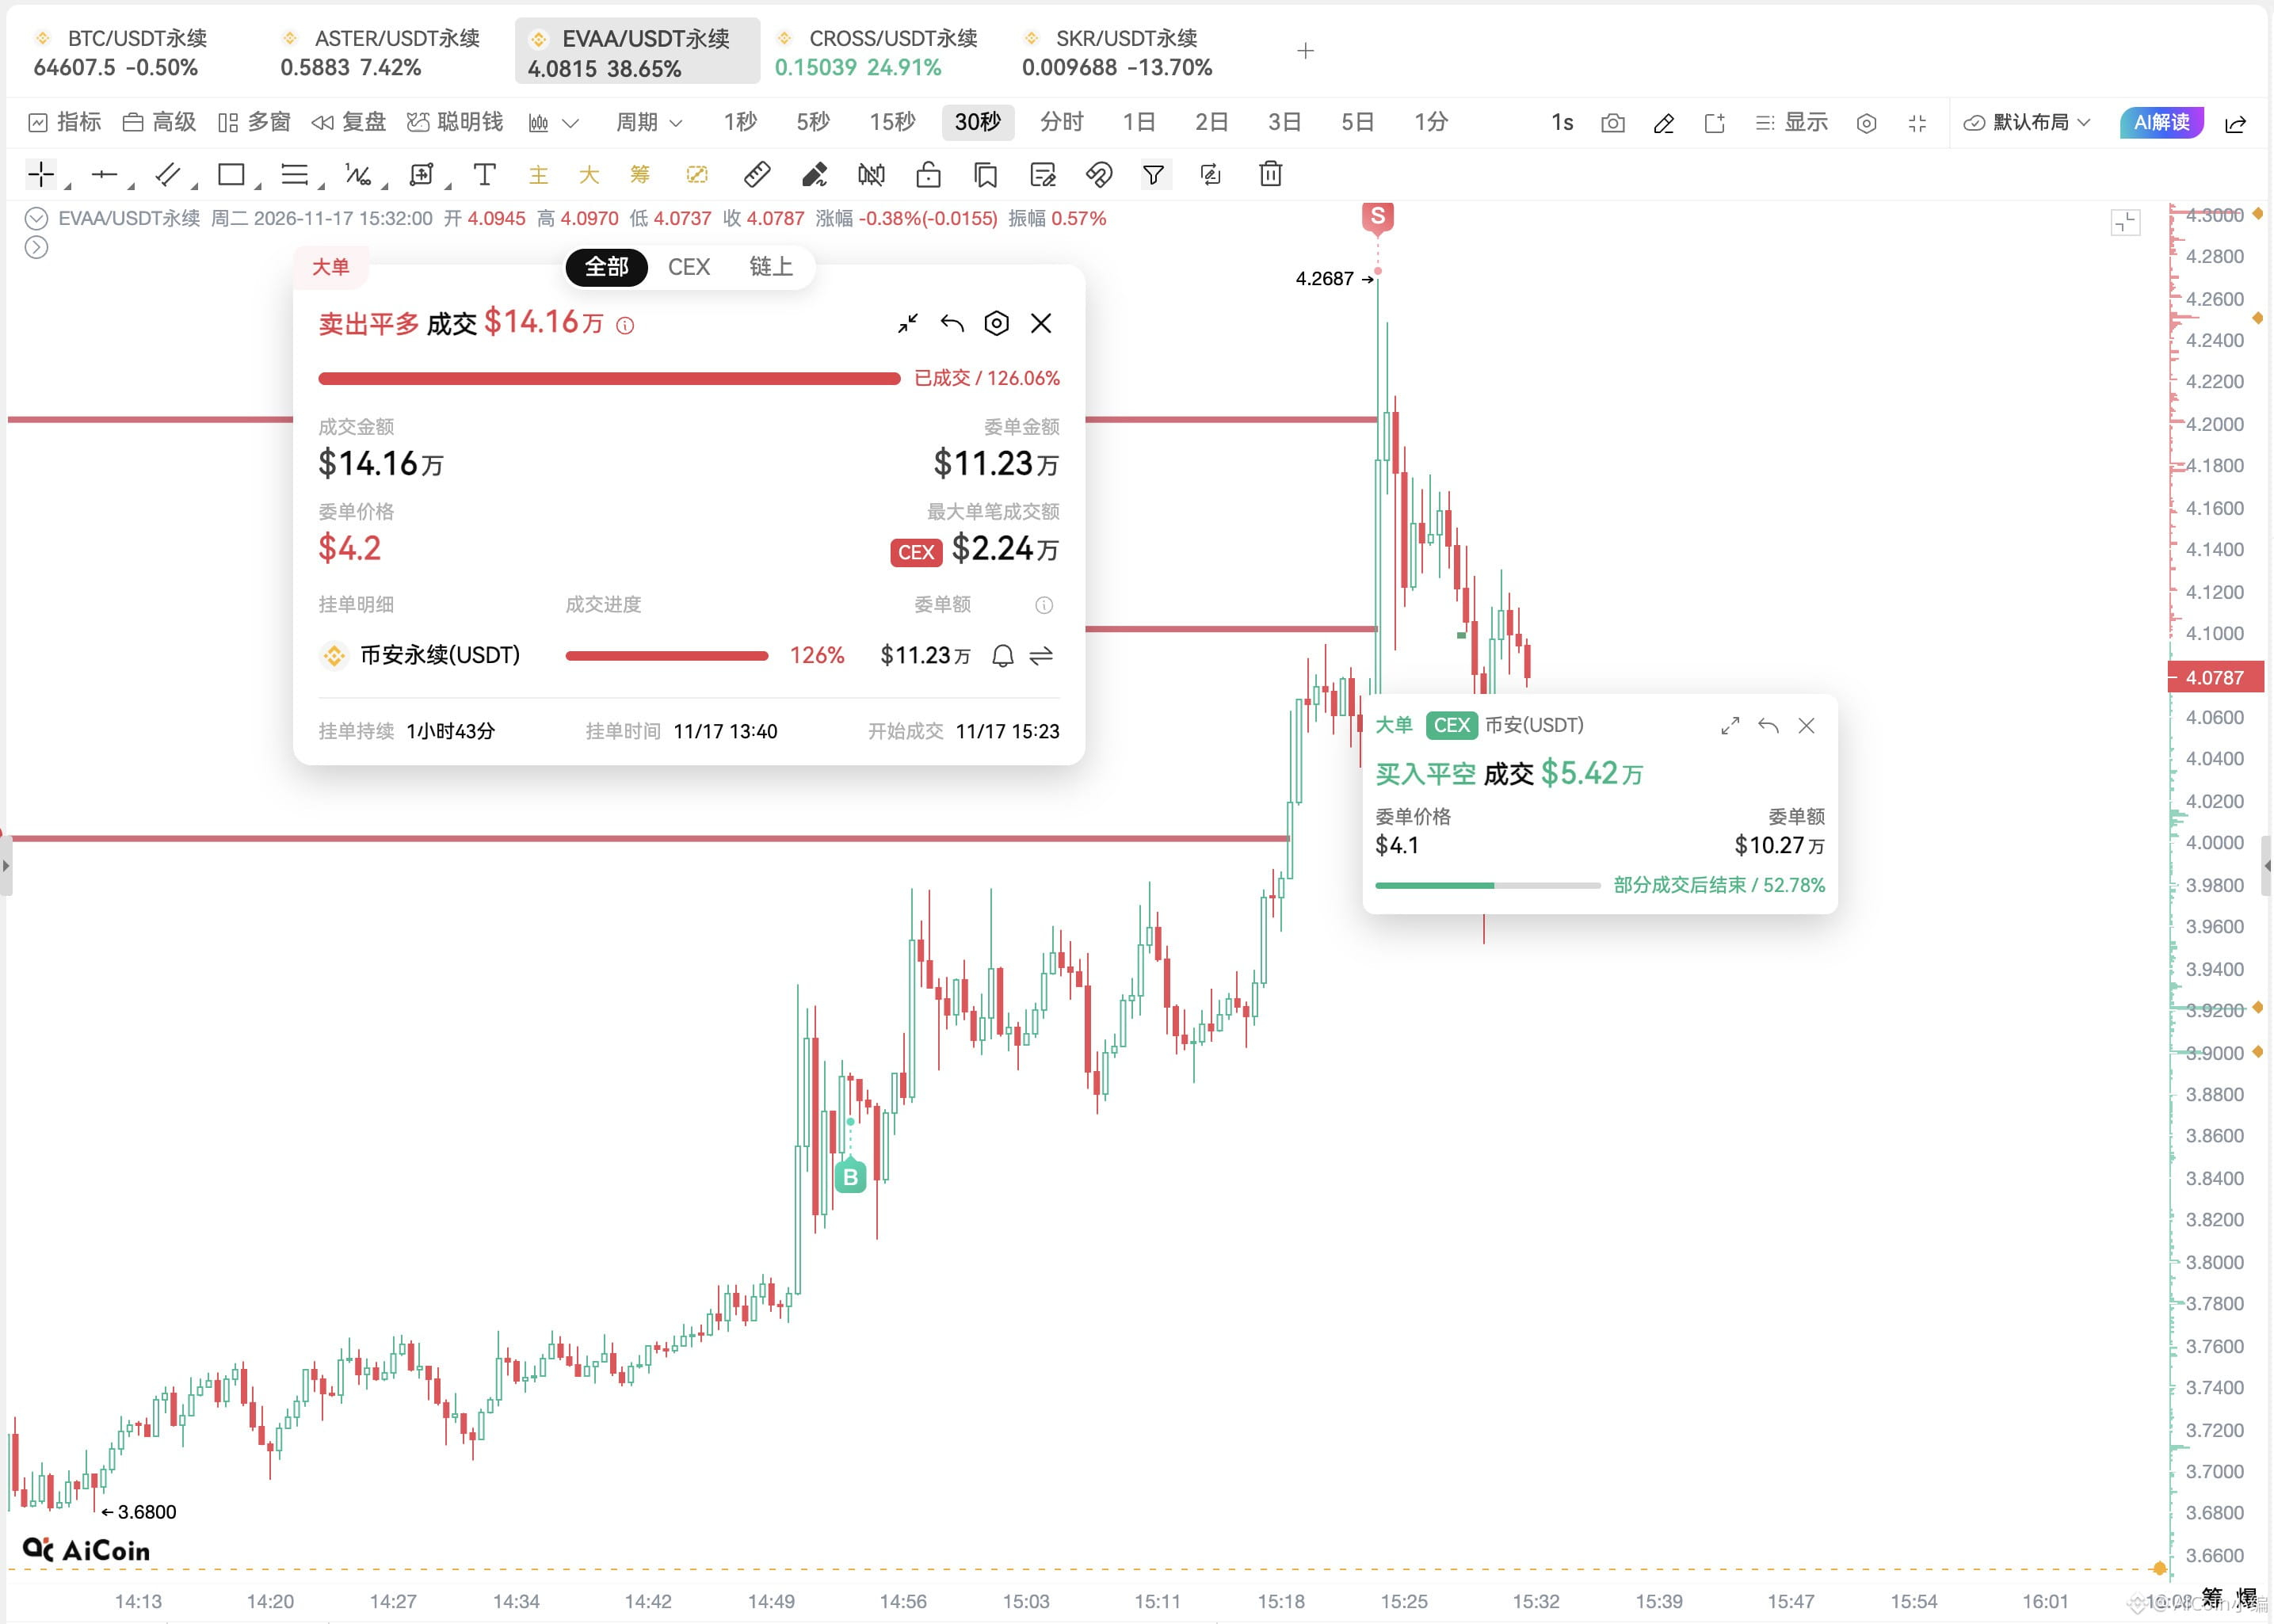
For a short-term trade, I chased a move following the large limit order $EVAA . Canceled, canceled—the sell order was filled, and the buy-side support didn't come through either. I'll wait for a pullback confirmation.
For a short-term trade, I chased a move following the large limit order $EVAA . Canceled, canceled—the sell order was filled, and the buy-side support didn't come through either. I'll wait for a pullback confirmation.
284
·
--
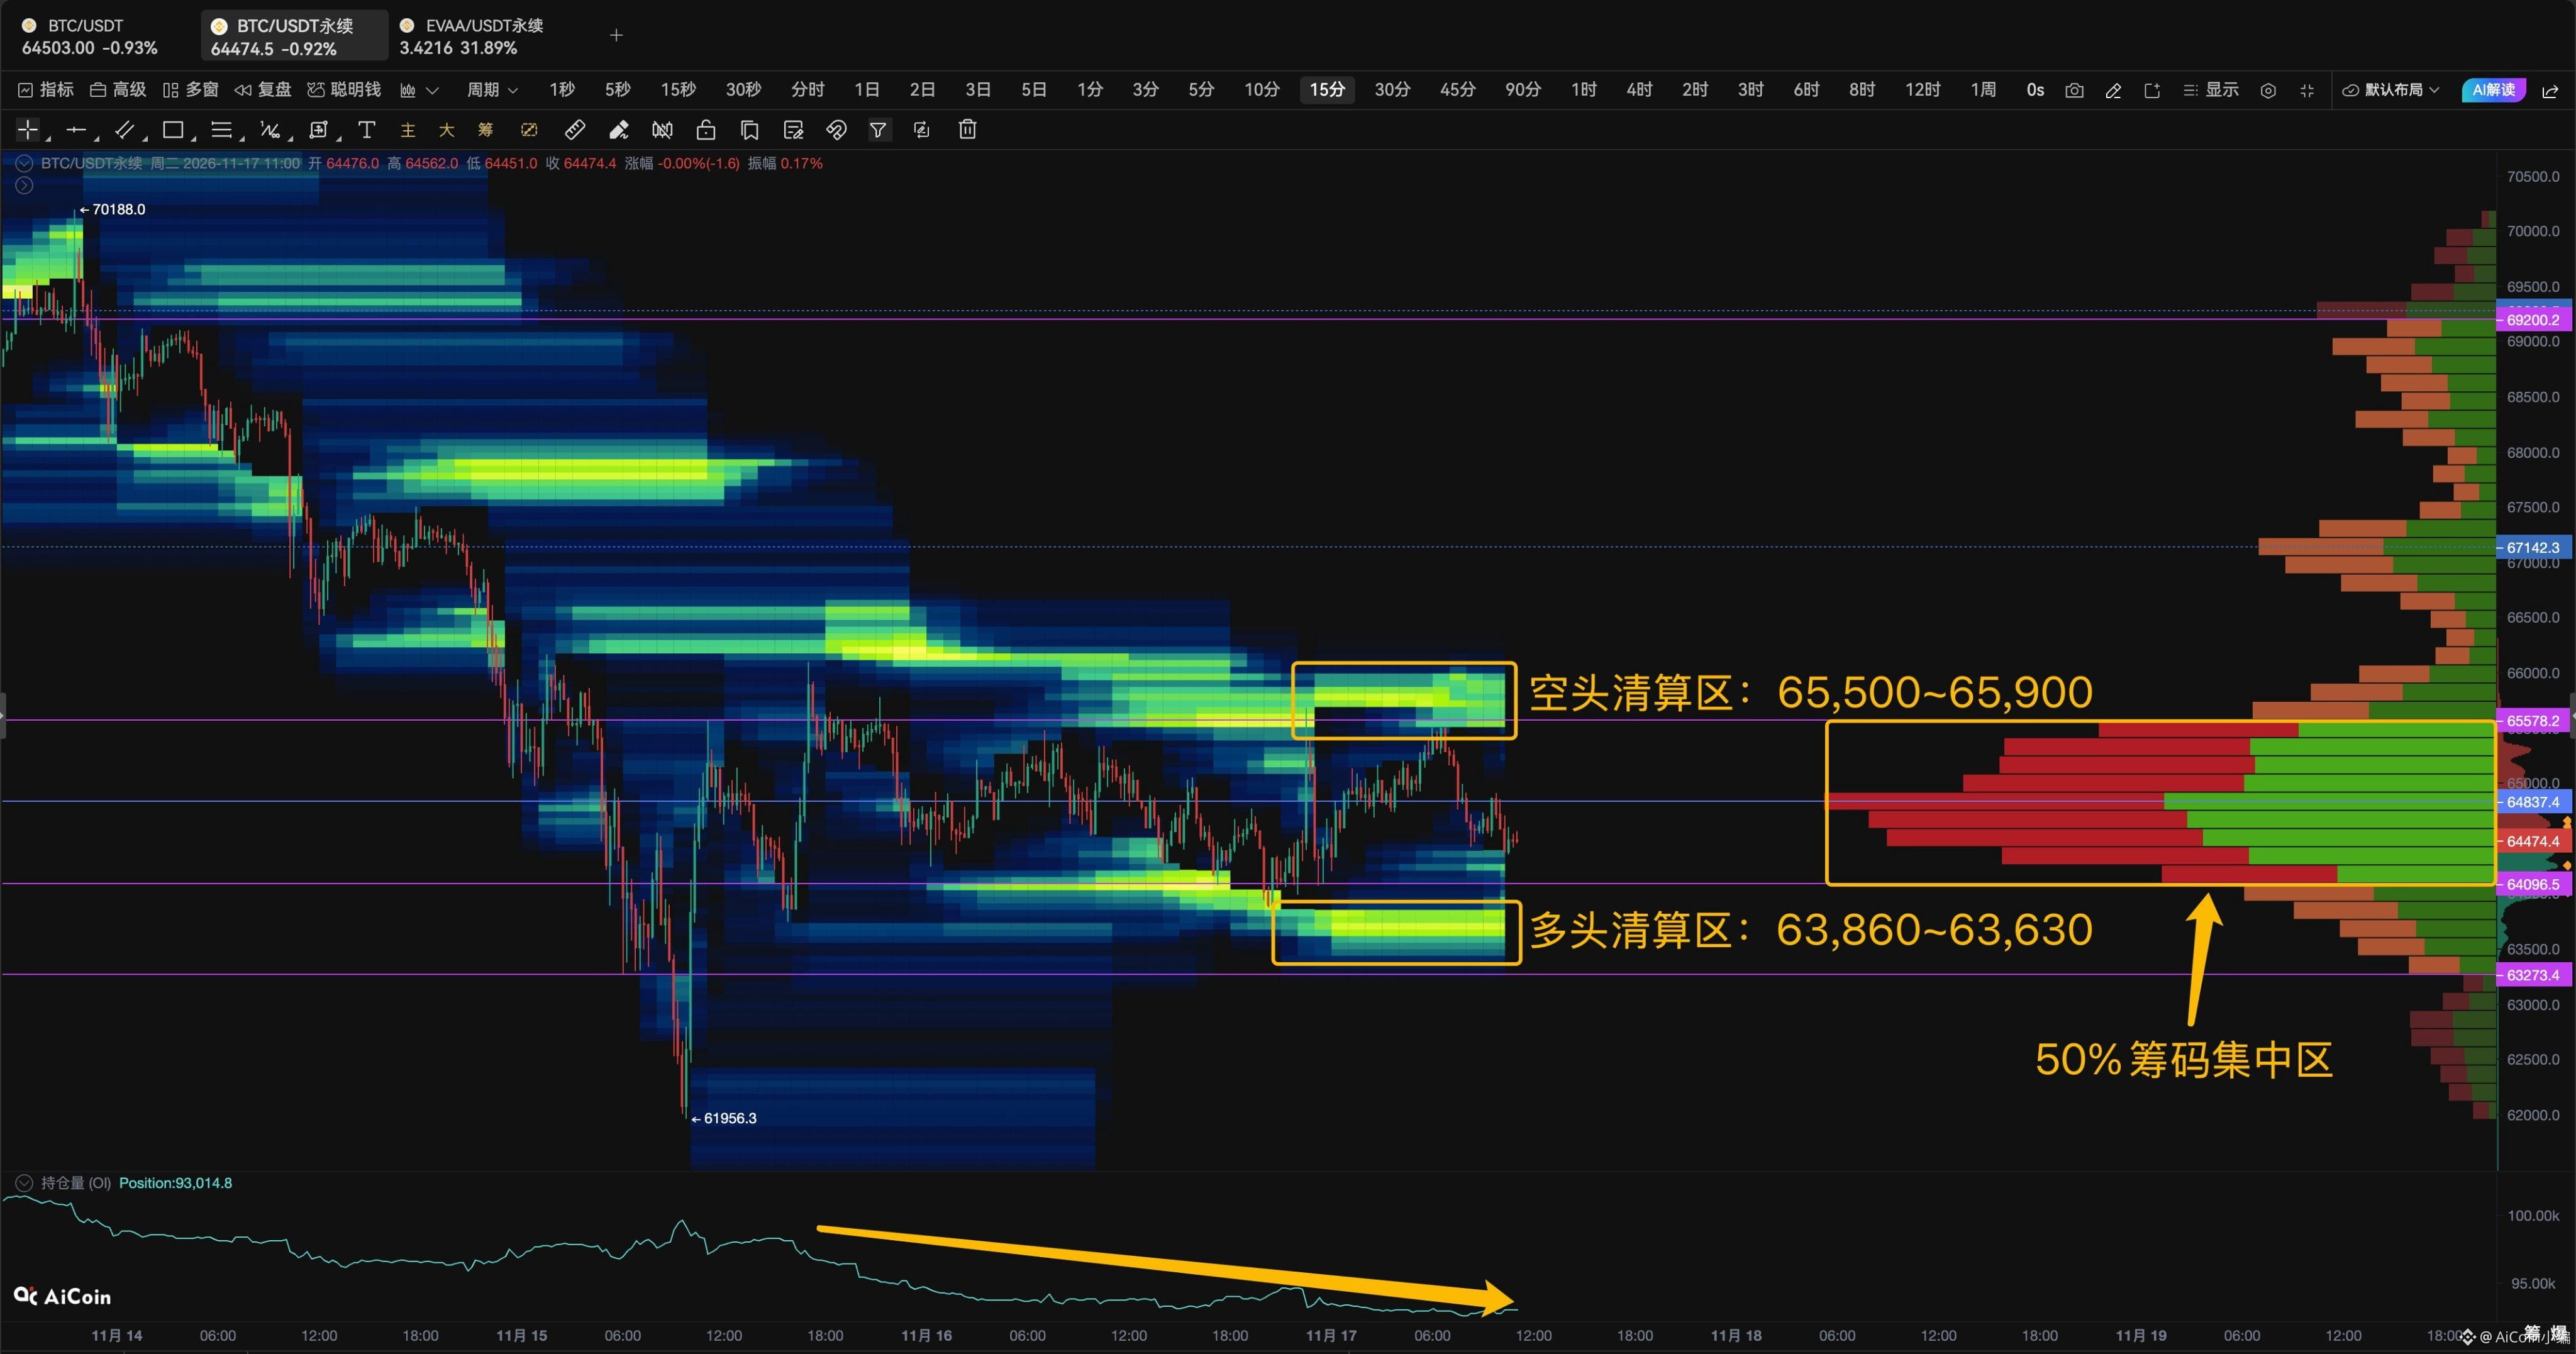
$BTC The main things to watch over the past two days are OI and the value area on the heatmap 👀
OI has continued to decline, with positions in the derivatives market steadily shrinking, but the price has never moved outside the value area.
This means leverage is still being flushed out, but so far, it hasn’t escalated into a price imbalance.
Looking at the liquidation heatmap, liquidity is concentrated right around both sides of the value area:
🔺 Above 65,500–65,900: short liquidation zone + upper edge of the value area
🔻 Below 63,860–63,630: long liquidation zone + lower edge of the value area
These two ranges are essentially the most important liquidity zones for the short term. Whichever side first moves out of the value area is more likely to accelerate, fueled by liquidation liquidity.
$BTC The main things to watch over the past two days are OI and the value area on the heatmap 👀
OI has continued to decline, with positions in the derivatives market steadily shrinking, but the price has never moved outside the value area.
This means leverage is still being flushed out, but so far, it hasn’t escalated into a price imbalance.
Looking at the liquidation heatmap, liquidity is concentrated right around both sides of the value area:
🔺 Above 65,500–65,900: short liquidation zone + upper edge of the value area
🔻 Below 63,860–63,630: long liquidation zone + lower edge of the value area
These two ranges are essentially the most important liquidity zones for the short term. Whichever side first moves out of the value area is more likely to accelerate, fueled by liquidation liquidity.
OI has continued to decline, with positions in the derivatives market steadily shrinking, but the price has never moved outside the value area.
This means leverage is still being flushed out, but so far, it hasn’t escalated into a price imbalance.
Looking at the liquidation heatmap, liquidity is concentrated right around both sides of the value area:
🔺 Above 65,500–65,900: short liquidation zone + upper edge of the value area
🔻 Below 63,860–63,630: long liquidation zone + lower edge of the value area
These two ranges are essentially the most important liquidity zones for the short term. Whichever side first moves out of the value area is more likely to accelerate, fueled by liquidation liquidity.
95
·
--
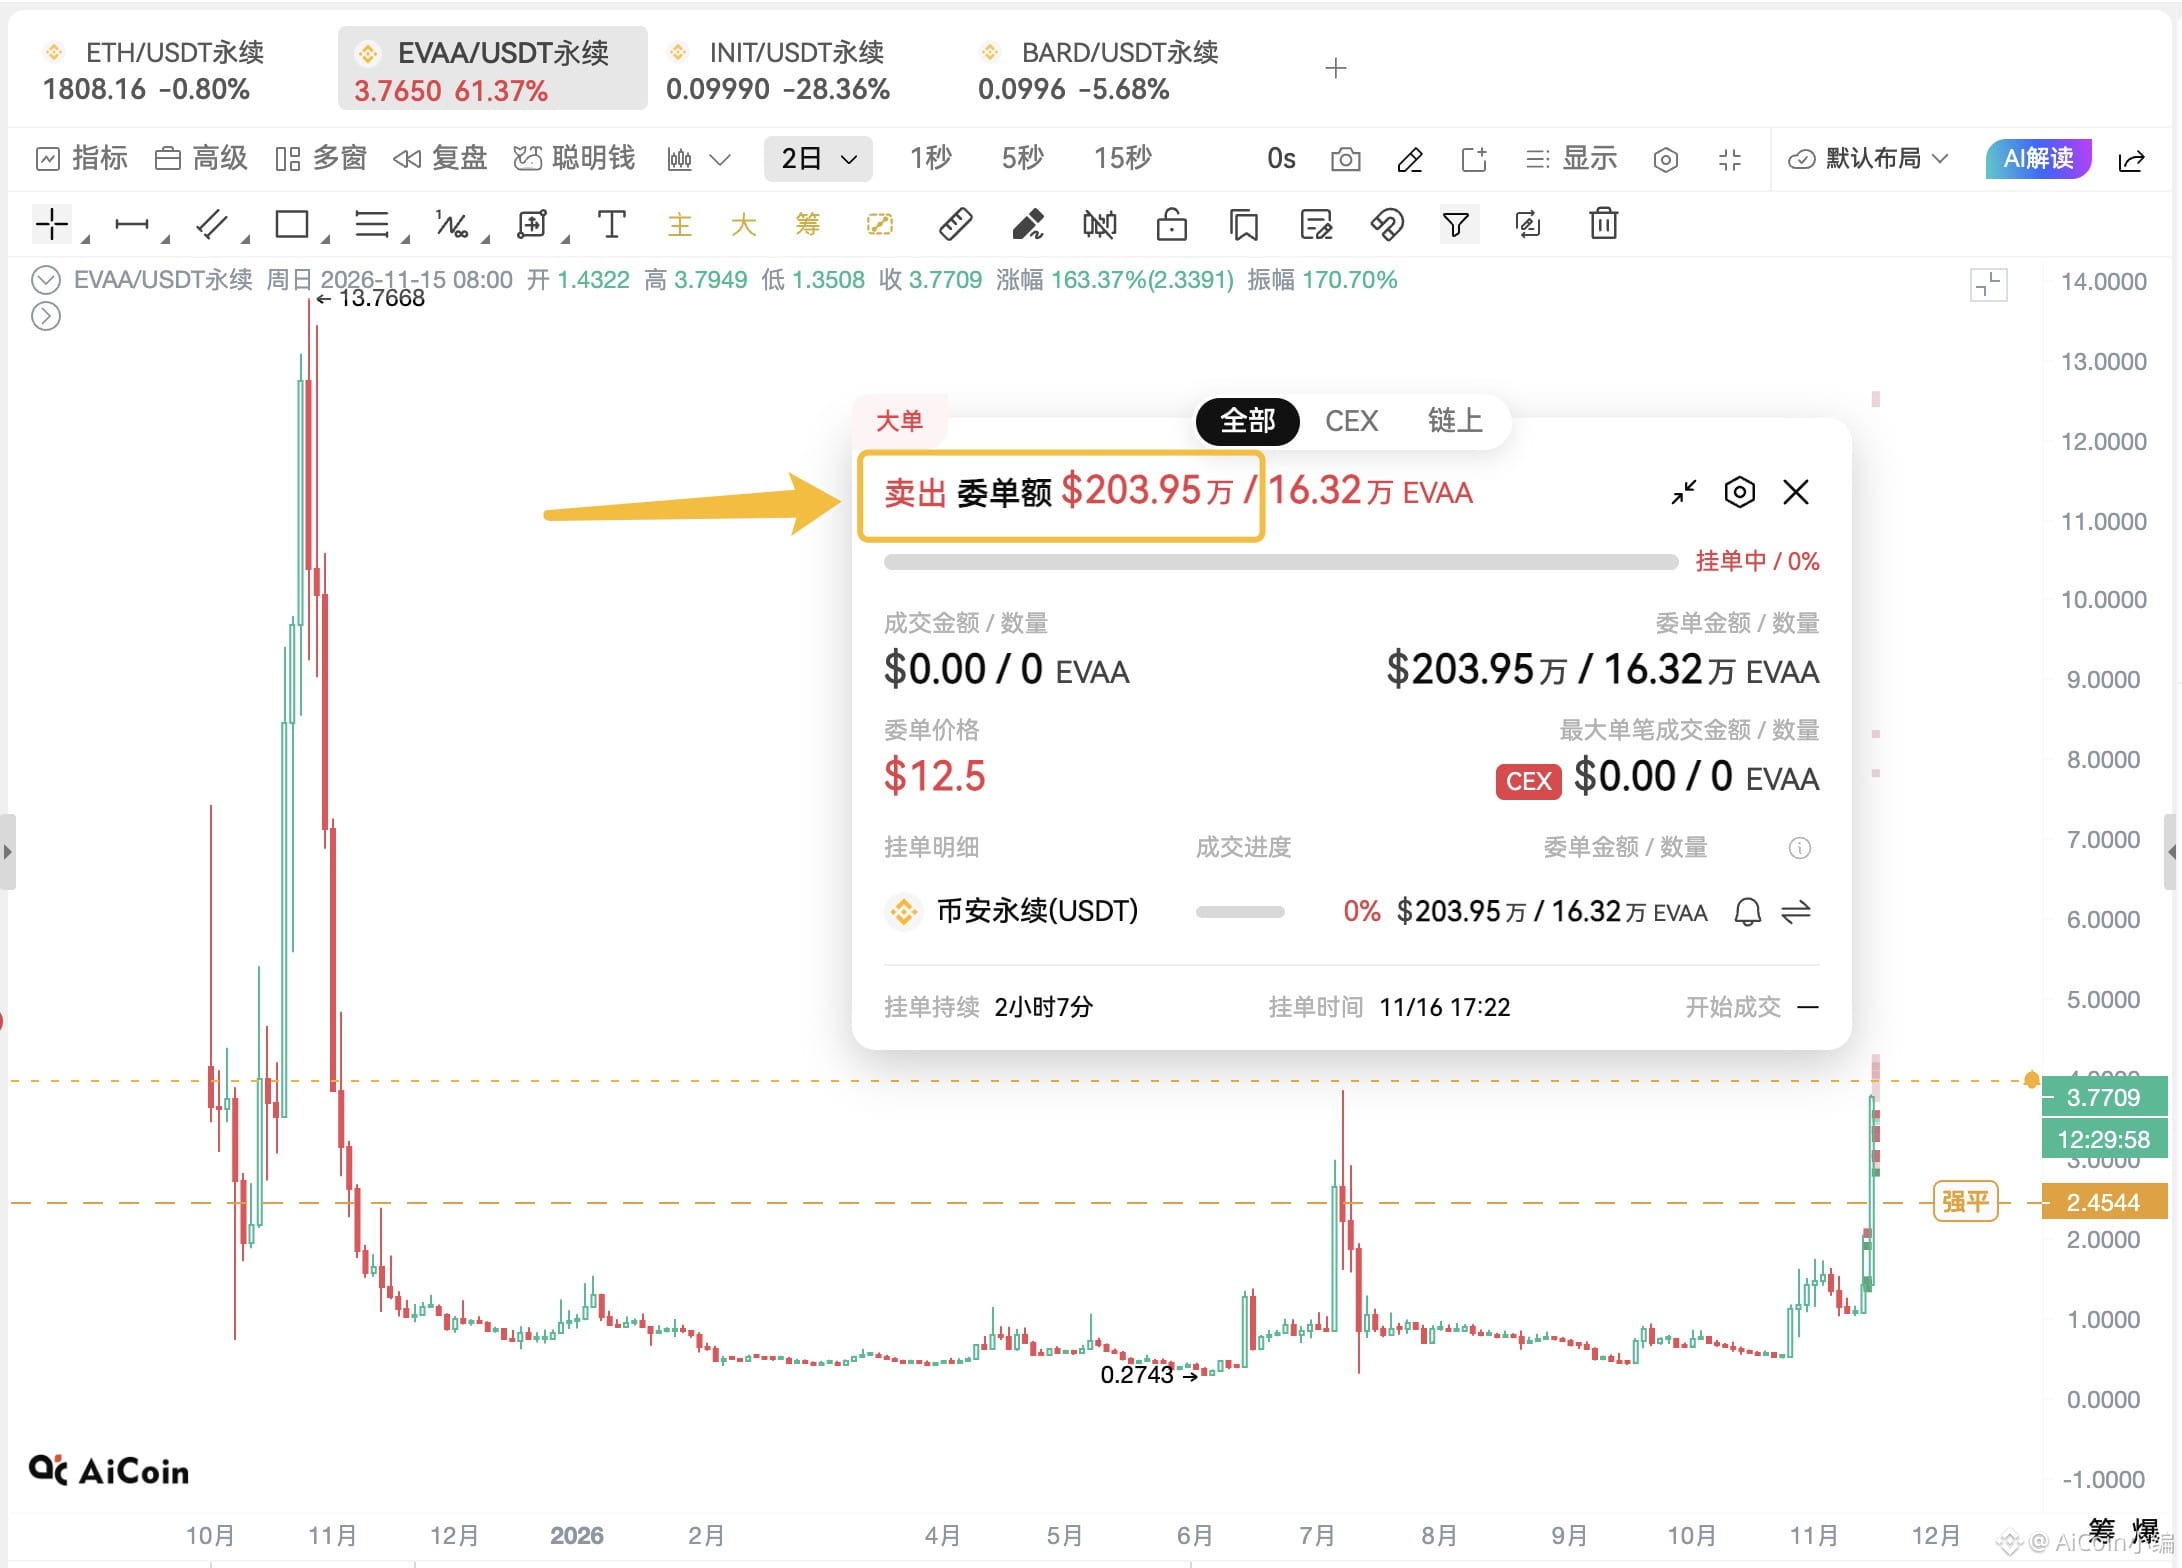
An absurd sell order worth $2.03 million appeared for $EVAA at $12.5; the price would need to rise another 230% for it to be filled
An absurd sell order worth $2.03 million appeared for $EVAA at $12.5; the price would need to rise another 230% for it to be filled
2
2.6k
·
--
Bearish
Who exactly is dumping BTC this time—$BTC ?! 🤨
No guessing institutions or whales, and no talking about OTC or split orders.
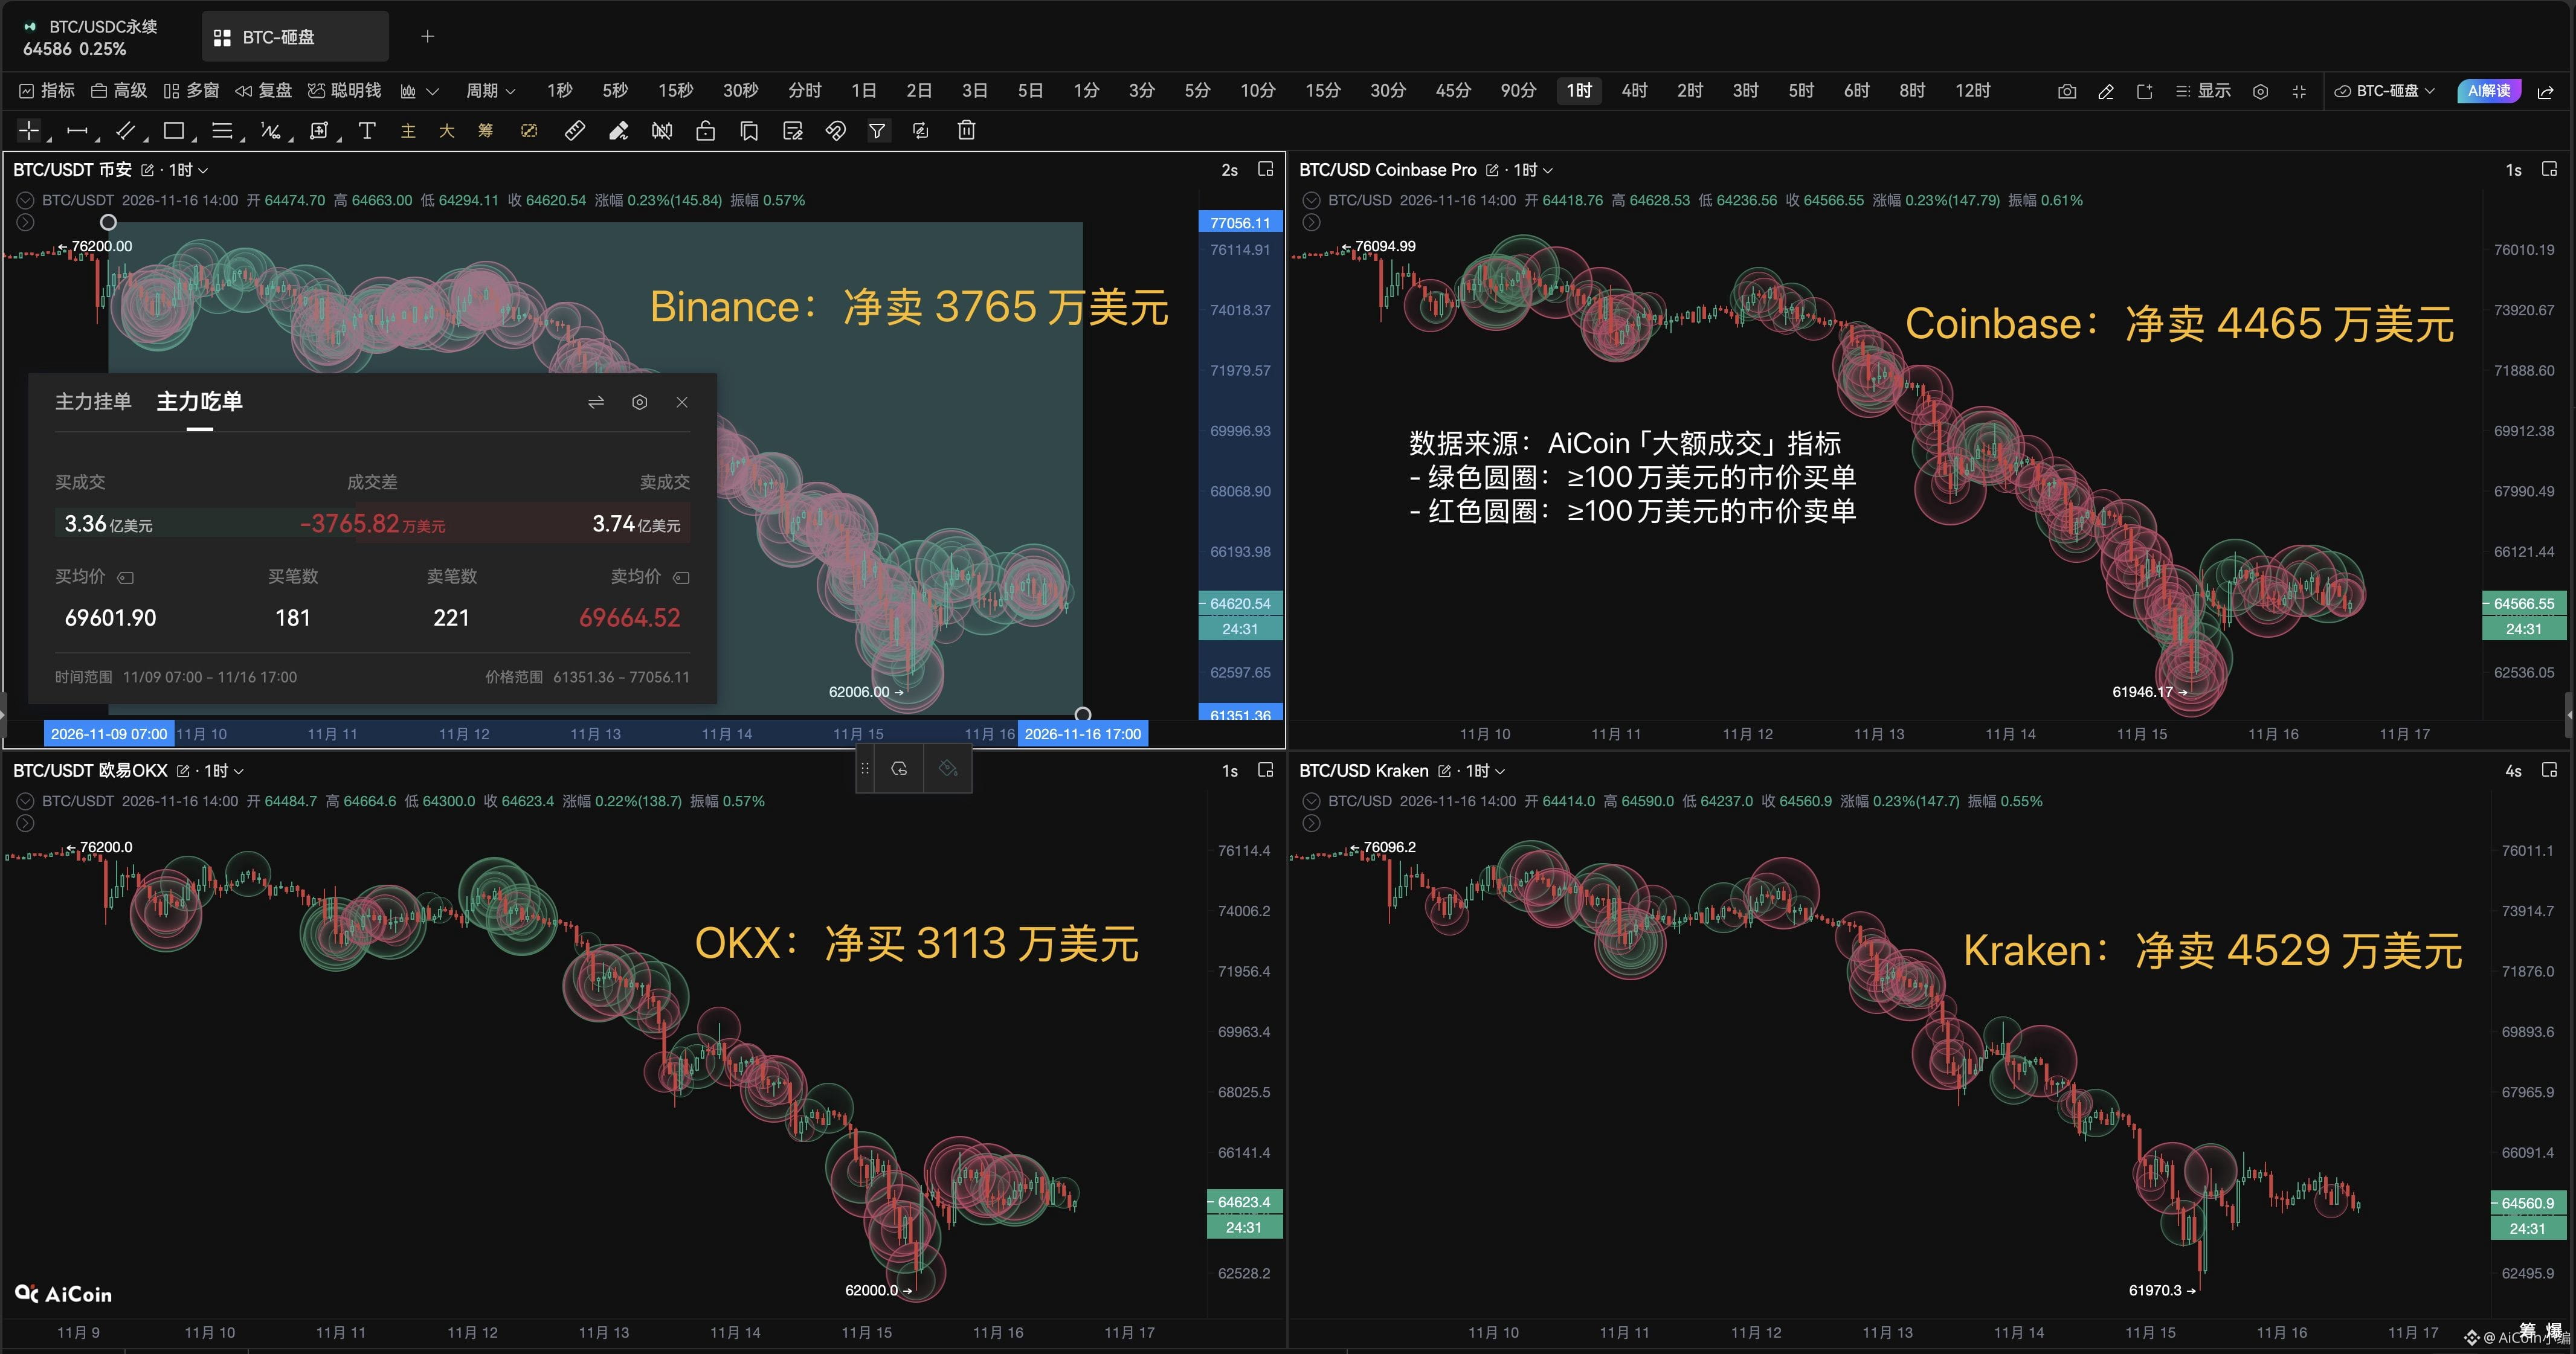
Just spot market orders of ≥$1 million over the past 7 days: 👇
- Binance: $336 million in aggressive buys, $374 million in aggressive sells, net sells of $37.65 million
- Coinbase: $185 million in aggressive buys, $230 million in aggressive sells, net sells of $44.65 million
- OKX: $112 million in aggressive buys, $80.43 million in aggressive sells, net buys of $31.13 million
- Kraken: $63.14 million in aggressive buys, $108 million in aggressive sells, net sells of $45.29 million
Across the four platforms, net selling totaled nearly $100 million, and the selling pressure was spread out—not driven by a single whale unloading on one exchange.
So at least by this measure, this drop wasn’t because “there were no buyers.” Rather, large aggressive sell orders kept dominating, while truly aggressive spot buying hasn’t returned yet.
BTC has now rebounded from 61,950 to around 64,300, but futures open interest (OI) is still declining. This looks more like a sideways recovery than a return of capital to the market.
So for now, I wouldn’t call this rebound a reversal. The real signs of a shift will be:
1️⃣ Spot net buying starts to show up consistently
2️⃣ Futures OI starts rising again
Who exactly is dumping BTC this time—$BTC ?! 🤨
No guessing institutions or whales, and no talking about OTC or split orders.
Just spot market orders of ≥$1 million over the past 7 days: 👇
- Binance: $336 million in aggressive buys, $374 million in aggressive sells, net sells of $37.65 million
- Coinbase: $185 million in aggressive buys, $230 million in aggressive sells, net sells of $44.65 million
- OKX: $112 million in aggressive buys, $80.43 million in aggressive sells, net buys of $31.13 million
- Kraken: $63.14 million in aggressive buys, $108 million in aggressive sells, net sells of $45.29 million
Across the four platforms, net selling totaled nearly $100 million, and the selling pressure was spread out—not driven by a single whale unloading on one exchange.
So at least by this measure, this drop wasn’t because “there were no buyers.” Rather, large aggressive sell orders kept dominating, while truly aggressive spot buying hasn’t returned yet.
BTC has now rebounded from 61,950 to around 64,300, but futures open interest (OI) is still declining. This looks more like a sideways recovery than a return of capital to the market.
So for now, I wouldn’t call this rebound a reversal. The real signs of a shift will be:
1️⃣ Spot net buying starts to show up consistently
2️⃣ Futures OI starts rising again
No guessing institutions or whales, and no talking about OTC or split orders.
Just spot market orders of ≥$1 million over the past 7 days: 👇
- Binance: $336 million in aggressive buys, $374 million in aggressive sells, net sells of $37.65 million
- Coinbase: $185 million in aggressive buys, $230 million in aggressive sells, net sells of $44.65 million
- OKX: $112 million in aggressive buys, $80.43 million in aggressive sells, net buys of $31.13 million
- Kraken: $63.14 million in aggressive buys, $108 million in aggressive sells, net sells of $45.29 million
Across the four platforms, net selling totaled nearly $100 million, and the selling pressure was spread out—not driven by a single whale unloading on one exchange.
So at least by this measure, this drop wasn’t because “there were no buyers.” Rather, large aggressive sell orders kept dominating, while truly aggressive spot buying hasn’t returned yet.
BTC has now rebounded from 61,950 to around 64,300, but futures open interest (OI) is still declining. This looks more like a sideways recovery than a return of capital to the market.
So for now, I wouldn’t call this rebound a reversal. The real signs of a shift will be:
1️⃣ Spot net buying starts to show up consistently
2️⃣ Futures OI starts rising again
171
·
--
See translation
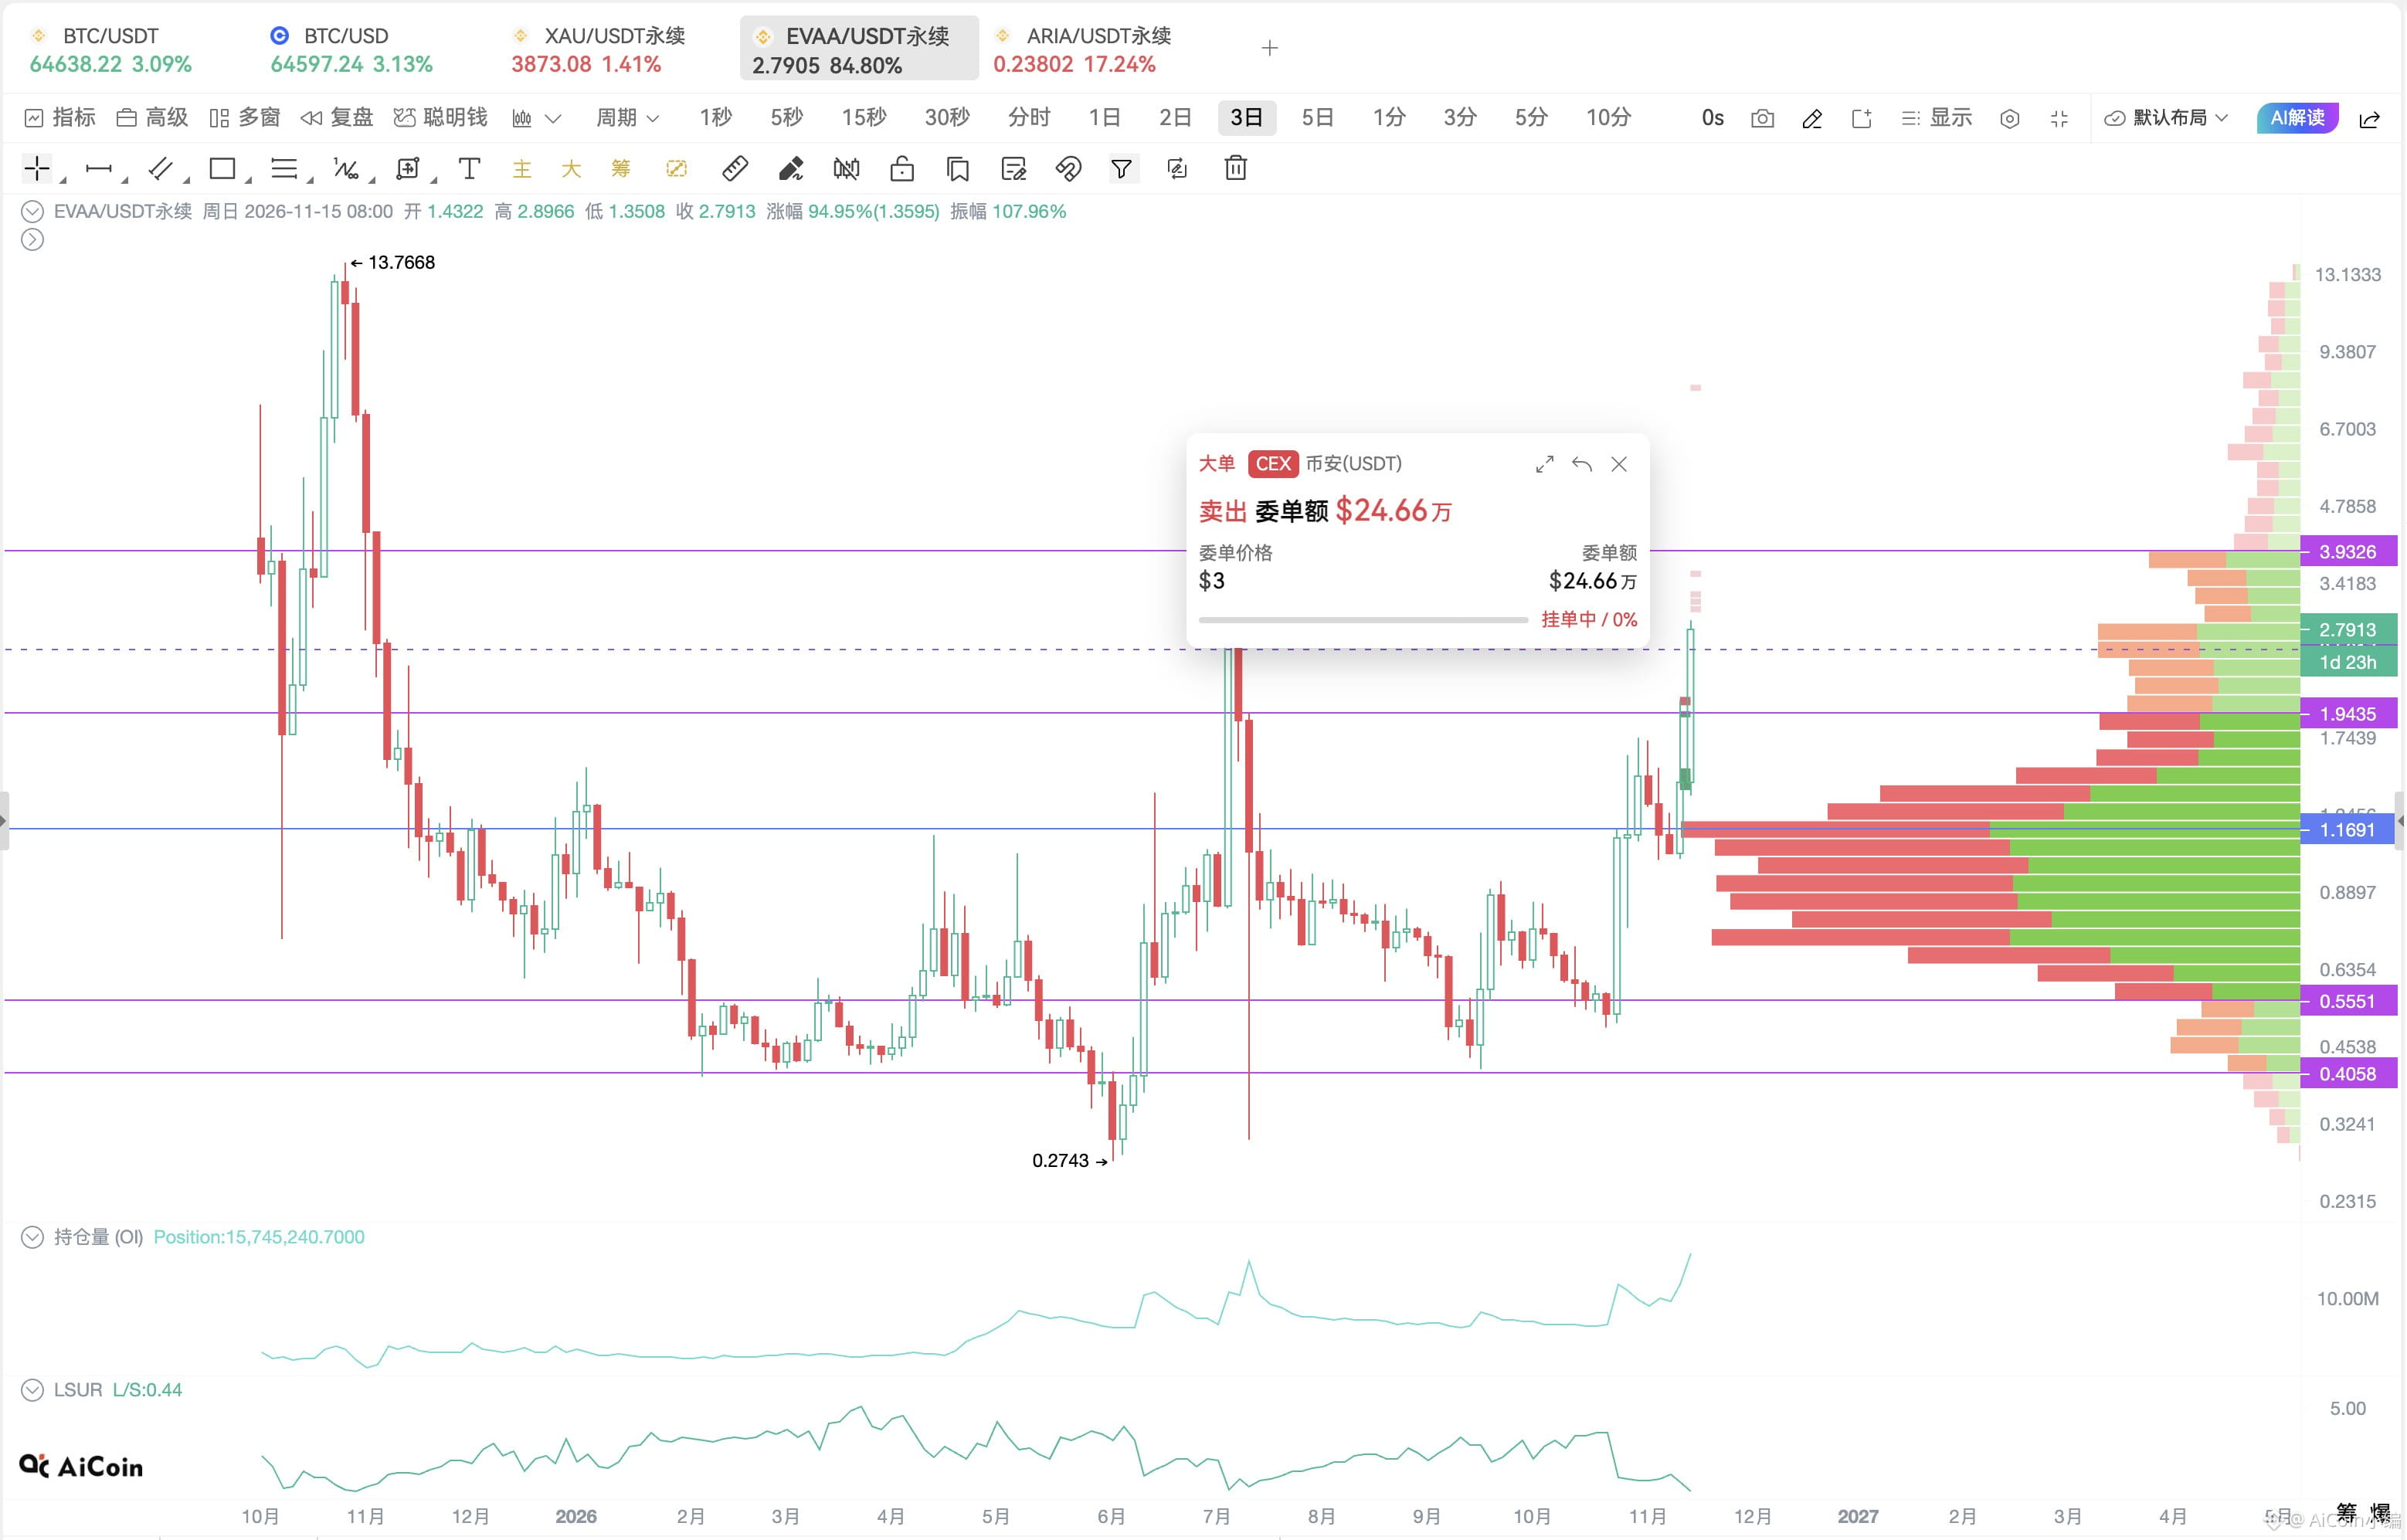
$EVAA 三周飙涨近 5 倍,24h 又拉了 85%+,但真正的考验才刚到。
现在价格在 $2.8 附近,上方 $3~$3.5 已经出现大额挂卖单。
这波能走到这里,靠的不只是情绪:
- 24h 成交额 7.55 亿美元
- 换手率 5090%
- 持仓额升到 6224 万美元,24h +24%
- 净流入约 2575 万美元
高换手说明筹码在快速易手,OI 同步增长则说明新杠杆资金还在继续进场。
问题也在这里。
EVAA 当前 TVL 只有 670万~690 万美元,协议基本面并没有跟着币价同步扩张。
所以这轮行情本质上还是资金推动大于基本面推动。
接下来就看 $3~$3.5:
- 如果卖单持续成交但价格还能站住,强势结构还在;
- 如果冲高后 OI 继续增长、价格却过不去,反而要防一轮高位去杠杆。
$EVAA 三周飙涨近 5 倍,24h 又拉了 85%+,但真正的考验才刚到。
现在价格在 $2.8 附近,上方 $3~$3.5 已经出现大额挂卖单。
这波能走到这里,靠的不只是情绪:
- 24h 成交额 7.55 亿美元
- 换手率 5090%
- 持仓额升到 6224 万美元,24h +24%
- 净流入约 2575 万美元
高换手说明筹码在快速易手,OI 同步增长则说明新杠杆资金还在继续进场。
问题也在这里。
EVAA 当前 TVL 只有 670万~690 万美元,协议基本面并没有跟着币价同步扩张。
所以这轮行情本质上还是资金推动大于基本面推动。
接下来就看 $3~$3.5:
- 如果卖单持续成交但价格还能站住,强势结构还在;
- 如果冲高后 OI 继续增长、价格却过不去,反而要防一轮高位去杠杆。
现在价格在 $2.8 附近,上方 $3~$3.5 已经出现大额挂卖单。
这波能走到这里,靠的不只是情绪:
- 24h 成交额 7.55 亿美元
- 换手率 5090%
- 持仓额升到 6224 万美元,24h +24%
- 净流入约 2575 万美元
高换手说明筹码在快速易手,OI 同步增长则说明新杠杆资金还在继续进场。
问题也在这里。
EVAA 当前 TVL 只有 670万~690 万美元,协议基本面并没有跟着币价同步扩张。
所以这轮行情本质上还是资金推动大于基本面推动。
接下来就看 $3~$3.5:
- 如果卖单持续成交但价格还能站住,强势结构还在;
- 如果冲高后 OI 继续增长、价格却过不去,反而要防一轮高位去杠杆。
90
·
--
$130 million in unrealized profits isn’t all—Abraxas has also pocketed $28 million in funding fees
🤩🤩
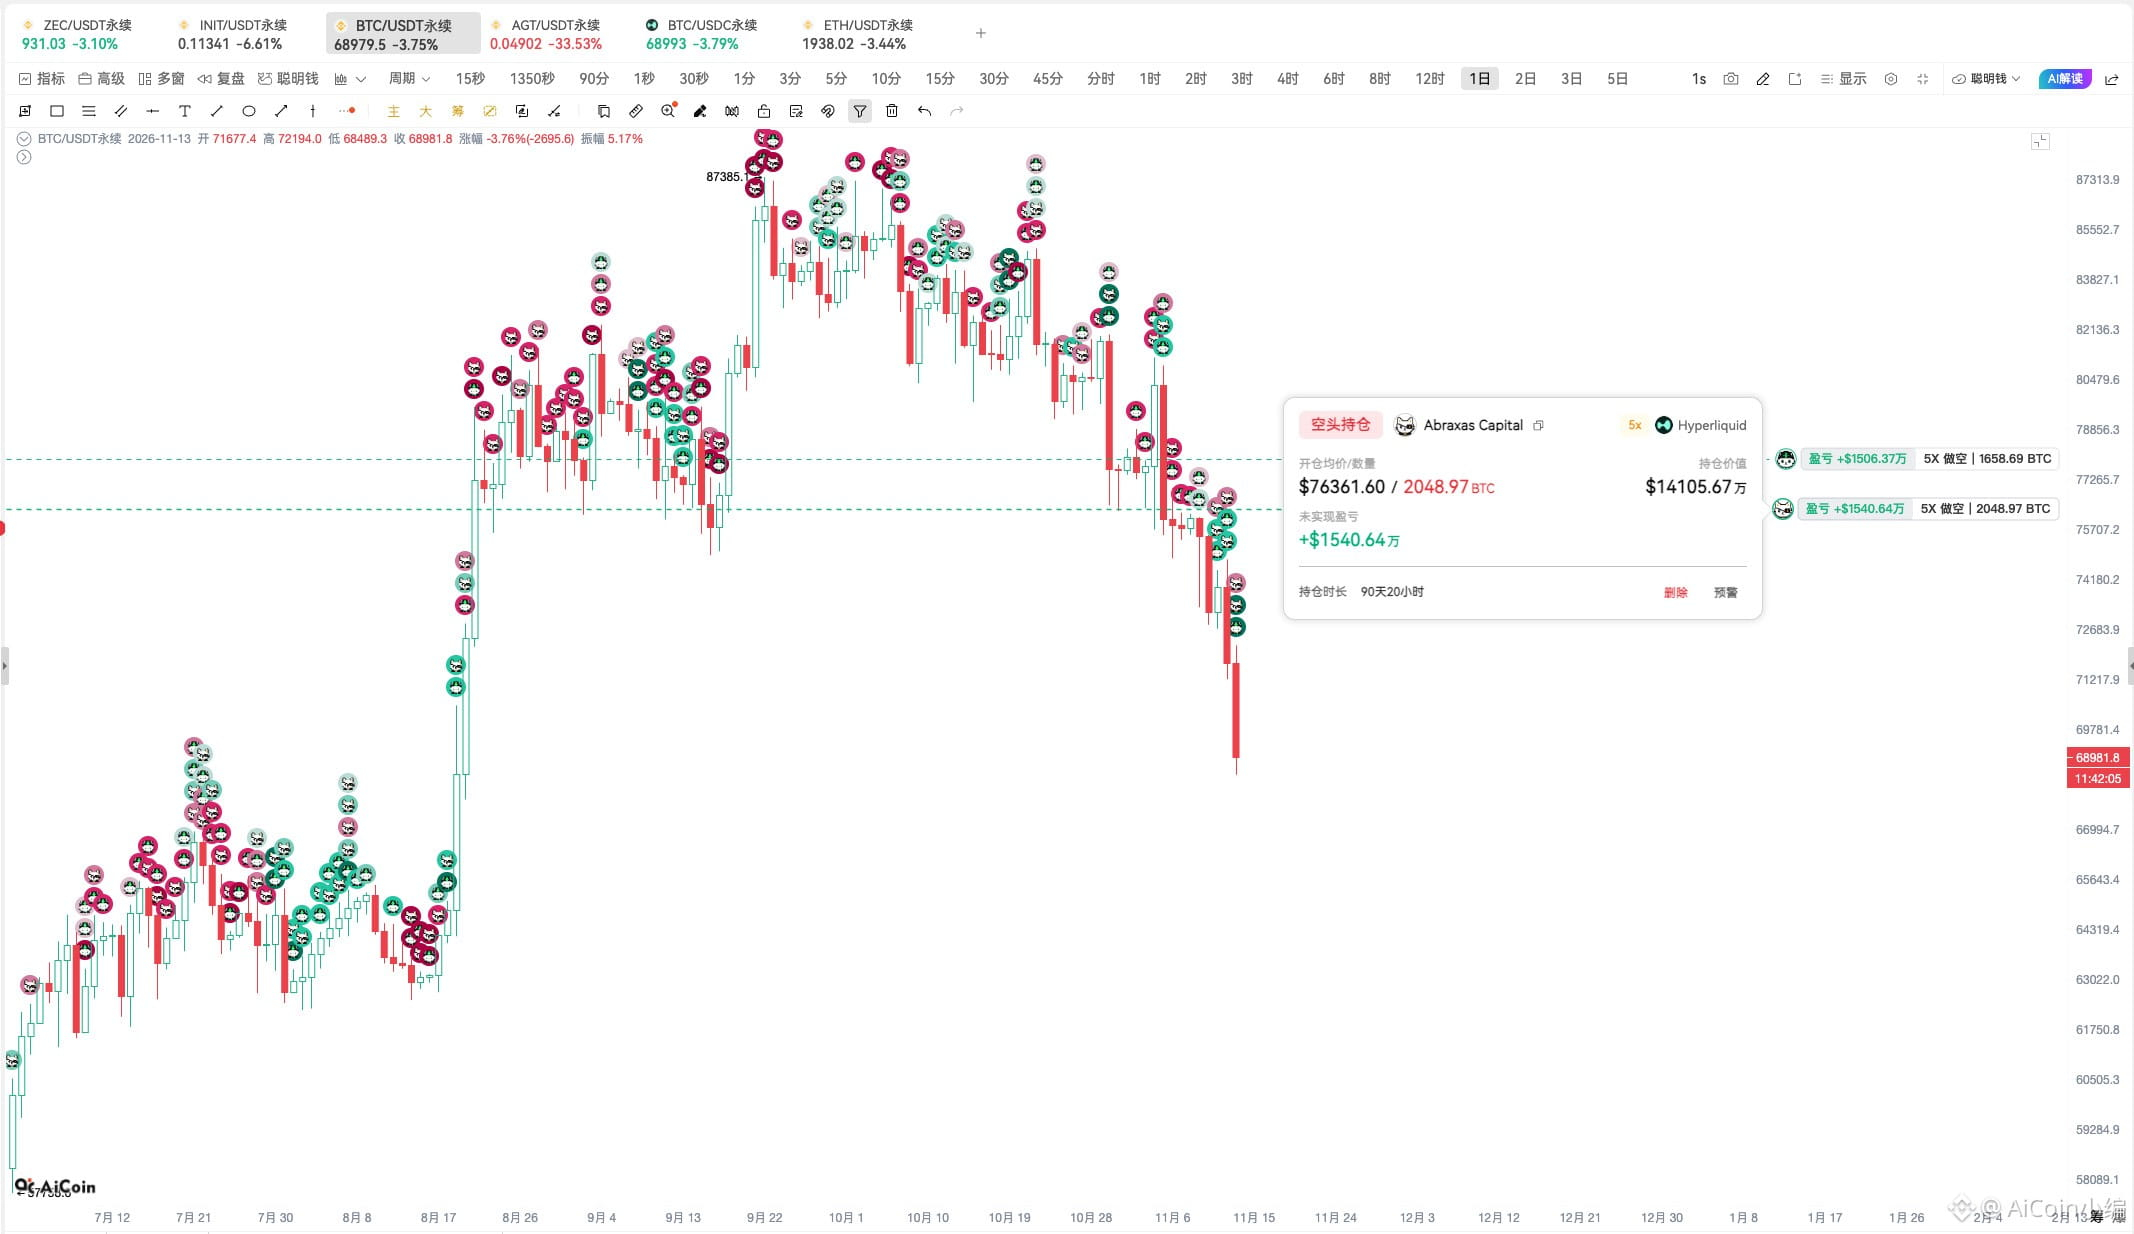
After BTC fell below $70,000, the short positions held by two addresses linked to hedge fund Abraxas Capital continued to grow more profitable. They now hold a combined short position worth about $697 million, with $130 million in unrealized profits.
A few key positions: 👇
- $BTC : short position of about $257 million, $28.93 million in unrealized profits, $7.51 million in funding fees
- HYPE: short position of about $108 million, $5.78 million in unrealized profits, $13.93 million in funding fees
- $ZEC : short position of about $80.1 million, $40.03 million in unrealized profits, $1.62 million in funding fees
- $ETH : a short position of about $64.35 million in a single address, $11.96 million in unrealized profits, $4.87 million in funding fees
Just these four positions have already generated $27.93 million in funding fees.
Most remarkable is HYPE, where funding fee income is already 2.4 times the current unrealized profit.
Abraxas is really having its cake and eating it too—making a killing…💵💵
$130 million in unrealized profits isn’t all—Abraxas has also pocketed $28 million in funding fees
🤩🤩
After BTC fell below $70,000, the short positions held by two addresses linked to hedge fund Abraxas Capital continued to grow more profitable. They now hold a combined short position worth about $697 million, with $130 million in unrealized profits.
A few key positions: 👇
- $BTC : short position of about $257 million, $28.93 million in unrealized profits, $7.51 million in funding fees
- HYPE: short position of about $108 million, $5.78 million in unrealized profits, $13.93 million in funding fees
- $ZEC : short position of about $80.1 million, $40.03 million in unrealized profits, $1.62 million in funding fees
- $ETH : a short position of about $64.35 million in a single address, $11.96 million in unrealized profits, $4.87 million in funding fees
Just these four positions have already generated $27.93 million in funding fees.
Most remarkable is HYPE, where funding fee income is already 2.4 times the current unrealized profit.
Abraxas is really having its cake and eating it too—making a killing…💵💵
🤩🤩
After BTC fell below $70,000, the short positions held by two addresses linked to hedge fund Abraxas Capital continued to grow more profitable. They now hold a combined short position worth about $697 million, with $130 million in unrealized profits.
A few key positions: 👇
- $BTC : short position of about $257 million, $28.93 million in unrealized profits, $7.51 million in funding fees
- HYPE: short position of about $108 million, $5.78 million in unrealized profits, $13.93 million in funding fees
- $ZEC : short position of about $80.1 million, $40.03 million in unrealized profits, $1.62 million in funding fees
- $ETH : a short position of about $64.35 million in a single address, $11.96 million in unrealized profits, $4.87 million in funding fees
Just these four positions have already generated $27.93 million in funding fees.
Most remarkable is HYPE, where funding fee income is already 2.4 times the current unrealized profit.
Abraxas is really having its cake and eating it too—making a killing…💵💵
121
·
--
$AGT surged 200%—is it still worth chasing?
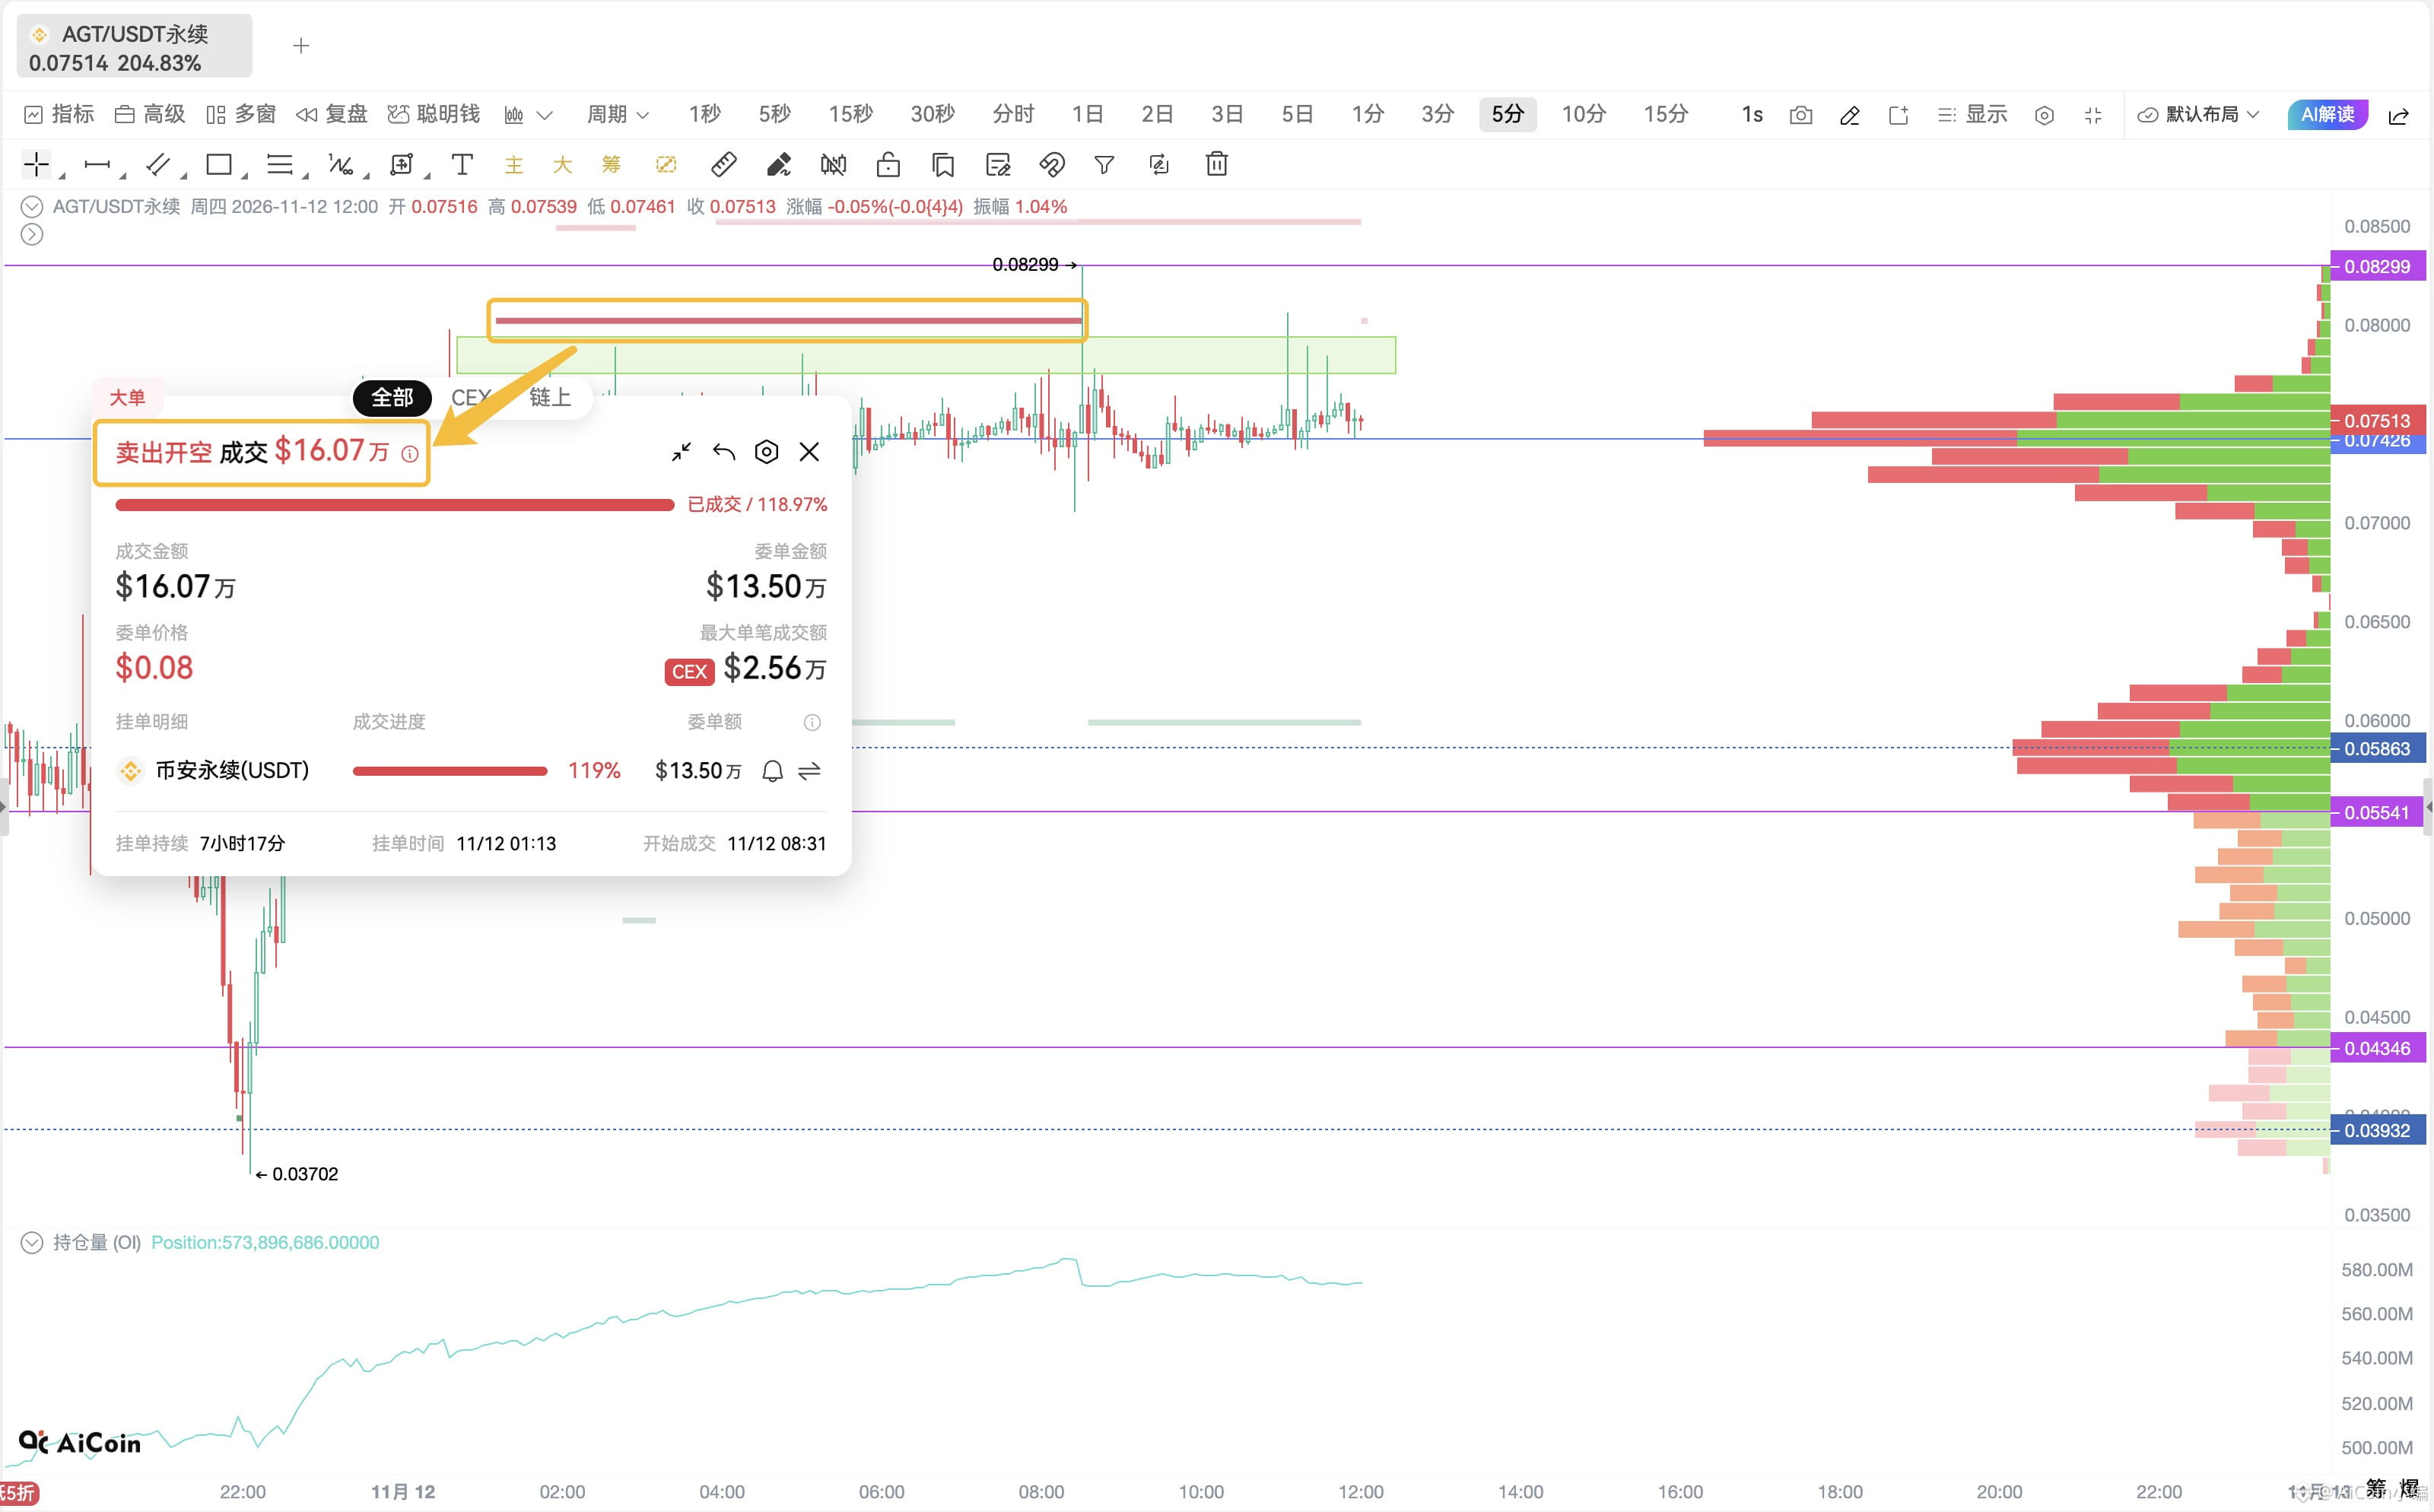
AGT’s 24-hour trading volume was 668 million (+4,321%), OI was 46.3 million (+58%), and net inflows were 28.47 million. It looks strong on the surface, but short-term OI has already started to dip slightly, suggesting that appetite for opening new positions is waning.
Also, a 160,000 short position appeared at the $0.08 level, suggesting that some traders are starting to short at these highs.
On-chain holdings are also highly concentrated: the top 100 addresses hold nearly 90% of the supply, with the top 5 holding 34%. The initial large allocations held by the No. 1 and No. 4 holders also came from the same distribution wallet.
In the short term, watch whether it can hold above $0.08–$0.083 on strong volume.
- If it holds, it could move higher;
- If it fails to break through and heavy selling pressure builds, the pullback could be swift~
$AGT surged 200%—is it still worth chasing?
AGT’s 24-hour trading volume was 668 million (+4,321%), OI was 46.3 million (+58%), and net inflows were 28.47 million. It looks strong on the surface, but short-term OI has already started to dip slightly, suggesting that appetite for opening new positions is waning.
Also, a 160,000 short position appeared at the $0.08 level, suggesting that some traders are starting to short at these highs.
On-chain holdings are also highly concentrated: the top 100 addresses hold nearly 90% of the supply, with the top 5 holding 34%. The initial large allocations held by the No. 1 and No. 4 holders also came from the same distribution wallet.
In the short term, watch whether it can hold above $0.08–$0.083 on strong volume.
- If it holds, it could move higher;
- If it fails to break through and heavy selling pressure builds, the pullback could be swift~
AGT’s 24-hour trading volume was 668 million (+4,321%), OI was 46.3 million (+58%), and net inflows were 28.47 million. It looks strong on the surface, but short-term OI has already started to dip slightly, suggesting that appetite for opening new positions is waning.
Also, a 160,000 short position appeared at the $0.08 level, suggesting that some traders are starting to short at these highs.
On-chain holdings are also highly concentrated: the top 100 addresses hold nearly 90% of the supply, with the top 5 holding 34%. The initial large allocations held by the No. 1 and No. 4 holders also came from the same distribution wallet.
In the short term, watch whether it can hold above $0.08–$0.083 on strong volume.
- If it holds, it could move higher;
- If it fails to break through and heavy selling pressure builds, the pullback could be swift~
2
394
·
--
Bearish
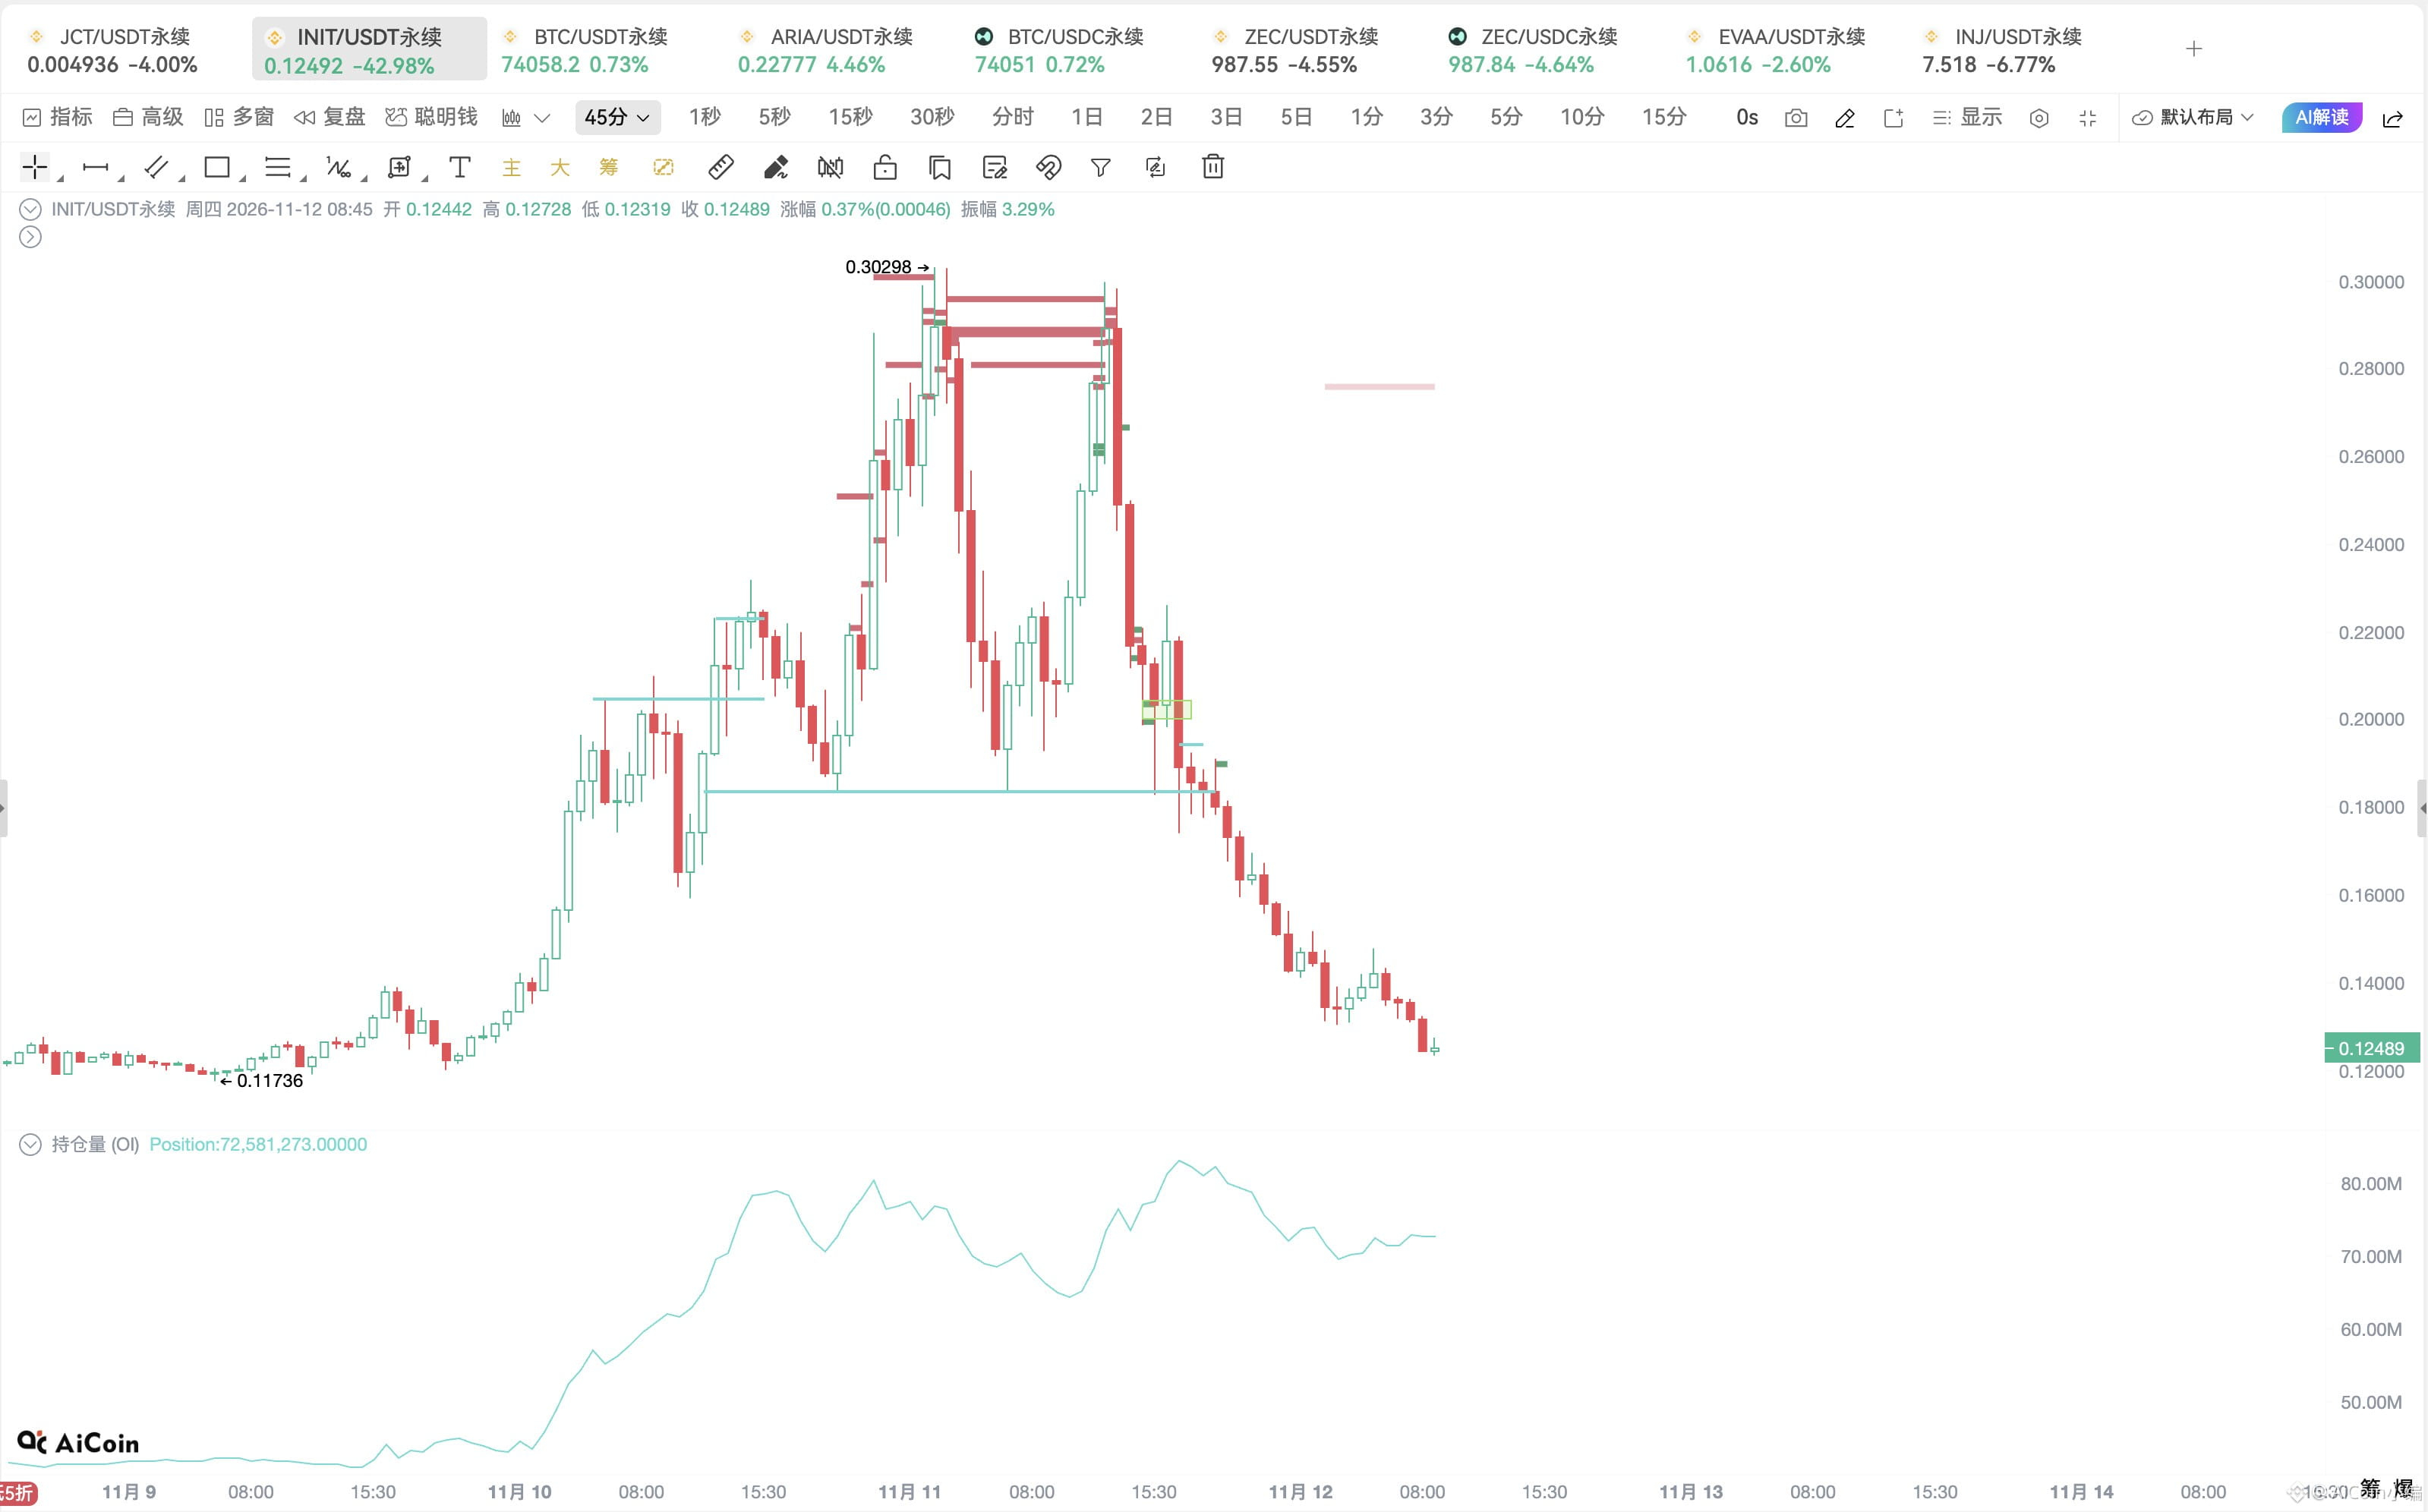
$INIT has been cut in half…
Altcoins are being harvested too quickly now.
$INIT has been cut in half…
Altcoins are being harvested too quickly now.
Altcoins are being harvested too quickly now.
635
·
--
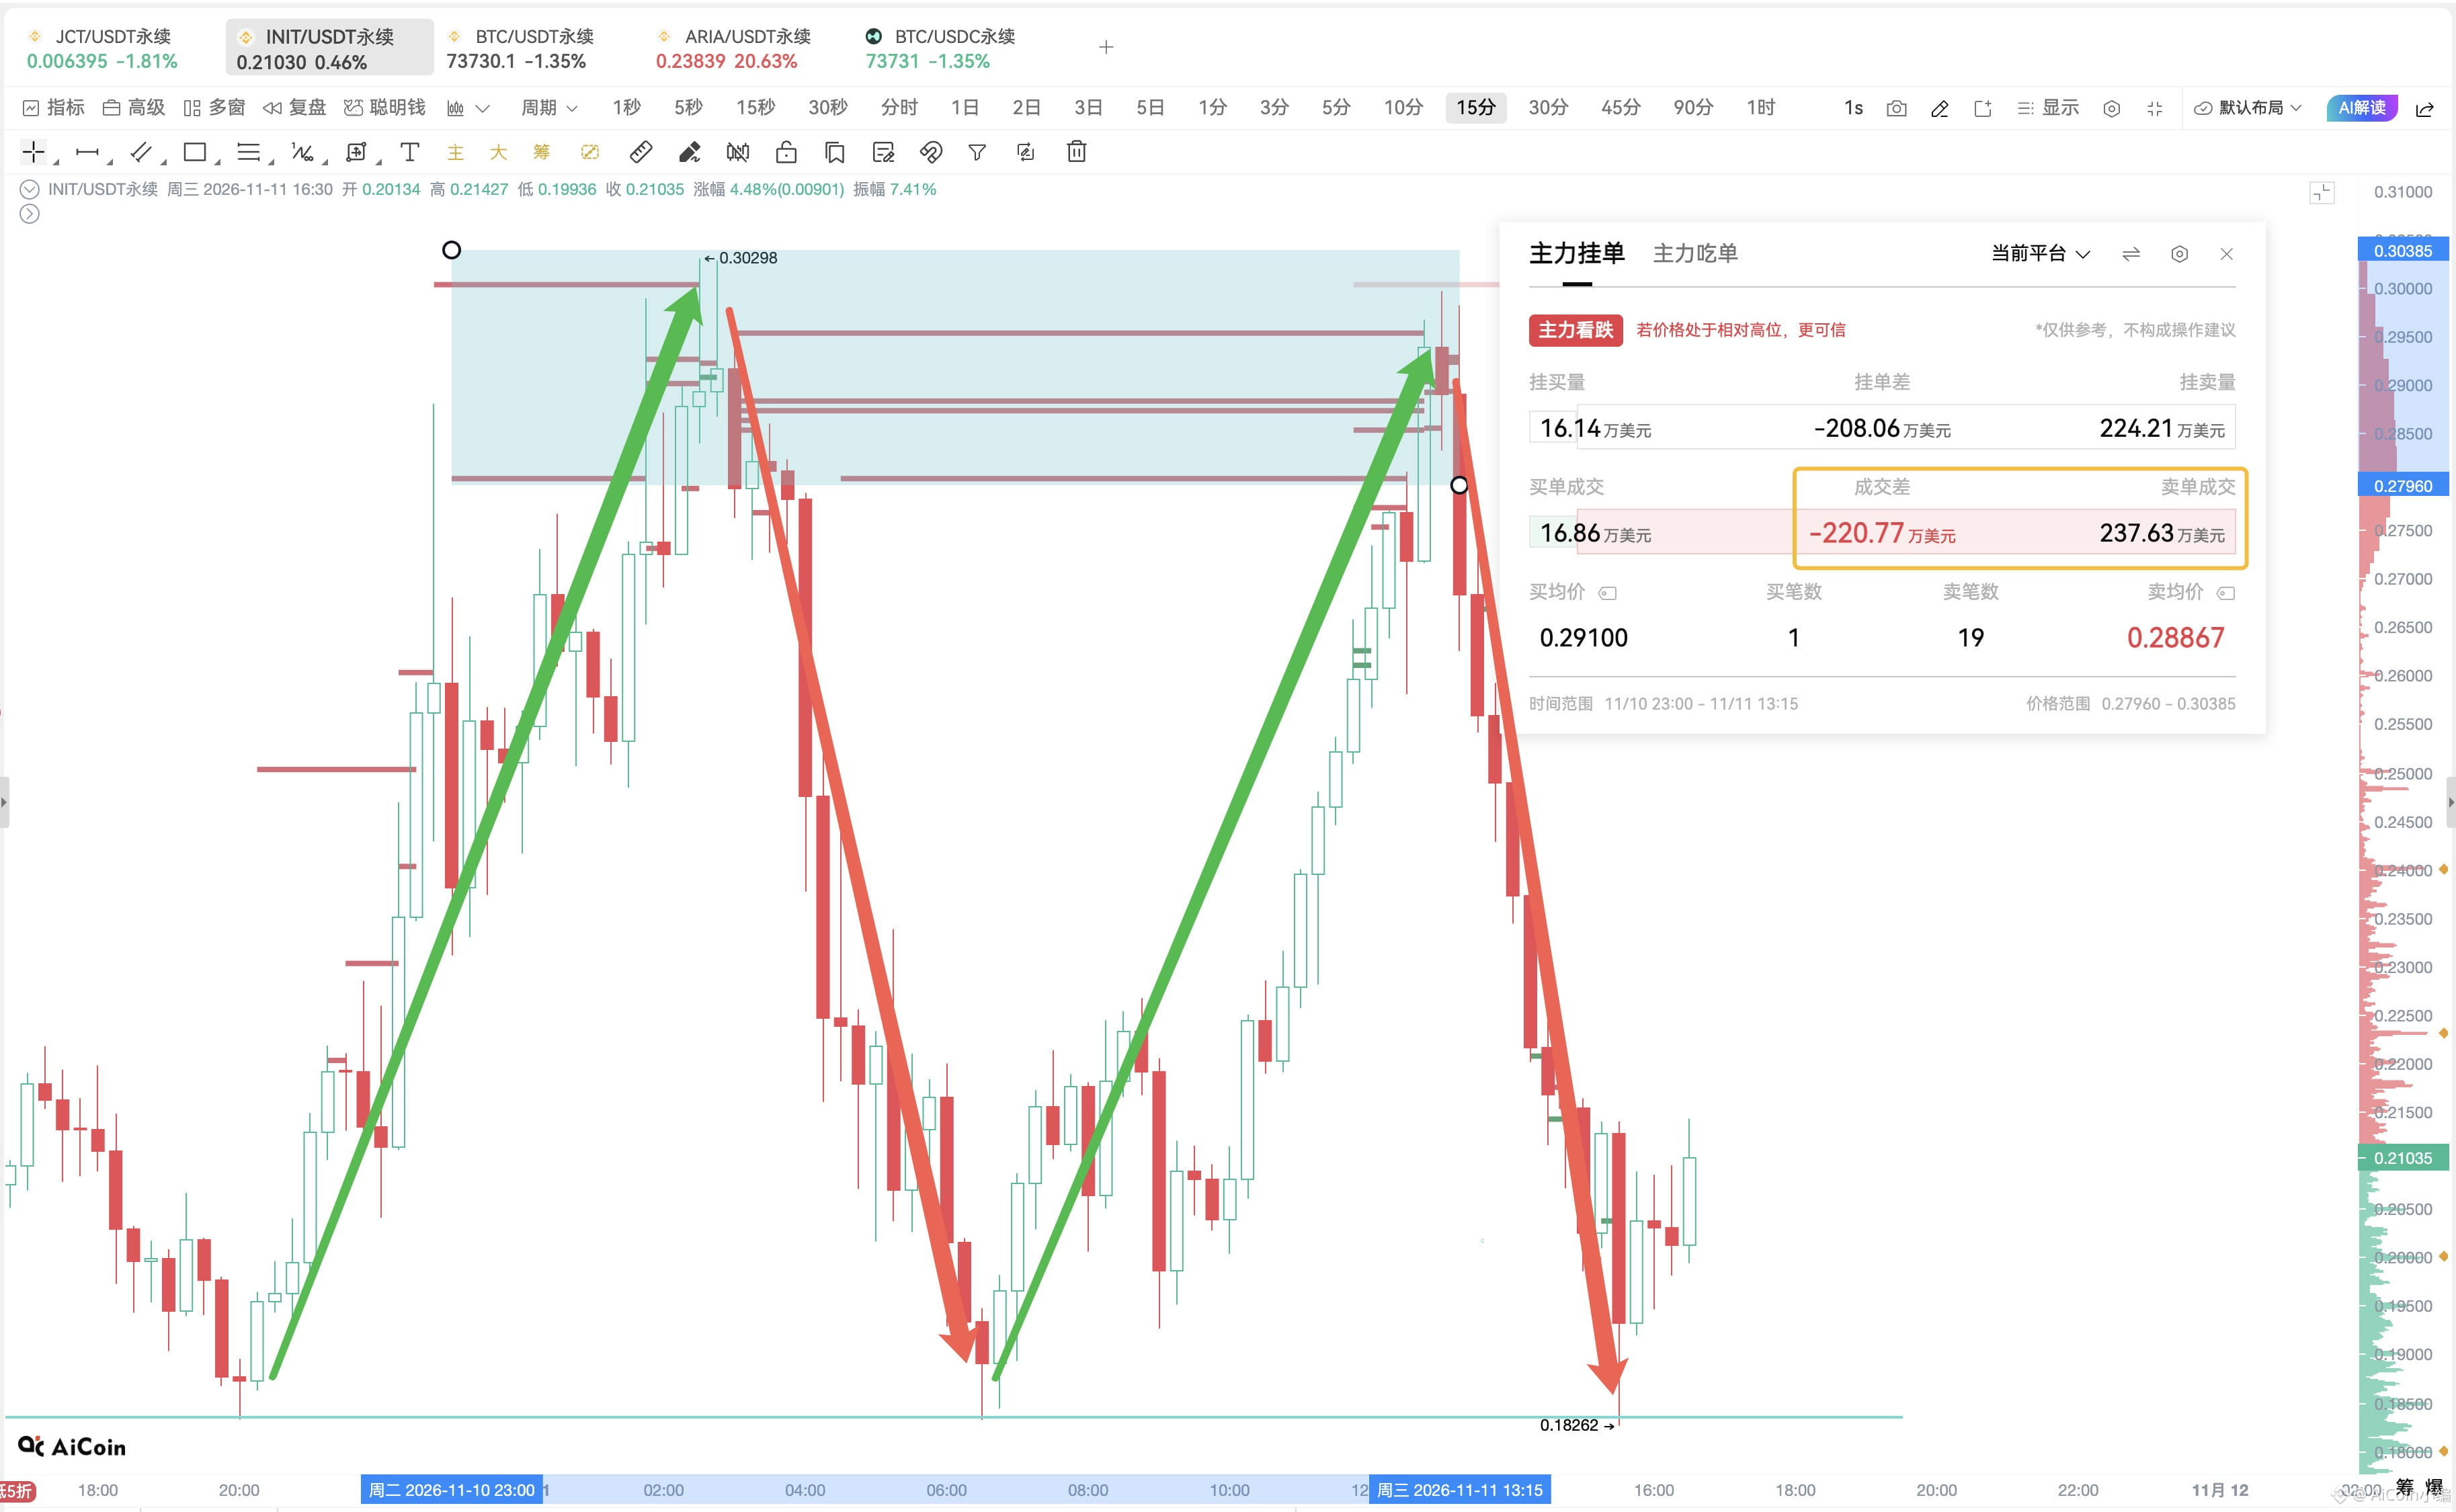
Every rally gets dumped. $INIT These two “breakouts” both looked pretty suspicious 🤨
1️⃣ First spike to $0.302:
Large players closed $1.4693 million in long positions, while new long positions totaled just $168,600.
Sell orders were in the millions, while buying was very weak. The price then plunged straight to $0.182, a drop of nearly 40%.
2️⃣ Second spike to $0.299:
Large players closed $1.3335 million in long positions, while buy volume was literally zero.
The price then crashed back to around $0.198, a drop of over 38%.
Both rallies were basically bait for large players to close their long positions and dump on the market (using FOMO buyers as exit liquidity).
INIT is now back around $0.20, and two buy orders totaling $176,000 have already been filled. If the price can hold here, it may try to challenge $0.28–$0.30 again. But large sell orders are still sitting in that resistance zone.
To spot these fake breakouts early, the key is to watch large orders: when they’re placed, canceled, and actually filled. When the order book shows “large sell orders + few buy orders,” chasing the price is very risky.
Tool: “Large Player Big Order Tracker” indicator
Every rally gets dumped. $INIT These two “breakouts” both looked pretty suspicious 🤨
1️⃣ First spike to $0.302:
Large players closed $1.4693 million in long positions, while new long positions totaled just $168,600.
Sell orders were in the millions, while buying was very weak. The price then plunged straight to $0.182, a drop of nearly 40%.
2️⃣ Second spike to $0.299:
Large players closed $1.3335 million in long positions, while buy volume was literally zero.
The price then crashed back to around $0.198, a drop of over 38%.
Both rallies were basically bait for large players to close their long positions and dump on the market (using FOMO buyers as exit liquidity).
INIT is now back around $0.20, and two buy orders totaling $176,000 have already been filled. If the price can hold here, it may try to challenge $0.28–$0.30 again. But large sell orders are still sitting in that resistance zone.
To spot these fake breakouts early, the key is to watch large orders: when they’re placed, canceled, and actually filled. When the order book shows “large sell orders + few buy orders,” chasing the price is very risky.
Tool: “Large Player Big Order Tracker” indicator
1️⃣ First spike to $0.302:
Large players closed $1.4693 million in long positions, while new long positions totaled just $168,600.
Sell orders were in the millions, while buying was very weak. The price then plunged straight to $0.182, a drop of nearly 40%.
2️⃣ Second spike to $0.299:
Large players closed $1.3335 million in long positions, while buy volume was literally zero.
The price then crashed back to around $0.198, a drop of over 38%.
Both rallies were basically bait for large players to close their long positions and dump on the market (using FOMO buyers as exit liquidity).
INIT is now back around $0.20, and two buy orders totaling $176,000 have already been filled. If the price can hold here, it may try to challenge $0.28–$0.30 again. But large sell orders are still sitting in that resistance zone.
To spot these fake breakouts early, the key is to watch large orders: when they’re placed, canceled, and actually filled. When the order book shows “large sell orders + few buy orders,” chasing the price is very risky.
Tool: “Large Player Big Order Tracker” indicator
330
·
--
Sold near a local top in September, and now turned around and borrowed $22 million to scoop up $ETH ? 🤨
The on-chain whale 7 Siblings is back in action.
Over the past 10 hours, it spent $22 million to buy 10,792 ETH at an average price of $2,038.
The whale currently still holds:
💰 174,000 ETH
💸 $136 million in debt
🏦 Primarily collateralized on Aave + Spark
Its strategy has always been consistent: borrow money to add to its position during sharp dips, then sell some on the rebound to repay the debt.
Based on its current position, ETH would need to fall to around $1,180 for its Spark position to start approaching liquidation—about 43% below the current price.
Is this a buying spree too early, or did it nail a local bottom? Keep an eye on what it does next 👇
Address details: 0x28a55C4b4f9615FDE3CDAdDf6cc01FcF2E38A6b0
Sold near a local top in September, and now turned around and borrowed $22 million to scoop up $ETH ? 🤨
The on-chain whale 7 Siblings is back in action.
Over the past 10 hours, it spent $22 million to buy 10,792 ETH at an average price of $2,038.
The whale currently still holds:
💰 174,000 ETH
💸 $136 million in debt
🏦 Primarily collateralized on Aave + Spark
Its strategy has always been consistent: borrow money to add to its position during sharp dips, then sell some on the rebound to repay the debt.
Based on its current position, ETH would need to fall to around $1,180 for its Spark position to start approaching liquidation—about 43% below the current price.
Is this a buying spree too early, or did it nail a local bottom? Keep an eye on what it does next 👇
Address details: 0x28a55C4b4f9615FDE3CDAdDf6cc01FcF2E38A6b0
The on-chain whale 7 Siblings is back in action.
Over the past 10 hours, it spent $22 million to buy 10,792 ETH at an average price of $2,038.
The whale currently still holds:
💰 174,000 ETH
💸 $136 million in debt
🏦 Primarily collateralized on Aave + Spark
Its strategy has always been consistent: borrow money to add to its position during sharp dips, then sell some on the rebound to repay the debt.
Based on its current position, ETH would need to fall to around $1,180 for its Spark position to start approaching liquidation—about 43% below the current price.
Is this a buying spree too early, or did it nail a local bottom? Keep an eye on what it does next 👇
Address details: 0x28a55C4b4f9615FDE3CDAdDf6cc01FcF2E38A6b0
216
·
--
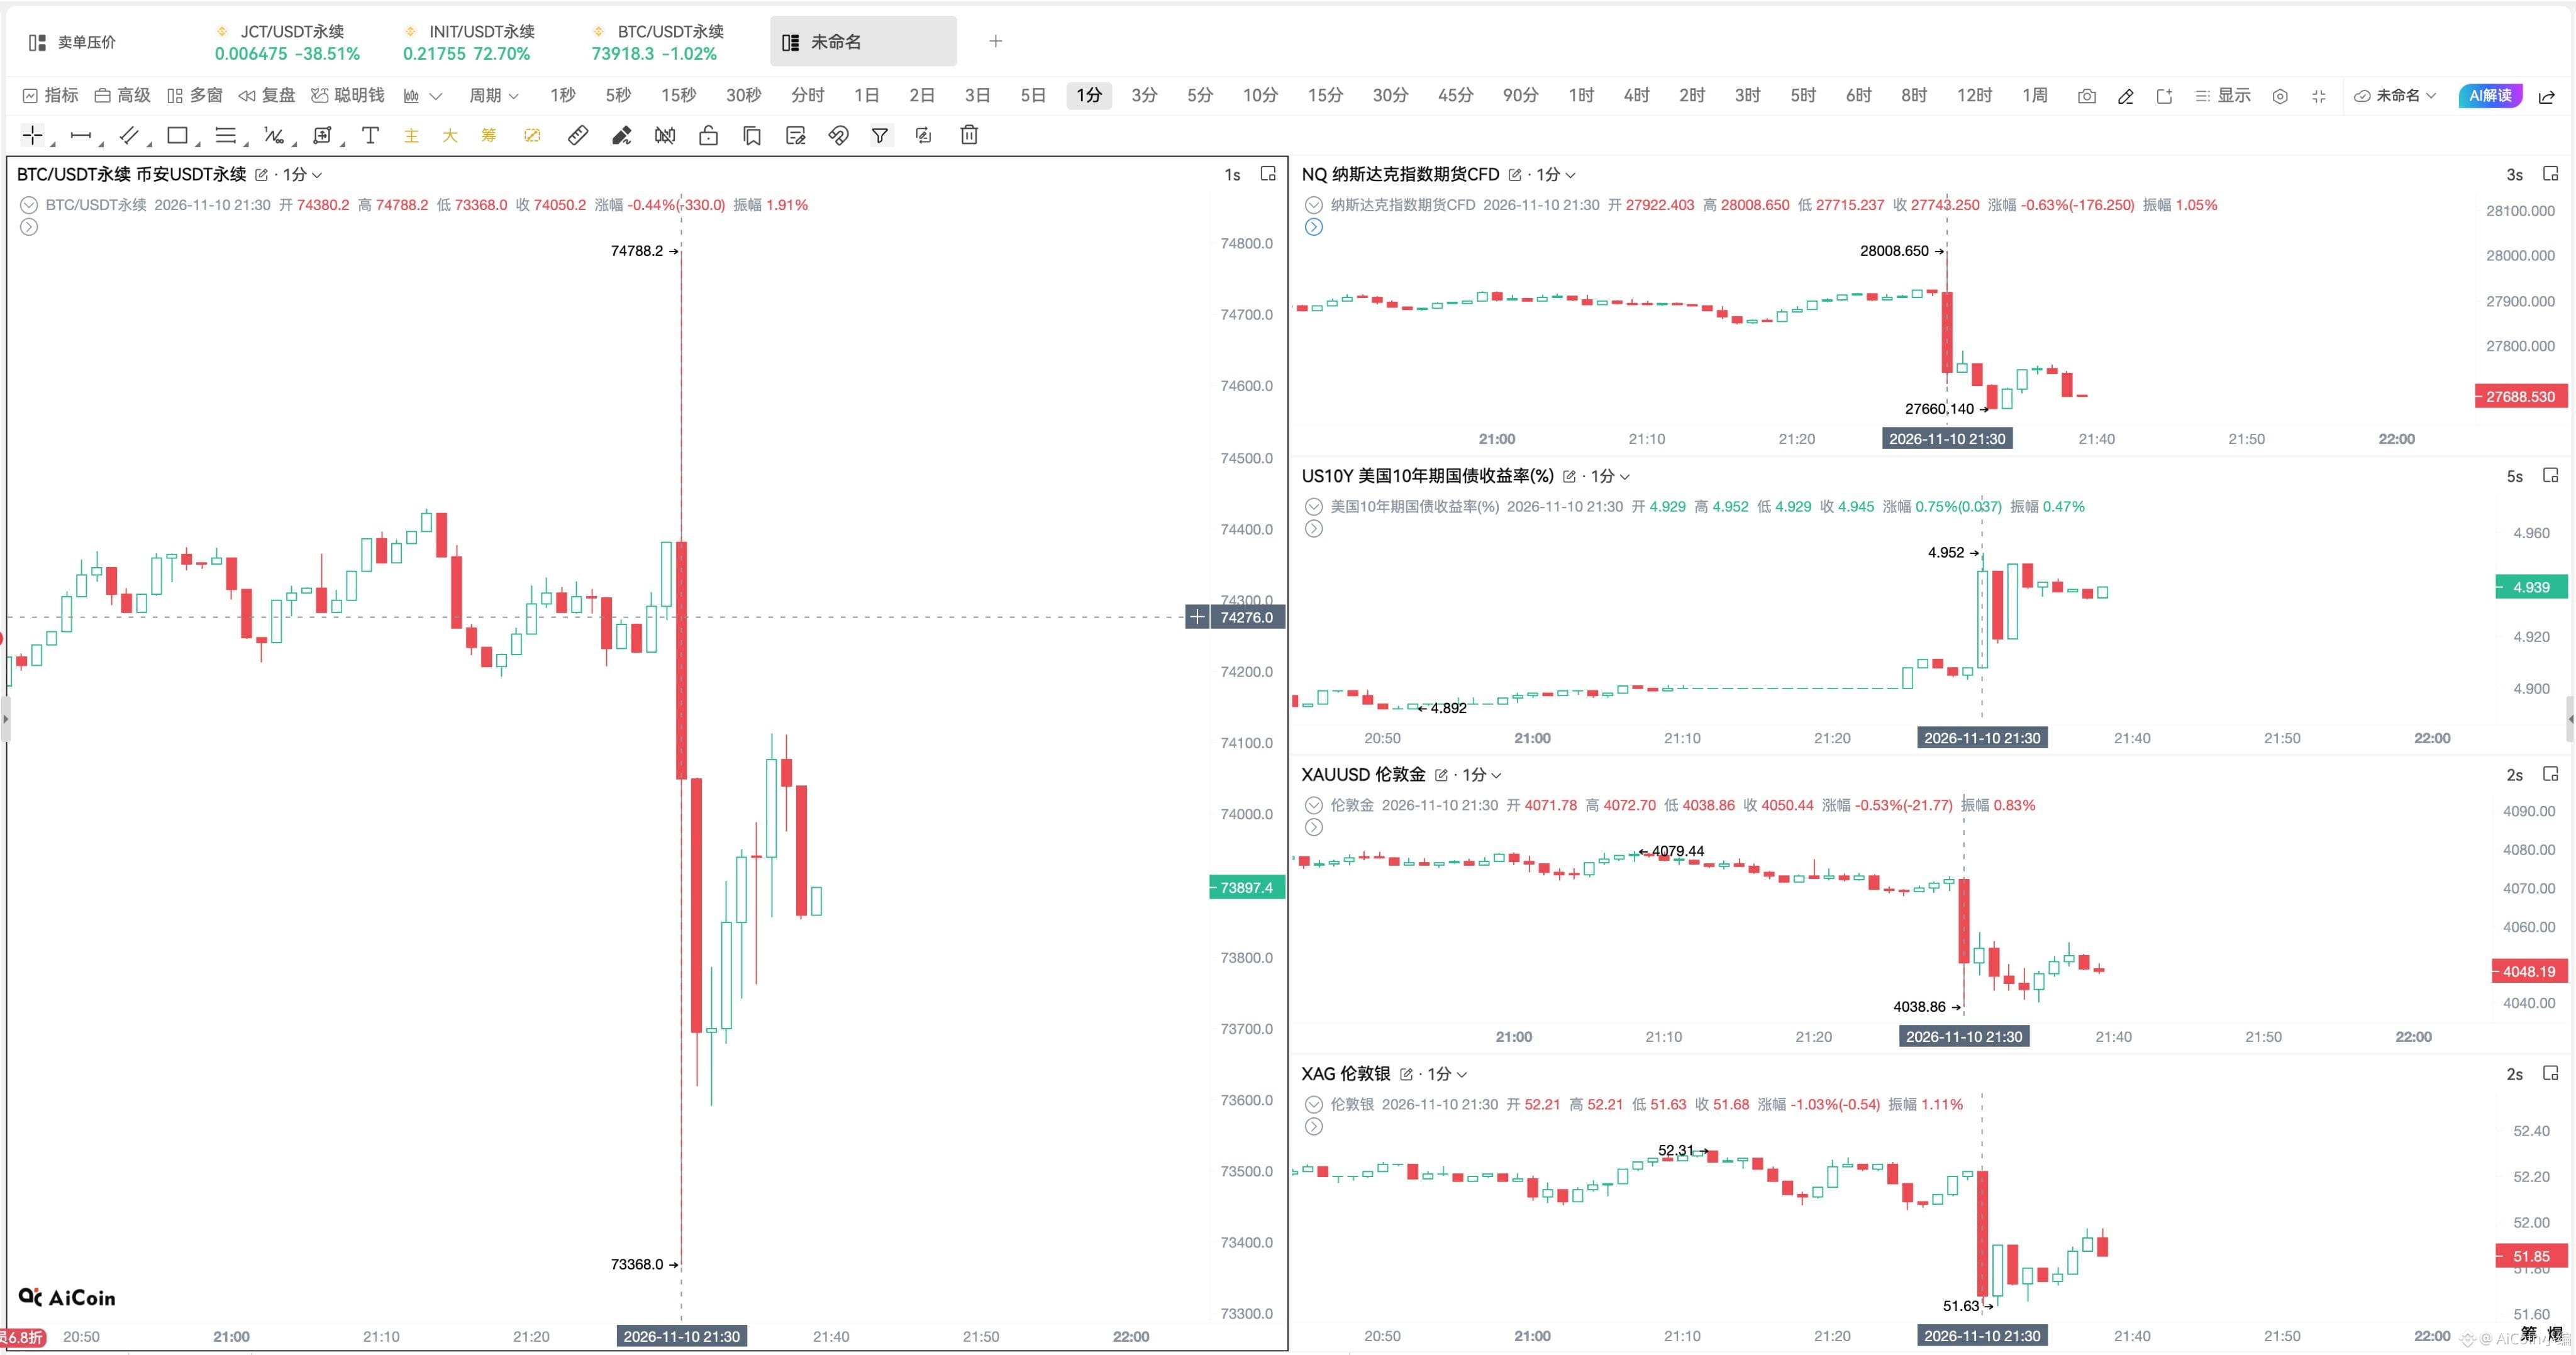
🔥CPI blew past expectations across the board! $BTC plunged straight down, falling below 74,000
U.S. October CPI and core CPI both came in higher than expected:
- CPI month-over-month: +0.4%, vs. +0.3% expected
- Core CPI: +0.3%, vs. +0.2% expected
Markets were sent into a tailspin:
🔻 BTC fell below the 74,000 mark
🔻 U.S. stock futures turned lower across the board
🔻 10-year Treasury yield surged to 4.95%
🔻 Gold and silver plunged, with silver down 1.1%
Rate cuts are completely off the table; markets are pricing in a 100% chance that the Fed will hike rates again in December~
#cpi #美联储何时降息?
🔥CPI blew past expectations across the board! $BTC plunged straight down, falling below 74,000
U.S. October CPI and core CPI both came in higher than expected:
- CPI month-over-month: +0.4%, vs. +0.3% expected
- Core CPI: +0.3%, vs. +0.2% expected
Markets were sent into a tailspin:
🔻 BTC fell below the 74,000 mark
🔻 U.S. stock futures turned lower across the board
🔻 10-year Treasury yield surged to 4.95%
🔻 Gold and silver plunged, with silver down 1.1%
Rate cuts are completely off the table; markets are pricing in a 100% chance that the Fed will hike rates again in December~
#cpi #美联储何时降息?
U.S. October CPI and core CPI both came in higher than expected:
- CPI month-over-month: +0.4%, vs. +0.3% expected
- Core CPI: +0.3%, vs. +0.2% expected
Markets were sent into a tailspin:
🔻 BTC fell below the 74,000 mark
🔻 U.S. stock futures turned lower across the board
🔻 10-year Treasury yield surged to 4.95%
🔻 Gold and silver plunged, with silver down 1.1%
Rate cuts are completely off the table; markets are pricing in a 100% chance that the Fed will hike rates again in December~
#cpi #美联储何时降息?
467
·
--
Bearish
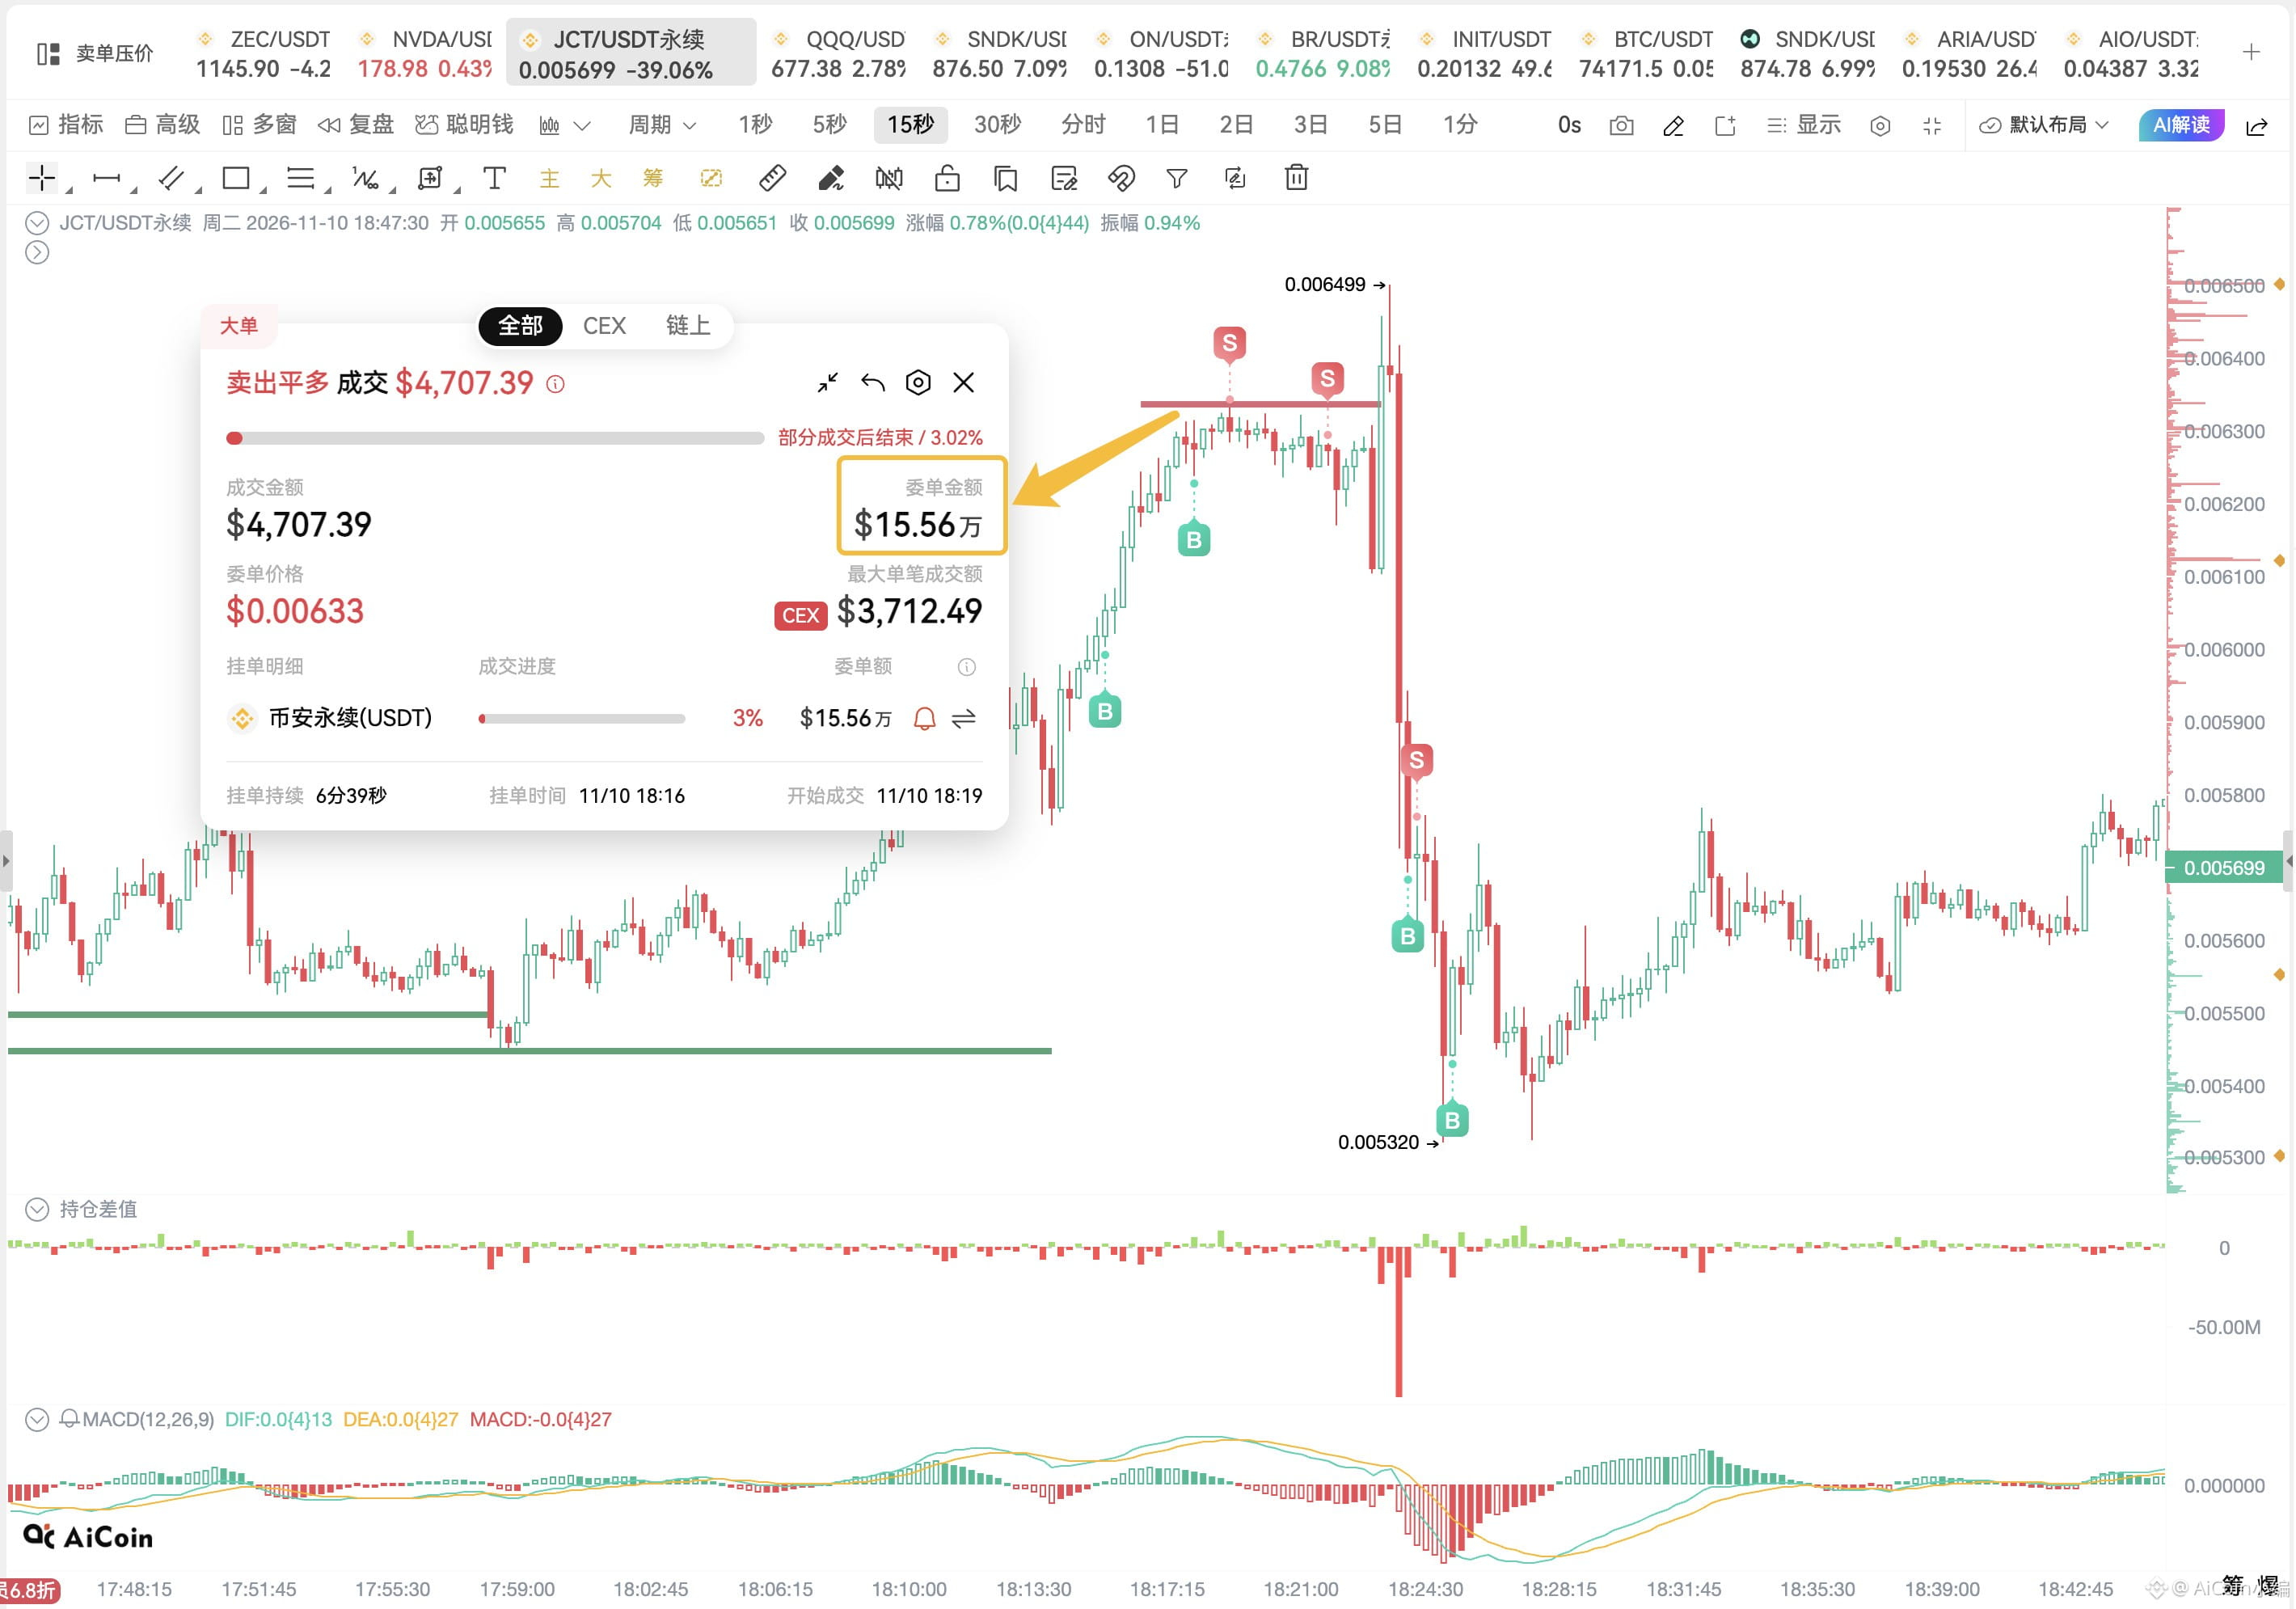
What a “paper tiger” price squeeze—the JCT big players’ latest feint was impressive 🤨
Just now, $JCT placed a huge sell order worth $155,600 at 0.00633, but it was canceled after only $4,707 had been filled.
That sub-$5,000 cost was enough to send JCT plunging 16% in the short term…
Buying high and selling low—there’s definitely something to those big limit orders. 👀
What a “paper tiger” price squeeze—the JCT big players’ latest feint was impressive 🤨
Just now, $JCT placed a huge sell order worth $155,600 at 0.00633, but it was canceled after only $4,707 had been filled.
That sub-$5,000 cost was enough to send JCT plunging 16% in the short term…
Buying high and selling low—there’s definitely something to those big limit orders. 👀
Just now, $JCT placed a huge sell order worth $155,600 at 0.00633, but it was canceled after only $4,707 had been filled.
That sub-$5,000 cost was enough to send JCT plunging 16% in the short term…
Buying high and selling low—there’s definitely something to those big limit orders. 👀
2
1
2.3k
·
--
Bearish
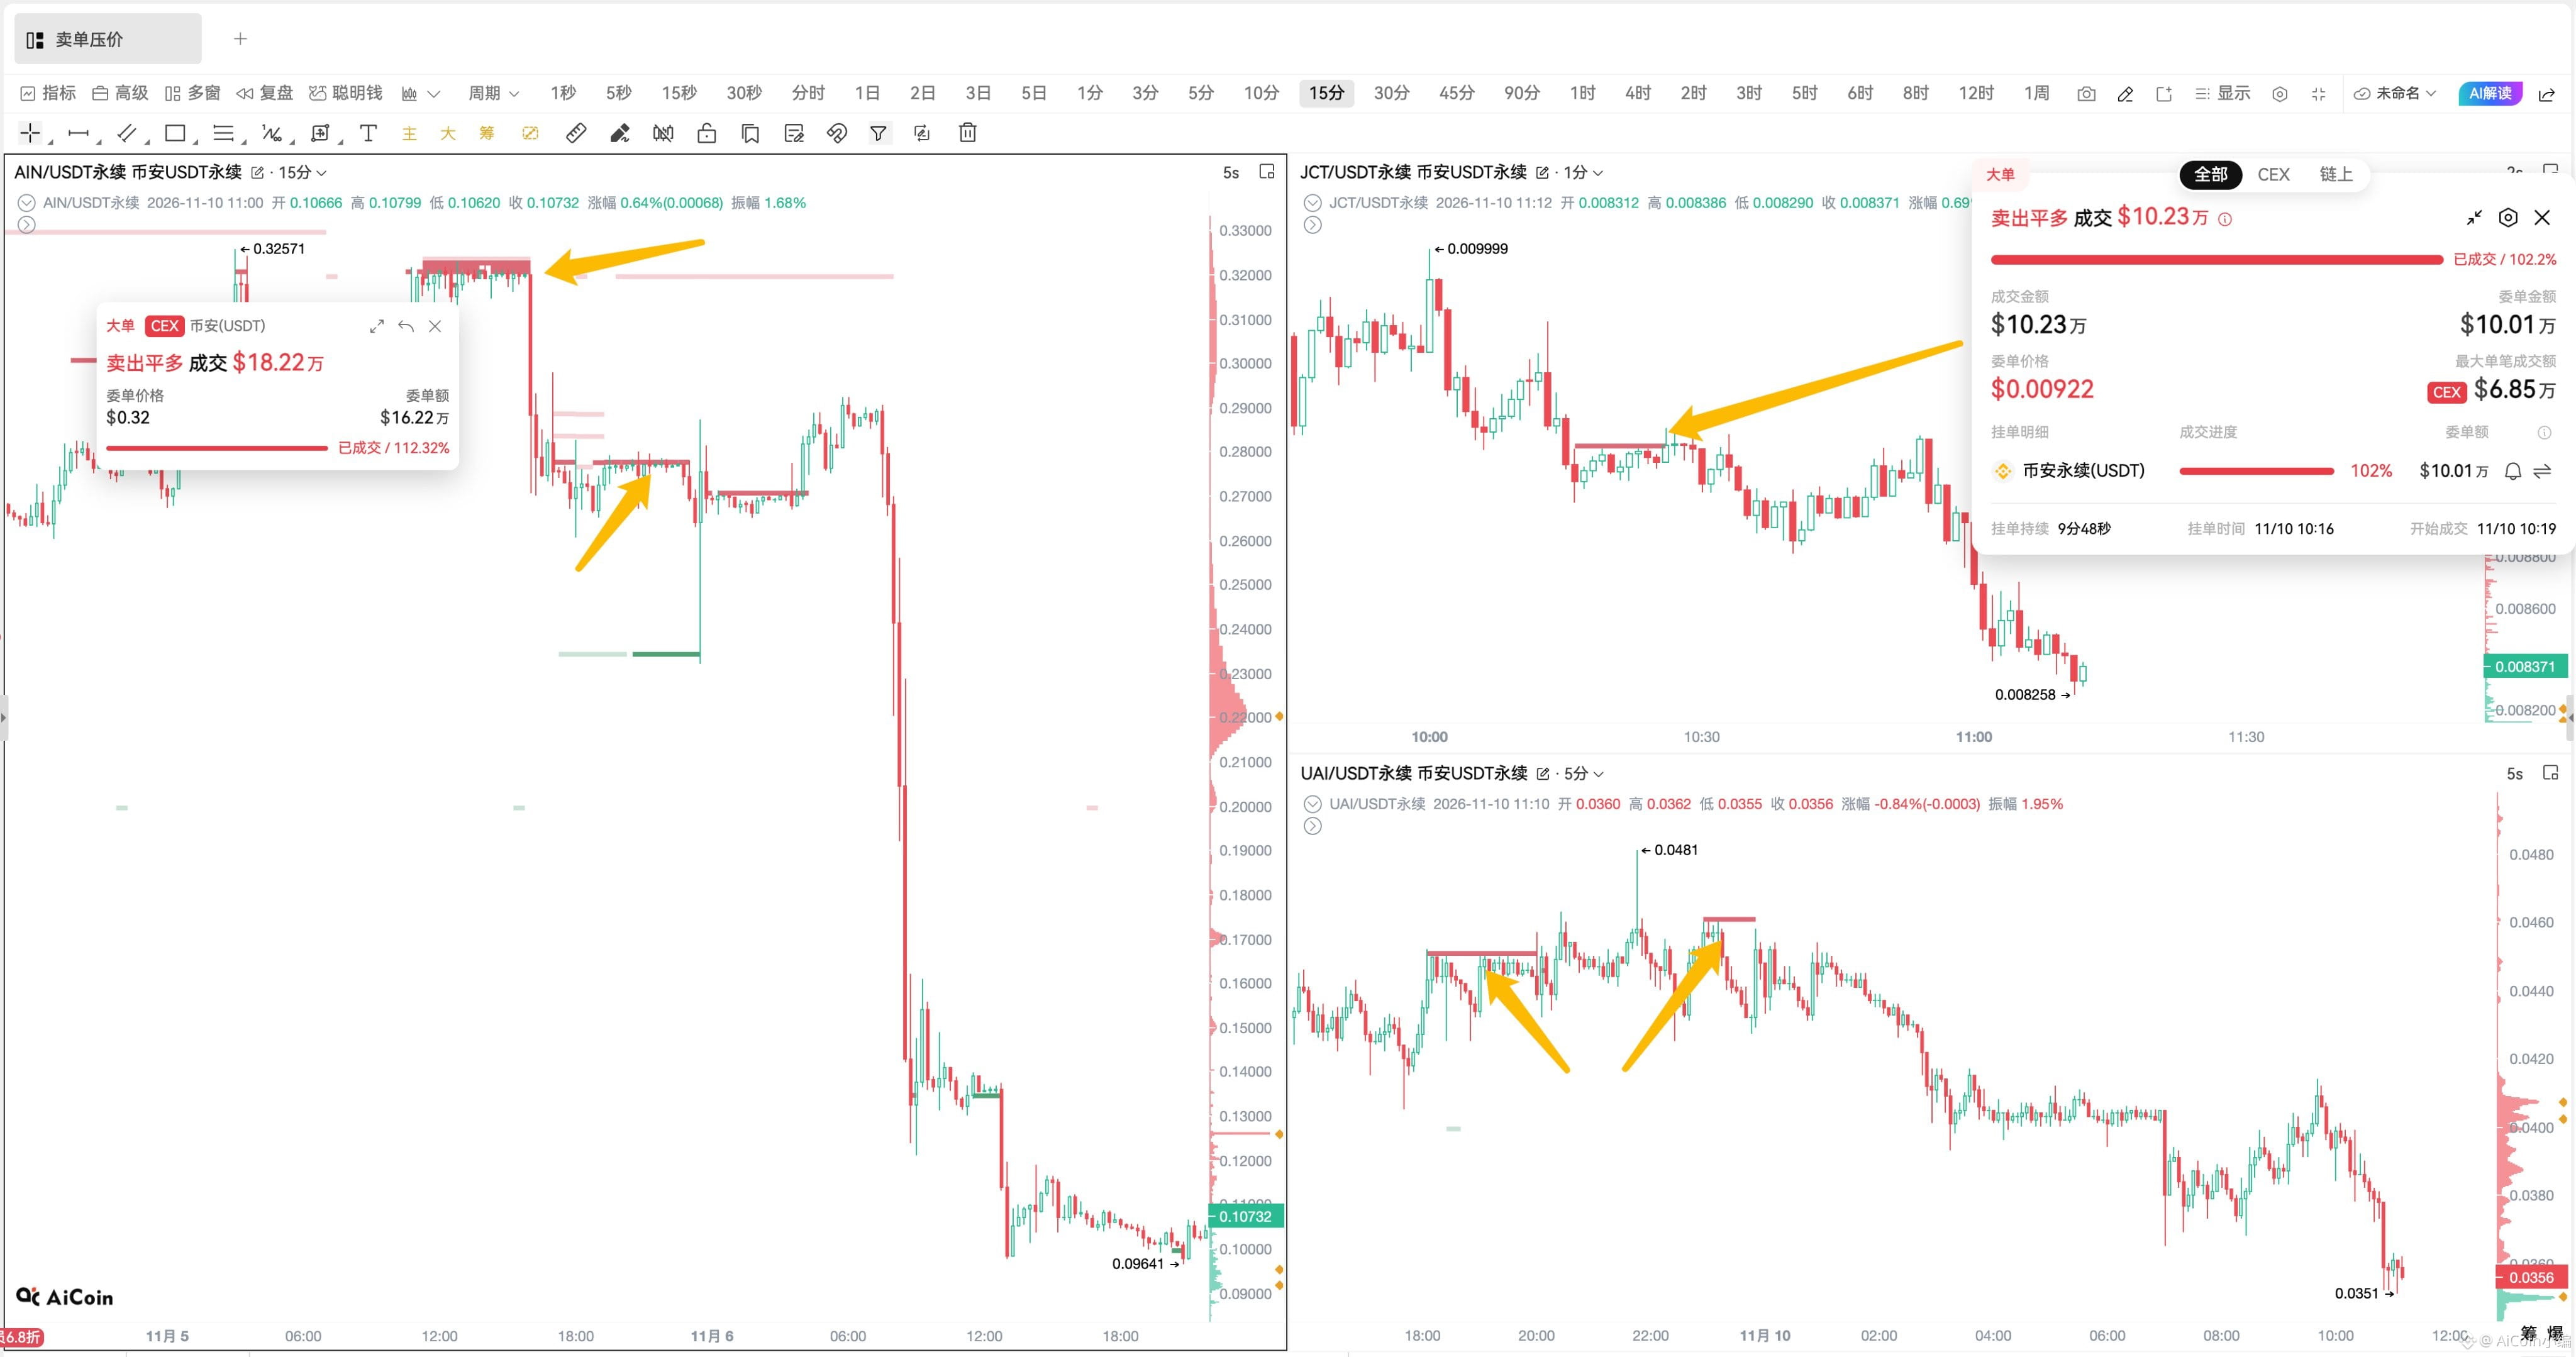
Big sell orders are capping the price. I’ve seen this episode before 🤨
$UAI : Yesterday, around $780,000 worth of sell orders were placed at 0.045–0.046. About $150,000 was then filled, and the price kept getting pushed down from that range.
$JCT : Today, a large $100,000 long-position close appeared at 0.00922, and the price hit clear resistance when it bounced back to that level.
This looks all too familiar. Not long ago, $AIN was a classic case of large sell orders pushing the price down, pinning it firmly around 0.32 and shaking people out until they had no fight left—then the price was dumped, cut in half, and traders were taken for a ride.
When big orders are capping the price like this, is it the whales putting on an act to shake out traders, or are they really preparing to bail and drive the price down? 🤔
Big sell orders are capping the price. I’ve seen this episode before 🤨
$UAI : Yesterday, around $780,000 worth of sell orders were placed at 0.045–0.046. About $150,000 was then filled, and the price kept getting pushed down from that range.
$JCT : Today, a large $100,000 long-position close appeared at 0.00922, and the price hit clear resistance when it bounced back to that level.
This looks all too familiar. Not long ago, $AIN was a classic case of large sell orders pushing the price down, pinning it firmly around 0.32 and shaking people out until they had no fight left—then the price was dumped, cut in half, and traders were taken for a ride.
When big orders are capping the price like this, is it the whales putting on an act to shake out traders, or are they really preparing to bail and drive the price down? 🤔
$UAI : Yesterday, around $780,000 worth of sell orders were placed at 0.045–0.046. About $150,000 was then filled, and the price kept getting pushed down from that range.
$JCT : Today, a large $100,000 long-position close appeared at 0.00922, and the price hit clear resistance when it bounced back to that level.
This looks all too familiar. Not long ago, $AIN was a classic case of large sell orders pushing the price down, pinning it firmly around 0.32 and shaking people out until they had no fight left—then the price was dumped, cut in half, and traders were taken for a ride.
When big orders are capping the price like this, is it the whales putting on an act to shake out traders, or are they really preparing to bail and drive the price down? 🤔
4
·
--
What’s unraveling for Jensen Huang this time goes far beyond his “devoted husband” image 😅
If this were just about an affair in his private life, $NVDA wouldn’t be this sensitive.
What’s really spooking the market is the combination of several things:
- A national security investigation
- Chip export controls
- Congressional inquiries
What makes things worse is that Nvidia has just been through a round of AI valuation declines, and now there’s another risk that almost no one had priced in before—Jensen Huang himself.
When the CEO himself becomes a risk factor, the story changes…
#黄仁勋 #英伟达
What’s unraveling for Jensen Huang this time goes far beyond his “devoted husband” image 😅
If this were just about an affair in his private life, $NVDA wouldn’t be this sensitive.
What’s really spooking the market is the combination of several things:
- A national security investigation
- Chip export controls
- Congressional inquiries
What makes things worse is that Nvidia has just been through a round of AI valuation declines, and now there’s another risk that almost no one had priced in before—Jensen Huang himself.
When the CEO himself becomes a risk factor, the story changes…
#黄仁勋 #英伟达
If this were just about an affair in his private life, $NVDA wouldn’t be this sensitive.
What’s really spooking the market is the combination of several things:
- A national security investigation
- Chip export controls
- Congressional inquiries
What makes things worse is that Nvidia has just been through a round of AI valuation declines, and now there’s another risk that almost no one had priced in before—Jensen Huang himself.
When the CEO himself becomes a risk factor, the story changes…
#黄仁勋 #英伟达
96
·
--
Bearish
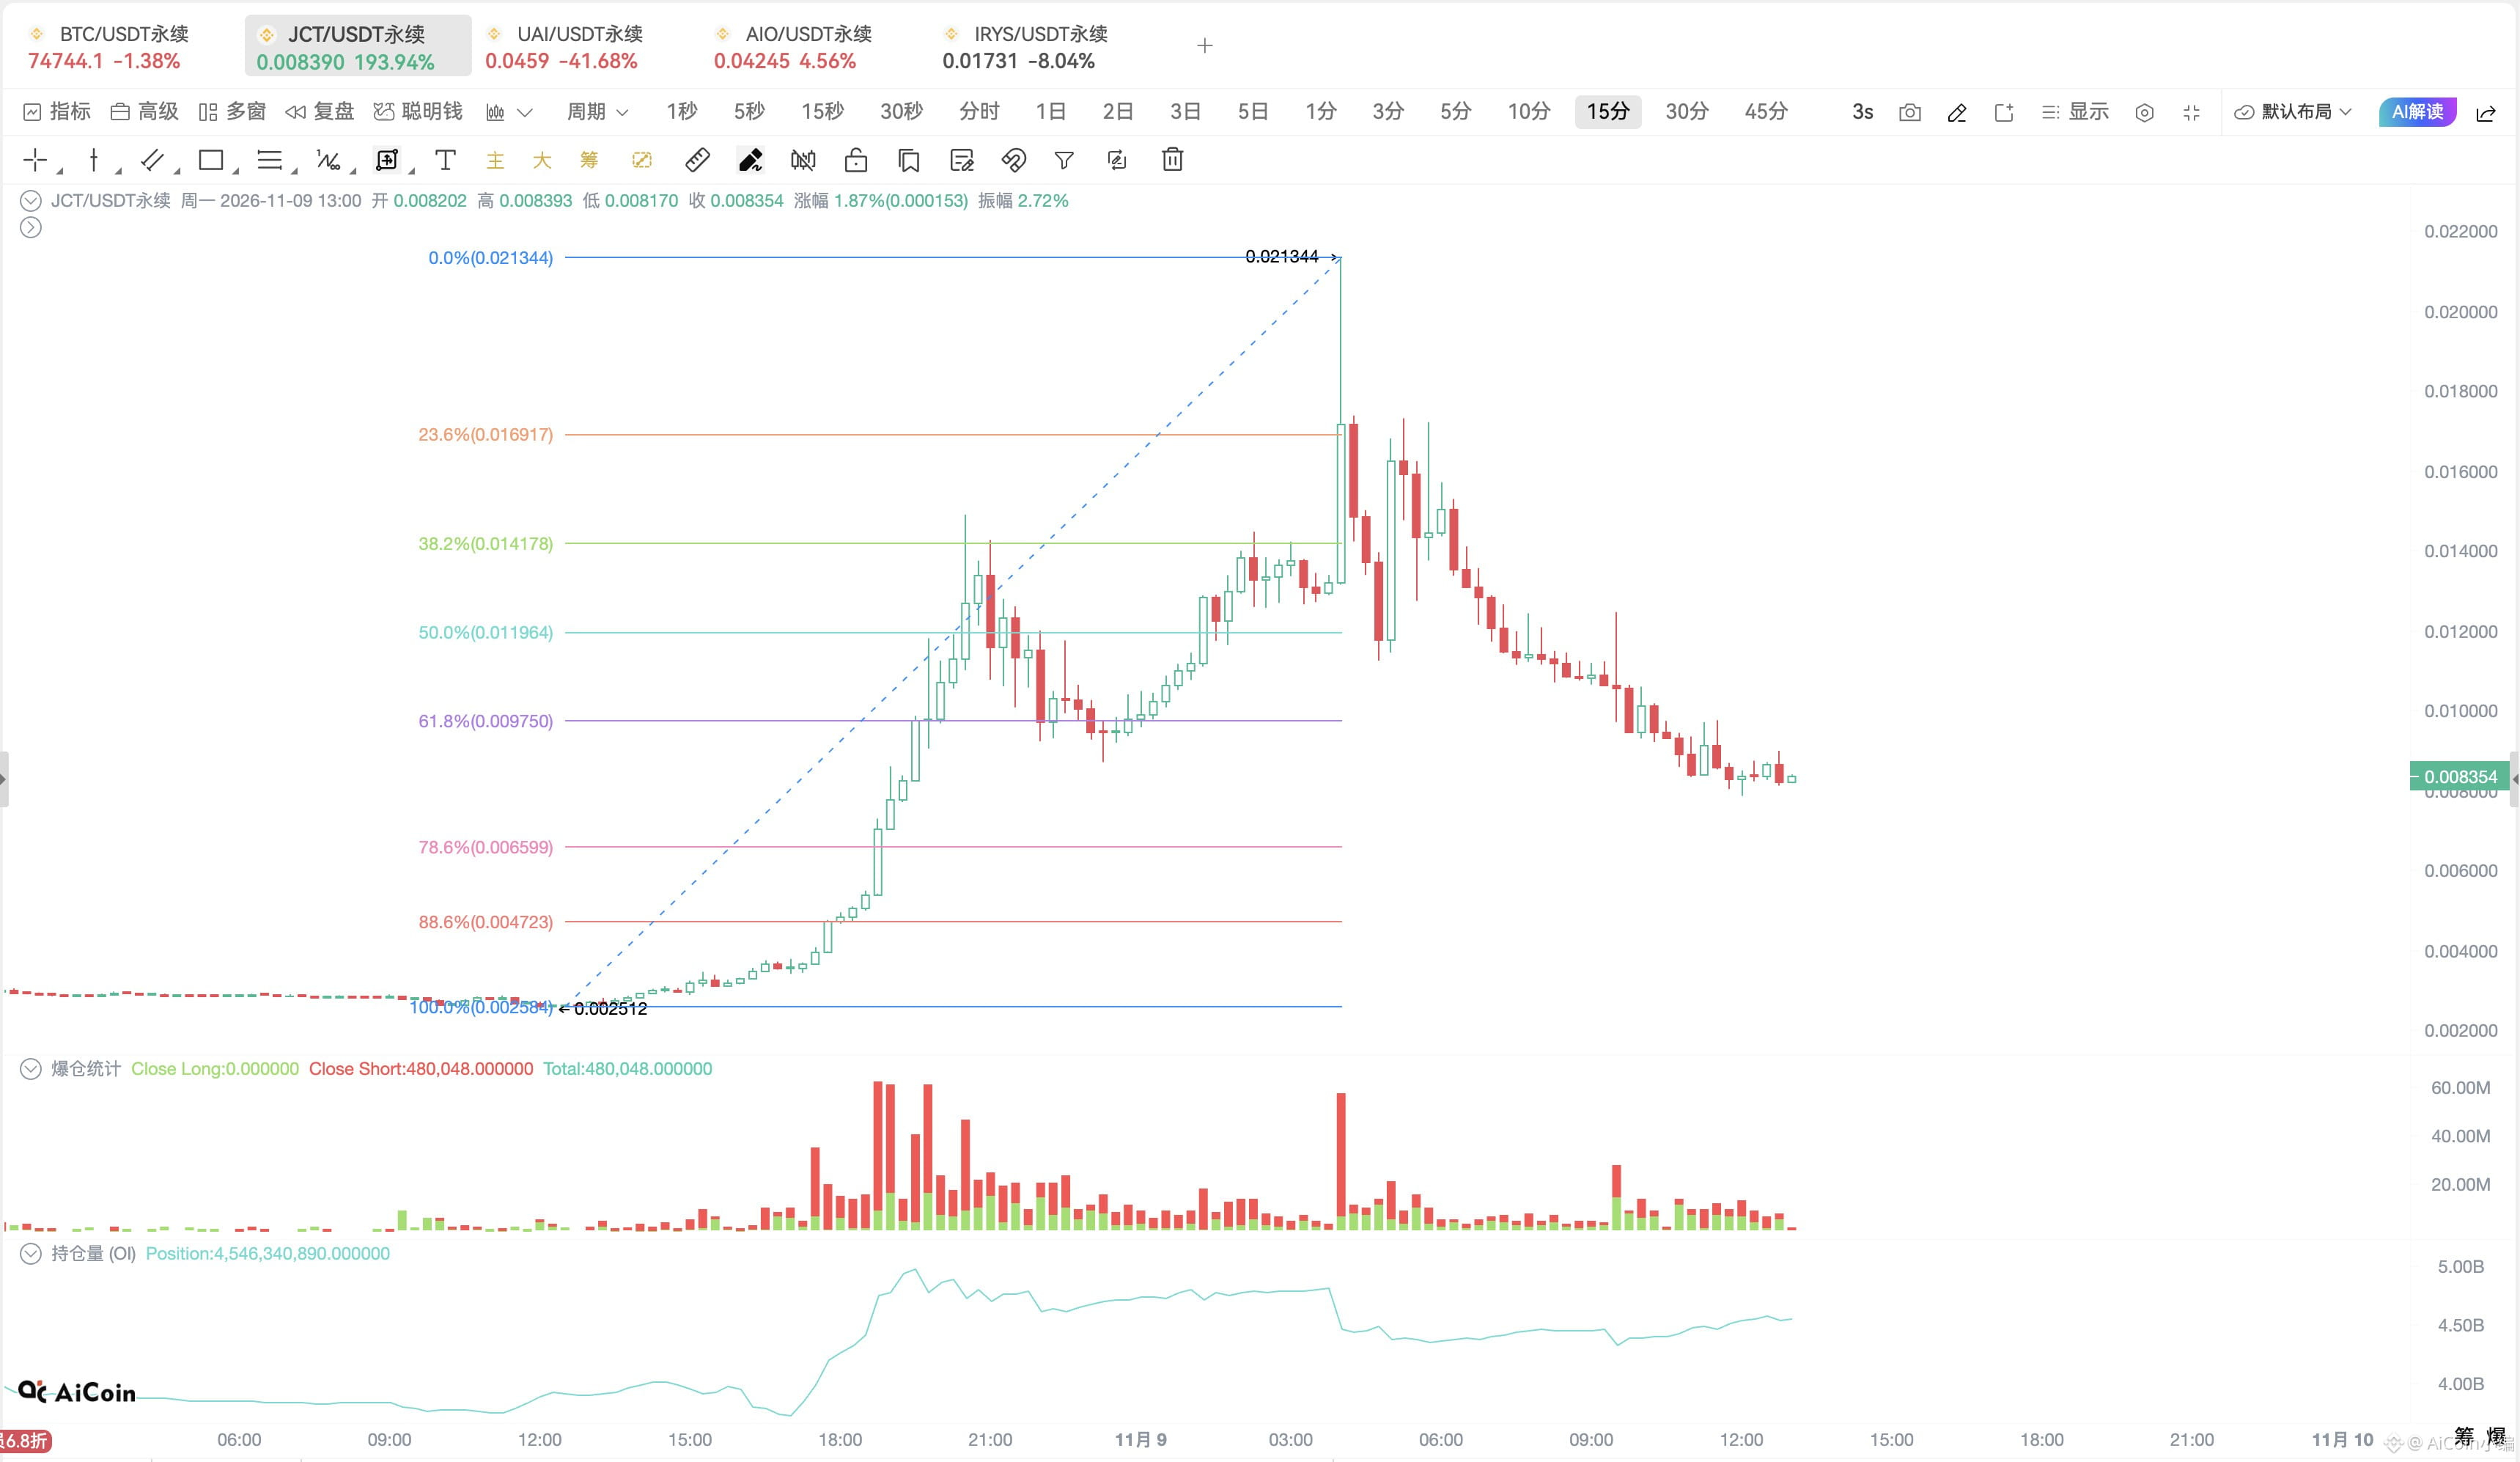
$JCT This move wiped out both longs and shorts 🤯
From a high of $0.0213, the price plunged all the way to around $0.008. It had surged 700%+ earlier, then promptly got cut in half.
Liquidations over the past 24 hours totaled nearly $22.5 million; $11.48 million were liquidated in just the past 12 hours, including $8.09 million in shorts and $3.39 million in longs.
Technically, the price has already fallen below the 50% ($0.01196) and 61.8% ($0.00975) retracement levels.
In the short term, the first thing to watch is whether it can reclaim $0.00975. If it can’t, keep an eye on the area around $0.00659 (78.6%) below.
P.S. The last one to have this kind of extreme roller-coaster ride was $IRYS , which is now down 96%+ from its high 😅
$JCT This move wiped out both longs and shorts 🤯
From a high of $0.0213, the price plunged all the way to around $0.008. It had surged 700%+ earlier, then promptly got cut in half.
Liquidations over the past 24 hours totaled nearly $22.5 million; $11.48 million were liquidated in just the past 12 hours, including $8.09 million in shorts and $3.39 million in longs.
Technically, the price has already fallen below the 50% ($0.01196) and 61.8% ($0.00975) retracement levels.
In the short term, the first thing to watch is whether it can reclaim $0.00975. If it can’t, keep an eye on the area around $0.00659 (78.6%) below.
P.S. The last one to have this kind of extreme roller-coaster ride was $IRYS , which is now down 96%+ from its high 😅
From a high of $0.0213, the price plunged all the way to around $0.008. It had surged 700%+ earlier, then promptly got cut in half.
Liquidations over the past 24 hours totaled nearly $22.5 million; $11.48 million were liquidated in just the past 12 hours, including $8.09 million in shorts and $3.39 million in longs.
Technically, the price has already fallen below the 50% ($0.01196) and 61.8% ($0.00975) retracement levels.
In the short term, the first thing to watch is whether it can reclaim $0.00975. If it can’t, keep an eye on the area around $0.00659 (78.6%) below.
P.S. The last one to have this kind of extreme roller-coaster ride was $IRYS , which is now down 96%+ from its high 😅
1
834
·
--
Up $68 million on paper but didn’t sell, then ended up losing $28 million—this BTC whale is back 😮
Address 3Ps78K…CYhm9F has been steadily accumulating $BTC over the past 23 hours and now holds 3,009 BTC, worth about $228 million. Its previous position had quite a dramatic run:
In late December 2024, it bought around 5,700 BTC near $93K–$95K. By late January 2025, its unrealized profit had peaked at +$68 million.
It didn’t reduce its position. BTC then kept falling, and only then did it start selling in batches:
- February 13: -1,100 BTC
- February 26: -1,612 BTC
- April 11: -1,500 BTC
- April 24: -1,485 BTC
By April 9 last year, its account’s P&L had gone from +$68 million to -$58 million.
After fully exiting, its cumulative P&L settled at -$28 million.
Now that $BTC has fallen to around $75K, it has started building a position again, at roughly 53% of the size of its previous position.
What do you think of this move? Is it buying the dip, or getting trapped again?
Up $68 million on paper but didn’t sell, then ended up losing $28 million—this BTC whale is back 😮
Address 3Ps78K…CYhm9F has been steadily accumulating $BTC over the past 23 hours and now holds 3,009 BTC, worth about $228 million. Its previous position had quite a dramatic run:
In late December 2024, it bought around 5,700 BTC near $93K–$95K. By late January 2025, its unrealized profit had peaked at +$68 million.
It didn’t reduce its position. BTC then kept falling, and only then did it start selling in batches:
- February 13: -1,100 BTC
- February 26: -1,612 BTC
- April 11: -1,500 BTC
- April 24: -1,485 BTC
By April 9 last year, its account’s P&L had gone from +$68 million to -$58 million.
After fully exiting, its cumulative P&L settled at -$28 million.
Now that $BTC has fallen to around $75K, it has started building a position again, at roughly 53% of the size of its previous position.
What do you think of this move? Is it buying the dip, or getting trapped again?
Address 3Ps78K…CYhm9F has been steadily accumulating $BTC over the past 23 hours and now holds 3,009 BTC, worth about $228 million. Its previous position had quite a dramatic run:
In late December 2024, it bought around 5,700 BTC near $93K–$95K. By late January 2025, its unrealized profit had peaked at +$68 million.
It didn’t reduce its position. BTC then kept falling, and only then did it start selling in batches:
- February 13: -1,100 BTC
- February 26: -1,612 BTC
- April 11: -1,500 BTC
- April 24: -1,485 BTC
By April 9 last year, its account’s P&L had gone from +$68 million to -$58 million.
After fully exiting, its cumulative P&L settled at -$28 million.
Now that $BTC has fallen to around $75K, it has started building a position again, at roughly 53% of the size of its previous position.
What do you think of this move? Is it buying the dip, or getting trapped again?

91
·
--
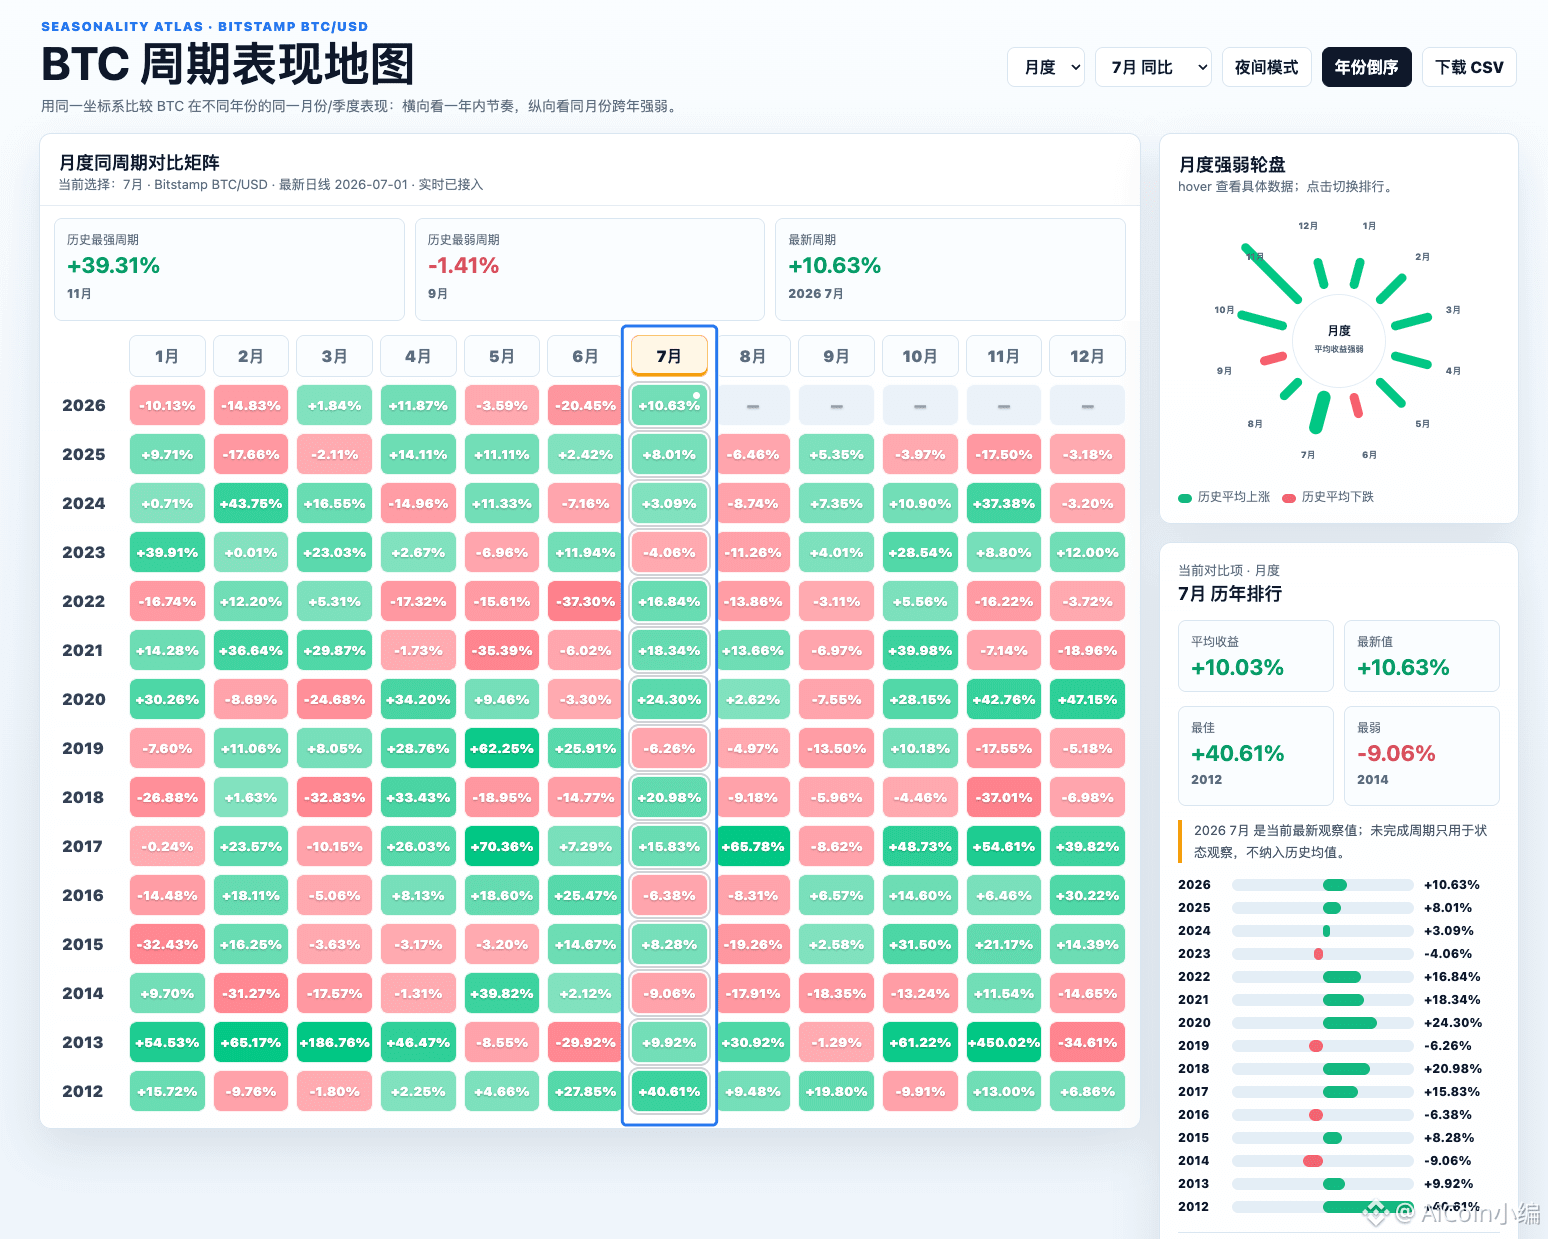
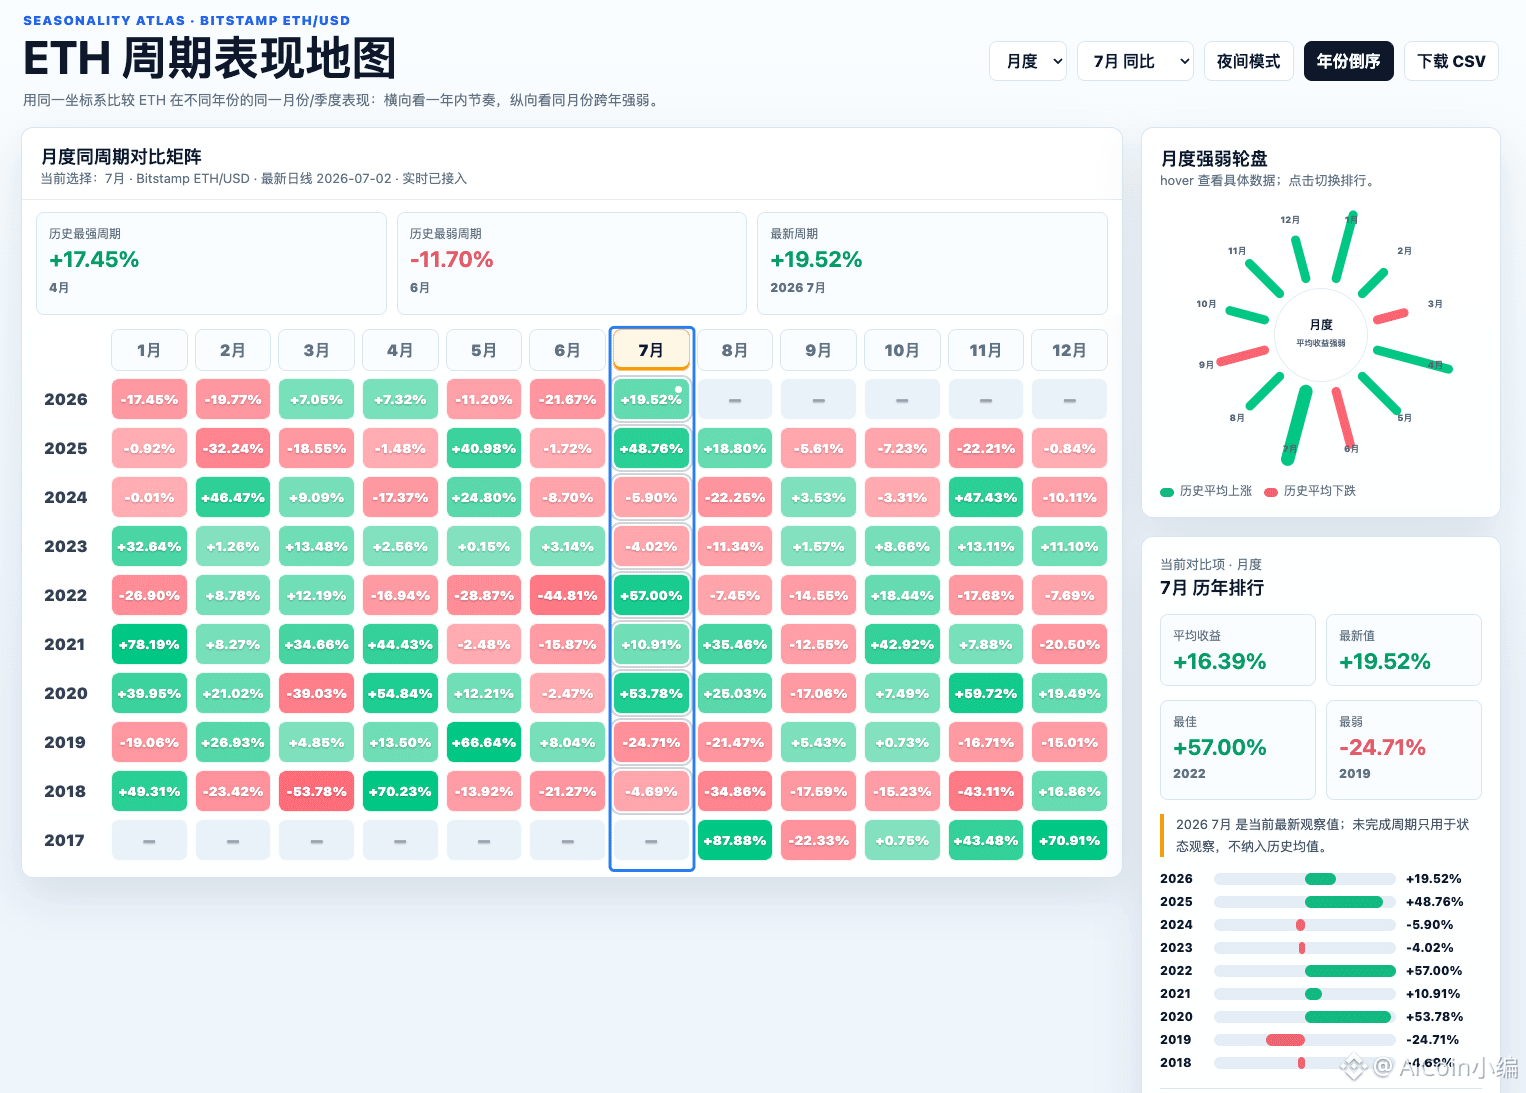
The first half of July hasn’t even passed, and $BTC 、$ETH have already turned in a solid performance!
🗺️From the cycle performance map:
BTC is up +10.54% so far in July, compared with the historical average July return of +10.03%;
ETH is stronger, up +19.42% so far in July, compared with the historical average July return of +16.39%.
📍Behind this are several main threads converging:
- ETF inflows returning, with institutional buying stepping in to provide support again;
- Institutional “whales” went on a rampage buying at June’s low levels—27万+ BTC;
- Stablecoins, on-chain finance, and tokenization narratives are heating up, with ETH showing stronger elasticity;
- Easing inflation + more dovish Fed expectations, helping risk appetite rebound;
- Historically, July itself is one of the months when BTC and ETH have tended to perform well.
History won’t simply repeat, but the cycle and liquidity are aligning ~
The first half of July hasn’t even passed, and $BTC 、$ETH have already turned in a solid performance!
🗺️From the cycle performance map:
BTC is up +10.54% so far in July, compared with the historical average July return of +10.03%;
ETH is stronger, up +19.42% so far in July, compared with the historical average July return of +16.39%.
📍Behind this are several main threads converging:
- ETF inflows returning, with institutional buying stepping in to provide support again;
- Institutional “whales” went on a rampage buying at June’s low levels—27万+ BTC;
- Stablecoins, on-chain finance, and tokenization narratives are heating up, with ETH showing stronger elasticity;
- Easing inflation + more dovish Fed expectations, helping risk appetite rebound;
- Historically, July itself is one of the months when BTC and ETH have tended to perform well.
History won’t simply repeat, but the cycle and liquidity are aligning ~
🗺️From the cycle performance map:
BTC is up +10.54% so far in July, compared with the historical average July return of +10.03%;
ETH is stronger, up +19.42% so far in July, compared with the historical average July return of +16.39%.
📍Behind this are several main threads converging:
- ETF inflows returning, with institutional buying stepping in to provide support again;
- Institutional “whales” went on a rampage buying at June’s low levels—27万+ BTC;
- Stablecoins, on-chain finance, and tokenization narratives are heating up, with ETH showing stronger elasticity;
- Easing inflation + more dovish Fed expectations, helping risk appetite rebound;
- Historically, July itself is one of the months when BTC and ETH have tended to perform well.
History won’t simply repeat, but the cycle and liquidity are aligning ~
114
·
--
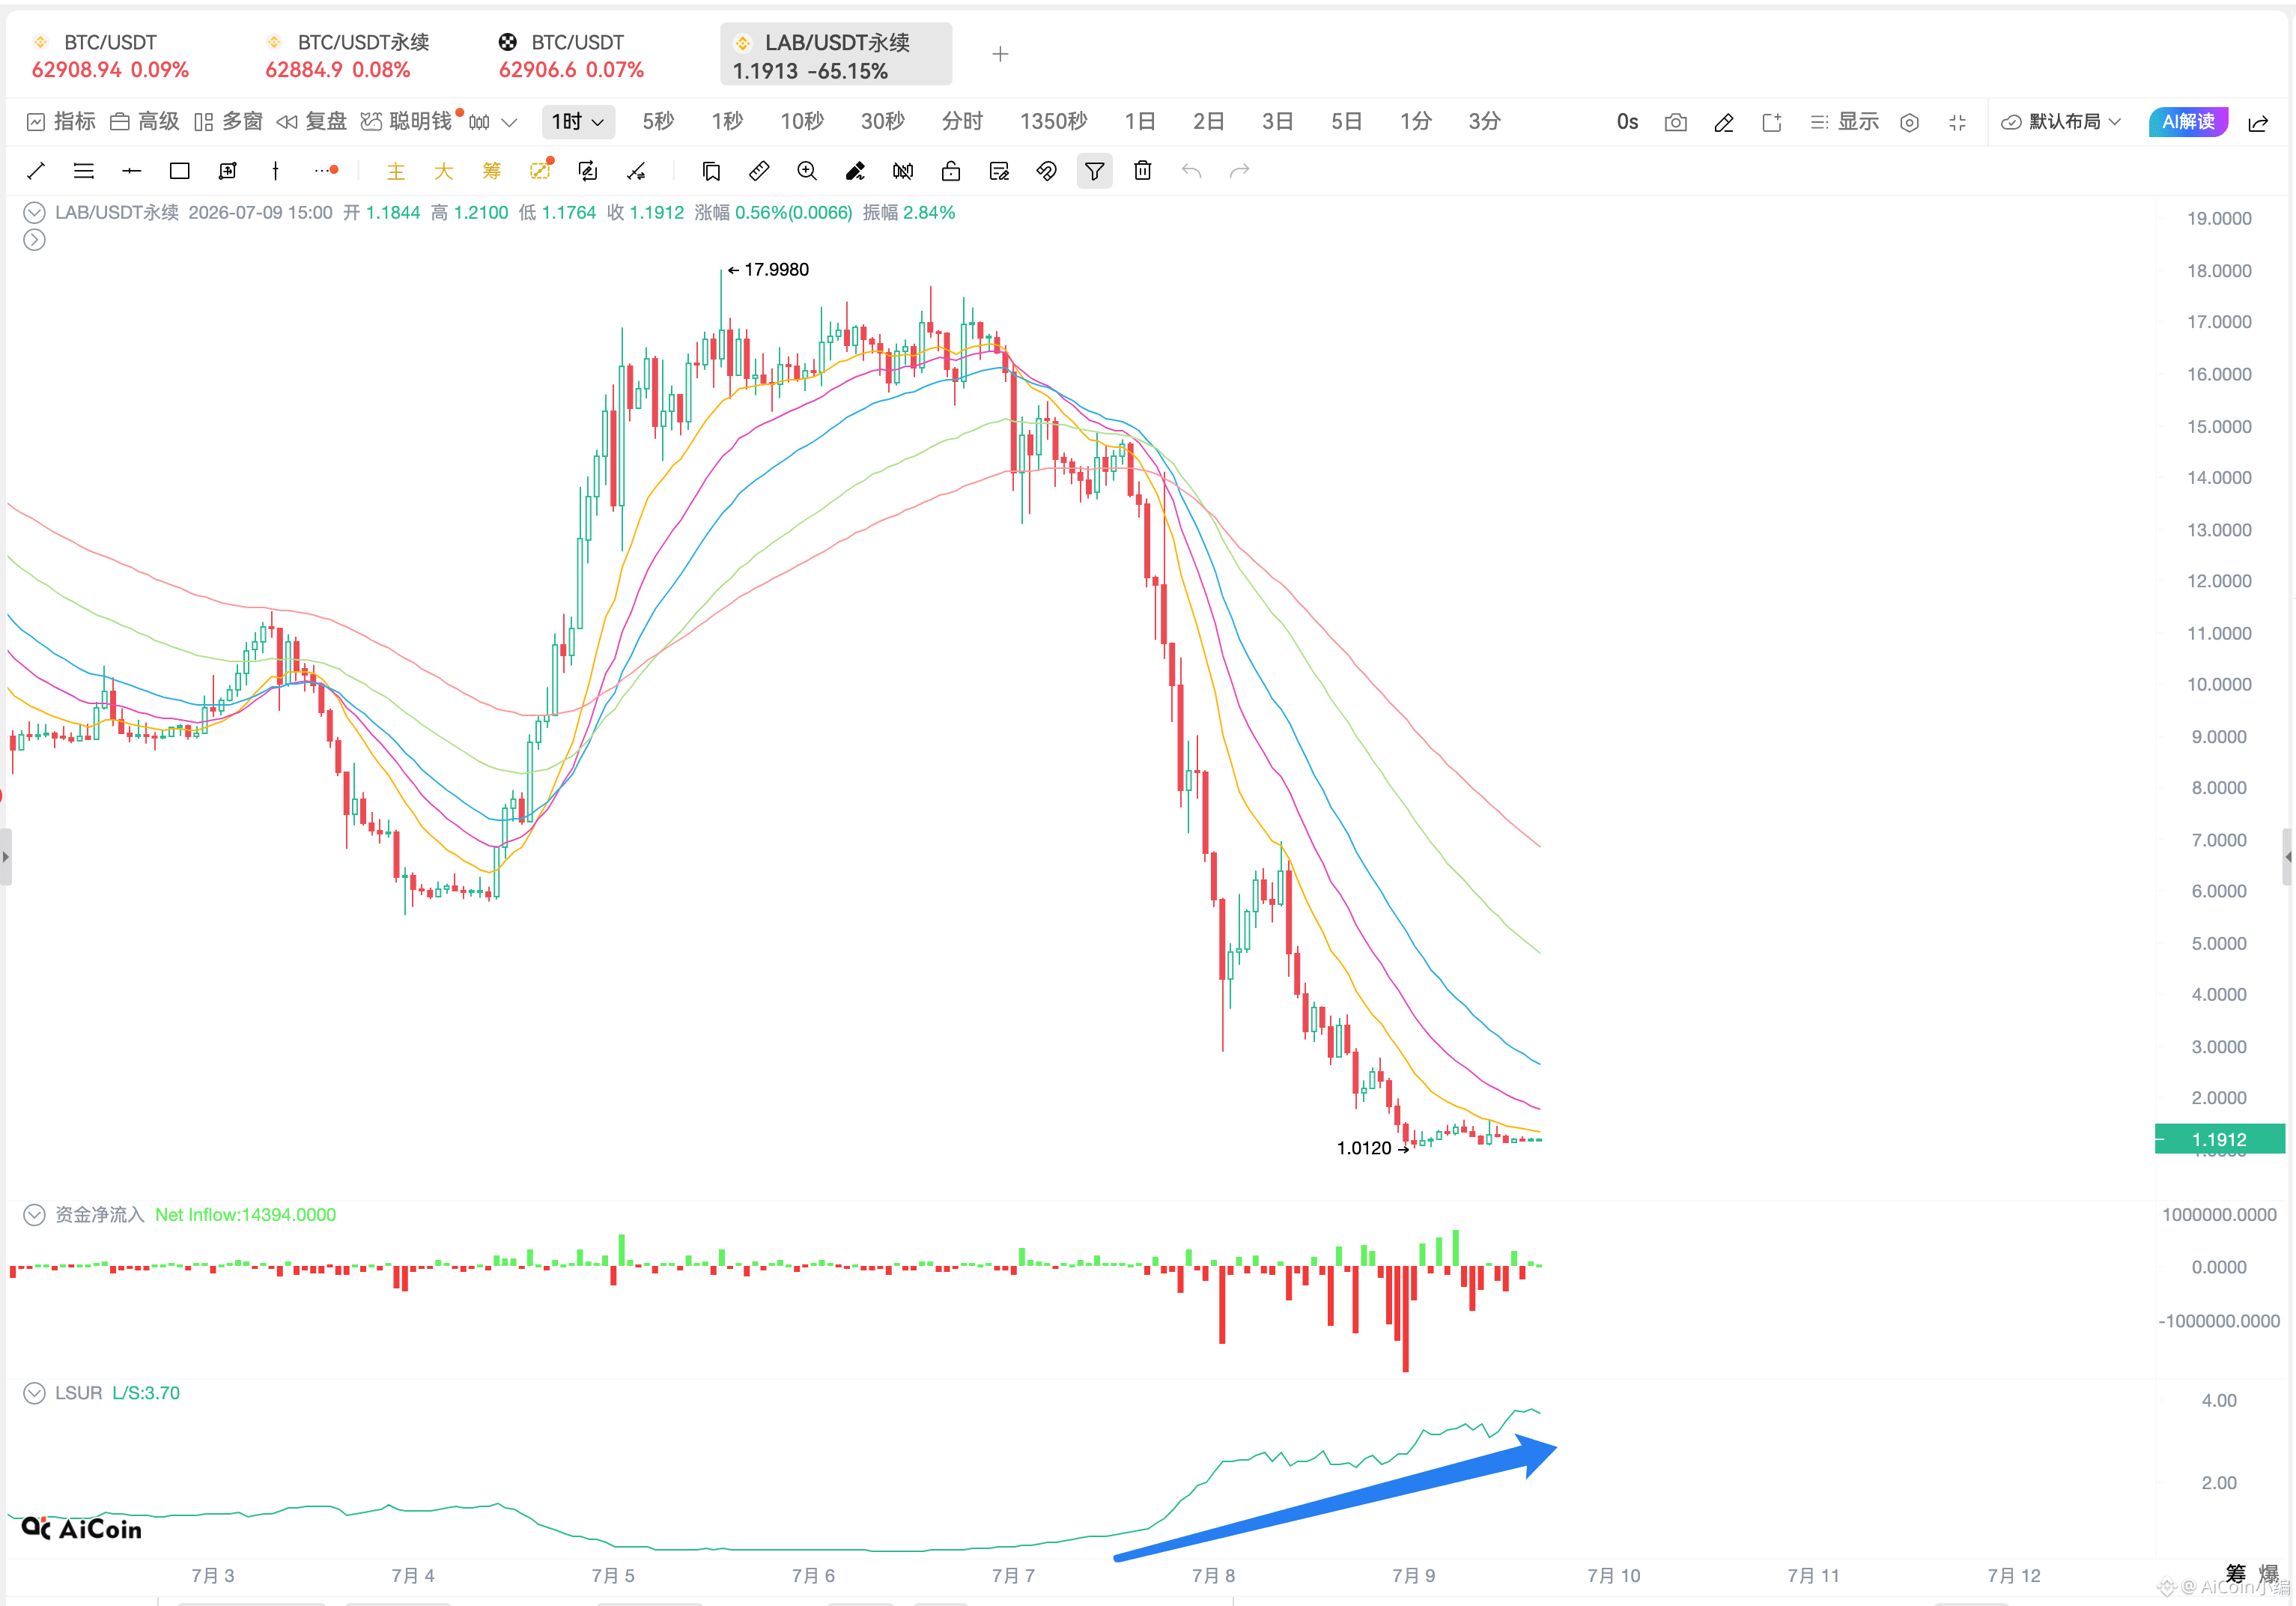
Buy the more it falls? $LAB long/short position ratio (LSUR) has jumped to 3.6+—are so many people going long?
Buy the more it falls? $LAB long/short position ratio (LSUR) has jumped to 3.6+—are so many people going long?
351
Log in to explore more content
Join global crypto users on Binance Square
⚡️ Get latest and useful information about crypto.
💬 Trusted by the world’s largest crypto exchange.
👍 Discover real insights from verified creators.
Email / Phone number
Trending Topics
NvidiaBeatsEstimatesWith$130BQ4Outlook
17,261 views
207 Discussing
Nvidia Beats With $115.8 Billion in Revenue, Guides to $130 Billion and Adds $150 Billion Buyback
Binance News
·50 Likes
·44.7k views
AnthropicIPOPriceCouldExceed$80
22,019 views
177 Discussing
RussiaCentralBankAddsAlfaBankToCryptoExchangeRegister
0 views
11 Discussing