Binance Square
Libra
13.1k Posts

Libra

BNB Holder || Financial Analyst || Providing investors with the latest market news.
Open Trade

BTW Holder
BTW Holder
High-Frequency Trader
5.4 Years
72 Following
561 Followers
1.9K+ Liked
Posts
Portfolio
·
--
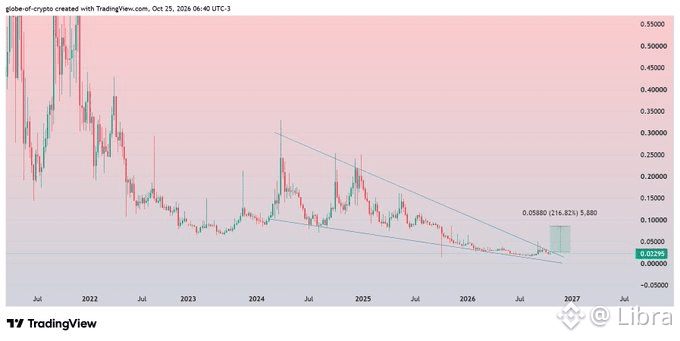
$XLM doesn’t move often. That’s what makes it dangerous. Most of its life is spent doing absolutely nothing. No hype. No headlines. No reason to even open the chart. Then one day… It reminds everyone why they should have. Look back. The first explosion came almost out of nowhere. Over 1,000% in a matter of months. By the time people realized what was happening, most of the move was already over. Years passed. Everyone moved on. Then it happened again. Another quiet accumulation. Another moment where nobody cared. Another vertical move that caught the market completely off guard. That’s what makes this chart so interesting today. Not the target. Not the percentage. The rhythm. XLM doesn’t grind higher every month like some other coins. It disappears. It gets forgotten. Then it makes one move that erases years of boredom. Right now, price feels eerily similar to those previous reset phases. Volatility is compressed. Expectations are low. Nobody is talking about Stellar anymore. Ironically, that’s often when it becomes the most interesting. Will history repeat for a third time? Nobody knows. But if $XLM follows the script it has already written twice… The next time everyone starts tweeting about Stellar… It probably won’t be trading anywhere near today’s price.
$XLM
doesn’t move often.

That’s what makes it dangerous.

Most of its life is spent doing absolutely nothing.

No hype.

No headlines.

No reason to even open the chart.

Then one day…

It reminds everyone why they should have.

Look back.

The first explosion came almost out of nowhere.

Over 1,000% in a matter of months.

By the time people realized what was happening, most of the move was already over.

Years passed.

Everyone moved on.

Then it happened again.

Another quiet accumulation.

Another moment where nobody cared.

Another vertical move that caught the market completely off guard.

That’s what makes this chart so interesting today.

Not the target.

Not the percentage.

The rhythm.

XLM doesn’t grind higher every month like some other coins.

It disappears.

It gets forgotten.

Then it makes one move that erases years of boredom.

Right now, price feels eerily similar to those previous reset phases.

Volatility is compressed.

Expectations are low.

Nobody is talking about Stellar anymore.

Ironically, that’s often when it becomes the most interesting.

Will history repeat for a third time?

Nobody knows.

But if
$XLM
follows the script it has already written twice…

The next time everyone starts tweeting about Stellar…

It probably won’t be trading anywhere near today’s price.
·
--
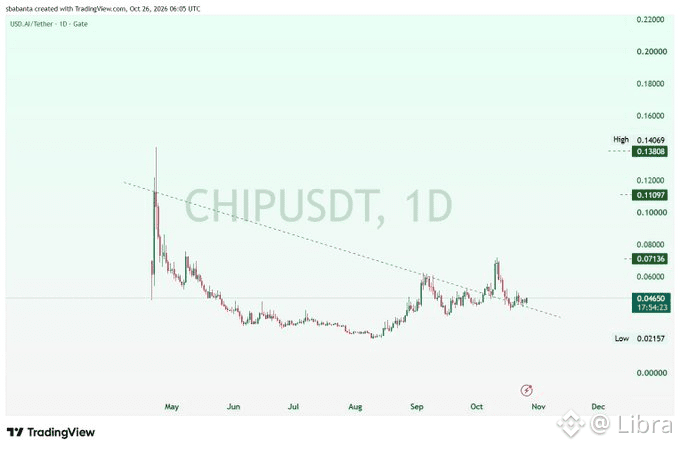
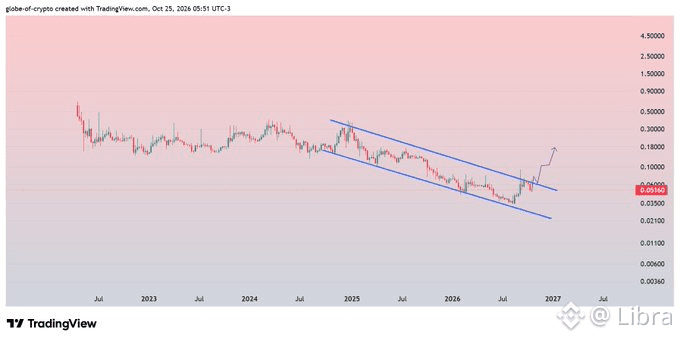
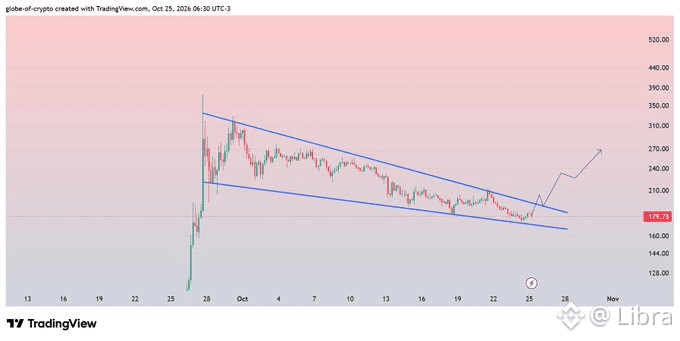
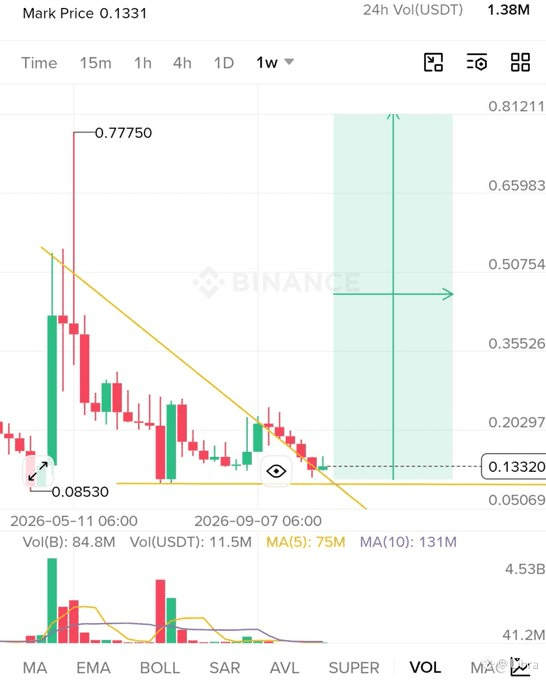
$ZRO #ZRO Already broken Descending Triangle on 1D Chart. Expecting a solid recovery move during coming days
$ZRO #ZRO
Already broken Descending Triangle on 1D Chart.
Expecting a solid recovery move during coming days
·
--
·
--
$ONDO rally isn't done yet Targeting $0.6 from here at least
$ONDO
rally isn't done yet

Targeting $0.6 from here at least
·
--
$GENIUS can go above $1 from here if bullish momentum continues. 🚀 The chart is looking strong, and a clean breakout could open the door to a significant move higher. The coming days and weeks could be exciting if momentum continues. Buy & hold.. ⏰💣
$GENIUS can go above $1 from here if bullish momentum continues.
🚀

The chart is looking strong, and a clean breakout could open the door to a significant move higher.

The coming days and weeks could be exciting if momentum continues.

Buy & hold..
⏰💣
·
--
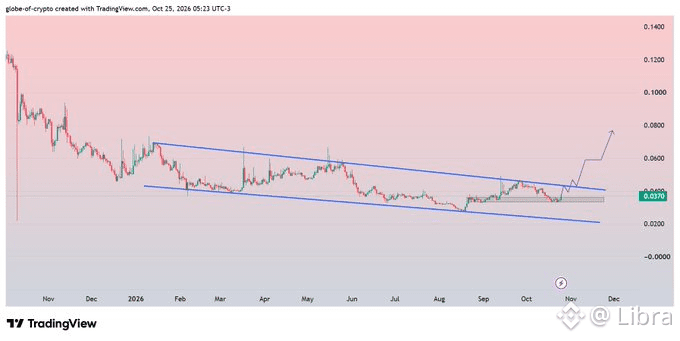
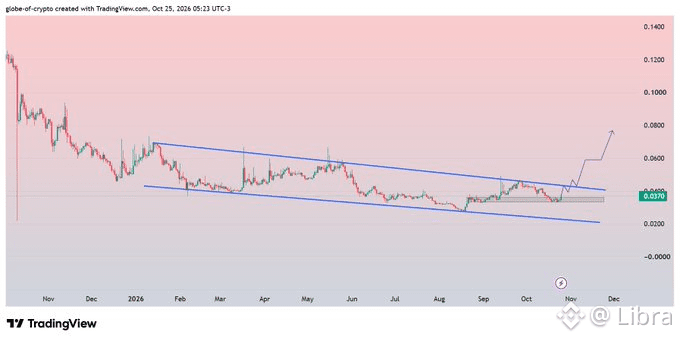
$TROLL has already proven what it's capable of. • First run: $0.009 → $0.28 (30x) 🚀 • Second run: $0.01 → $0.15 (15x) 🔥 Now $TROLL is building a base around $0.037–$0.045. I believe $TROY has the potential to reach a $1B market cap this cycle. 🔥
$TROLL
has already proven what it's capable of.

• First run: $0.009 → $0.28 (30x)
🚀

• Second run: $0.01 → $0.15 (15x)
🔥

Now
$TROLL
is building a base around $0.037–$0.045.

I believe
$TROY has the potential to reach a $1B market cap this cycle.
🔥
·
--
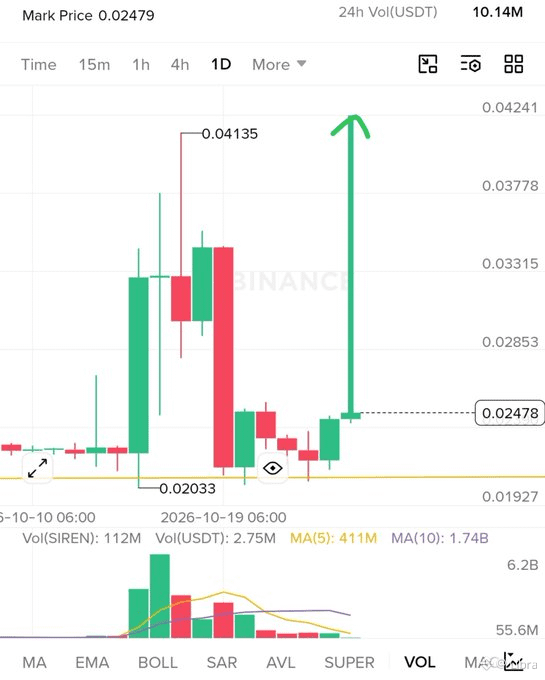
$DUSK M.CAP UPDATE!!! Needs to bounce now! This still looks like a fake breakdown like in 2022! 👀 I will update this as we go... STAY TUNED! Not FA!
$DUSK
M.CAP UPDATE!!!

Needs to bounce now!

This still looks like a fake breakdown like in 2022!
👀

I will update this as we go...

STAY TUNED!

Not FA!
·
--
$CHZ has quietly entered one of the most interesting accumulation zones on the chart. Not because it’s making new highs. Because it’s spent years doing the exact opposite. Since the 2021 peak, Chiliz has been trapped in a relentless downtrend, with every rally ending in another lower high. That’s exactly how long-term capitulation usually looks before sentiment begins to shift. The first level I’m watching sits around $0.14. This was previous support before turning into resistance, making it the first meaningful hurdle bulls need to reclaim. A successful break above that level would be the market’s first real signal that the long-term trend is changing. Above that, the next key area comes in around $0.30. Historically, this zone acted as a major pivot where buyers and sellers repeatedly fought for control. If price manages to reclaim it, momentum could accelerate as trapped supply starts getting absorbed. The biggest test sits near $0.66. That’s one of the strongest historical resistance levels left on the chart and the last major obstacle before the market begins discussing a return toward previous cycle highs. What’s interesting is that CHZ no longer needs to prove it can survive. It already has. The market spent years compressing price into a narrow range while volatility disappeared and interest faded. That’s often when the foundation for the next expansion is built. Most participants won’t pay attention while CHZ trades near multi-year lows. They’ll become interested after multiple resistance levels have already been reclaimed. By then, a large part of the move could already be behind them. For now, the chart is simple. Hold the base. Reclaim $0.14. Then $0.30. And if buyers keep control, $0.66 becomes the level that could completely change the long-term structure.
$CHZ
has quietly entered one of the most interesting accumulation zones on the chart.

Not because it’s making new highs.

Because it’s spent years doing the exact opposite.

Since the 2021 peak, Chiliz has been trapped in a relentless downtrend, with every rally ending in another lower high.

That’s exactly how long-term capitulation usually looks before sentiment begins to shift.

The first level I’m watching sits around $0.14.

This was previous support before turning into resistance, making it the first meaningful hurdle bulls need to reclaim.

A successful break above that level would be the market’s first real signal that the long-term trend is changing.

Above that, the next key area comes in around $0.30.

Historically, this zone acted as a major pivot where buyers and sellers repeatedly fought for control.

If price manages to reclaim it, momentum could accelerate as trapped supply starts getting absorbed.

The biggest test sits near $0.66.

That’s one of the strongest historical resistance levels left on the chart and the last major obstacle before the market begins discussing a return toward previous cycle highs.

What’s interesting is that CHZ no longer needs to prove it can survive.

It already has.

The market spent years compressing price into a narrow range while volatility disappeared and interest faded.

That’s often when the foundation for the next expansion is built.

Most participants won’t pay attention while CHZ trades near multi-year lows.

They’ll become interested after multiple resistance levels have already been reclaimed.

By then, a large part of the move could already be behind them.

For now, the chart is simple.

Hold the base.

Reclaim $0.14.

Then $0.30.

And if buyers keep control, $0.66 becomes the level that could completely change the long-term structure.
·
--
$1INCH UPDATE #1INCH is getting a good support here. We can see 100%+ gain here ✍🏻
$1INCH

UPDATE

#1INCH is getting a good support here. We can see 100%+ gain here
✍🏻
·
--
$CELO UPDATE #CELO is getting a good drop here. Expecting 30%+ drop here ✍🏻
$CELO

UPDATE

#CELO is getting a good drop here. Expecting 30%+ drop here
✍🏻
·
--
$NIL UPDATE #NIL is getting a good support here. Expecting 90%+ gain here ✍🏻
$NIL

UPDATE

#NIL is getting a good support here. Expecting 90%+ gain here
✍🏻
·
--
$EDEN UPDATE #EDEN is getting a good support here. In this move expecting 100%+ gain here ✍🏻
$EDEN

UPDATE

#EDEN is getting a good support here. In this move expecting 100%+ gain here
✍🏻
·
--
$PROVE UPDATE #PROVE is getting ready for breakout. In this move expecting 20%+ gain here ✍🏻
$PROVE

UPDATE

#PROVE is getting ready for breakout. In this move expecting 20%+ gain here
✍🏻
·
--
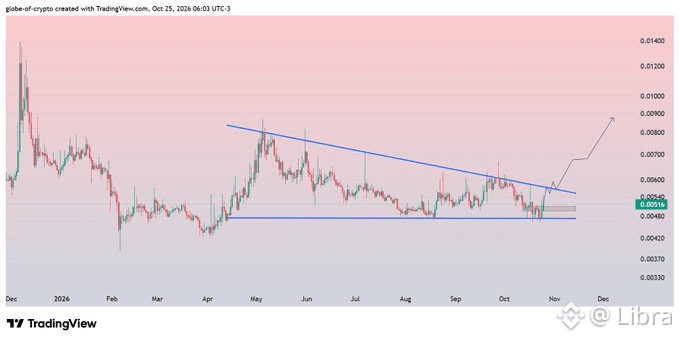
$AKE — Bullish structure confirmed, breakout retesting as support 📊 Price broke out clean from the resistance zone, and after tapping new highs, it's now retesting that same zone from above, exactly what a healthy breakout looks like. Structure has been textbook, higher lows building since the 22nd, respecting the rising trendline through every pullback. Currently at $0.0042374, up +35.23% today. Spot Entry Zone: 0.0038 - 0.0044 (accumulate on this retest holding as support) Risk Management: Invalidation: a clean break and close below 0.0035 weakens this structure, exit if that happens - Sell 33% at $0.006 - Sell another 33% at $0.007 - Hold remaining 33% for $0.010 as a longer-term target Structure remains bullish as long as this support zone holds. Manage your position size, don't go all-in. DYOR. NFA.
$AKE — Bullish structure confirmed, breakout retesting as support
📊

Price broke out clean from the resistance zone, and after tapping new highs, it's now retesting that same zone from above, exactly what a healthy breakout looks like. Structure has been textbook, higher lows building since the 22nd, respecting the rising trendline through every pullback.

Currently at $0.0042374, up +35.23% today.

Spot Entry Zone: 0.0038 - 0.0044 (accumulate on this retest holding as support)

Risk Management:
Invalidation: a clean break and close below 0.0035 weakens this structure, exit if that happens
- Sell 33% at $0.006
- Sell another 33% at $0.007
- Hold remaining 33% for $0.010 as a longer-term target

Structure remains bullish as long as this support zone holds. Manage your position size, don't go all-in.

DYOR. NFA.
·
--
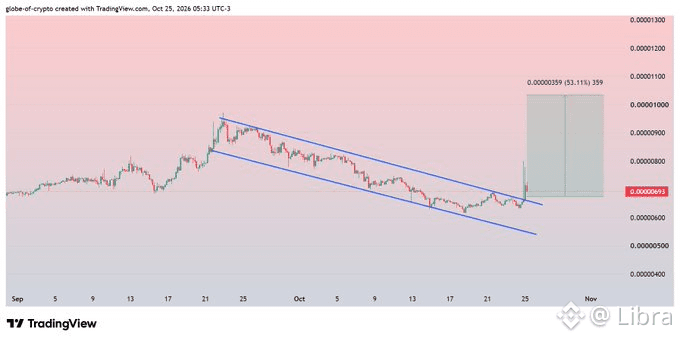
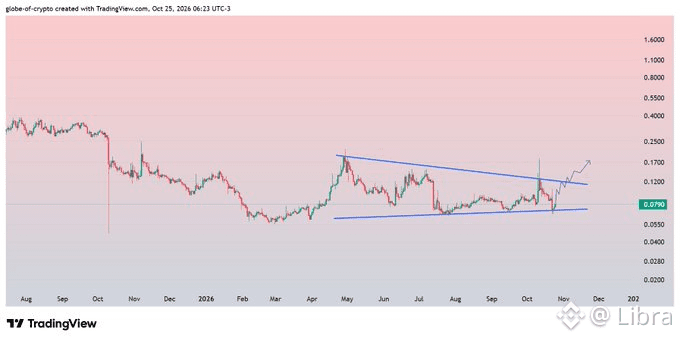
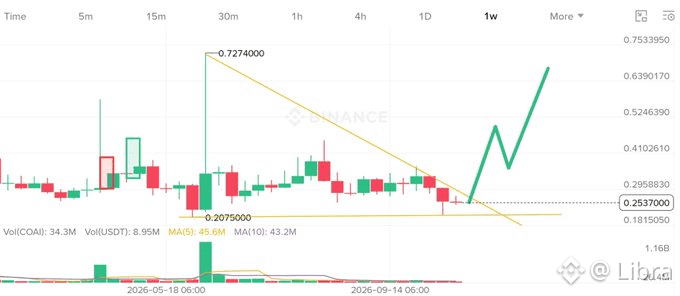
$ZRO #Zro Break Down the Trend Gradually Long-term, Breakthrough Success May Lead to Sustainable Recovery
·
--
$GRAM is showing strong potential. 🚀🚀🚀 If it successfully breaks above the key resistance with strong volume, a double-digit price could be the next major target. Keep an eye on the breakout confirmation and always manage your risk. 🔥📈 Like & RT will be appreciated ❤️
$GRAM is showing strong potential.
🚀🚀🚀

If it successfully breaks above the key resistance with strong volume, a double-digit price could be the next major target.

Keep an eye on the breakout confirmation and always manage your risk.
🔥📈

Like & RT will be appreciated
❤️
·
--
$PUMP retest on previous highs ☑️ red box is key
$PUMP

retest on previous highs
☑️

red box is key
·
--
$CRV has spent years getting destroyed. Not weeks. Not months. Years. From an all-time high above $23 $CRV has erased almost 99% of its value and is now sitting directly on one of the most important support zones in its entire trading history. This is exactly where long-term trends either completely die… Or quietly begin again. What’s interesting is that every major selloff has already happened. Weak hands have been forced out. Momentum traders disappeared. Volume collapsed. That’s usually what a mature accumulation phase looks like. The longer price stays compressed near a historical floor, the more explosive the eventual expansion tends to become. The first thing I’m watching isn’t $20. It’s the breakout itself. Once $CRV starts reclaiming previous weekly structure and confirms buyers are back in control, the market will begin repricing much faster than most expect. The majority of investors won’t notice until price is already several multiples higher. By then, everyone will suddenly have a bullish thesis. History shows that’s usually how these cycles unfold. $CRV doesn’t need new all-time highs tomorrow. It only needs to prove that the bottom is finally behind it. If that happens… One of the biggest comeback charts in crypto could already be forming.
$CRV
has spent years getting destroyed.

Not weeks.

Not months.

Years.

From an all-time high above $23

$CRV
has erased almost 99% of its value and is now sitting directly on one of the most important support zones in its entire trading history.

This is exactly where long-term trends either completely die…

Or quietly begin again.

What’s interesting is that every major selloff has already happened.

Weak hands have been forced out.

Momentum traders disappeared.

Volume collapsed.

That’s usually what a mature accumulation phase looks like.

The longer price stays compressed near a historical floor, the more explosive the eventual expansion tends to become.

The first thing I’m watching isn’t $20.

It’s the breakout itself.

Once
$CRV
starts reclaiming previous weekly structure and confirms buyers are back in control, the market will begin repricing much faster than most expect.

The majority of investors won’t notice until price is already several multiples higher.

By then, everyone will suddenly have a bullish thesis.

History shows that’s usually how these cycles unfold.

$CRV
doesn’t need new all-time highs tomorrow.

It only needs to prove that the bottom is finally behind it.

If that happens…

One of the biggest comeback charts in crypto could already be forming.
·
--
$NAORIS has been added to the portfolio from a key support level. 🚀🚀🚀 The setup is looking attractive, and I'm watching for a potential continuation move as long as support holds. The upcoming days & weeks will be explosive. Get in while its still cheap.. Buy & Hold. ⏰💣
$NAORIS has been added to the portfolio from a key support level.
🚀🚀🚀

The setup is looking attractive, and I'm watching for a potential continuation move as long as support holds.

The upcoming days & weeks will be explosive. Get in while its still cheap..

Buy & Hold.
⏰💣
·
--
Remember when everyone couldn’t stop talking about $WLD ? Every timeline. Every podcast. Every YouTube thumbnail. Now… Almost nobody even mentions it. Did the story disappear? Or did people’s attention move somewhere else? Those aren’t the same thing. Crypto doesn’t kill narratives. It just gets bored of them. Until price reminds everyone why they cared in the first place. Maybe $WLD never gets that moment. That’s possible. But if it does… People won’t be buying at these levels. They’ll be buying after it breaks every level they said was “impossible.” I’ve seen this cycle too many times.
Remember when everyone couldn’t stop talking about $WLD
?

Every timeline.

Every podcast.

Every YouTube thumbnail.

Now…

Almost nobody even mentions it.

Did the story disappear?

Or did people’s attention move somewhere else?

Those aren’t the same thing.

Crypto doesn’t kill narratives.

It just gets bored of them.

Until price reminds everyone why they cared in the first place.

Maybe
$WLD
never gets that moment.

That’s possible.

But if it does…

People won’t be buying at these levels.

They’ll be buying after it breaks every level they said was “impossible.”

I’ve seen this cycle too many times.
Log in to explore more content
Join global crypto users on Binance Square
⚡️ Get latest and useful information about crypto.
💬 Trusted by the world’s largest crypto exchange.
👍 Discover real insights from verified creators.
Email / Phone number
Sitemap
Cookie Preferences
Platform T&Cs