

币圈老杨_
806 Posts

币圈老杨_
Report
Block User
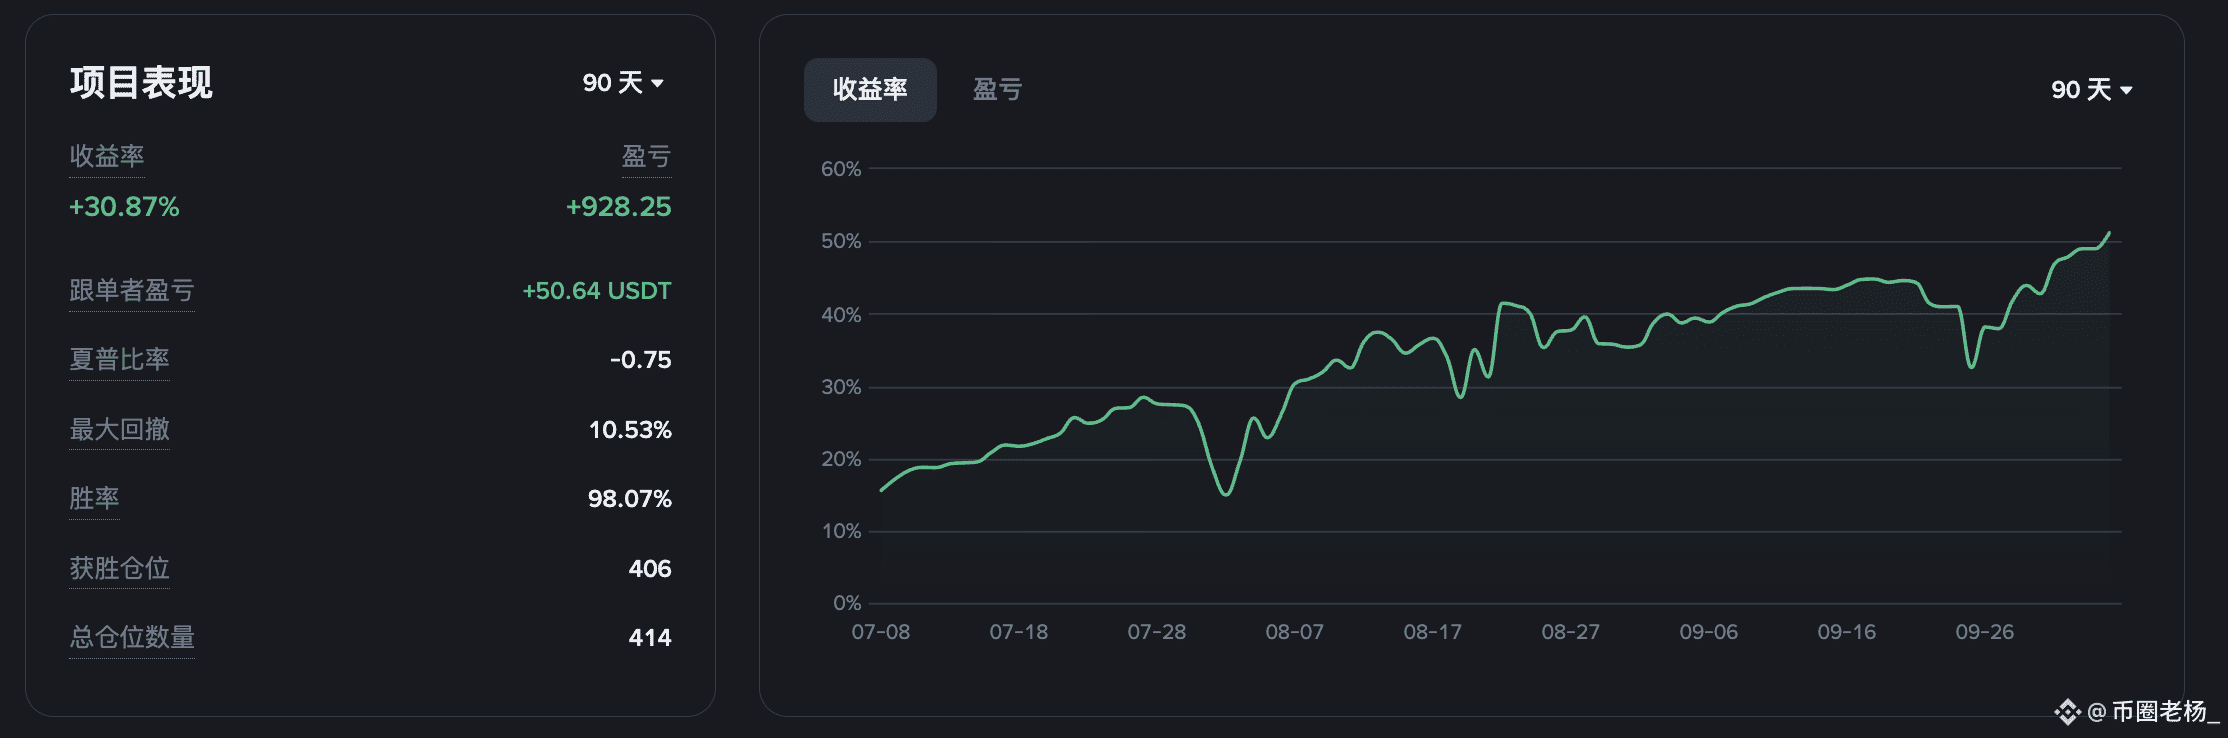
从业7年的加密货币分析师,专注于BTC、ETH、BNB、SOL及稳定币交易,致力于为客户提优质的投资机会。凭借精准的市场分析和严格的风险控制,我的带单服务在过去90天实现44%的收益率。立即加入,开启财富增值之旅!
Open Trade

0G Holder
High-Frequency Trader
4.3 Years
38 Following
1.6K+ Followers
1.9K+ Liked
Posts
Portfolio
All
Quotes
PINNED
·
--
Bullish
I have been in the cryptocurrency industry for 7 years, focusing on trading BTC, ETH, BNB, SOL, and stablecoins, dedicated to providing clients with high-quality investment opportunities. With precise market analysis and strict risk control, my trading services have achieved a 44% return over the past 90 days. Join now and start your journey to wealth enhancement! #带单大神
I have been in the cryptocurrency industry for 7 years, focusing on trading BTC, ETH, BNB, SOL, and stablecoins, dedicated to providing clients with high-quality investment opportunities. With precise market analysis and strict risk control, my trading services have achieved a 44% return over the past 90 days. Join now and start your journey to wealth enhancement! #带单大神
1
3
395
·
--
BTC/ETH ETF outflows on the same day, yet SOL is stronger: why fund flows and prices are not moving in syncOn September 16, the U.S. spot ETF daily flow report showed a highly asymmetric set of figures: $BTC had net outflows of $295.9 million, $ETH had net outflows of $224.1 million, and $SOL had net inflows of $0.84 million. Combined, the first two saw total net outflows of $520 million.
In the price window as of 9/17 ET, Coinbase data shows BTC up 1.18%, ETH up 1.80%, and SOL up 4.94%. In the prior UTC day, the SOL/BTC ratio rose again from 0.00128096 to 0.00129190, up about 0.85%, while ETH/BTC was essentially flat.
The easiest story to write is: “capital rotated from BTC and ETH to SOL.” But that’s precisely where caution is needed. ETF daily flows, secondary-market prices, and cross-coin ratios use different cutoff times, and ETF orders may also lag behind the actual risk decisions. There is relative strength here, but there isn’t yet a single, uniquely identifiable rotation causality.
BTC/ETH ETF outflows on the same day, yet SOL is stronger: why fund flows and prices are not moving in sync
On September 16, the U.S. spot ETF daily flow report showed a highly asymmetric set of figures: $BTC had net outflows of $295.9 million, $ETH had net outflows of $224.1 million, and $SOL had net inflows of $0.84 million. Combined, the first two saw total net outflows of $520 million.
In the price window as of 9/17 ET, Coinbase data shows BTC up 1.18%, ETH up 1.80%, and SOL up 4.94%. In the prior UTC day, the SOL/BTC ratio rose again from 0.00128096 to 0.00129190, up about 0.85%, while ETH/BTC was essentially flat.
The easiest story to write is: “capital rotated from BTC and ETH to SOL.” But that’s precisely where caution is needed. ETF daily flows, secondary-market prices, and cross-coin ratios use different cutoff times, and ETF orders may also lag behind the actual risk decisions. There is relative strength here, but there isn’t yet a single, uniquely identifiable rotation causality.
In the price window as of 9/17 ET, Coinbase data shows BTC up 1.18%, ETH up 1.80%, and SOL up 4.94%. In the prior UTC day, the SOL/BTC ratio rose again from 0.00128096 to 0.00129190, up about 0.85%, while ETH/BTC was essentially flat.
The easiest story to write is: “capital rotated from BTC and ETH to SOL.” But that’s precisely where caution is needed. ETF daily flows, secondary-market prices, and cross-coin ratios use different cutoff times, and ETF orders may also lag behind the actual risk decisions. There is relative strength here, but there isn’t yet a single, uniquely identifiable rotation causality.
1
437
·
--
After the FOMC, why is the first candlestick the easiest to mislead?
After the announcement was released, $BTC dipped from about $75,681 before the event to $75,337 (-0.45%), but by 14:05 ET it had already returned to $76,031, and by 16:00 ET it further rose to $76,198 (+0.68% vs. before the event). $ETH also showed a directional structure of falling first and then regaining.
If you only take the first move, you’d get “FOMC is bearish for crypto.” But if you only look at the rebound five minutes later, it turns into “the market welcomes the FOMC.” Both takes are too simplistic.
At the very moment major news is released, the order book thins out. Stop losses, algorithmic trading, and leveraged liquidations can all happen at the same time. The first candlestick often reflects position unwinding first—it doesn’t necessarily mean the market has fully digested the statement, the rate outlook, and the subsequent path.
But a V-shaped rebound doesn’t automatically mean policy is certainly dovish either. It could come from short covering, a surprise versus expectations, changes in the dollar and U.S. Treasury yields, or price corrections after liquidity returns.
Event trading should compare three points instead: the pre-news baseline, the post-news extreme, and the stable level one to two hours later. The first candlestick tells you the market was hit; the subsequent price action tells you whether the shock was absorbed.
Next, watch whether $BTC and $ETH can continue to hold levels from before the event, whether open interest in perpetuals declines, and whether other major exchanges can reproduce a similar path.
This article is for event research and risk breakdown only and does not constitute investment advice.
#比特币 #以太坊 #fomc
After the FOMC, why is the first candlestick the easiest to mislead?
After the announcement was released, $BTC dipped from about $75,681 before the event to $75,337 (-0.45%), but by 14:05 ET it had already returned to $76,031, and by 16:00 ET it further rose to $76,198 (+0.68% vs. before the event). $ETH also showed a directional structure of falling first and then regaining.
If you only take the first move, you’d get “FOMC is bearish for crypto.” But if you only look at the rebound five minutes later, it turns into “the market welcomes the FOMC.” Both takes are too simplistic.
At the very moment major news is released, the order book thins out. Stop losses, algorithmic trading, and leveraged liquidations can all happen at the same time. The first candlestick often reflects position unwinding first—it doesn’t necessarily mean the market has fully digested the statement, the rate outlook, and the subsequent path.
But a V-shaped rebound doesn’t automatically mean policy is certainly dovish either. It could come from short covering, a surprise versus expectations, changes in the dollar and U.S. Treasury yields, or price corrections after liquidity returns.
Event trading should compare three points instead: the pre-news baseline, the post-news extreme, and the stable level one to two hours later. The first candlestick tells you the market was hit; the subsequent price action tells you whether the shock was absorbed.
Next, watch whether $BTC and $ETH can continue to hold levels from before the event, whether open interest in perpetuals declines, and whether other major exchanges can reproduce a similar path.
This article is for event research and risk breakdown only and does not constitute investment advice.
#比特币 #以太坊 #fomc
After the announcement was released, $BTC dipped from about $75,681 before the event to $75,337 (-0.45%), but by 14:05 ET it had already returned to $76,031, and by 16:00 ET it further rose to $76,198 (+0.68% vs. before the event). $ETH also showed a directional structure of falling first and then regaining.
If you only take the first move, you’d get “FOMC is bearish for crypto.” But if you only look at the rebound five minutes later, it turns into “the market welcomes the FOMC.” Both takes are too simplistic.
At the very moment major news is released, the order book thins out. Stop losses, algorithmic trading, and leveraged liquidations can all happen at the same time. The first candlestick often reflects position unwinding first—it doesn’t necessarily mean the market has fully digested the statement, the rate outlook, and the subsequent path.
But a V-shaped rebound doesn’t automatically mean policy is certainly dovish either. It could come from short covering, a surprise versus expectations, changes in the dollar and U.S. Treasury yields, or price corrections after liquidity returns.
Event trading should compare three points instead: the pre-news baseline, the post-news extreme, and the stable level one to two hours later. The first candlestick tells you the market was hit; the subsequent price action tells you whether the shock was absorbed.
Next, watch whether $BTC and $ETH can continue to hold levels from before the event, whether open interest in perpetuals declines, and whether other major exchanges can reproduce a similar path.
This article is for event research and risk breakdown only and does not constitute investment advice.
#比特币 #以太坊 #fomc
275
·
--
I just completed a new transaction! Copy my investment portfolio in one click👇
I just completed a new transaction! Copy my investment portfolio in one click👇
币圈老杨_
Close Position
SOLUSDT
PNL(USDT)
-30.14
Close Price
107.66472153
164
·
--
I just finished a new transaction! One-click copy my investment portfolio👇
I just finished a new transaction! One-click copy my investment portfolio👇
币圈老杨_
Close Position
SOLUSDT
PNL(USDT)
-115.23
Close Price
105.621327
149
·
--
I just completed a new transaction! Copy my investment portfolio in one click, here👇
I just completed a new transaction! Copy my investment portfolio in one click, here👇
币圈老杨_
Close Position
SOLUSDT
PNL(USDT)
-115.23
Close Price
105.621327
40
·
--
I just completed a new transaction! Copy my investment portfolio in one click👇
I just completed a new transaction! Copy my investment portfolio in one click👇
币圈老杨_
Close Position
SOLUSDT
PNL(USDT)
-115.23
Close Price
105.621327
73
·
--
I just completed a new transaction! Copy my investment portfolio in one click👇
I just completed a new transaction! Copy my investment portfolio in one click👇
币圈老杨_
Close Position
SOLUSDT
PNL(USDT)
-115.23
Close Price
105.621327
126
·
--
I just completed a new trade! Copy my investment portfolio with one click 👇
I just completed a new trade! Copy my investment portfolio with one click 👇
币圈老杨_
Close Position
SOLUSDT
PNL(USDT)
-115.23
Close Price
105.621327
108
·
--
I just completed a new trade! Copy my investment portfolio in one click👇
I just completed a new trade! Copy my investment portfolio in one click👇
币圈老杨_
Close Position
SOLUSDT
PNL(USDT)
-115.23
Close Price
105.621327
105
·
--
I just finished a new transaction! Copy my investment portfolio with one click👇
I just finished a new transaction! Copy my investment portfolio with one click👇
币圈老杨_
Close Position
SOLUSDT
PNL(USDT)
-115.23
Close Price
105.621327
126
·
--
I just completed a new transaction! Copy my investment portfolio with one click👇
I just completed a new transaction! Copy my investment portfolio with one click👇
币圈老杨_
Close Position
SOLUSDT
PNL(USDT)
-115.23
Close Price
105.621327
74
·
--
I just completed a new transaction! Copy my investment portfolio with one click👇
I just completed a new transaction! Copy my investment portfolio with one click👇
币圈老杨_
Close Position
SOLUSDT
PNL(USDT)
-115.23
Close Price
105.621327
87
·
--
I just completed a new transaction! Copy my investment portfolio with one click👇
I just completed a new transaction! Copy my investment portfolio with one click👇
币圈老杨_
Close Position
SOLUSDT
PNL(USDT)
-115.23
Close Price
105.621327
90
·
--
I just completed a new trade! Copy my portfolio with one click 👇
I just completed a new trade! Copy my portfolio with one click 👇
币圈老杨_
Close Position
SOLUSDT
PNL(USDT)
-115.23
Close Price
105.621327
77
·
--
I just completed a new trade! Copy my portfolio with one click 👇
I just completed a new trade! Copy my portfolio with one click 👇
币圈老杨_
Close Position
SOLUSDT
PNL(USDT)
-115.23
Close Price
105.621327
89
·
--
I just completed a new trade! Copy my portfolio with one click👇
I just completed a new trade! Copy my portfolio with one click👇
币圈老杨_
Close Position
SOLUSDT
PNL(USDT)
-115.23
Close Price
105.621327
111
·
--
I just finished a new transaction! Copy my investment portfolio in one click吧👇
I just finished a new transaction! Copy my investment portfolio in one click吧👇
币圈老杨_
Close Position
SOLUSDT
PNL(USDT)
-115.23
Close Price
105.621327
100
·
--
I just completed a new transaction! One-tap copy my investment portfolio👇
I just completed a new transaction! One-tap copy my investment portfolio👇
币圈老杨_
Close Position
SOLUSDT
PNL(USDT)
-115.23
Close Price
105.621327
123
·
--
I just finished a new transaction! Copy my investment portfolio in one click👇
I just finished a new transaction! Copy my investment portfolio in one click👇
币圈老杨_
Close Position
SOLUSDT
PNL(USDT)
-115.23
Close Price
105.621327
107
Log in to explore more content
Join global crypto users on Binance Square
⚡️ Get latest and useful information about crypto.
💬 Trusted by the world’s largest crypto exchange.
👍 Discover real insights from verified creators.
Email / Phone number