

KanT Crypto
4.4k Posts

KanT Crypto
Report
Block User
Decoding Politics. Tracking Crypto. Real-time news. 100% Signal with 0% Noise.
Open Trade

BNB Holder
Frequent Trader
1.1 Years
124 Following
1.6K+ Followers
8.1K+ Liked
Posts
Portfolio
All
Quotes
Videos
Live
·
--
Bullish
📈 Bitcoin Just Took Back $85K
The line everyone was watching is back under price.
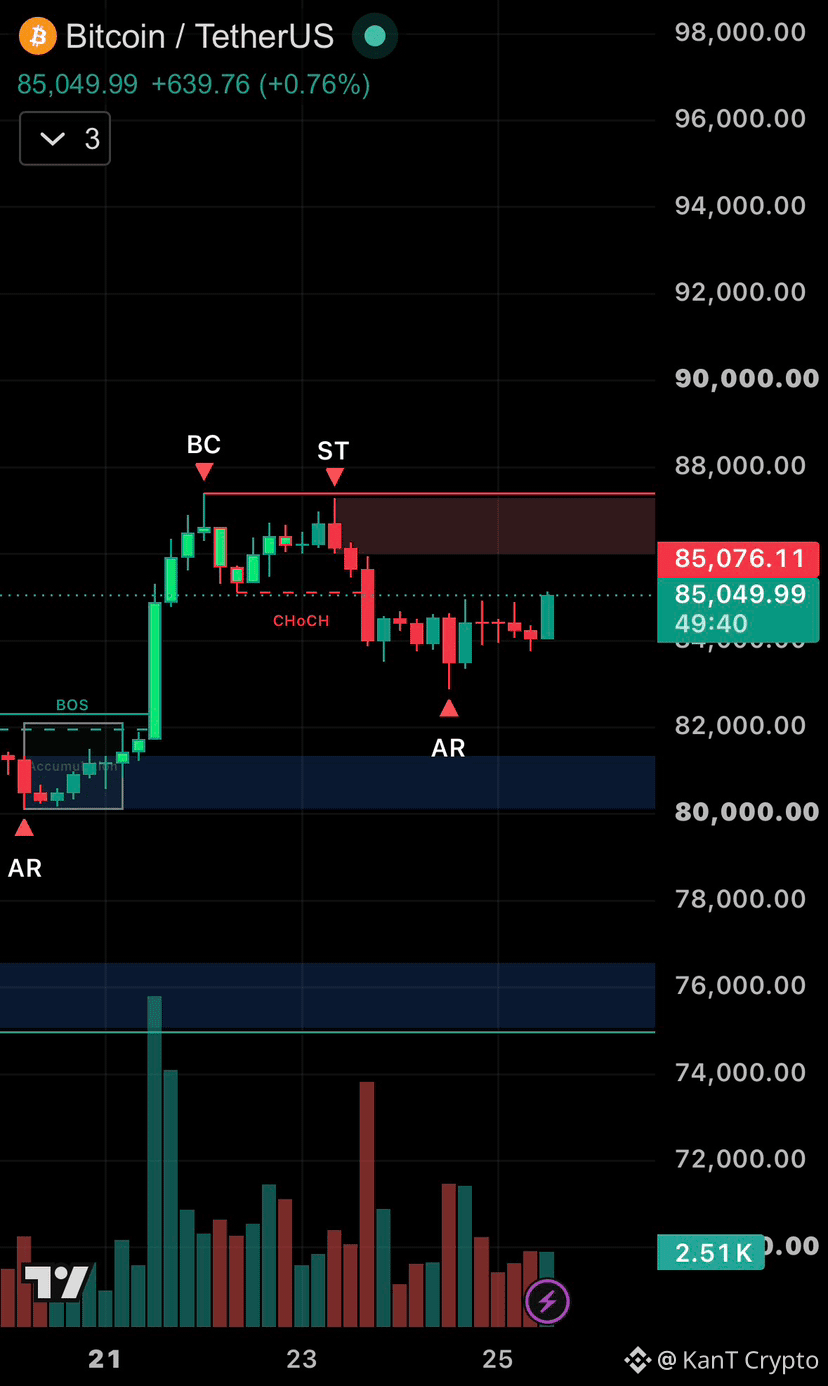
BTC is at $85,050 on the 4H, up 0.76%, pushing back above the level where this week's breakdown started.
Why $85K matters so much:
That is where the change of character (CHoCH) happened, the break that flipped the short-term trend down after the $87K double top. Since then, BTC chopped between $83K and $85K for days, and every dip toward $83K got bought.
Now buyers are stepping over the line. 👀
Reclaiming the exact level of a breakdown is how failed breakdowns begin. It hints that the drop to $82,900 was a shakeout, not the start of a deeper slide.
One thing first, though. This 4H candle hasn't closed yet. A wick above $85K and a close above $85K are very different signals, and only the close counts.
Next up is the ceiling.
The $86K to $87.2K zone is where the double top formed and sellers are still parked. Clear it, and a sweep of the $87.4K high comes into play.
Fall back under $85K, and this becomes just another rejection inside the range, with $83K back in focus.
Momentum has tilted toward the bulls for now. Let the close confirm it before chasing.
Real reclaim, or another fake-out at $85K? 🔥
Not financial advice.
$BTC
{future}(BTCUSDT)
$ETH
{future}(ETHUSDT)
$BNB
{future}(BNBUSDT)
📈 Bitcoin Just Took Back $85K
The line everyone was watching is back under price.
BTC is at $85,050 on the 4H, up 0.76%, pushing back above the level where this week's breakdown started.
Why $85K matters so much:
That is where the change of character (CHoCH) happened, the break that flipped the short-term trend down after the $87K double top. Since then, BTC chopped between $83K and $85K for days, and every dip toward $83K got bought.
Now buyers are stepping over the line. 👀
Reclaiming the exact level of a breakdown is how failed breakdowns begin. It hints that the drop to $82,900 was a shakeout, not the start of a deeper slide.
One thing first, though. This 4H candle hasn't closed yet. A wick above $85K and a close above $85K are very different signals, and only the close counts.
Next up is the ceiling.
The $86K to $87.2K zone is where the double top formed and sellers are still parked. Clear it, and a sweep of the $87.4K high comes into play.
Fall back under $85K, and this becomes just another rejection inside the range, with $83K back in focus.
Momentum has tilted toward the bulls for now. Let the close confirm it before chasing.
Real reclaim, or another fake-out at $85K? 🔥
Not financial advice.
$BTC
$ETH
$BNB
The line everyone was watching is back under price.
BTC is at $85,050 on the 4H, up 0.76%, pushing back above the level where this week's breakdown started.
Why $85K matters so much:
That is where the change of character (CHoCH) happened, the break that flipped the short-term trend down after the $87K double top. Since then, BTC chopped between $83K and $85K for days, and every dip toward $83K got bought.
Now buyers are stepping over the line. 👀
Reclaiming the exact level of a breakdown is how failed breakdowns begin. It hints that the drop to $82,900 was a shakeout, not the start of a deeper slide.
One thing first, though. This 4H candle hasn't closed yet. A wick above $85K and a close above $85K are very different signals, and only the close counts.
Next up is the ceiling.
The $86K to $87.2K zone is where the double top formed and sellers are still parked. Clear it, and a sweep of the $87.4K high comes into play.
Fall back under $85K, and this becomes just another rejection inside the range, with $83K back in focus.
Momentum has tilted toward the bulls for now. Let the close confirm it before chasing.
Real reclaim, or another fake-out at $85K? 🔥
Not financial advice.
$BTC
$ETH
$BNB
1
1.1k
·
--
Bearish
🚀 TAKE's Rocket Is Back on the Launchpad. Relaunch or Crash Through?
Zoom out to the 4H and the whole story fits on one screen.
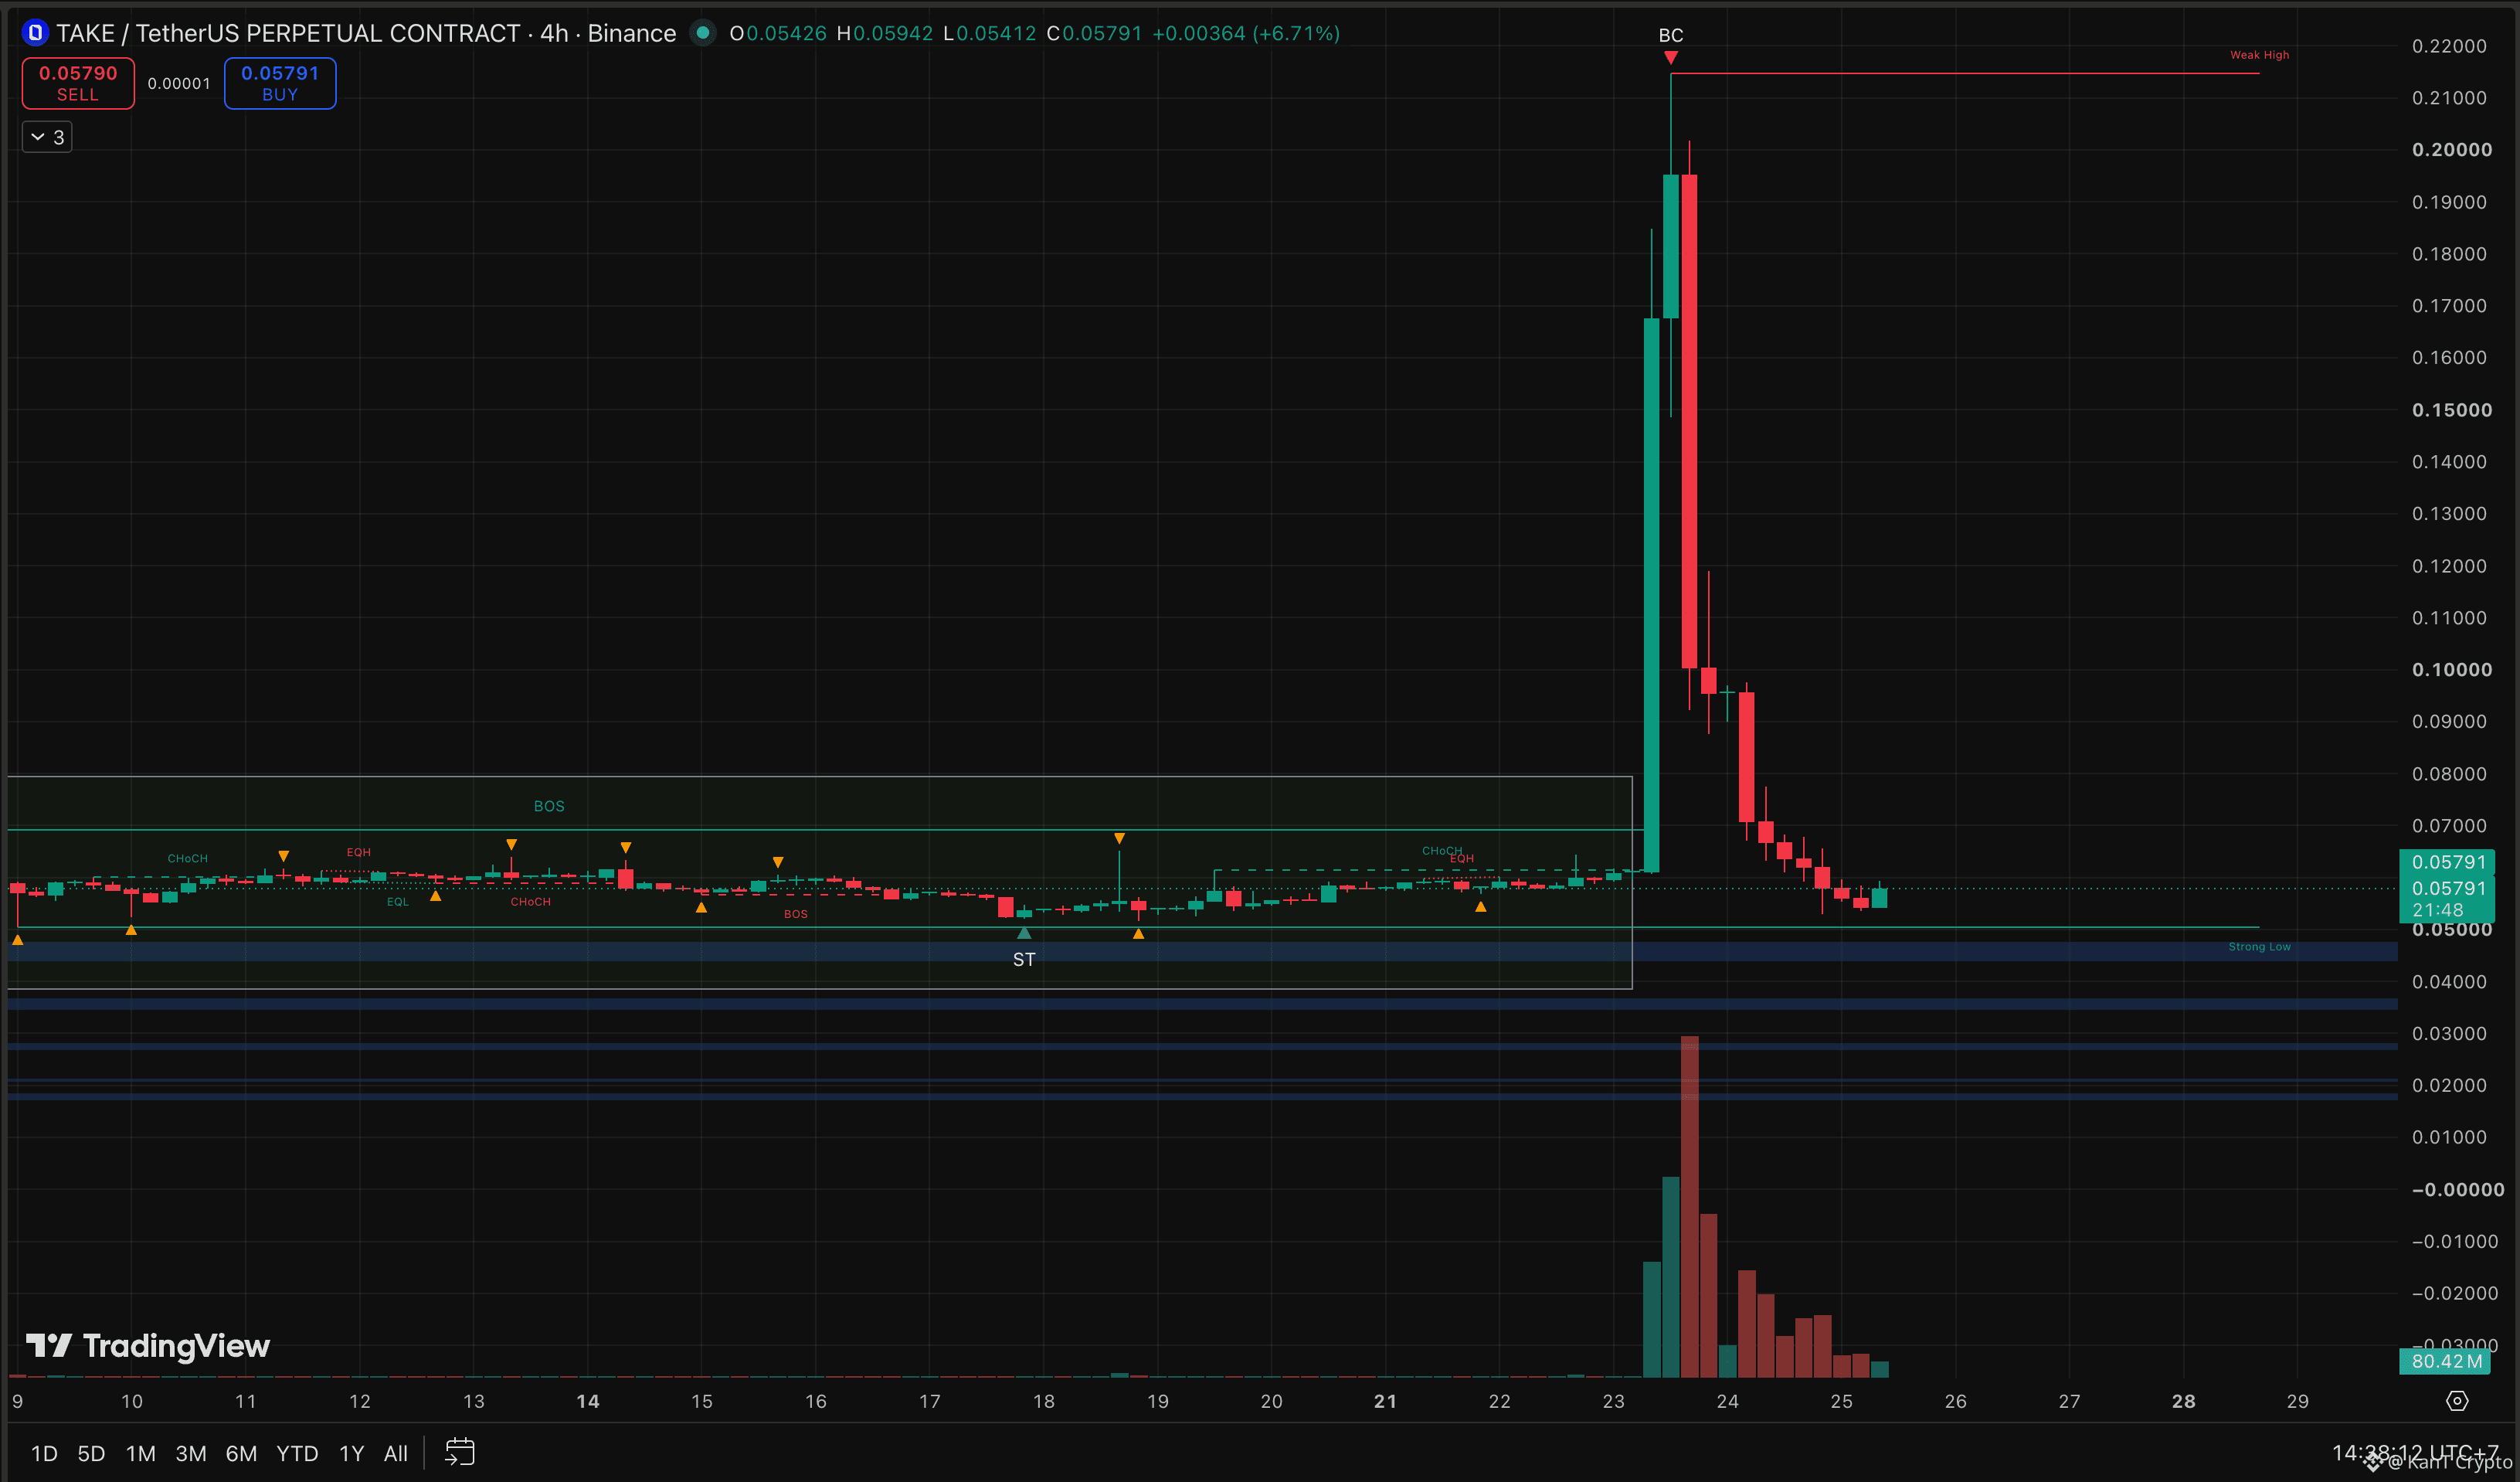
Two weeks of flat accumulation between roughly $0.053 and $0.061.
One launch to $0.215.
Then a full descent, right back into the same box it took off from.
Price just dipped into the $0.053 area, the floor we flagged last time, and bounced. The latest 4H candle is up 6.7% to $0.0579, the first real green one since the crash. 👀
The case for a relaunch:
Price is back where the original buyers accumulated for two weeks. If that demand is still there, this is where it should show up, and the floor held on its first test.
The case for going deeper:
The bounce came on thin volume, a fraction of the selling that brought it here. And everyone who bought between $0.10 and $0.20 is still trapped overhead, ready to sell into any rally.
The levels that settle it.
Hold $0.053 and reclaim $0.061, the top of the launchpad, and TAKE can base for another attempt.
Lose $0.053, and the strong low near $0.050 is next, with the $0.046 to $0.048 zone below that.
A coin back on its launchpad isn't bullish or bearish yet. It has to prove its buyers never left.
Relaunch from the pad, or crash through the floor? 🔥
Not financial advice.
$TAKE
{future}(TAKEUSDT)
$SAGA
$龙虾
{future}(龙虾USDT)
{future}(SAGAUSDT)
🚀 TAKE's Rocket Is Back on the Launchpad. Relaunch or Crash Through?
Zoom out to the 4H and the whole story fits on one screen.
Two weeks of flat accumulation between roughly $0.053 and $0.061.
One launch to $0.215.
Then a full descent, right back into the same box it took off from.
Price just dipped into the $0.053 area, the floor we flagged last time, and bounced. The latest 4H candle is up 6.7% to $0.0579, the first real green one since the crash. 👀
The case for a relaunch:
Price is back where the original buyers accumulated for two weeks. If that demand is still there, this is where it should show up, and the floor held on its first test.
The case for going deeper:
The bounce came on thin volume, a fraction of the selling that brought it here. And everyone who bought between $0.10 and $0.20 is still trapped overhead, ready to sell into any rally.
The levels that settle it.
Hold $0.053 and reclaim $0.061, the top of the launchpad, and TAKE can base for another attempt.
Lose $0.053, and the strong low near $0.050 is next, with the $0.046 to $0.048 zone below that.
A coin back on its launchpad isn't bullish or bearish yet. It has to prove its buyers never left.
Relaunch from the pad, or crash through the floor? 🔥
Not financial advice.
$TAKE
$SAGA
$龙虾
Zoom out to the 4H and the whole story fits on one screen.
Two weeks of flat accumulation between roughly $0.053 and $0.061.
One launch to $0.215.
Then a full descent, right back into the same box it took off from.
Price just dipped into the $0.053 area, the floor we flagged last time, and bounced. The latest 4H candle is up 6.7% to $0.0579, the first real green one since the crash. 👀
The case for a relaunch:
Price is back where the original buyers accumulated for two weeks. If that demand is still there, this is where it should show up, and the floor held on its first test.
The case for going deeper:
The bounce came on thin volume, a fraction of the selling that brought it here. And everyone who bought between $0.10 and $0.20 is still trapped overhead, ready to sell into any rally.
The levels that settle it.
Hold $0.053 and reclaim $0.061, the top of the launchpad, and TAKE can base for another attempt.
Lose $0.053, and the strong low near $0.050 is next, with the $0.046 to $0.048 zone below that.
A coin back on its launchpad isn't bullish or bearish yet. It has to prove its buyers never left.
Relaunch from the pad, or crash through the floor? 🔥
Not financial advice.
$TAKE
$SAGA
$龙虾
1
2.3k
·
--
Bullish
📈 Is Bitcoin Pumping Again?
The 15-minute chart built something interesting overnight.
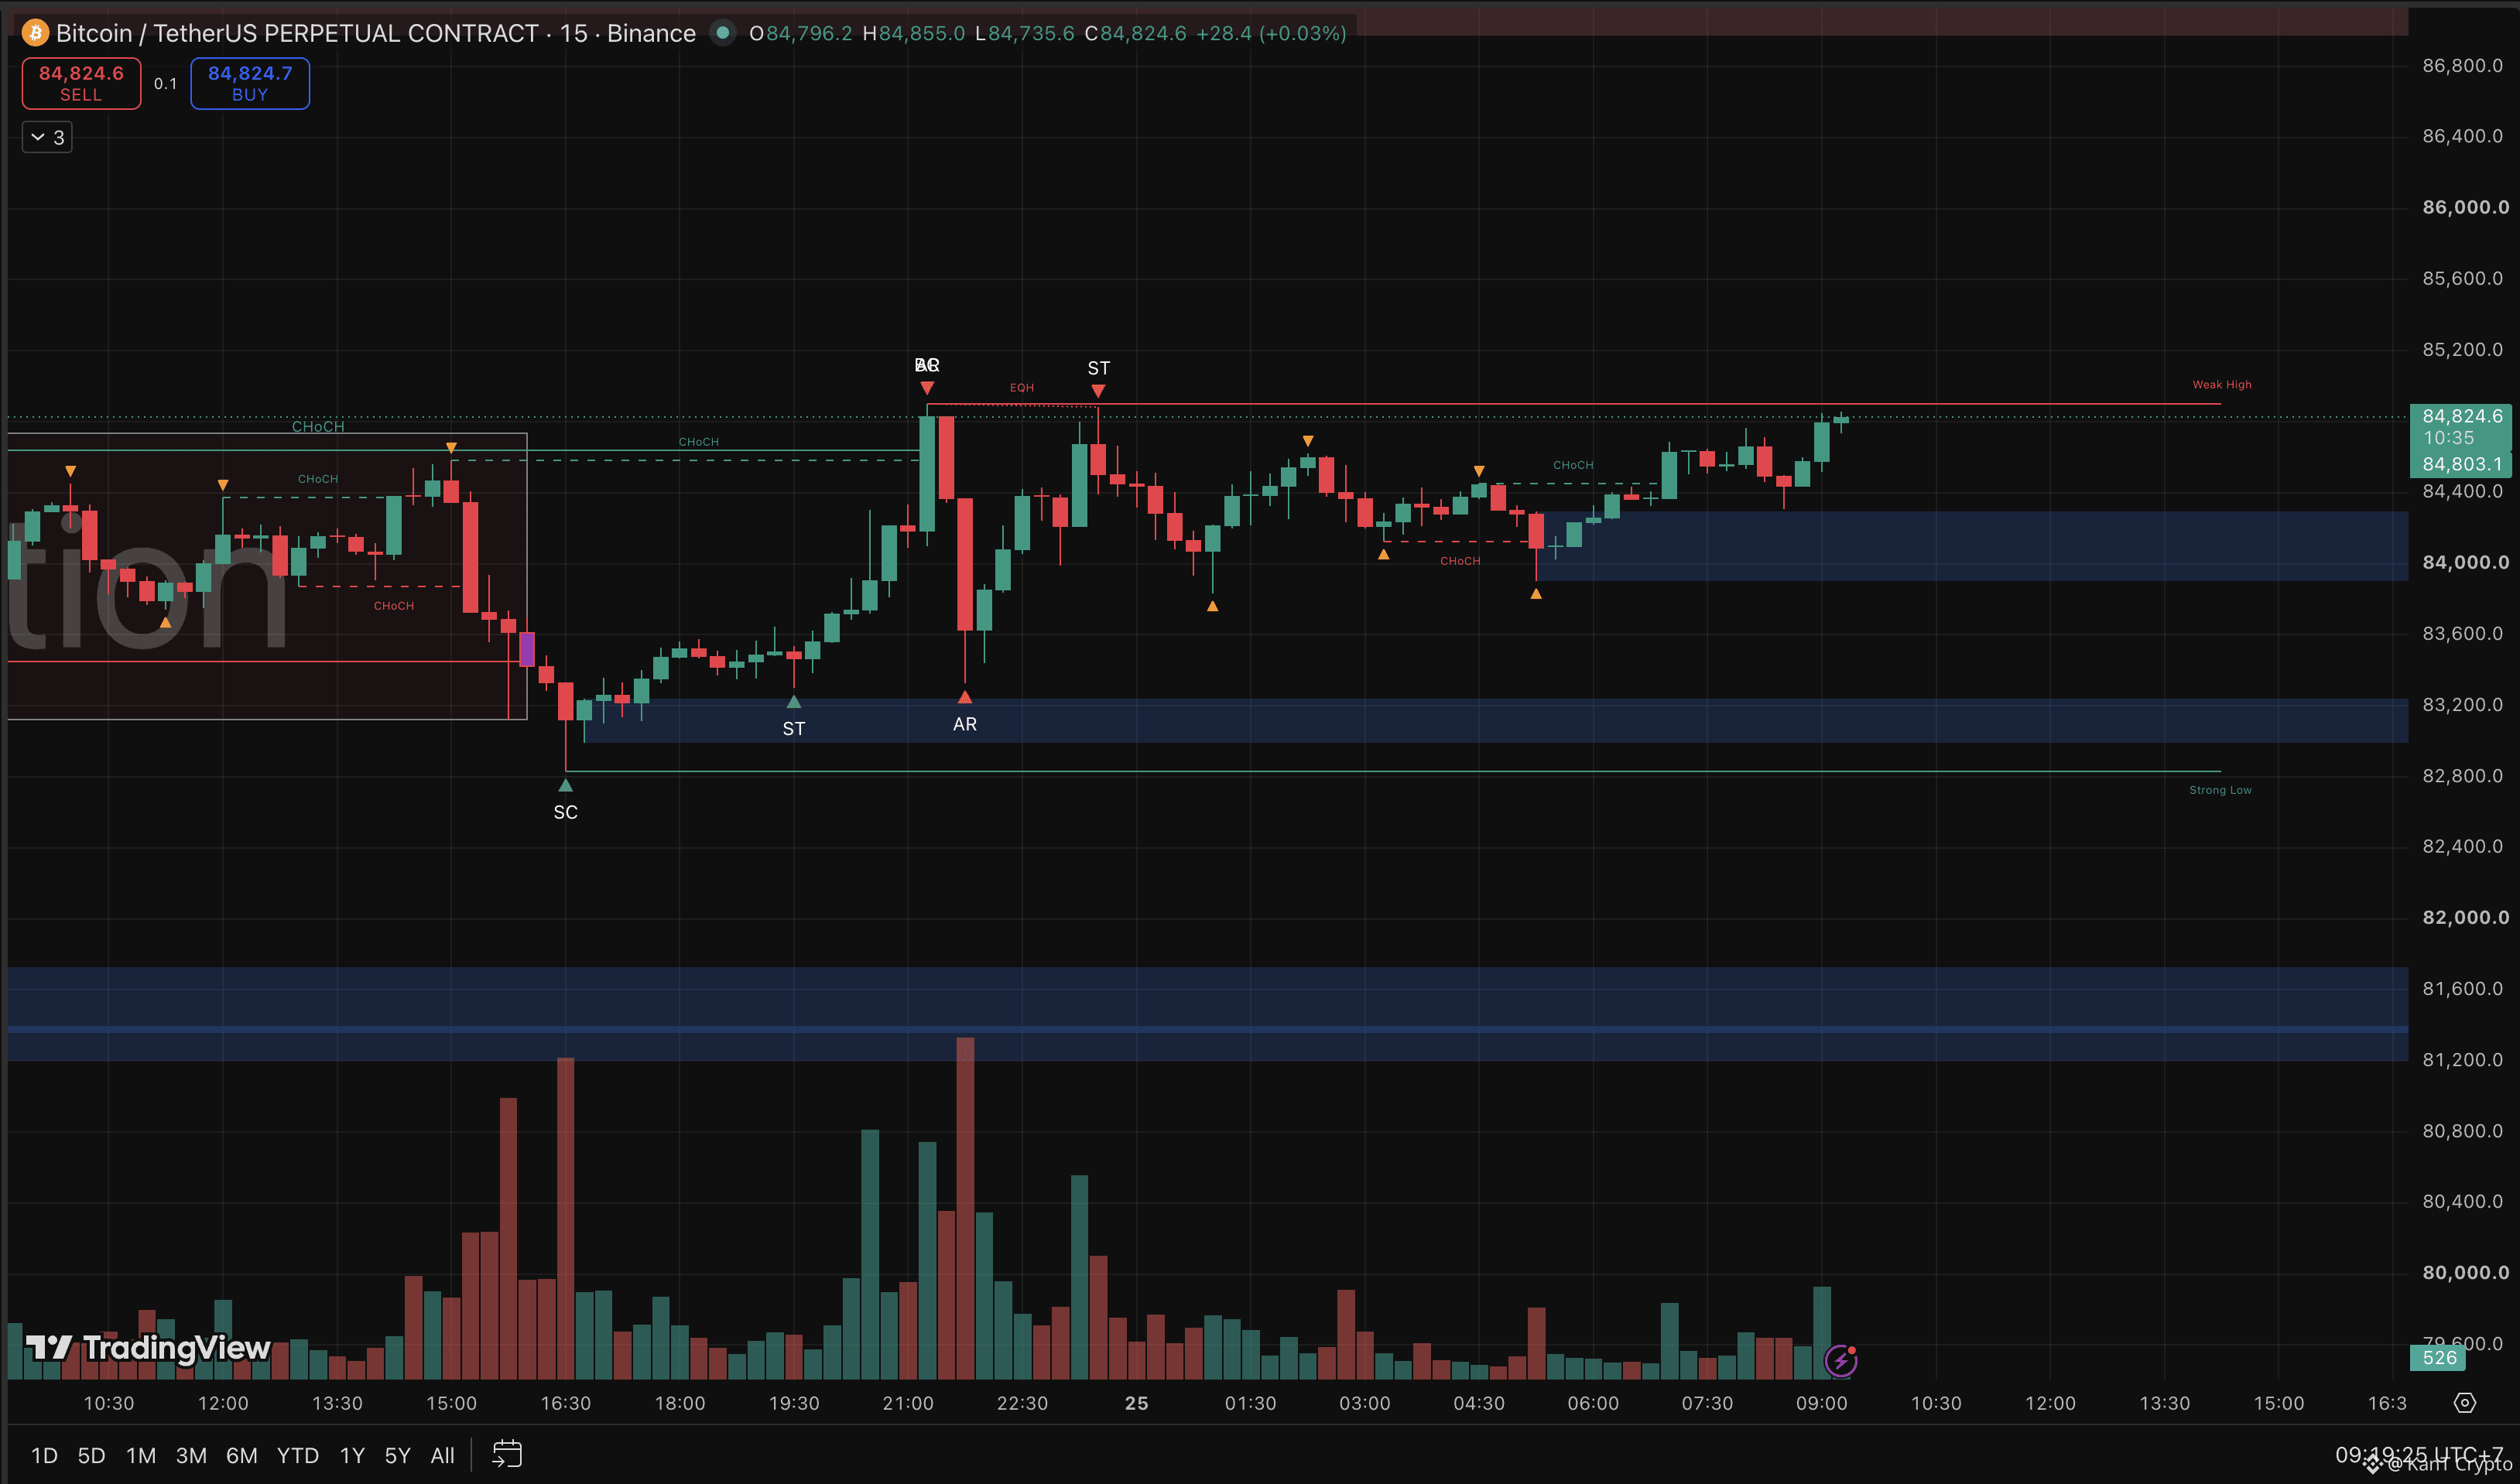
After yesterday's breakdown, BTC flushed to about $82,850 and sellers ran dry right there. The chart marks it a selling climax (SC), the moment panic peaks and bigger buyers start absorbing.
Since then, it looks a lot like a mini accumulation.
A bounce, a retest that held above the low, then higher lows stacking up.
The $83,900 to $84,300 zone got defended twice.
Now price is at $84,824, pressing the same $84,900 ceiling that rejected it twice before.
That ceiling is the whole story. 👀
Two taps at one level leave equal highs, and equal highs are where stop orders pile up. Break it, and those stops can fuel a quick squeeze. Fail again, and it turns into a triple top.
Keep the timeframe in mind. This is a 15-minute structure. It can spark a move, but the level that matters on the bigger chart is still $85K, and a 4H close above it is what turns a bounce into a recovery.
Break $84,900 and hold, and $85,500 to $86K opens up.
Lose $83,900, and the bounce is done, with $83,000 back in focus.
All this with the US 10-year yield at a 19-year high. The resilience is real, and so is the pressure.
Squeeze through $84.9K, or another rejection at the ceiling? 🔥
Not financial advice.
$BTC
{future}(BTCUSDT)
$BNB
{future}(BNBUSDT)
$ETH
{future}(ETHUSDT)
📈 Is Bitcoin Pumping Again?
The 15-minute chart built something interesting overnight.
After yesterday's breakdown, BTC flushed to about $82,850 and sellers ran dry right there. The chart marks it a selling climax (SC), the moment panic peaks and bigger buyers start absorbing.
Since then, it looks a lot like a mini accumulation.
A bounce, a retest that held above the low, then higher lows stacking up.
The $83,900 to $84,300 zone got defended twice.
Now price is at $84,824, pressing the same $84,900 ceiling that rejected it twice before.
That ceiling is the whole story. 👀
Two taps at one level leave equal highs, and equal highs are where stop orders pile up. Break it, and those stops can fuel a quick squeeze. Fail again, and it turns into a triple top.
Keep the timeframe in mind. This is a 15-minute structure. It can spark a move, but the level that matters on the bigger chart is still $85K, and a 4H close above it is what turns a bounce into a recovery.
Break $84,900 and hold, and $85,500 to $86K opens up.
Lose $83,900, and the bounce is done, with $83,000 back in focus.
All this with the US 10-year yield at a 19-year high. The resilience is real, and so is the pressure.
Squeeze through $84.9K, or another rejection at the ceiling? 🔥
Not financial advice.
$BTC
$BNB
$ETH
The 15-minute chart built something interesting overnight.
After yesterday's breakdown, BTC flushed to about $82,850 and sellers ran dry right there. The chart marks it a selling climax (SC), the moment panic peaks and bigger buyers start absorbing.
Since then, it looks a lot like a mini accumulation.
A bounce, a retest that held above the low, then higher lows stacking up.
The $83,900 to $84,300 zone got defended twice.
Now price is at $84,824, pressing the same $84,900 ceiling that rejected it twice before.
That ceiling is the whole story. 👀
Two taps at one level leave equal highs, and equal highs are where stop orders pile up. Break it, and those stops can fuel a quick squeeze. Fail again, and it turns into a triple top.
Keep the timeframe in mind. This is a 15-minute structure. It can spark a move, but the level that matters on the bigger chart is still $85K, and a 4H close above it is what turns a bounce into a recovery.
Break $84,900 and hold, and $85,500 to $86K opens up.
Lose $83,900, and the bounce is done, with $83,000 back in focus.
All this with the US 10-year yield at a 19-year high. The resilience is real, and so is the pressure.
Squeeze through $84.9K, or another rejection at the ceiling? 🔥
Not financial advice.
$BTC
$BNB
$ETH
4
2.2k
·
--
Bullish
🔍 Can ZEC Hit $2,000 Before the Year Ends?
The chart is drawing a path there. Whether price walks it is another story.
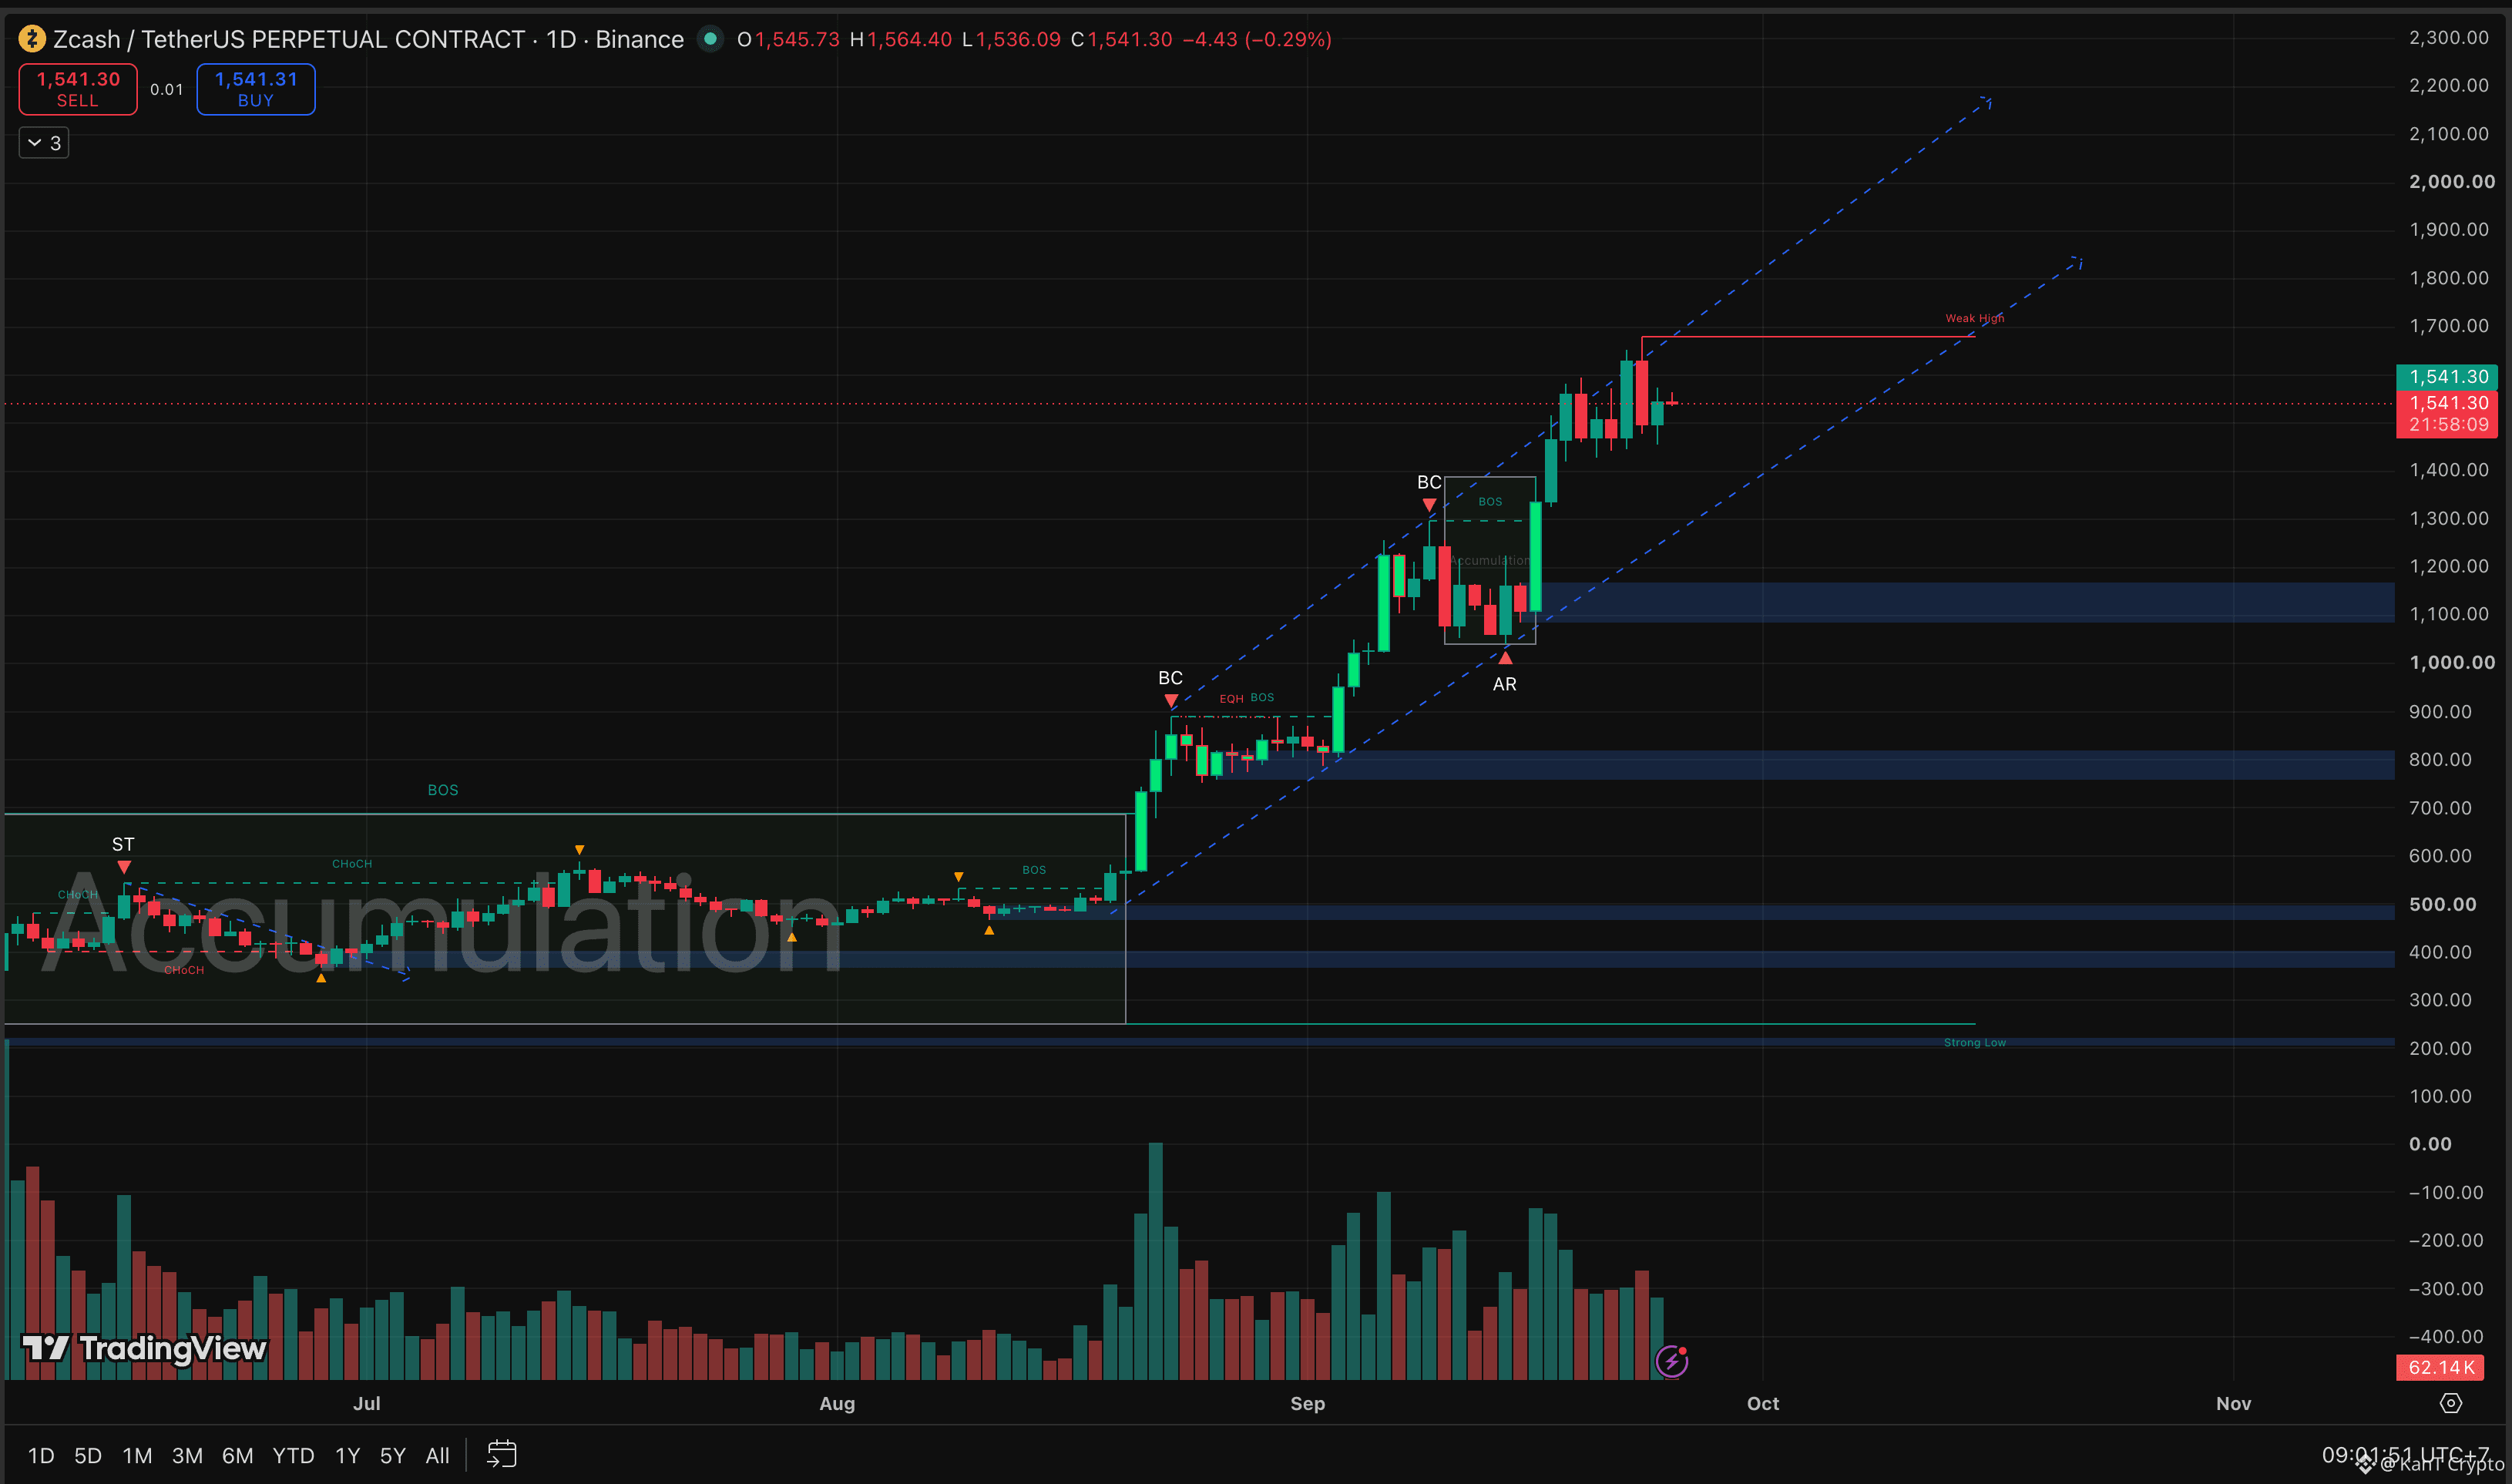
ZEC is at $1,541 on the daily, sitting inside a rising channel that has guided every leg since mid-August. Project that channel forward and its upper line crosses the $2,000 area in October.
The staircase underneath is clean.
Accumulation, breakout, re-accumulation, breakout. Every pause since August has ended with a break of structure and a higher high.
The fuel is still coming in. 👀
Grayscale's spot ZEC ETF just logged a fourth straight week of inflows, and Europe got its first physically backed ZEC product this week. Shielded transactions are running at their highest since 2022. And NU7 now has dates: testnet October 6, the mainnet go/no-go October 20, activation targeted for November 5.
But the chart also shows a ceiling and a warning.
The $1,675 weak high is where the last push stalled, and daily RSI (a momentum gauge) has been sliding while price climbed, a bearish divergence that often shows up before a cool-off. Big upgrade dates can also turn into "sell the news" moments.
What $2,000 needs:
A daily close above $1,675 to reopen the upper half of the channel.
What cancels it:
A drop through the channel floor near $1,250, then the $1,100 to $1,160 demand zone, would signal the trend is cooling hard.
Catalysts give a coin a reason to run. Levels decide whether it actually does.
$2,000 by year-end, or a deeper reset before the next leg? 🔥
Not financial advice.
$ZEC
{future}(ZECUSDT)
$HYPE
{future}(HYPEUSDT)
$ONDO
{future}(ONDOUSDT)
🔍 Can ZEC Hit $2,000 Before the Year Ends?
The chart is drawing a path there. Whether price walks it is another story.
ZEC is at $1,541 on the daily, sitting inside a rising channel that has guided every leg since mid-August. Project that channel forward and its upper line crosses the $2,000 area in October.
The staircase underneath is clean.
Accumulation, breakout, re-accumulation, breakout. Every pause since August has ended with a break of structure and a higher high.
The fuel is still coming in. 👀
Grayscale's spot ZEC ETF just logged a fourth straight week of inflows, and Europe got its first physically backed ZEC product this week. Shielded transactions are running at their highest since 2022. And NU7 now has dates: testnet October 6, the mainnet go/no-go October 20, activation targeted for November 5.
But the chart also shows a ceiling and a warning.
The $1,675 weak high is where the last push stalled, and daily RSI (a momentum gauge) has been sliding while price climbed, a bearish divergence that often shows up before a cool-off. Big upgrade dates can also turn into "sell the news" moments.
What $2,000 needs:
A daily close above $1,675 to reopen the upper half of the channel.
What cancels it:
A drop through the channel floor near $1,250, then the $1,100 to $1,160 demand zone, would signal the trend is cooling hard.
Catalysts give a coin a reason to run. Levels decide whether it actually does.
$2,000 by year-end, or a deeper reset before the next leg? 🔥
Not financial advice.
$ZEC
$HYPE
$ONDO
The chart is drawing a path there. Whether price walks it is another story.
ZEC is at $1,541 on the daily, sitting inside a rising channel that has guided every leg since mid-August. Project that channel forward and its upper line crosses the $2,000 area in October.
The staircase underneath is clean.
Accumulation, breakout, re-accumulation, breakout. Every pause since August has ended with a break of structure and a higher high.
The fuel is still coming in. 👀
Grayscale's spot ZEC ETF just logged a fourth straight week of inflows, and Europe got its first physically backed ZEC product this week. Shielded transactions are running at their highest since 2022. And NU7 now has dates: testnet October 6, the mainnet go/no-go October 20, activation targeted for November 5.
But the chart also shows a ceiling and a warning.
The $1,675 weak high is where the last push stalled, and daily RSI (a momentum gauge) has been sliding while price climbed, a bearish divergence that often shows up before a cool-off. Big upgrade dates can also turn into "sell the news" moments.
What $2,000 needs:
A daily close above $1,675 to reopen the upper half of the channel.
What cancels it:
A drop through the channel floor near $1,250, then the $1,100 to $1,160 demand zone, would signal the trend is cooling hard.
Catalysts give a coin a reason to run. Levels decide whether it actually does.
$2,000 by year-end, or a deeper reset before the next leg? 🔥
Not financial advice.
$ZEC
$HYPE
$ONDO
1
776
·
--
Bullish
🚨 BREAKING: 🇺🇸 The 10-Year Treasury Yield Just Hit a 19-Year High
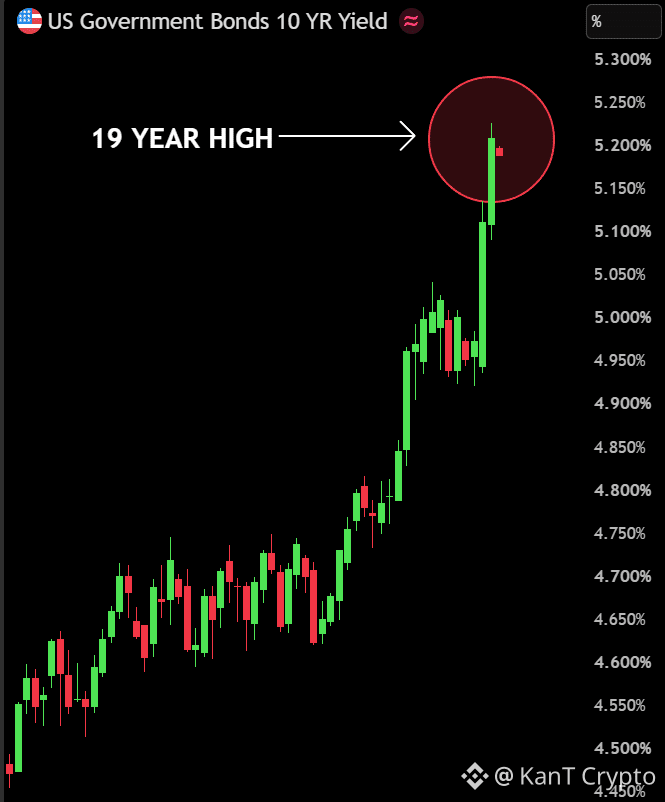
The world's most important interest rate just broke above 5.20%, its highest since July 2007, after jumping about 25 basis points in two sessions.
The trigger was hot data. September's flash PMI, a survey of business activity, hit 58.4, the strongest since July 2021, with input costs rising at the fastest pace since October 2022. Strong growth plus rising prices is the last thing a Fed that just hiked wants to see, and markets now eye another hike in October. With Brent back above $100 and a swelling deficit to fund, bond buyers are demanding more.
The 2007 comparison deserves care. Back then, yields peaked right before a credit bust. Today's driver is a hot economy with sticky inflation, closer to stagflation risk than a 2008 replay. The warning is real, the parallel is not exact.
The 10-year anchors mortgages, corporate borrowing, and how every asset gets valued. Duration matters more than the number itself. A brief spike gets absorbed. Months above 5% is when refinancing pain starts cracking housing and heavily indebted companies.
For crypto, when a risk-free Treasury pays over 5%, every risk asset has to work harder to attract money. Bitcoin holding the $84K area through this is real resilience, but yield shocks can flip sentiment fast.
Watch whether yields stay above 5% heading into the October 27 to 28 Fed meeting.
Keep leverage low and respect what the bond market is saying.
Not financial advice.
$BTC
{future}(BTCUSDT)
$BNB
{future}(BNBUSDT)
$ETH
{future}(ETHUSDT)
🚨 BREAKING: 🇺🇸 The 10-Year Treasury Yield Just Hit a 19-Year High
The world's most important interest rate just broke above 5.20%, its highest since July 2007, after jumping about 25 basis points in two sessions.
The trigger was hot data. September's flash PMI, a survey of business activity, hit 58.4, the strongest since July 2021, with input costs rising at the fastest pace since October 2022. Strong growth plus rising prices is the last thing a Fed that just hiked wants to see, and markets now eye another hike in October. With Brent back above $100 and a swelling deficit to fund, bond buyers are demanding more.
The 2007 comparison deserves care. Back then, yields peaked right before a credit bust. Today's driver is a hot economy with sticky inflation, closer to stagflation risk than a 2008 replay. The warning is real, the parallel is not exact.
The 10-year anchors mortgages, corporate borrowing, and how every asset gets valued. Duration matters more than the number itself. A brief spike gets absorbed. Months above 5% is when refinancing pain starts cracking housing and heavily indebted companies.
For crypto, when a risk-free Treasury pays over 5%, every risk asset has to work harder to attract money. Bitcoin holding the $84K area through this is real resilience, but yield shocks can flip sentiment fast.
Watch whether yields stay above 5% heading into the October 27 to 28 Fed meeting.
Keep leverage low and respect what the bond market is saying.
Not financial advice.
$BTC
$BNB
$ETH
The world's most important interest rate just broke above 5.20%, its highest since July 2007, after jumping about 25 basis points in two sessions.
The trigger was hot data. September's flash PMI, a survey of business activity, hit 58.4, the strongest since July 2021, with input costs rising at the fastest pace since October 2022. Strong growth plus rising prices is the last thing a Fed that just hiked wants to see, and markets now eye another hike in October. With Brent back above $100 and a swelling deficit to fund, bond buyers are demanding more.
The 2007 comparison deserves care. Back then, yields peaked right before a credit bust. Today's driver is a hot economy with sticky inflation, closer to stagflation risk than a 2008 replay. The warning is real, the parallel is not exact.
The 10-year anchors mortgages, corporate borrowing, and how every asset gets valued. Duration matters more than the number itself. A brief spike gets absorbed. Months above 5% is when refinancing pain starts cracking housing and heavily indebted companies.
For crypto, when a risk-free Treasury pays over 5%, every risk asset has to work harder to attract money. Bitcoin holding the $84K area through this is real resilience, but yield shocks can flip sentiment fast.
Watch whether yields stay above 5% heading into the October 27 to 28 Fed meeting.
Keep leverage low and respect what the bond market is saying.
Not financial advice.
$BTC
$BNB
$ETH
1
2.4k
·
--
Bearish
🎃 $TAKE 's Carriage Just Turned Back Into a Pumpkin
The ball is over. Midnight hit.
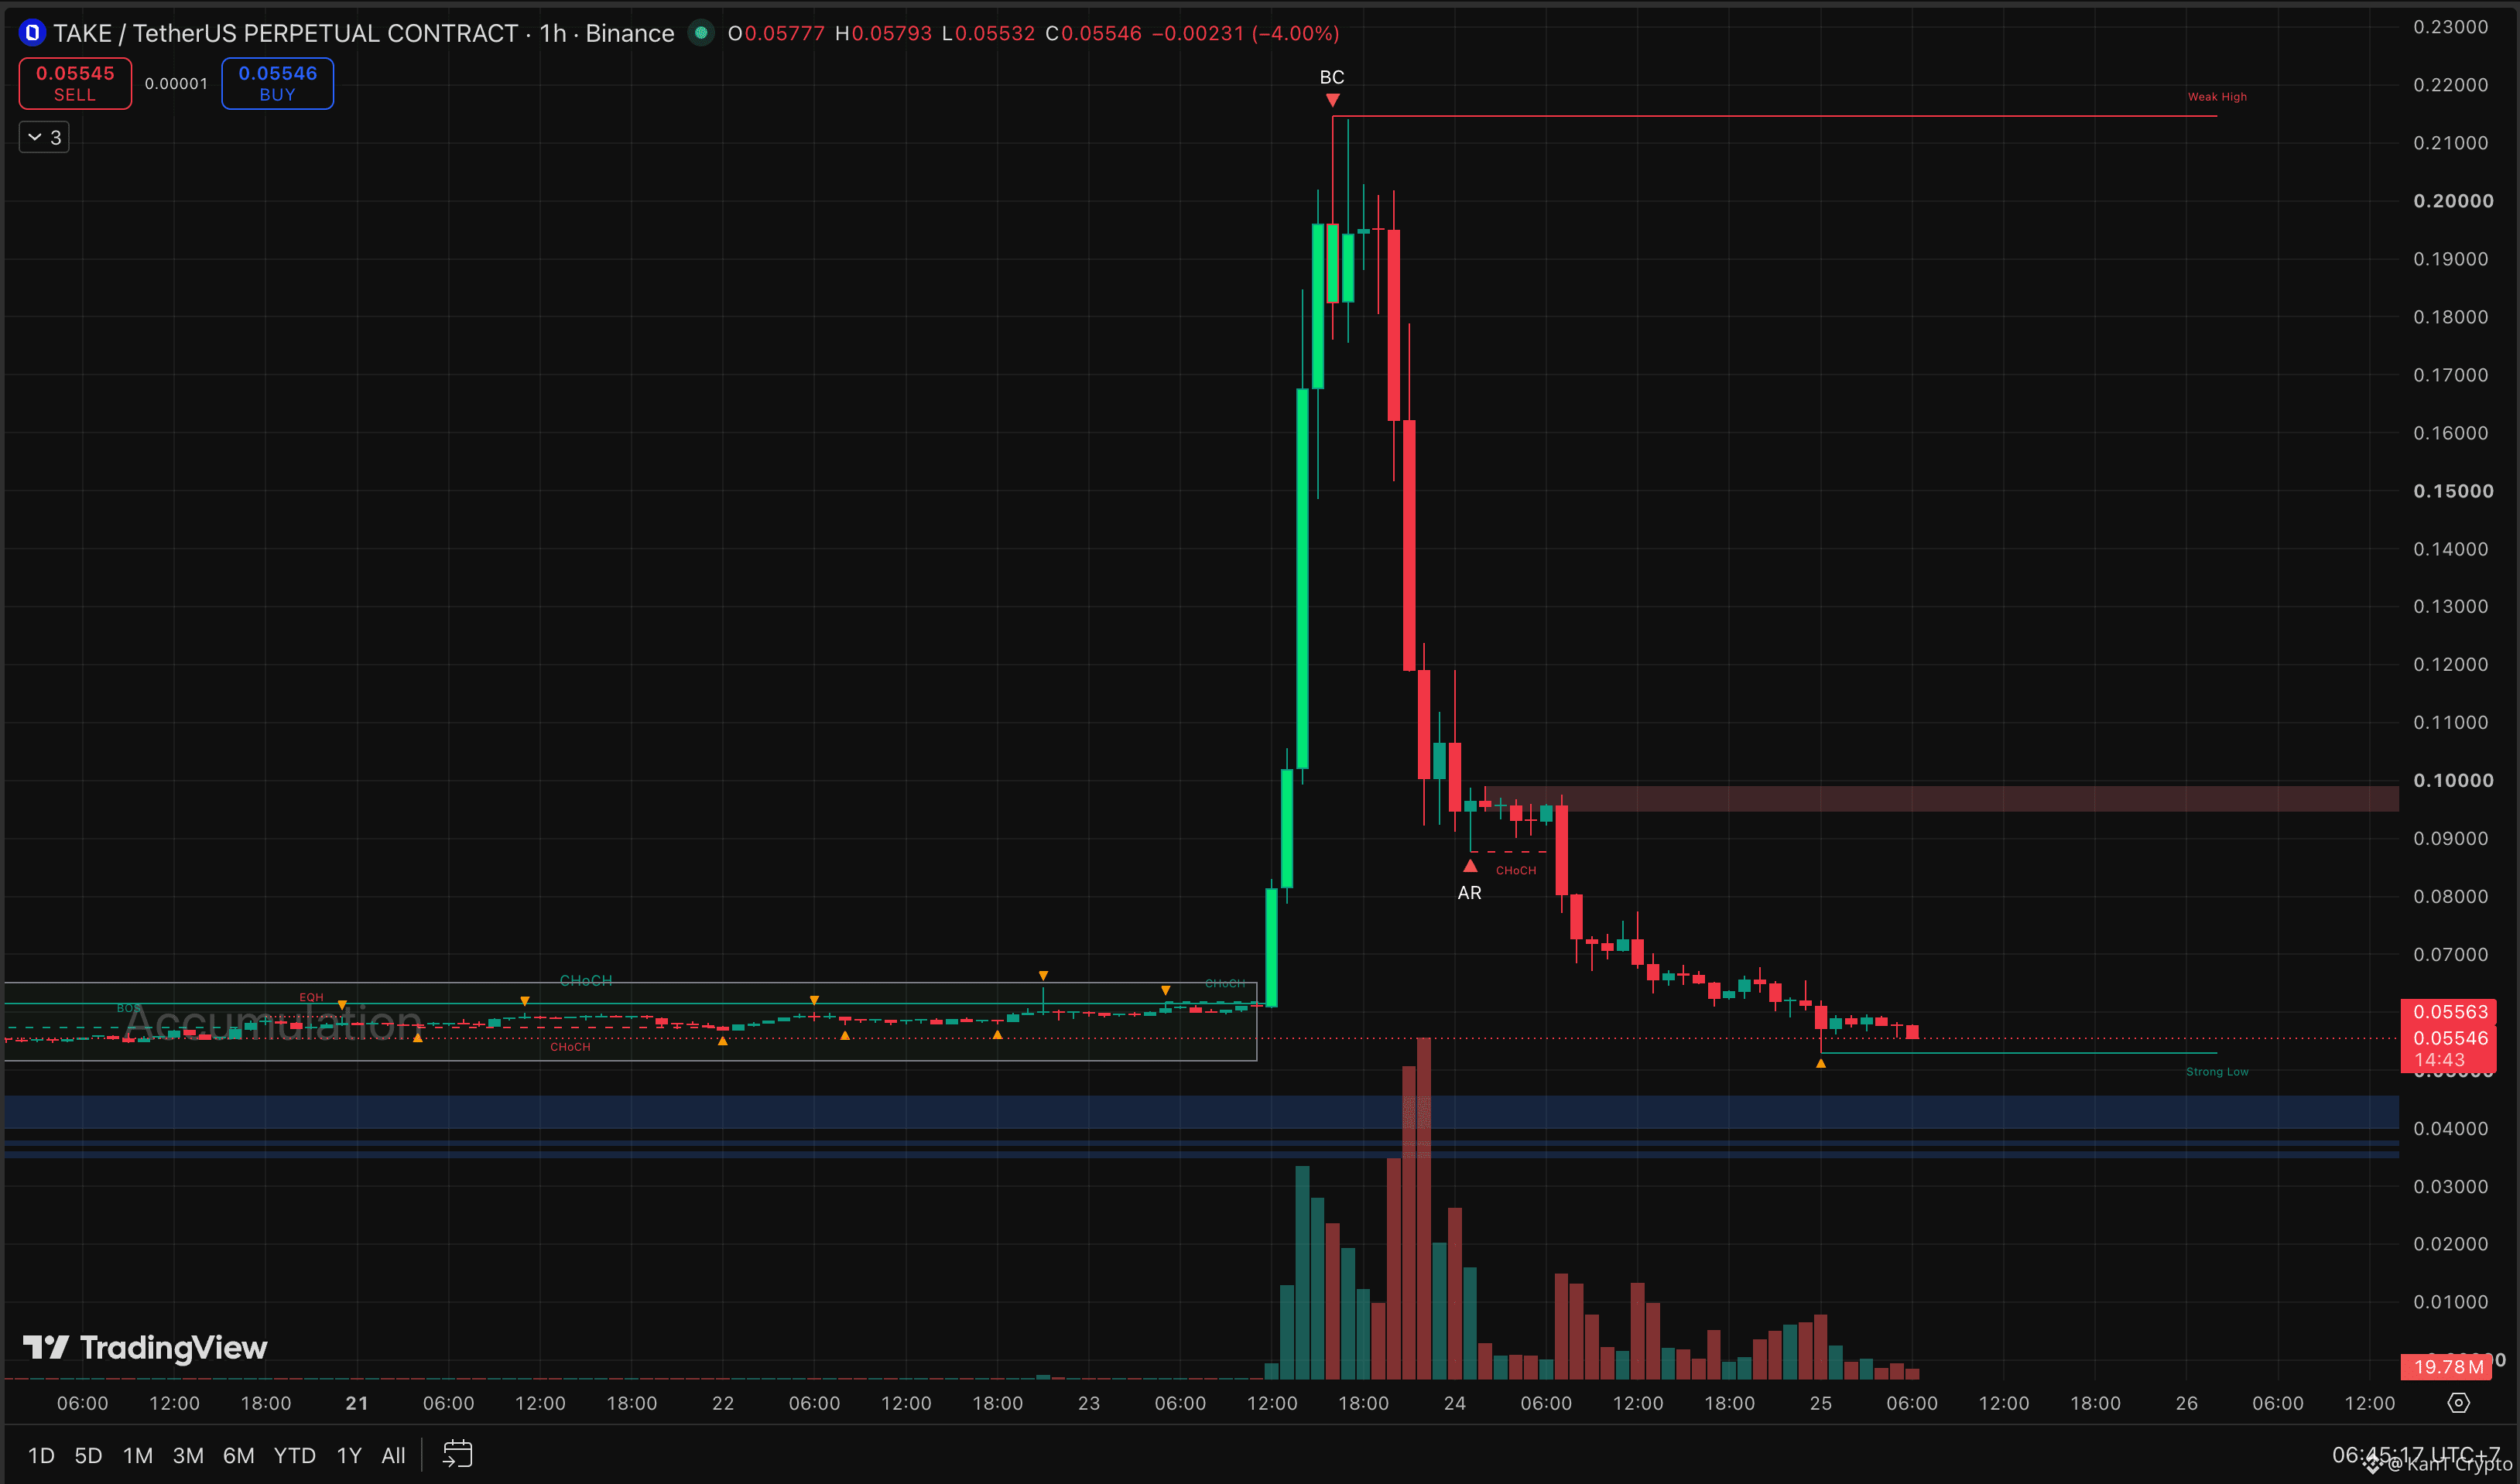
From a $0.215 peak to $0.0555.
Around 74% gone.
And price now sits back inside the exact accumulation range it launched from two days ago.
Yesterday the line to hold was $0.06. It did not hold. 👀
Price slipped under it, and TAKE is officially back to square one, trading where it was before anyone noticed the pump.
Nothing about the project changed in 48 hours. The price went up on hype and leverage, and came back down the same way. The only thing that really moved was money, from late buyers to early sellers.
Look at the volume now, too.
The panic selling is gone. Candles are small, volume is drying up, and price is grinding lower slowly. Sellers are tired, but no buyers are stepping in either.
The levels that matter.
$0.0535 is the strong low, the last floor of the old range.
Hold it, and TAKE can go back to sleep and base sideways.
Lose it, and the chart opens toward the $0.040 to $0.046 demand zone below.
Any bounce needs to reclaim $0.061 before it means anything, and $0.095 to $0.10 is a wall of trapped buyers overhead.
Pumps like this teach the same lesson every time. The price at the top is rarely the price the market actually agrees on.
Base at $0.0535, or one more floor down? 🔥
Not financial advice.
{future}(TAKEUSDT)
$龙虾
{future}(龙虾USDT)
$ONE
{future}(ONEUSDT)
🎃 $TAKE 's Carriage Just Turned Back Into a Pumpkin
The ball is over. Midnight hit.
From a $0.215 peak to $0.0555.
Around 74% gone.
And price now sits back inside the exact accumulation range it launched from two days ago.
Yesterday the line to hold was $0.06. It did not hold. 👀
Price slipped under it, and TAKE is officially back to square one, trading where it was before anyone noticed the pump.
Nothing about the project changed in 48 hours. The price went up on hype and leverage, and came back down the same way. The only thing that really moved was money, from late buyers to early sellers.
Look at the volume now, too.
The panic selling is gone. Candles are small, volume is drying up, and price is grinding lower slowly. Sellers are tired, but no buyers are stepping in either.
The levels that matter.
$0.0535 is the strong low, the last floor of the old range.
Hold it, and TAKE can go back to sleep and base sideways.
Lose it, and the chart opens toward the $0.040 to $0.046 demand zone below.
Any bounce needs to reclaim $0.061 before it means anything, and $0.095 to $0.10 is a wall of trapped buyers overhead.
Pumps like this teach the same lesson every time. The price at the top is rarely the price the market actually agrees on.
Base at $0.0535, or one more floor down? 🔥
Not financial advice.
$龙虾
$ONE
The ball is over. Midnight hit.
From a $0.215 peak to $0.0555.
Around 74% gone.
And price now sits back inside the exact accumulation range it launched from two days ago.
Yesterday the line to hold was $0.06. It did not hold. 👀
Price slipped under it, and TAKE is officially back to square one, trading where it was before anyone noticed the pump.
Nothing about the project changed in 48 hours. The price went up on hype and leverage, and came back down the same way. The only thing that really moved was money, from late buyers to early sellers.
Look at the volume now, too.
The panic selling is gone. Candles are small, volume is drying up, and price is grinding lower slowly. Sellers are tired, but no buyers are stepping in either.
The levels that matter.
$0.0535 is the strong low, the last floor of the old range.
Hold it, and TAKE can go back to sleep and base sideways.
Lose it, and the chart opens toward the $0.040 to $0.046 demand zone below.
Any bounce needs to reclaim $0.061 before it means anything, and $0.095 to $0.10 is a wall of trapped buyers overhead.
Pumps like this teach the same lesson every time. The price at the top is rarely the price the market actually agrees on.
Base at $0.0535, or one more floor down? 🔥
Not financial advice.
$龙虾
$ONE
1
2.3k
·
--
Bullish
🚀 $SAGA Just Fired a 72% Rocket. In One Candle.
Four hours. That is all it took.
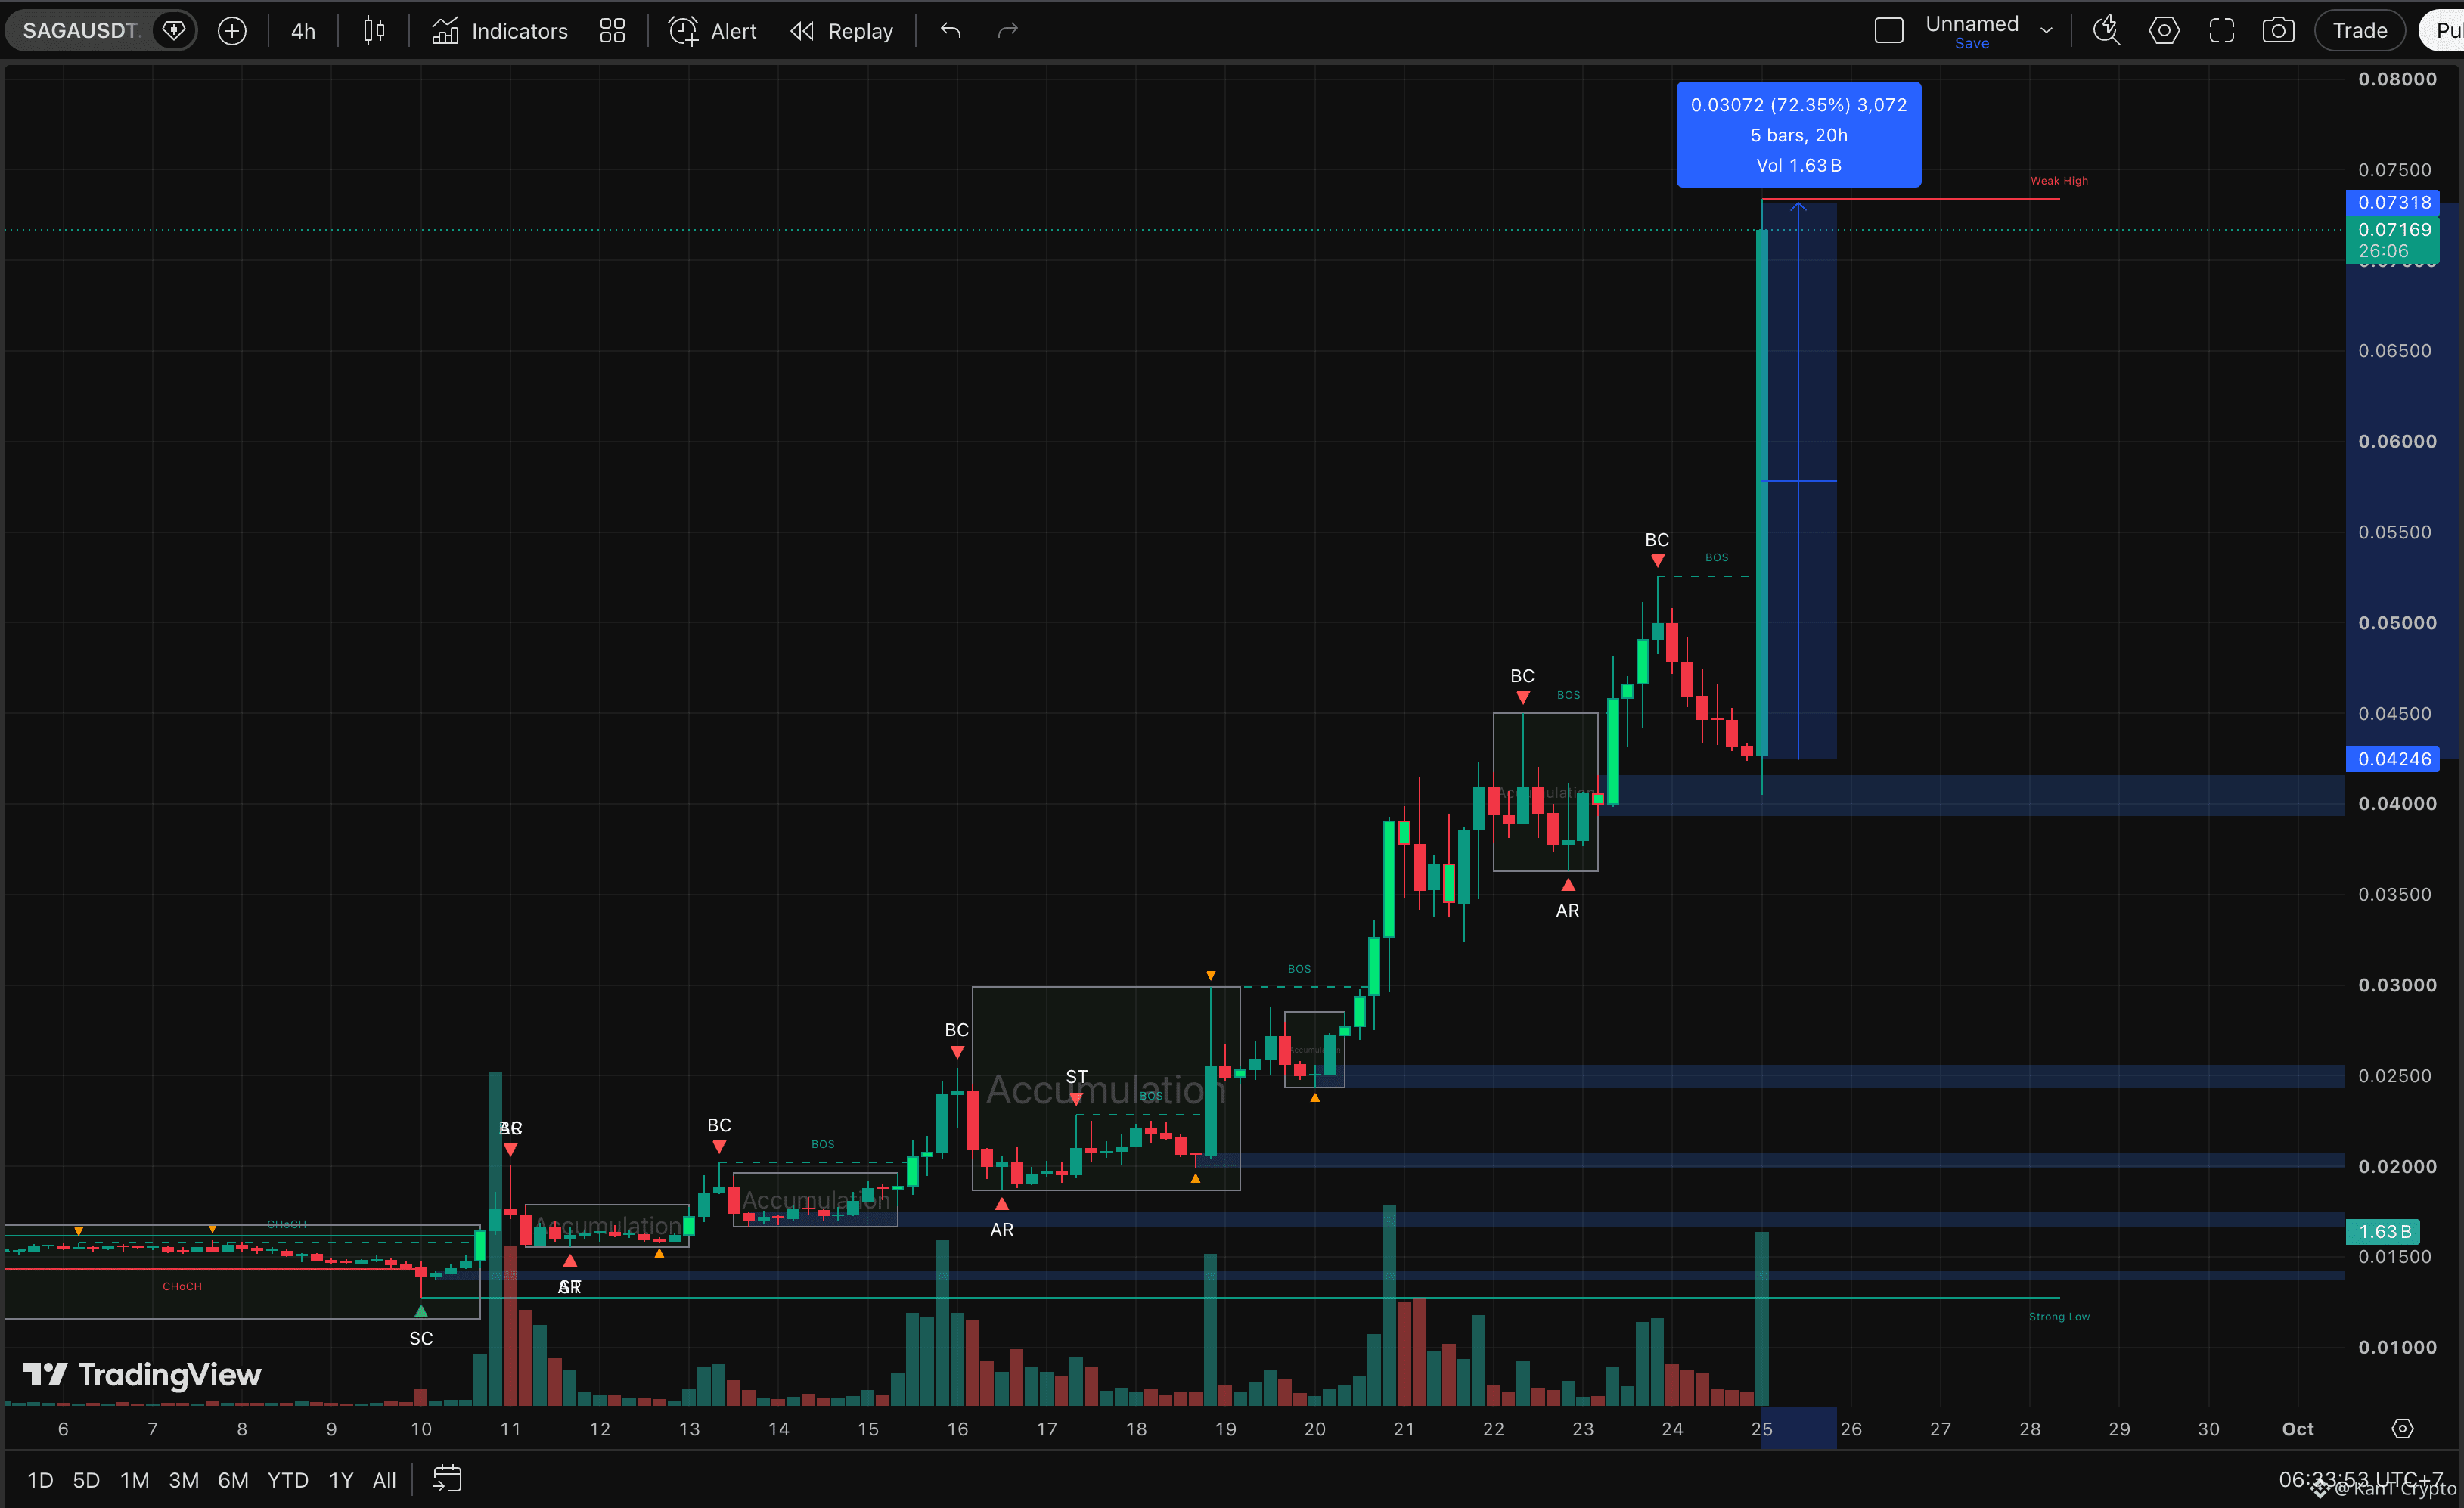
$0.0425 to $0.0732.
+72% on a single 4H candle, still open.
1.63 billion SAGA in perp volume, roughly four times the entire circulating supply.
And this was not a spike out of nowhere. Zoom out and the chart is a staircase.
Since a selling climax near $0.014 on September 10, SAGA has stacked accumulation box after accumulation box, broken structure after each one, and climbed roughly 5x in two weeks. Today's candle is the steepest step yet.
Now look where it landed. 👀
Price sits at $0.0717, pressed right under the $0.0732 weak high it just printed. Everyone who bought the bottom of this candle is sitting on huge gains, and some of them will want out.
Keep perspective, too. SAGA is still more than 99% below its 2024 all-time high. Cheap versus history does not mean undervalued, and volume several times the circulating supply says leverage is doing a lot of the lifting here.
The levels that matter.
Break and hold above $0.0732, and this leg keeps climbing.
Lose the candle's midpoint around $0.058, and the rocket gives back altitude fast.
The launchpad at $0.040 to $0.042 is where real demand sits if it all unwinds.
Chasing the top of a 72% candle is how you buy someone else's exit. Let the first pullback show where buyers actually are.
Refuel and blast past $0.0732, or back to the launchpad? 🔥
Not financial advice.
{future}(SAGAUSDT)
$ONDO
{future}(ONDOUSDT)
$XAI
{future}(XAIUSDT)
🚀 $SAGA Just Fired a 72% Rocket. In One Candle.
Four hours. That is all it took.
$0.0425 to $0.0732.
+72% on a single 4H candle, still open.
1.63 billion SAGA in perp volume, roughly four times the entire circulating supply.
And this was not a spike out of nowhere. Zoom out and the chart is a staircase.
Since a selling climax near $0.014 on September 10, SAGA has stacked accumulation box after accumulation box, broken structure after each one, and climbed roughly 5x in two weeks. Today's candle is the steepest step yet.
Now look where it landed. 👀
Price sits at $0.0717, pressed right under the $0.0732 weak high it just printed. Everyone who bought the bottom of this candle is sitting on huge gains, and some of them will want out.
Keep perspective, too. SAGA is still more than 99% below its 2024 all-time high. Cheap versus history does not mean undervalued, and volume several times the circulating supply says leverage is doing a lot of the lifting here.
The levels that matter.
Break and hold above $0.0732, and this leg keeps climbing.
Lose the candle's midpoint around $0.058, and the rocket gives back altitude fast.
The launchpad at $0.040 to $0.042 is where real demand sits if it all unwinds.
Chasing the top of a 72% candle is how you buy someone else's exit. Let the first pullback show where buyers actually are.
Refuel and blast past $0.0732, or back to the launchpad? 🔥
Not financial advice.
$ONDO
$XAI
Four hours. That is all it took.
$0.0425 to $0.0732.
+72% on a single 4H candle, still open.
1.63 billion SAGA in perp volume, roughly four times the entire circulating supply.
And this was not a spike out of nowhere. Zoom out and the chart is a staircase.
Since a selling climax near $0.014 on September 10, SAGA has stacked accumulation box after accumulation box, broken structure after each one, and climbed roughly 5x in two weeks. Today's candle is the steepest step yet.
Now look where it landed. 👀
Price sits at $0.0717, pressed right under the $0.0732 weak high it just printed. Everyone who bought the bottom of this candle is sitting on huge gains, and some of them will want out.
Keep perspective, too. SAGA is still more than 99% below its 2024 all-time high. Cheap versus history does not mean undervalued, and volume several times the circulating supply says leverage is doing a lot of the lifting here.
The levels that matter.
Break and hold above $0.0732, and this leg keeps climbing.
Lose the candle's midpoint around $0.058, and the rocket gives back altitude fast.
The launchpad at $0.040 to $0.042 is where real demand sits if it all unwinds.
Chasing the top of a 72% candle is how you buy someone else's exit. Let the first pullback show where buyers actually are.
Refuel and blast past $0.0732, or back to the launchpad? 🔥
Not financial advice.
$ONDO
$XAI
1
2.2k
·
--
🧲 Two Magnets, One Bitcoin. Which One Wins?
BTC is stuck in a tug of war, and both ends are pulling hard.
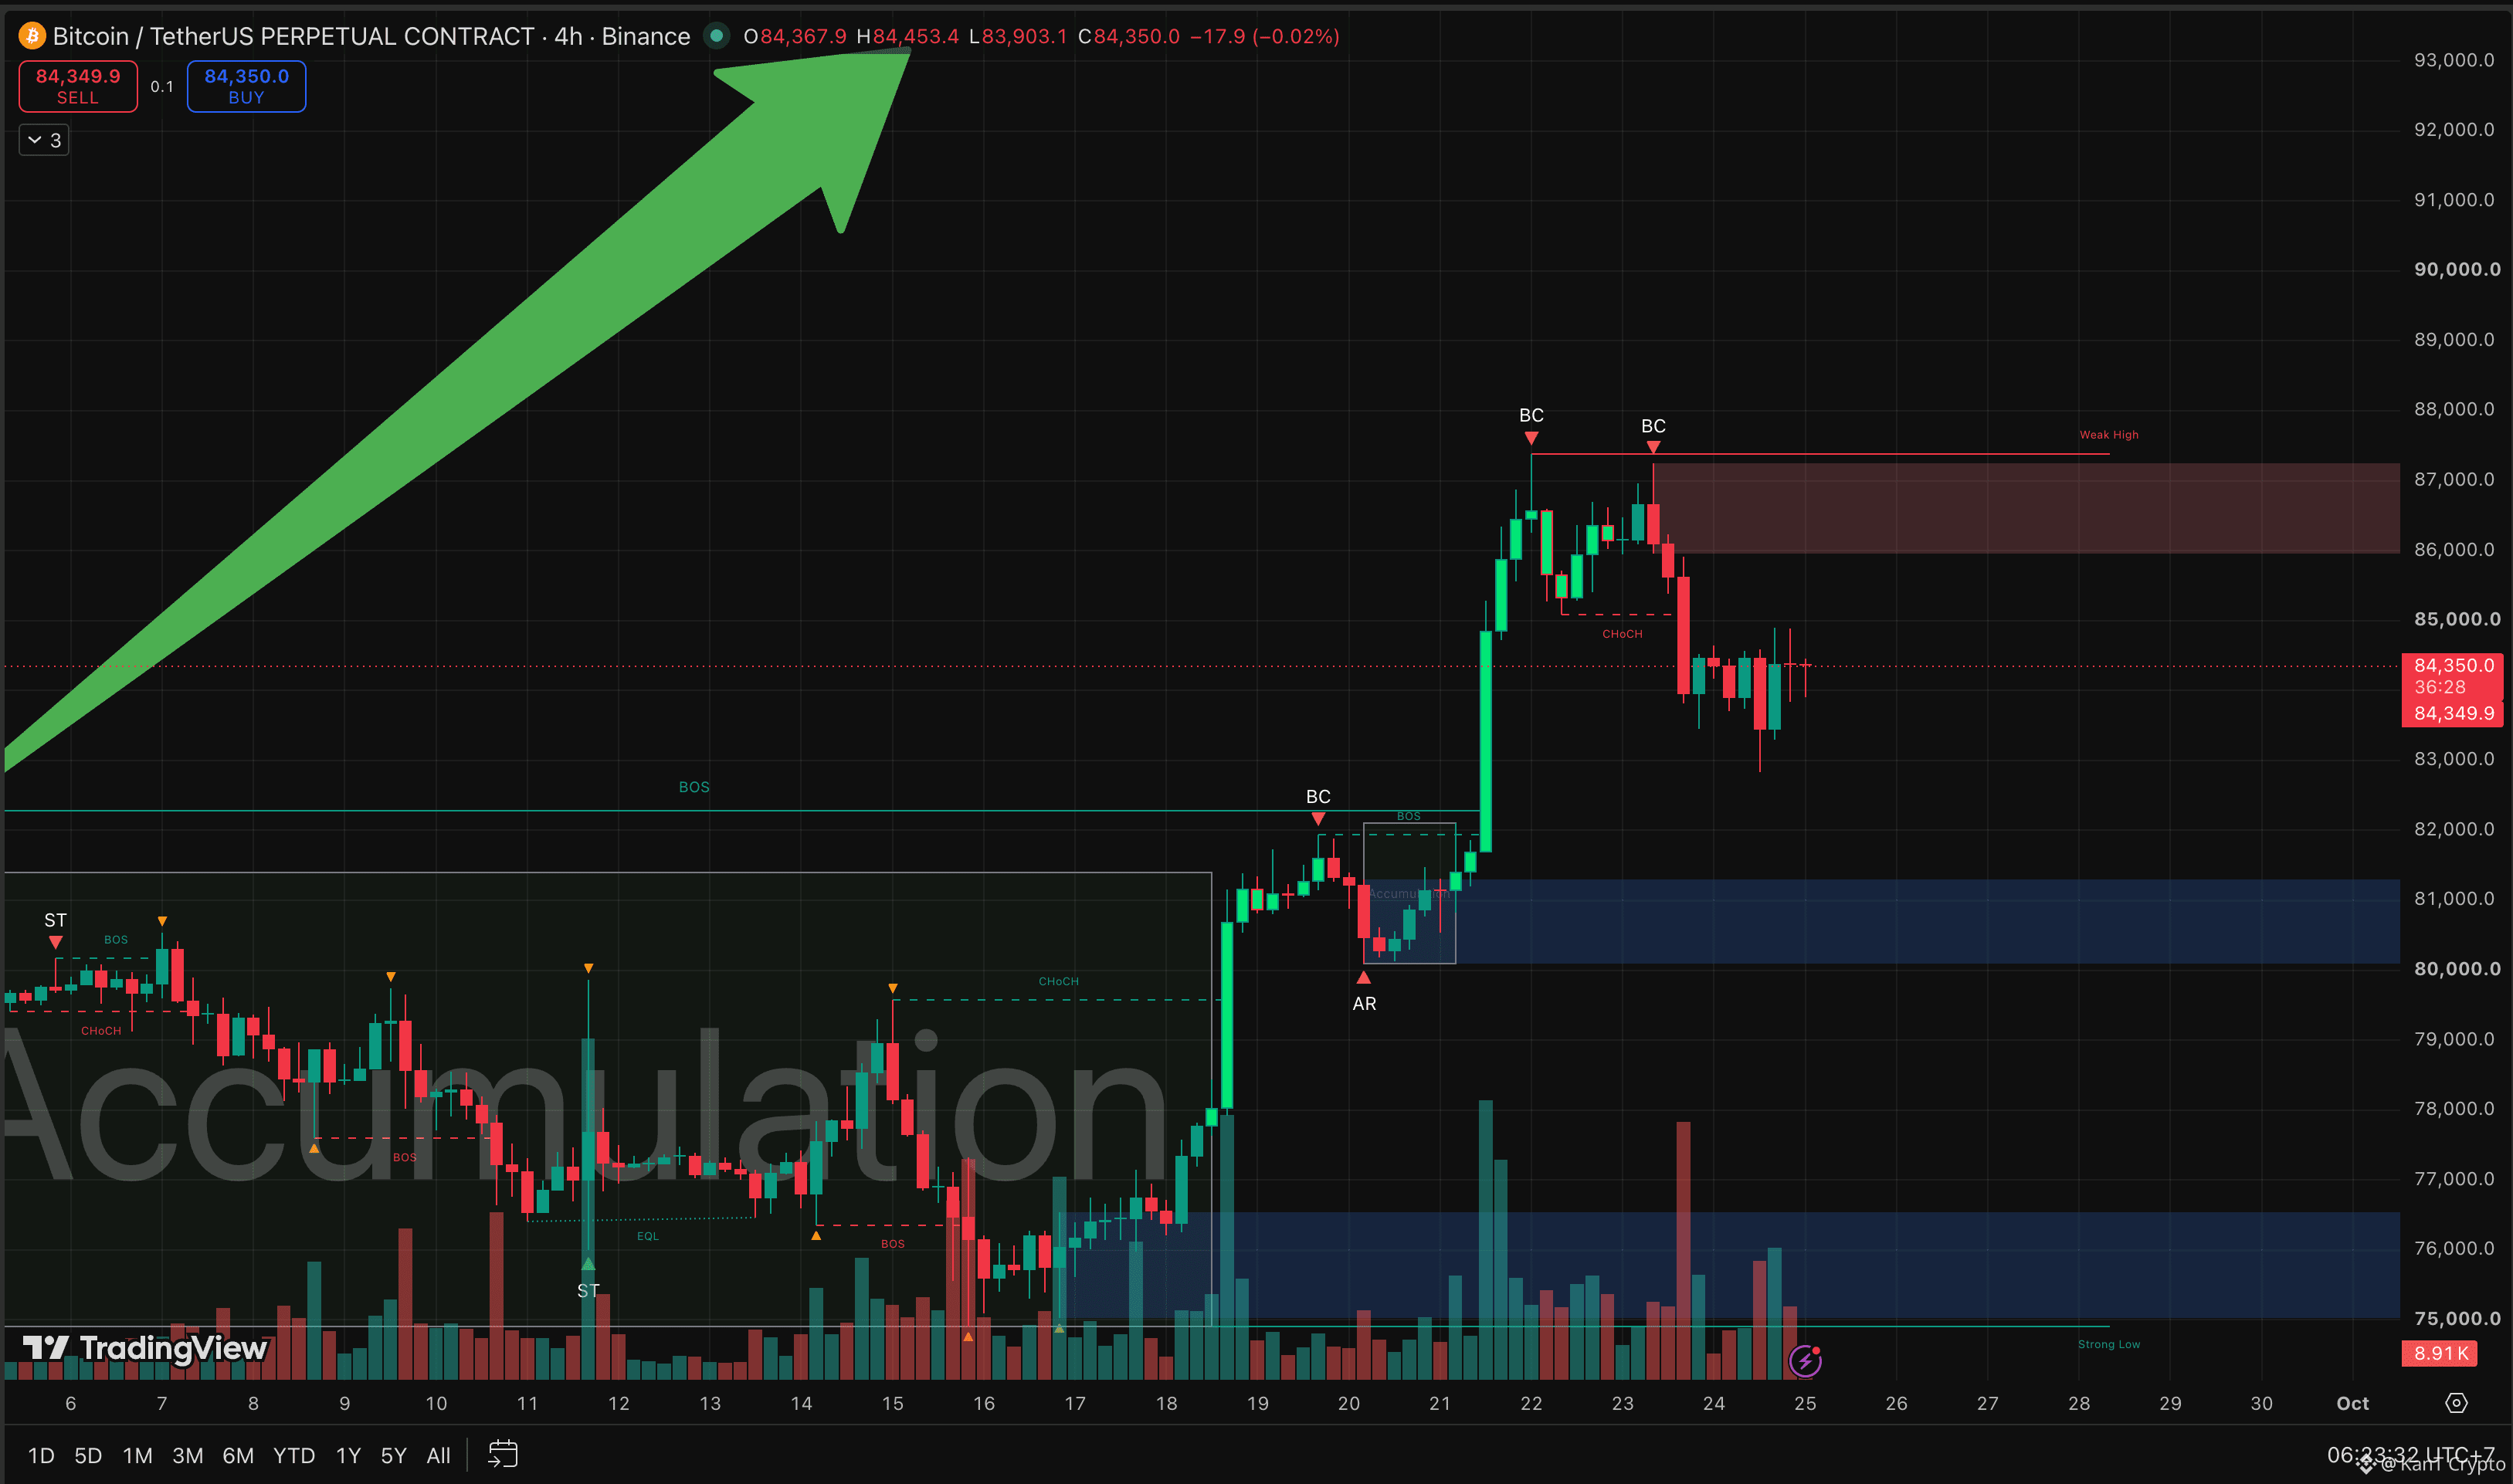
Price is holding $84,350 on the 4H, pinned between two zones that keep tugging at it.
The magnet above: $86K to $87K.
That is where the double top formed and where sellers parked their orders. Just above it sits the $87,400 weak high, a pool of short stop-losses waiting to be triggered. Markets love to go where the stops are.
The magnet below: $80K to $81K.
That is the breakout base, the exact launchpad for the rip to $87K. Price left it in a hurry, and zones abandoned that fast often get revisited.
Both sides have a case. 👀
Bears point to the structure. Since the $87K top, BTC printed a change of character to the downside and a lower high.
Bulls point to the dips. Every push toward $83K keeps getting bought, leaving long lower wicks, a sign of demand quietly absorbing the selling.
Neither side has won yet, and the break will settle it.
Reclaim and hold $85K, and the upper magnet takes over, with a real shot at sweeping $87.4K.
Lose $83K cleanly, and the slide toward $80K to $81K opens fast.
Chopping in the middle of two magnets is where accounts get shredded. Let one side break first.
Up to $86K, or down to $81K first? 🔥
Not financial advice.
$BTC
{future}(BTCUSDT)
$BNB
{future}(BNBUSDT)
$ETH
{future}(ETHUSDT)
🧲 Two Magnets, One Bitcoin. Which One Wins?
BTC is stuck in a tug of war, and both ends are pulling hard.
Price is holding $84,350 on the 4H, pinned between two zones that keep tugging at it.
The magnet above: $86K to $87K.
That is where the double top formed and where sellers parked their orders. Just above it sits the $87,400 weak high, a pool of short stop-losses waiting to be triggered. Markets love to go where the stops are.
The magnet below: $80K to $81K.
That is the breakout base, the exact launchpad for the rip to $87K. Price left it in a hurry, and zones abandoned that fast often get revisited.
Both sides have a case. 👀
Bears point to the structure. Since the $87K top, BTC printed a change of character to the downside and a lower high.
Bulls point to the dips. Every push toward $83K keeps getting bought, leaving long lower wicks, a sign of demand quietly absorbing the selling.
Neither side has won yet, and the break will settle it.
Reclaim and hold $85K, and the upper magnet takes over, with a real shot at sweeping $87.4K.
Lose $83K cleanly, and the slide toward $80K to $81K opens fast.
Chopping in the middle of two magnets is where accounts get shredded. Let one side break first.
Up to $86K, or down to $81K first? 🔥
Not financial advice.
$BTC
$BNB
$ETH
BTC is stuck in a tug of war, and both ends are pulling hard.
Price is holding $84,350 on the 4H, pinned between two zones that keep tugging at it.
The magnet above: $86K to $87K.
That is where the double top formed and where sellers parked their orders. Just above it sits the $87,400 weak high, a pool of short stop-losses waiting to be triggered. Markets love to go where the stops are.
The magnet below: $80K to $81K.
That is the breakout base, the exact launchpad for the rip to $87K. Price left it in a hurry, and zones abandoned that fast often get revisited.
Both sides have a case. 👀
Bears point to the structure. Since the $87K top, BTC printed a change of character to the downside and a lower high.
Bulls point to the dips. Every push toward $83K keeps getting bought, leaving long lower wicks, a sign of demand quietly absorbing the selling.
Neither side has won yet, and the break will settle it.
Reclaim and hold $85K, and the upper magnet takes over, with a real shot at sweeping $87.4K.
Lose $83K cleanly, and the slide toward $80K to $81K opens fast.
Chopping in the middle of two magnets is where accounts get shredded. Let one side break first.
Up to $86K, or down to $81K first? 🔥
Not financial advice.
$BTC
$BNB
$ETH
3
105
·
--
Bearish
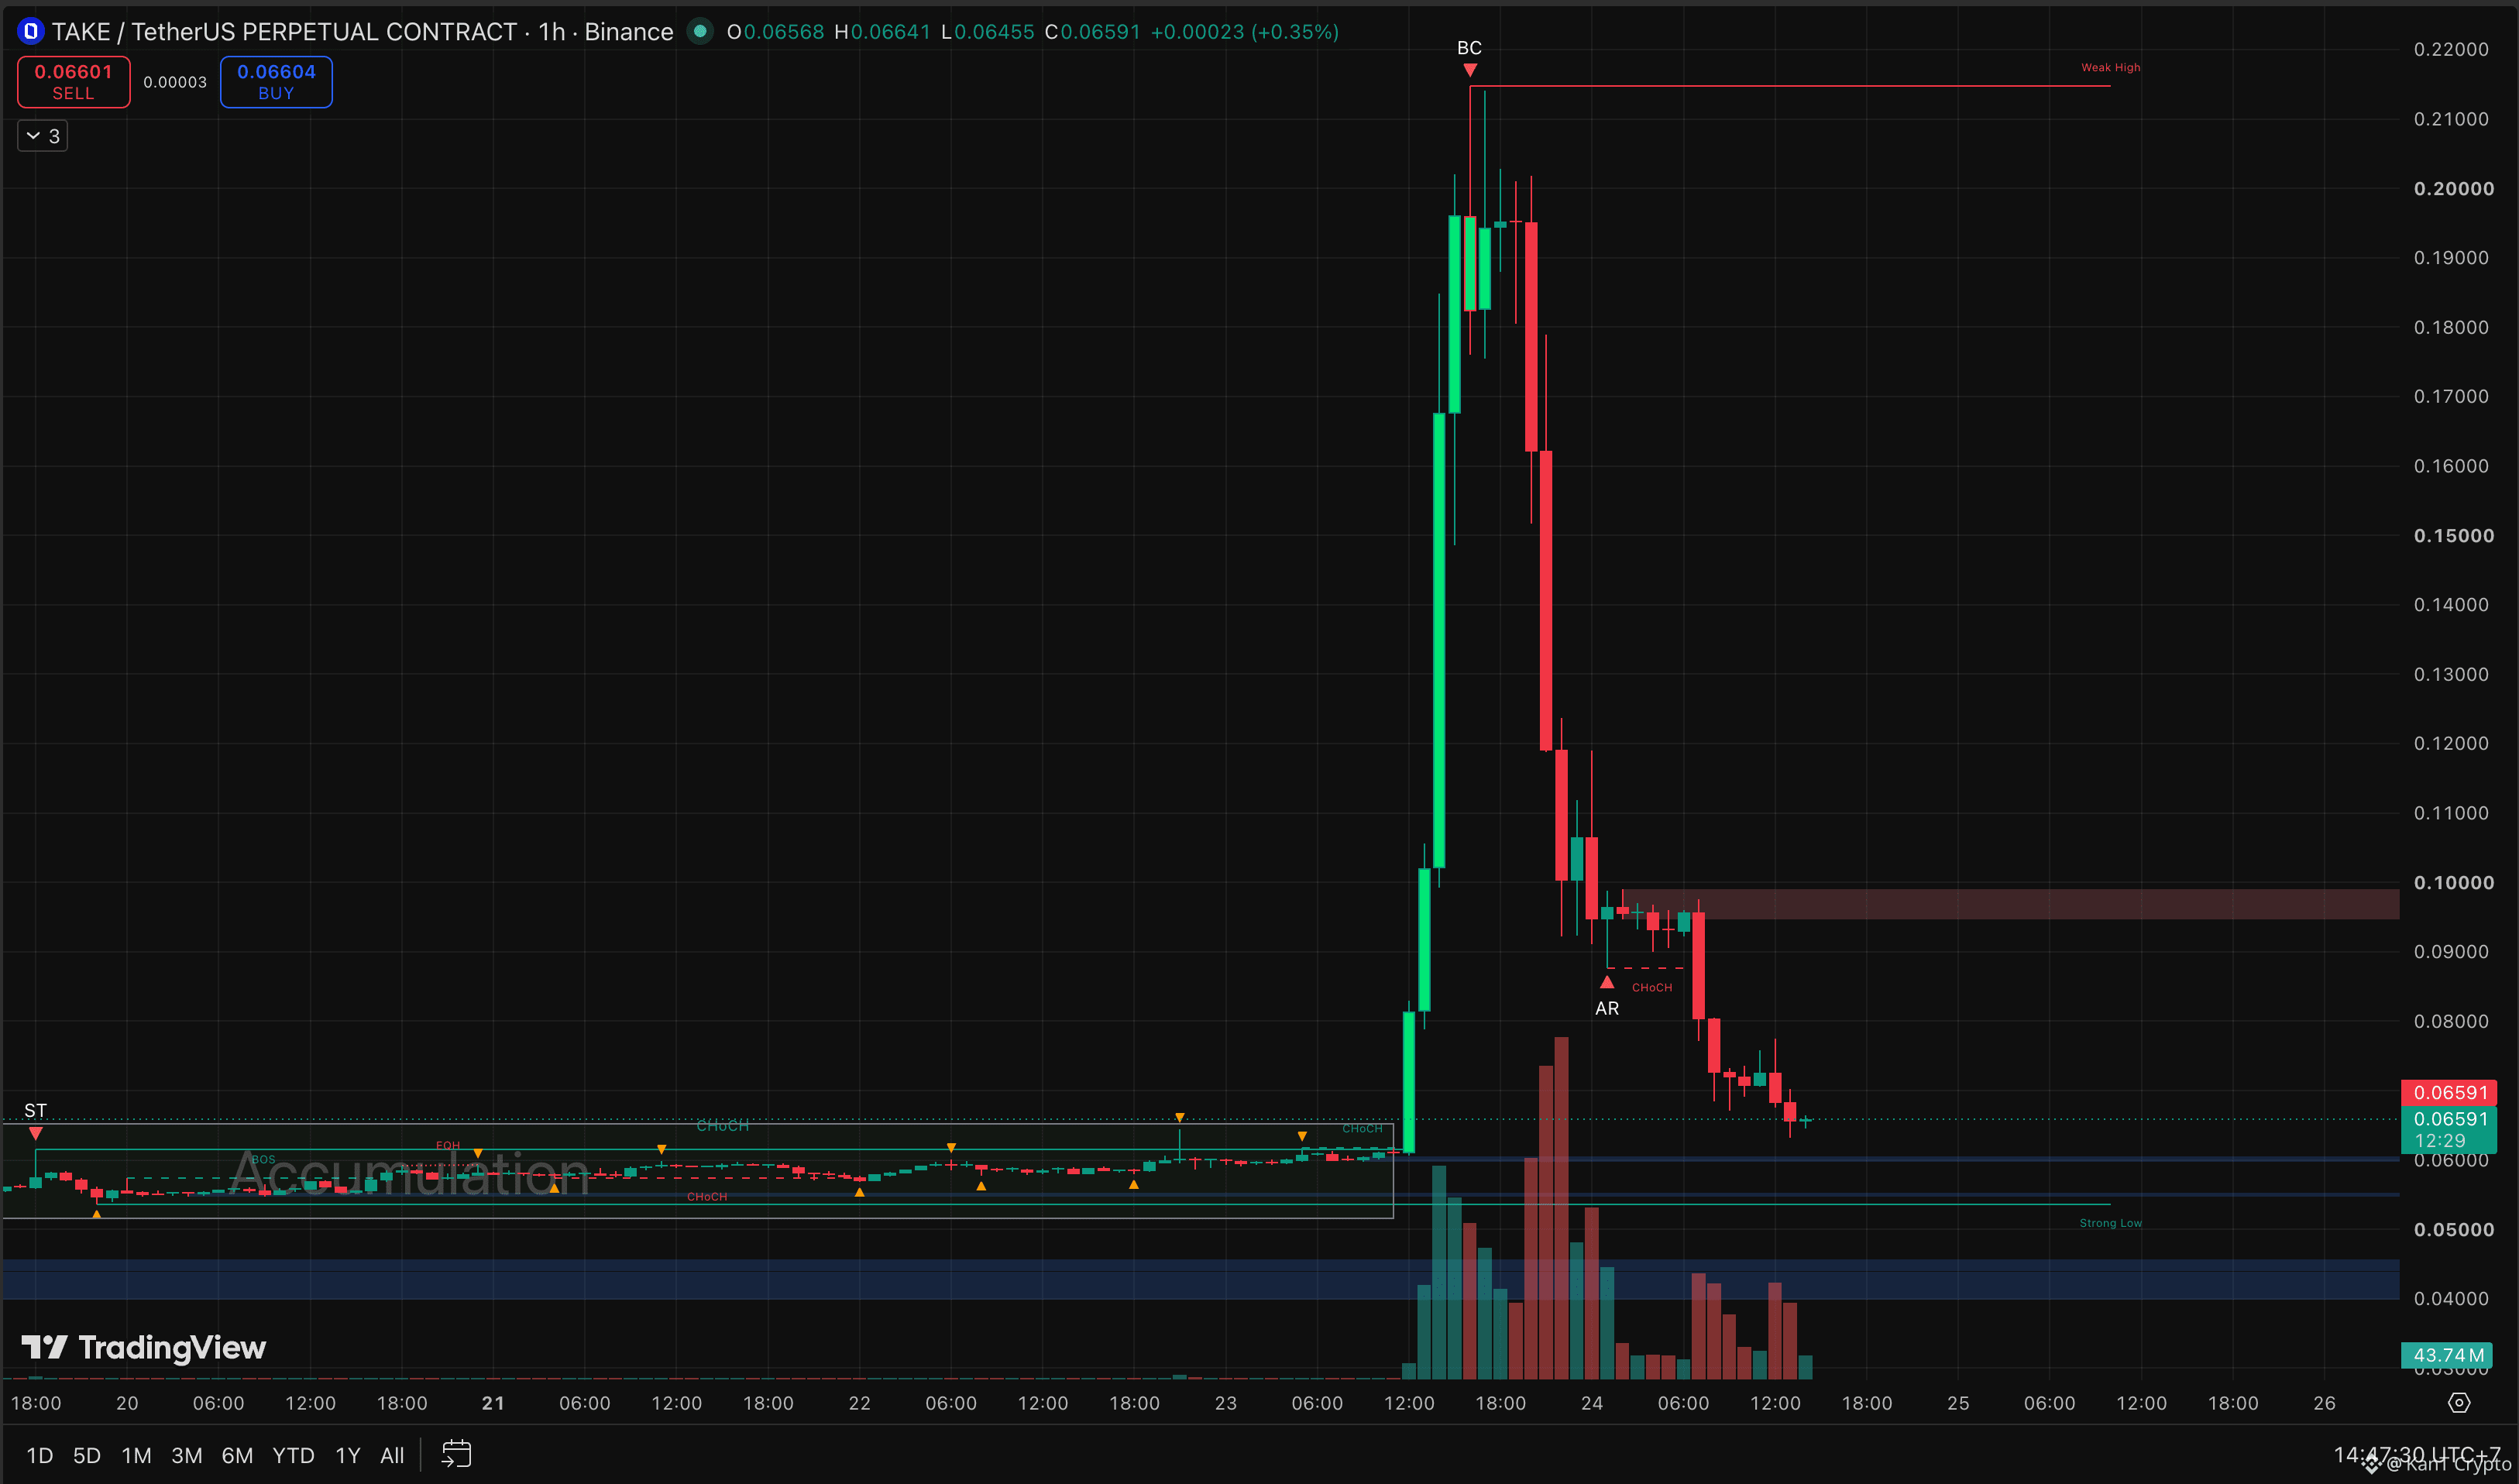
🎢 $TAKE Just Took the Full Round Trip
Up the elevator. Down the elevator shaft.
The ride up:
From a flat base around $0.06 to a peak near $0.215.
Roughly +250% in a matter of hours.
The ride down:
Straight back to $0.0659.
Around 69% wiped out from the top, and price is now sitting almost exactly where the whole thing started.
Everyone who bought the breakout is basically back to zero gains. Everyone who bought anywhere above $0.10 is deep underwater. 💀
The chart reads like a textbook blow-off.
Days of quiet accumulation, then a vertical candle on massive volume.
A buying climax at $0.215, the moment the last buyers pile in and momentum dies.
Then the heaviest red volume of the entire move on the way down. That is not a dip. That is the early buyers leaving through the front door at once.
There was one attempt to stabilize around $0.09, it failed, and the old support there has now flipped into resistance at $0.095 to $0.10.
Now the levels that matter. 👀
Price is hovering just above the top of the old accumulation range.
Hold $0.06 and it might base and chop.
Lose it, and the strong low near $0.0535 is the last line before the chart opens toward $0.040 to $0.045.
No news, thin books, trapped buyers overhead. Bounces here can be sharp, and they can just as easily be exit liquidity.
Base at $0.06, or does the elevator keep dropping? 🔥
Not financial advice.
{future}(TAKEUSDT)
$MUBARAK
{future}(MUBARAKUSDT)
$ONE
{future}(ONEUSDT)
🎢 $TAKE Just Took the Full Round Trip
Up the elevator. Down the elevator shaft.
The ride up:
From a flat base around $0.06 to a peak near $0.215.
Roughly +250% in a matter of hours.
The ride down:
Straight back to $0.0659.
Around 69% wiped out from the top, and price is now sitting almost exactly where the whole thing started.
Everyone who bought the breakout is basically back to zero gains. Everyone who bought anywhere above $0.10 is deep underwater. 💀
The chart reads like a textbook blow-off.
Days of quiet accumulation, then a vertical candle on massive volume.
A buying climax at $0.215, the moment the last buyers pile in and momentum dies.
Then the heaviest red volume of the entire move on the way down. That is not a dip. That is the early buyers leaving through the front door at once.
There was one attempt to stabilize around $0.09, it failed, and the old support there has now flipped into resistance at $0.095 to $0.10.
Now the levels that matter. 👀
Price is hovering just above the top of the old accumulation range.
Hold $0.06 and it might base and chop.
Lose it, and the strong low near $0.0535 is the last line before the chart opens toward $0.040 to $0.045.
No news, thin books, trapped buyers overhead. Bounces here can be sharp, and they can just as easily be exit liquidity.
Base at $0.06, or does the elevator keep dropping? 🔥
Not financial advice.
$MUBARAK
$ONE
Up the elevator. Down the elevator shaft.
The ride up:
From a flat base around $0.06 to a peak near $0.215.
Roughly +250% in a matter of hours.
The ride down:
Straight back to $0.0659.
Around 69% wiped out from the top, and price is now sitting almost exactly where the whole thing started.
Everyone who bought the breakout is basically back to zero gains. Everyone who bought anywhere above $0.10 is deep underwater. 💀
The chart reads like a textbook blow-off.
Days of quiet accumulation, then a vertical candle on massive volume.
A buying climax at $0.215, the moment the last buyers pile in and momentum dies.
Then the heaviest red volume of the entire move on the way down. That is not a dip. That is the early buyers leaving through the front door at once.
There was one attempt to stabilize around $0.09, it failed, and the old support there has now flipped into resistance at $0.095 to $0.10.
Now the levels that matter. 👀
Price is hovering just above the top of the old accumulation range.
Hold $0.06 and it might base and chop.
Lose it, and the strong low near $0.0535 is the last line before the chart opens toward $0.040 to $0.045.
No news, thin books, trapped buyers overhead. Bounces here can be sharp, and they can just as easily be exit liquidity.
Base at $0.06, or does the elevator keep dropping? 🔥
Not financial advice.
$MUBARAK
$ONE
1
810
·
--
Bullish
🏰 Bitcoin Is Defending the $84K Fortress
The bleeding stopped. For now.
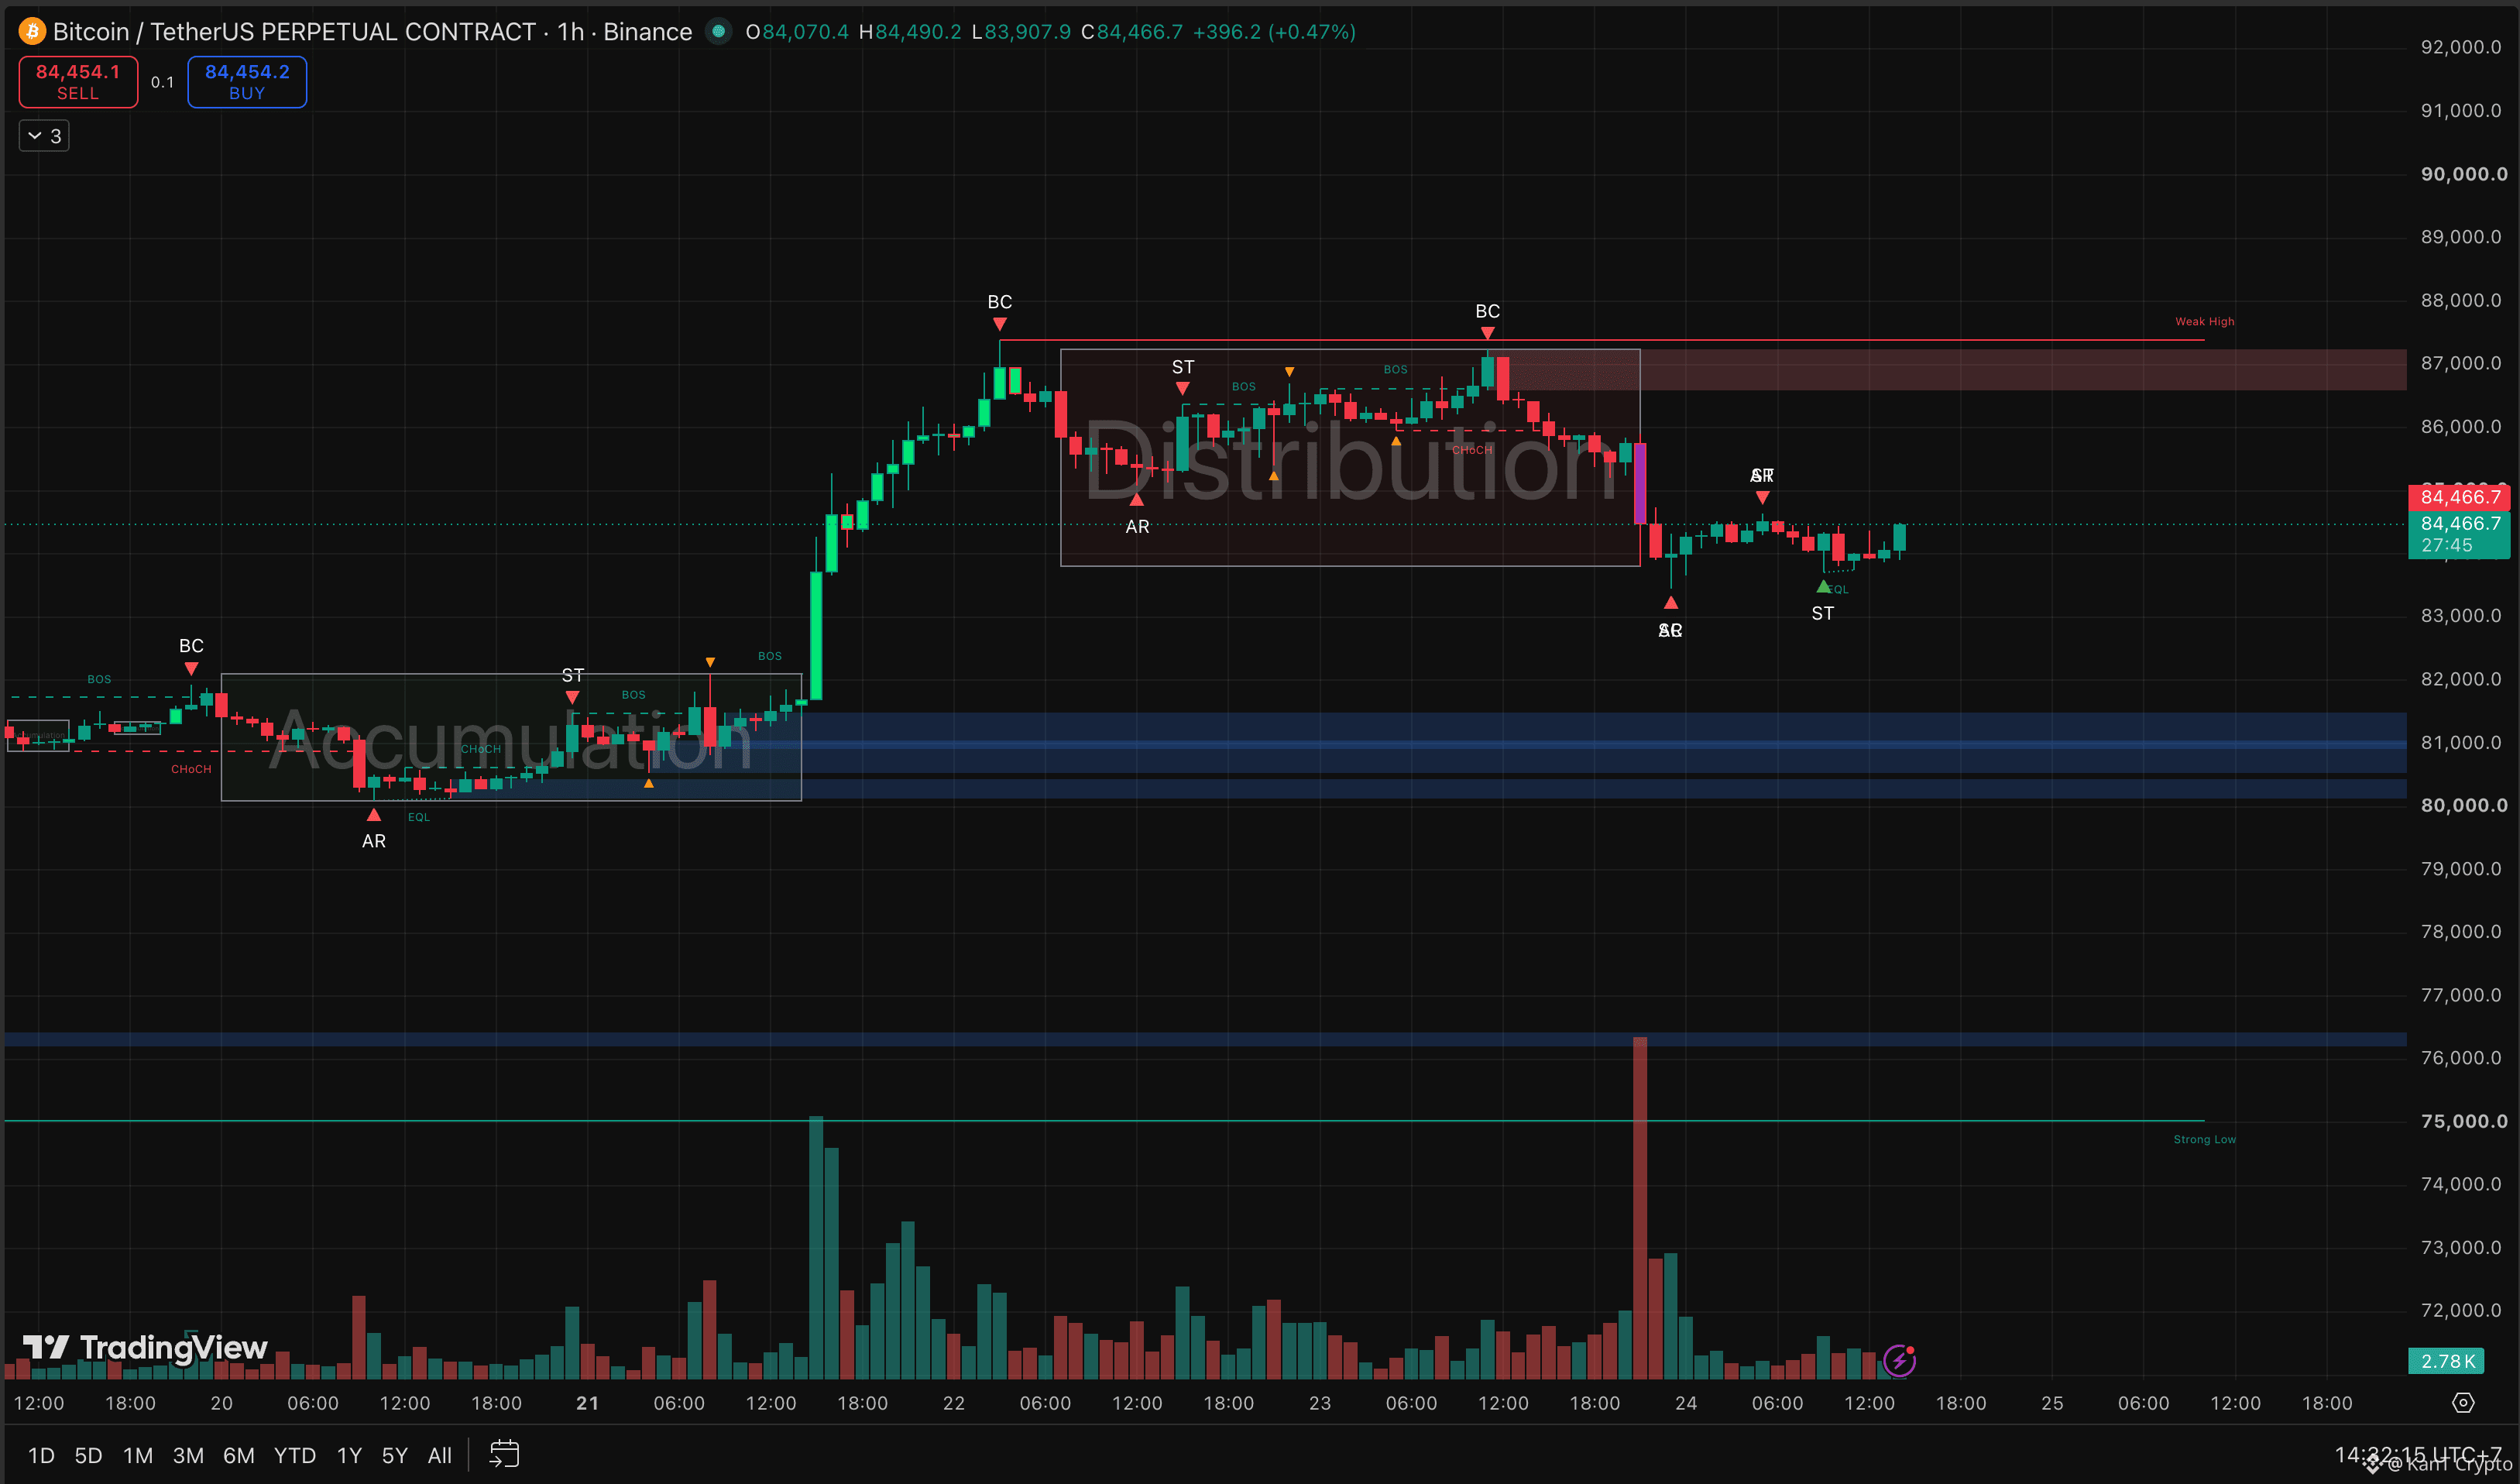
After the breakdown, BTC slid to about $83,500, bounced, came back to test the same spot, and held. Now it is pushing $84,466 on the 1H, up a quiet 0.47%.
The bigger picture on this chart is loud, though.
BTC built a clean accumulation box between $80K and $82K, broke out, and ripped to $87K.
Then it spent two days going sideways up there, and that range turned out to be distribution. Buyers exhausted, sellers quietly unloading.
The exit came with the heaviest red volume candle of the whole week.
What changed since then is the pace. 👀
Selling volume has dried up. The retest near $83,600 printed equal lows instead of a new low. That is sellers losing steam, not buyers taking over.
Now the part that decides everything.
After a distribution breakdown, price often rallies back to the bottom of the old range and gets rejected there. For BTC that ceiling sits at $84,800 to $85,500.
Reclaim it and close back inside the box, and the breakdown starts to look like a shakeout, with $87K back in play.
Get rejected there, and the path toward the $80K to $81K demand zone reopens.
Lose $83,500 outright, and that trip happens faster.
A pause is not a reversal. Let the $85K test play out before picking a side.
Fortress holds and reclaims $85K, or one more leg down to $81K? 🔥
Not financial advice.
$BTC
{future}(BTCUSDT)
$BNB
{future}(BNBUSDT)
$ETH
{future}(ETHUSDT)
🏰 Bitcoin Is Defending the $84K Fortress
The bleeding stopped. For now.
After the breakdown, BTC slid to about $83,500, bounced, came back to test the same spot, and held. Now it is pushing $84,466 on the 1H, up a quiet 0.47%.
The bigger picture on this chart is loud, though.
BTC built a clean accumulation box between $80K and $82K, broke out, and ripped to $87K.
Then it spent two days going sideways up there, and that range turned out to be distribution. Buyers exhausted, sellers quietly unloading.
The exit came with the heaviest red volume candle of the whole week.
What changed since then is the pace. 👀
Selling volume has dried up. The retest near $83,600 printed equal lows instead of a new low. That is sellers losing steam, not buyers taking over.
Now the part that decides everything.
After a distribution breakdown, price often rallies back to the bottom of the old range and gets rejected there. For BTC that ceiling sits at $84,800 to $85,500.
Reclaim it and close back inside the box, and the breakdown starts to look like a shakeout, with $87K back in play.
Get rejected there, and the path toward the $80K to $81K demand zone reopens.
Lose $83,500 outright, and that trip happens faster.
A pause is not a reversal. Let the $85K test play out before picking a side.
Fortress holds and reclaims $85K, or one more leg down to $81K? 🔥
Not financial advice.
$BTC
$BNB
$ETH
The bleeding stopped. For now.
After the breakdown, BTC slid to about $83,500, bounced, came back to test the same spot, and held. Now it is pushing $84,466 on the 1H, up a quiet 0.47%.
The bigger picture on this chart is loud, though.
BTC built a clean accumulation box between $80K and $82K, broke out, and ripped to $87K.
Then it spent two days going sideways up there, and that range turned out to be distribution. Buyers exhausted, sellers quietly unloading.
The exit came with the heaviest red volume candle of the whole week.
What changed since then is the pace. 👀
Selling volume has dried up. The retest near $83,600 printed equal lows instead of a new low. That is sellers losing steam, not buyers taking over.
Now the part that decides everything.
After a distribution breakdown, price often rallies back to the bottom of the old range and gets rejected there. For BTC that ceiling sits at $84,800 to $85,500.
Reclaim it and close back inside the box, and the breakdown starts to look like a shakeout, with $87K back in play.
Get rejected there, and the path toward the $80K to $81K demand zone reopens.
Lose $83,500 outright, and that trip happens faster.
A pause is not a reversal. Let the $85K test play out before picking a side.
Fortress holds and reclaims $85K, or one more leg down to $81K? 🔥
Not financial advice.
$BTC
$BNB
$ETH
1
414
·
--
Bearish
🎄 Christmas Came Early for MUBARAK
And like every Christmas tree on a chart, it came with a trunk, a star on top, and a steep way back down.
The climb:
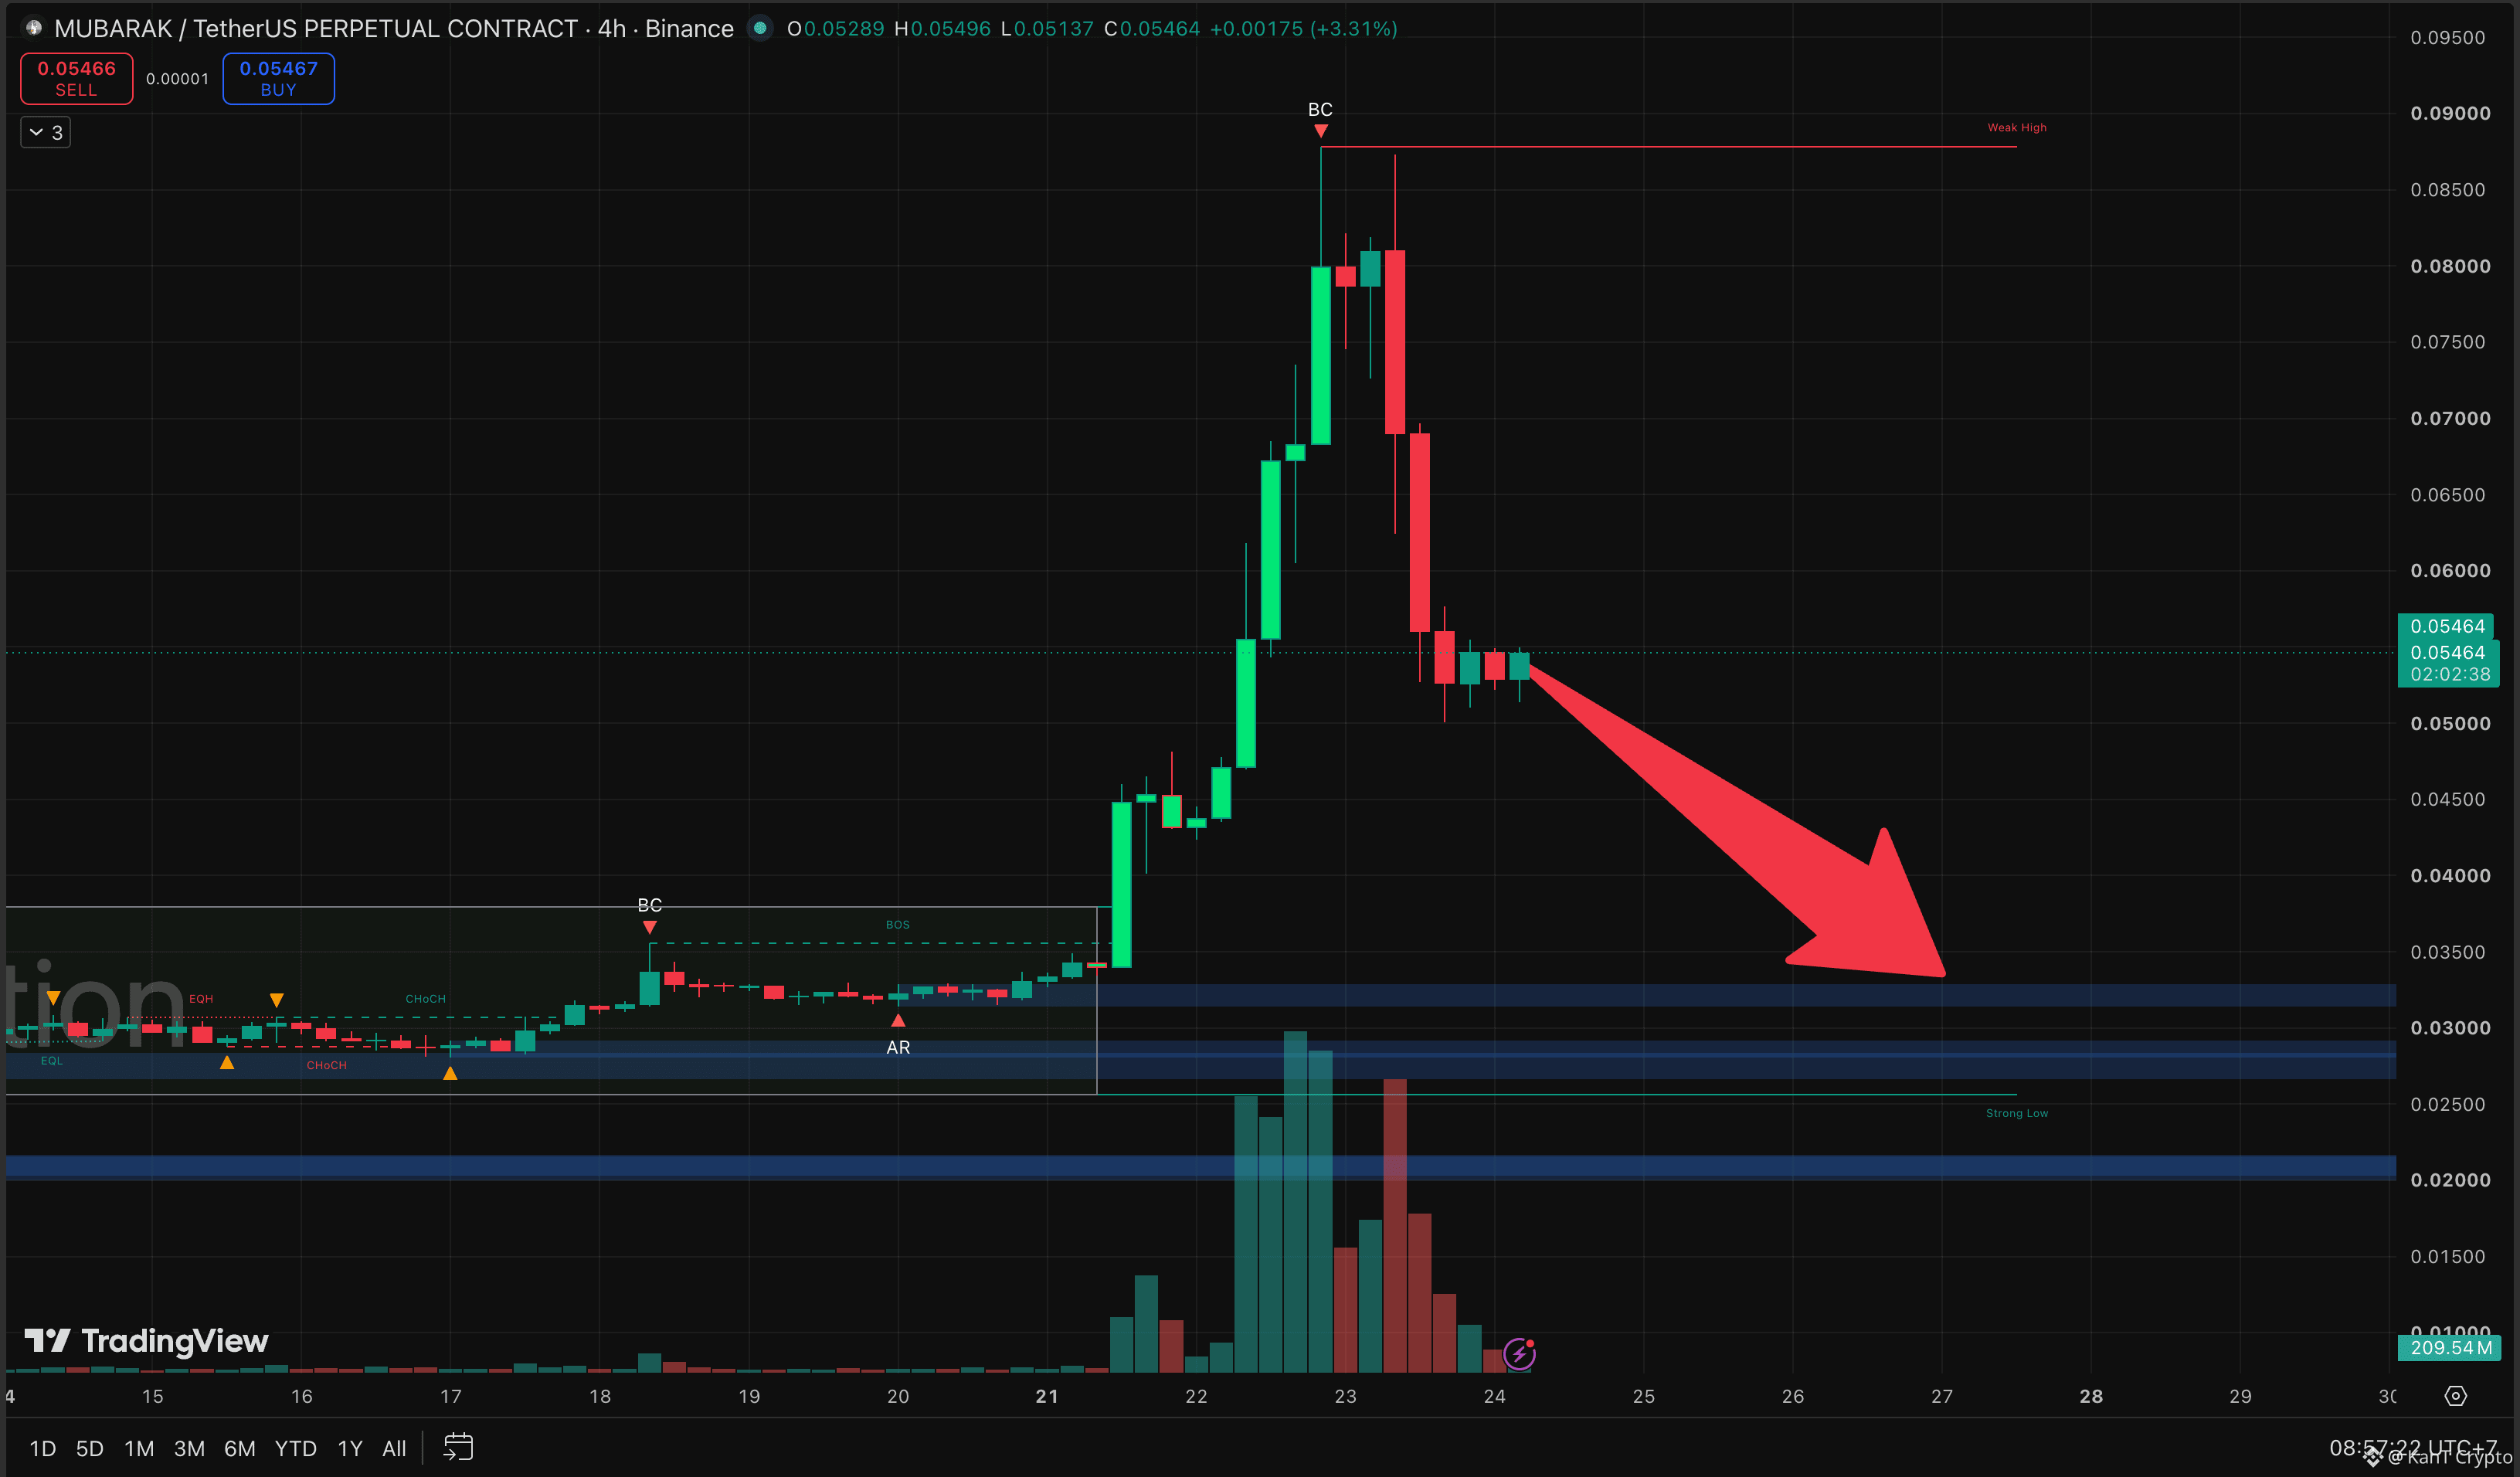
From a $0.033 base to a high near $0.0875.
Roughly +165% in about two days.
The drop:
Straight back to $0.050.
Around 40% erased from the top in a handful of candles.
That is the classic pine tree shape. A vertical pump on huge volume, a buying climax at the top (the moment the last eager buyers pile in and momentum dies), then an equally vertical dump as early buyers cash out. The red volume on the way down was almost as heavy as the green on the way up. That is distribution, not a dip.
Now price is sitting around $0.0546, trying to base while volume fades. 👀
This is where small caps get tricky. No news behind the move, thin order books, and a crowd that just watched the top get sold hard. Bounces here can be sharp, but they can also be exit liquidity for anyone still trapped above $0.07.
The levels that matter.
Hold $0.050 and this can chop sideways and cool off.
Lose it, and the chart points back toward the $0.031 to $0.033 zone, the base where this whole tree was planted.
Below that, $0.0255 is the strong low that must not break.
If you missed the pump, you do not need to catch the dump. Let it find a real floor first.
Base at $0.050, or the whole tree gets chopped back to $0.033? 🔥
Not financial advice.
$MUBARAK
{future}(MUBARAKUSDT)
$NIL
{future}(NILUSDT)
$TAKE
{future}(TAKEUSDT)
🎄 Christmas Came Early for MUBARAK
And like every Christmas tree on a chart, it came with a trunk, a star on top, and a steep way back down.
The climb:
From a $0.033 base to a high near $0.0875.
Roughly +165% in about two days.
The drop:
Straight back to $0.050.
Around 40% erased from the top in a handful of candles.
That is the classic pine tree shape. A vertical pump on huge volume, a buying climax at the top (the moment the last eager buyers pile in and momentum dies), then an equally vertical dump as early buyers cash out. The red volume on the way down was almost as heavy as the green on the way up. That is distribution, not a dip.
Now price is sitting around $0.0546, trying to base while volume fades. 👀
This is where small caps get tricky. No news behind the move, thin order books, and a crowd that just watched the top get sold hard. Bounces here can be sharp, but they can also be exit liquidity for anyone still trapped above $0.07.
The levels that matter.
Hold $0.050 and this can chop sideways and cool off.
Lose it, and the chart points back toward the $0.031 to $0.033 zone, the base where this whole tree was planted.
Below that, $0.0255 is the strong low that must not break.
If you missed the pump, you do not need to catch the dump. Let it find a real floor first.
Base at $0.050, or the whole tree gets chopped back to $0.033? 🔥
Not financial advice.
$MUBARAK
$NIL
$TAKE
And like every Christmas tree on a chart, it came with a trunk, a star on top, and a steep way back down.
The climb:
From a $0.033 base to a high near $0.0875.
Roughly +165% in about two days.
The drop:
Straight back to $0.050.
Around 40% erased from the top in a handful of candles.
That is the classic pine tree shape. A vertical pump on huge volume, a buying climax at the top (the moment the last eager buyers pile in and momentum dies), then an equally vertical dump as early buyers cash out. The red volume on the way down was almost as heavy as the green on the way up. That is distribution, not a dip.
Now price is sitting around $0.0546, trying to base while volume fades. 👀
This is where small caps get tricky. No news behind the move, thin order books, and a crowd that just watched the top get sold hard. Bounces here can be sharp, but they can also be exit liquidity for anyone still trapped above $0.07.
The levels that matter.
Hold $0.050 and this can chop sideways and cool off.
Lose it, and the chart points back toward the $0.031 to $0.033 zone, the base where this whole tree was planted.
Below that, $0.0255 is the strong low that must not break.
If you missed the pump, you do not need to catch the dump. Let it find a real floor first.
Base at $0.050, or the whole tree gets chopped back to $0.033? 🔥
Not financial advice.
$MUBARAK
$NIL
$TAKE
1
1k
·
--
Bullish
⚡ NIL Went Vertical. Now It's Catching Its Breath
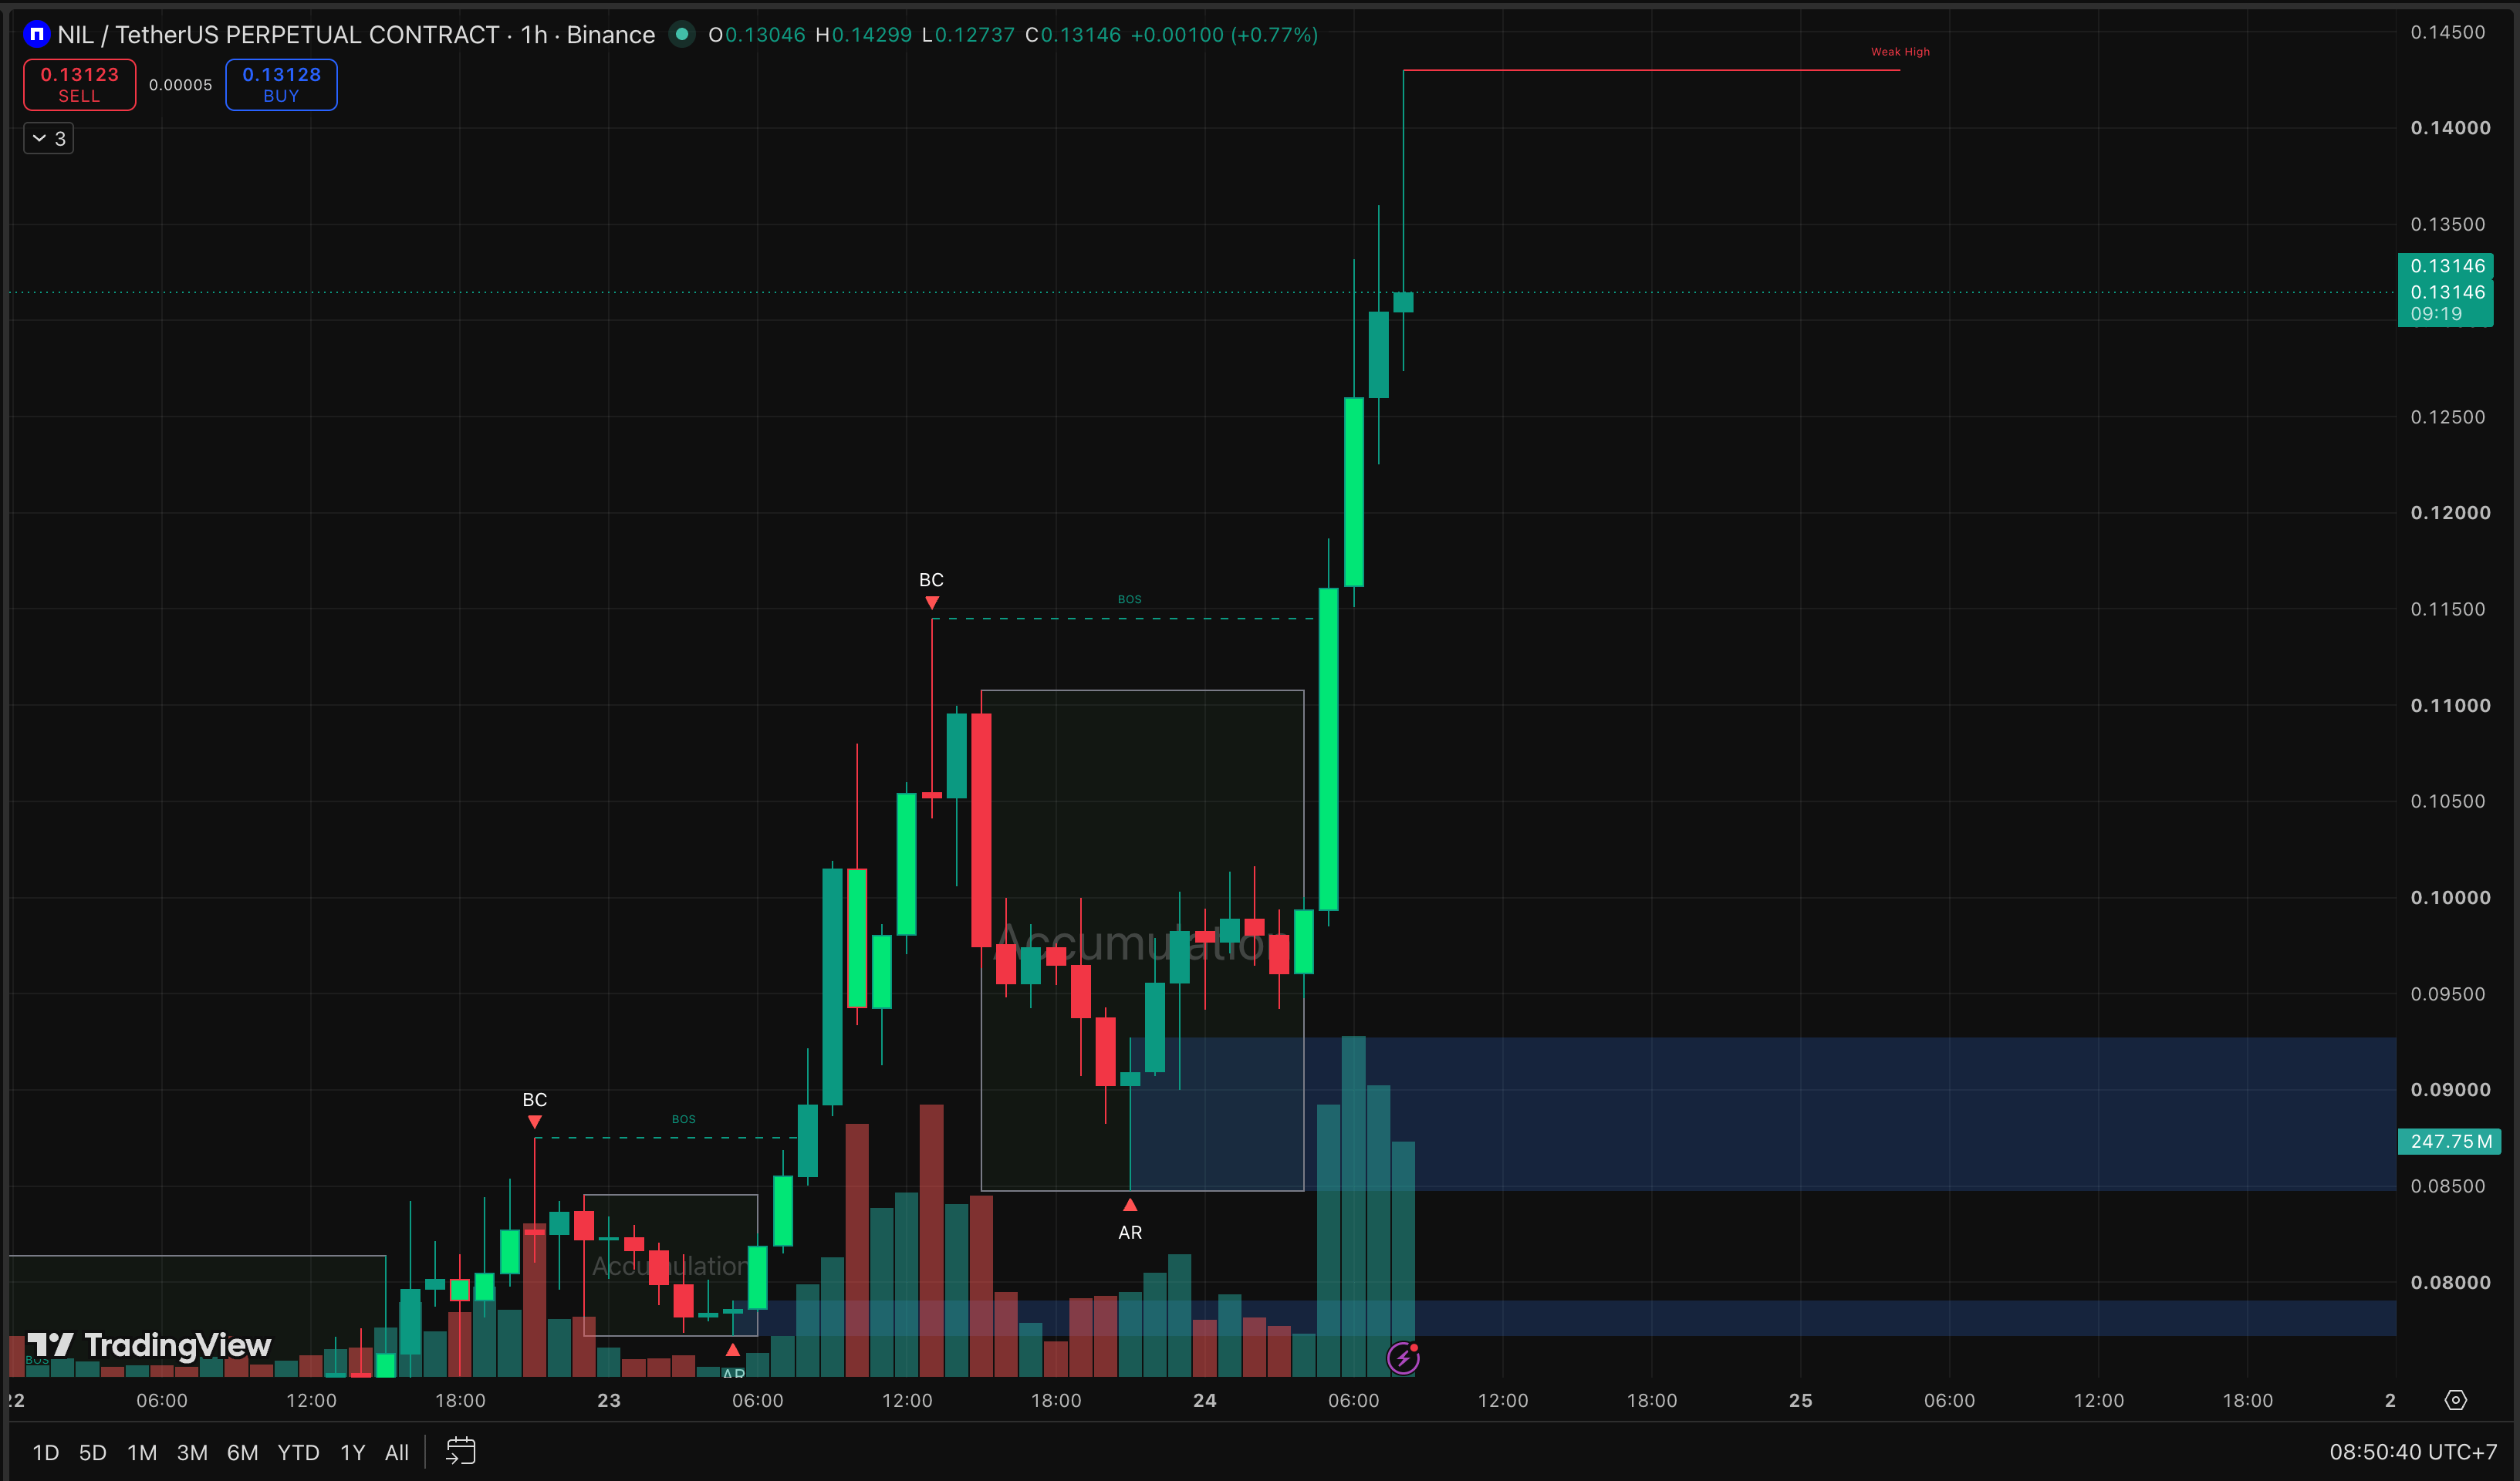
Nearly 50% in a day, and the chart looks like a rocket launch log.
From the $0.095 base to a high of $0.143.
Now sitting at $0.131.
For context, this coin was trading around $0.03 in early August. That is roughly 4x in under two months.
The structure is clean, for what it's worth.
Two accumulation boxes, two breaks of structure, then a straight vertical leg out of the second range. Buyers stepped in with the heaviest volume of the move right at the breakout.
But look at the top. 👀
A long wick into $0.143 and an immediate pullback. The chart even marks it a "weak high," a level buyers tagged but could not hold. That is the first sign the easy part of the rip is done.
And remember what NIL is. A small cap moving on its own speculative flow, no clear news behind it. That cuts both ways. Thin order books push price up fast, and they pull it down just as fast.
The levels that matter now.
Hold $0.115 to $0.125, the breakout zone, and this is a pause before another shot at $0.143.
Lose it, and $0.10, then the $0.085 to $0.093 demand box, come into play quickly.
Chasing a candle that already ran 50% is how you end up holding the top. If you want in, wait for the pullback to prove the floor.
Pause and reload, or the wick marks the top? 🔥
Not financial advice.
$NIL
{future}(NILUSDT)
$TAKE
{future}(TAKEUSDT)
$BNB
{future}(BNBUSDT)
⚡ NIL Went Vertical. Now It's Catching Its Breath
Nearly 50% in a day, and the chart looks like a rocket launch log.
From the $0.095 base to a high of $0.143.
Now sitting at $0.131.
For context, this coin was trading around $0.03 in early August. That is roughly 4x in under two months.
The structure is clean, for what it's worth.
Two accumulation boxes, two breaks of structure, then a straight vertical leg out of the second range. Buyers stepped in with the heaviest volume of the move right at the breakout.
But look at the top. 👀
A long wick into $0.143 and an immediate pullback. The chart even marks it a "weak high," a level buyers tagged but could not hold. That is the first sign the easy part of the rip is done.
And remember what NIL is. A small cap moving on its own speculative flow, no clear news behind it. That cuts both ways. Thin order books push price up fast, and they pull it down just as fast.
The levels that matter now.
Hold $0.115 to $0.125, the breakout zone, and this is a pause before another shot at $0.143.
Lose it, and $0.10, then the $0.085 to $0.093 demand box, come into play quickly.
Chasing a candle that already ran 50% is how you end up holding the top. If you want in, wait for the pullback to prove the floor.
Pause and reload, or the wick marks the top? 🔥
Not financial advice.
$NIL
$TAKE
$BNB
Nearly 50% in a day, and the chart looks like a rocket launch log.
From the $0.095 base to a high of $0.143.
Now sitting at $0.131.
For context, this coin was trading around $0.03 in early August. That is roughly 4x in under two months.
The structure is clean, for what it's worth.
Two accumulation boxes, two breaks of structure, then a straight vertical leg out of the second range. Buyers stepped in with the heaviest volume of the move right at the breakout.
But look at the top. 👀
A long wick into $0.143 and an immediate pullback. The chart even marks it a "weak high," a level buyers tagged but could not hold. That is the first sign the easy part of the rip is done.
And remember what NIL is. A small cap moving on its own speculative flow, no clear news behind it. That cuts both ways. Thin order books push price up fast, and they pull it down just as fast.
The levels that matter now.
Hold $0.115 to $0.125, the breakout zone, and this is a pause before another shot at $0.143.
Lose it, and $0.10, then the $0.085 to $0.093 demand box, come into play quickly.
Chasing a candle that already ran 50% is how you end up holding the top. If you want in, wait for the pullback to prove the floor.
Pause and reload, or the wick marks the top? 🔥
Not financial advice.
$NIL
$TAKE
$BNB
1
776
·
--
Bullish
Partly True
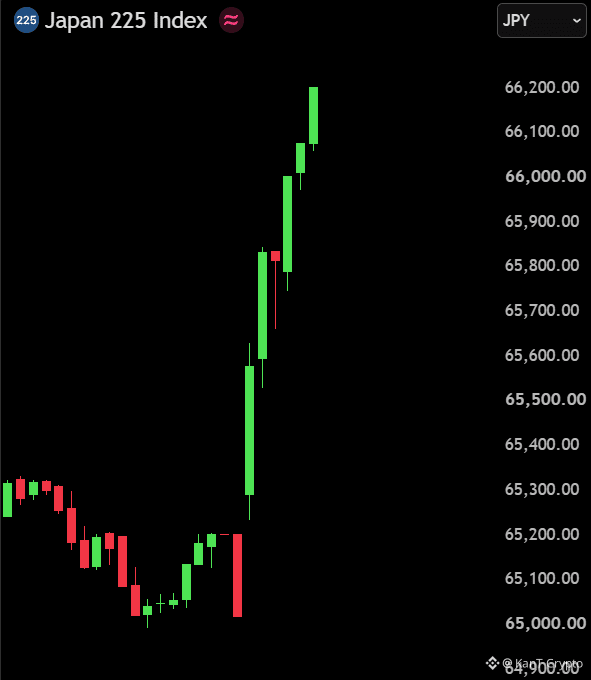
📈 BREAKING: 🇯🇵 Japan Stocks Rip +1.8% as Tokyo Returns From Holiday
Nikkei 225 jumps to around 66,200.
Roughly ¥21 trillion ($135B) reportedly added to Japanese stocks in a single session.
The fuel is chips again.
Friday's rebound was led by Advantest, Lasertec and the semiconductor bloc, and that bid came right back after the long weekend.
It also landed just days after the Bank of Japan hiked rates to 1.25%. Markets absorbed the hike without panic, and that is the part worth noticing.
Still not a record, though.
The June all-time high sits above, and September opened near these exact levels before sliding to 63,484. This is a recovery, not a breakout yet.
For crypto, Japan matters more than most think. A calm BOJ means a calm yen carry trade, the cheap-yen borrowing that funds risk bets worldwide. When it unwinds, Bitcoin feels it first. Right now it is quiet.
Watch the yen and any fresh BOJ tightening hints next.
Not financial advice.
$BTC
{future}(BTCUSDT)
$ETH
{future}(ETHUSDT)
$BNB
{future}(BNBUSDT)
📈 BREAKING: 🇯🇵 Japan Stocks Rip +1.8% as Tokyo Returns From Holiday
Nikkei 225 jumps to around 66,200.
Roughly ¥21 trillion ($135B) reportedly added to Japanese stocks in a single session.
The fuel is chips again.
Friday's rebound was led by Advantest, Lasertec and the semiconductor bloc, and that bid came right back after the long weekend.
It also landed just days after the Bank of Japan hiked rates to 1.25%. Markets absorbed the hike without panic, and that is the part worth noticing.
Still not a record, though.
The June all-time high sits above, and September opened near these exact levels before sliding to 63,484. This is a recovery, not a breakout yet.
For crypto, Japan matters more than most think. A calm BOJ means a calm yen carry trade, the cheap-yen borrowing that funds risk bets worldwide. When it unwinds, Bitcoin feels it first. Right now it is quiet.
Watch the yen and any fresh BOJ tightening hints next.
Not financial advice.
$BTC
$ETH
$BNB
Nikkei 225 jumps to around 66,200.
Roughly ¥21 trillion ($135B) reportedly added to Japanese stocks in a single session.
The fuel is chips again.
Friday's rebound was led by Advantest, Lasertec and the semiconductor bloc, and that bid came right back after the long weekend.
It also landed just days after the Bank of Japan hiked rates to 1.25%. Markets absorbed the hike without panic, and that is the part worth noticing.
Still not a record, though.
The June all-time high sits above, and September opened near these exact levels before sliding to 63,484. This is a recovery, not a breakout yet.
For crypto, Japan matters more than most think. A calm BOJ means a calm yen carry trade, the cheap-yen borrowing that funds risk bets worldwide. When it unwinds, Bitcoin feels it first. Right now it is quiet.
Watch the yen and any fresh BOJ tightening hints next.
Not financial advice.
$BTC
$ETH
$BNB
1
164
·
--
Bearish
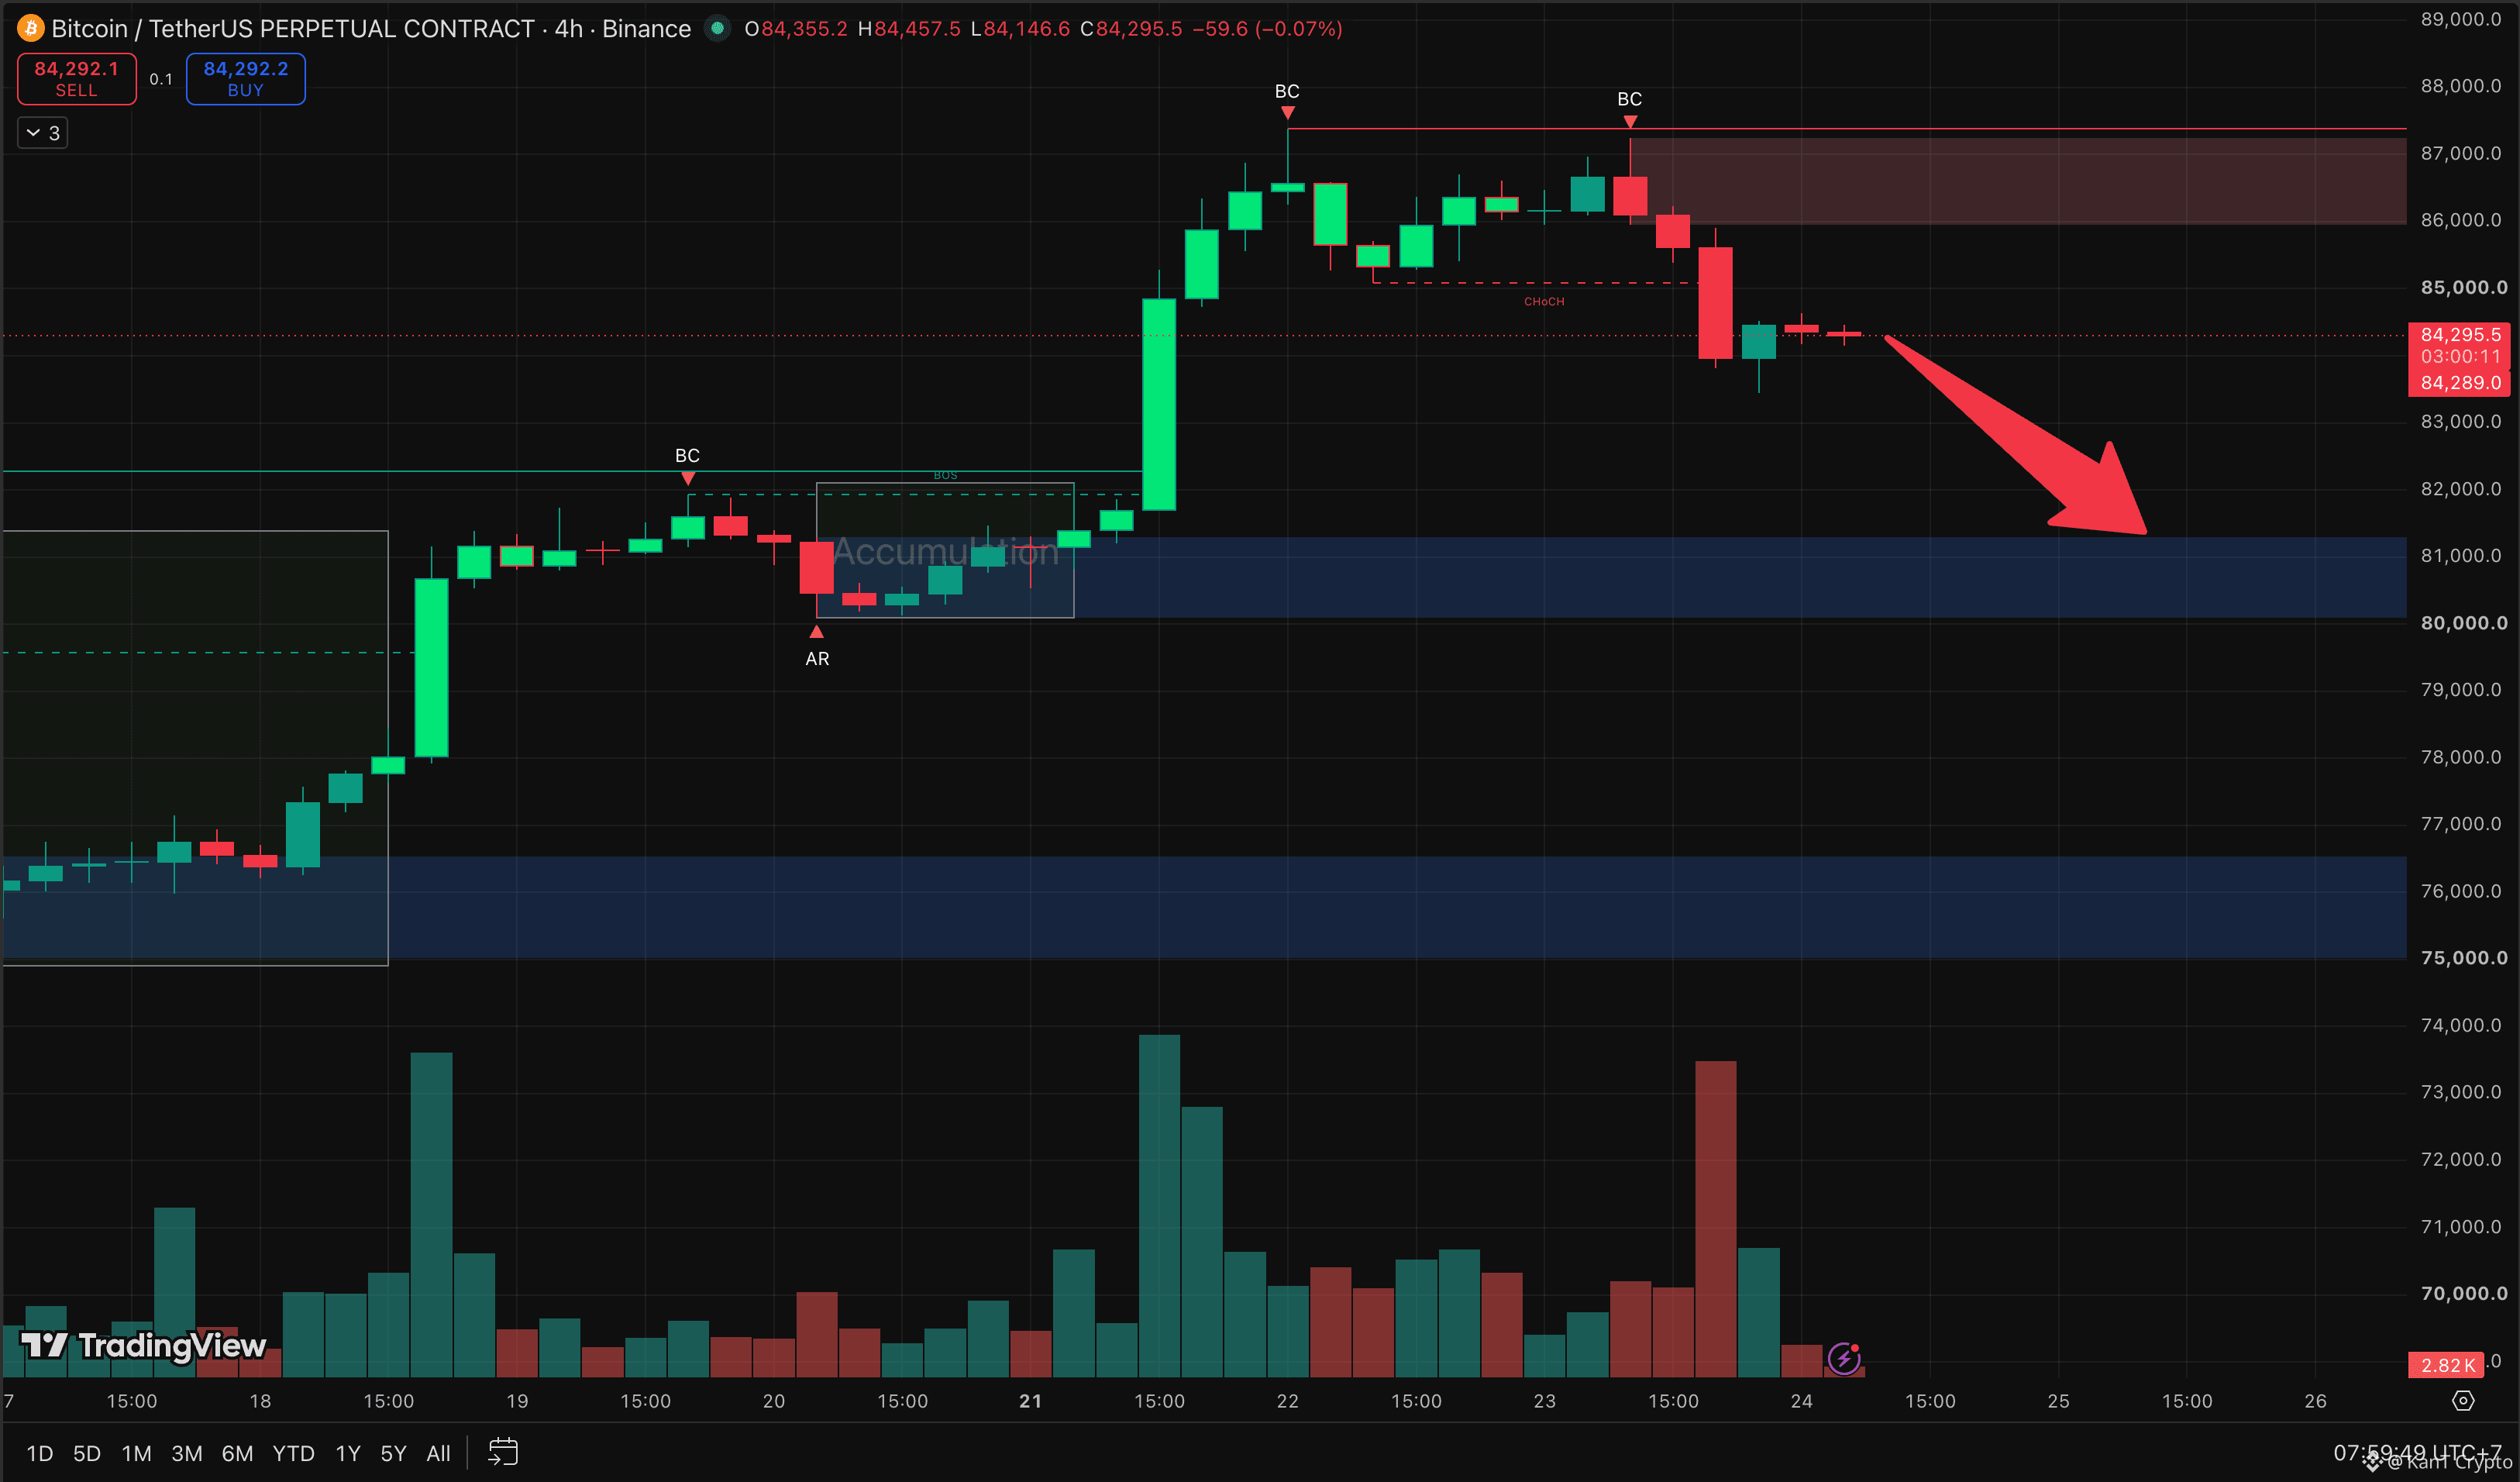
📉 Bitcoin Couldn't Hold $86K. Next Stop, $81K?
Two swings at $87K. Two rejections.
BTC printed a pair of buying climaxes near $87,300 on the 4H, basically a double top, and the $86K to $87K band turned into a brick ceiling.
Then the floor cracked.
Price broke the $85K swing low, a change of character (CHoCH) that flips the short-term trend from up to down.
The candle that did it carried the heaviest sell volume of the week. That is not random drift. That is someone hitting the exit.
Now BTC sits at $84,295, pausing, but the path of least resistance points lower. 👀
The magnet below is the $80K to $81K zone.
That is the base BTC built before the breakout, the exact range it ripped out of on the way up. Old resistance, now support. If price revisits it, that is where buyers should step in with size.
A pullback after an 8-month high is not the end of the move, though. It is the market testing whether the breakout was real.
Hold $80K to $81K and this is just a retest before another run at $87K.
Lose it cleanly, and the next real shelf sits way down at $75K to $76K.
No need to catch the knife on the way down. Let price reach the zone and show a reaction before trusting any bounce.
Retest and reload at $81K, or the breakout fails completely? 🔥
Not financial advice.
$BTC
{future}(BTCUSDT)
$ETH
{future}(ETHUSDT)
$BNB
{future}(BNBUSDT)
📉 Bitcoin Couldn't Hold $86K. Next Stop, $81K?
Two swings at $87K. Two rejections.
BTC printed a pair of buying climaxes near $87,300 on the 4H, basically a double top, and the $86K to $87K band turned into a brick ceiling.
Then the floor cracked.
Price broke the $85K swing low, a change of character (CHoCH) that flips the short-term trend from up to down.
The candle that did it carried the heaviest sell volume of the week. That is not random drift. That is someone hitting the exit.
Now BTC sits at $84,295, pausing, but the path of least resistance points lower. 👀
The magnet below is the $80K to $81K zone.
That is the base BTC built before the breakout, the exact range it ripped out of on the way up. Old resistance, now support. If price revisits it, that is where buyers should step in with size.
A pullback after an 8-month high is not the end of the move, though. It is the market testing whether the breakout was real.
Hold $80K to $81K and this is just a retest before another run at $87K.
Lose it cleanly, and the next real shelf sits way down at $75K to $76K.
No need to catch the knife on the way down. Let price reach the zone and show a reaction before trusting any bounce.
Retest and reload at $81K, or the breakout fails completely? 🔥
Not financial advice.
$BTC
$ETH
$BNB
Two swings at $87K. Two rejections.
BTC printed a pair of buying climaxes near $87,300 on the 4H, basically a double top, and the $86K to $87K band turned into a brick ceiling.
Then the floor cracked.
Price broke the $85K swing low, a change of character (CHoCH) that flips the short-term trend from up to down.
The candle that did it carried the heaviest sell volume of the week. That is not random drift. That is someone hitting the exit.
Now BTC sits at $84,295, pausing, but the path of least resistance points lower. 👀
The magnet below is the $80K to $81K zone.
That is the base BTC built before the breakout, the exact range it ripped out of on the way up. Old resistance, now support. If price revisits it, that is where buyers should step in with size.
A pullback after an 8-month high is not the end of the move, though. It is the market testing whether the breakout was real.
Hold $80K to $81K and this is just a retest before another run at $87K.
Lose it cleanly, and the next real shelf sits way down at $75K to $76K.
No need to catch the knife on the way down. Let price reach the zone and show a reaction before trusting any bounce.
Retest and reload at $81K, or the breakout fails completely? 🔥
Not financial advice.
$BTC
$ETH
$BNB
1
1.3k
·
--
Bullish
📊 Bitcoin Just Did Something Bear Markets Never Do
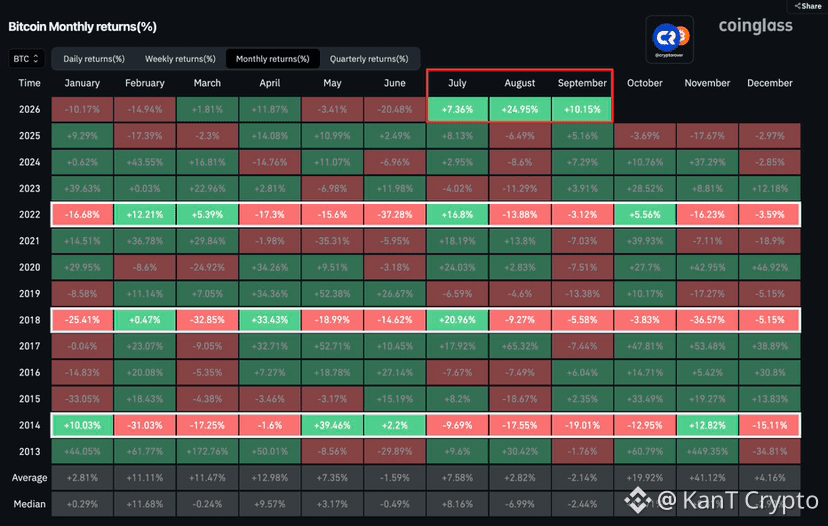
Three green months in a row.
July: +7.36%
August: +24.95%
September: +10.15% (so far)
Now look at the last three bear years on the chart. 2014, 2018, 2022.
Not one of them strung together three straight green months. The best they managed was two before the floor gave out again.
And September is the kicker. 👀
Historically it is Bitcoin's worst month, with an average of -2.14% and a median of -2.44%. This year it is running double digits green. A market fighting its own seasonality is a market with real demand behind it.
So is this the bull market?
Slow down one step. September has not closed yet, and a week of red candles can still erase the streak. 2026 also opened brutal: January -10%, February -15%, June -20%. One strong quarter does not delete that damage, it starts repairing it.
What history does say is that Q4 is usually where Bitcoin does its heavy lifting. October carries a median of +14.71%. November's +41% average looks wild, but a single 2013 month (+449%) inflates it, so the +8.81% median is the fairer read.
The setup is strong. The confirmation is the monthly close.
Close September green and the streak becomes a real signal.
Lose the month and it goes back to being a bounce.
Streak confirmed, or September's curse strikes late? 🔥
Not financial advice.
$BTC
{future}(BTCUSDT)
$BNB
{future}(BNBUSDT)
$ETH
{future}(ETHUSDT)
📊 Bitcoin Just Did Something Bear Markets Never Do
Three green months in a row.
July: +7.36%
August: +24.95%
September: +10.15% (so far)
Now look at the last three bear years on the chart. 2014, 2018, 2022.
Not one of them strung together three straight green months. The best they managed was two before the floor gave out again.
And September is the kicker. 👀
Historically it is Bitcoin's worst month, with an average of -2.14% and a median of -2.44%. This year it is running double digits green. A market fighting its own seasonality is a market with real demand behind it.
So is this the bull market?
Slow down one step. September has not closed yet, and a week of red candles can still erase the streak. 2026 also opened brutal: January -10%, February -15%, June -20%. One strong quarter does not delete that damage, it starts repairing it.
What history does say is that Q4 is usually where Bitcoin does its heavy lifting. October carries a median of +14.71%. November's +41% average looks wild, but a single 2013 month (+449%) inflates it, so the +8.81% median is the fairer read.
The setup is strong. The confirmation is the monthly close.
Close September green and the streak becomes a real signal.
Lose the month and it goes back to being a bounce.
Streak confirmed, or September's curse strikes late? 🔥
Not financial advice.
$BTC
$BNB
$ETH
Three green months in a row.
July: +7.36%
August: +24.95%
September: +10.15% (so far)
Now look at the last three bear years on the chart. 2014, 2018, 2022.
Not one of them strung together three straight green months. The best they managed was two before the floor gave out again.
And September is the kicker. 👀
Historically it is Bitcoin's worst month, with an average of -2.14% and a median of -2.44%. This year it is running double digits green. A market fighting its own seasonality is a market with real demand behind it.
So is this the bull market?
Slow down one step. September has not closed yet, and a week of red candles can still erase the streak. 2026 also opened brutal: January -10%, February -15%, June -20%. One strong quarter does not delete that damage, it starts repairing it.
What history does say is that Q4 is usually where Bitcoin does its heavy lifting. October carries a median of +14.71%. November's +41% average looks wild, but a single 2013 month (+449%) inflates it, so the +8.81% median is the fairer read.
The setup is strong. The confirmation is the monthly close.
Close September green and the streak becomes a real signal.
Lose the month and it goes back to being a bounce.
Streak confirmed, or September's curse strikes late? 🔥
Not financial advice.
$BTC
$BNB
$ETH
2
1.6k
·
--
Bullish
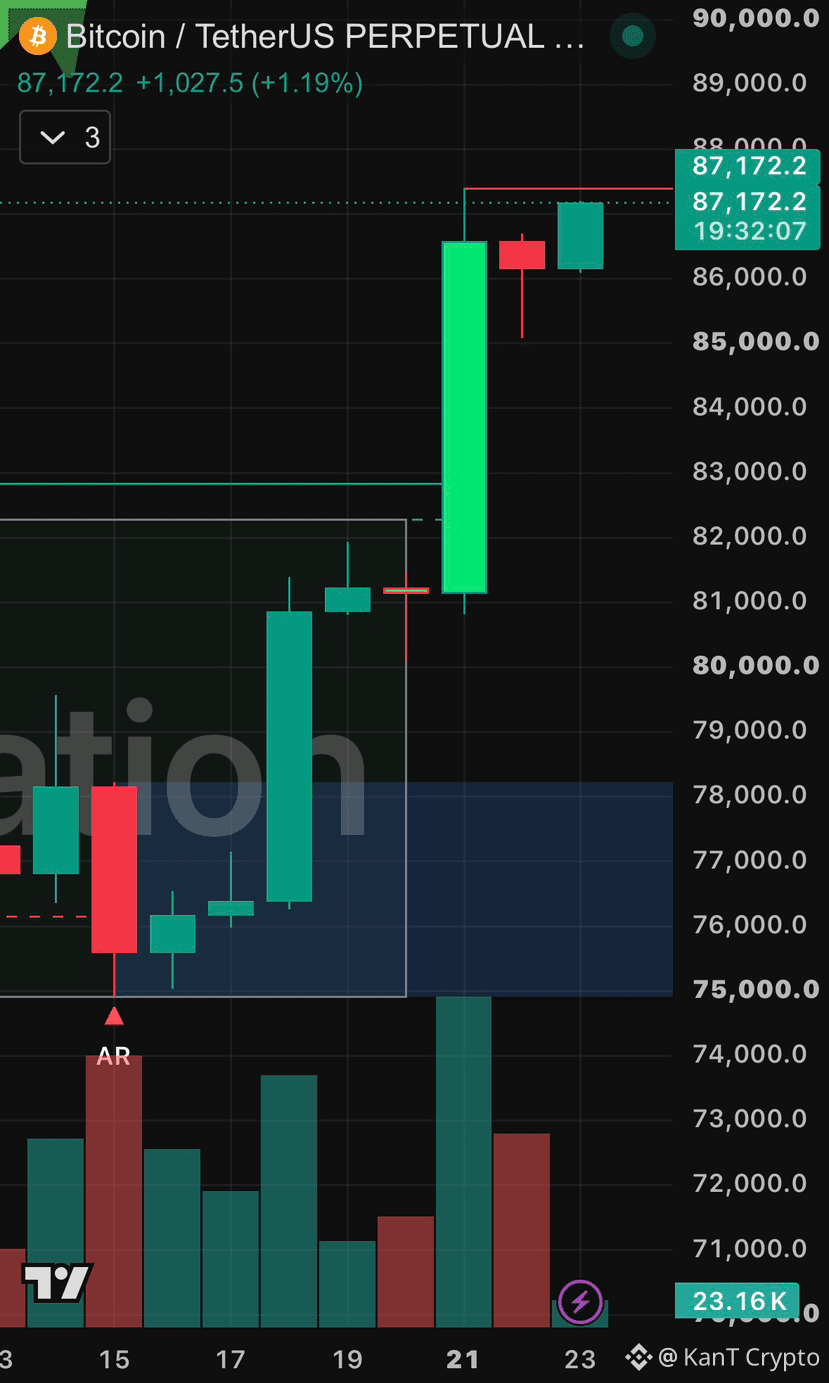
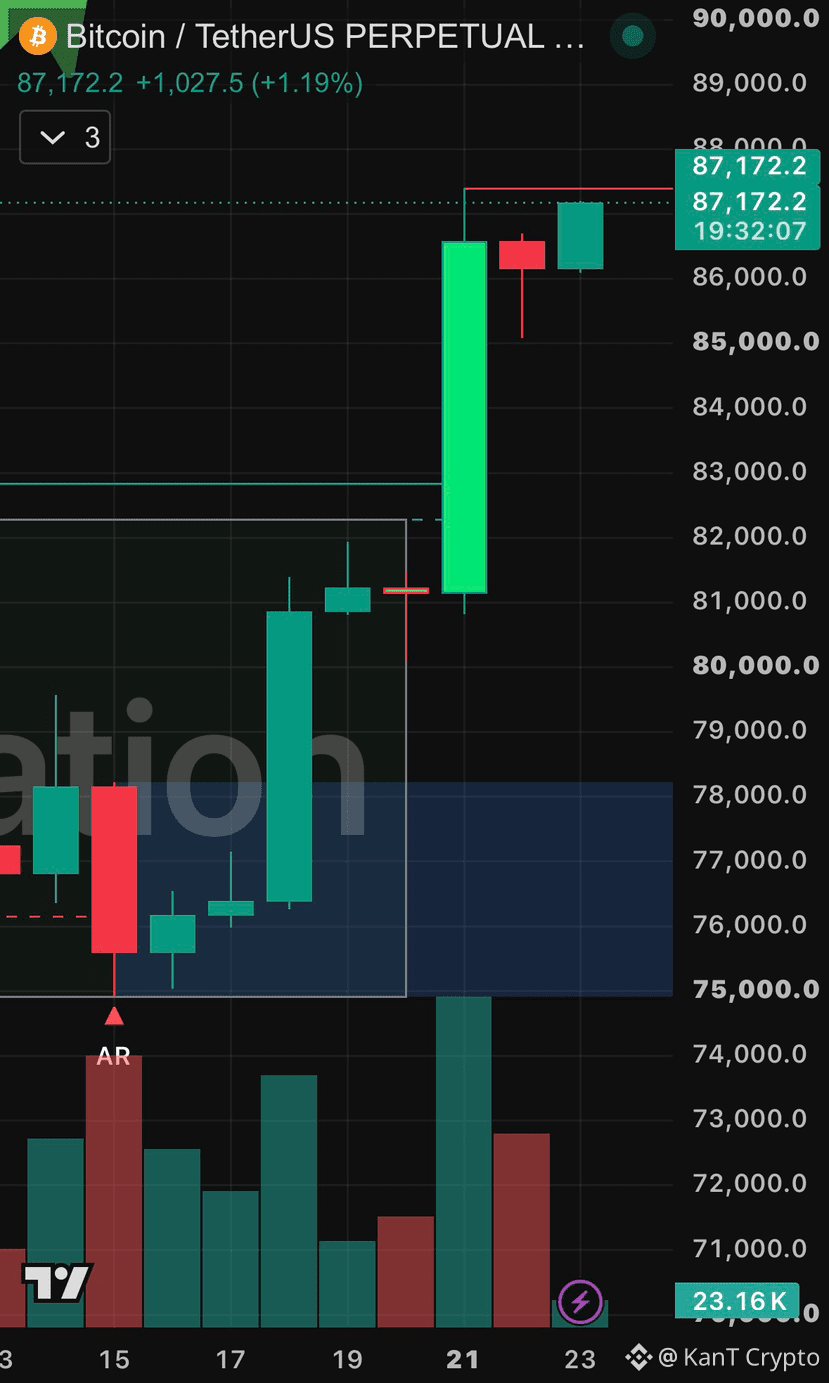
JUST IN: Bitcoin reclaims $87,000
$BTC
{future}(BTCUSDT)
$BNB
{future}(BNBUSDT)
$ETH
{future}(ETHUSDT)
JUST IN: Bitcoin reclaims $87,000
$BTC
$BNB
$ETH
$BTC
$BNB
$ETH
1
365
·
--
Bullish
Verified
📈 BREAKING: 🇨🇦 Canada's Biggest Banks Are Putting Money on the Blockchain
All six of Canada's largest banks just teamed up to test tokenized deposits, and it is a bigger signal for crypto than the headline suggests.
BMO, CIBC, National Bank, RBC, Scotiabank, and TD announced a joint project to move Canadian-dollar deposits on a shared blockchain. The first phase is narrow: transferring these tokens between the banks themselves to speed up settlement. Round-the-clock programmable payments are the long-term goal, not day one. The banks call it exploratory, and no one has committed to a full launch yet.
Here is the part that actually matters, and where most people get confused. A tokenized deposit is not a stablecoin. It is real money already sitting in your bank account, represented as a digital token on a ledger. It stays a bank liability inside the regulated system. A stablecoin is a separate token issued by a crypto company and backed by its own reserves. Same technology underneath, very different risk and oversight.
Why this is bullish for the broader space is simple. It is validation of the rails. The same blockchain settlement that crypto has argued for over years is now being adopted by the most conservative institutions in finance. This is part of a global wave, JPMorgan already runs a deposit token, US banks are building a shared network, and Swift is testing cross-border versions.
The nuance to hold onto: this is banks using blockchain for their own efficiency, not banks buying Bitcoin. It grows the ecosystem and normalizes the tech, but it is not direct demand for crypto assets.
What to watch is whether this moves from pilot to real product, and whether it eventually connects to public networks.
Not financial advice.
$BTC
{future}(BTCUSDT)
$ETH
{future}(ETHUSDT)
$BNB
{future}(BNBUSDT)
📈 BREAKING: 🇨🇦 Canada's Biggest Banks Are Putting Money on the Blockchain
All six of Canada's largest banks just teamed up to test tokenized deposits, and it is a bigger signal for crypto than the headline suggests.
BMO, CIBC, National Bank, RBC, Scotiabank, and TD announced a joint project to move Canadian-dollar deposits on a shared blockchain. The first phase is narrow: transferring these tokens between the banks themselves to speed up settlement. Round-the-clock programmable payments are the long-term goal, not day one. The banks call it exploratory, and no one has committed to a full launch yet.
Here is the part that actually matters, and where most people get confused. A tokenized deposit is not a stablecoin. It is real money already sitting in your bank account, represented as a digital token on a ledger. It stays a bank liability inside the regulated system. A stablecoin is a separate token issued by a crypto company and backed by its own reserves. Same technology underneath, very different risk and oversight.
Why this is bullish for the broader space is simple. It is validation of the rails. The same blockchain settlement that crypto has argued for over years is now being adopted by the most conservative institutions in finance. This is part of a global wave, JPMorgan already runs a deposit token, US banks are building a shared network, and Swift is testing cross-border versions.
The nuance to hold onto: this is banks using blockchain for their own efficiency, not banks buying Bitcoin. It grows the ecosystem and normalizes the tech, but it is not direct demand for crypto assets.
What to watch is whether this moves from pilot to real product, and whether it eventually connects to public networks.
Not financial advice.
$BTC
$ETH
$BNB
All six of Canada's largest banks just teamed up to test tokenized deposits, and it is a bigger signal for crypto than the headline suggests.
BMO, CIBC, National Bank, RBC, Scotiabank, and TD announced a joint project to move Canadian-dollar deposits on a shared blockchain. The first phase is narrow: transferring these tokens between the banks themselves to speed up settlement. Round-the-clock programmable payments are the long-term goal, not day one. The banks call it exploratory, and no one has committed to a full launch yet.
Here is the part that actually matters, and where most people get confused. A tokenized deposit is not a stablecoin. It is real money already sitting in your bank account, represented as a digital token on a ledger. It stays a bank liability inside the regulated system. A stablecoin is a separate token issued by a crypto company and backed by its own reserves. Same technology underneath, very different risk and oversight.
Why this is bullish for the broader space is simple. It is validation of the rails. The same blockchain settlement that crypto has argued for over years is now being adopted by the most conservative institutions in finance. This is part of a global wave, JPMorgan already runs a deposit token, US banks are building a shared network, and Swift is testing cross-border versions.
The nuance to hold onto: this is banks using blockchain for their own efficiency, not banks buying Bitcoin. It grows the ecosystem and normalizes the tech, but it is not direct demand for crypto assets.
What to watch is whether this moves from pilot to real product, and whether it eventually connects to public networks.
Not financial advice.
$BTC
$ETH
$BNB


1
1.1k
·
--
Bullish
Verified
⚠️ BREAKING: 🇺🇸 Trump Floats a US Diesel Export Ban as Prices Hit Records
Diesel just hit an all-time high of $6.51 a gallon, roughly 75% above pre-war levels, and Washington is now talking about a drastic fix.
President Trump said he is considering a ban on US diesel exports, siding with lawmakers who want to keep the fuel at home. In his words, "Let's not send out the diesel." His Treasury Secretary walked it back slightly, saying the administration is still studying whether a ban is even feasible. So this is a strong signal, not a done deal.
Why diesel is spiking matters. This is a supply shock. Ukrainian drone strikes have knocked out major Russian refining capacity, and Russia responded by restricting its own diesel exports. Two of the world's biggest suppliers pulling back at once sent prices vertical.
Here is the honest catch most headlines skip. A US export ban might not even lower prices at the pump. US fuel prices track global benchmarks, not just domestic supply. Cut exports and prices could fall in Texas but spike on the East Coast, which imports much of its fuel. Several energy analysts warn the move could backfire and lift global prices instead.
The crypto angle is simple here. Diesel moves the real economy, so record diesel keeps inflation sticky. Sticky inflation makes it harder for the Fed to cut rates, and tighter policy pressures risk assets like Bitcoin. This is a headwind worth tracking, not a reason to panic.
What to watch is whether the ban moves from talk to policy, and whether Russia extends its own restrictions past month-end.
Energy shocks feed inflation, and inflation drives the Fed. Keep risk tight while this plays out.
Not financial advice.
$CL
{future}(CLUSDT)
$BZ
{future}(BZUSDT)
$NATGAS
{future}(NATGASUSDT)
⚠️ BREAKING: 🇺🇸 Trump Floats a US Diesel Export Ban as Prices Hit Records
Diesel just hit an all-time high of $6.51 a gallon, roughly 75% above pre-war levels, and Washington is now talking about a drastic fix.
President Trump said he is considering a ban on US diesel exports, siding with lawmakers who want to keep the fuel at home. In his words, "Let's not send out the diesel." His Treasury Secretary walked it back slightly, saying the administration is still studying whether a ban is even feasible. So this is a strong signal, not a done deal.
Why diesel is spiking matters. This is a supply shock. Ukrainian drone strikes have knocked out major Russian refining capacity, and Russia responded by restricting its own diesel exports. Two of the world's biggest suppliers pulling back at once sent prices vertical.
Here is the honest catch most headlines skip. A US export ban might not even lower prices at the pump. US fuel prices track global benchmarks, not just domestic supply. Cut exports and prices could fall in Texas but spike on the East Coast, which imports much of its fuel. Several energy analysts warn the move could backfire and lift global prices instead.
The crypto angle is simple here. Diesel moves the real economy, so record diesel keeps inflation sticky. Sticky inflation makes it harder for the Fed to cut rates, and tighter policy pressures risk assets like Bitcoin. This is a headwind worth tracking, not a reason to panic.
What to watch is whether the ban moves from talk to policy, and whether Russia extends its own restrictions past month-end.
Energy shocks feed inflation, and inflation drives the Fed. Keep risk tight while this plays out.
Not financial advice.
$CL
$BZ
$NATGAS
Diesel just hit an all-time high of $6.51 a gallon, roughly 75% above pre-war levels, and Washington is now talking about a drastic fix.
President Trump said he is considering a ban on US diesel exports, siding with lawmakers who want to keep the fuel at home. In his words, "Let's not send out the diesel." His Treasury Secretary walked it back slightly, saying the administration is still studying whether a ban is even feasible. So this is a strong signal, not a done deal.
Why diesel is spiking matters. This is a supply shock. Ukrainian drone strikes have knocked out major Russian refining capacity, and Russia responded by restricting its own diesel exports. Two of the world's biggest suppliers pulling back at once sent prices vertical.
Here is the honest catch most headlines skip. A US export ban might not even lower prices at the pump. US fuel prices track global benchmarks, not just domestic supply. Cut exports and prices could fall in Texas but spike on the East Coast, which imports much of its fuel. Several energy analysts warn the move could backfire and lift global prices instead.
The crypto angle is simple here. Diesel moves the real economy, so record diesel keeps inflation sticky. Sticky inflation makes it harder for the Fed to cut rates, and tighter policy pressures risk assets like Bitcoin. This is a headwind worth tracking, not a reason to panic.
What to watch is whether the ban moves from talk to policy, and whether Russia extends its own restrictions past month-end.
Energy shocks feed inflation, and inflation drives the Fed. Keep risk tight while this plays out.
Not financial advice.
$CL
$BZ
$NATGAS

1
835
·
--
Bearish
Verified
⚠️ CRASH: 🛢️ Oil Just Dropped Off a Cliff
Crude fell about 3% in a single hour, slicing straight through $91 to hit $90.30. When a market moves this fast, it usually means one story just broke.
That story is the war premium leaving oil. For weeks, crude traded higher on fear that Middle East conflict would choke off supply. That fear is now unwinding fast, and three things hit at once.
First, diplomacy. Trump signaled he is open to meeting Iran's president at the UN this week, raising real hopes of a ceasefire. Fear of escalation was holding a premium in the price, and that premium is deflating.
Second, supply came back faster than expected. US Central Command says oil flows through the Strait of Hormuz just hit a six-month high with the shipping lanes cleared of mines, even with a Saudi pipeline still down. The market feared a shortage that has not materialized.
Third, the demand side is soft. US inventories posted a surprise build of over 7 million barrels, meaning more oil is sitting unused, while Chinese buying stayed weak. More supply, less demand, lower price.
Now the crypto link, kept short. Cheaper oil cools inflation pressure, which eases the case for more rate hikes, which loosens financial conditions. That is a tailwind for risk assets like Bitcoin, and it is part of why crypto has stayed strong even through a hawkish Fed.
What to watch is whether this holds. A collapsing war premium can reverse violently on a single fresh headline. One new strike or a broken pipeline, and the premium snaps right back in.
A move this sharp cuts both ways, so respect the volatility rather than chasing it.
Not financial advice.
$CL
{future}(CLUSDT)
$BZ
{future}(BZUSDT)
$NATGAS
{future}(NATGASUSDT)
⚠️ CRASH: 🛢️ Oil Just Dropped Off a Cliff
Crude fell about 3% in a single hour, slicing straight through $91 to hit $90.30. When a market moves this fast, it usually means one story just broke.
That story is the war premium leaving oil. For weeks, crude traded higher on fear that Middle East conflict would choke off supply. That fear is now unwinding fast, and three things hit at once.
First, diplomacy. Trump signaled he is open to meeting Iran's president at the UN this week, raising real hopes of a ceasefire. Fear of escalation was holding a premium in the price, and that premium is deflating.
Second, supply came back faster than expected. US Central Command says oil flows through the Strait of Hormuz just hit a six-month high with the shipping lanes cleared of mines, even with a Saudi pipeline still down. The market feared a shortage that has not materialized.
Third, the demand side is soft. US inventories posted a surprise build of over 7 million barrels, meaning more oil is sitting unused, while Chinese buying stayed weak. More supply, less demand, lower price.
Now the crypto link, kept short. Cheaper oil cools inflation pressure, which eases the case for more rate hikes, which loosens financial conditions. That is a tailwind for risk assets like Bitcoin, and it is part of why crypto has stayed strong even through a hawkish Fed.
What to watch is whether this holds. A collapsing war premium can reverse violently on a single fresh headline. One new strike or a broken pipeline, and the premium snaps right back in.
A move this sharp cuts both ways, so respect the volatility rather than chasing it.
Not financial advice.
$CL
$BZ
$NATGAS
Crude fell about 3% in a single hour, slicing straight through $91 to hit $90.30. When a market moves this fast, it usually means one story just broke.
That story is the war premium leaving oil. For weeks, crude traded higher on fear that Middle East conflict would choke off supply. That fear is now unwinding fast, and three things hit at once.
First, diplomacy. Trump signaled he is open to meeting Iran's president at the UN this week, raising real hopes of a ceasefire. Fear of escalation was holding a premium in the price, and that premium is deflating.
Second, supply came back faster than expected. US Central Command says oil flows through the Strait of Hormuz just hit a six-month high with the shipping lanes cleared of mines, even with a Saudi pipeline still down. The market feared a shortage that has not materialized.
Third, the demand side is soft. US inventories posted a surprise build of over 7 million barrels, meaning more oil is sitting unused, while Chinese buying stayed weak. More supply, less demand, lower price.
Now the crypto link, kept short. Cheaper oil cools inflation pressure, which eases the case for more rate hikes, which loosens financial conditions. That is a tailwind for risk assets like Bitcoin, and it is part of why crypto has stayed strong even through a hawkish Fed.
What to watch is whether this holds. A collapsing war premium can reverse violently on a single fresh headline. One new strike or a broken pipeline, and the premium snaps right back in.
A move this sharp cuts both ways, so respect the volatility rather than chasing it.
Not financial advice.
$CL
$BZ
$NATGAS
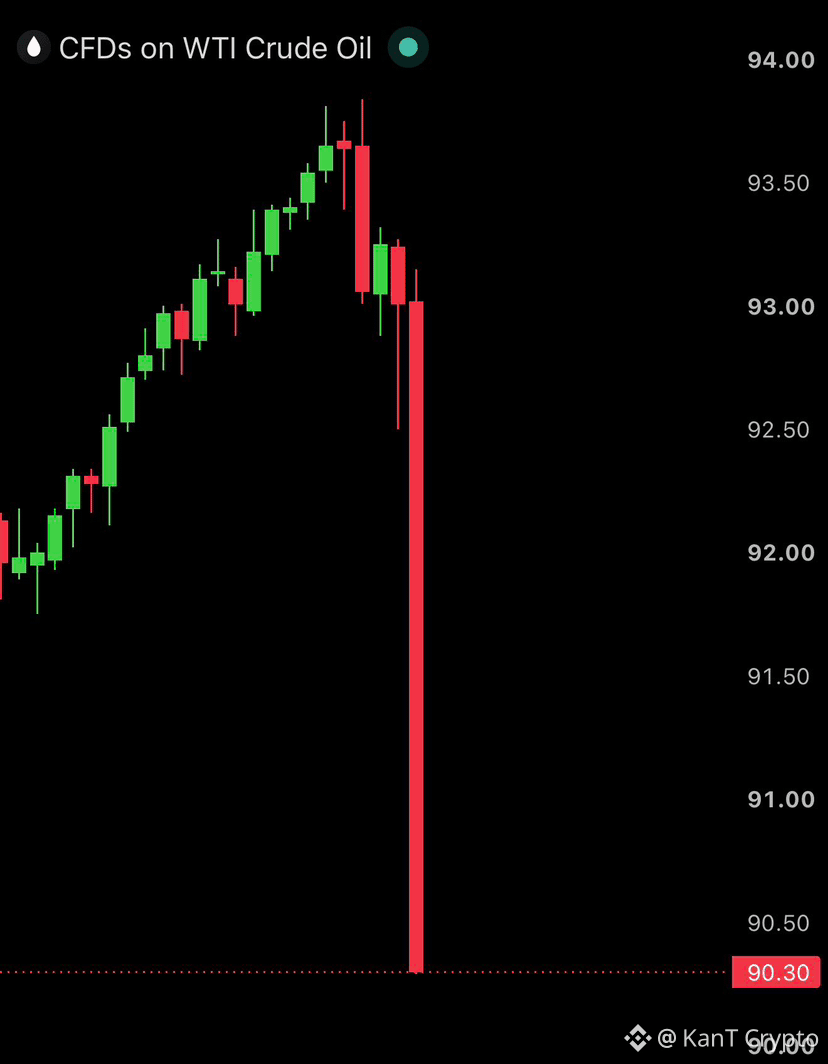
1
1.6k
·
--
Bearish
🔥 Shorts Got Absolutely Cooked
Bet against the rocket. The rocket won.
$750 million liquidated in 24 hours.
Shorts: ~$650 million.
Longs: the crumbs.
Roughly 9 out of 10 dollars wiped out came from bears who swore price would drop.
It didn't. 💀
And here's the brutal part they forgot:
A dead short is a forced buy.
Their bet gets closed, the exchange buys it back, and that buying shoves price even higher.
Every short that blew up literally fueled the pump that killed it.
That is the short squeeze that sent BTC past $85K and BNB kissing $800. 🚀
But do not get cute up here. 🚩
Forced buying is not the same as real buying.
Once the trapped bears are flushed, that fuel is gone.
Open interest is still climbing, meaning fresh leverage is piling in, and leverage does not pick sides.
Today it squeezed shorts. Tomorrow it can gut the late longs.
The move is real. The market is also leveraged and emotional as hell right now.
Chase a candle built on liquidations and you become the next name on the list.
Size small. Let the blood dry.
Squeeze keeps ripping, or late longs get flushed next? 🔥
Not financial advice.
$BTC
{future}(BTCUSDT)
$ETH
{future}(ETHUSDT)
$BNB
{future}(BNBUSDT)
🔥 Shorts Got Absolutely Cooked
Bet against the rocket. The rocket won.
$750 million liquidated in 24 hours.
Shorts: ~$650 million.
Longs: the crumbs.
Roughly 9 out of 10 dollars wiped out came from bears who swore price would drop.
It didn't. 💀
And here's the brutal part they forgot:
A dead short is a forced buy.
Their bet gets closed, the exchange buys it back, and that buying shoves price even higher.
Every short that blew up literally fueled the pump that killed it.
That is the short squeeze that sent BTC past $85K and BNB kissing $800. 🚀
But do not get cute up here. 🚩
Forced buying is not the same as real buying.
Once the trapped bears are flushed, that fuel is gone.
Open interest is still climbing, meaning fresh leverage is piling in, and leverage does not pick sides.
Today it squeezed shorts. Tomorrow it can gut the late longs.
The move is real. The market is also leveraged and emotional as hell right now.
Chase a candle built on liquidations and you become the next name on the list.
Size small. Let the blood dry.
Squeeze keeps ripping, or late longs get flushed next? 🔥
Not financial advice.
$BTC
$ETH
$BNB
Bet against the rocket. The rocket won.
$750 million liquidated in 24 hours.
Shorts: ~$650 million.
Longs: the crumbs.
Roughly 9 out of 10 dollars wiped out came from bears who swore price would drop.
It didn't. 💀
And here's the brutal part they forgot:
A dead short is a forced buy.
Their bet gets closed, the exchange buys it back, and that buying shoves price even higher.
Every short that blew up literally fueled the pump that killed it.
That is the short squeeze that sent BTC past $85K and BNB kissing $800. 🚀
But do not get cute up here. 🚩
Forced buying is not the same as real buying.
Once the trapped bears are flushed, that fuel is gone.
Open interest is still climbing, meaning fresh leverage is piling in, and leverage does not pick sides.
Today it squeezed shorts. Tomorrow it can gut the late longs.
The move is real. The market is also leveraged and emotional as hell right now.
Chase a candle built on liquidations and you become the next name on the list.
Size small. Let the blood dry.
Squeeze keeps ripping, or late longs get flushed next? 🔥
Not financial advice.
$BTC
$ETH
$BNB
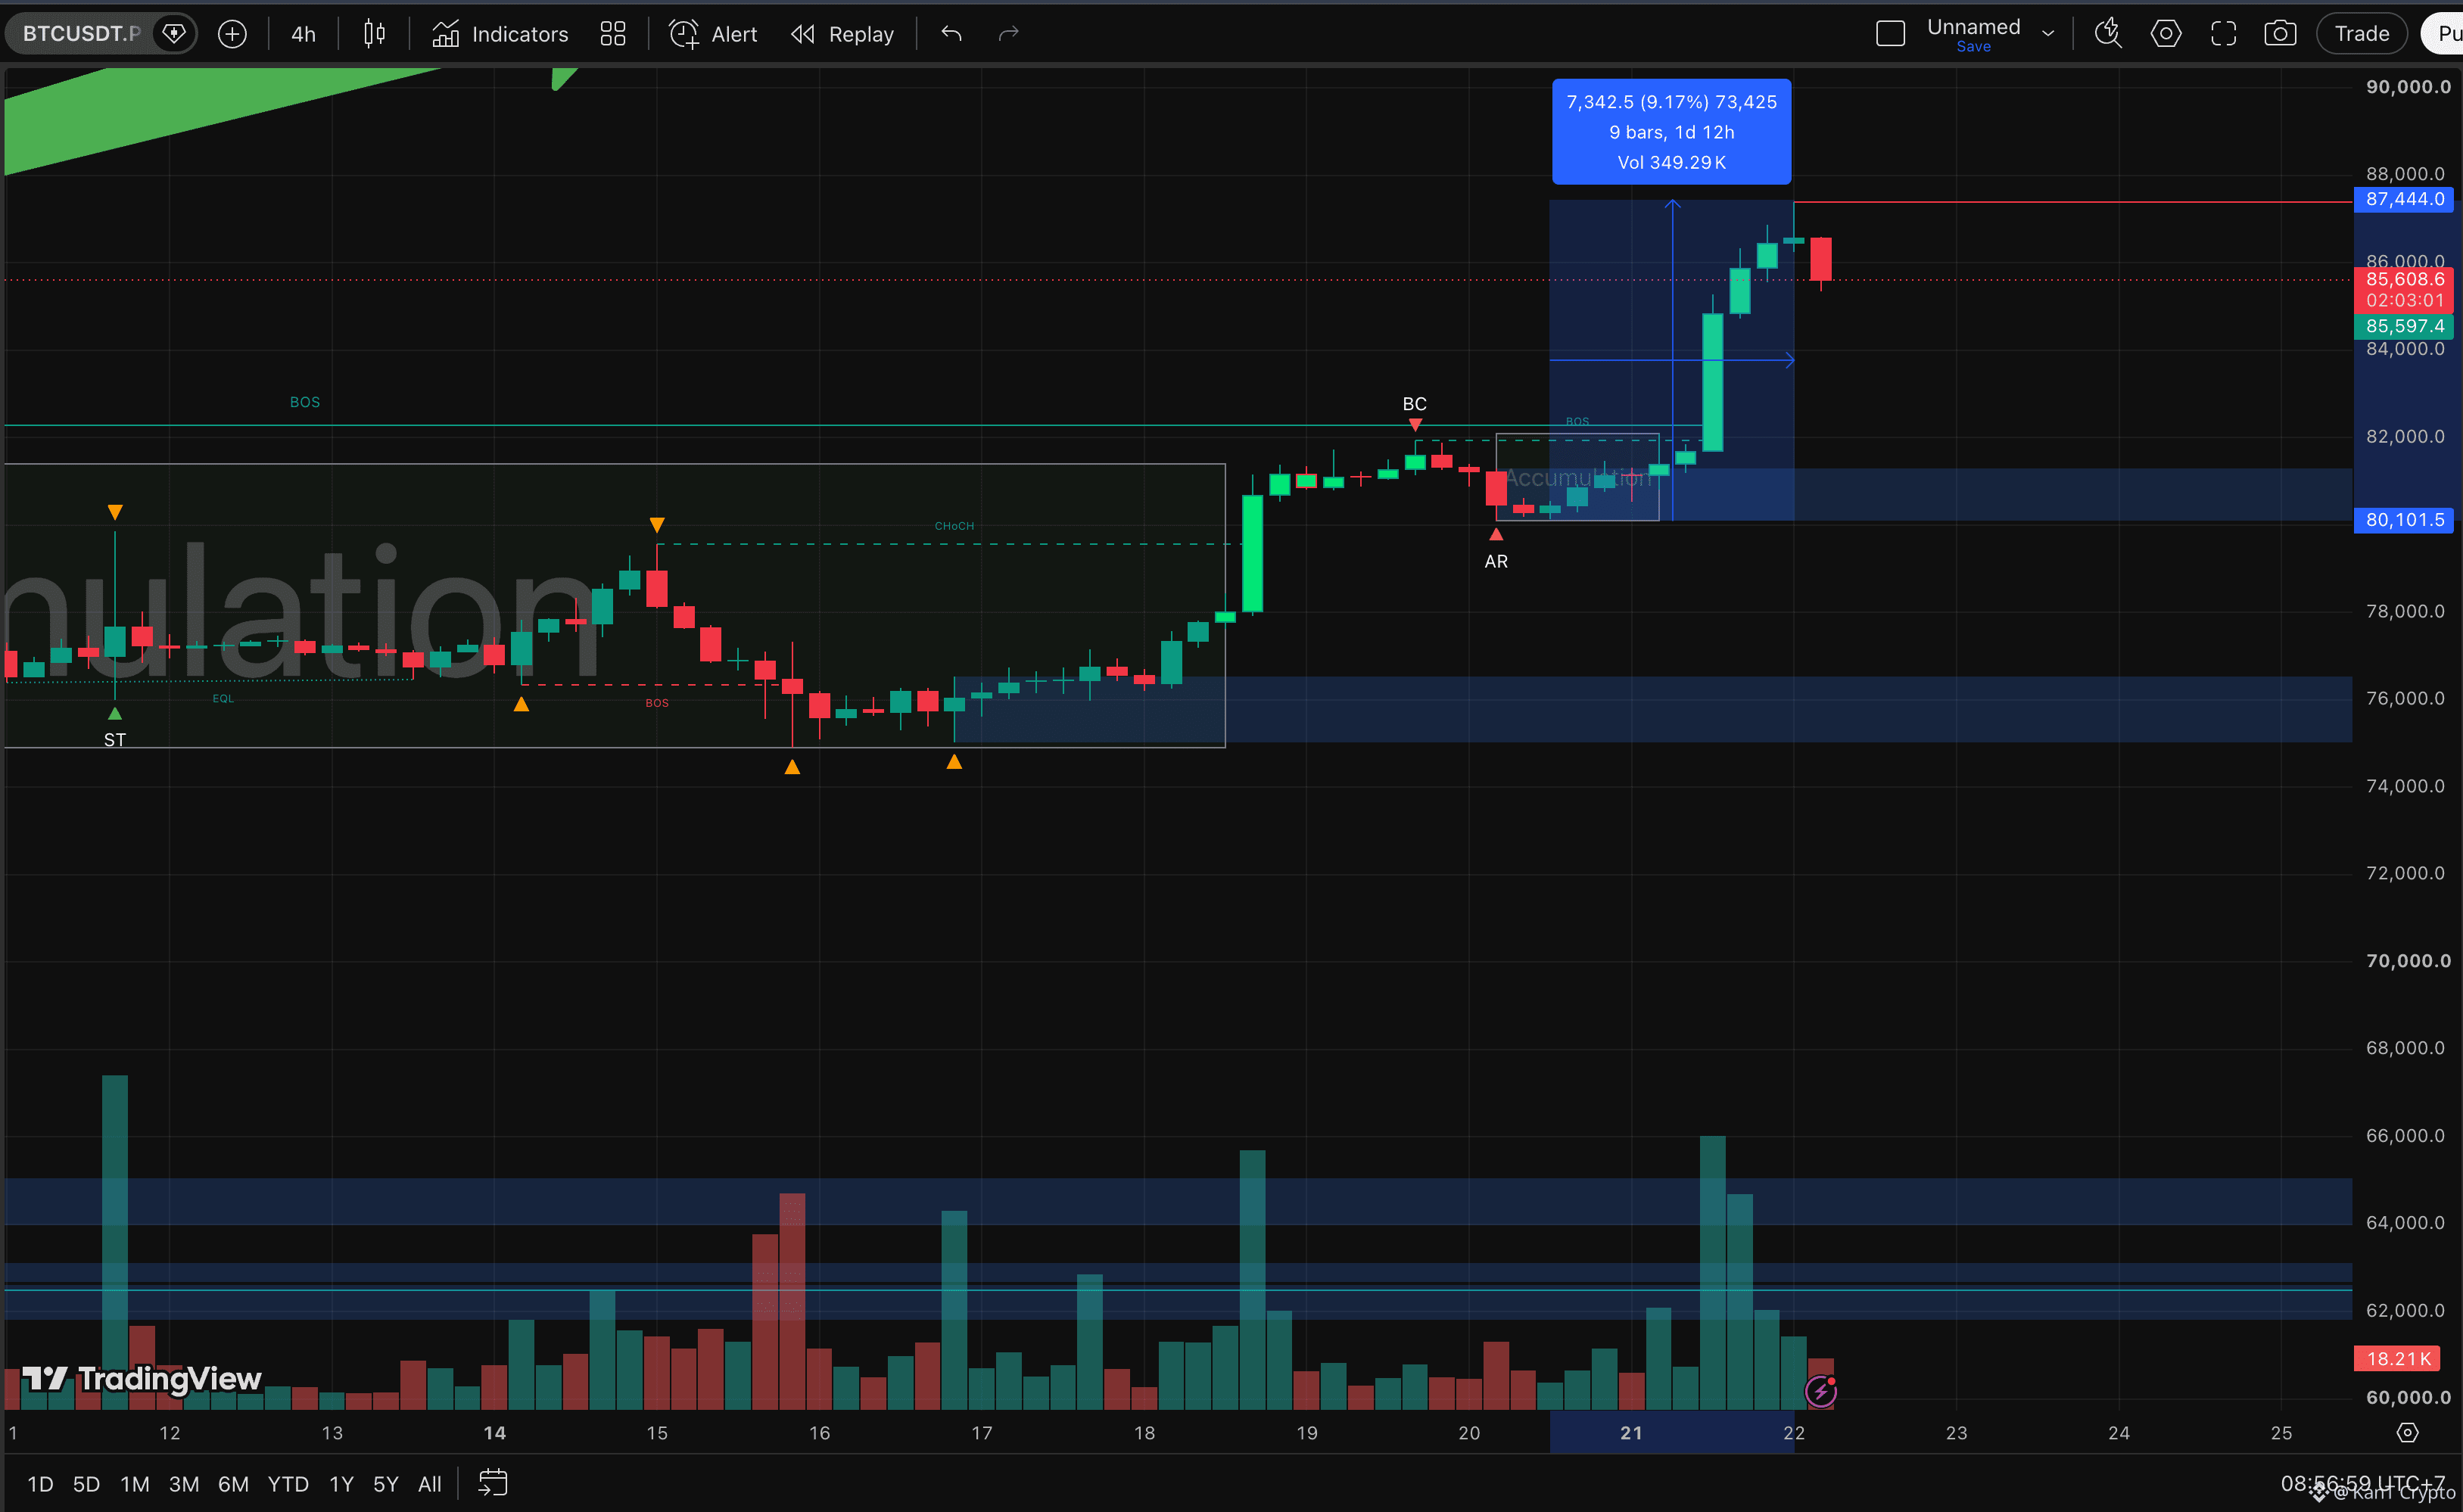
1
197
Log in to explore more content
Join global crypto users on Binance Square
⚡️ Get latest and useful information about crypto.
💬 Trusted by the world’s largest crypto exchange.
👍 Discover real insights from verified creators.
Email / Phone number
Trending Topics
CircleMints500MUSDCOnSolana
133,514 views
2,506 Discussing
#circlemints500musdconsolana 🚨 $500M USDC PUT SOLANA DEFI UNDER THE MICROSCOPE
Circle has added 500 million Dollar in USDC to Solana. That’s a number.. Here’s what traders really need to pay attention to. 👀
A 500 million Dollar jump in USDC supply doesn’t automatically mean 500 million dollar of buying pressure. That’s not how it works. The real story is what happens next.
🔹 Does the USDC move into lending protocols?
🔹 Does borrowing demand pick up more liquidity comes in?
🔹 Do USDC lending yields drop as supply grows?
🔹 Does all this stablecoin liquidity eventually shift into SOL and other Solana assets?
Circle says the USDC can be minted in advance and held before it hits the circulating supply. That means the headline number is the start. The actual flow after minting matters more than the announcement.
Jupiter is already a player on Solana for USDC lending and borrowing. So the utilization rate and borrowing activity there are metrics to watch.
📊 Here’s my main focus:
inflows → DeFi utilization → rising borrowing demand → SOL liquidity.
Is this 500 million Dollar going to sit idle?. Will it flow into DeFi first?. Then will it eventually move into riskier assets like SOL, JUP, KMNO?
The next few days could tell us a lot, about how Solana DeFi's reacting to this injection.
#solana #crypto #Khan62 #USDC
$KMNO $JUP $ORCA
Khan 62
·6 Likes
·5k views
PolymarketBankFailureBetsDrawFDICConcern
120,040 views
2,078 Discussing
BlackRockBuildsTokenizedPortfoliosForOndo
116,194 views
1,486 Discussing