

币圈十二叔
6.6k Posts

币圈十二叔
Report
Block User
量化交易员🤠量化带单中欢迎跟单🤖币安手续费八折返佣码: SR988
High-Frequency Trader
1.3 Years
12 Following
1.1K+ Followers
437 Liked
Posts
All
Quotes
Videos
·
--
Chinese AI model stocks have taken a real beating lately.
I saw a Bloomberg report saying that $MiniMax and $ZHIPU have lost a combined $150 billion in market value since their peak.
This pullback is no joke.
Chinese AI model stocks have taken a real beating lately.
I saw a Bloomberg report saying that $MiniMax and $ZHIPU have lost a combined $150 billion in market value since their peak.
This pullback is no joke.
I saw a Bloomberg report saying that $MiniMax and $ZHIPU have lost a combined $150 billion in market value since their peak.
This pullback is no joke.
·
--
$SKHY Our side reports earnings tomorrow night; it’ll be Wednesday morning in Seoul.
For this HBM heavyweight, this is a tough test of quarter-over-quarter growth: second-quarter revenue was 79.3 trillion won, operating profit 60.5 trillion won, and the profit margin 76.3%.
The market consensus for the third quarter (FnGuide) is revenue of 98.2 trillion won and operating profit of 77.0 trillion won—up 24% and 27%, respectively, in a single quarter.
With those figures on the table, it all comes down to tomorrow night: can they deliver?
$SKHY Our side reports earnings tomorrow night; it’ll be Wednesday morning in Seoul.
For this HBM heavyweight, this is a tough test of quarter-over-quarter growth: second-quarter revenue was 79.3 trillion won, operating profit 60.5 trillion won, and the profit margin 76.3%.
The market consensus for the third quarter (FnGuide) is revenue of 98.2 trillion won and operating profit of 77.0 trillion won—up 24% and 27%, respectively, in a single quarter.
With those figures on the table, it all comes down to tomorrow night: can they deliver?
For this HBM heavyweight, this is a tough test of quarter-over-quarter growth: second-quarter revenue was 79.3 trillion won, operating profit 60.5 trillion won, and the profit margin 76.3%.
The market consensus for the third quarter (FnGuide) is revenue of 98.2 trillion won and operating profit of 77.0 trillion won—up 24% and 27%, respectively, in a single quarter.
With those figures on the table, it all comes down to tomorrow night: can they deliver?
1
·
--
I’m looking at $SNDK —it jumped 37% this time. Interest in the storage sector is really surging now.
I’m looking at $SNDK —it jumped 37% this time. Interest in the storage sector is really surging now.
2
·
--
Looking at this $NIL 1-hour move, buyers have already broken through resistance. Both the 50 and 200 EMAs are below price, and momentum feels more like continuation than a pullback to me.
0.0883 is the previous swing high that capped the last move. If price can hold on a retest, it could have room to move toward 0.0959.
The invalidation level is 0.0877.
Looking at this $NIL 1-hour move, buyers have already broken through resistance. Both the 50 and 200 EMAs are below price, and momentum feels more like continuation than a pullback to me.
0.0883 is the previous swing high that capped the last move. If price can hold on a retest, it could have room to move toward 0.0959.
The invalidation level is 0.0877.
0.0883 is the previous swing high that capped the last move. If price can hold on a retest, it could have room to move toward 0.0959.
The invalidation level is 0.0877.
3
·
--
I’ve seen this pattern in the storage industry many times. It’s one of the most cyclical sectors: ordinary memory is a commodity, and one manufacturer’s product is much like another’s. Customers only care about price.
When supplies are tight and prices rise, companies rush to build factories. A year or two later, all that new capacity comes online at once, prices collapse, and production is cut—until supplies tighten again. And so the cycle repeats.
So when evaluating storage stocks, you have to think in reverse: when profits look their best, new capacity is already on the way, which often means the peak.
When companies are losing money and start cutting production, supply contracts—which often means the bottom.
$MU $SNDK $SKHY
I’ve seen this pattern in the storage industry many times. It’s one of the most cyclical sectors: ordinary memory is a commodity, and one manufacturer’s product is much like another’s. Customers only care about price.
When supplies are tight and prices rise, companies rush to build factories. A year or two later, all that new capacity comes online at once, prices collapse, and production is cut—until supplies tighten again. And so the cycle repeats.
So when evaluating storage stocks, you have to think in reverse: when profits look their best, new capacity is already on the way, which often means the peak.
When companies are losing money and start cutting production, supply contracts—which often means the bottom.
$MU $SNDK $SKHY
When supplies are tight and prices rise, companies rush to build factories. A year or two later, all that new capacity comes online at once, prices collapse, and production is cut—until supplies tighten again. And so the cycle repeats.
So when evaluating storage stocks, you have to think in reverse: when profits look their best, new capacity is already on the way, which often means the peak.
When companies are losing money and start cutting production, supply contracts—which often means the bottom.
$MU $SNDK $SKHY
3
·
--
I took a look at the daily chart for $SKHYNIX . Counting from the low, today is day 7, and the resistance level above is ₩1,334,000.
ADX rose from 51.63 yesterday to 53.02, so trend strength is still increasing, but overall the downtrend remains intact.
That said, I think Monday, Tuesday, and Wednesday may be the last buying window near the lows, so if you're looking to buy the dip, keep a close eye on it.
I took a look at the daily chart for $SKHYNIX . Counting from the low, today is day 7, and the resistance level above is ₩1,334,000.
ADX rose from 51.63 yesterday to 53.02, so trend strength is still increasing, but overall the downtrend remains intact.
That said, I think Monday, Tuesday, and Wednesday may be the last buying window near the lows, so if you're looking to buy the dip, keep a close eye on it.
ADX rose from 51.63 yesterday to 53.02, so trend strength is still increasing, but overall the downtrend remains intact.
That said, I think Monday, Tuesday, and Wednesday may be the last buying window near the lows, so if you're looking to buy the dip, keep a close eye on it.
2
·
--
I took a look at this claim: they say $MSTR is more likely to achieve a 5x return because it holds a large amount of $BTC and has a leverage amplification effect.
But I just want to ask one thing: if $BTC really surges over the next five years, would $COIN just stand still?
Increasing trading volume, derivatives expansion, and USDC growth—aren't all of these real sources of profit?
I took a look at this claim: they say $MSTR is more likely to achieve a 5x return because it holds a large amount of $BTC and has a leverage amplification effect.
But I just want to ask one thing: if $BTC really surges over the next five years, would $COIN just stand still?
Increasing trading volume, derivatives expansion, and USDC growth—aren't all of these real sources of profit?
But I just want to ask one thing: if $BTC really surges over the next five years, would $COIN just stand still?
Increasing trading volume, derivatives expansion, and USDC growth—aren't all of these real sources of profit?
3
·
--
I’m looking at $INTW , and this chart is starting to feel a bit chilly. The distribution signals are bearish, the price is slowly grinding below VWAP, and selling pressure remains firmly in control. Low liquidity is also weighing on it.
MFI is nearing oversold territory, but the downward momentum hasn’t let up. This setup makes me think another cold spell may be ahead, with volatility continuing to weigh on the market.
I’m looking at $INTW , and this chart is starting to feel a bit chilly. The distribution signals are bearish, the price is slowly grinding below VWAP, and selling pressure remains firmly in control. Low liquidity is also weighing on it.
MFI is nearing oversold territory, but the downward momentum hasn’t let up. This setup makes me think another cold spell may be ahead, with volatility continuing to weigh on the market.
MFI is nearing oversold territory, but the downward momentum hasn’t let up. This setup makes me think another cold spell may be ahead, with volatility continuing to weigh on the market.
10
·
--
I took a look—$ZHIPU is giving away 200,000 free tokens to bring in new users. That’s pretty aggressive; they’re basically paying people to try their coder. I have to say, I respect that user acquisition strategy.
I took a look—$ZHIPU is giving away 200,000 free tokens to bring in new users. That’s pretty aggressive; they’re basically paying people to try their coder. I have to say, I respect that user acquisition strategy.
10
·
--
Samsung and $SKHYNIX together made nearly 185 trillion won in profit in the third quarter. That figure looks pretty staggering, but I think the real test isn’t there at all—it’s HBM4.
Whether they can supply next-generation HBM4 for NVIDIA’s $NVDA Vera Rubin accelerators—that’s the real dividing line.
Whoever passes certification first will capture this AI memory cycle.
Who are you betting on?
Samsung and $SKHYNIX together made nearly 185 trillion won in profit in the third quarter. That figure looks pretty staggering, but I think the real test isn’t there at all—it’s HBM4.
Whether they can supply next-generation HBM4 for NVIDIA’s $NVDA Vera Rubin accelerators—that’s the real dividing line.
Whoever passes certification first will capture this AI memory cycle.
Who are you betting on?
Whether they can supply next-generation HBM4 for NVIDIA’s $NVDA Vera Rubin accelerators—that’s the real dividing line.
Whoever passes certification first will capture this AI memory cycle.
Who are you betting on?
35
·
--
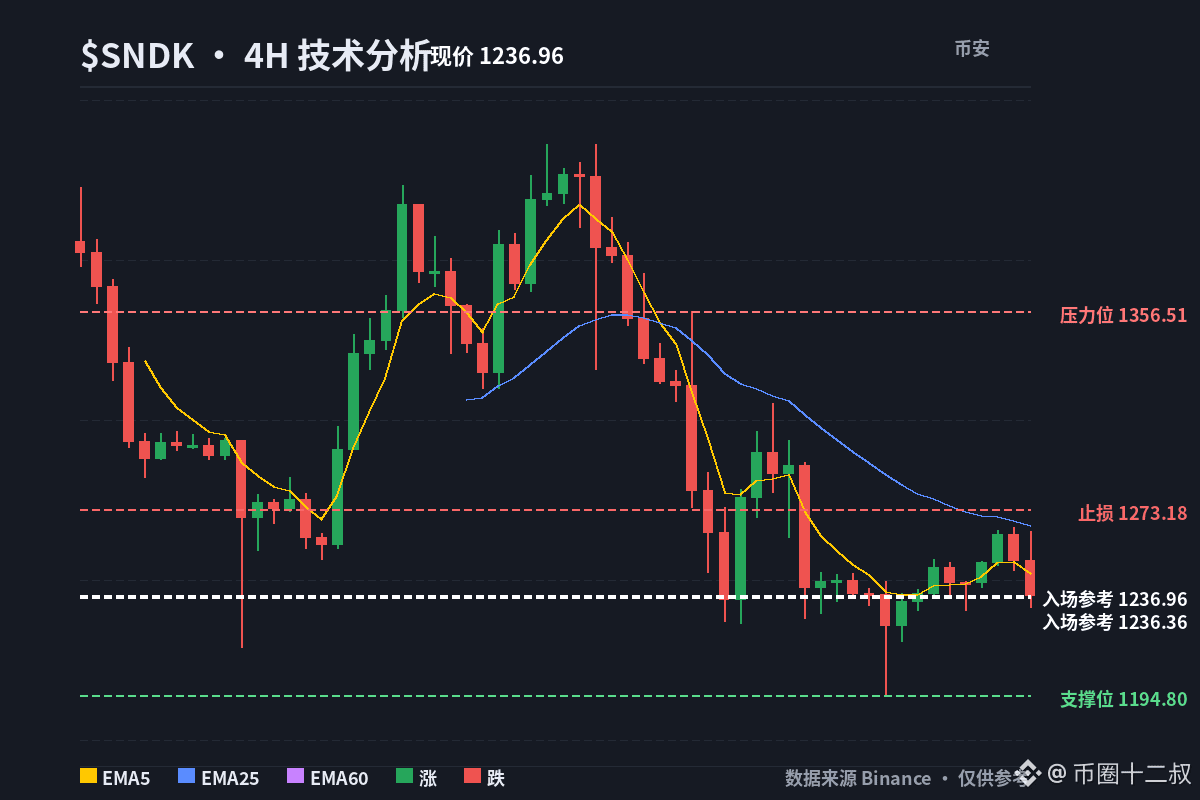
I've been watching $SNDK, and I’m leaning toward a short at this level.
The entry zone is 1236.35626 to 1239.94374. The first target is 1211.87757, followed by 1194.36262, and finally 1168.09019. Set the stop-loss at 1273.17990.
I've been watching $SNDK , and I’m leaning toward a short at this level.
The entry zone is 1236.35626 to 1239.94374. The first target is 1211.87757, followed by 1194.36262, and finally 1168.09019. Set the stop-loss at 1273.17990.
The entry zone is 1236.35626 to 1239.94374. The first target is 1211.87757, followed by 1194.36262, and finally 1168.09019. Set the stop-loss at 1273.17990.
35
·
--
This is a big week for AI, and I’m telling you, this week’s earnings reports will directly shape the entire AI infrastructure ecosystem.
First, let’s look at the cloud giants. Whether the AI capex guidance from companies like $MSFT and $GOOGL is solid, and whether cloud demand is holding up, will be the key signals this week.
We also need to keep a close eye on the memory and flash storage supply chain. Demand, pricing power, and supply constraints on the $SKHY side will tell us a lot.
And then there’s the whole data center hardware space. Don’t get distracted by the hype—the real question is whether orders and industry momentum can keep up.
Overall, this week’s earnings are no small matter. AI infrastructure, from cloud to memory to hardware, could all be repriced.
This is a big week for AI, and I’m telling you, this week’s earnings reports will directly shape the entire AI infrastructure ecosystem.
First, let’s look at the cloud giants. Whether the AI capex guidance from companies like $MSFT and $GOOGL is solid, and whether cloud demand is holding up, will be the key signals this week.
We also need to keep a close eye on the memory and flash storage supply chain. Demand, pricing power, and supply constraints on the $SKHY side will tell us a lot.
And then there’s the whole data center hardware space. Don’t get distracted by the hype—the real question is whether orders and industry momentum can keep up.
Overall, this week’s earnings are no small matter. AI infrastructure, from cloud to memory to hardware, could all be repriced.
First, let’s look at the cloud giants. Whether the AI capex guidance from companies like $MSFT and $GOOGL is solid, and whether cloud demand is holding up, will be the key signals this week.
We also need to keep a close eye on the memory and flash storage supply chain. Demand, pricing power, and supply constraints on the $SKHY side will tell us a lot.
And then there’s the whole data center hardware space. Don’t get distracted by the hype—the real question is whether orders and industry momentum can keep up.
Overall, this week’s earnings are no small matter. AI infrastructure, from cloud to memory to hardware, could all be repriced.
46
·
--
In my view, no matter how much computing power Alibaba and ByteDance amass as private companies, they still can't overcome the trust issue.
$ZHIPU and state-controlled companies like DeepSeek can keep going on orders from state-owned enterprises, central SOEs, and the government.
In my view, no matter how much computing power Alibaba and ByteDance amass as private companies, they still can't overcome the trust issue.
$ZHIPU and state-controlled companies like DeepSeek can keep going on orders from state-owned enterprises, central SOEs, and the government.
$ZHIPU and state-controlled companies like DeepSeek can keep going on orders from state-owned enterprises, central SOEs, and the government.
67
·
--
I see $INTC had a slight pullback this week (10/19–23), mainly dragged down by a broad sell-off in the AI semiconductor sector.
The 10/29 earnings report is the biggest event this week. If results beat expectations, $INTC could have a chance to break above $90;
for now, the market is in a wait-and-see mode, with no real momentum until earnings are out.
I see $INTC had a slight pullback this week (10/19–23), mainly dragged down by a broad sell-off in the AI semiconductor sector.
The 10/29 earnings report is the biggest event this week. If results beat expectations, $INTC could have a chance to break above $90;
for now, the market is in a wait-and-see mode, with no real momentum until earnings are out.
The 10/29 earnings report is the biggest event this week. If results beat expectations, $INTC could have a chance to break above $90;
for now, the market is in a wait-and-see mode, with no real momentum until earnings are out.
71
·
--
$TENCENT has made WorkBuddy the first major AI agent app that can sell its own skills. The platform takes just 1% during the beta, and I get why that sounds exciting.
But honestly, I really don't think this model can hold up.
A skill is basically just a Markdown file, so once...
$TENCENT has made WorkBuddy the first major AI agent app that can sell its own skills. The platform takes just 1% during the beta, and I get why that sounds exciting.
But honestly, I really don't think this model can hold up.
A skill is basically just a Markdown file, so once...
But honestly, I really don't think this model can hold up.
A skill is basically just a Markdown file, so once...
2
·
--
I see $INTW is trending bearish, with clear signs of distribution. Price keeps grinding below VWAP, selling pressure is still dominant, and the low-liquidity area is being pulled lower.
MFI is almost in oversold territory, but downside momentum hasn’t let up. Structurally, another cold spell lies ahead, and volatility will continue to weigh on the market.
I see $INTW is trending bearish, with clear signs of distribution. Price keeps grinding below VWAP, selling pressure is still dominant, and the low-liquidity area is being pulled lower.
MFI is almost in oversold territory, but downside momentum hasn’t let up. Structurally, another cold spell lies ahead, and volatility will continue to weigh on the market.
MFI is almost in oversold territory, but downside momentum hasn’t let up. Structurally, another cold spell lies ahead, and volatility will continue to weigh on the market.
12
·
--
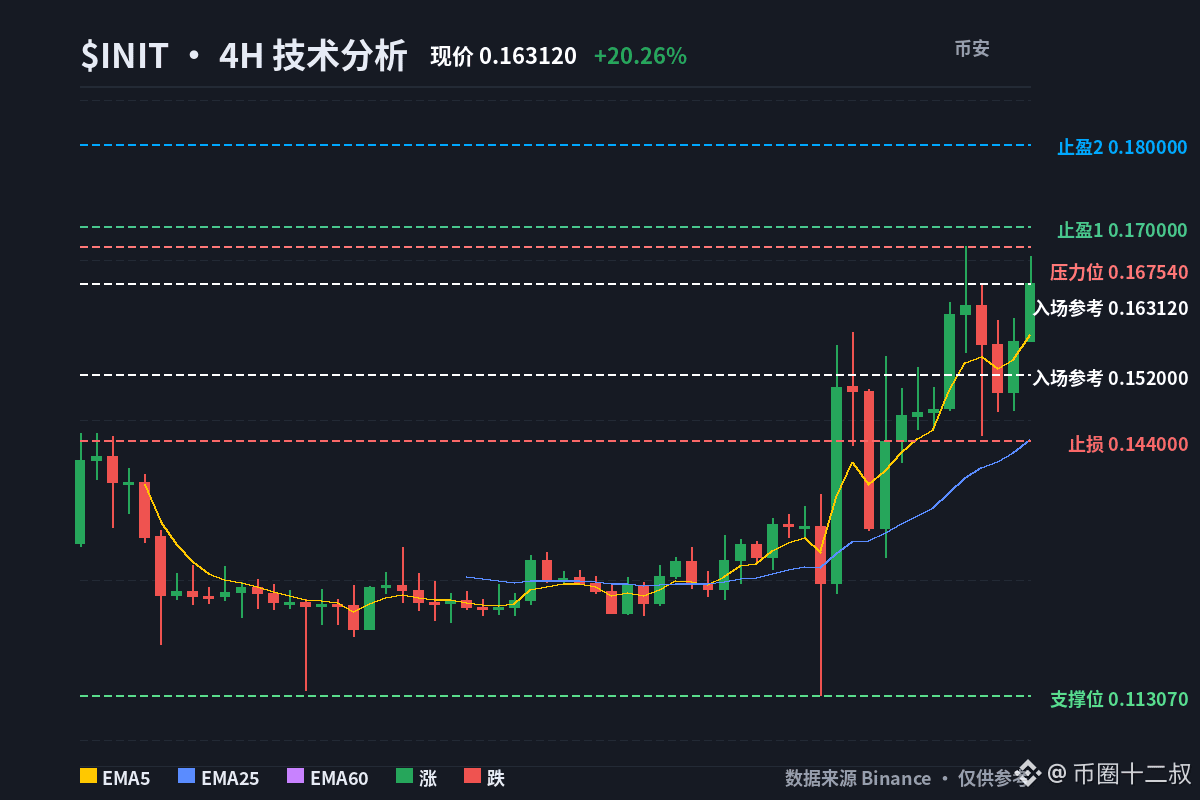
$INIT It’s up 20 points, retail traders are shorting while the big players are buying in—I’m not talking anyone out of this one 😅. If buyers show up on a pullback to 0.152, I’ll scale in; if it breaks below 0.144, I’ll admit I was wrong.
Funding is still positive, so longs are paying to stay in the trade, and retail is probably mostly short. Who’ll let go first? I’m betting on those contrarian shorts: once they close, price could first test 0.170. If it can’t reach that, it’ll turn back toward 0.152. Price is hugging EMA5, and there’s no room to widen my stop, so I’m staying out of it.
Daily RSI is overbought, so I’m not chasing. I’ll buy the pullback: 12 points up versus 5 points down—that’s a risk/reward I can get behind. It’s running on its own; no matter how fast it goes, it’s running solo.
The more retail shorts, the bolder the big players get about buying in. This rally is being propped up by the shorts.
If 0.152 holds, you can get in; if 0.144 breaks, you have to admit you were wrong—which one are you betting on?
📊 Direction: Wait for a pullback, then go long
💰 Entry reference: Scale in if price retests 0.152 and stabilizes
🛑 Stop loss: Admit you’re wrong if it breaks below 0.144
🎯 Take profit 1: 0.170, resistance at the previous high
🎯 Take profit 2: 0.180, extension above the previous high
$INIT #技术分析 #UncleTwelve
$INIT It’s up 20 points, retail traders are shorting while the big players are buying in—I’m not talking anyone out of this one 😅. If buyers show up on a pullback to 0.152, I’ll scale in; if it breaks below 0.144, I’ll admit I was wrong.
Funding is still positive, so longs are paying to stay in the trade, and retail is probably mostly short. Who’ll let go first? I’m betting on those contrarian shorts: once they close, price could first test 0.170. If it can’t reach that, it’ll turn back toward 0.152. Price is hugging EMA5, and there’s no room to widen my stop, so I’m staying out of it.
Daily RSI is overbought, so I’m not chasing. I’ll buy the pullback: 12 points up versus 5 points down—that’s a risk/reward I can get behind. It’s running on its own; no matter how fast it goes, it’s running solo.
The more retail shorts, the bolder the big players get about buying in. This rally is being propped up by the shorts.
If 0.152 holds, you can get in; if 0.144 breaks, you have to admit you were wrong—which one are you betting on?
📊 Direction: Wait for a pullback, then go long
💰 Entry reference: Scale in if price retests 0.152 and stabilizes
🛑 Stop loss: Admit you’re wrong if it breaks below 0.144
🎯 Take profit 1: 0.170, resistance at the previous high
🎯 Take profit 2: 0.180, extension above the previous high
$INIT #技术分析 #UncleTwelve
Funding is still positive, so longs are paying to stay in the trade, and retail is probably mostly short. Who’ll let go first? I’m betting on those contrarian shorts: once they close, price could first test 0.170. If it can’t reach that, it’ll turn back toward 0.152. Price is hugging EMA5, and there’s no room to widen my stop, so I’m staying out of it.
Daily RSI is overbought, so I’m not chasing. I’ll buy the pullback: 12 points up versus 5 points down—that’s a risk/reward I can get behind. It’s running on its own; no matter how fast it goes, it’s running solo.
The more retail shorts, the bolder the big players get about buying in. This rally is being propped up by the shorts.
If 0.152 holds, you can get in; if 0.144 breaks, you have to admit you were wrong—which one are you betting on?
📊 Direction: Wait for a pullback, then go long
💰 Entry reference: Scale in if price retests 0.152 and stabilizes
🛑 Stop loss: Admit you’re wrong if it breaks below 0.144
🎯 Take profit 1: 0.170, resistance at the previous high
🎯 Take profit 2: 0.180, extension above the previous high
$INIT #技术分析 #UncleTwelve
18
·
--
I think $MRVL and $AVGO both need to take off this week, provided guidance from the two major cloud providers on XPU usage is stronger than expected.
If that happens, $NVDA will still be the biggest beneficiary.
I think $MRVL and $AVGO both need to take off this week, provided guidance from the two major cloud providers on XPU usage is stronger than expected.
If that happens, $NVDA will still be the biggest beneficiary.
If that happens, $NVDA will still be the biggest beneficiary.
5
·
--
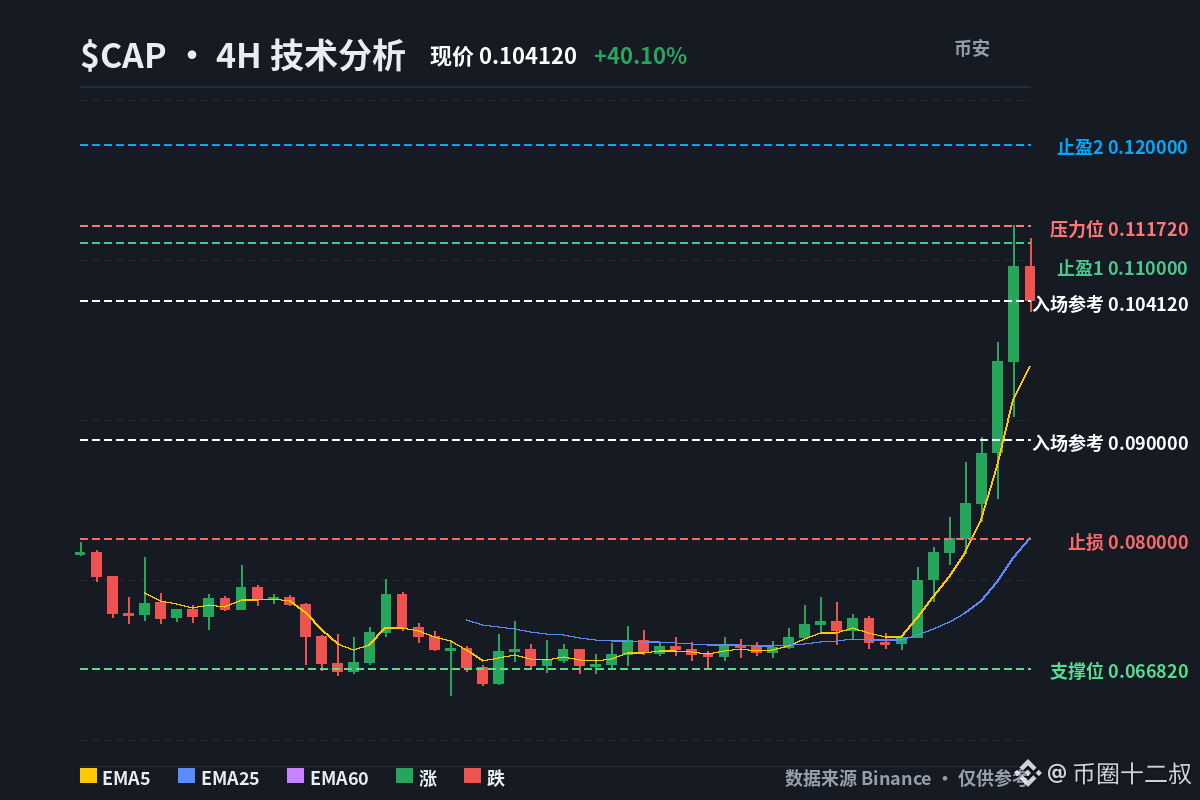
$CAP rode EMA5 up to 0.098. I’m not buying this last leg. If it pulls back to 0.090 and finds buyers, I’ll scale in. If it breaks below 0.080, I’m wrong.
The funding rate is 0.36% a day—longs are paying shorts. Both retail accounts and whales are heavily long. Who’ll be the first to let go? My bet is that the leveraged longs chasing the price higher will be first to bail, sending it back to 0.090. If that doesn’t hold, the next level to watch is EMA25 at 0.080. The current price is too close to my stop-loss, so I can’t move it up 😅
Chasing a long at the current price to 0.110 only nets a 10% gain, while a drop back to 0.080 would mean a 20% loss. I’m not taking those odds. The moving averages are still in bullish alignment, but RSI is stuck in the overbought zone. It can run as fast as it likes, but there’s no one there to catch it.
Longs are adding to their positions while paying funding. That’s not conviction—it’s momentum.
Would you buy the pullback at 0.090, or wait for it to break below 0.080 before admitting you’re wrong? Pick one.
📊 Direction: Wait for a pullback, then go long
💰 Entry reference: Buy the pullback at 0.090; scale in
🛑 Stop-loss: Exit if it breaks below 0.080
🎯 Take profit 1: 0.110, the previous high and resistance
🎯 Take profit 2: 0.120, the daily-chart high
$CAP #技术分析 #UncleTwelve
$CAP rode EMA5 up to 0.098. I’m not buying this last leg. If it pulls back to 0.090 and finds buyers, I’ll scale in. If it breaks below 0.080, I’m wrong.
The funding rate is 0.36% a day—longs are paying shorts. Both retail accounts and whales are heavily long. Who’ll be the first to let go? My bet is that the leveraged longs chasing the price higher will be first to bail, sending it back to 0.090. If that doesn’t hold, the next level to watch is EMA25 at 0.080. The current price is too close to my stop-loss, so I can’t move it up 😅
Chasing a long at the current price to 0.110 only nets a 10% gain, while a drop back to 0.080 would mean a 20% loss. I’m not taking those odds. The moving averages are still in bullish alignment, but RSI is stuck in the overbought zone. It can run as fast as it likes, but there’s no one there to catch it.
Longs are adding to their positions while paying funding. That’s not conviction—it’s momentum.
Would you buy the pullback at 0.090, or wait for it to break below 0.080 before admitting you’re wrong? Pick one.
📊 Direction: Wait for a pullback, then go long
💰 Entry reference: Buy the pullback at 0.090; scale in
🛑 Stop-loss: Exit if it breaks below 0.080
🎯 Take profit 1: 0.110, the previous high and resistance
🎯 Take profit 2: 0.120, the daily-chart high
$CAP #技术分析 #UncleTwelve
The funding rate is 0.36% a day—longs are paying shorts. Both retail accounts and whales are heavily long. Who’ll be the first to let go? My bet is that the leveraged longs chasing the price higher will be first to bail, sending it back to 0.090. If that doesn’t hold, the next level to watch is EMA25 at 0.080. The current price is too close to my stop-loss, so I can’t move it up 😅
Chasing a long at the current price to 0.110 only nets a 10% gain, while a drop back to 0.080 would mean a 20% loss. I’m not taking those odds. The moving averages are still in bullish alignment, but RSI is stuck in the overbought zone. It can run as fast as it likes, but there’s no one there to catch it.
Longs are adding to their positions while paying funding. That’s not conviction—it’s momentum.
Would you buy the pullback at 0.090, or wait for it to break below 0.080 before admitting you’re wrong? Pick one.
📊 Direction: Wait for a pullback, then go long
💰 Entry reference: Buy the pullback at 0.090; scale in
🛑 Stop-loss: Exit if it breaks below 0.080
🎯 Take profit 1: 0.110, the previous high and resistance
🎯 Take profit 2: 0.120, the daily-chart high
$CAP #技术分析 #UncleTwelve
12
·
--
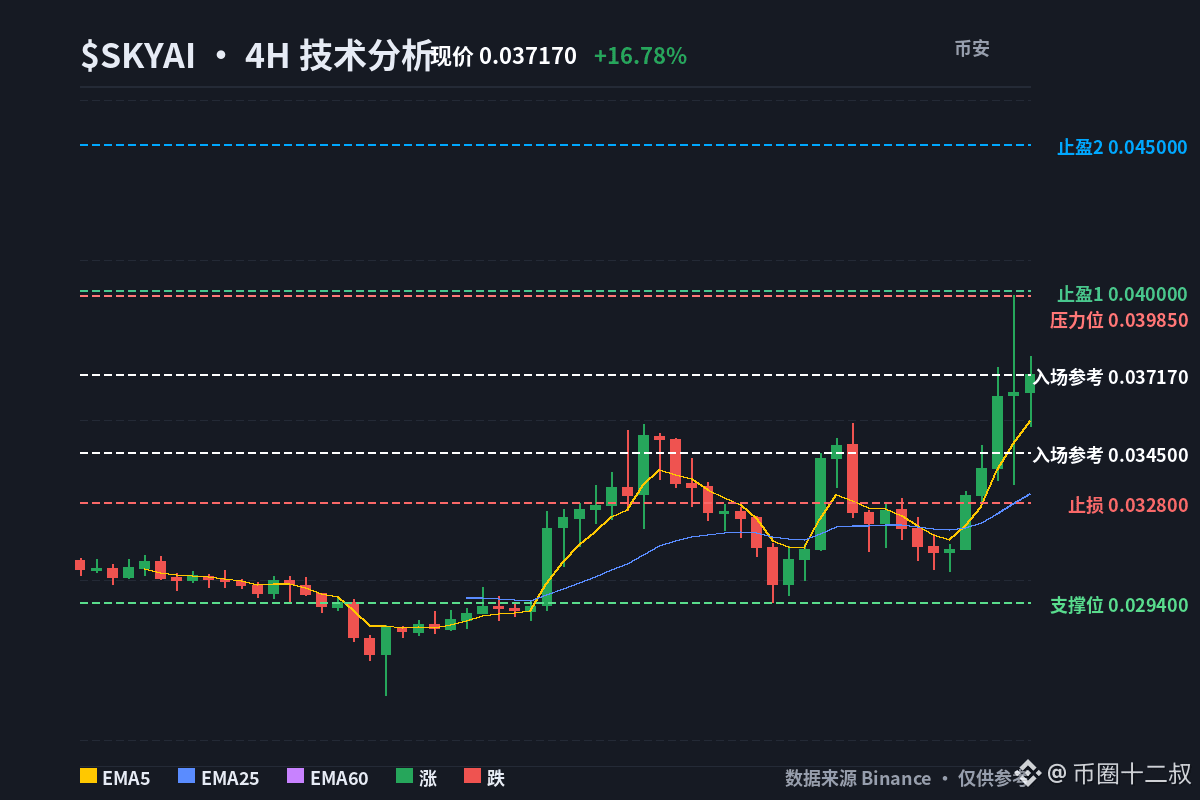
$SKYAI RSI 79.7—I'm not chasing at this price. Fast-rising coins never give you a heads-up before they pull back.
I'll scale in on a retest of 0.0345; if it breaks below 0.0328, I was wrong.
The funding rate is still positive, and the account long/short ratio is nearly 2:1. The longs are paying the protection fee. Who lets go first? My bet is on the leveraged longs who just chased in. If they close, price will first look to the 4h EMA25 at 0.0331; if that doesn't hold, it may test 0.0328. Price is too far from the moving average right now, so there's no room to set a stop. I'm not catching this falling knife 😅
The longs are paying the protection fee. I'm waiting for them to let go.
Will 0.0345 hold, or will 0.0328 be the first to give way? Pick one—let's hear your 50-cent takes in the comments.
The stop is 5% below entry, and 0.0400 is 16% higher. I'll take that 3:1. The daily chart has just crossed above the EMA25, but it needs to hold there for the signal to count. The broader market is going nowhere while this one runs on its own—but even a fast runner needs someone to catch it.
📊 Direction: Wait for a pullback to go long
💰 Entry reference: Scale in if a retest of 0.0345 holds
🛑 Stop loss: Exit if 0.0328 breaks below the 4h EMA25
🎯 Take profit 1: Take half off before the previous high at 0.0400
🎯 Take profit 2: Reassess at the round-number level of 0.0450
$SKYAI #技术分析 #Uncle Twelve
$SKYAI RSI 79.7—I'm not chasing at this price. Fast-rising coins never give you a heads-up before they pull back.
I'll scale in on a retest of 0.0345; if it breaks below 0.0328, I was wrong.
The funding rate is still positive, and the account long/short ratio is nearly 2:1. The longs are paying the protection fee. Who lets go first? My bet is on the leveraged longs who just chased in. If they close, price will first look to the 4h EMA25 at 0.0331; if that doesn't hold, it may test 0.0328. Price is too far from the moving average right now, so there's no room to set a stop. I'm not catching this falling knife 😅
The longs are paying the protection fee. I'm waiting for them to let go.
Will 0.0345 hold, or will 0.0328 be the first to give way? Pick one—let's hear your 50-cent takes in the comments.
The stop is 5% below entry, and 0.0400 is 16% higher. I'll take that 3:1. The daily chart has just crossed above the EMA25, but it needs to hold there for the signal to count. The broader market is going nowhere while this one runs on its own—but even a fast runner needs someone to catch it.
📊 Direction: Wait for a pullback to go long
💰 Entry reference: Scale in if a retest of 0.0345 holds
🛑 Stop loss: Exit if 0.0328 breaks below the 4h EMA25
🎯 Take profit 1: Take half off before the previous high at 0.0400
🎯 Take profit 2: Reassess at the round-number level of 0.0450
$SKYAI #技术分析 #Uncle Twelve
I'll scale in on a retest of 0.0345; if it breaks below 0.0328, I was wrong.
The funding rate is still positive, and the account long/short ratio is nearly 2:1. The longs are paying the protection fee. Who lets go first? My bet is on the leveraged longs who just chased in. If they close, price will first look to the 4h EMA25 at 0.0331; if that doesn't hold, it may test 0.0328. Price is too far from the moving average right now, so there's no room to set a stop. I'm not catching this falling knife 😅
The longs are paying the protection fee. I'm waiting for them to let go.
Will 0.0345 hold, or will 0.0328 be the first to give way? Pick one—let's hear your 50-cent takes in the comments.
The stop is 5% below entry, and 0.0400 is 16% higher. I'll take that 3:1. The daily chart has just crossed above the EMA25, but it needs to hold there for the signal to count. The broader market is going nowhere while this one runs on its own—but even a fast runner needs someone to catch it.
📊 Direction: Wait for a pullback to go long
💰 Entry reference: Scale in if a retest of 0.0345 holds
🛑 Stop loss: Exit if 0.0328 breaks below the 4h EMA25
🎯 Take profit 1: Take half off before the previous high at 0.0400
🎯 Take profit 2: Reassess at the round-number level of 0.0450
$SKYAI #技术分析 #Uncle Twelve
9
Log in to explore more content
Join global crypto users on Binance Square
⚡️ Get latest and useful information about crypto.
💬 Trusted by the world’s largest crypto exchange.
👍 Discover real insights from verified creators.
Email / Phone number