
FlameKey
296 Posts

FlameKey
Report
Block User
个人推特:@Fkey666
行情分析丨知行合一丨合作X私信丨所有内容均不是投资建议,广告自辨丨 #币安 手续费八折 邀请码:CAI888
High-Frequency Trader
8.5 Years
21 Following
2.0K+ Followers
403 Liked
Posts
All
Quotes
Videos
Live
PINNED

·
--
Bullish
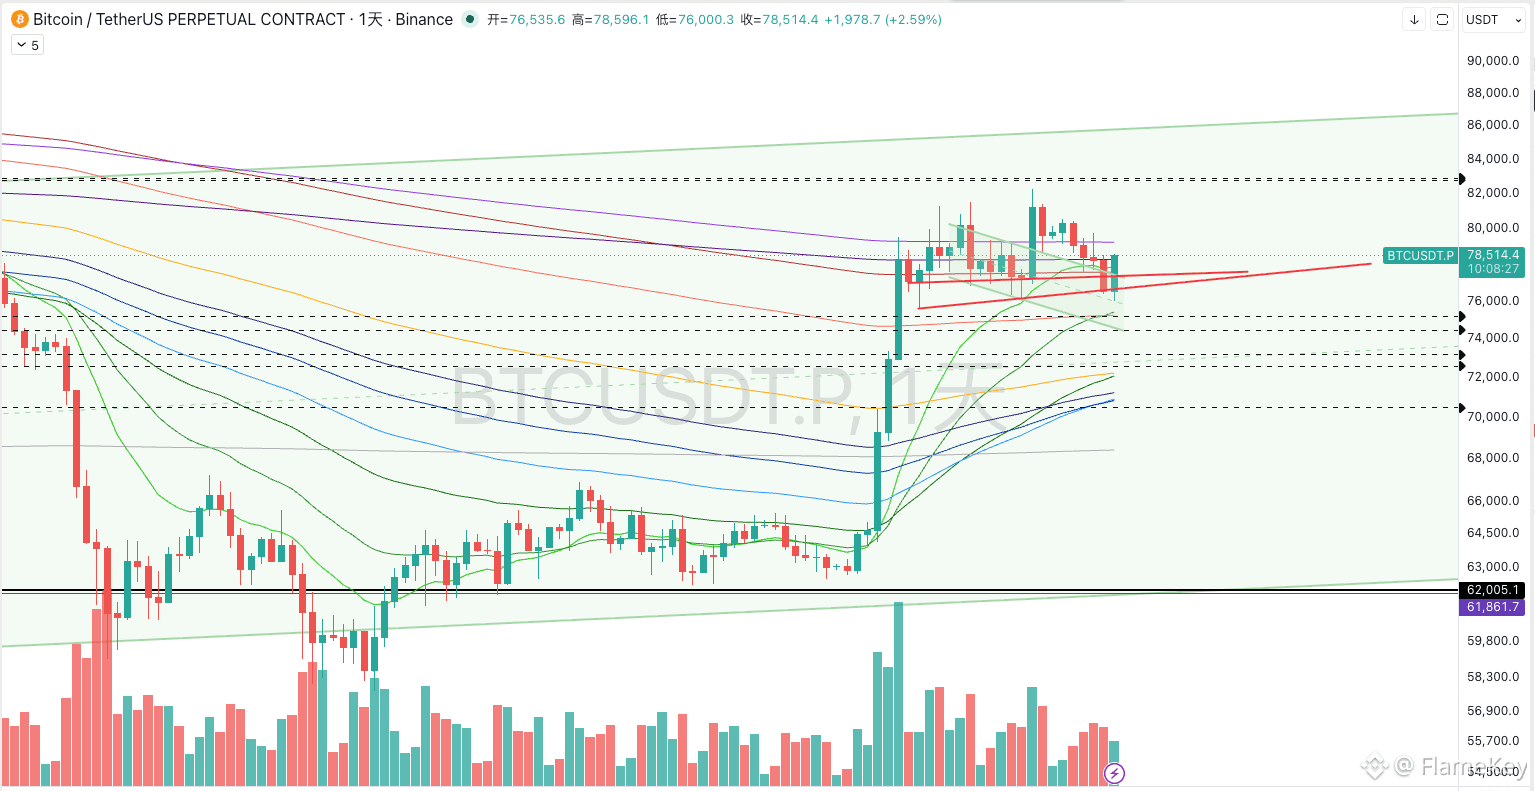
CPI data is good news, and the US stocks and $BTC both started to rally. If today BTC closes above 78,300, then the daily engulfing pattern will be confirmed. Then on the weekend, we’ll see altcoins and mreme put on a show!
$牛来 $我踏马来了 $marscoin are all great.
{future}(我踏马来了USDT)
{future}(牛来USDT)
{future}(BTCUSDT)
CPI data is good news, and the US stocks and $BTC both started to rally. If today BTC closes above 78,300, then the daily engulfing pattern will be confirmed. Then on the weekend, we’ll see altcoins and mreme put on a show!
$牛来 $我踏马来了 $marscoin are all great.
$牛来 $我踏马来了 $marscoin are all great.
1
3k
·
--
🎙️ CPI released soon, plus the weekend—be careful with orders
End
01 h 27 m 33 s
489
0
0
·
--
🎙️ The initial pullback is in place. What’s next—continue the pullback or switch to a rebound?
End
01 h 39 m 26 s
677
1
0
·
--
I’m taking today off, so there won’t be a livestream.
The overall market is still choppy. Don’t worry too much. The key date is still the 15th. With the fluctuations over the past two days, the small-cap alts should have some movement.
I’m taking today off, so there won’t be a livestream.
The overall market is still choppy. Don’t worry too much. The key date is still the 15th. With the fluctuations over the past two days, the small-cap alts should have some movement.
The overall market is still choppy. Don’t worry too much. The key date is still the 15th. With the fluctuations over the past two days, the small-cap alts should have some movement.
221
·
--
$牛来 available now! I choose to buy at $MARSCOIN
Hahahahahahahahaha The control rate of Niuniu is not as high as Mars's.
$牛来 available now! I choose to buy at $MARSCOIN
Hahahahahahahahaha The control rate of Niuniu is not as high as Mars's.
Hahahahahahahahaha The control rate of Niuniu is not as high as Mars's.
516
·
--
Bullish
$BTC If it reclaims 78500 here, it probably won’t fall below 77k in the short term. Then continue to maintain a high-level consolidation trend. Looking at $ETH ’s movement also means the same thing. If it keeps consolidating, then the altcoins will keep putting on a show.
Pull it up: $I’m fucking here, $GIGGLE , $Here comes the bull, $marscoin, bring
{future}(牛来USDT)
{future}(我踏马来了USDT)
{future}(MARSCOINUSDT)
$BTC If it reclaims 78500 here, it probably won’t fall below 77k in the short term. Then continue to maintain a high-level consolidation trend. Looking at $ETH ’s movement also means the same thing. If it keeps consolidating, then the altcoins will keep putting on a show.
Pull it up: $I’m fucking here, $GIGGLE , $Here comes the bull, $marscoin, bring
Pull it up: $I’m fucking here, $GIGGLE , $Here comes the bull, $marscoin, bring
329
·
--
🎙️ High-level consolidation is still ongoing, and this is a chance for the copycat season.
End
01 h 38 m 50 s
246
1
0
·
--
Bearish
Brothers, I'm taking a day off today and won't be streaming.
The non-farm payroll and unemployment data were somewhat bearish, so $BTC has already fallen back and retested. At the moment, BTC looks to be pulling back to around 79k~78.6k. If it holds steady, it can continue rising over the weekend.
{future}(BTCUSDT)
Brothers, I'm taking a day off today and won't be streaming.
The non-farm payroll and unemployment data were somewhat bearish, so $BTC has already fallen back and retested. At the moment, BTC looks to be pulling back to around 79k~78.6k. If it holds steady, it can continue rising over the weekend.
The non-farm payroll and unemployment data were somewhat bearish, so $BTC has already fallen back and retested. At the moment, BTC looks to be pulling back to around 79k~78.6k. If it holds steady, it can continue rising over the weekend.
348
·
--
62.8 bought spot $CRCLB finally it’s getting going too
{spot}(CRCLBUSDT)
62.8 bought spot $CRCLB finally it’s getting going too
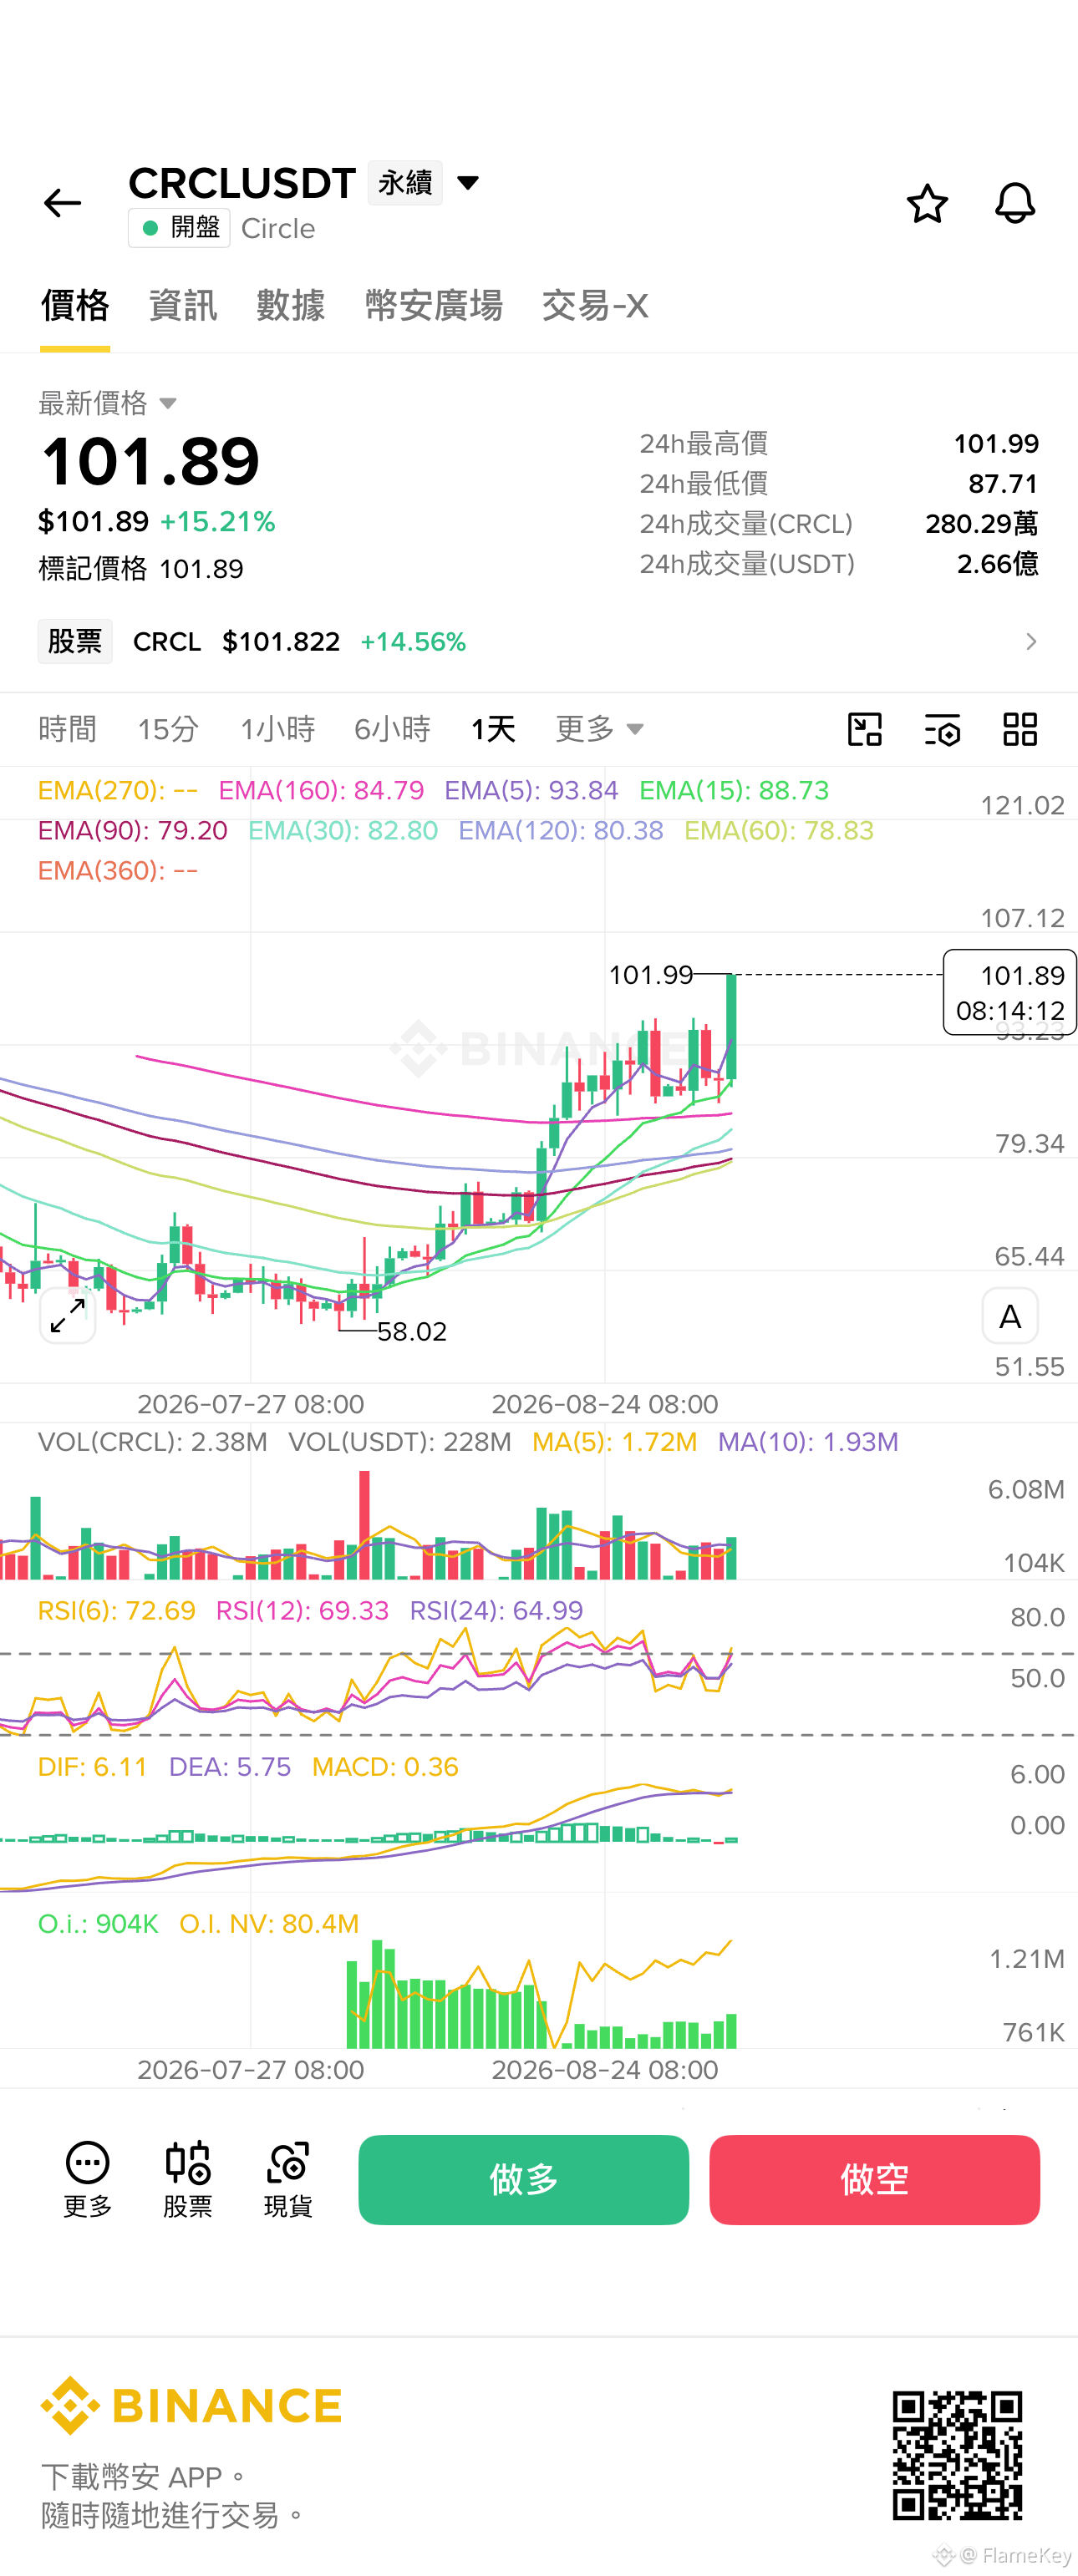
Sourced by user sharing on Binance
2k
·
--
Bullish
Bought a bit of $GIGGLE and $我踏马来了 as lottery tickets. The logic is that the distribution phase time is about right, and the fundamentals and overall condition are still okay. What if the rally starts in mid-September?
Also, one more thing about $牛来 —I think “bull” is a very good coin. Fast-track alpha and the derivatives market and contract also suggest the project is related and has connections. But the distribution time isn’t enough and the concentration of holdings isn’t high enough, so it may still need a shakeout. After the shakeout, I guess it will be around Chinese New Year.
{future}(牛来USDT)
{future}(我踏马来了USDT)
{future}(GIGGLEUSDT)
Bought a bit of $GIGGLE and $我踏马来了 as lottery tickets. The logic is that the distribution phase time is about right, and the fundamentals and overall condition are still okay. What if the rally starts in mid-September?
Also, one more thing about $牛来 —I think “bull” is a very good coin. Fast-track alpha and the derivatives market and contract also suggest the project is related and has connections. But the distribution time isn’t enough and the concentration of holdings isn’t high enough, so it may still need a shakeout. After the shakeout, I guess it will be around Chinese New Year.
Also, one more thing about $牛来 —I think “bull” is a very good coin. Fast-track alpha and the derivatives market and contract also suggest the project is related and has connections. But the distribution time isn’t enough and the concentration of holdings isn’t high enough, so it may still need a shakeout. After the shakeout, I guess it will be around Chinese New Year.
1
3
2k
·
--
🎙️ Enable callbacks and check the handoff status below.
End
02 h 15 m 46 s
3.3k
0
0
·
--
Bearish
Verified
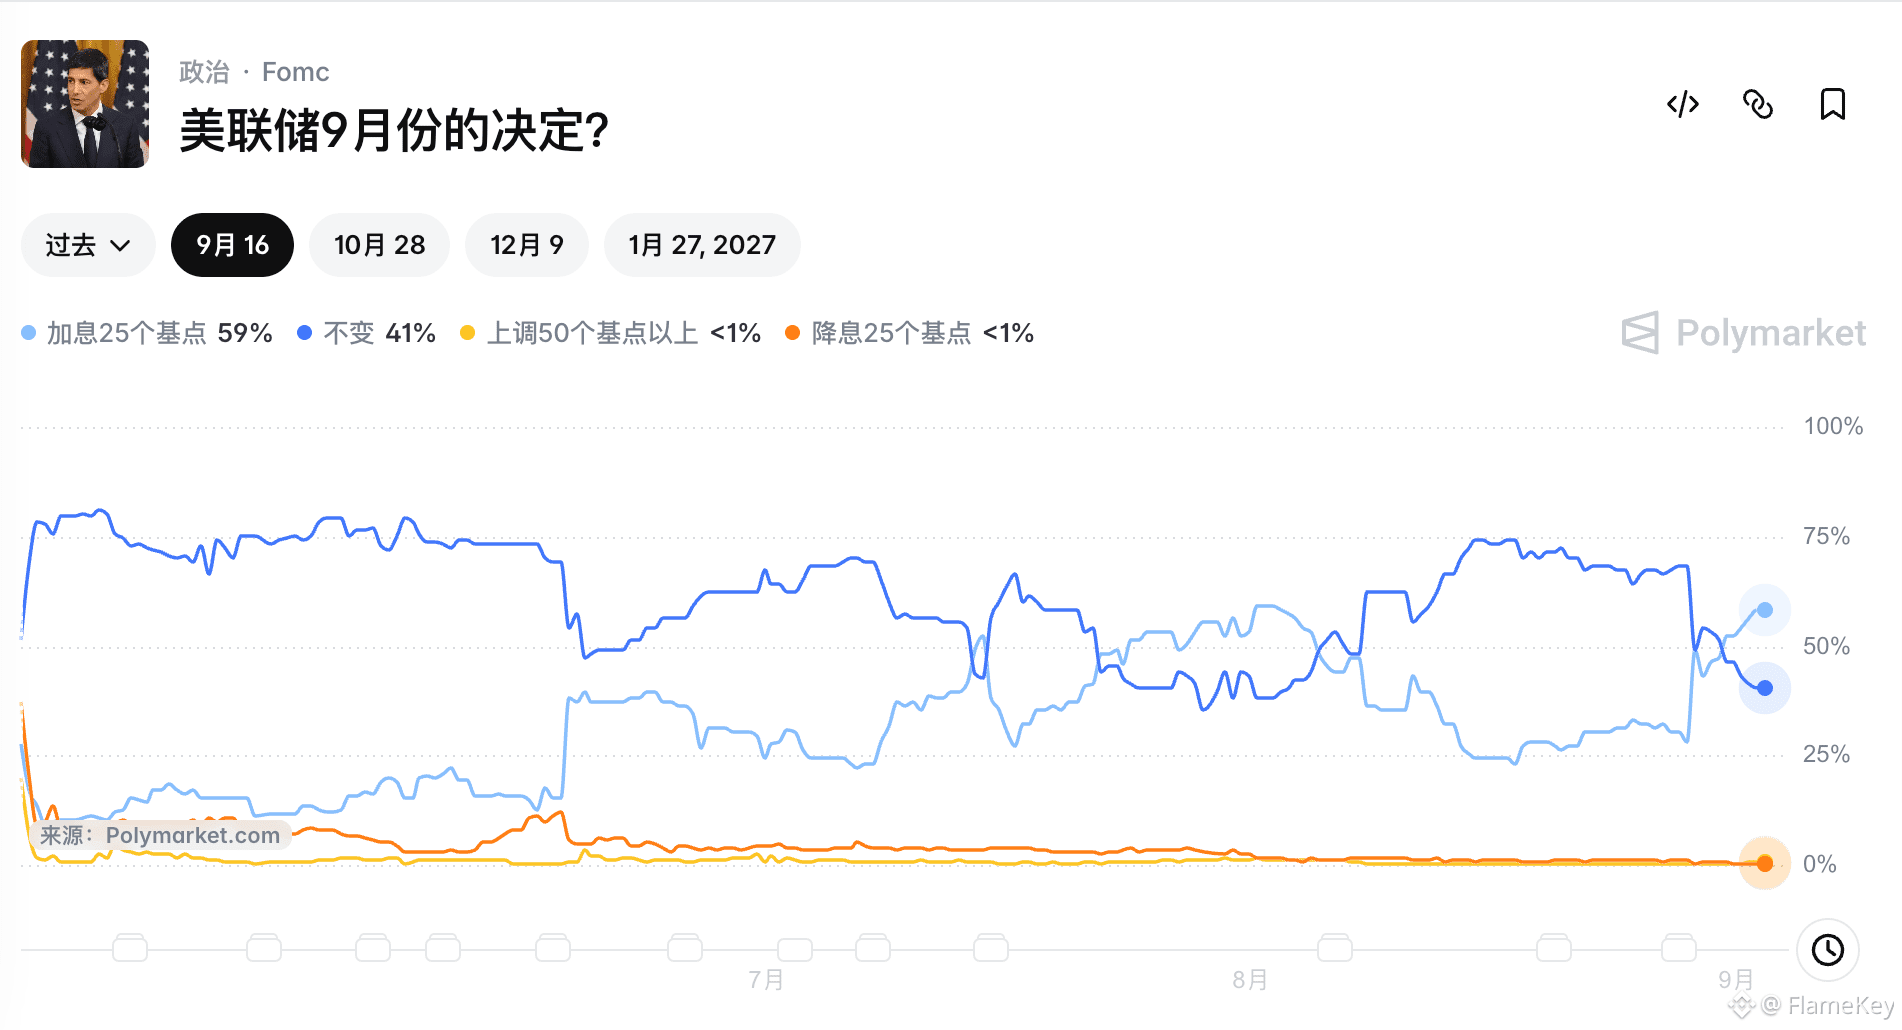
$BTC As scheduled, it fell, mainly due to two factors: the deterioration of the Iran-U.S. relationship, along with a higher expectation of a rate hike in September. Currently, the probability of a September rate hike is already close to 60%.
For Bitcoin here, a pullback needs to test the support around 75,500–75,000. If that breaks, then it should go to around 72,500.😅
{future}(BTCUSDT)
$BTC As scheduled, it fell, mainly due to two factors: the deterioration of the Iran-U.S. relationship, along with a higher expectation of a rate hike in September. Currently, the probability of a September rate hike is already close to 60%.
For Bitcoin here, a pullback needs to test the support around 75,500–75,000. If that breaks, then it should go to around 72,500.😅
For Bitcoin here, a pullback needs to test the support around 75,500–75,000. If that breaks, then it should go to around 72,500.😅
1
2
1.1k
·
--
🎙️ The turmoil is about to reach its end
End
02 h 15 m 24 s
399
0
0
·
--
Bearish
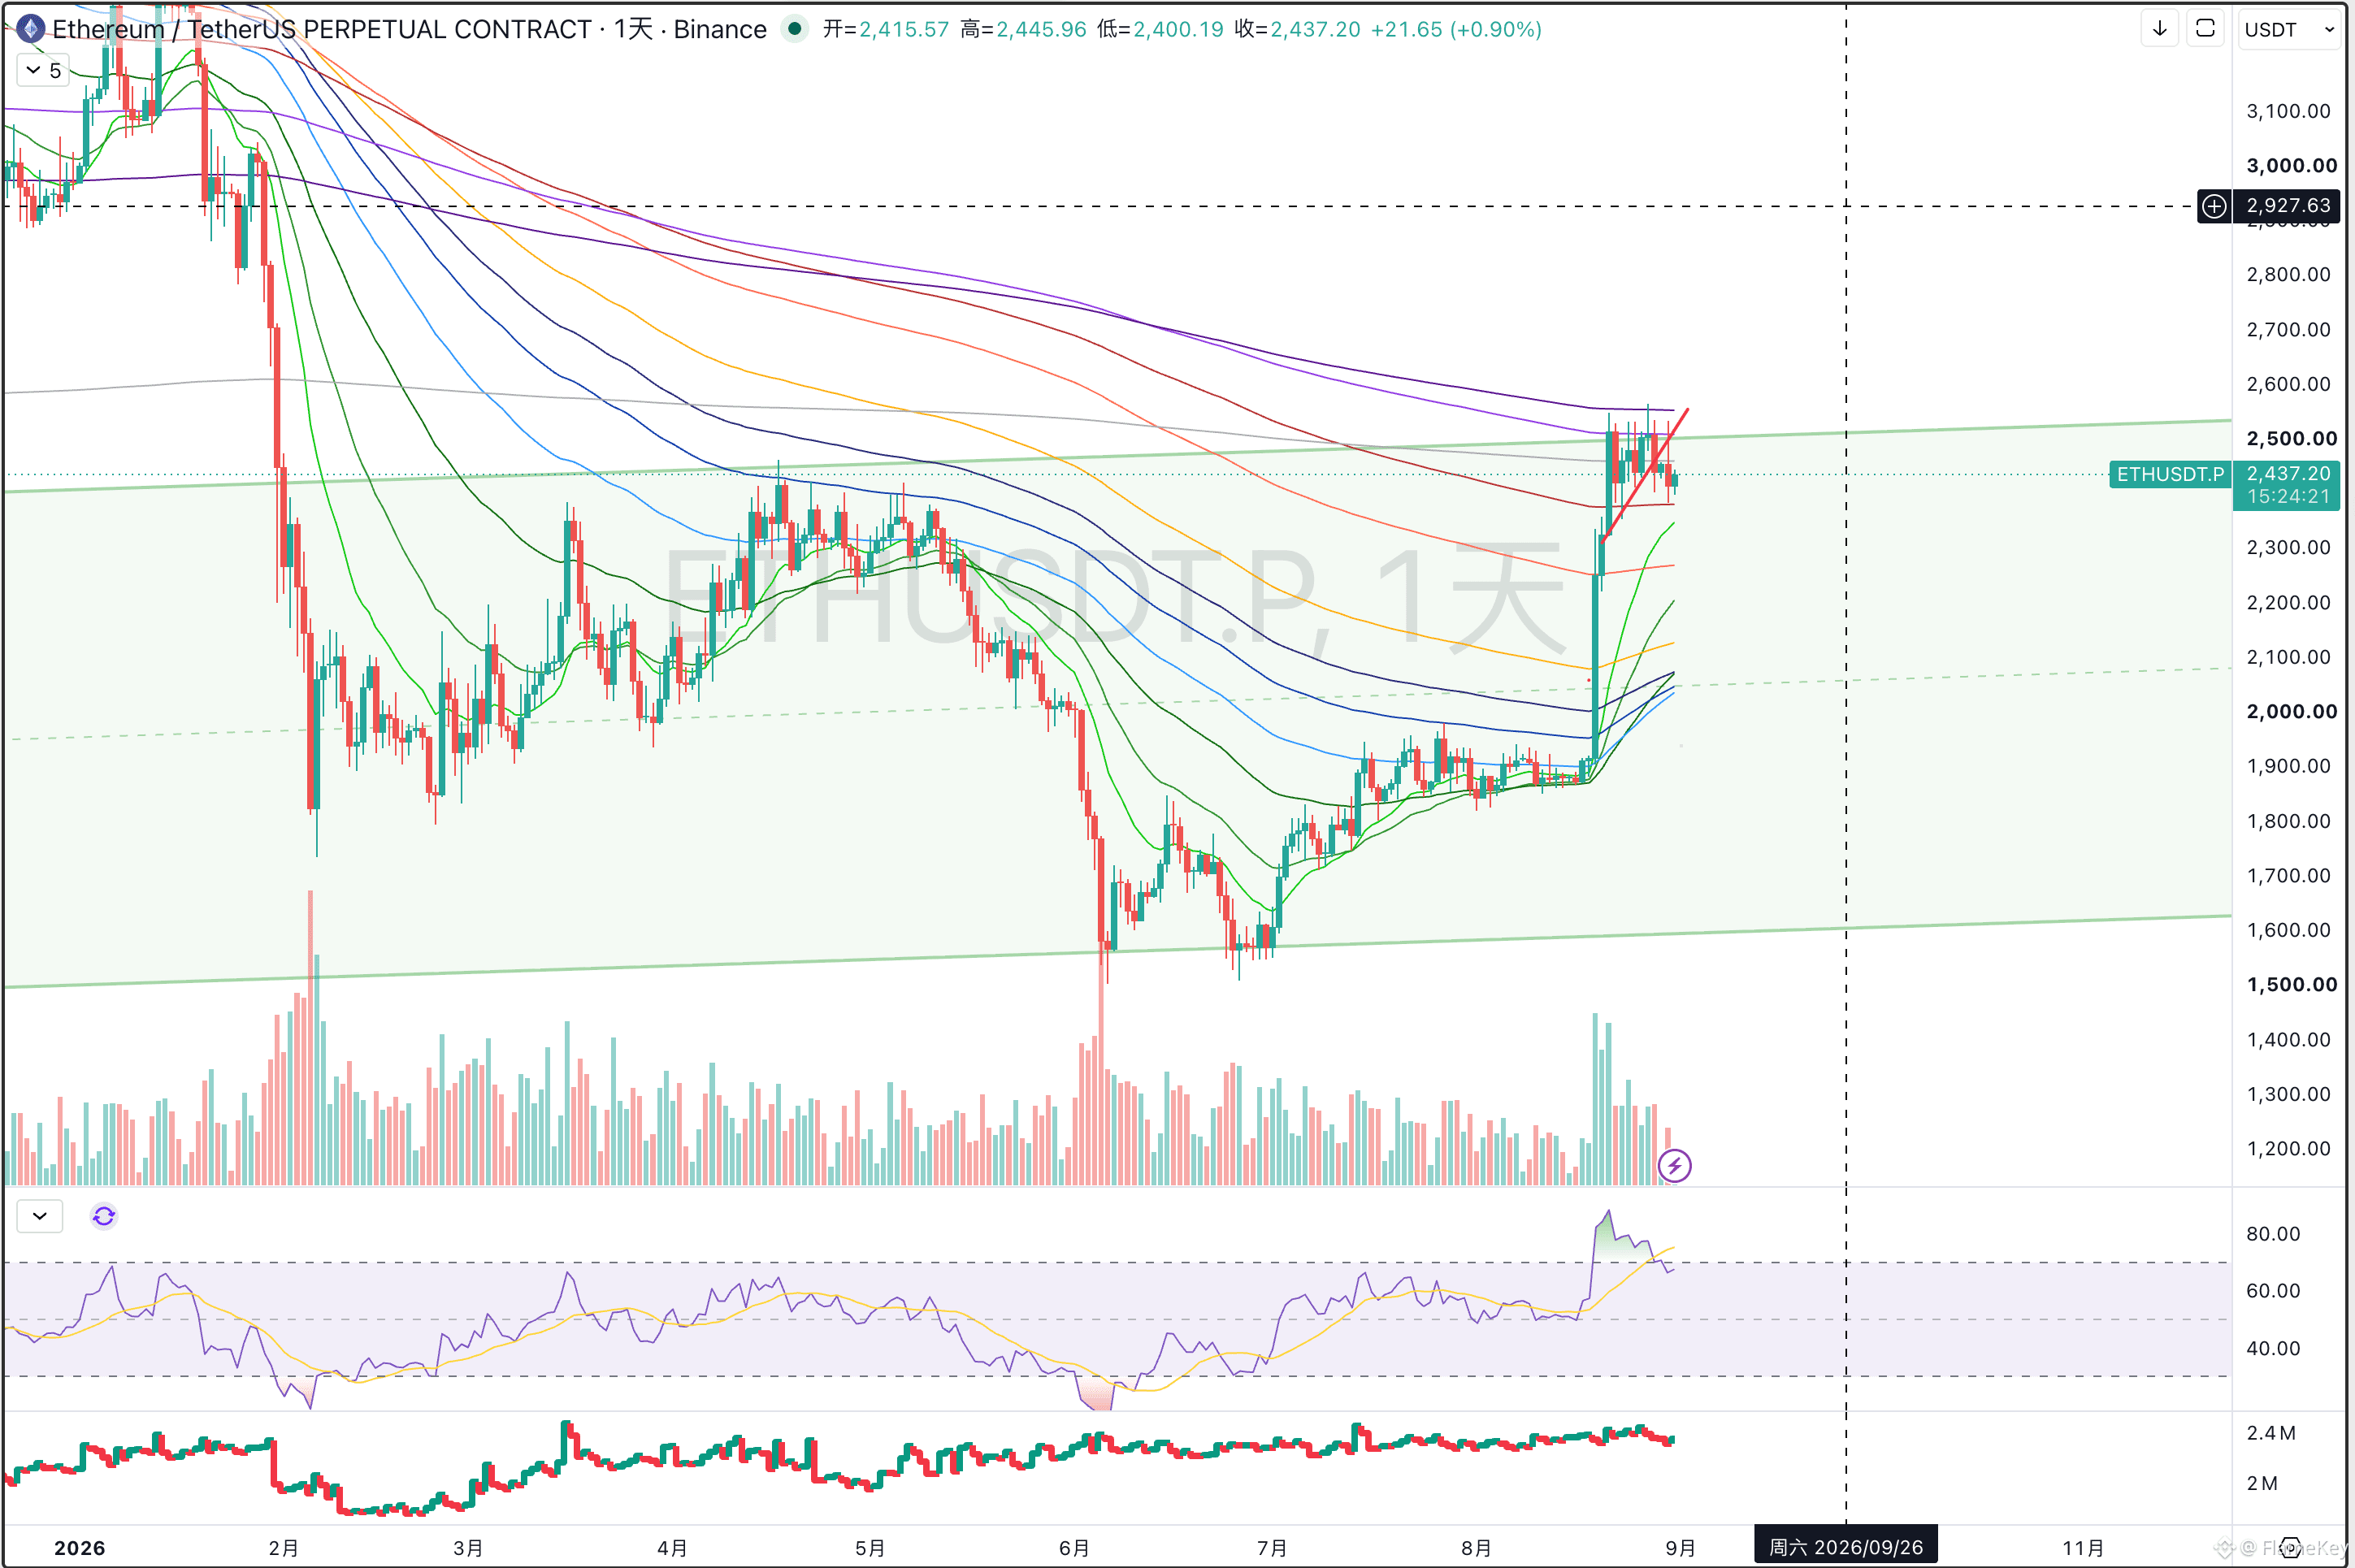
$ETH daily lines are in your control. Don’t be in a hurry—just extend the timeframe and you can make money.
{future}(ETHUSDT)
$ETH daily lines are in your control. Don’t be in a hurry—just extend the timeframe and you can make money.
411
·
--
🎙️ Under a high-level volatile range, the short-sell long-term bias remains unchanged.
End
01 h 03 m 54 s
239
0
0
·
--
Bearish
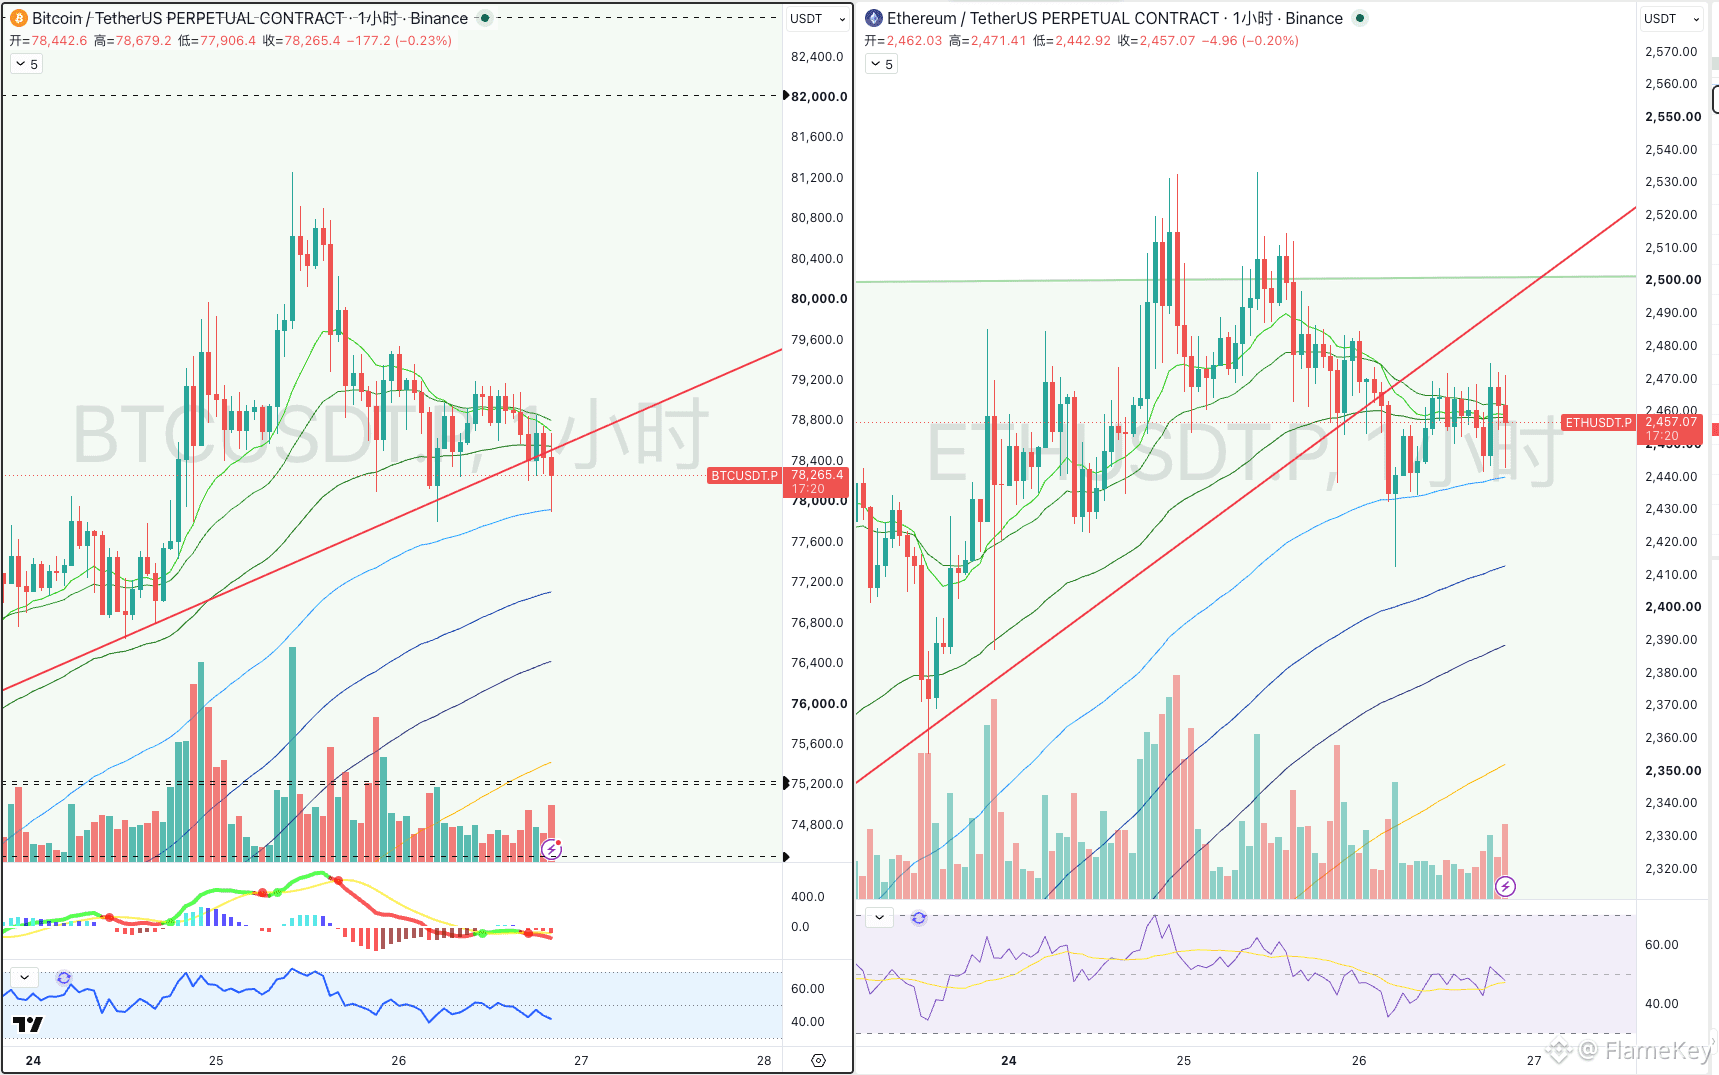
💹BTC August 26 Evening Market Analysis
Current price: $78,432
Analysis of the current price status
BTC is currently trading around $78,432 and has already approached the resistance near $78,515. On the upside, the main resistance area to watch is $78,515–$78,786. On the downside, the main support area to watch is $77,851–$78,239. This position is not suitable for chasing higher directly; it’s more appropriate to wait for a breakout and confirmation, or for a pullback to confirm. The daily RSI is overheated, so the risk-reward ratio for chasing is reduced.
Technical analysis outlook for BTC
The technical outlook is: overall bearish, and in the short term, any rallies should mainly serve as confirmation of resistance. 1-hour price is below the SMA20, and 4-hour price is also below the SMA20; however, the daily price is above the SMA20. The 1-hour MACD remains weak, and the 4-hour MACD remains weak. The 1-hour RSI is 43.3, the 4-hour RSI is 56.7, and the daily RSI is 79.5. Price is trading below the Bollinger middle band; the lower band reference is $78,239. Current volume is close to the average—temporarily, treat it as a normal range-bound consolidation.
Key levels
Support: $78,239, $77,851, $76,661, $75,952
Resistance: $78,515, $78,786, $79,333, $80,369
💹ETH August 26 Evening Market Analysis
Current price: $2,462
Analysis of the current price status
ETH is currently trading around $2,462 and has already approached support near $2,460. On the upside, the main resistance area to watch is $2,465–$2,476. On the downside, the main support area to watch is $2,438–$2,460. This position is not suitable for chasing shorting directly; it’s more appropriate to wait for confirmation of support holding or breaking. The daily RSI is overheated, so the risk-reward ratio for chasing is reduced.
Technical analysis outlook for ETH
The technical outlook is: bullish on the larger timeframe, with short-term consolidation and repair. 1-hour price is above the SMA20, and 4-hour price is also above the SMA20; the daily price is above the SMA20. The 1-hour MACD histogram is positive, while the 4-hour MACD negative histogram is narrowing. The 1-hour RSI is 49.4, the 4-hour RSI is 58.0, and the daily RSI is 75.9. Price is trading above the Bollinger middle band; overhead pressure reference is $2,477. Current volume is close to the average—temporarily, treat it as a normal range-bound consolidation.
Key levels
Support: $2,460, $2,438, $2,426, $2,415
Resistance: $2,465, $2,476, $2,504, $2,533
For reference only and does not constitute investment advice.
💹BTC August 26 Evening Market Analysis
Current price: $78,432
Analysis of the current price status
BTC is currently trading around $78,432 and has already approached the resistance near $78,515. On the upside, the main resistance area to watch is $78,515–$78,786. On the downside, the main support area to watch is $77,851–$78,239. This position is not suitable for chasing higher directly; it’s more appropriate to wait for a breakout and confirmation, or for a pullback to confirm. The daily RSI is overheated, so the risk-reward ratio for chasing is reduced.
Technical analysis outlook for BTC
The technical outlook is: overall bearish, and in the short term, any rallies should mainly serve as confirmation of resistance. 1-hour price is below the SMA20, and 4-hour price is also below the SMA20; however, the daily price is above the SMA20. The 1-hour MACD remains weak, and the 4-hour MACD remains weak. The 1-hour RSI is 43.3, the 4-hour RSI is 56.7, and the daily RSI is 79.5. Price is trading below the Bollinger middle band; the lower band reference is $78,239. Current volume is close to the average—temporarily, treat it as a normal range-bound consolidation.
Key levels
Support: $78,239, $77,851, $76,661, $75,952
Resistance: $78,515, $78,786, $79,333, $80,369
💹ETH August 26 Evening Market Analysis
Current price: $2,462
Analysis of the current price status
ETH is currently trading around $2,462 and has already approached support near $2,460. On the upside, the main resistance area to watch is $2,465–$2,476. On the downside, the main support area to watch is $2,438–$2,460. This position is not suitable for chasing shorting directly; it’s more appropriate to wait for confirmation of support holding or breaking. The daily RSI is overheated, so the risk-reward ratio for chasing is reduced.
Technical analysis outlook for ETH
The technical outlook is: bullish on the larger timeframe, with short-term consolidation and repair. 1-hour price is above the SMA20, and 4-hour price is also above the SMA20; the daily price is above the SMA20. The 1-hour MACD histogram is positive, while the 4-hour MACD negative histogram is narrowing. The 1-hour RSI is 49.4, the 4-hour RSI is 58.0, and the daily RSI is 75.9. Price is trading above the Bollinger middle band; overhead pressure reference is $2,477. Current volume is close to the average—temporarily, treat it as a normal range-bound consolidation.
Key levels
Support: $2,460, $2,438, $2,426, $2,415
Resistance: $2,465, $2,476, $2,504, $2,533
For reference only and does not constitute investment advice.
Current price: $78,432
Analysis of the current price status
BTC is currently trading around $78,432 and has already approached the resistance near $78,515. On the upside, the main resistance area to watch is $78,515–$78,786. On the downside, the main support area to watch is $77,851–$78,239. This position is not suitable for chasing higher directly; it’s more appropriate to wait for a breakout and confirmation, or for a pullback to confirm. The daily RSI is overheated, so the risk-reward ratio for chasing is reduced.
Technical analysis outlook for BTC
The technical outlook is: overall bearish, and in the short term, any rallies should mainly serve as confirmation of resistance. 1-hour price is below the SMA20, and 4-hour price is also below the SMA20; however, the daily price is above the SMA20. The 1-hour MACD remains weak, and the 4-hour MACD remains weak. The 1-hour RSI is 43.3, the 4-hour RSI is 56.7, and the daily RSI is 79.5. Price is trading below the Bollinger middle band; the lower band reference is $78,239. Current volume is close to the average—temporarily, treat it as a normal range-bound consolidation.
Key levels
Support: $78,239, $77,851, $76,661, $75,952
Resistance: $78,515, $78,786, $79,333, $80,369
💹ETH August 26 Evening Market Analysis
Current price: $2,462
Analysis of the current price status
ETH is currently trading around $2,462 and has already approached support near $2,460. On the upside, the main resistance area to watch is $2,465–$2,476. On the downside, the main support area to watch is $2,438–$2,460. This position is not suitable for chasing shorting directly; it’s more appropriate to wait for confirmation of support holding or breaking. The daily RSI is overheated, so the risk-reward ratio for chasing is reduced.
Technical analysis outlook for ETH
The technical outlook is: bullish on the larger timeframe, with short-term consolidation and repair. 1-hour price is above the SMA20, and 4-hour price is also above the SMA20; the daily price is above the SMA20. The 1-hour MACD histogram is positive, while the 4-hour MACD negative histogram is narrowing. The 1-hour RSI is 49.4, the 4-hour RSI is 58.0, and the daily RSI is 75.9. Price is trading above the Bollinger middle band; overhead pressure reference is $2,477. Current volume is close to the average—temporarily, treat it as a normal range-bound consolidation.
Key levels
Support: $2,460, $2,438, $2,426, $2,415
Resistance: $2,465, $2,476, $2,504, $2,533
For reference only and does not constitute investment advice.
878
Log in to explore more content
Join global crypto users on Binance Square
⚡️ Get latest and useful information about crypto.
💬 Trusted by the world’s largest crypto exchange.
👍 Discover real insights from verified creators.
Email / Phone number
Trending Topics
AnthropicCEOCallsForAISlowdown
17,019 views
332 Discussing
#anthropicceocallsforaislowdown Three of the world's top artificial intelligence companies' CEOs announced Saturday that they believe the industry needs to slow down
.
On Saturday, Dario Amodei of
Anthropic, Sam Altman of OpenAI and Elon Musk of xAI publicly backed a call to reduce the pace at which AI companies build more powerful models.$IOTX $WAXP $0G
Isabella-I
·1 Likes
·504 views
AnthropicChoosesNasdaqForPotentialIPO
4,197 views
98 Discussing
SECReceivesGrayscaleLitecoinTrustETFFiling
136,648 views
1,845 Discussing