

Focabieu
246 Posts

Focabieu
Report
Block User
Me gustan las focas :D
82 Following
77 Followers
138 Liked
Posts
·
--
Why are there so many content creators who use their followers as exit liquidity for certain positions? From now on, I’ll definitely only trust my own analysis lol
Why are there so many content creators who use their followers as exit liquidity for certain positions? From now on, I’ll definitely only trust my own analysis lol
1
86
·
--
Well, the Fed’s decision is coming up, and although they’re most likely to keep rates unchanged, what matters will be their tone and the clues they give us about what’s next xd.
If the tone is more dovish, we could see a bit of optimism in $BTC and crypto, but if they get more hawkish, there could be downward pressure for a while.
For now, I’d rather stay a little away from the market and wait to see how it reacts before looking for entries. There’s no point in jumping the gun and getting caught in a false breakout, although personally I’m hoping for positive news that will push prices up and give the market a bit of relief :v
Sometimes not trading is part of the strategy too :))
$USAR
#bitcoin #CryptoNewss #FedMeeting #trading
220
·
--
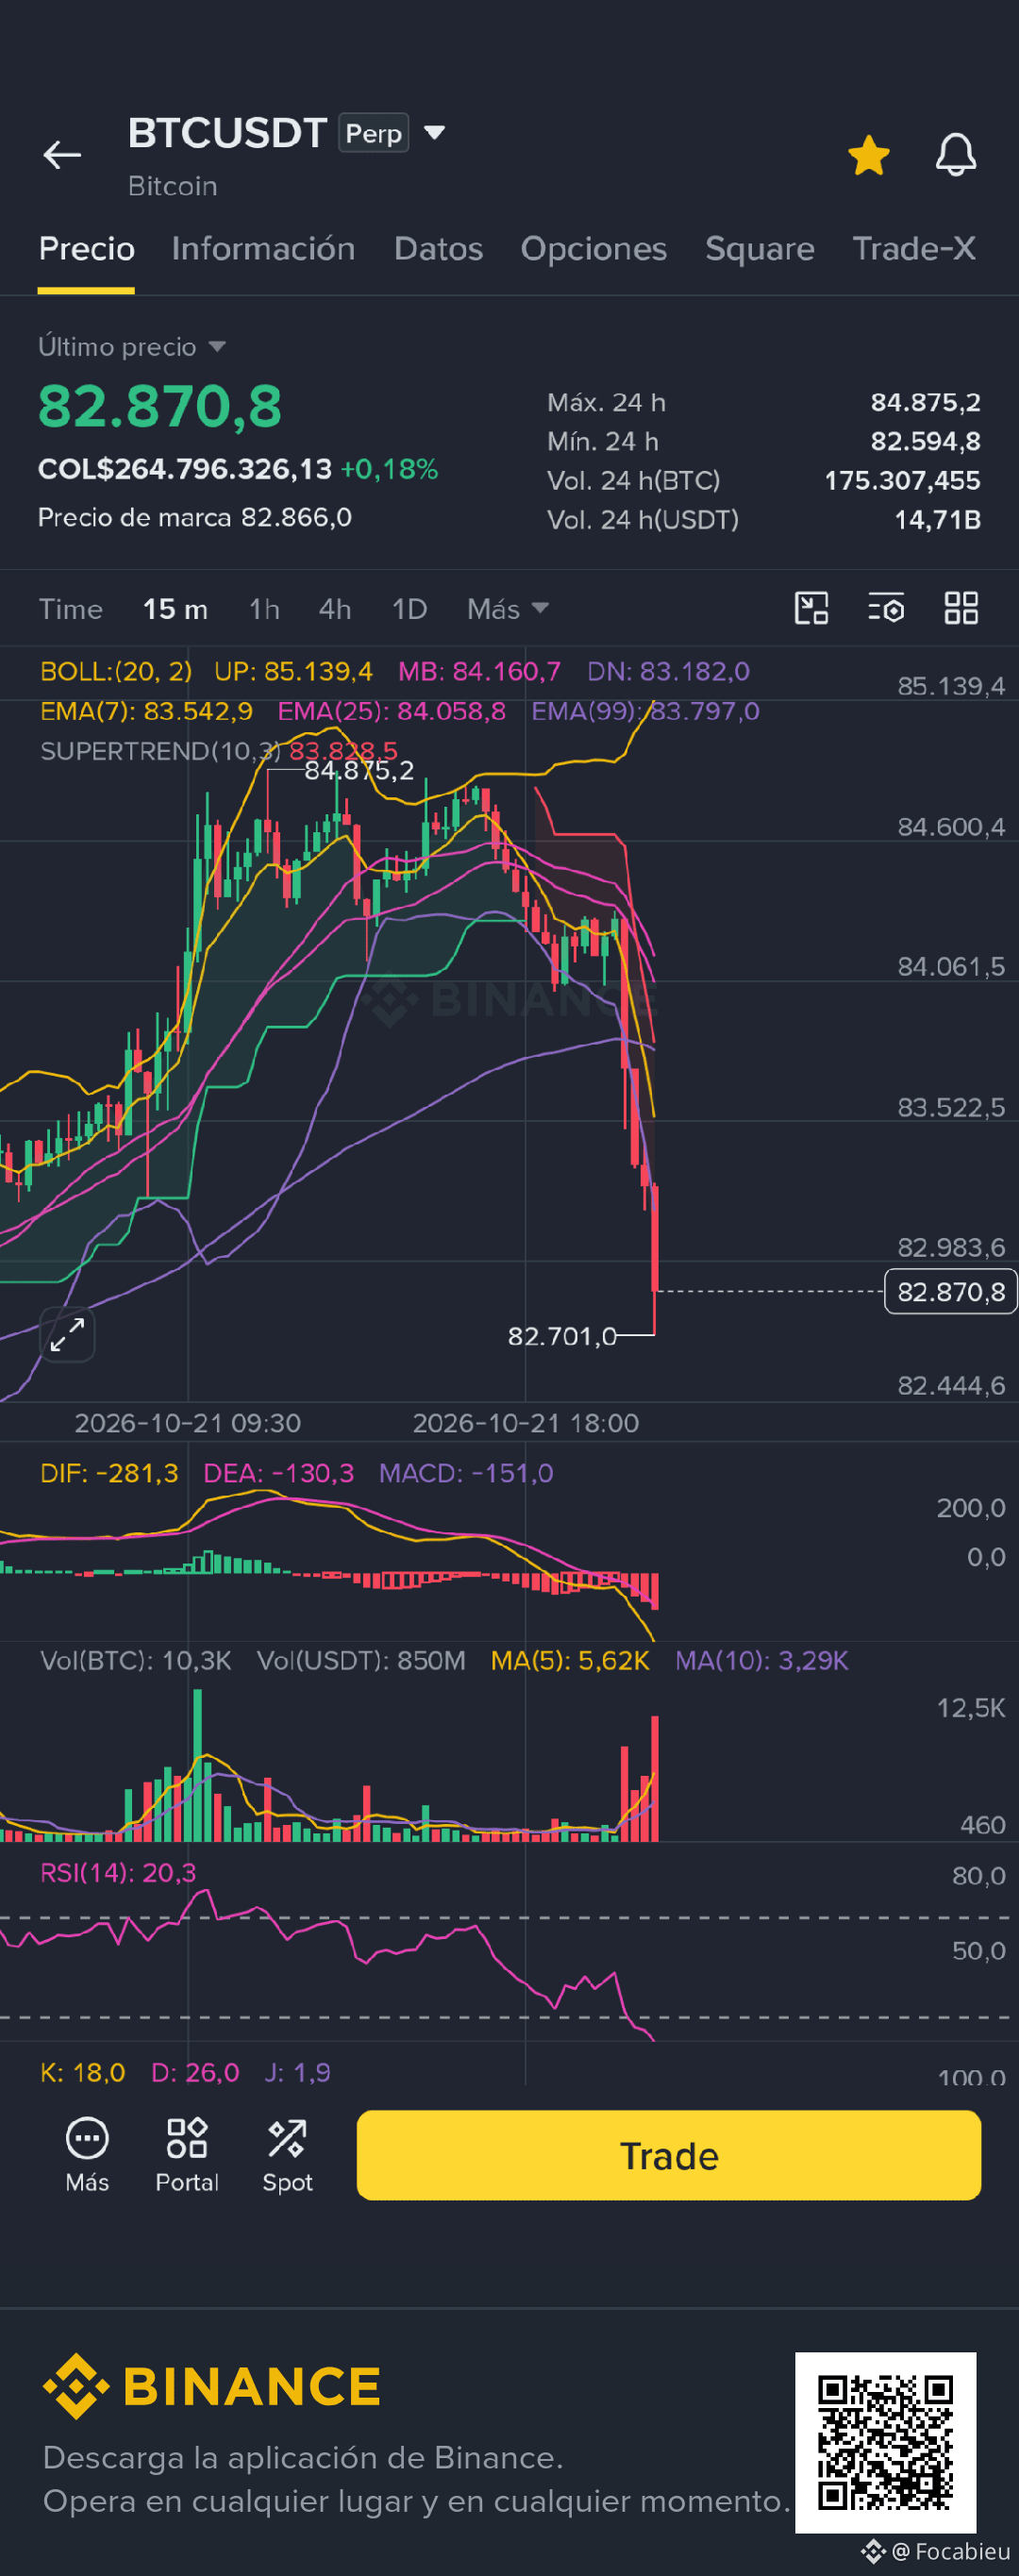
I hope they closed their longs. If it keeps falling, it’ll drag most of the market down 😿
I hope they closed their longs. If it keeps falling, it’ll drag most of the market down 😿
1
642
·
--
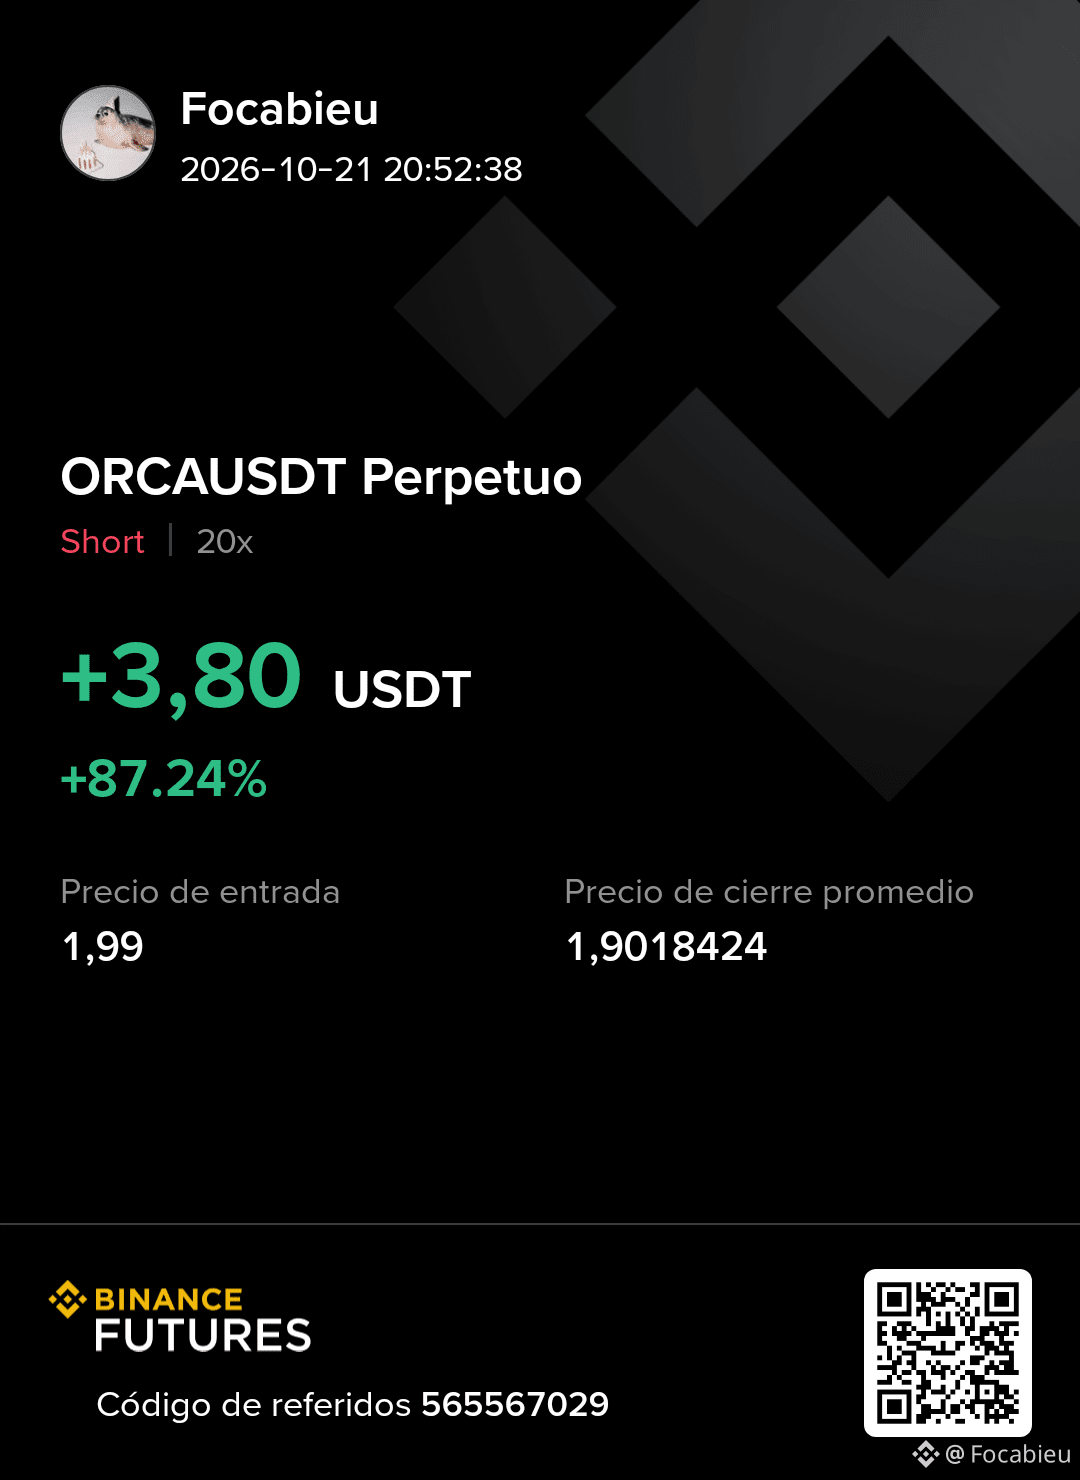
Well, I entered with little margin a few minutes earlier because I saw that $BTC was showing weakness. 3 minutes later, my TP hit⛳😷. Still, be careful about opening longs right now—the market is way too weird, so there will probably be quite a few red candles when it opens tomorrow.
$ORCA
Well, I entered with little margin a few minutes earlier because I saw that $BTC was showing weakness. 3 minutes later, my TP hit⛳😷. Still, be careful about opening longs right now—the market is way too weird, so there will probably be quite a few red candles when it opens tomorrow.
$ORCA
$ORCA
1
551
·
--
The TPs lined up, but not the entry. I was going to place it at 85.1, but to improve the R:R I went with the recent low. It usually drops and then rises, but oh well, it’s fine 😼 $CRCL
The TPs lined up, but not the entry. I was going to place it at 85.1, but to improve the R:R I went with the recent low. It usually drops and then rises, but oh well, it’s fine 😼 $CRCL
207
·
--
Bullish
$CRCL — Long
Well, with CRCL, I've noticed a certain pattern that I've seen repeat several times at market open: first it drops quite sharply, then it pumps, which could be related to a liquidity move, and then it continues falling.
Obviously, that doesn't mean it'll definitely happen again, but I think it's interesting to keep in mind when considering a possible entry, since if the price reacts similarly again, there could be an opportunity to take advantage of that move.
I'm thinking of entering at 84.60, looking for a possible bounce toward 87.00, with an SL at 83.60. The idea is to give the price room to move without invalidating the setup too soon, although everything will depend on how the market behaves at the open lol.
I'm placing the SL below the 99 EMA on the 15M timeframe and the lower Bollinger Band on that same timeframe. Basically, I'm using these technical reference points to define my exit level, although that doesn't mean they'll act as infallible support.
This setup is only valid before the market opens.
My setup:
Entry: 84.70
TP: 86.3 - 87.00
SL: 83.60
This is a speculative trade based on a pattern I've seen, and it could stop repeating at any time. The open can bring quite a bit of volatility, so I'm not planning to enter blindly just because the chart has done something similar before.
I'm using low leverage and defined risk management, because if the price invalidates my idea, I'll just close the trade. There's no point getting stuck waiting for the market to do what you want lol.
If you're going to trade CRCL, do your own research, calculate your position size, and don't risk money you can't afford to lose. An SL also doesn't guarantee an exact execution at the set price if there's slippage or sharp price movements.
As I always say, this is my technical analysis, not a guarantee of anything. Do your own research before copying any entry, including mine :v
3
266
·
--
Bearish
$BAT — Short 📉
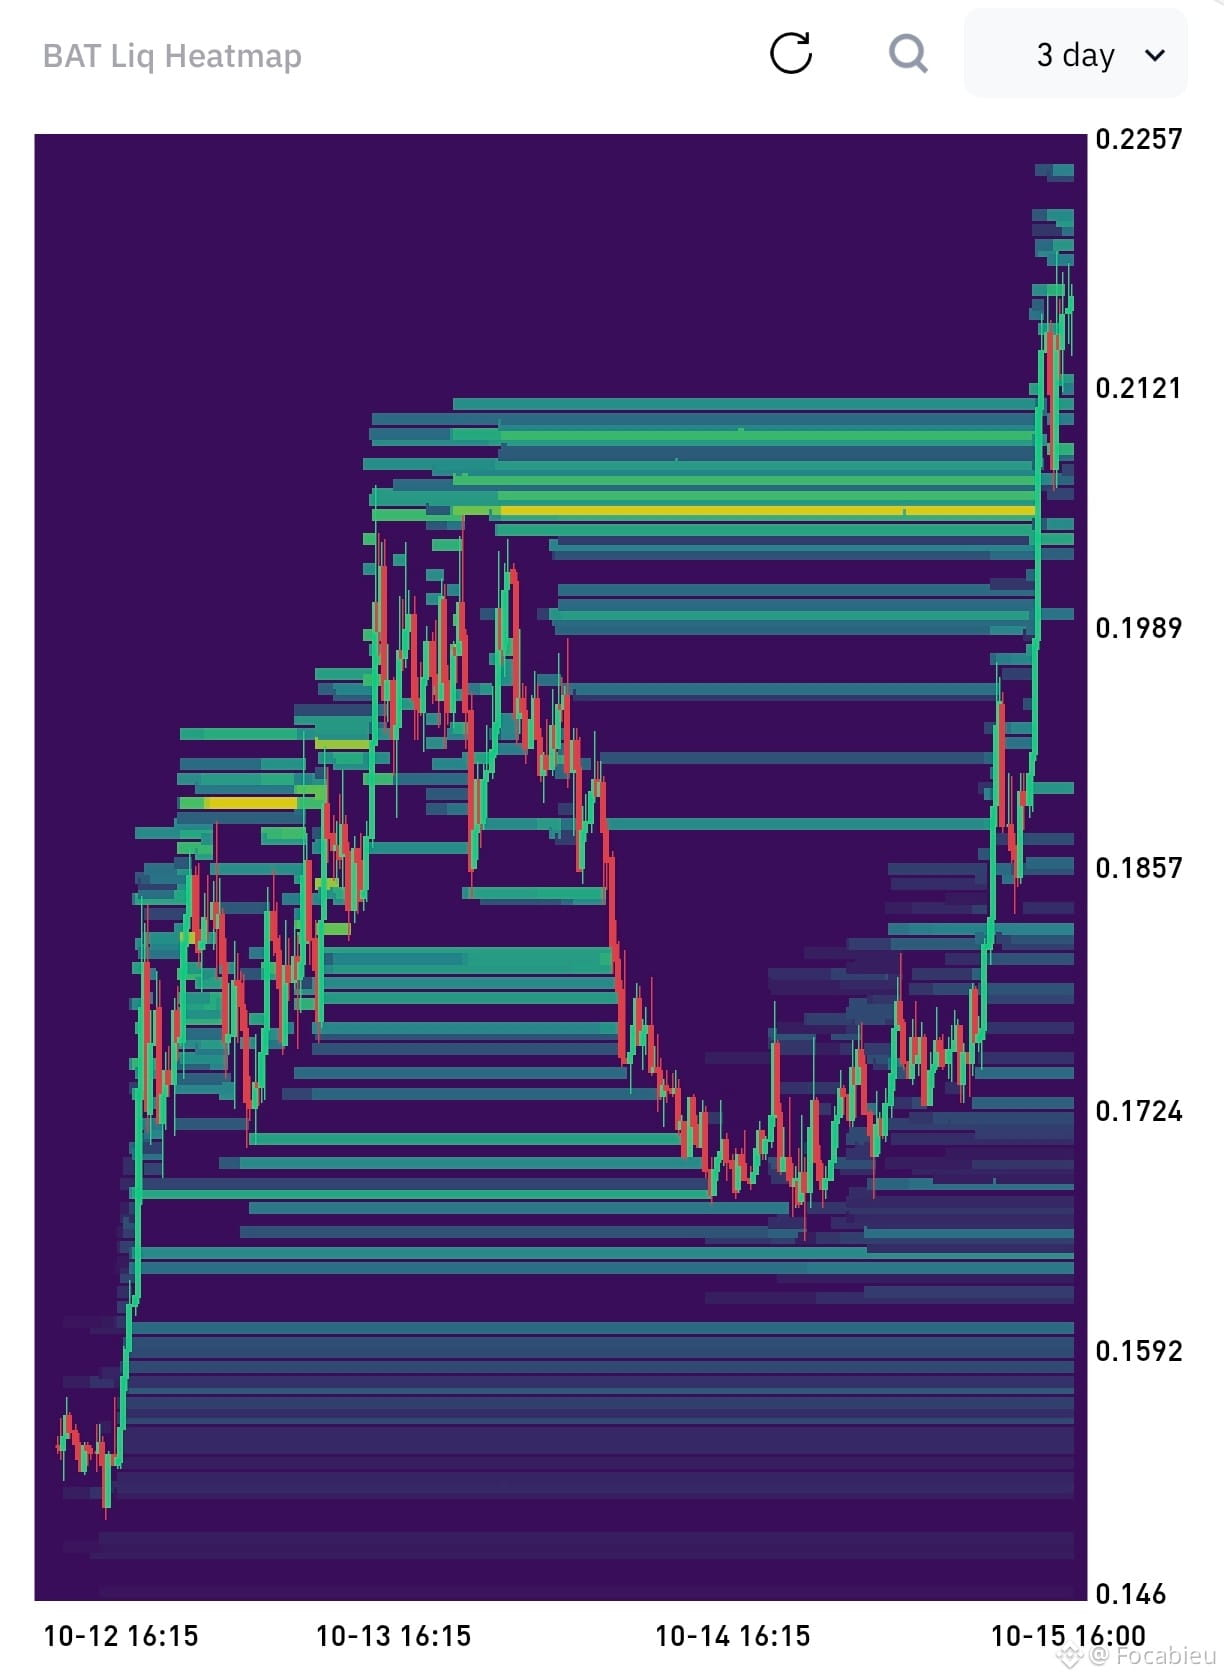
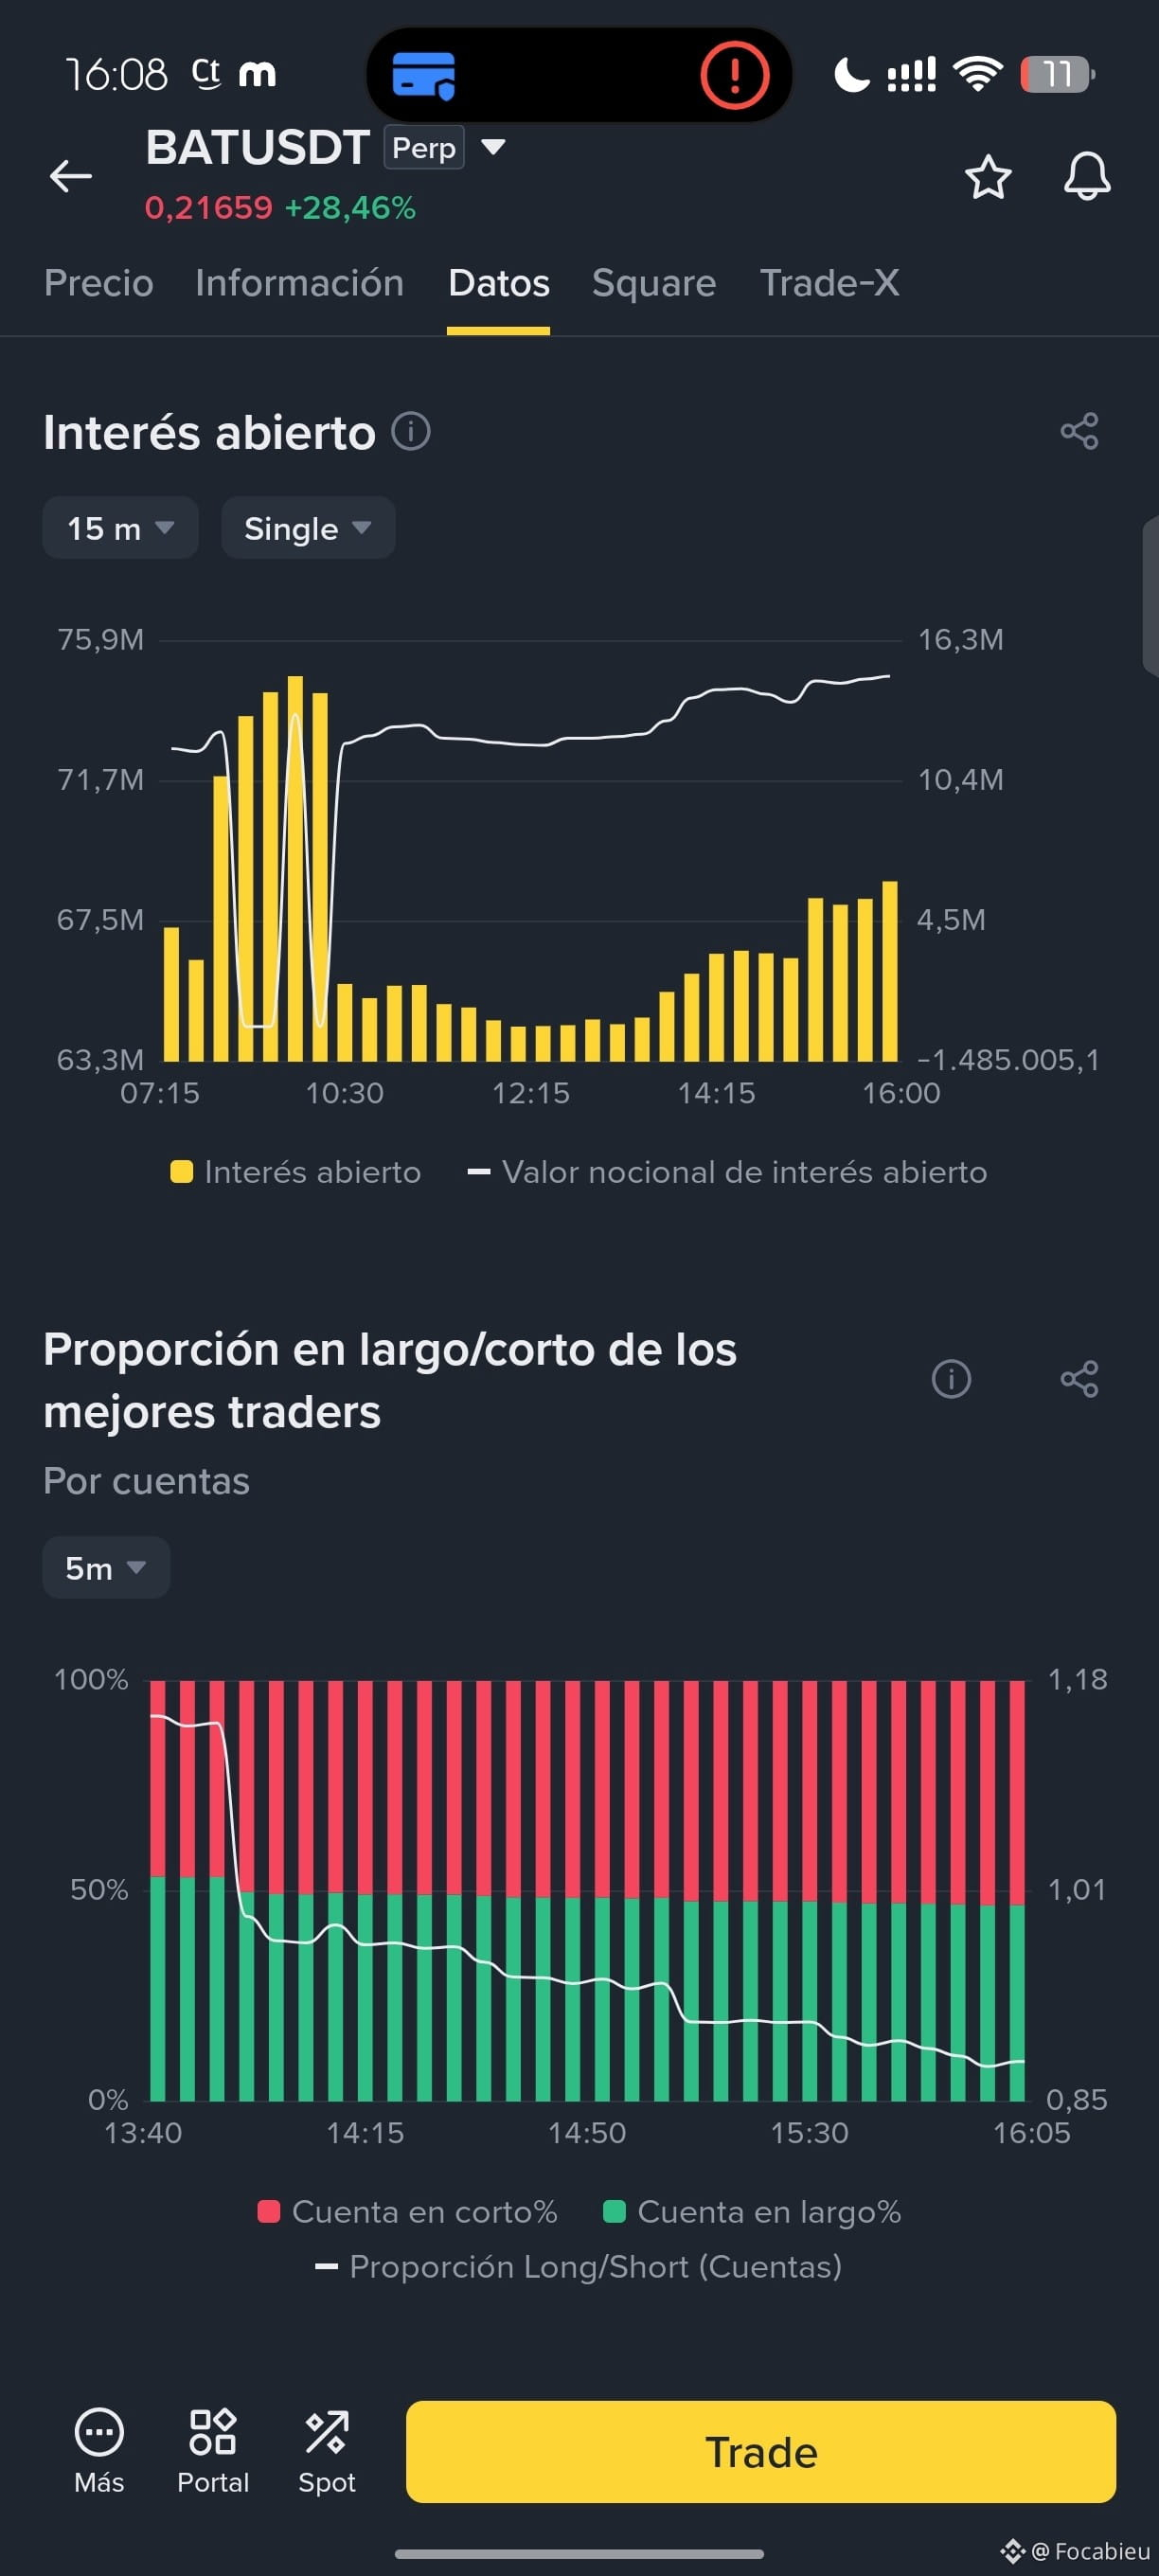
Well, with BAT I'm looking to take advantage of a possible correction after a pretty vertical move up. The price rose more than 28% in 24H, and the RSI is overbought on both the 1H (73.34) and 15M (73.51) timeframes.
The Bollinger Bands also show the price extending significantly away from its average. If it starts losing momentum, it could look for a correction toward lower levels, although being overbought doesn't mean it's definitely going to fall.
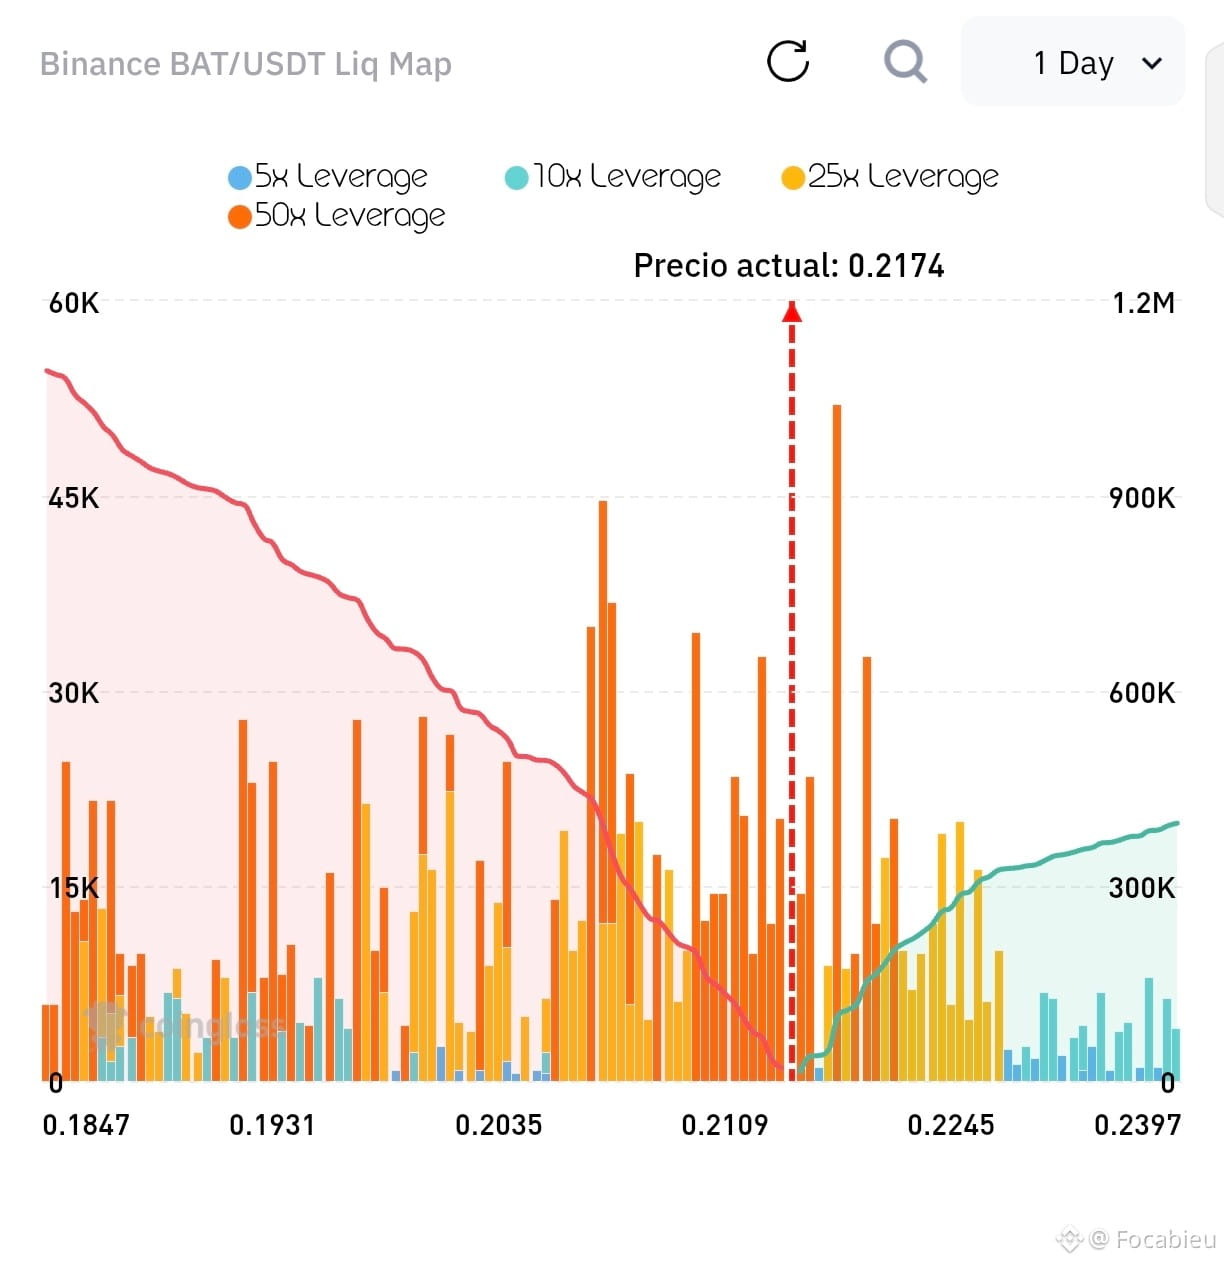
The liquidation map shows interesting zones below the price, between 0.210 and 0.180, which could obviously become relevant if those support levels break. Also, the Long/Short Ratio for top accounts is close to 0.85, reflecting a relatively greater share of short positions in that indicator, although this doesn't guarantee a drop.
Also, the price has been trying to break 0.21994 for more than 2 hours, still without success. So either there's not enough buying pressure, or the sellers are about to take control xd
My setup:
My entry was at 0.2175, although I wouldn't rule out 0.223 as a possible entry too :v
SL: 0.235
TP: 0.180-0.187
The risk is 0.0175 per token for a potential move of 0.0375, with an approximate risk/reward ratio of 1:2.14 xd.
I'm using low leverage because BAT could still keep rising or make a wick toward higher levels before correcting. If the price hits my SL, I'll close, no exceptions—because you can't always be right, no matter how many charts you look at. I'm not going to get stuck waiting for the market to do what I want xd, like a ceeertain coin the other day.
If you're going to enter, obviouslyyy use a small position and calculate the risk based on your own capital. Don't use all your margin just because, and don't copy the entry blindly either; the price could keep rising, and the SL doesn't guarantee an exact execution.
As I always say, this is my technical analysis, obviously not a guarantee of anything. Do your own research before copying any entry, including mine. :v
121
·
--
Bearish
Disputed
$TZA - Possible drop tomorrow
It's currently at 50.8, and I think tomorrow's unemployment claims will come in steady, that is, close to expectations. This could benefit the Russell 2000 and cause $TZA to drop to 47–48 ONLY IF the Russell 2000 rises.
We'll still have to see how the market reacts, because one thing is the data and another is what the price has already priced in, lol.
For now, my bias is bearish, but we'll see what happens tomorrow. I'm not entering any positions just yet :v
Do your own research and manage your risk. This time, this is for informational purposes only.
3
165
·
--
Update on my post about $WAL : I spent about half an hour writing it, and it's already making a move. I'm sorry 😭 I'll close now since I didn't post it sooner :( However, I wouldn't rule out it going back up to 0.06–0.059 and then dropping further from there.
Update on my post about $WAL : I spent about half an hour writing it, and it's already making a move. I'm sorry 😭 I'll close now since I didn't post it sooner :( However, I wouldn't rule out it going back up to 0.06–0.059 and then dropping further from there.
7
2
502
·
--
Bearish
$WAL — Short 📉
After BTW, I learned an expensive lesson, so to speak xd. I entered a short position, and when the price broke through my SL, I didn’t close it. I stayed in, hoping they’d “get tired” of pushing it up, watching liquidity maps and waiting for the price to do what I wanted. That decision cost me a PnL of -$22.
With WAL, I want to do the opposite: stick to a fixed plan and not negotiate with myself afterward.
The context is that WAL is up +45% today. Volume is cooling off, and the 15m RSI is neutral (48), not overbought.
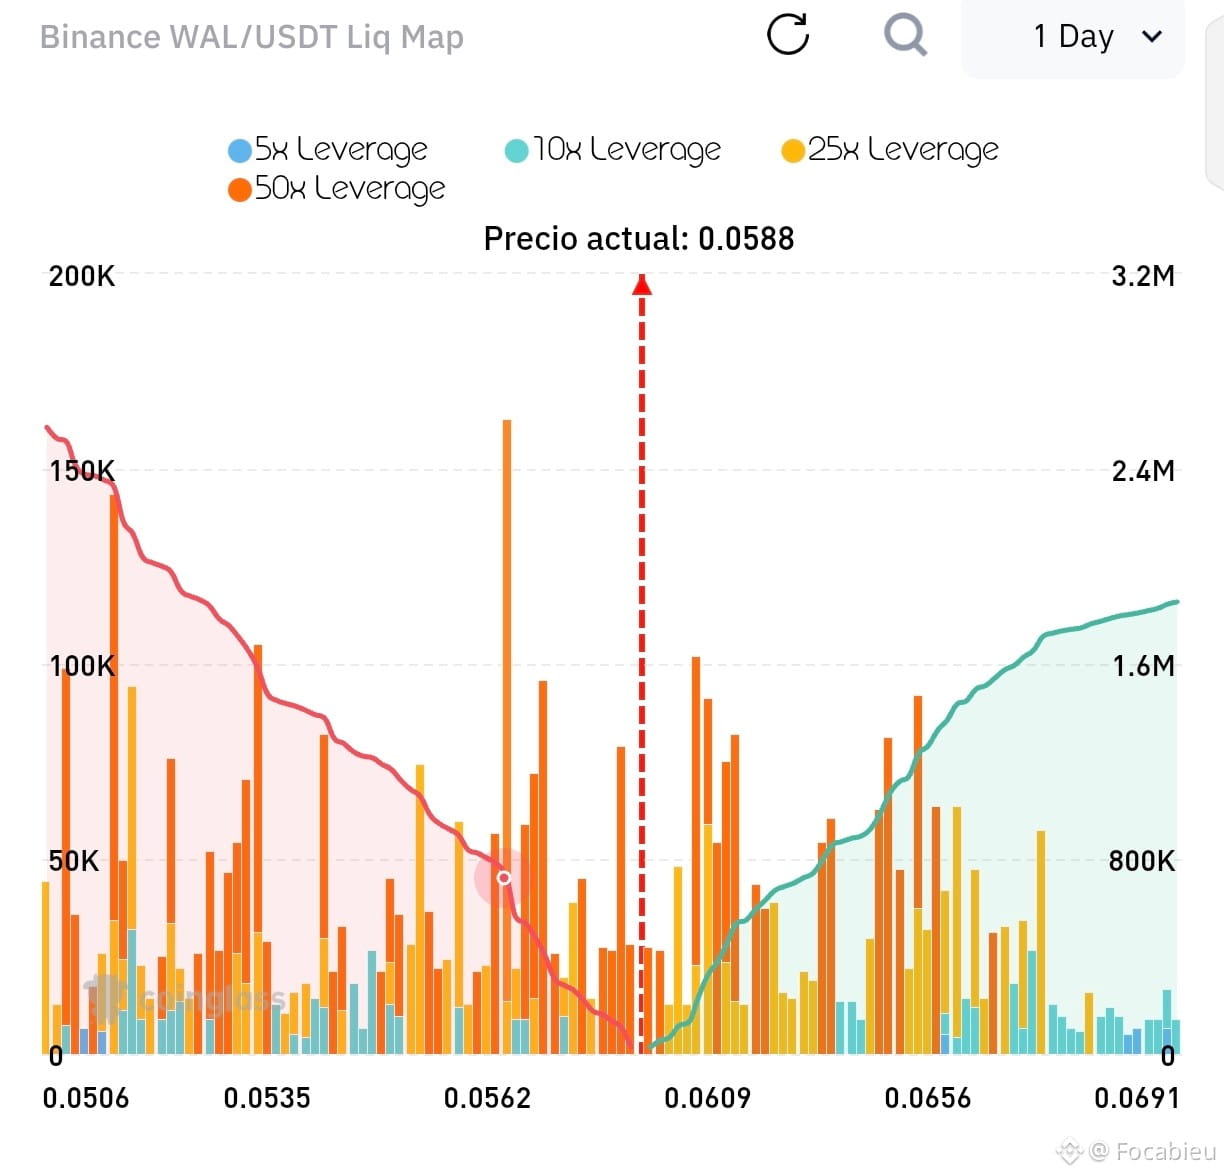
The liquidation map shows more liquidity accumulated on the long side, below the price, than on the short side, above it. This could favor a drop if support levels break, although on its own, it doesn’t confirm that it will happen.
My setup:
Entry: 0.06 - 0,063 (if the price reaches that zone and the setup is confirmed)
SL: 0,069 (above the recent ATH)
TP1: 0,055 — close 40% and move SL to breakeven
TP2: 0,0529 — close another 30%
TP3: 0,0478 — close the rest
I’m using low leverage, and if the price hits my SL, I’ll close with no exceptions. I’ve learned that a nice analysis is useless if you don’t stick to your own plan afterward xd.
If you’re going to enter, use a small position and low leverage, calculating the risk based on your own capital. Don’t use all your margin or blindly copy the entry; this could go wrong, and the SL doesn’t guarantee an exact execution price either.
This is just my technical read, obviously not a guarantee of anything. Do your own research before copying any entry, including mine. :v
1
175
·
--
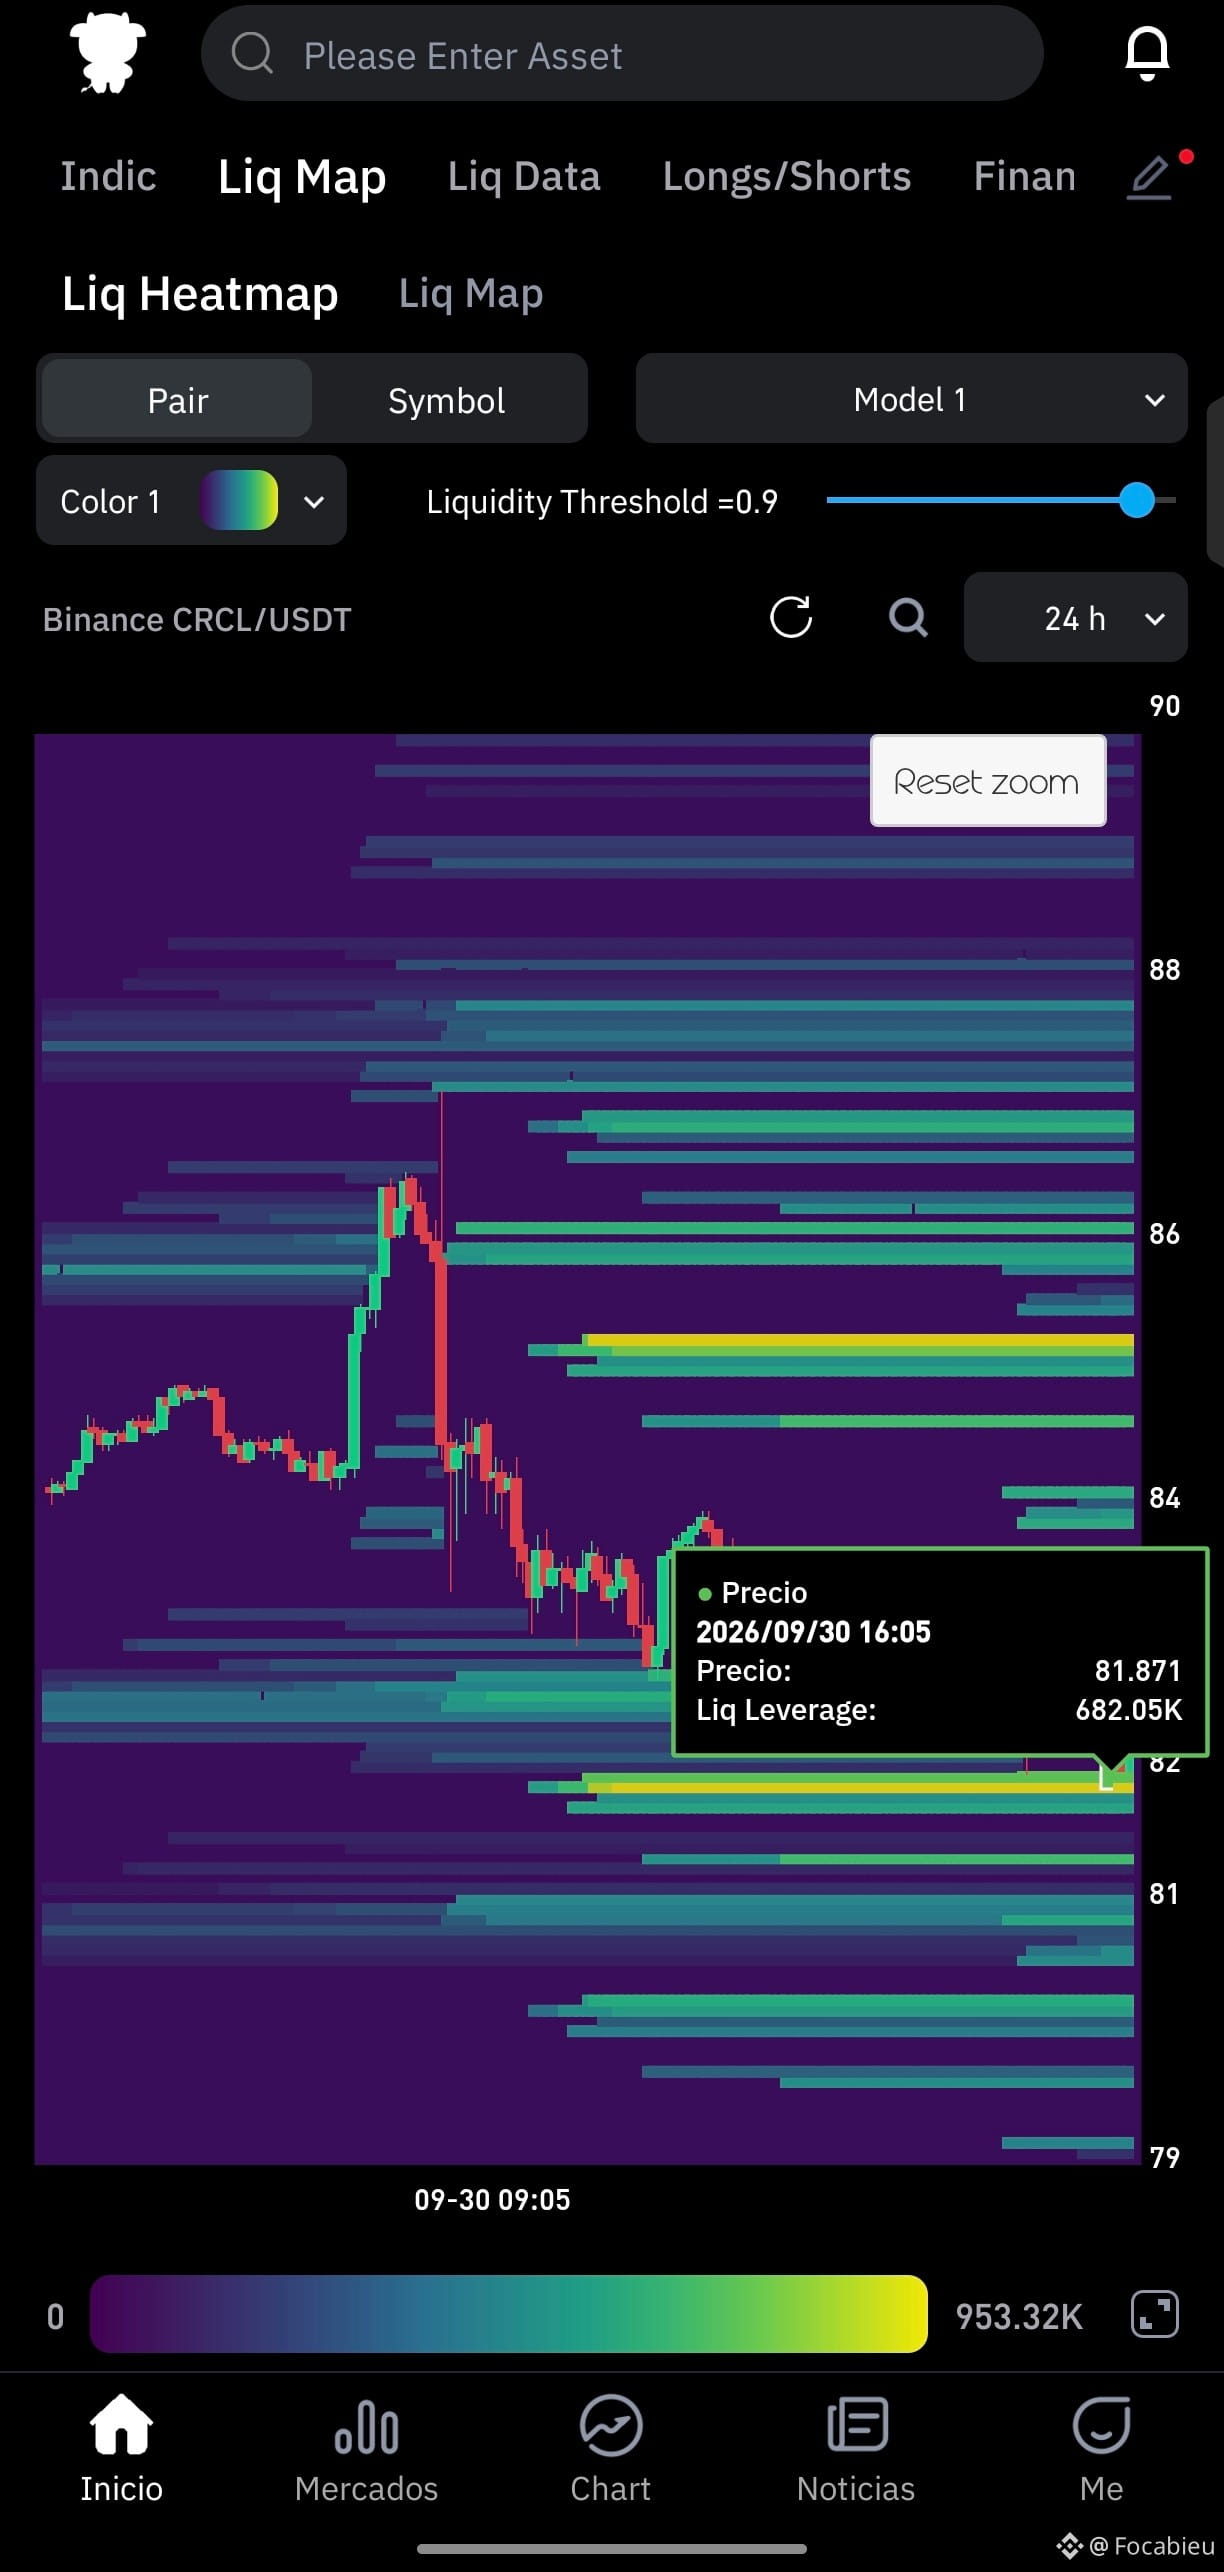
As I said yesterday and it happened, avoid entering long at $CRCL , it is very close to touching a key liquidity point and, if it isn’t defended, it will probably fall back down to 78-79 again. But if it is defended, then it will be a reversal. Either way, do your own research :)
As I said yesterday and it happened, avoid entering long at $CRCL , it is very close to touching a key liquidity point and, if it isn’t defended, it will probably fall back down to 78-79 again. But if it is defended, then it will be a reversal. Either way, do your own research :)
1
182
·
--
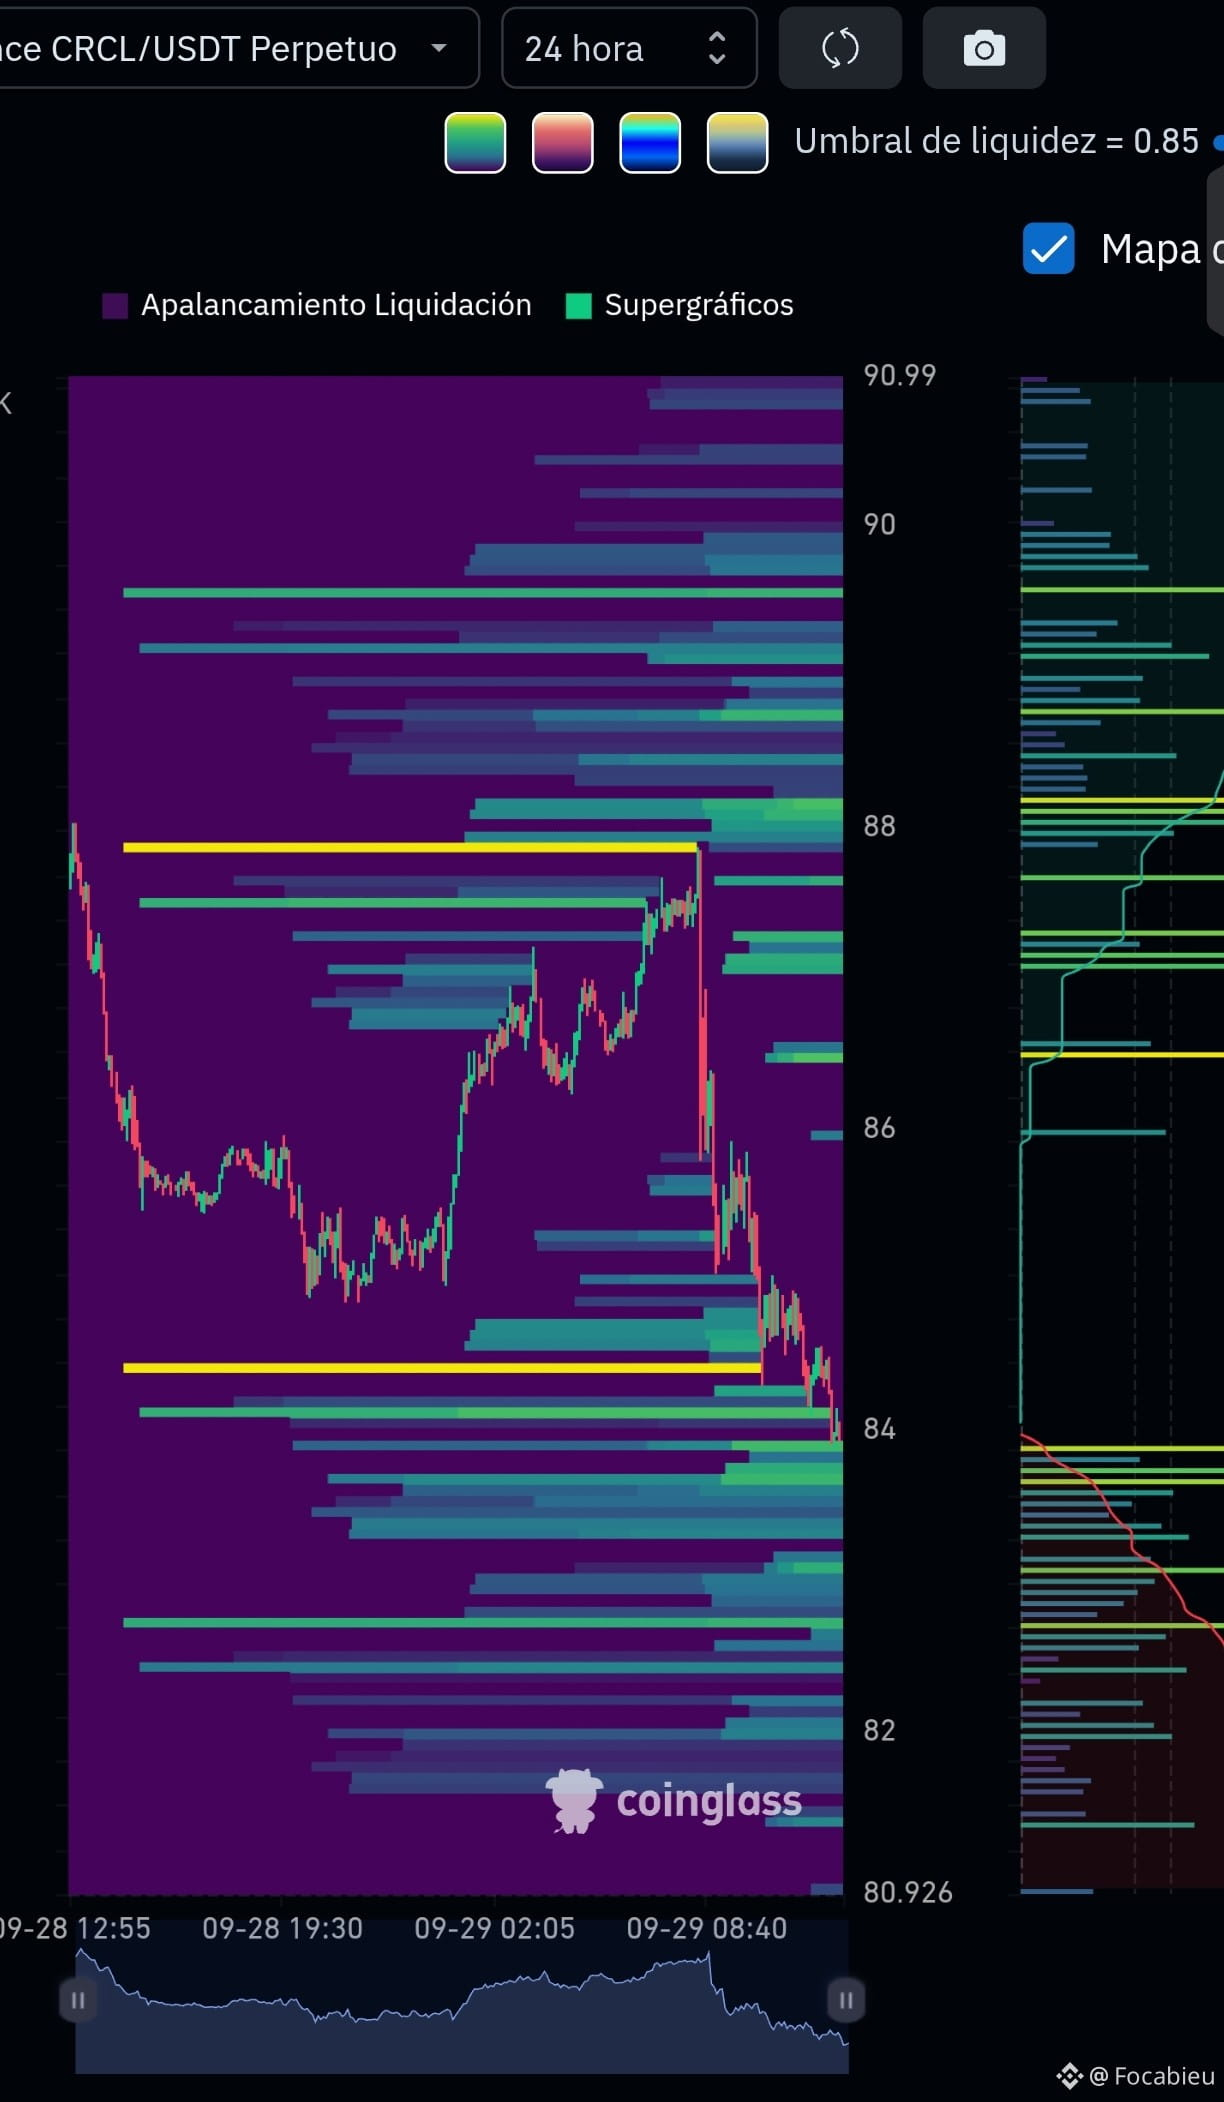
$CRCL Very likely it will keep going down; there’s more liquidity below. If they do enter anyway, keep that in mind :)
$CRCL Very likely it will keep going down; there’s more liquidity below. If they do enter anyway, keep that in mind :)
1
365
·
--
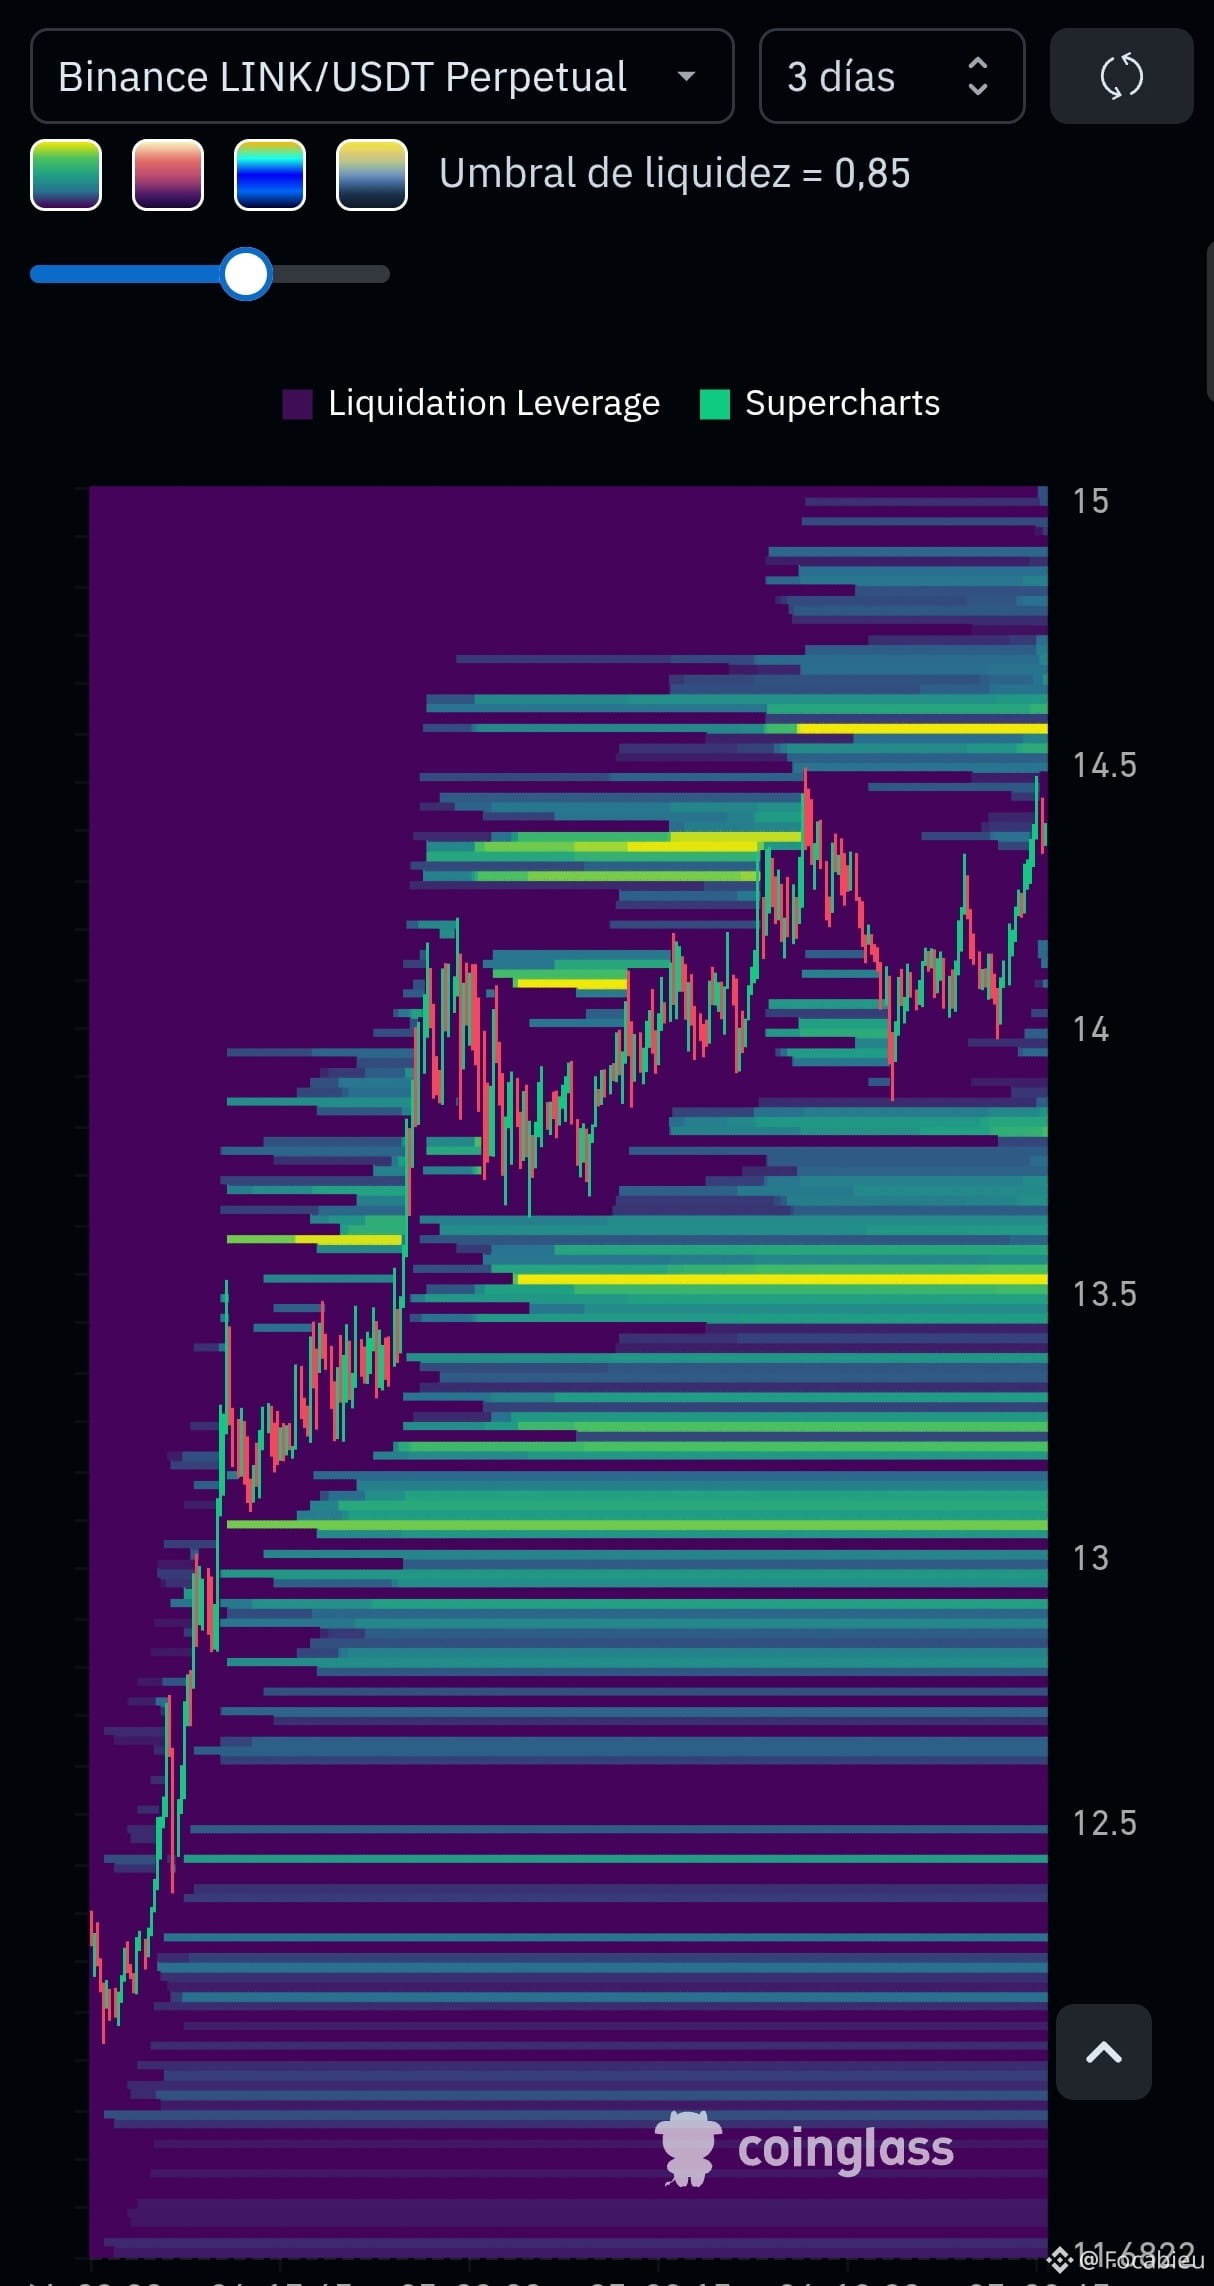
🚨 The manipulation in $LINK this weekend is blatant 🚨
They’re inflating the price without real volume just to squeeze the Shorts. But look at the attached liquidity map: the real ocean of millions is BELOW. They’re forcing an artificial pump before going to hunt the big mass of Longs.
🛡️ My limit: $14.67.
That’s my key structural level. If the algorithm has the strength to break through that ceiling, then we accept the manipulation, set our Stop Loss according to risk management, and we step aside. You don’t fight the market blindly.
Patience and shield on standby to wait for the dump. 📉📊
What do you think: does it drop soon to sweep the Longs, or does it keep this artificial squeeze going?
168
·
--
NOTICE:
$INTW es leverage 2x — trade with caution
INTW tracks Intel’s price ($INTC ) through the GraniteShares 2x Long INTC ETF. This means it doubles the stock’s daily percentage move — for better and for worse.
So if Intel rises 5%, this ETF moves 10%, and vice versa; it can be a good option if you fully understand how it moves: rallies are amplified, but so are the drops.
If you also add leverage via futures (x5, x10), you’re multiplying the risk twice — first by the product, then by your position. The sharp moves you see here aren’t random; they’re inherent to the instrument.
Always do your own research (DYOR). This isn’t financial advice—just context so you trade with your eyes open.
2
116
·
--
$INTW | Closed Operation Successful
Return (ROI): +31.67% (TP reached and SL respected).
Market note: As this is a stock, remember to watch for high volatility and strong price movements during market open, which is at 8:30 am and 3:00 am Col. time.
$INTW | Closed Operation Successful
Return (ROI): +31.67% (TP reached and SL respected).
Market note: As this is a stock, remember to watch for high volatility and strong price movements during market open, which is at 8:30 am and 3:00 am Col. time.
Return (ROI): +31.67% (TP reached and SL respected).
Market note: As this is a stock, remember to watch for high volatility and strong price movements during market open, which is at 8:30 am and 3:00 am Col. time.
1
276
·
--
Entry at 33,68, in the confluence zone between the upper Bollinger Band and the previous local high (34,11). The price came with strong bullish momentum but showing signs of short-term exhaustion—RSI nearing overbought without strong volume to support continuation.
TP: 32,6-32
SL: 34,20
Leverage: 10x
R:R ≈ 1:2
Trading with risk management defined before entering—fixed SL and TP, without changing anything based on market mood. Not a guarantee of anything, just the technical read of the moment
$INTW
TP: 32,6-32
SL: 34,20
Leverage: 10x
R:R ≈ 1:2
Trading with risk management defined before entering—fixed SL and TP, without changing anything based on market mood. Not a guarantee of anything, just the technical read of the moment
$INTW
1
165
Log in to explore more content
Join global crypto users on Binance Square
⚡️ Get latest and useful information about crypto.
💬 Trusted by the world’s largest crypto exchange.
👍 Discover real insights from verified creators.
Email / Phone number