Binance Square
Crypto Skull Signal
7.9k Posts

Crypto Skull Signal

Square Verified+
X.com/SkullSignal 👈 I’m not only a pretty face… I’ll show step by step how to beat this market, because I already did. Welcome to the family
Level 1 Creator
Level 1 Creator
1 Following
55.8K+ Followers
93.6K+ Liked
1 Badges
Posts
PINNED
·
--
Bearish
PINNED
#BITCOIN ANALYSIS I have been warning you for the last 45 days that a big dump was coming and now it’s playing out exactly. Bitcoin has already dumped around $20K and is now trading near 112K, right at the major resistance zone that has triggered every big correction since 2018. A small bounce to 115K–116K is possible, but after that I expect another leg down toward 100K, and potentially lower to 90K. I’m still holding my 50% short position. If anything changes or I close my position, I’ll update you. Remember I mentioned earlier that if BTC went back to 125K–128K, I would add more shorts and that plan hasn’t changed. Till Monday, I expect some volatility, but Monday’s price action will give a clearer direction. 🔸 Weekly: BTC touched the long-term trendline again → clear rejection happened. 👉 Until we get a weekly close above 125K, the risk of a major pullback stays high. 🔸 Daily: Price is inside the 110K–125K supply zone. Structure is weak. If price breaks and resists below 110K, then 100K is the next target. 📊 My Trade: ✅ First target 105K hit Holding 50% shorts, expecting a bounce to 115K, then lower. 📌 Downside Targets: 105K ✅ → 100K → 95K → 90K $BTC #TrumpTariffs {future}(BTCUSDT)
#BITCOIN ANALYSIS

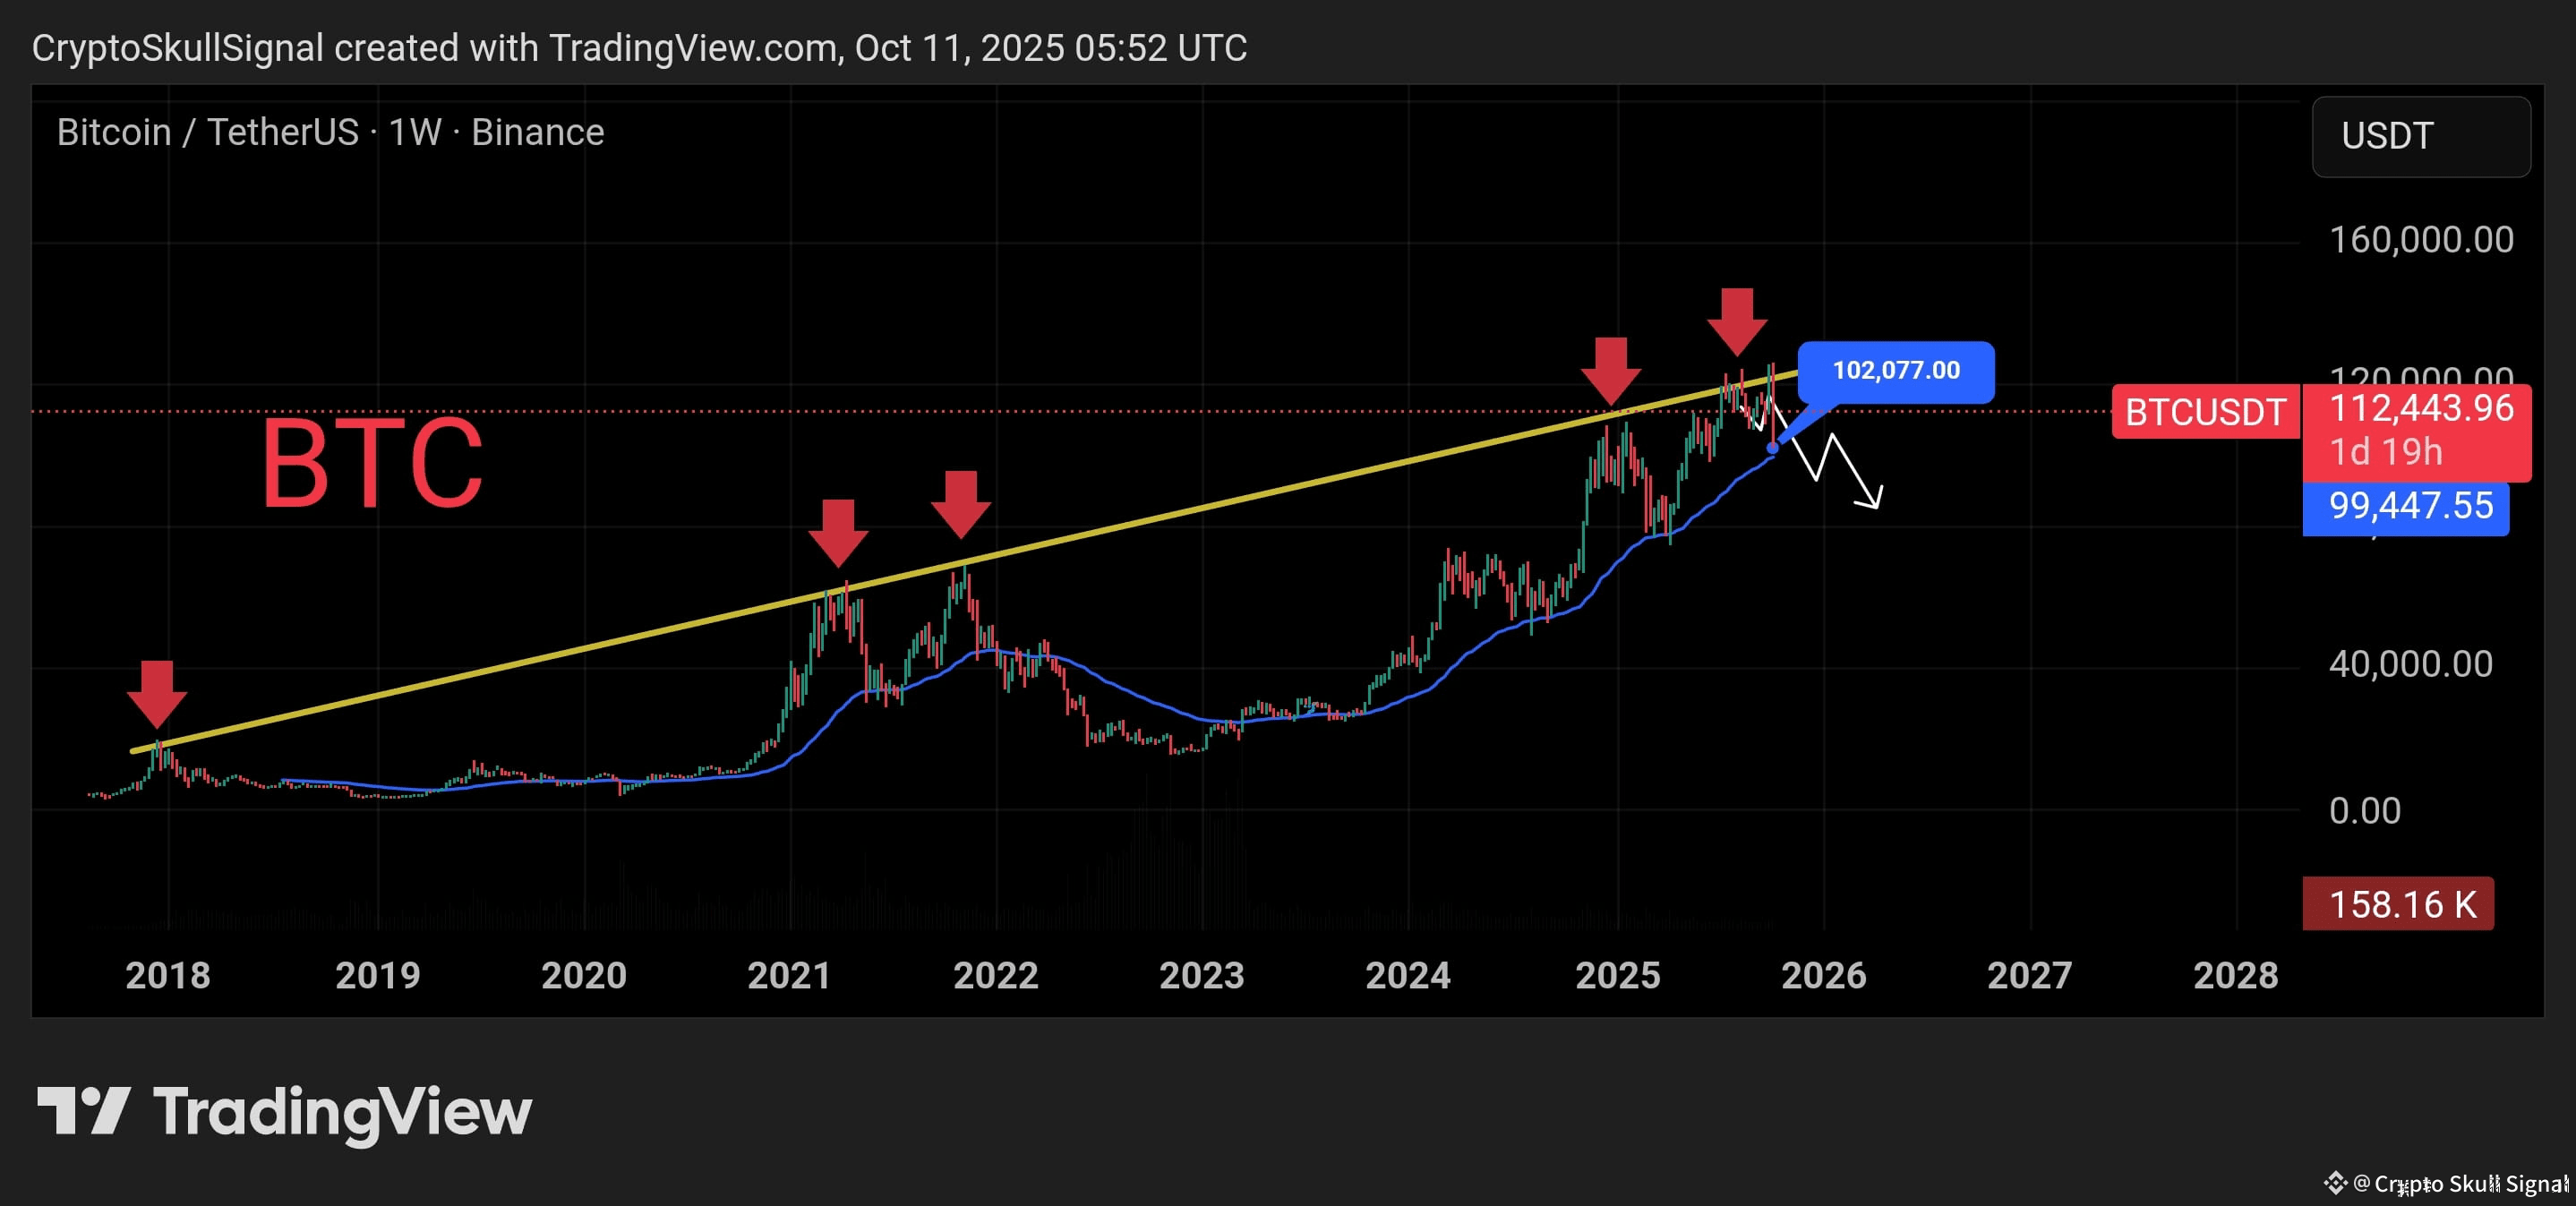
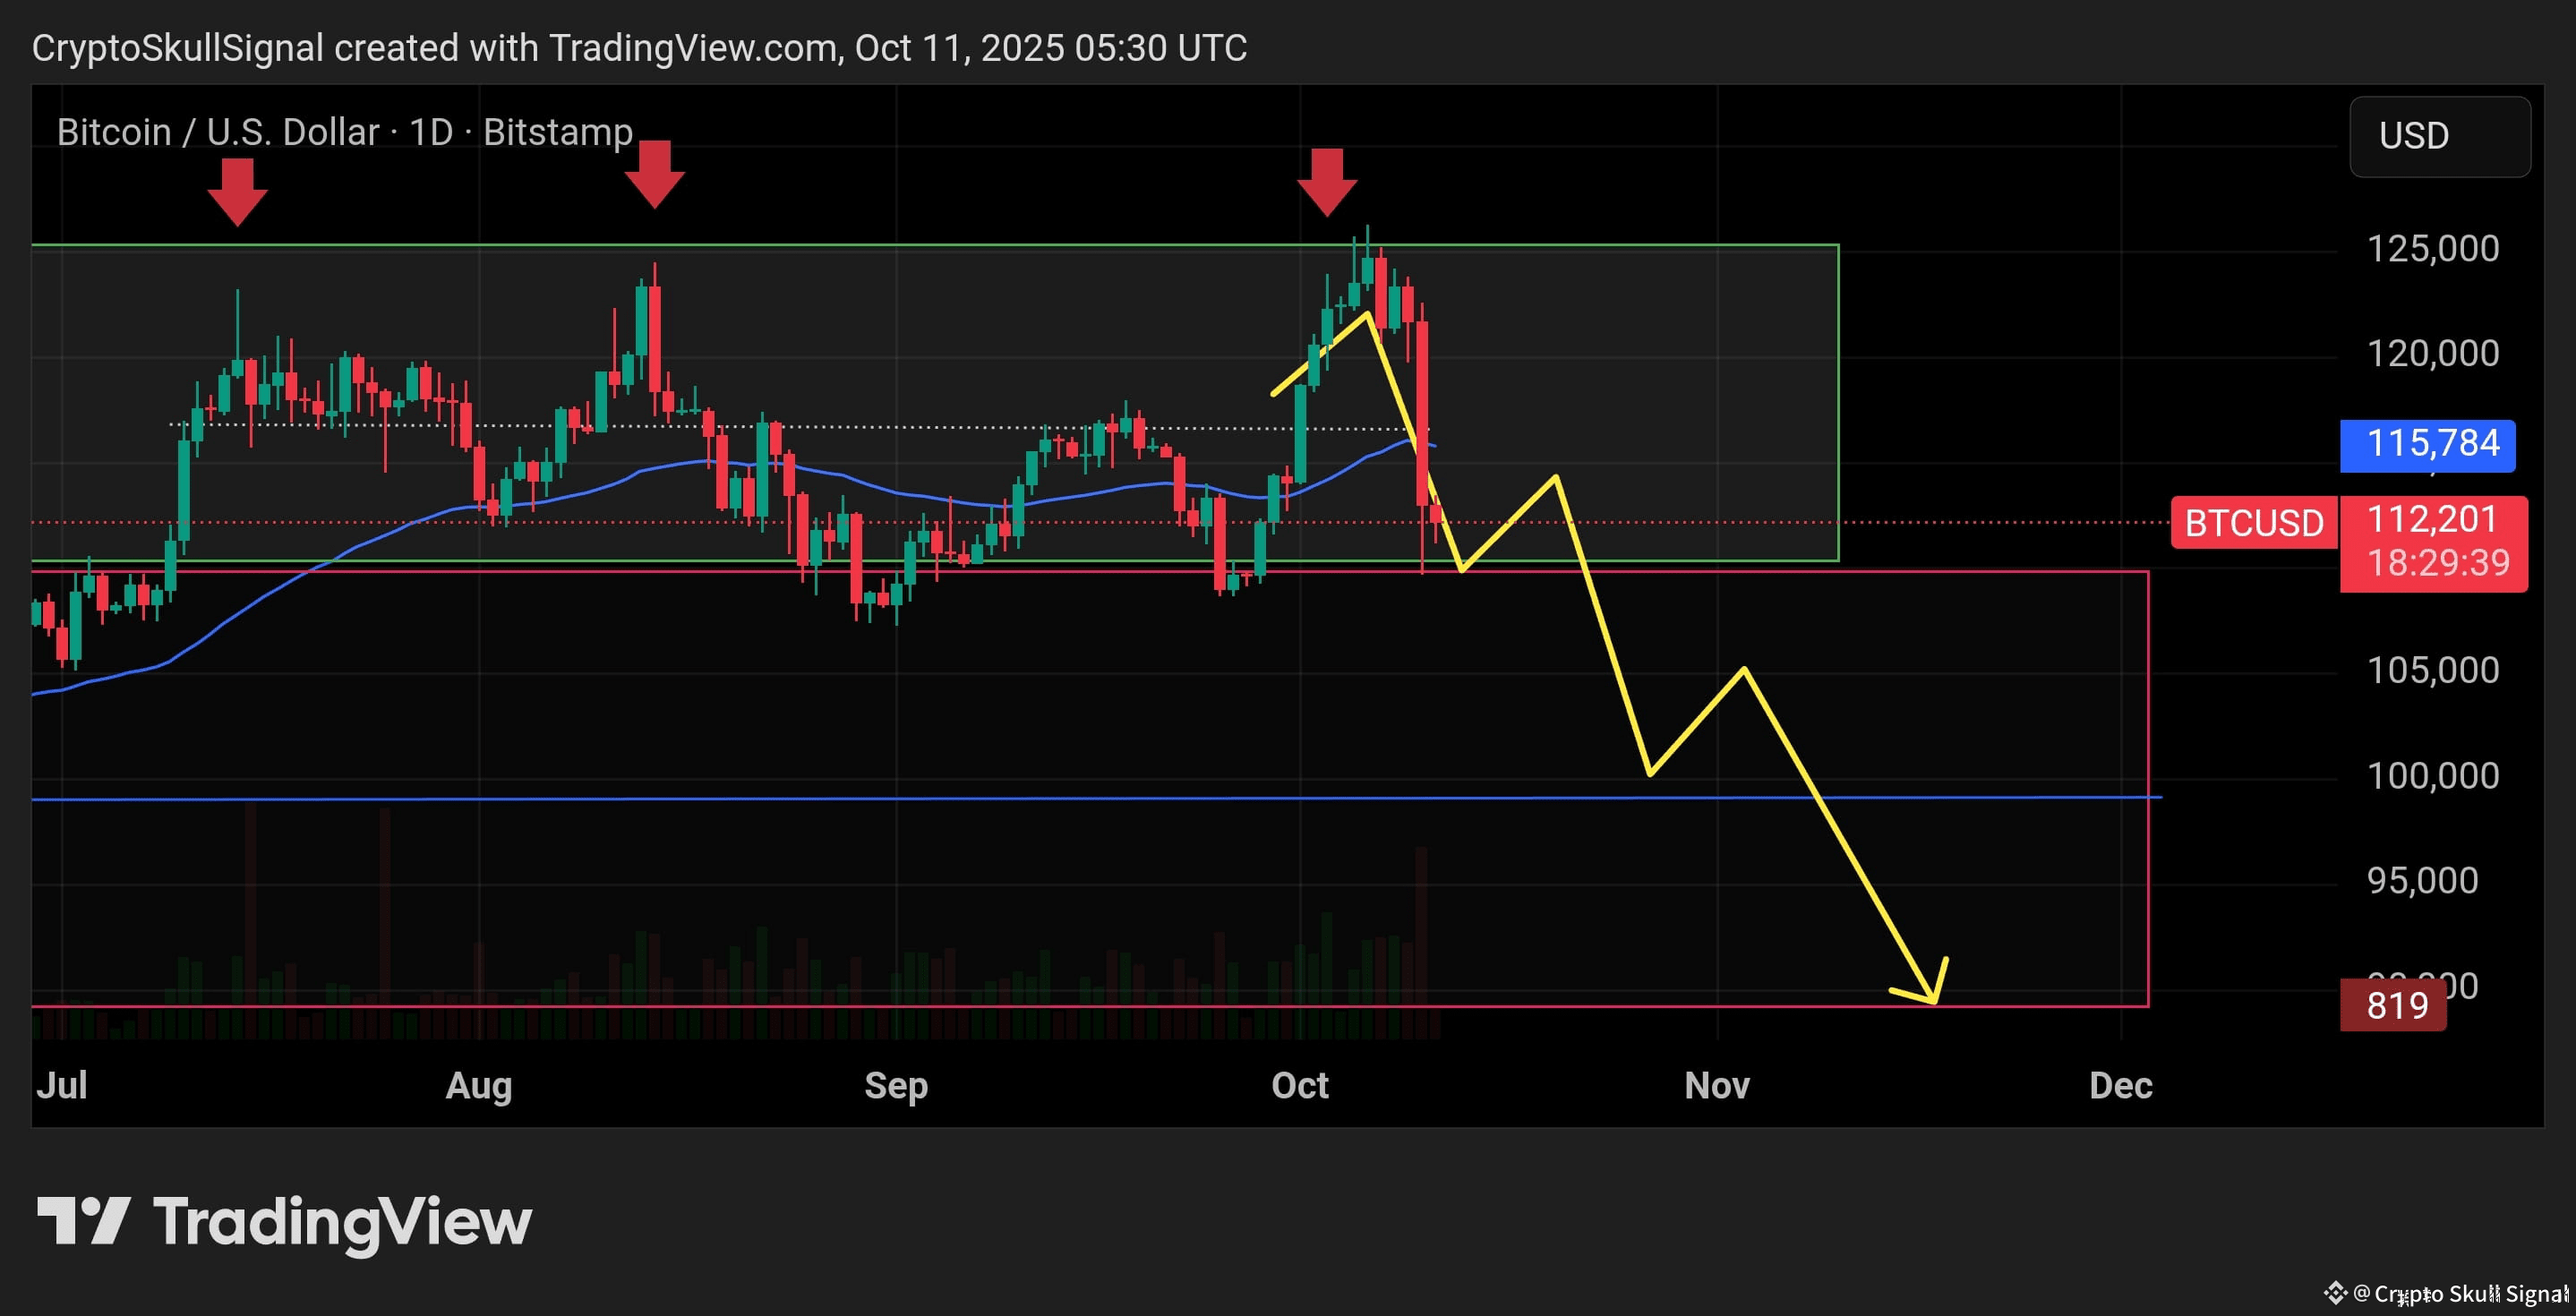
I have been warning you for the last 45 days that a big dump was coming and now it’s playing out exactly. Bitcoin has already dumped around $20K and is now trading near 112K, right at the major resistance zone that has triggered every big correction since 2018.

A small bounce to 115K–116K is possible, but after that I expect another leg down toward 100K, and potentially lower to 90K.
I’m still holding my 50% short position. If anything changes or I close my position, I’ll update you. Remember I mentioned earlier that if BTC went back to 125K–128K, I would add more shorts and that plan hasn’t changed.

Till Monday, I expect some volatility, but Monday’s price action will give a clearer direction.

🔸 Weekly:
BTC touched the long-term trendline again → clear rejection happened.
👉 Until we get a weekly close above 125K, the risk of a major pullback stays high.

🔸 Daily:
Price is inside the 110K–125K supply zone. Structure is weak.
If price breaks and resists below 110K, then 100K is the next target.

📊 My Trade:

✅ First target 105K hit
Holding 50% shorts, expecting a bounce to 115K, then lower.

📌 Downside Targets: 105K ✅ → 100K → 95K → 90K

$BTC #TrumpTariffs
Crypto Skull Signal
·
--
Bearish
#BITCOIN ANALYSIS

For the last 40 days I’ve been telling you guys I’m bearish on $BTC. We already dropped almost 8K twice, but every time Bitcoin reclaimed the levels again. Right now it’s trading around 18K to 119k but nothing has changed for me. I’m still bearish.

I’ve said many times that the 115K to 124K region is a short zone, not a long zone. If you’re still holding longs, I’d strongly suggest you flip to shorts because the chart is flashing multiple top signals.

Don’t get trapped by hype like “Bitcoin to 1 million by the end of this year.” That’s just noise. The structure is weak, liquidity is being engineered, and the bigger downside move is still ahead.

📌 Downside Targets:
105K → 100K → 95K → 90K

$BTC
BITCOIN SUNDAY ANALYSIS $BTC did exactly what I was watching. {future}(BTCUSDT) $82K held, BTC reclaimed $87K, and now we are back at the same decision area. But I’m still not interested in chasing a long here. For me, $87K is starting to look like a potential trap zone. The more BTC pushes higher, the more people will start feeling that the breakout is confirmed and begin adding longs. And if too much long liquidity builds up around these levels, that can become the perfect setup for a sharp move in the opposite direction. I’m not saying BTC must dump from here. I’m saying I don't want to be the liquidity. The area where I’m much more interested in looking for a long is around $79K-$80K, but only if that zone holds and gives me the confirmation I want. Until then, I’m staying patient. If I add a BTC long, I’ll update you. For now, I see more risk in chasing this move than in waiting for the better entry. $87K is the trap area I’m watching. $79K-$80K is the area I’m watching for opportunity. Let the market show its hand first. 💀
BITCOIN SUNDAY ANALYSIS

$BTC did exactly what I was watching.

$82K held, BTC reclaimed $87K, and now we are back at the same decision area.

But I’m still not interested in chasing a long here.

For me, $87K is starting to look like a potential trap zone.

The more BTC pushes higher, the more people will start feeling that the breakout is confirmed and begin adding longs.

And if too much long liquidity builds up around these levels, that can become the perfect setup for a sharp move in the opposite direction.

I’m not saying BTC must dump from here.

I’m saying I don't want to be the liquidity.

The area where I’m much more interested in looking for a long is around $79K-$80K, but only if that zone holds and gives me the confirmation I want.

Until then, I’m staying patient.

If I add a BTC long, I’ll update you.

For now, I see more risk in chasing this move than in waiting for the better entry.

$87K is the trap area I’m watching.
$79K-$80K is the area I’m watching for opportunity.

Let the market show its hand first. 💀
Crypto Skull Signal
·
--
Bearish
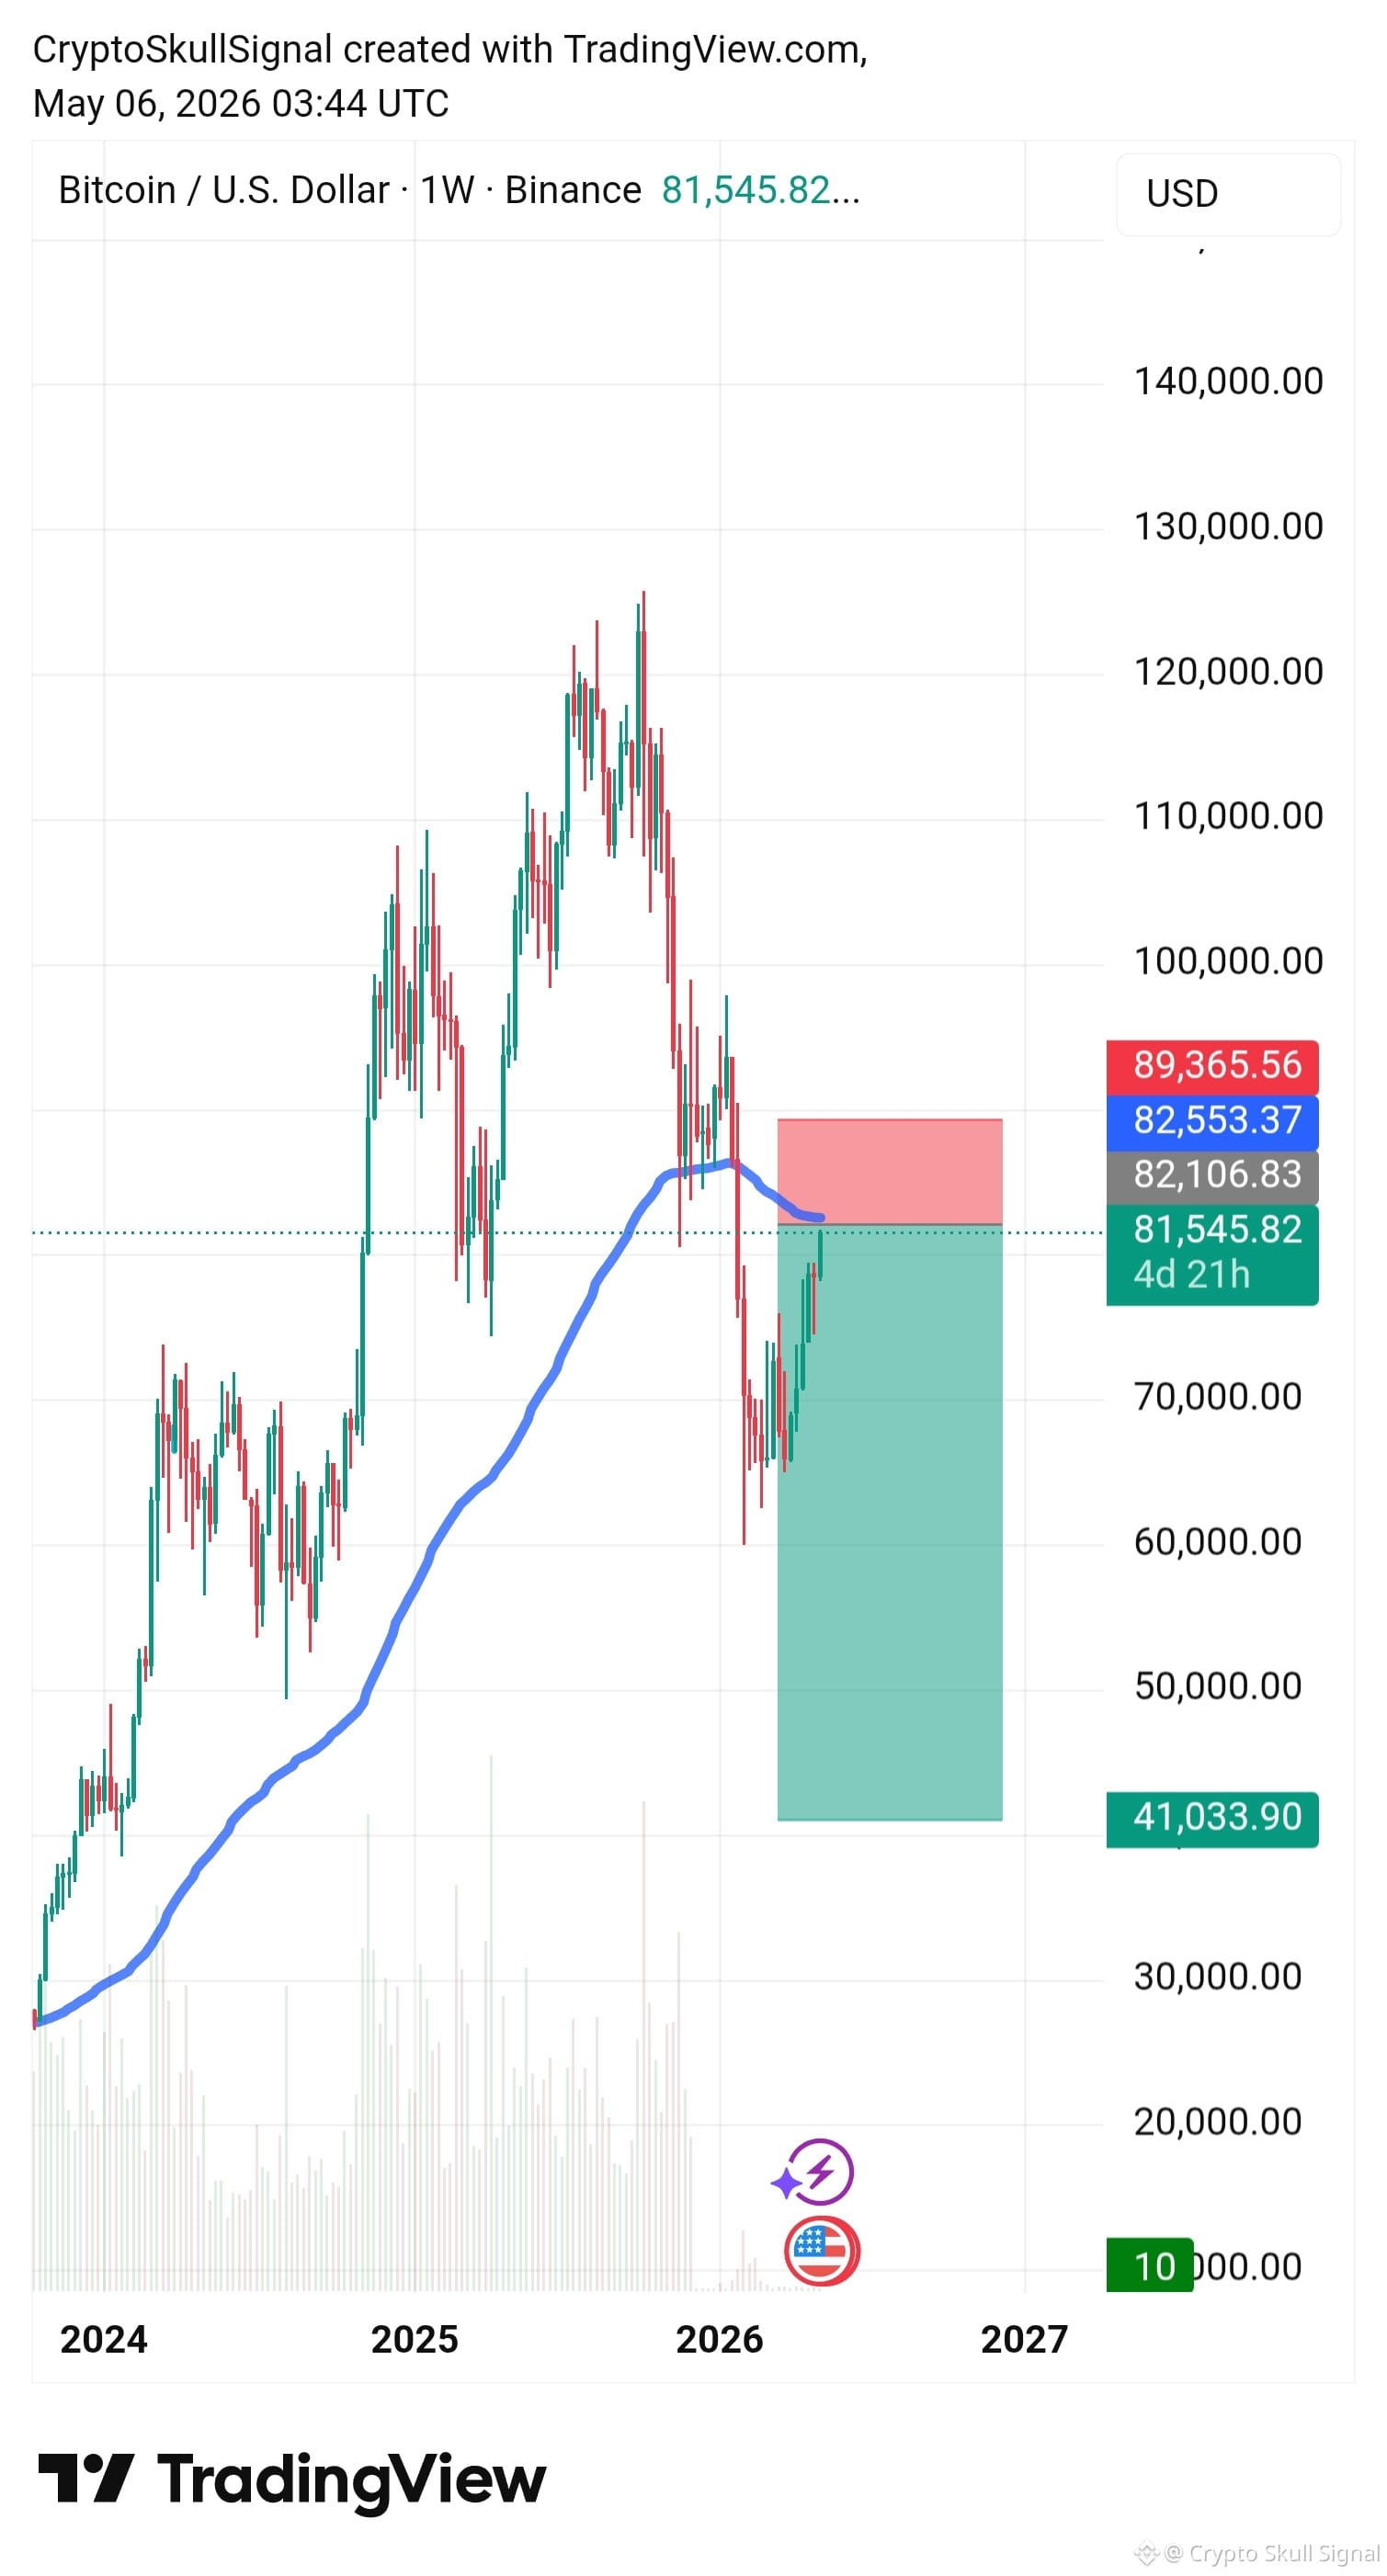
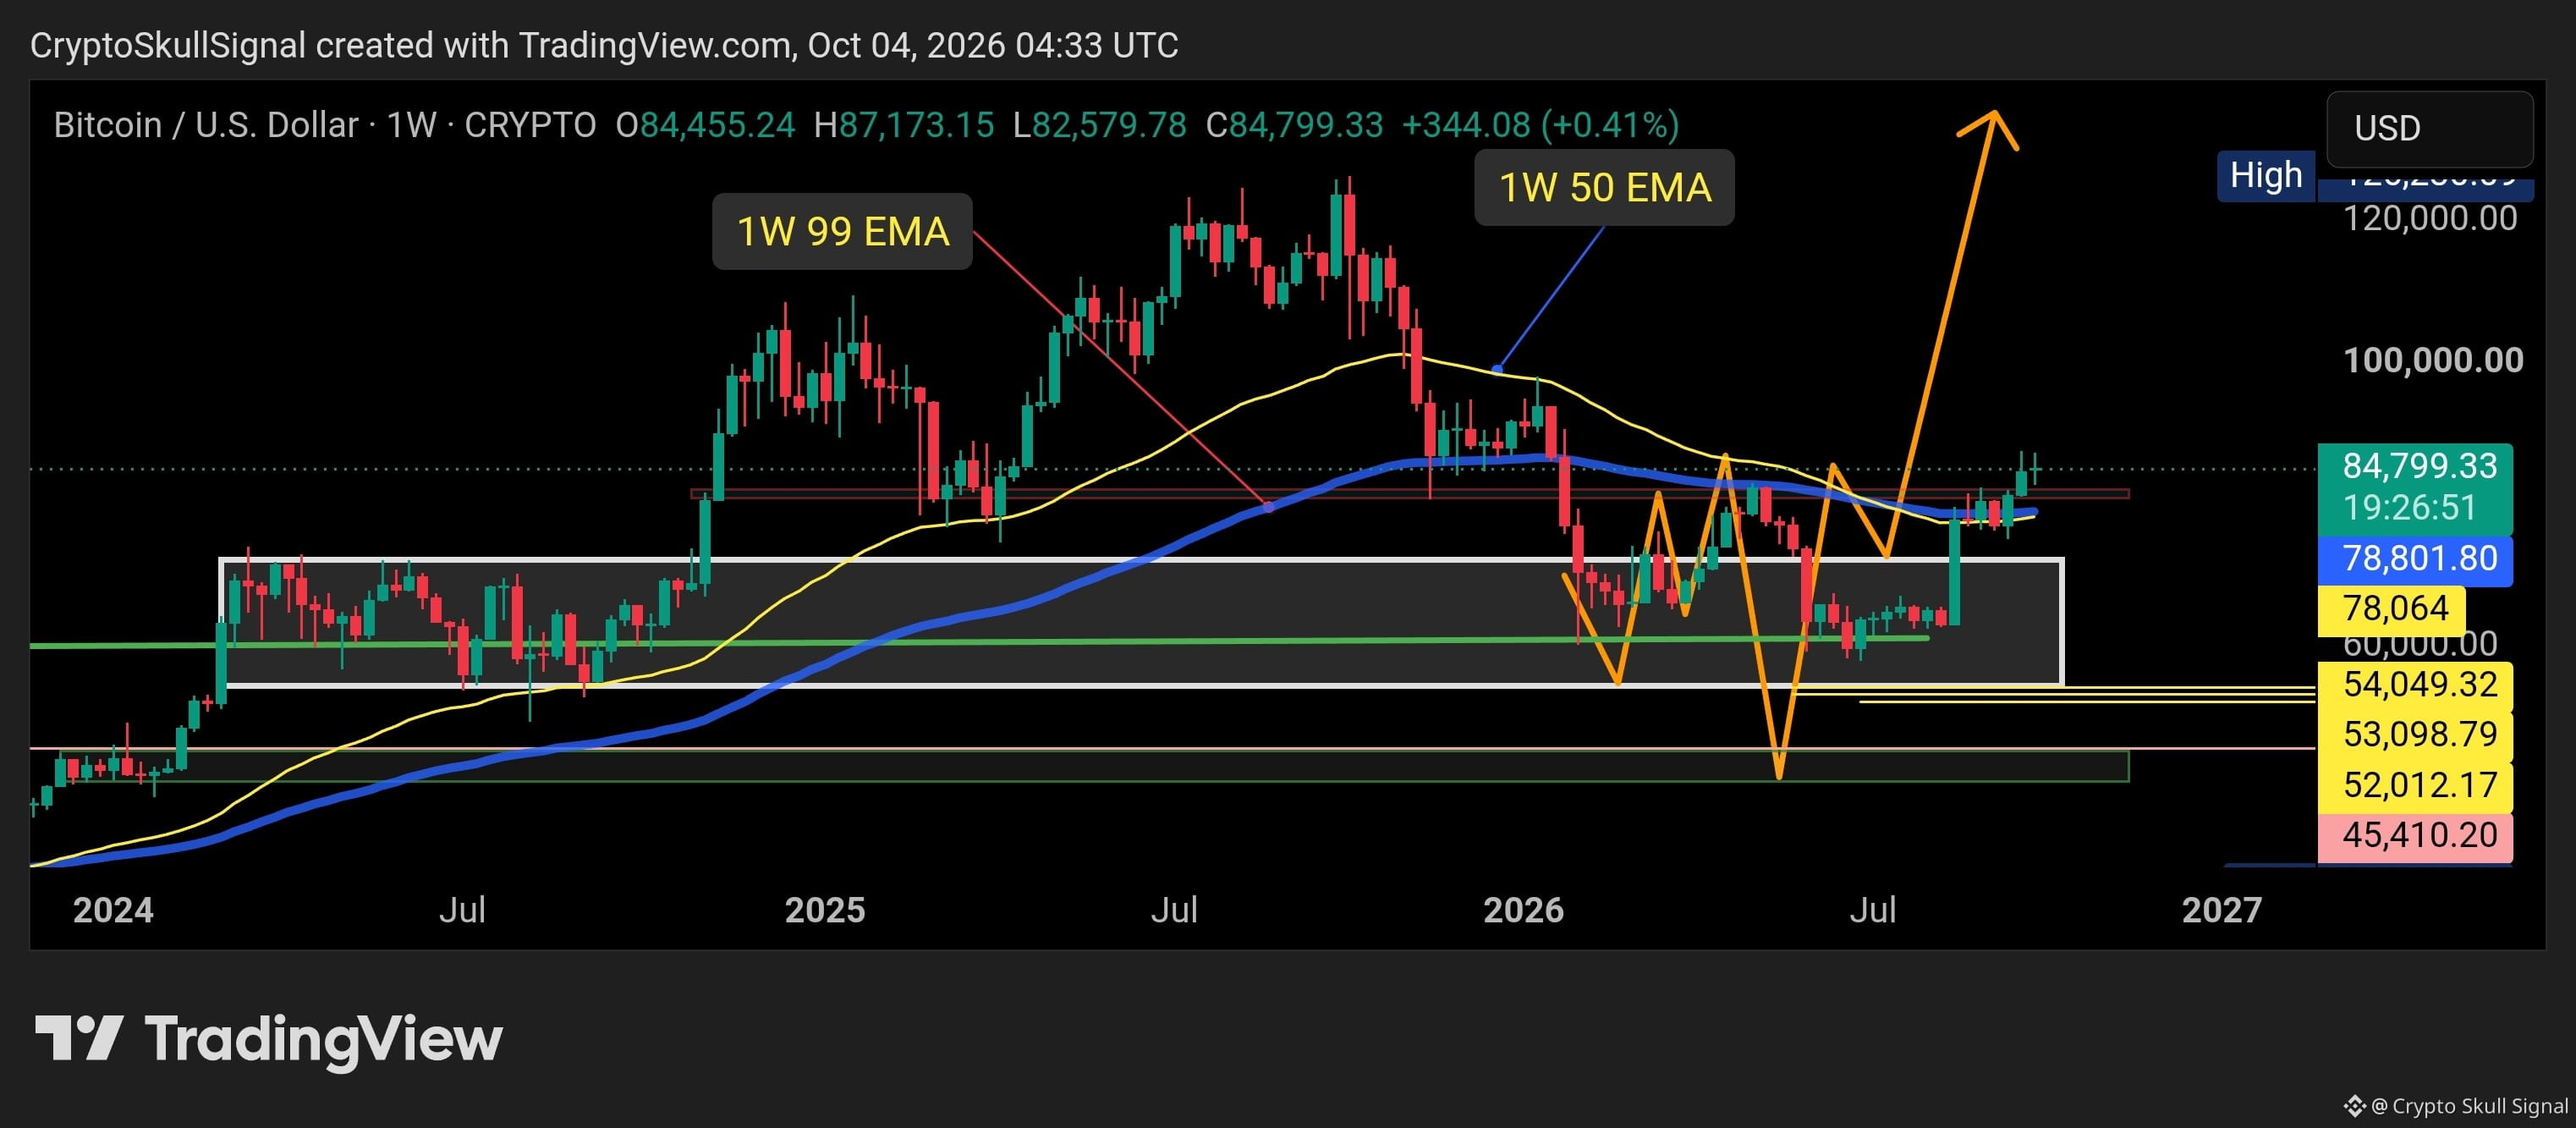
#BTC SUNDAY ANALYSIS 📊

A lot has changed since my last Sunday analysis.

For months, I kept saying $82K was the major resistance and that I needed to see a proper weekly close above it before changing my view.

Now BTC is trading around $84.5K and has reclaimed the $82K area. More importantly, price is above the weekly 50 EMA and 99 EMA.

So again, I’m not going to force the old bearish thesis.

$82K is now the level I’m watching most closely.

If BTC holds above $82K and continues to build above the breakout, then the next areas I’ll watch are $90K-$95K, followed by $100K.

But if this breakout fails and BTC loses $82K, especially the $78K-$79K weekly EMA zone, then I would expect a deeper retest toward $70K-$72K.

Below that, the bigger support remains around $54K-$60K.

The important part now is simple:

Above $82K = strength needs to prove itself.

Below $82K = breakout needs to be questioned.

I’m not chasing BTC here. After everything that happened, risk management matters more than being right.

Let BTC show us what it wants to do, then we react. $BTC
·
--
Bullish
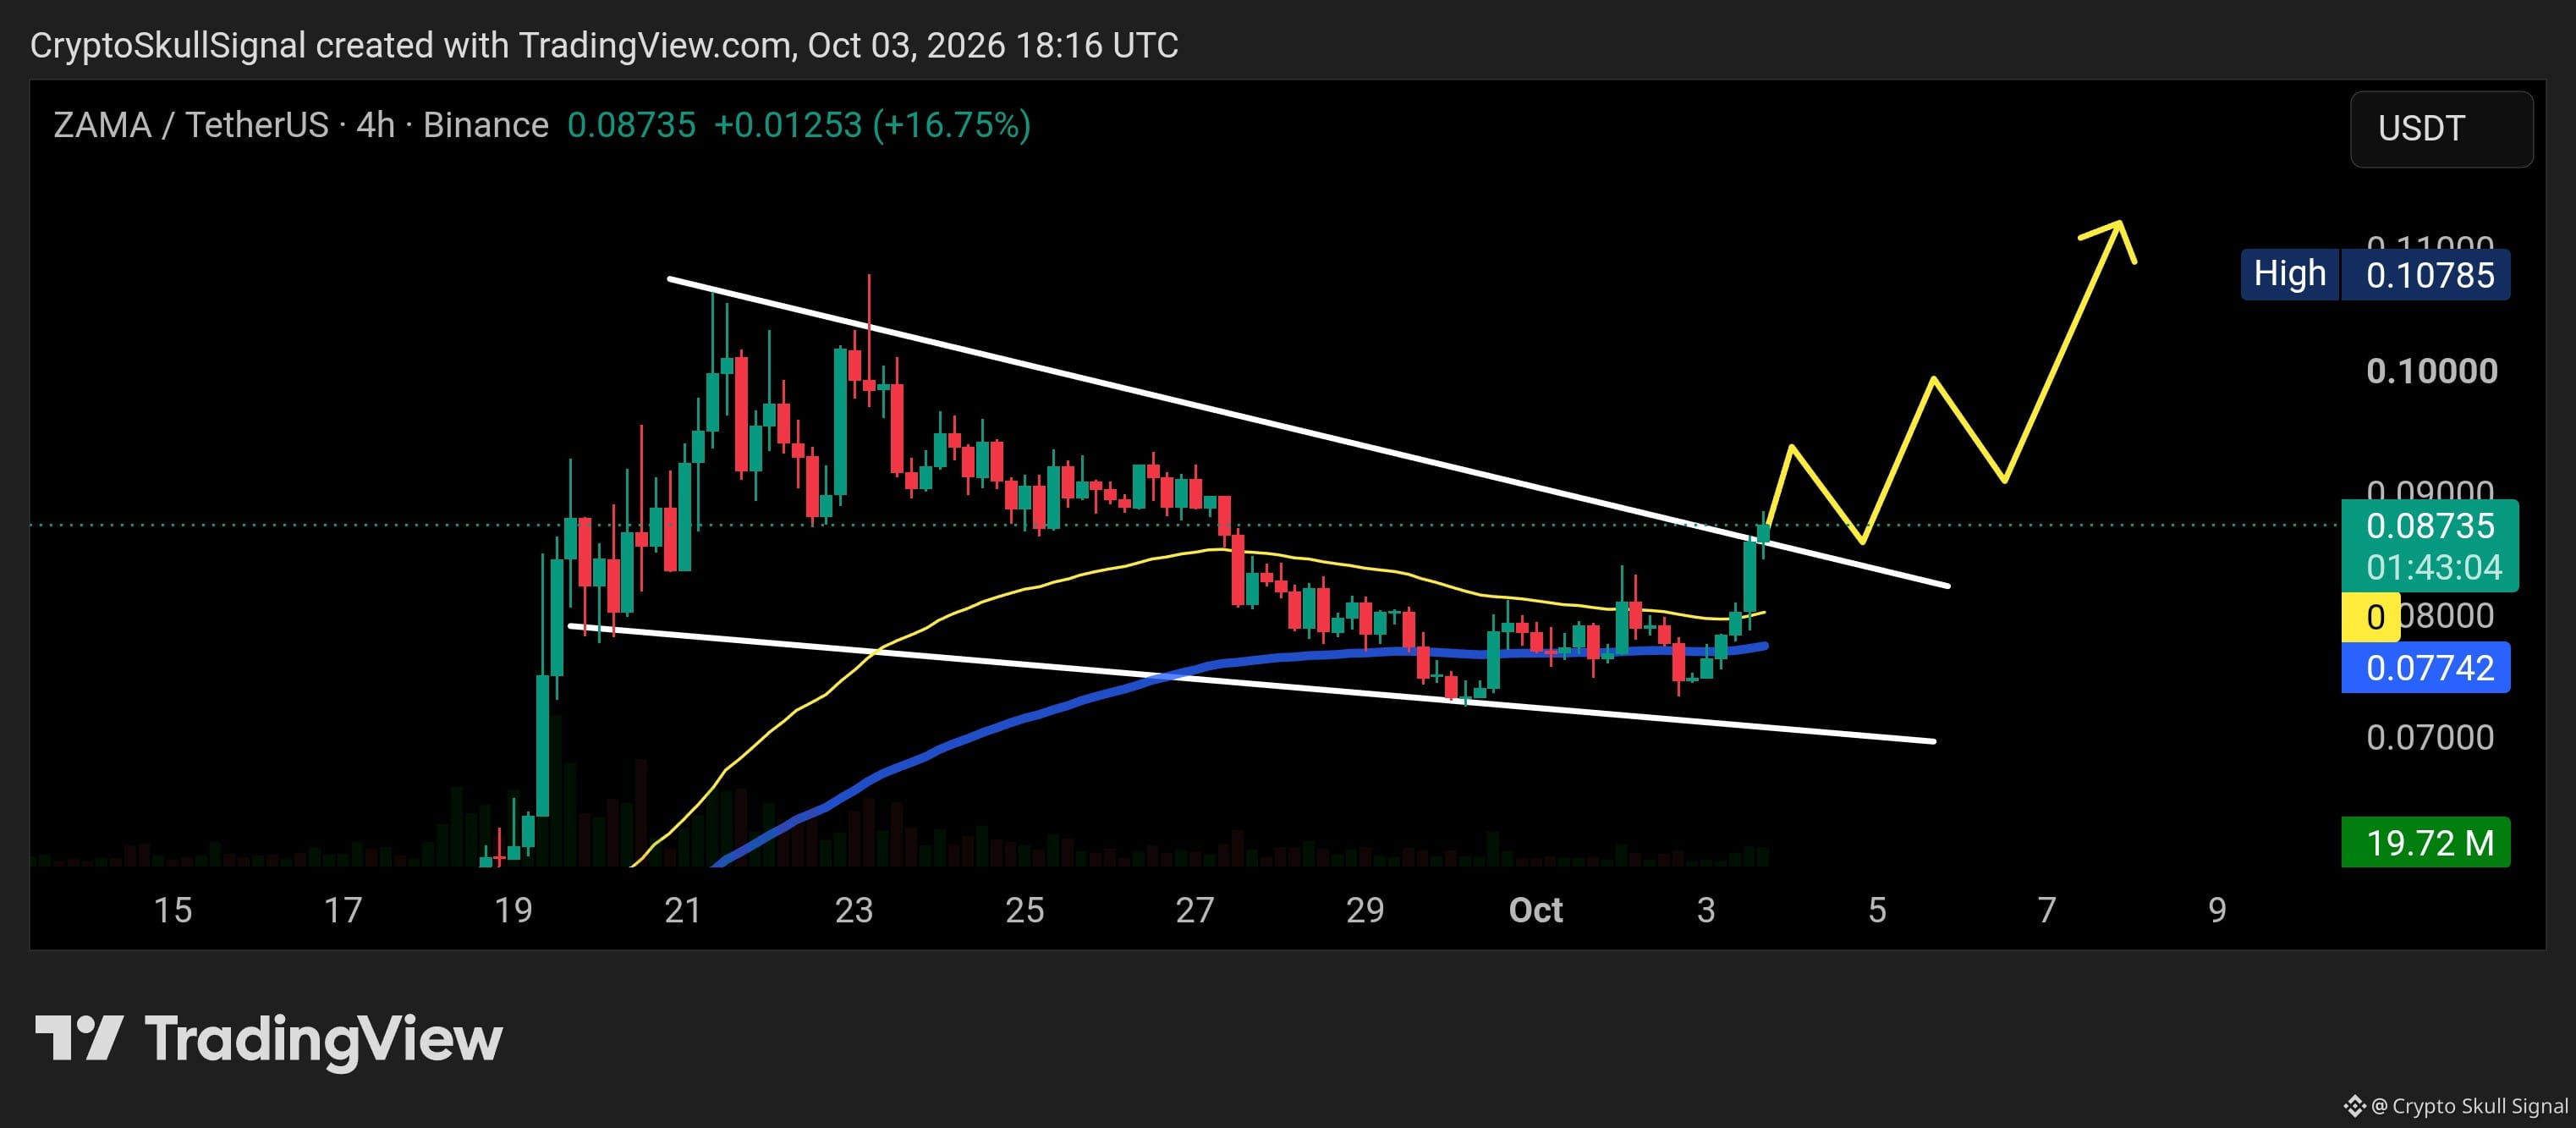
$ZAMA is finally testing the key breakout area. Price has broken above the descending trendline, but I don't want to chase the move yet. What matters now is whether this breakout can hold and turn the trendline into support. {future}(ZAMAUSDT) If ZAMA holds above the breakout zone around $0.085–$0.088, the structure starts looking much stronger. A successful retest could push price back toward the recent high around $0.108, and if that level breaks with momentum, the next move can extend higher. If price falls back below the breakout and loses the structure, I would consider this a failed breakout rather than assuming the upside continues. For me, the key now is simple: breakout → retest → hold → continuation.
$ZAMA is finally testing the key breakout area.

Price has broken above the descending trendline, but I don't want to chase the move yet. What matters now is whether this breakout can hold and turn the trendline into support.

If ZAMA holds above the breakout zone around $0.085–$0.088, the structure starts looking much stronger. A successful retest could push price back toward the recent high around $0.108, and if that level breaks with momentum, the next move can extend higher.

If price falls back below the breakout and loses the structure, I would consider this a failed breakout rather than assuming the upside continues.

For me, the key now is simple: breakout → retest → hold → continuation.
$FIL is approaching a major decision zone. The downtrend line, 50 EMA, and the accumulation zone are all converging around the same area, making this the key level to watch. FIL needs to break above this resistance and hold it as support. If that happens, the first major target is the 99 EMA around $2.53. If FIL can break and hold above the 99 EMA as well, the larger structure could open the way toward $5. For now, I’m watching the breakout and, more importantly, whether price can hold above this entire resistance area.
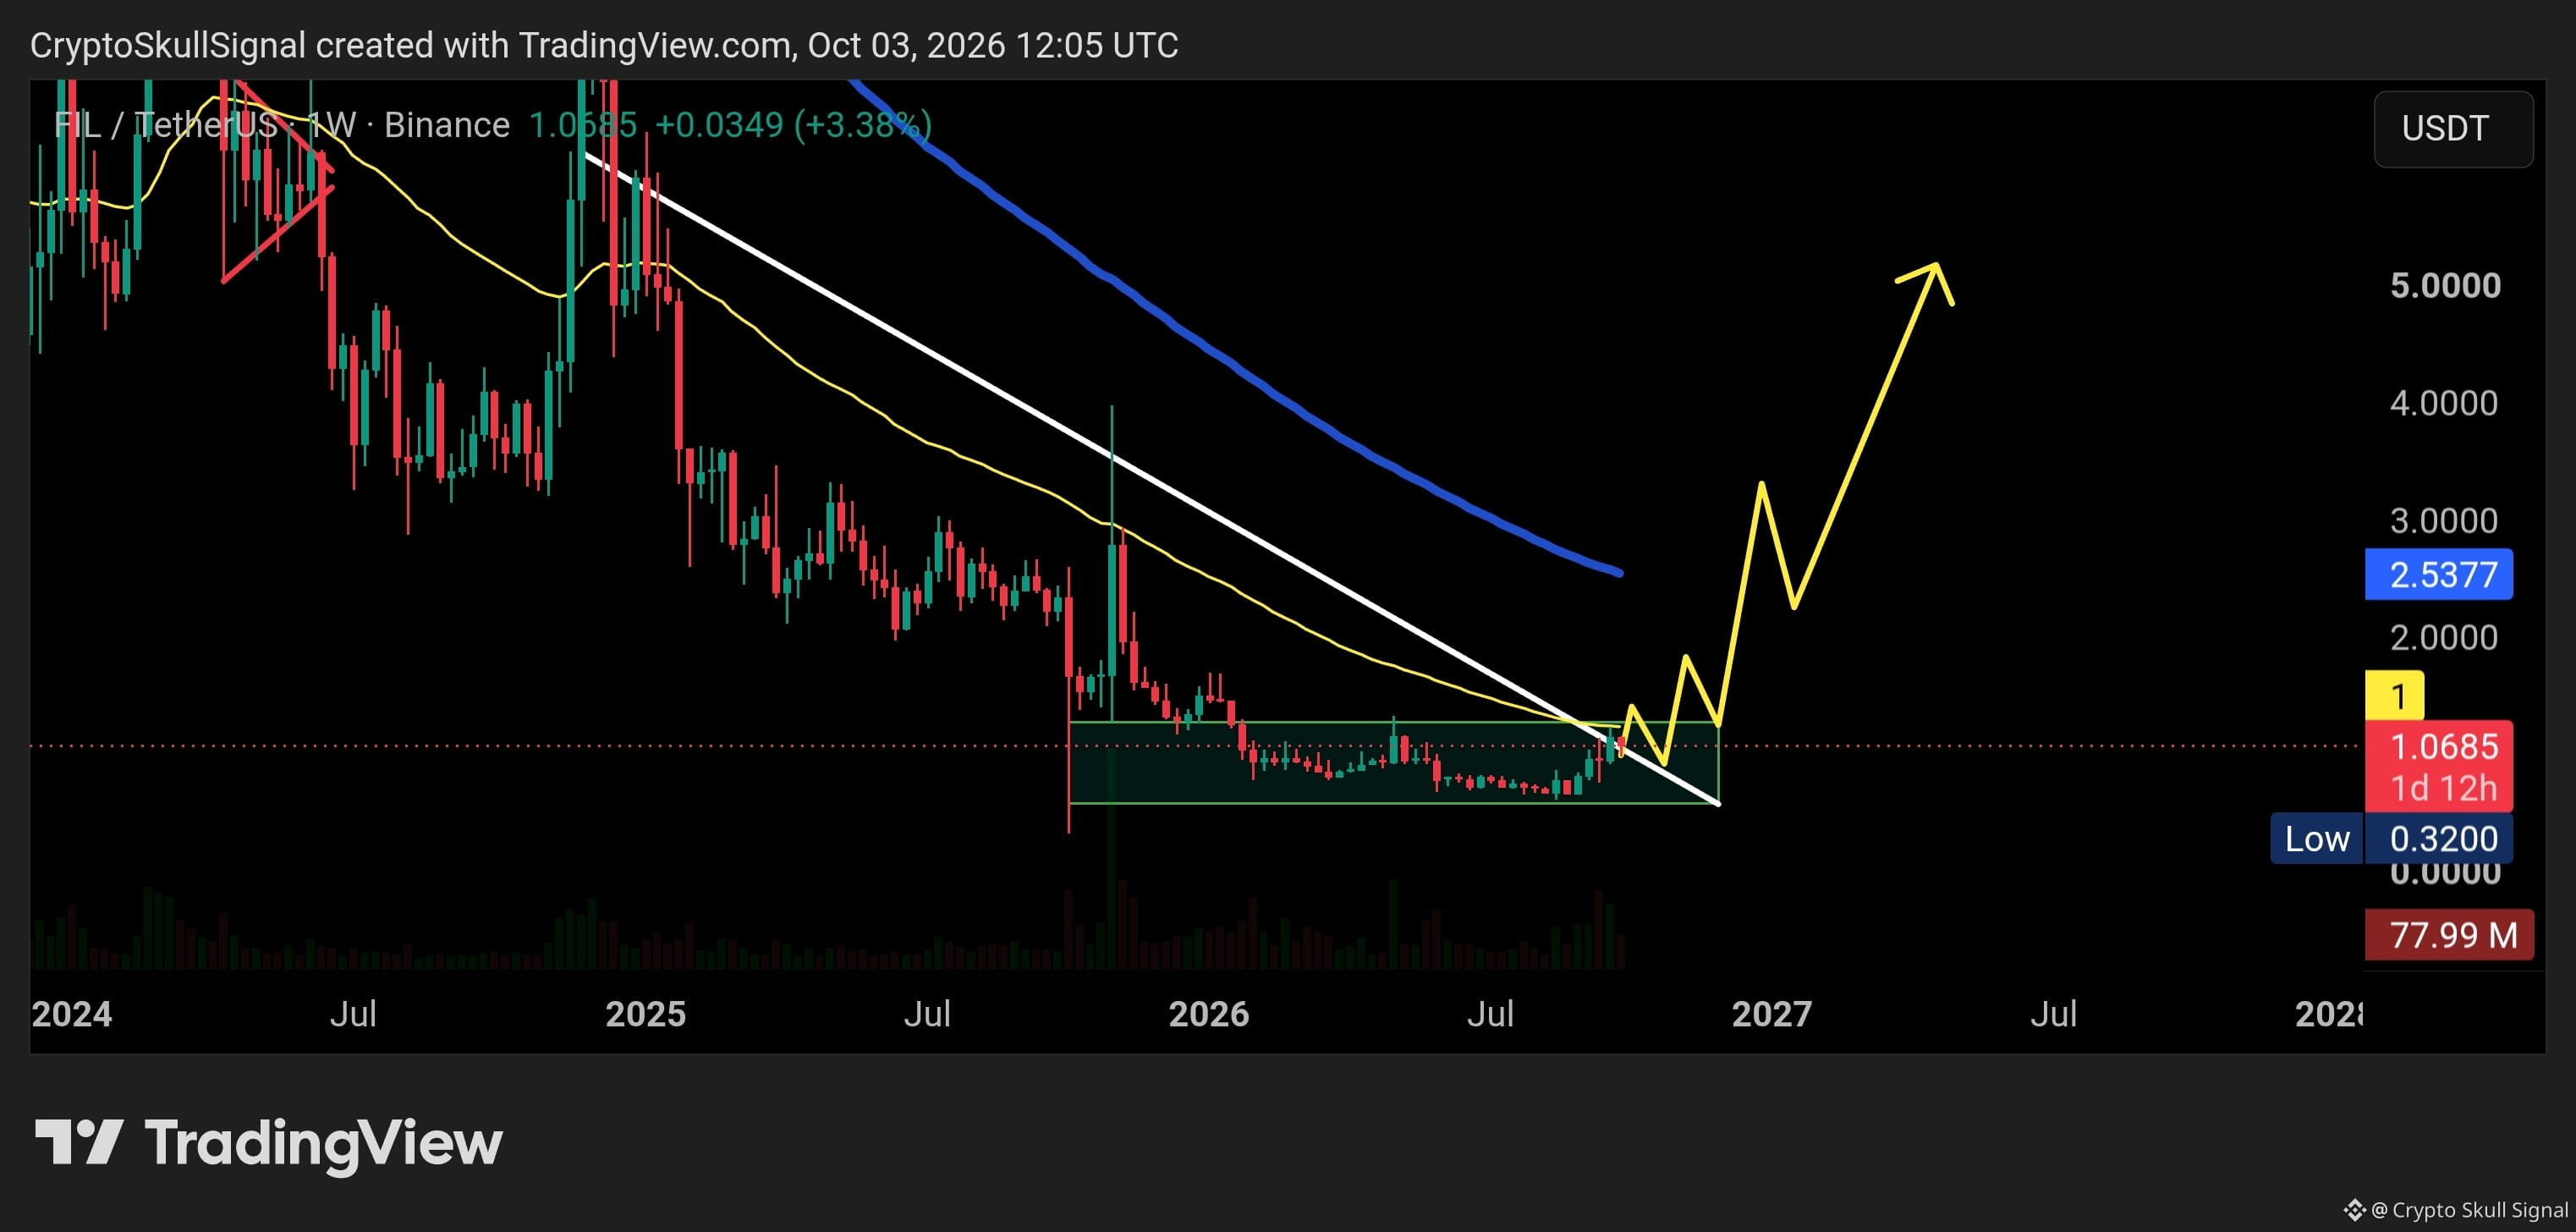
$FIL is approaching a major decision zone.

The downtrend line, 50 EMA, and the accumulation zone are all converging around the same area, making this the key level to watch.

FIL needs to break above this resistance and hold it as support. If that happens, the first major target is the 99 EMA around $2.53.

If FIL can break and hold above the 99 EMA as well, the larger structure could open the way toward $5.

For now, I’m watching the breakout and, more importantly, whether price can hold above this entire resistance area.
$BTC /USDT Take-Profit TARGET 2 DONE ✅ Profit: 32.88% with 10x 📈 {future}(BTCUSDT)
$BTC /USDT Take-Profit

TARGET 2 DONE ✅

Profit: 32.88% with 10x 📈
Crypto Skull Signal
·
--
Bearish
$BTC /USDT

🔴 SHORT 10X

📍 Entry: 86450 - 88890

🎯 Targets:

TP1: 85585
TP2: 84721
TP3: 82992
TP4: 81263
TP5: 78670
TP6: 76076

❌ Stop Loss: 93000

⚠️ Risk: Risky trade. Use low funds only
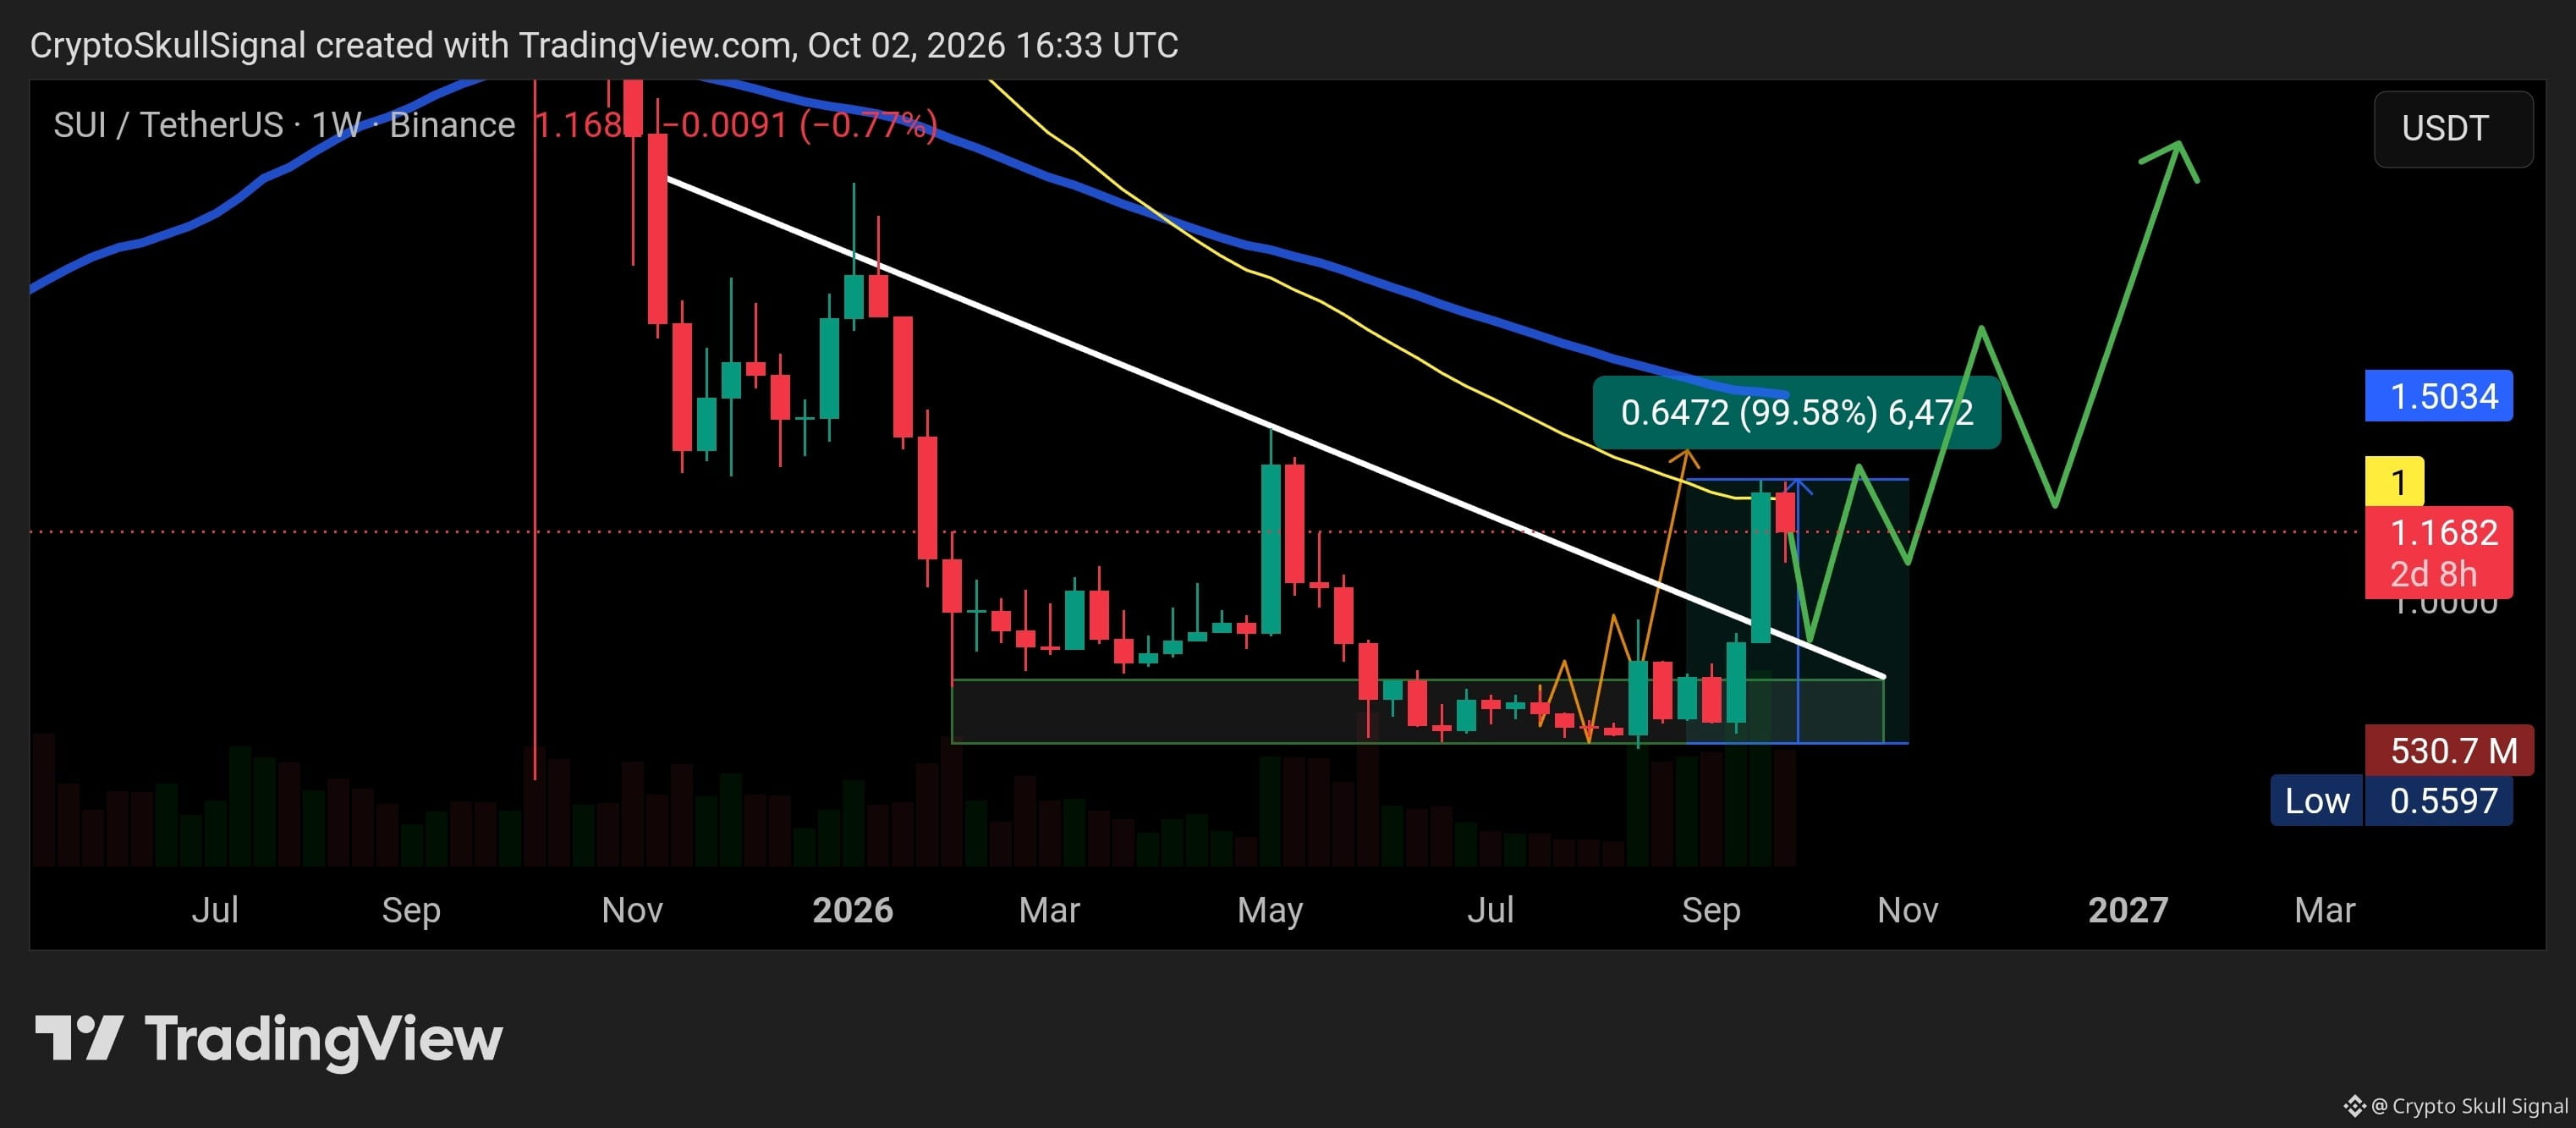
$SUI has already delivered around 99% from the accumulation zone without leverage, exactly as the structure suggested. Now we are seeing a pullback, and price is retesting the broken downtrend line. {future}(SUIUSDT) This is the key area to watch. If SUI successfully retests this trendline and holds above it, I think another rally toward $2 is possible. The structure remains interesting as long as the breakout holds.
$SUI has already delivered around 99% from the accumulation zone without leverage, exactly as the structure suggested.

Now we are seeing a pullback, and price is retesting the broken downtrend line.


This is the key area to watch.

If SUI successfully retests this trendline and holds above it, I think another rally toward $2 is possible.

The structure remains interesting as long as the breakout holds.
$BTC /USDT Take-Profit TARGET 1 DONE ✅ Profit: 12.65% with 10x 📈 {future}(BTCUSDT)
$BTC /USDT Take-Profit

TARGET 1 DONE ✅

Profit: 12.65% with 10x 📈
Crypto Skull Signal
·
--
Bearish
$BTC /USDT

🔴 SHORT 10X

📍 Entry: 86450 - 88890

🎯 Targets:

TP1: 85585
TP2: 84721
TP3: 82992
TP4: 81263
TP5: 78670
TP6: 76076

❌ Stop Loss: 93000

⚠️ Risk: Risky trade. Use low funds only

$BTC /USDT 🔴 SHORT 10X 📍 Entry: 86450 - 88890 🎯 Targets: TP1: 85585 TP2: 84721 TP3: 82992 TP4: 81263 TP5: 78670 TP6: 76076 ❌ Stop Loss: 93000 ⚠️ Risk: Risky trade. Use low funds only {future}(BTCUSDT)
$BTC /USDT

🔴 SHORT 10X

📍 Entry: 86450 - 88890

🎯 Targets:

TP1: 85585
TP2: 84721
TP3: 82992
TP4: 81263
TP5: 78670
TP6: 76076

❌ Stop Loss: 93000

⚠️ Risk: Risky trade. Use low funds only
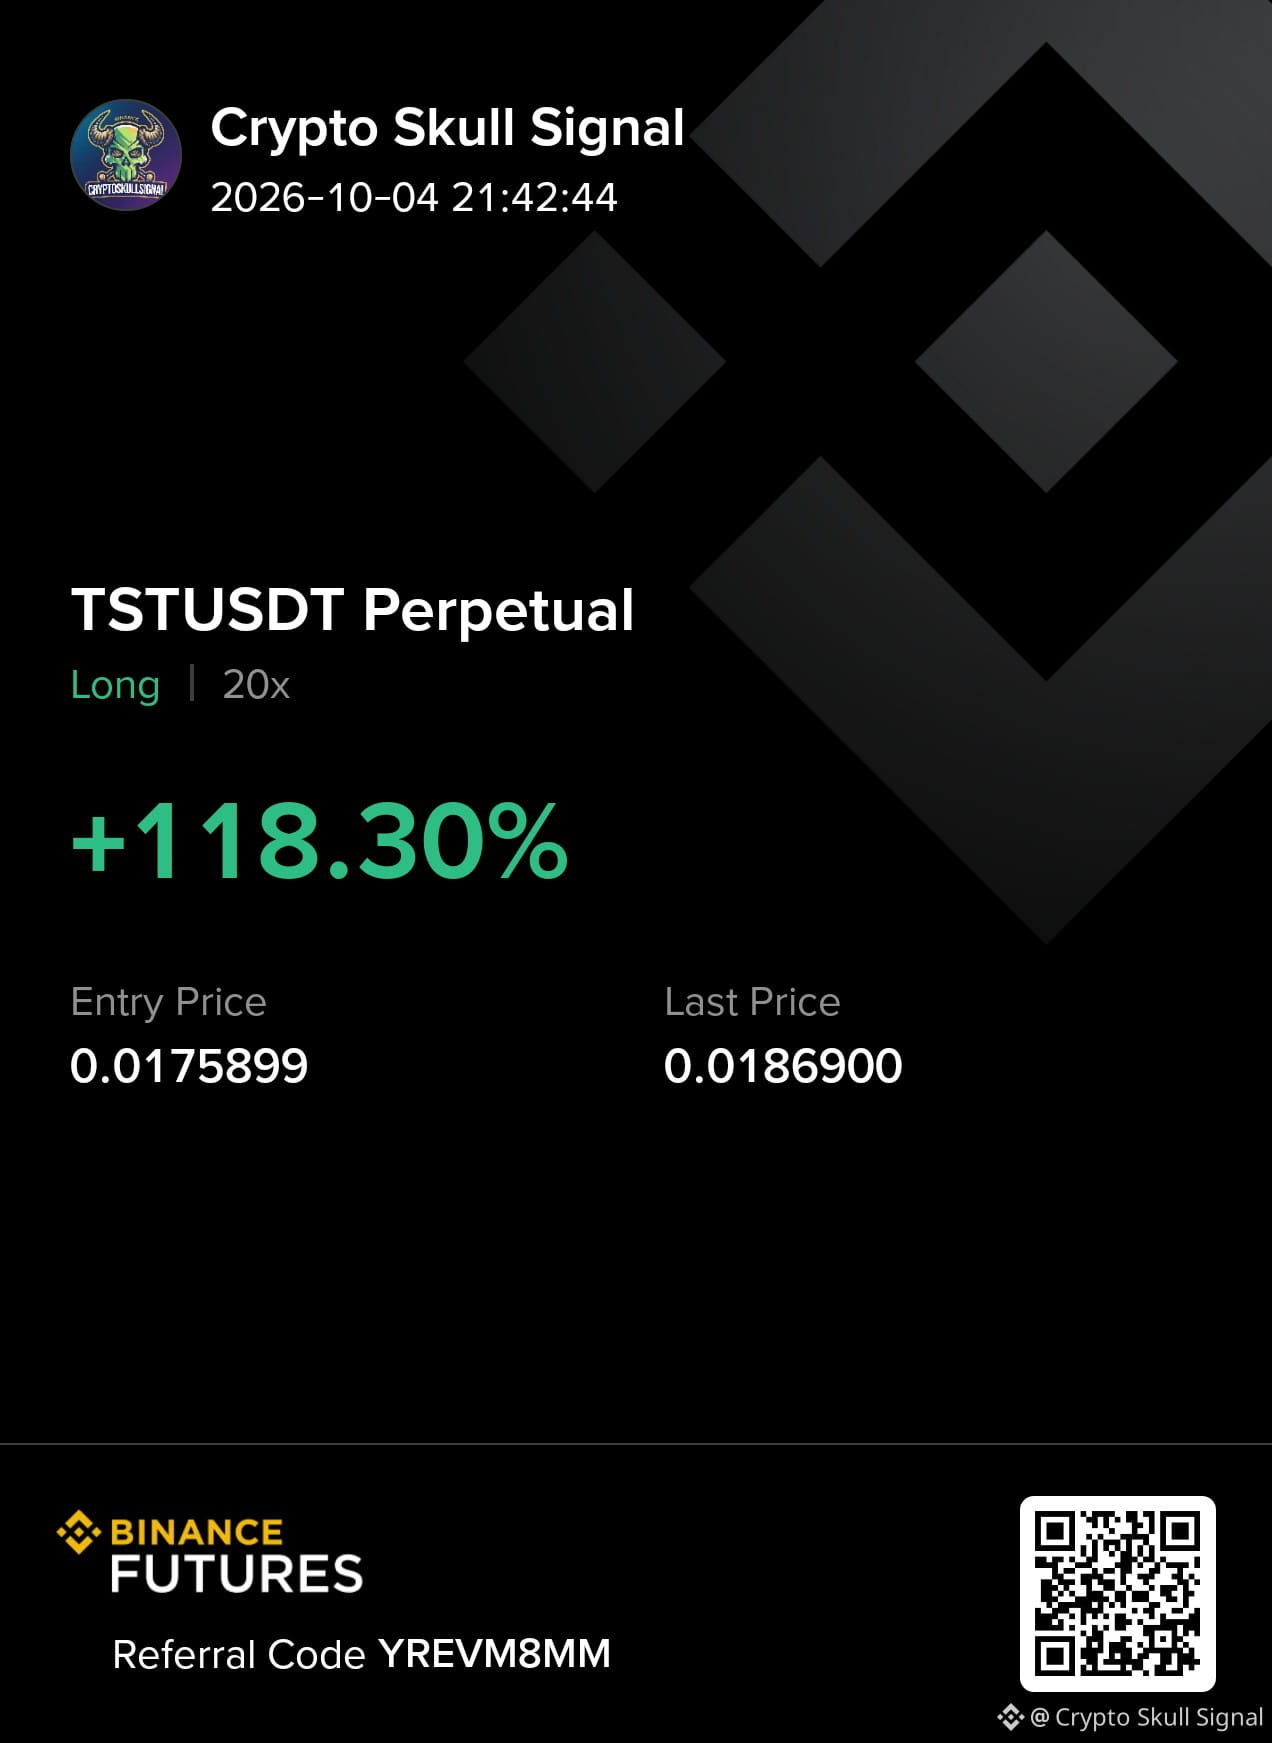
People who bought $BTC at 15k 😂
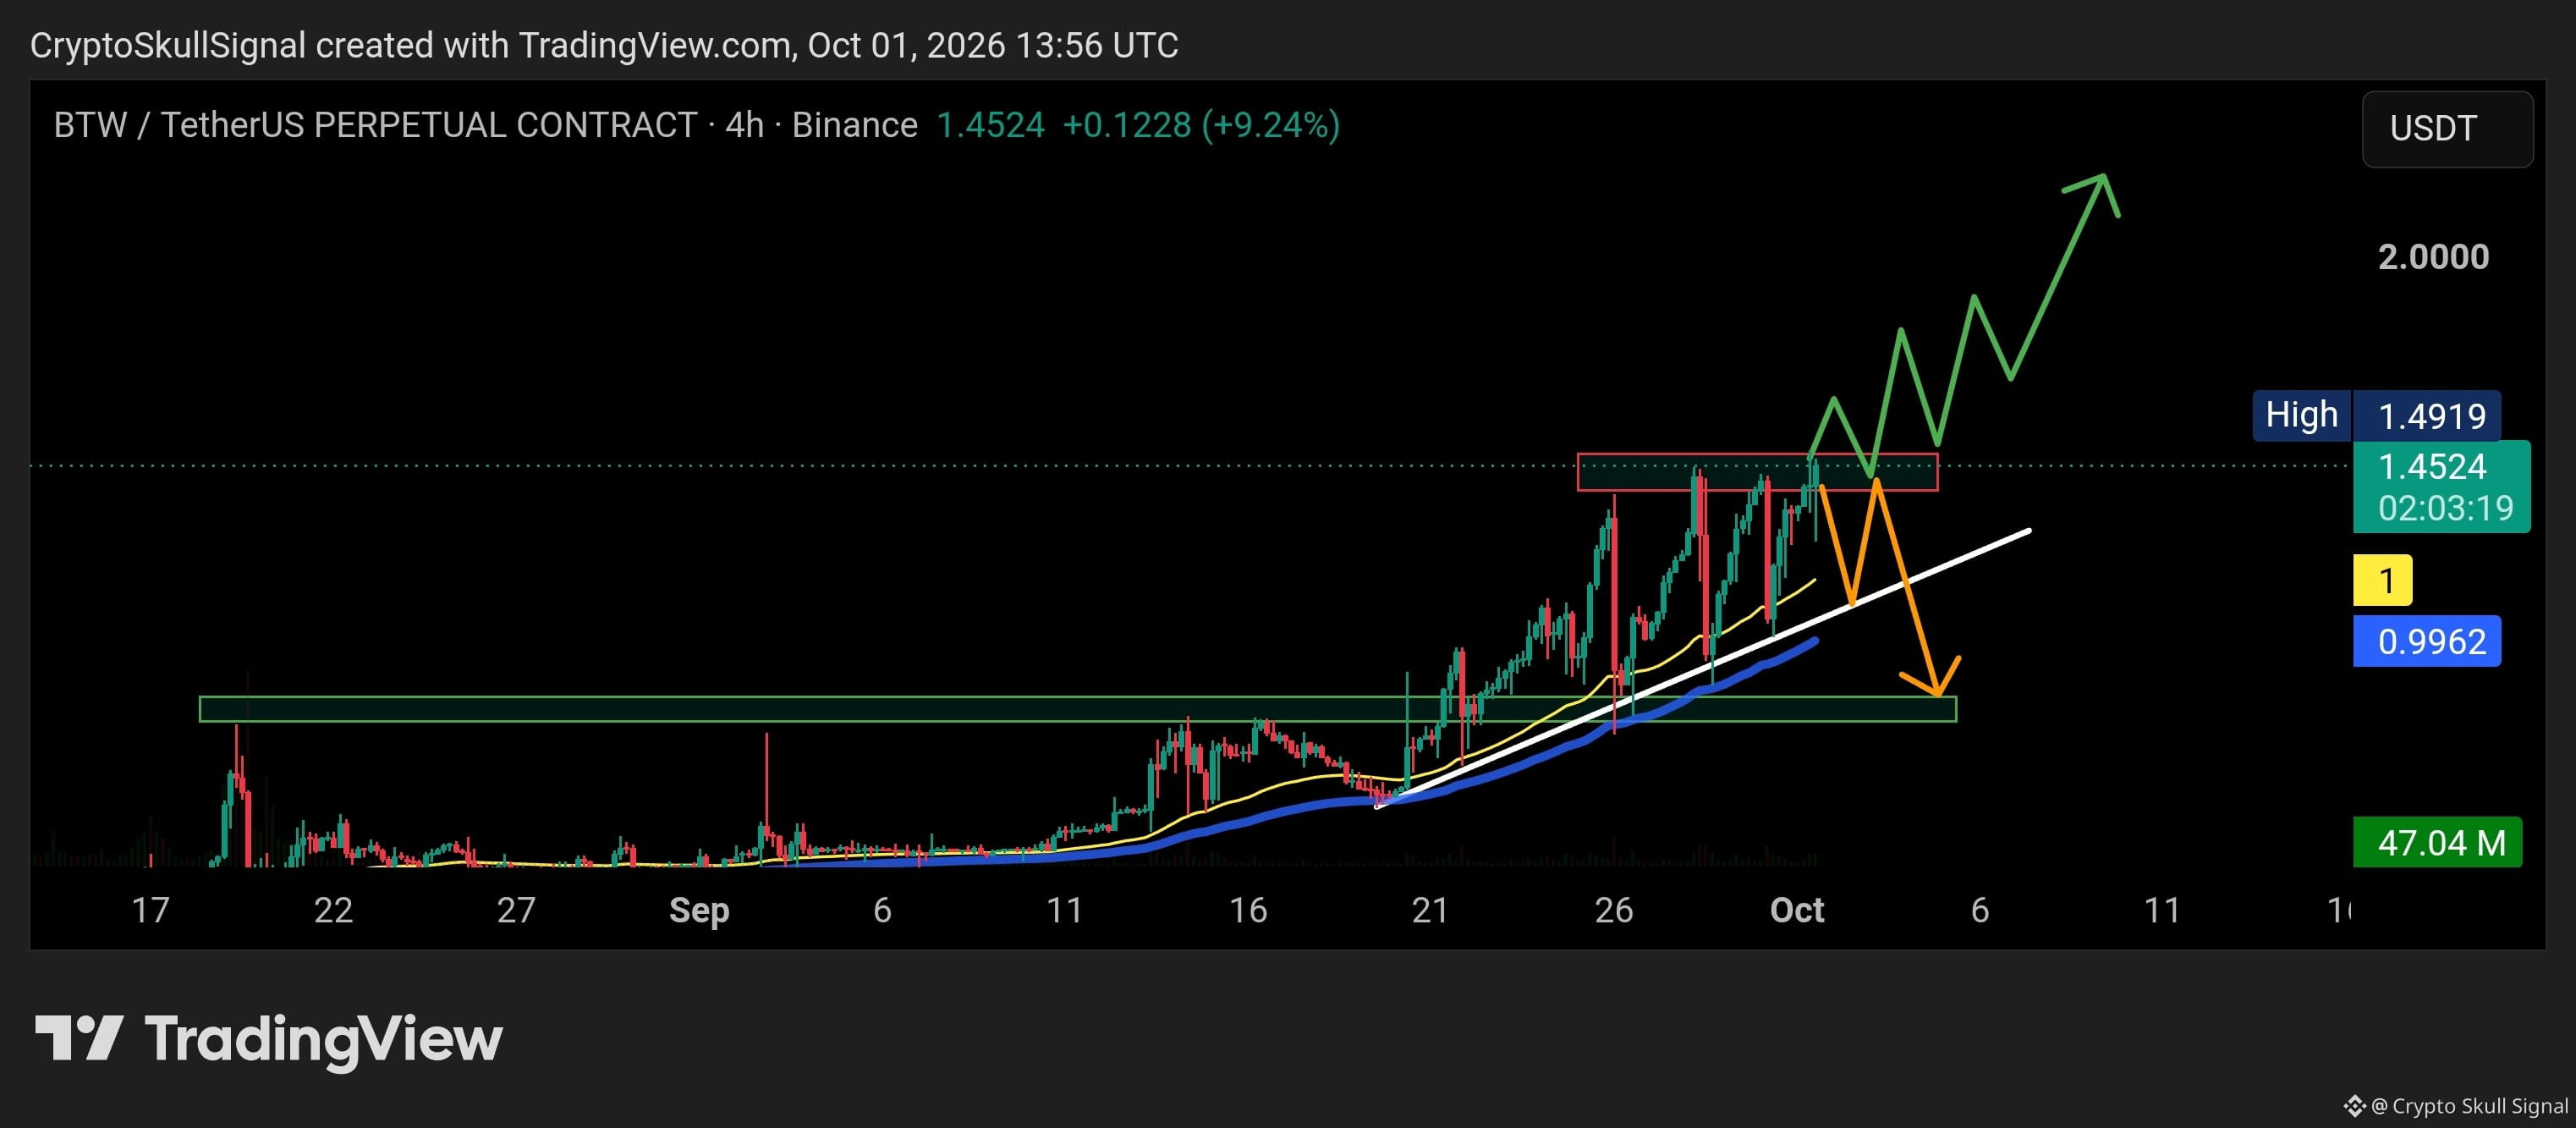
$BTW is sitting right at a major resistance zone after a strong move up. The chart is showing a clear decision point here. If price fails to break above this resistance, I’m watching for a pullback toward the rising trendline and the support zone below. But if BWT breaks out and holds above this resistance, the current structure remains bullish and the next move can extend toward $2 and potentially higher.
$BTW is sitting right at a major resistance zone after a strong move up.

The chart is showing a clear decision point here. If price fails to break above this resistance, I’m watching for a pullback toward the rising trendline and the support zone below.

But if BWT breaks out and holds above this resistance, the current structure remains bullish and the next move can extend toward $2 and potentially higher.
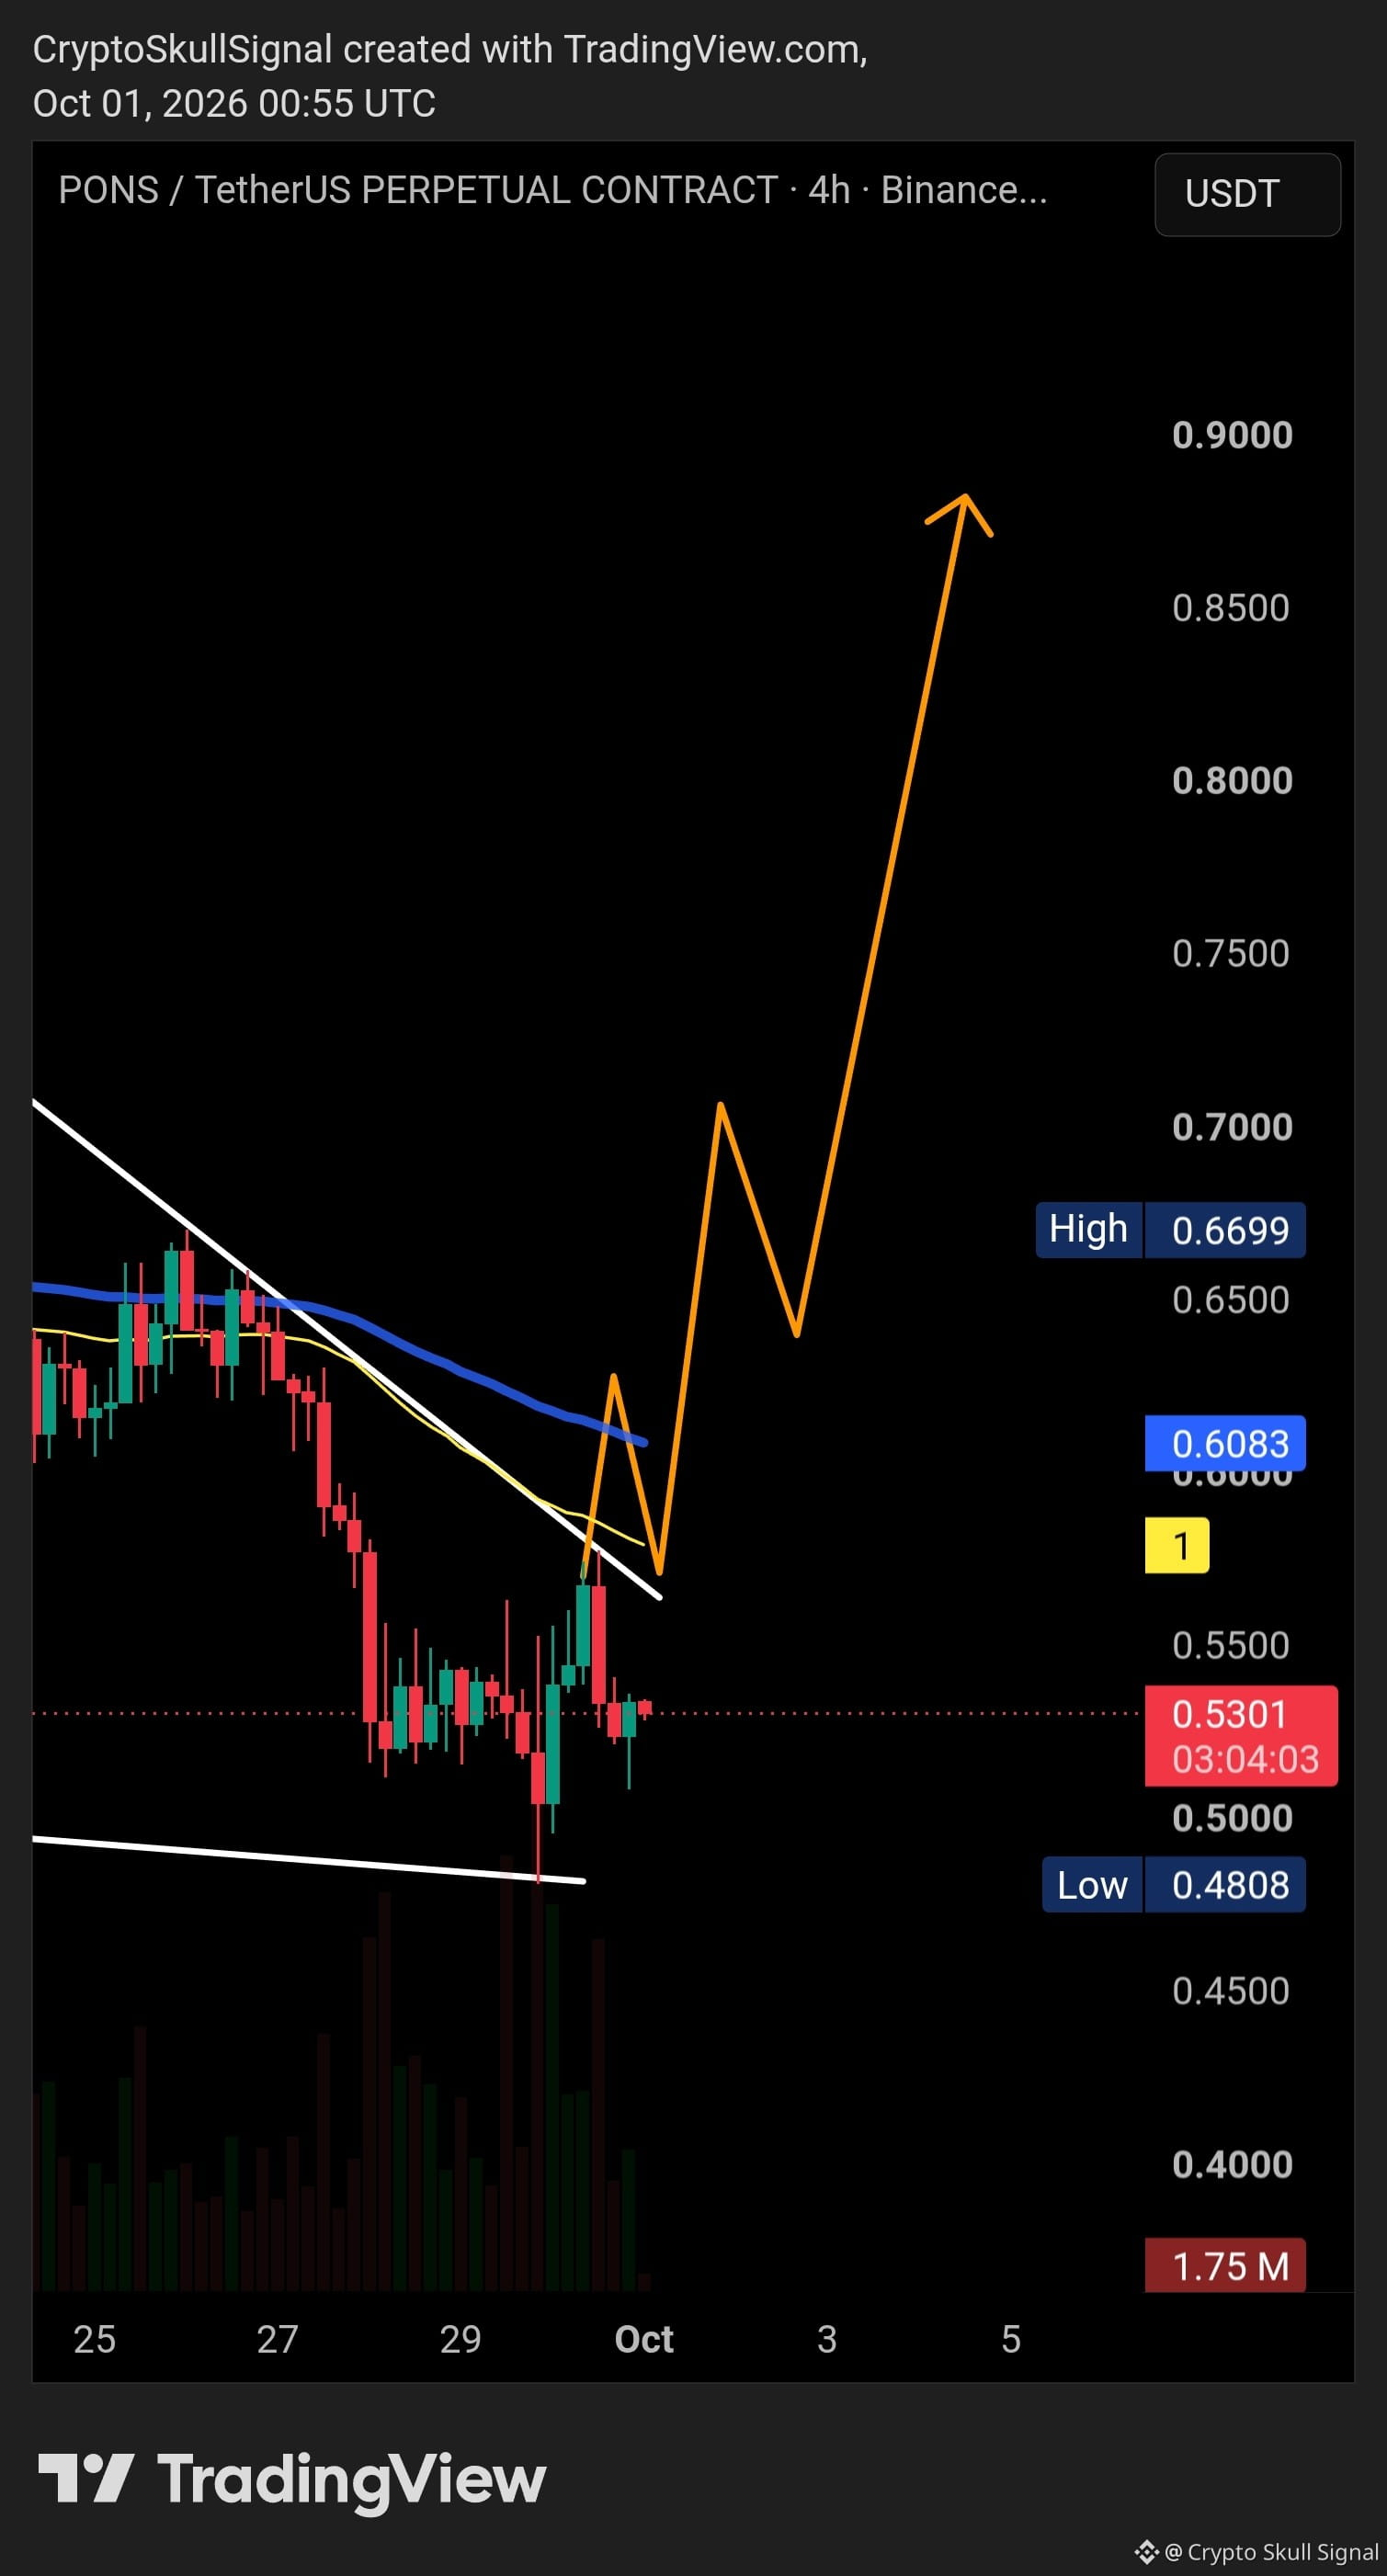
$PONS is forming a Falling Wedge structure, which can turn bullish if the upper trendline is broken and reclaimed. {future}(PONSUSDT) The first breakout attempt was rejected by a strong candle, so I’m not counting the breakout yet. Price is now sitting around the middle of the structure, while the lower trendline near $0.48 is the key support. If $0.48 holds, I’m still watching for another attempt to break above the Falling Wedge and continue higher. But if we get a confirmed candle close below $0.48, the setup is invalid. For now, I’m waiting for two things: support to hold and the upper trendline to break and hold. That’s where the real confirmation comes in.
$PONS is forming a Falling Wedge structure, which can turn bullish if the upper trendline is broken and reclaimed.

The first breakout attempt was rejected by a strong candle, so I’m not counting the breakout yet. Price is now sitting around the middle of the structure, while the lower trendline near $0.48 is the key support.

If $0.48 holds, I’m still watching for another attempt to break above the Falling Wedge and continue higher.

But if we get a confirmed candle close below $0.48, the setup is invalid.

For now, I’m waiting for two things: support to hold and the upper trendline to break and hold. That’s where the real confirmation comes in.
Crypto Skull Signal
·
--
$PONS is setting up nicely, but we need the breakout first and, more importantly, a clean hold above the descending trendline.

If the breakout holds and the structure remains intact, I’ll be watching $0.70 first, followed by $0.85-$0.90.

No breakout, no confirmation. Let’s see how it plays out. 📈
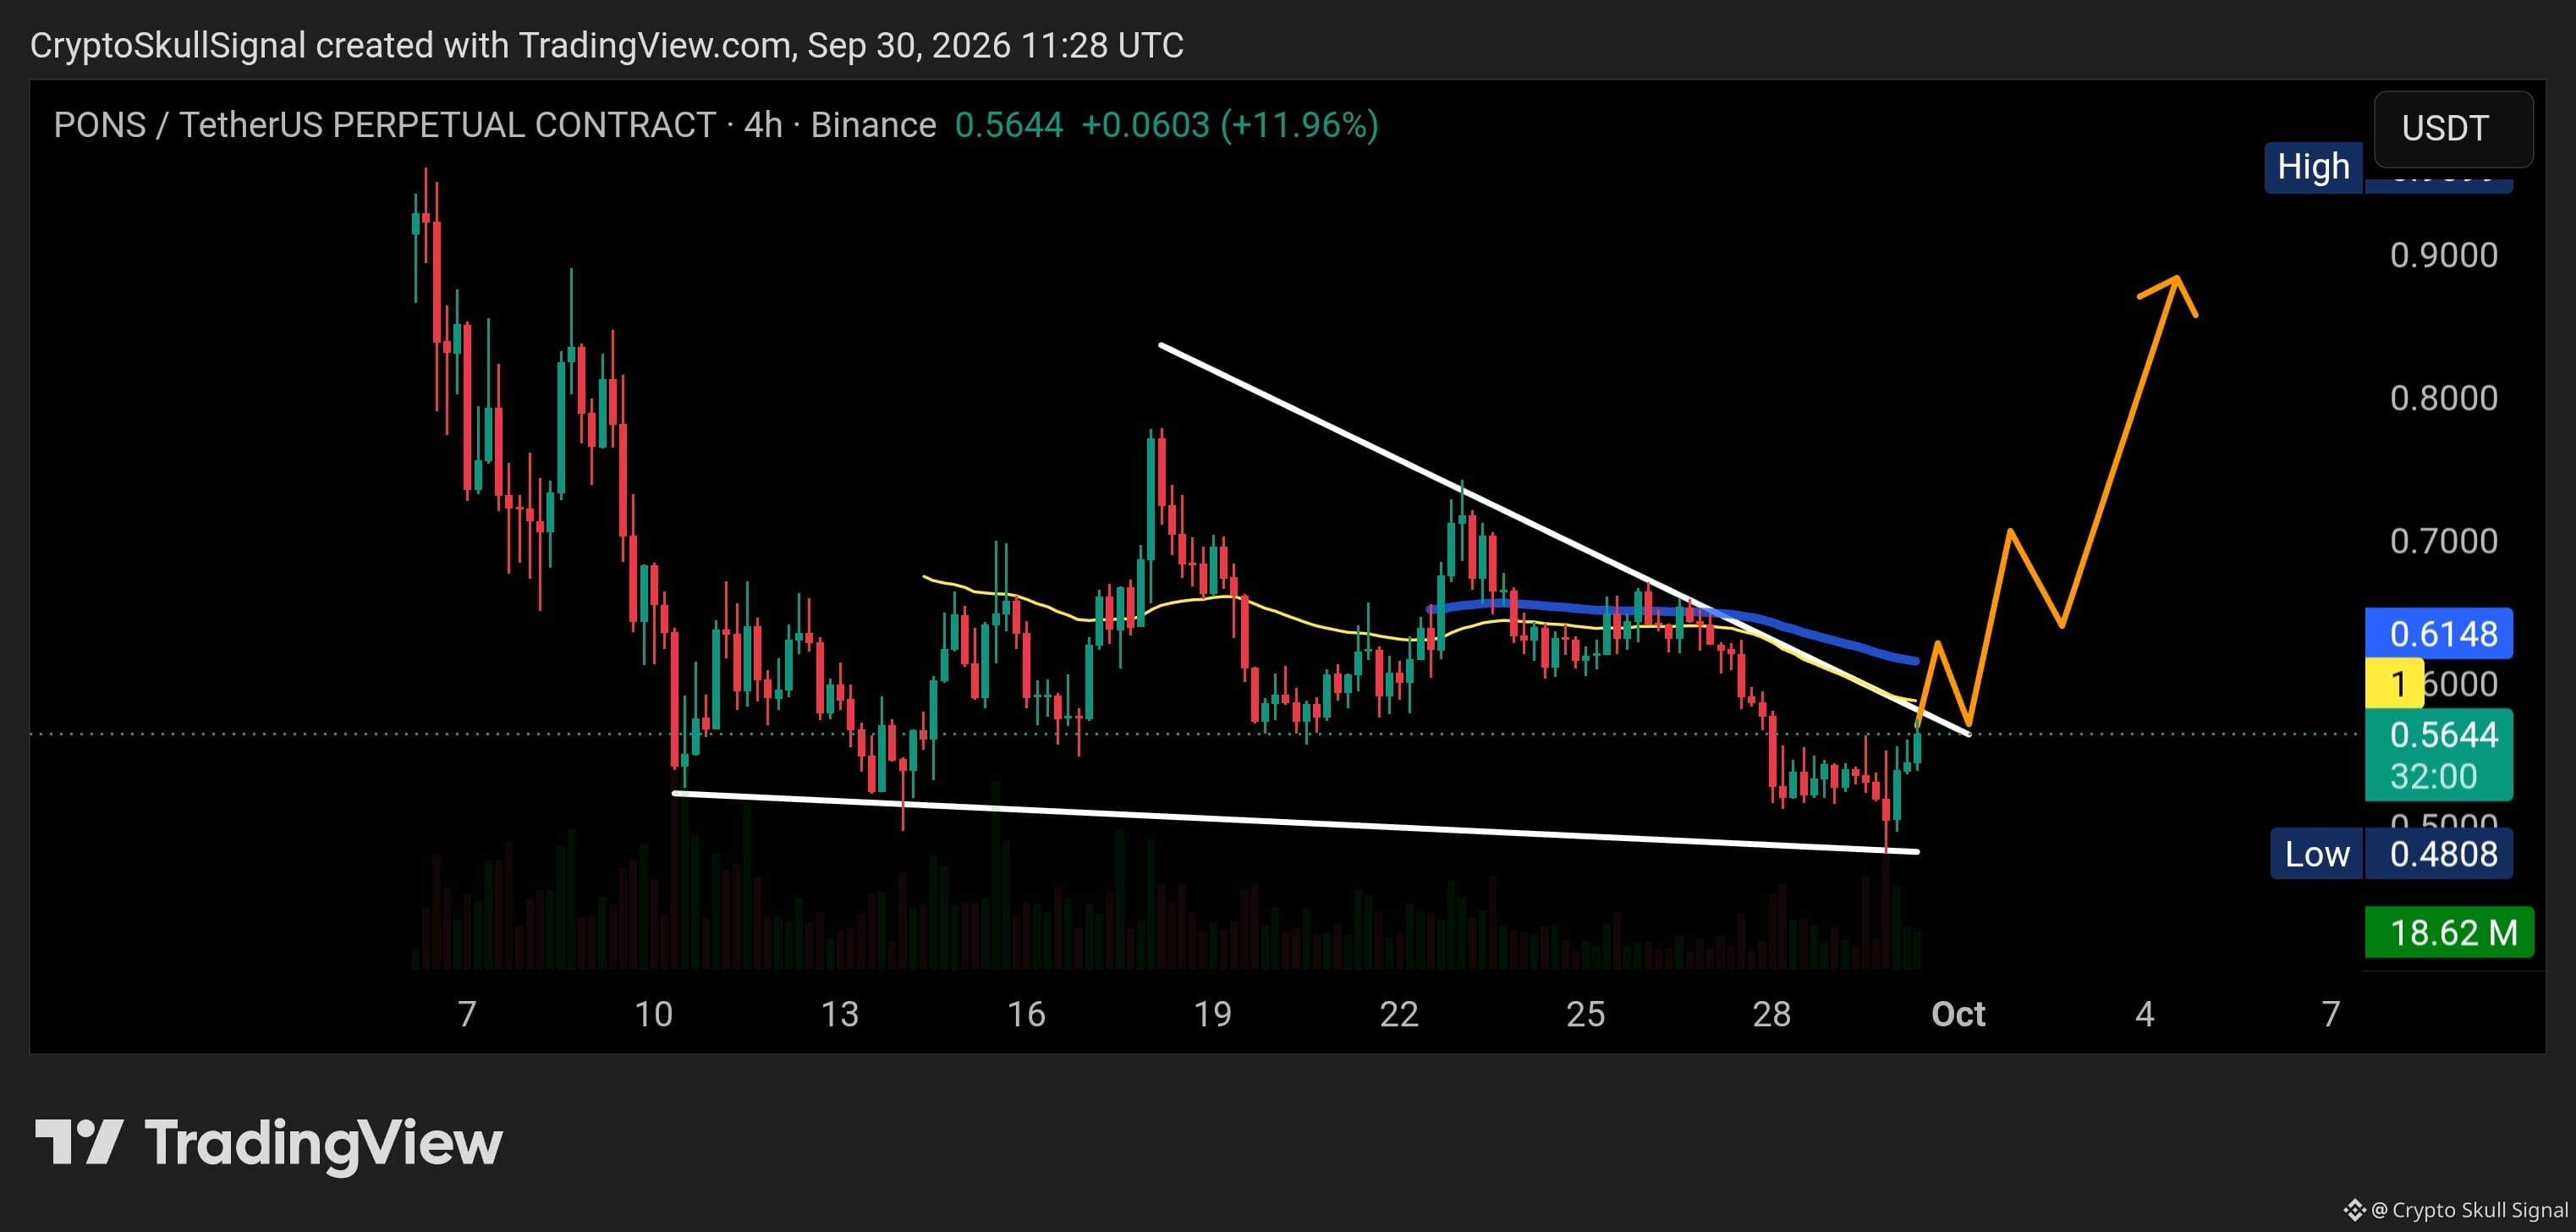
$PONS is setting up nicely, but we need the breakout first and, more importantly, a clean hold above the descending trendline. If the breakout holds and the structure remains intact, I’ll be watching $0.70 first, followed by $0.85-$0.90. No breakout, no confirmation. Let’s see how it plays out. 📈 {future}(PONSUSDT)
$PONS is setting up nicely, but we need the breakout first and, more importantly, a clean hold above the descending trendline.

If the breakout holds and the structure remains intact, I’ll be watching $0.70 first, followed by $0.85-$0.90.

No breakout, no confirmation. Let’s see how it plays out. 📈
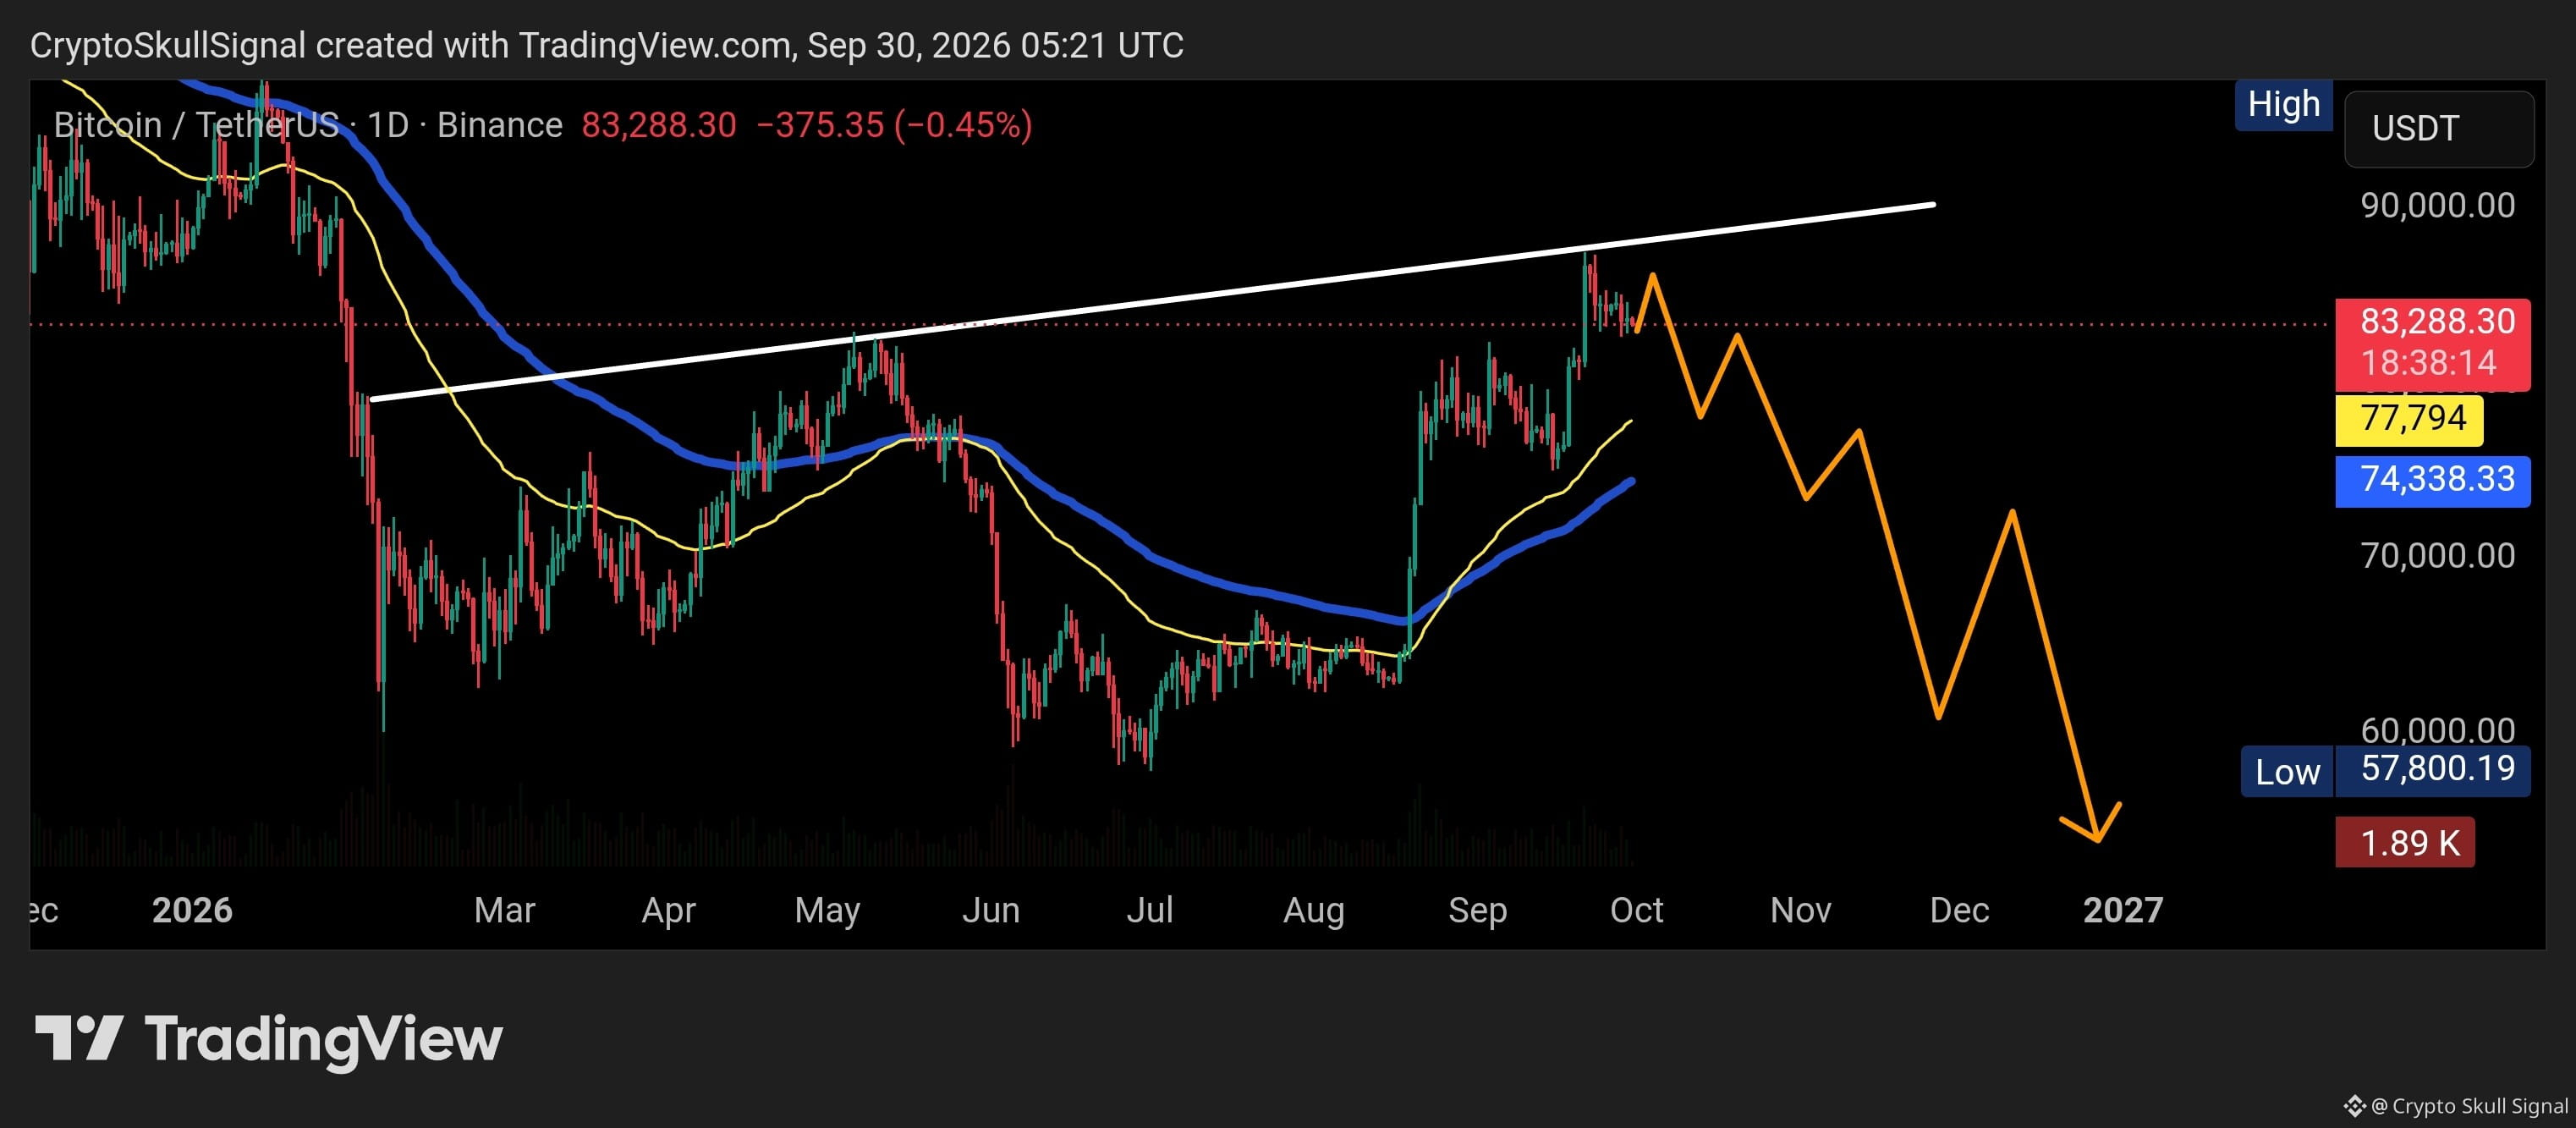
#Bitcoin is showing weakness, and for me, $82K is the key level right now. If BTC gets a daily close below $82K and fails to reclaim it, I think the current move can start looking very different. From there, $75K → $70K becomes the area I’ll be watching. That doesn’t mean it has to happen tomorrow. Markets can move against you for weeks or even months before the bigger structure plays out. I’ve already learned that the hard way because BTC liquidated my short. I still see the recent move as potentially being a trap followed by heavy liquidation. Now we wait and see what BTC does next. I’m not forcing anyone to short or long. I’m simply sharing my thesis and analysis. The market will decide whether I’m right or wrong. $BTC {future}(BTCUSDT)
#Bitcoin is showing weakness, and for me, $82K is the key level right now.

If BTC gets a daily close below $82K and fails to reclaim it, I think the current move can start looking very different. From there, $75K → $70K becomes the area I’ll be watching.

That doesn’t mean it has to happen tomorrow. Markets can move against you for weeks or even months before the bigger structure plays out. I’ve already learned that the hard way because BTC liquidated my short. I still see the recent move as potentially being a trap followed by heavy liquidation.

Now we wait and see what BTC does next.

I’m not forcing anyone to short or long. I’m simply sharing my thesis and analysis. The market will decide whether I’m right or wrong. $BTC
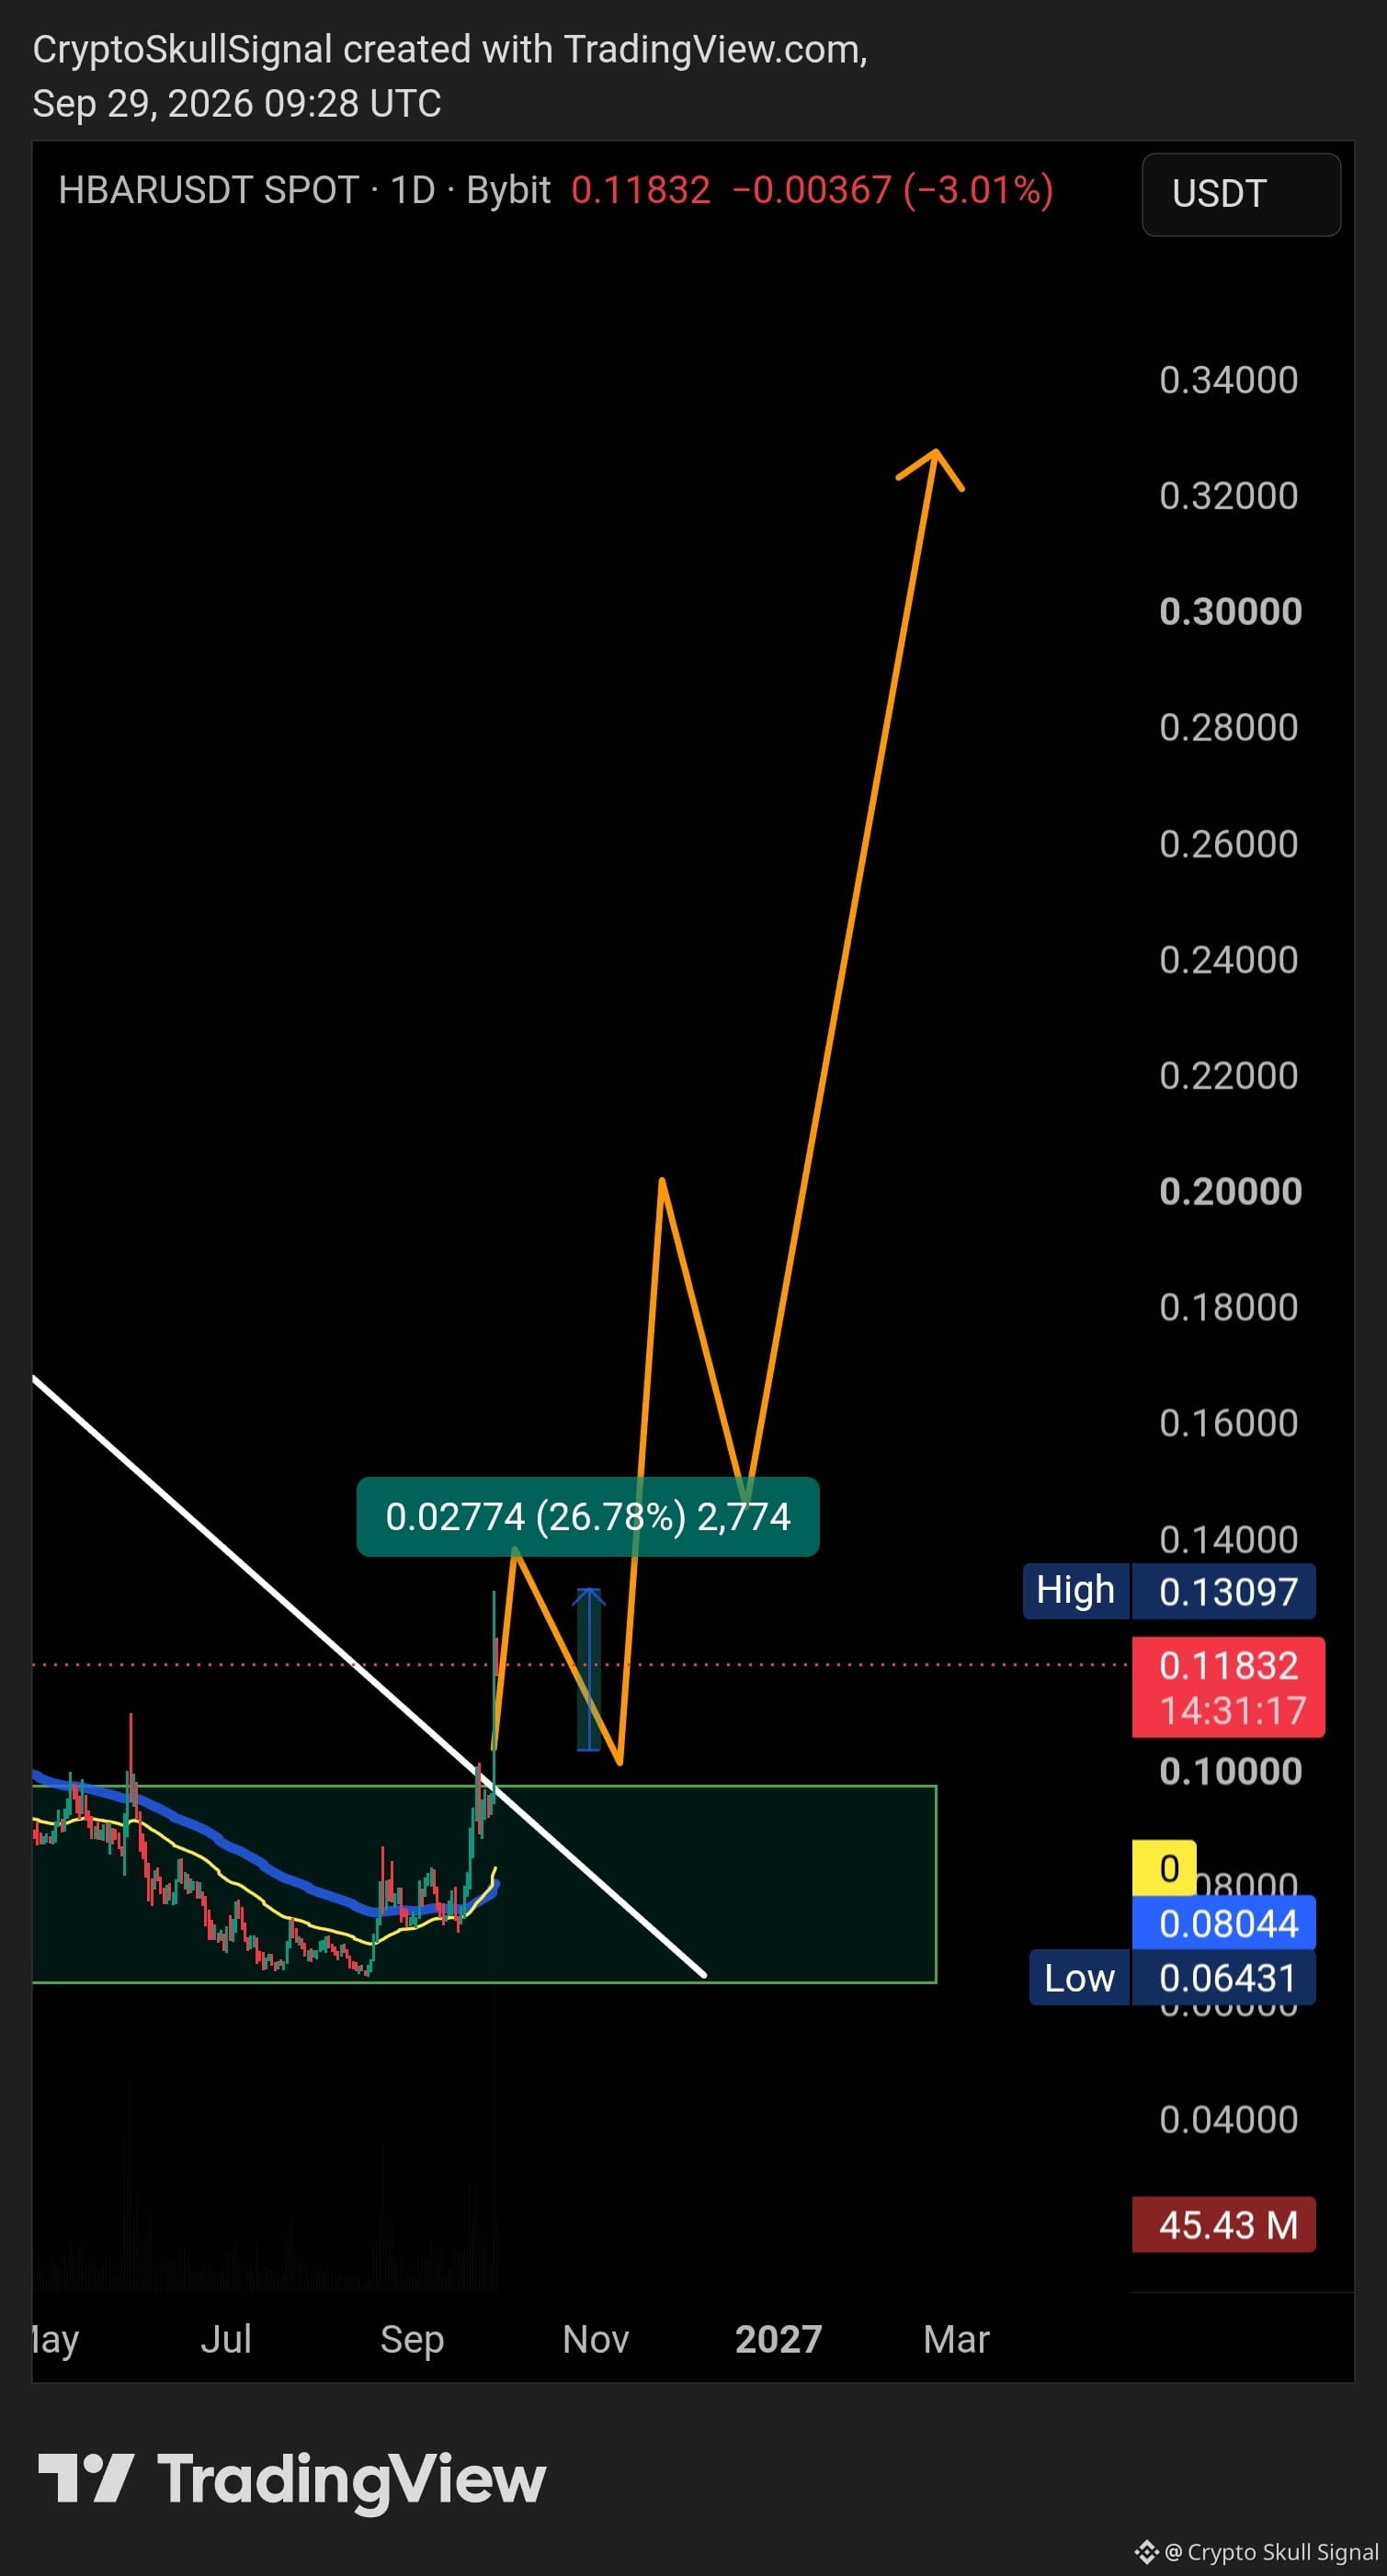
$HBAR is now up 25% from the setup. 👀🔥 The key now is to hold above $0.12 and stay above the accumulation zone. If those levels continue to hold, the bullish setup remains intact. 📈
$HBAR is now up 25% from the setup. 👀🔥

The key now is to hold above $0.12 and stay above the accumulation zone.

If those levels continue to hold, the bullish setup remains intact. 📈
Crypto Skull Signal
·
--
Bullish
$HBAR is looking highly bullish here. 👀📈

As long as price holds above the accumulation zone and the broken downtrend, the setup remains intact.

If HBAR breaks above $0.12 and holds it as support, I’ll be watching $0.35 next.

The key is not just the breakout, but holding it. 🔥

Verified
$ONDO expands tokenized stocks with Korean equities for overseas investors and 24/7 perps using stocks and ETFs as collateral {future}(ONDOUSDT)
$ONDO expands tokenized stocks with Korean equities for overseas investors and 24/7 perps using stocks and ETFs as collateral
Crypto Skull Signal
·
--
Bearish
Zcash co-founder Eli Ben-Sasson predicts that the price of ZEC will reach $5,000 by the end of the year.

#ZEC downtrend starting 🚨

$ZEC
$HBAR is looking highly bullish here. 👀📈 As long as price holds above the accumulation zone and the broken downtrend, the setup remains intact. If HBAR breaks above $0.12 and holds it as support, I’ll be watching $0.35 next. The key is not just the breakout, but holding it. 🔥 {future}(HBARUSDT)
$HBAR is looking highly bullish here. 👀📈

As long as price holds above the accumulation zone and the broken downtrend, the setup remains intact.

If HBAR breaks above $0.12 and holds it as support, I’ll be watching $0.35 next.

The key is not just the breakout, but holding it. 🔥
Zcash co-founder Eli Ben-Sasson predicts that the price of ZEC will reach $5,000 by the end of the year. #ZEC downtrend starting 🚨 $ZEC {future}(ZECUSDT)
Zcash co-founder Eli Ben-Sasson predicts that the price of ZEC will reach $5,000 by the end of the year.

#ZEC downtrend starting 🚨

$ZEC
Log in to explore more content
Join global crypto users on Binance Square
⚡️ Get latest and useful information about crypto.
💬 Trusted by the world’s largest crypto exchange.
👍 Discover real insights from verified creators.
Email / Phone number
Sitemap
Cookie Preferences
Platform T&Cs