

Block HunterX
3k Posts

Block HunterX
Report
Block User
OG crypto hunter! transformed 4K$ into 1M$ during the chaos.
Occasional Trader
1.8 Years
13 Following
3.0K+ Followers
7.9K+ Liked
Posts
All
Quotes
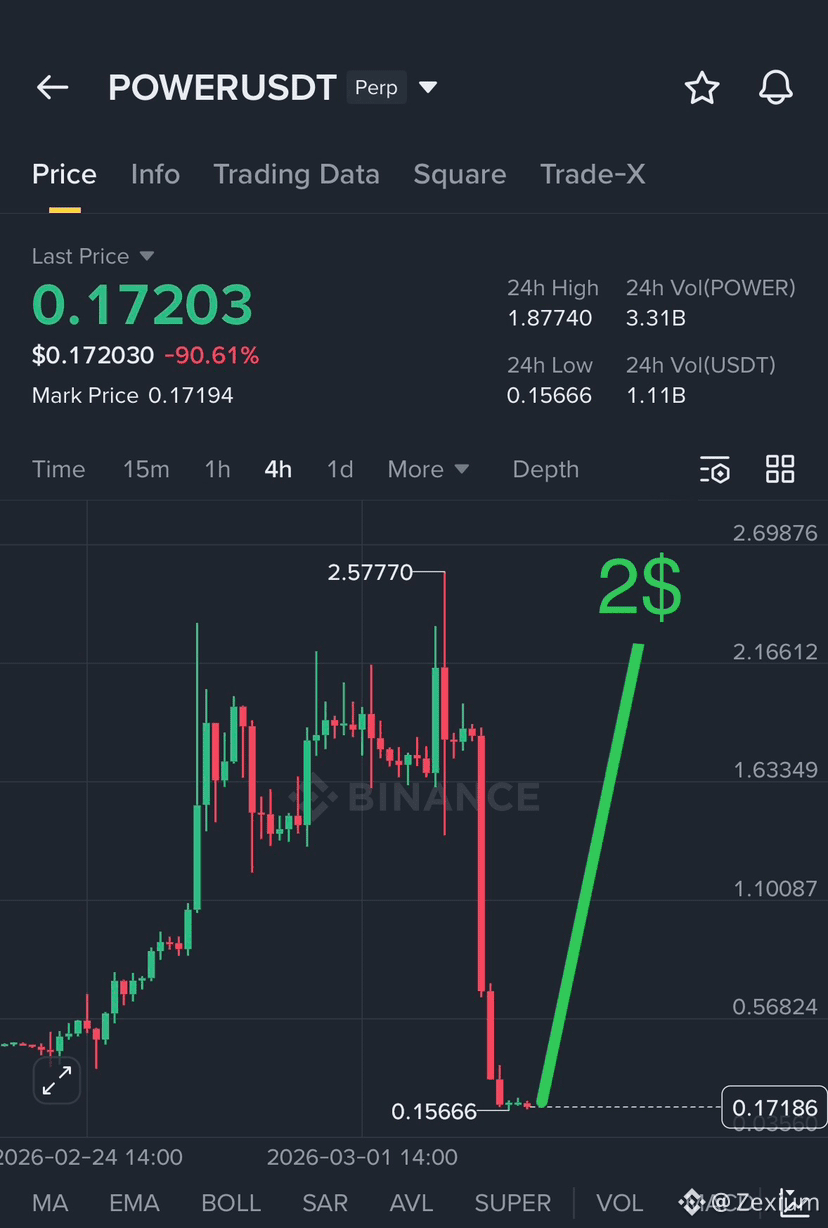
$POWER to $2 again? 😱🔥
Do you think $POWER can make another big pump?
Yes ✅
No ❌
$POWER to $2 again? 😱🔥
Do you think $POWER can make another big pump?
Yes ✅
No ❌
Do you think $POWER can make another big pump?
Yes ✅
No ❌
1
1
495
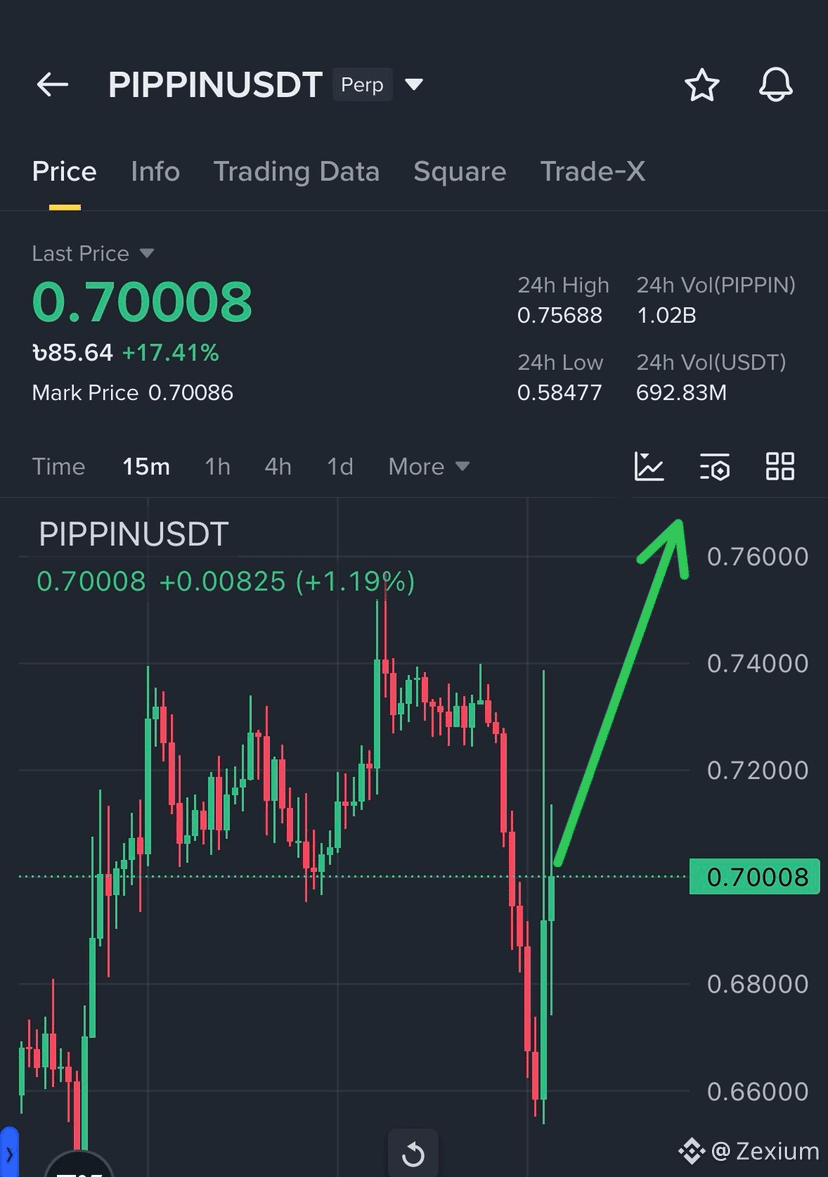
$PIPPIN momentum continues as FOMO and short liquidations drive price action. $1 remains a valid target. Staying long.
{future}(PIPPINUSDT)
$PIPPIN momentum continues as FOMO and short liquidations drive price action. $1 remains a valid target. Staying long.
511
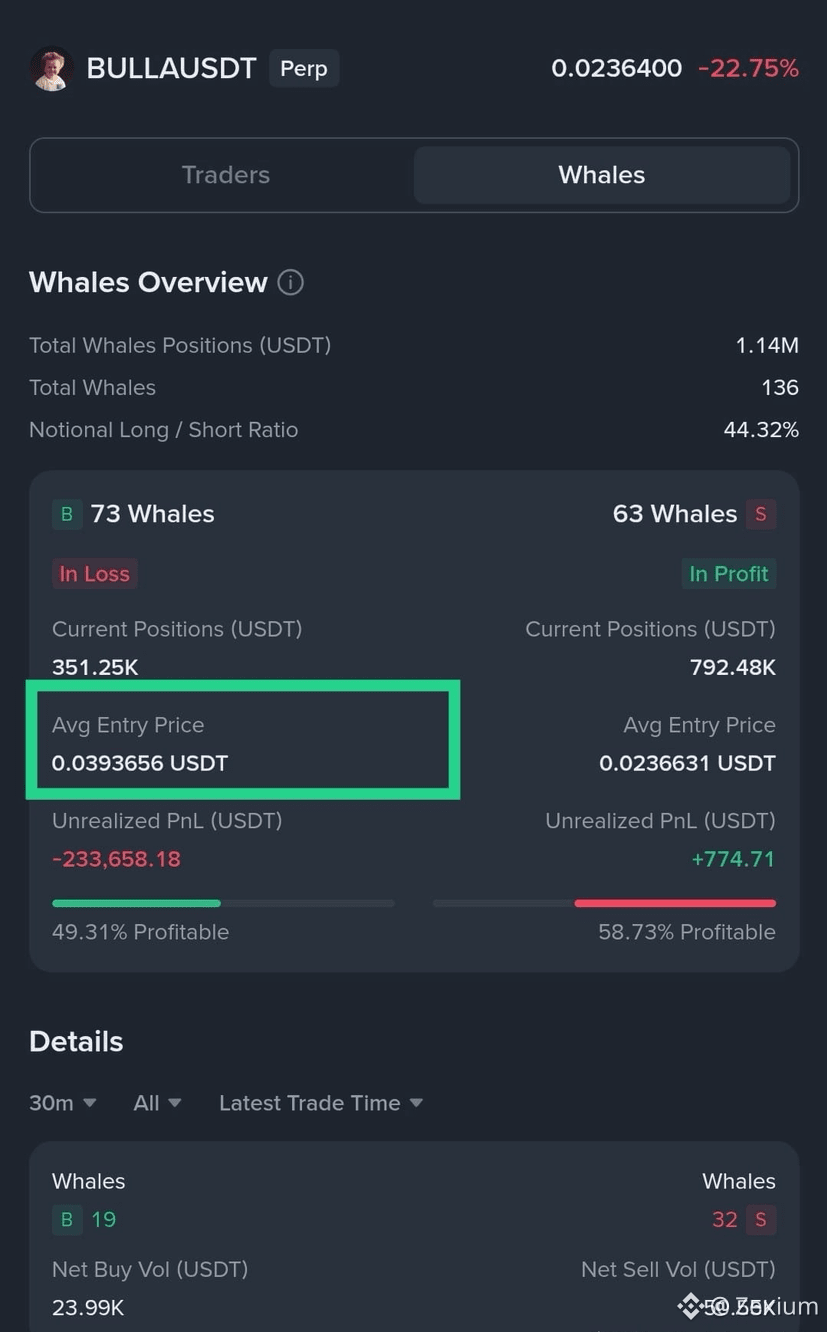
🚨 $BULLA Alert 🚨
Whales positioned near $0.039 🐳
They’re not letting this go.
Expect another leg up 🚀
TP: 0.025 – 0.028
SL: 0.020
Stay long $BULLA 📈
🚨 $BULLA Alert 🚨
Whales positioned near $0.039 🐳
They’re not letting this go.
Expect another leg up 🚀
TP: 0.025 – 0.028
SL: 0.020
Stay long $BULLA 📈
Whales positioned near $0.039 🐳
They’re not letting this go.
Expect another leg up 🚀
TP: 0.025 – 0.028
SL: 0.020
Stay long $BULLA 📈
2
465
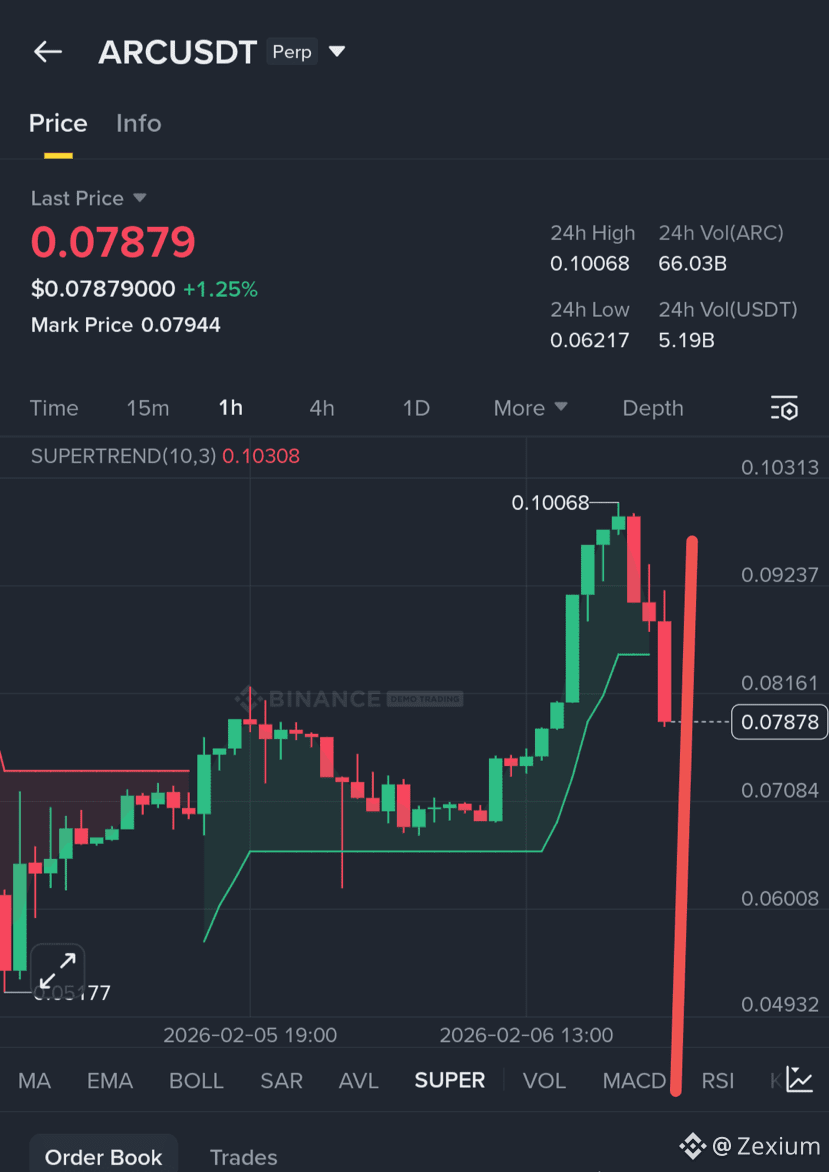
📉 $ARC Downtrend Continues
More downside in play
TP: 0.075 / 0.070
Keep shorting $ARC 🔻
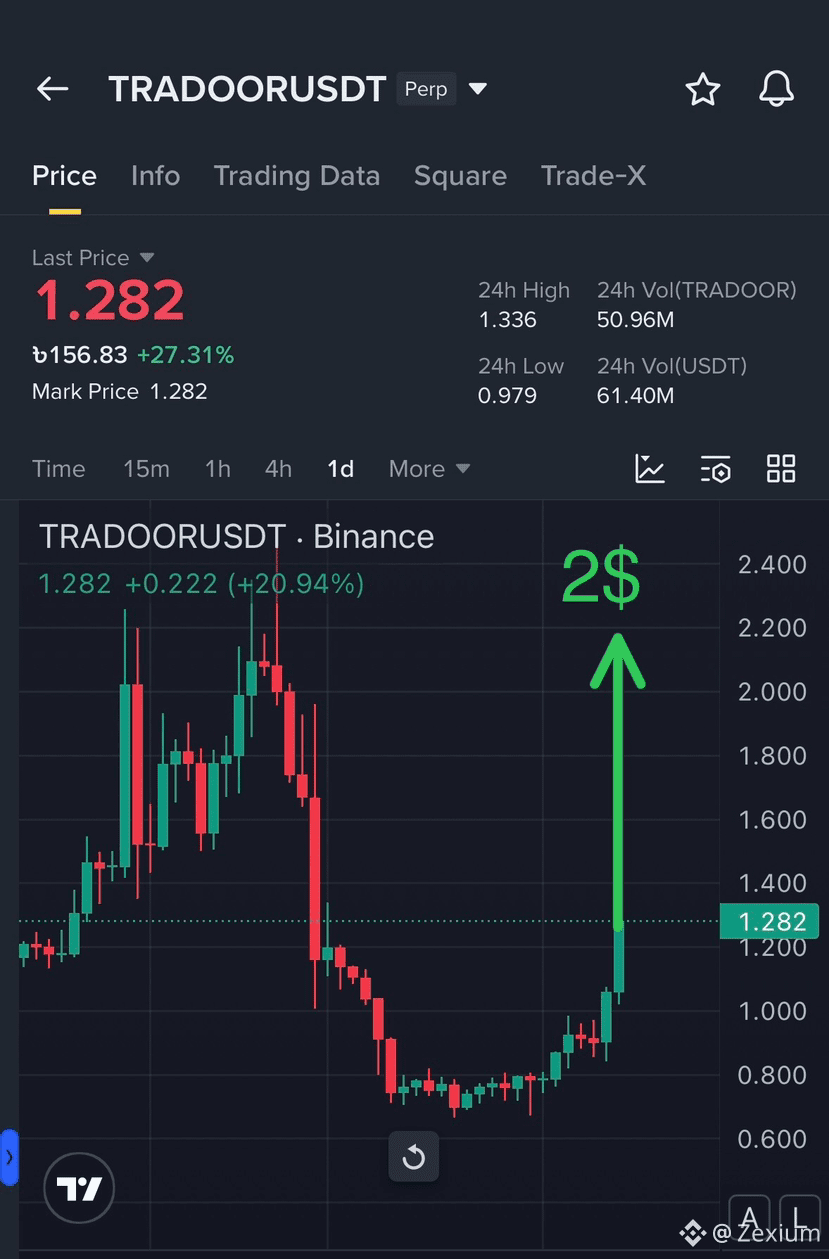
Don’t miss $TRADOOR 👀
📉 $ARC Downtrend Continues
More downside in play
TP: 0.075 / 0.070
Keep shorting $ARC 🔻
Don’t miss $TRADOOR 👀
More downside in play
TP: 0.075 / 0.070
Keep shorting $ARC 🔻
Don’t miss $TRADOOR 👀
196
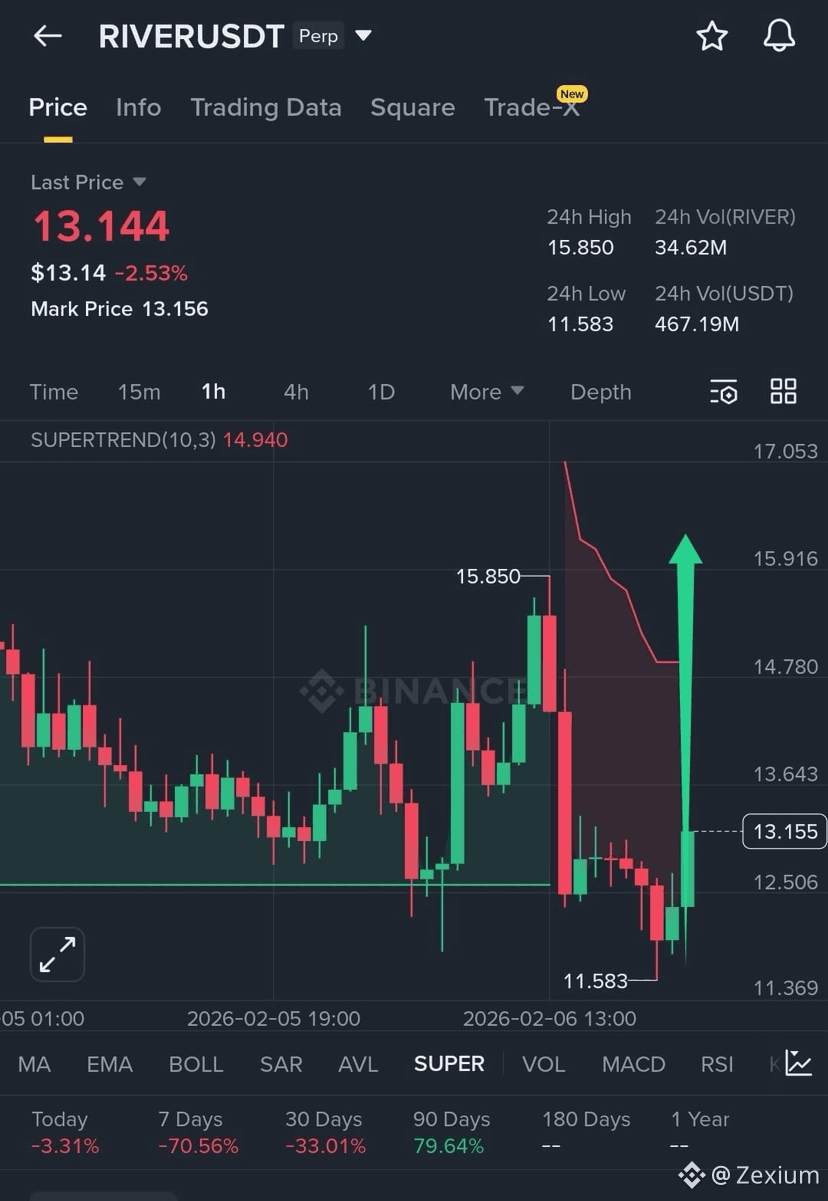
🚀 $RIVER Buy Long Now 📈
Momentum building
TP: 15
SL: 10
$BULLA & $PIPPIN longs active — don’t miss ✅
🚀 $RIVER Buy Long Now 📈
Momentum building
TP: 15
SL: 10
$BULLA & $PIPPIN longs active — don’t miss ✅
Momentum building
TP: 15
SL: 10
$BULLA & $PIPPIN longs active — don’t miss ✅
358
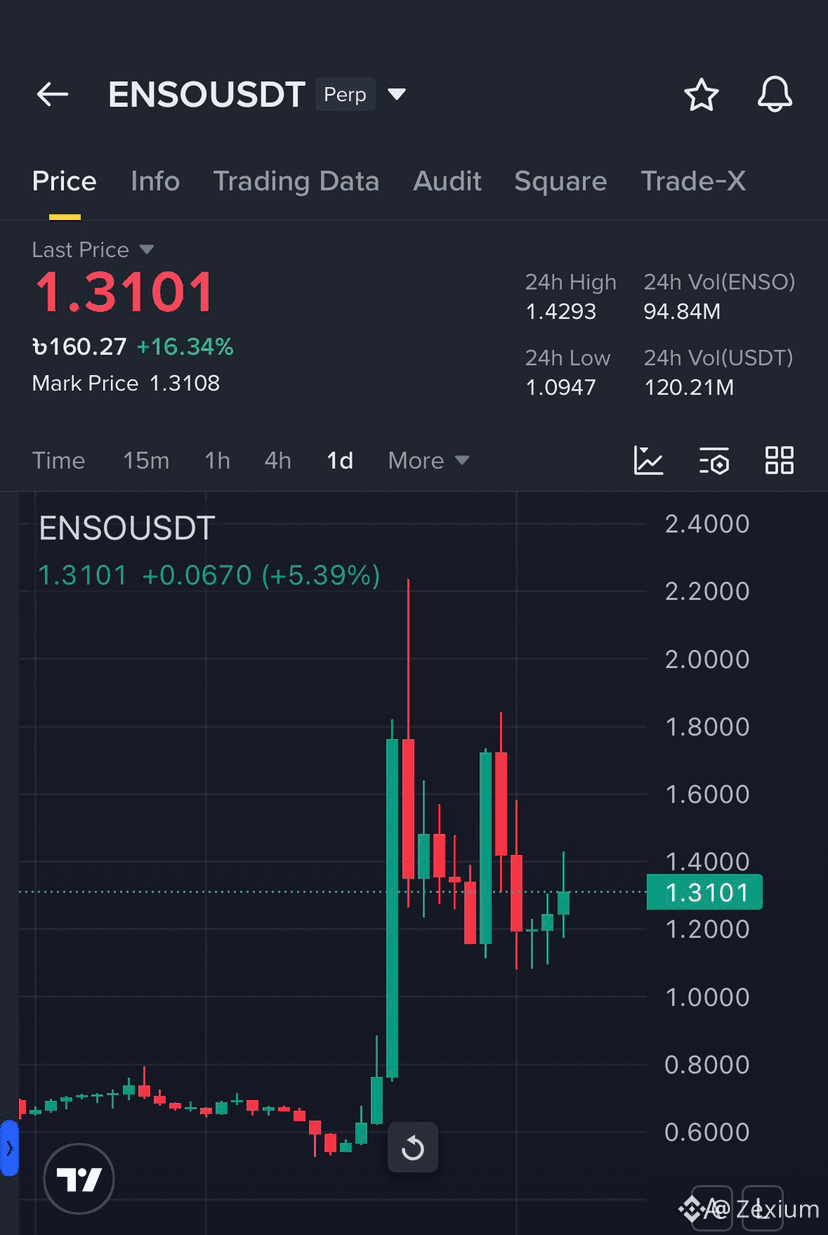
One of my friends made $13K from $ENSO
Should I buy now or should I wait for dip ?
One of my friends made $13K from $ENSO
Should I buy now or should I wait for dip ?
Should I buy now or should I wait for dip ?
533
1
1
2
888
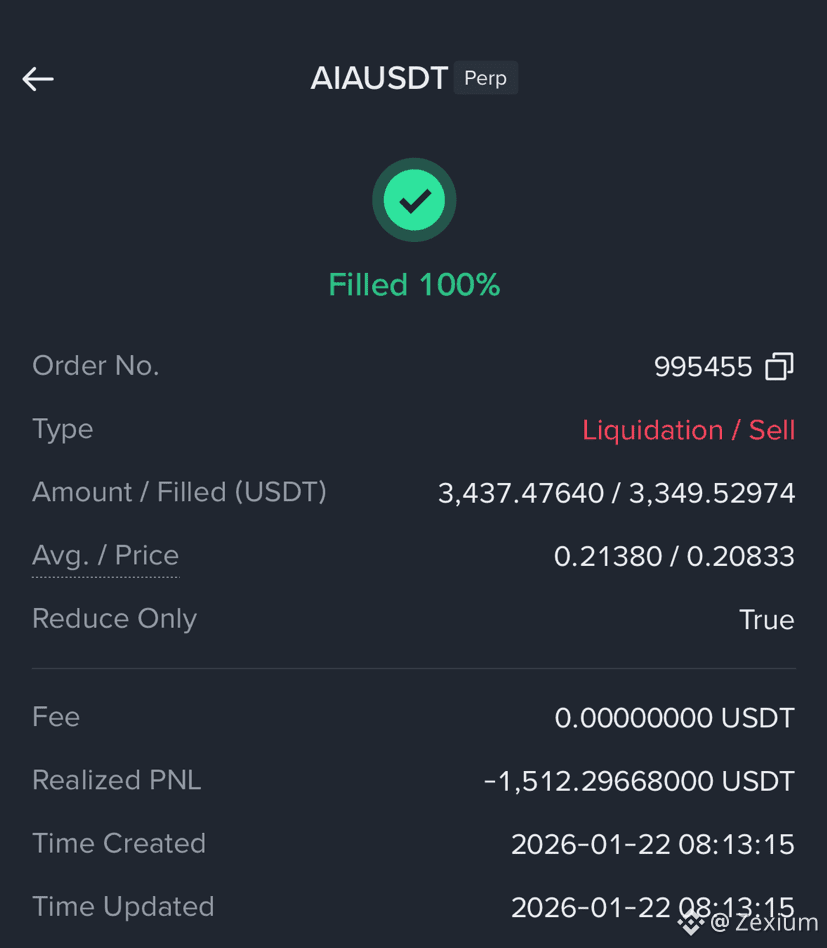
POV: you bought the top and got liquidated again 🤣
One of my friends bought the top on $AIA and got liquidated 😂
POV: you bought the top and got liquidated again 🤣
One of my friends bought the top on $AIA and got liquidated 😂
One of my friends bought the top on $AIA and got liquidated 😂

2
1
762
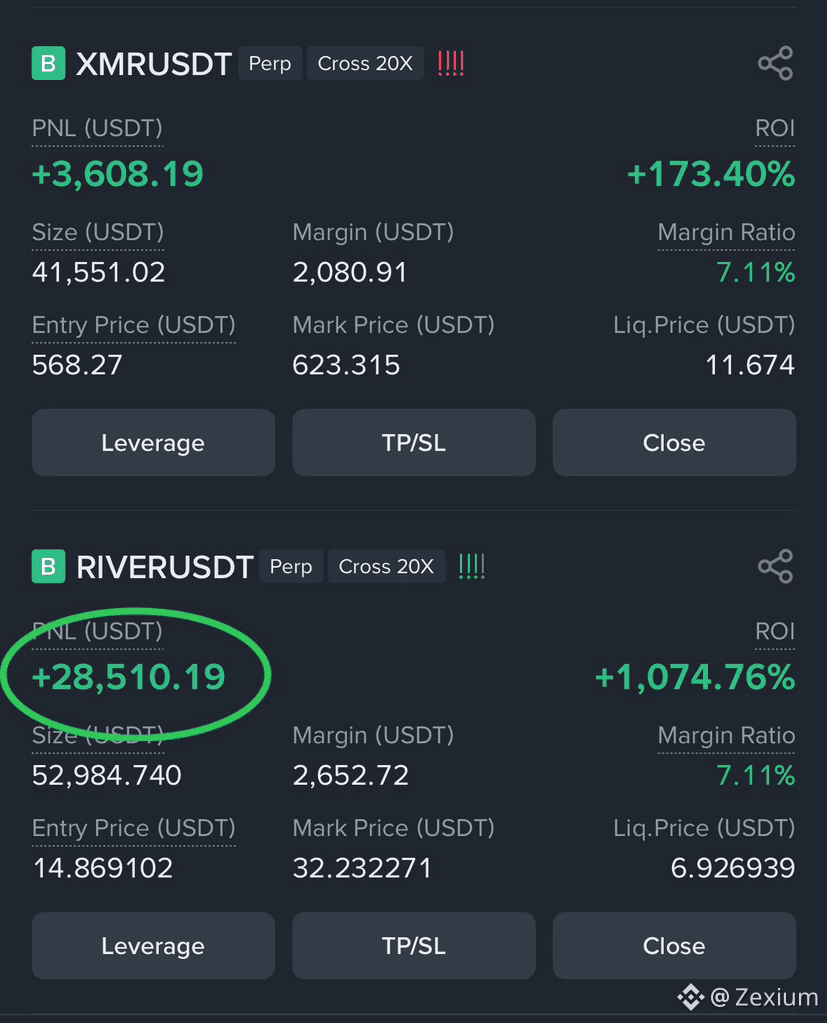
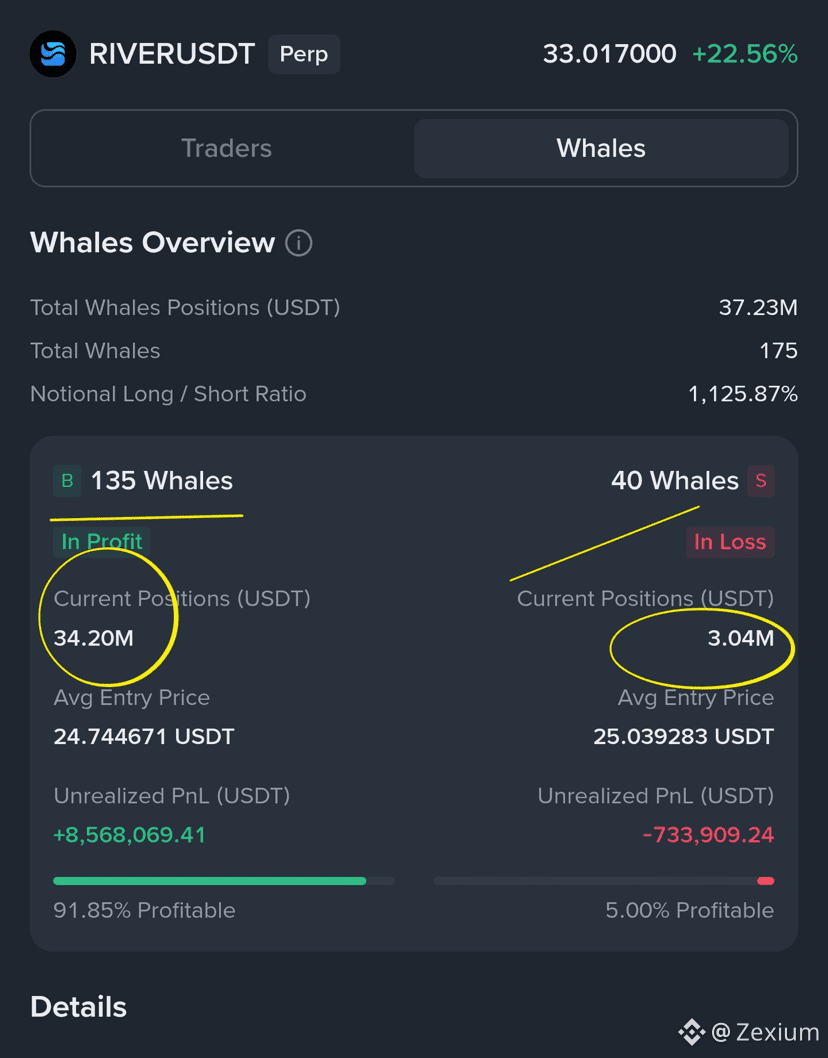
All $RIVER holders are future millionaires 🚨
Don’t stop buying $RIVER ✅
All $RIVER holders are future millionaires 🚨
Don’t stop buying $RIVER ✅
Don’t stop buying $RIVER ✅
2
2
2
235
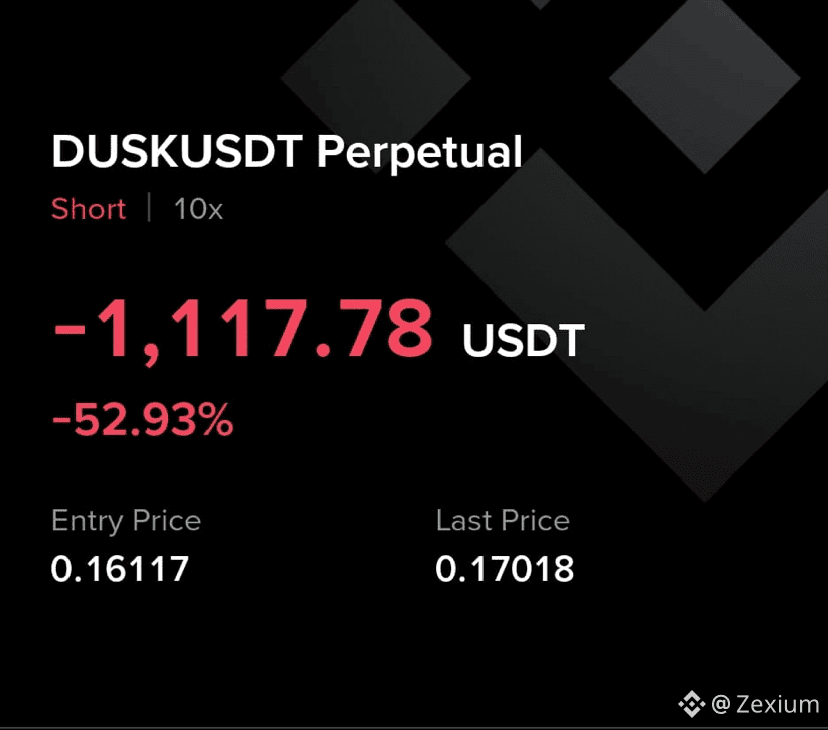
Damn $DUSK 😡
This pump is insane 😤
How much did you lose on $DUSK ?
Damn $DUSK 😡
This pump is insane 😤
How much did you lose on $DUSK ?
This pump is insane 😤
How much did you lose on $DUSK ?

234
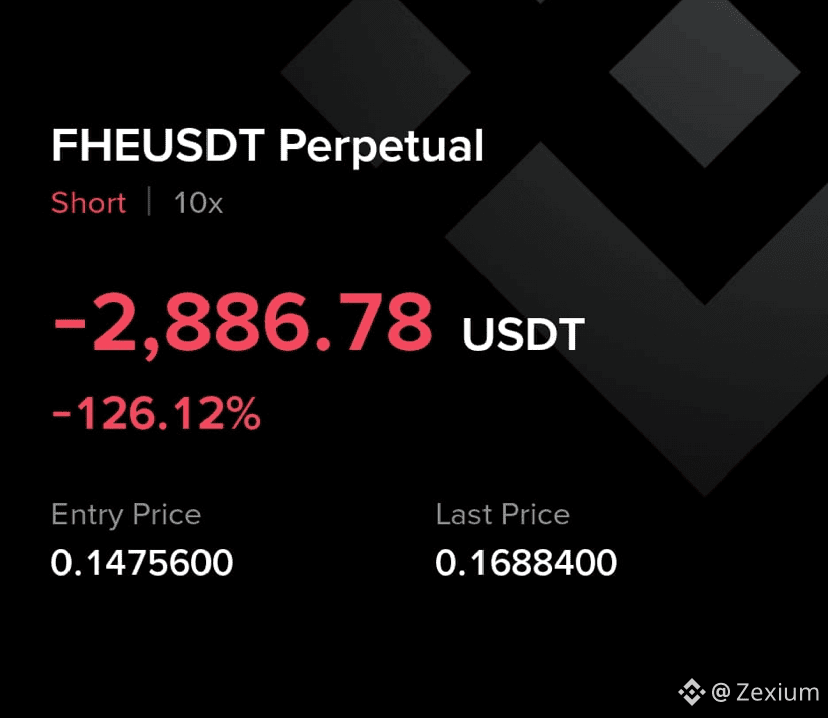
Down $2,886 on $FHE , but I’m sure it’s going to dump again 😤
Down $2,886 on $FHE , but I’m sure it’s going to dump again 😤

405
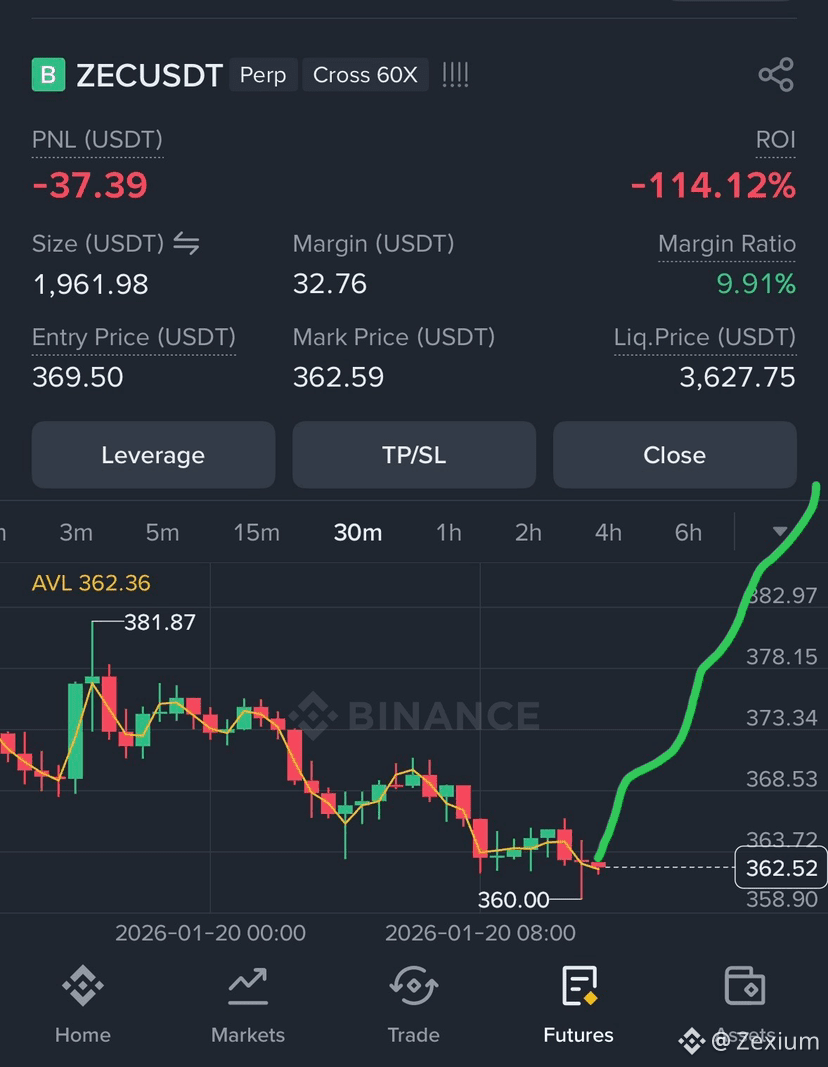
Buying $ZEC
I know i’m soo smart 😎😎
I will be millionaire soon 🥳
Buying $ZEC
I know i’m soo smart 😎😎
I will be millionaire soon 🥳
I know i’m soo smart 😎😎
I will be millionaire soon 🥳
1
146
Article
LIGHTUSDT Market Structure Report – Post-Liquidity Regime & Directional RiskMarket Snapshot
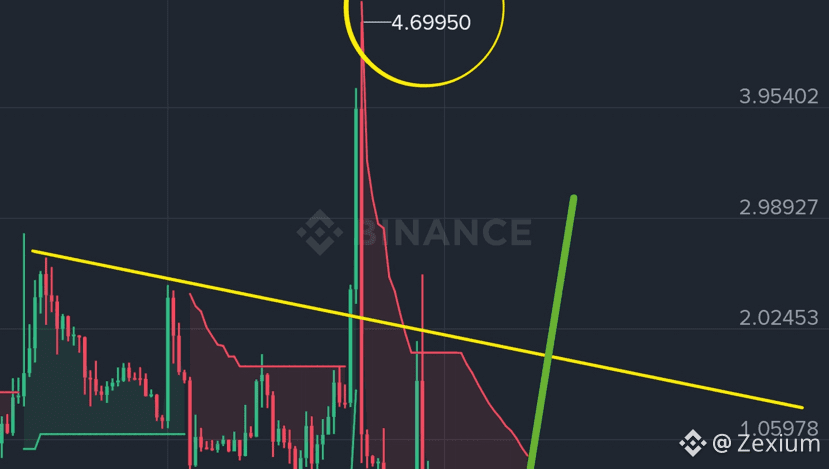
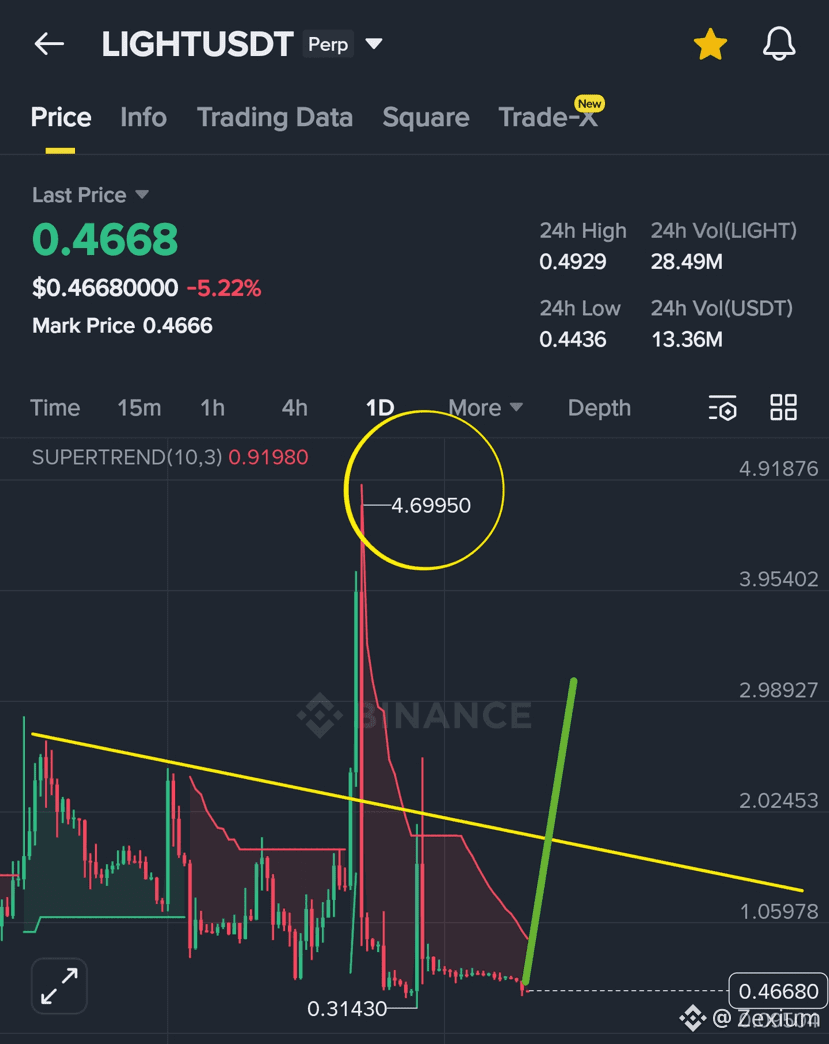
$LIGHT/USDT is currently trading around 0.46, after undergoing a long corrective process that followed an extreme historical surge into the 4.69 area. That sharp vertical move, visible on higher timeframes, displays the traits of a liquidity-driven expansion rather than genuine price discovery. Spikes of this nature are often linked to stop-runs, forced liquidations, or thin-liquidity distortions, and are typically followed by extended consolidation or compression.
Since that event, $LIGHT has maintained a broad bearish framework, consistently respecting a descending trendline that continues to function as dynamic resistance.
Technical Structure
On the daily chart, price is currently:
Holding above a major historical demand band between 0.31 – 0.44
Moving laterally after a prolonged decline, indicating that selling pressure is fading
Trading far below the spike peak, reinforcing that the move to 4.69 was unsustainable and largely liquidity-based
The market has now shifted through a classic sequence:
impulse → breakdown → basing, which frequently follows manipulated or liquidity-driven events.
Trend & Indicator Environment
The Supertrend indicator remains positioned above price, confirming that the dominant macro trend is still bearish. However, the gap between price and trend resistance has tightened, while volatility has compressed sharply — a condition that often precedes a significant expansion phase.
Volume has continued to contract, aligning with behavior typically seen when distribution tapers off and absorption begins. In professional market-structure models, this backdrop often appears before either:
A trendline recovery and reversal, or
A final liquidity sweep prior to reversal.
Key Technical Zones
Primary resistance: Descending trendline / former breakdown area
Near-term support: 0.44
Structural base: 0.31
Bullish confirmation: A strong daily close above the descending trendline accompanied by expanding volume
Bearish invalidation: A loss of the 0.31 support, which would break the current basing structure
Strategic Outlook
LIGHTUSDT is no longer in a momentum expansion stage. It is now in a developed compression environment following a confirmed liquidity event. Such conditions generally reward structured planning and patience, not reactive trading.
The market is approaching a decision zone:
Either a trendline reclaim leading to a structural shift,
Or a final capitulation move to complete the accumulation process.
Professional participants will be monitoring volatility expansion, volume return, and clean structural breaks to validate the next directional phase.
⚠️ This analysis is for educational purposes only and does not constitute financial advice.
$LIGHT
LIGHTUSDT Market Structure Report – Post-Liquidity Regime & Directional Risk
Market Snapshot
$LIGHT /USDT is currently trading around 0.46, after undergoing a long corrective process that followed an extreme historical surge into the 4.69 area. That sharp vertical move, visible on higher timeframes, displays the traits of a liquidity-driven expansion rather than genuine price discovery. Spikes of this nature are often linked to stop-runs, forced liquidations, or thin-liquidity distortions, and are typically followed by extended consolidation or compression.
Since that event, $LIGHT has maintained a broad bearish framework, consistently respecting a descending trendline that continues to function as dynamic resistance.
Technical Structure
On the daily chart, price is currently:
Holding above a major historical demand band between 0.31 – 0.44
Moving laterally after a prolonged decline, indicating that selling pressure is fading
Trading far below the spike peak, reinforcing that the move to 4.69 was unsustainable and largely liquidity-based
The market has now shifted through a classic sequence:
impulse → breakdown → basing, which frequently follows manipulated or liquidity-driven events.
Trend & Indicator Environment
The Supertrend indicator remains positioned above price, confirming that the dominant macro trend is still bearish. However, the gap between price and trend resistance has tightened, while volatility has compressed sharply — a condition that often precedes a significant expansion phase.
Volume has continued to contract, aligning with behavior typically seen when distribution tapers off and absorption begins. In professional market-structure models, this backdrop often appears before either:
A trendline recovery and reversal, or
A final liquidity sweep prior to reversal.
Key Technical Zones
Primary resistance: Descending trendline / former breakdown area
Near-term support: 0.44
Structural base: 0.31
Bullish confirmation: A strong daily close above the descending trendline accompanied by expanding volume
Bearish invalidation: A loss of the 0.31 support, which would break the current basing structure
Strategic Outlook
LIGHTUSDT is no longer in a momentum expansion stage. It is now in a developed compression environment following a confirmed liquidity event. Such conditions generally reward structured planning and patience, not reactive trading.
The market is approaching a decision zone:
Either a trendline reclaim leading to a structural shift,
Or a final capitulation move to complete the accumulation process.
Professional participants will be monitoring volatility expansion, volume return, and clean structural breaks to validate the next directional phase.
⚠️ This analysis is for educational purposes only and does not constitute financial advice.
$LIGHT
$LIGHT /USDT is currently trading around 0.46, after undergoing a long corrective process that followed an extreme historical surge into the 4.69 area. That sharp vertical move, visible on higher timeframes, displays the traits of a liquidity-driven expansion rather than genuine price discovery. Spikes of this nature are often linked to stop-runs, forced liquidations, or thin-liquidity distortions, and are typically followed by extended consolidation or compression.
Since that event, $LIGHT has maintained a broad bearish framework, consistently respecting a descending trendline that continues to function as dynamic resistance.
Technical Structure
On the daily chart, price is currently:
Holding above a major historical demand band between 0.31 – 0.44
Moving laterally after a prolonged decline, indicating that selling pressure is fading
Trading far below the spike peak, reinforcing that the move to 4.69 was unsustainable and largely liquidity-based
The market has now shifted through a classic sequence:
impulse → breakdown → basing, which frequently follows manipulated or liquidity-driven events.
Trend & Indicator Environment
The Supertrend indicator remains positioned above price, confirming that the dominant macro trend is still bearish. However, the gap between price and trend resistance has tightened, while volatility has compressed sharply — a condition that often precedes a significant expansion phase.
Volume has continued to contract, aligning with behavior typically seen when distribution tapers off and absorption begins. In professional market-structure models, this backdrop often appears before either:
A trendline recovery and reversal, or
A final liquidity sweep prior to reversal.
Key Technical Zones
Primary resistance: Descending trendline / former breakdown area
Near-term support: 0.44
Structural base: 0.31
Bullish confirmation: A strong daily close above the descending trendline accompanied by expanding volume
Bearish invalidation: A loss of the 0.31 support, which would break the current basing structure
Strategic Outlook
LIGHTUSDT is no longer in a momentum expansion stage. It is now in a developed compression environment following a confirmed liquidity event. Such conditions generally reward structured planning and patience, not reactive trading.
The market is approaching a decision zone:
Either a trendline reclaim leading to a structural shift,
Or a final capitulation move to complete the accumulation process.
Professional participants will be monitoring volatility expansion, volume return, and clean structural breaks to validate the next directional phase.
⚠️ This analysis is for educational purposes only and does not constitute financial advice.
$LIGHT
52
$LIGHT big pump is coming soon🚨
Keep Long $LIGHT
$LIGHT big pump is coming soon🚨
Keep Long $LIGHT
Keep Long $LIGHT
2
2
1
207
Article
🌊 RIVER ($RIVER) Market Research Report Structure, Distribution, Whale Behavior & Contract Risk1️⃣ Asset Summary: River ($RIVER)
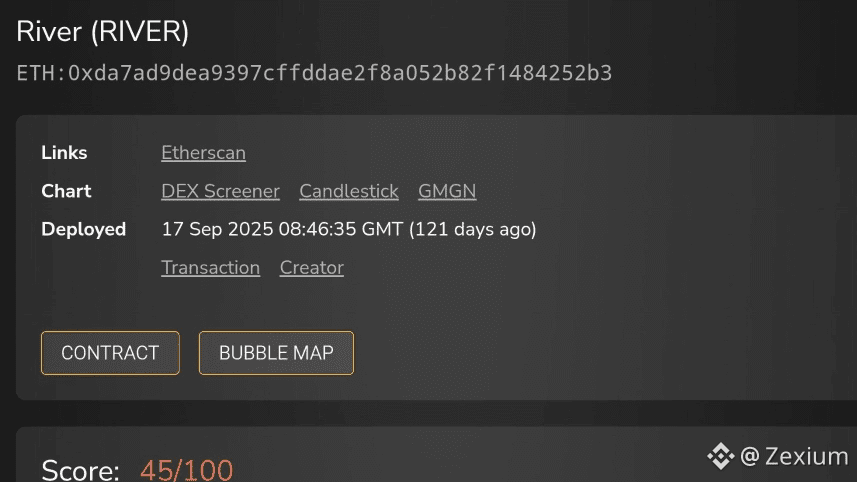
River ($RIVER) is an Ethereum-based token launched on 17 September 2025. Current on-chain metrics and derivatives signals suggest that RIVER has moved into a period of heightened speculative activity, shown by growing whale accumulation, upward price momentum, and a relatively concentrated holder distribution.
Key data highlights:
• Blockchain: Ethereum
• Token lifespan: ~121 days
• Data sources used: Bubble Map, Etherscan, DEX Screener, GMGN
• Audit rating: 45 / 100
2️⃣ Holder Composition & Supply Breakdown
On-chain wallet data shows that RIVER’s token supply is extremely concentrated.
Total supply:
57,838,999.73 RIVER
Number of holders:
356 wallets
Major concentration findings:
The top 100 wallets control nearly 100% of the circulating supplyThe top 4 wallets alone hold over ~70% of all tokensLargest wallet balances:18,000,000 RIVER (~31.1%)12,000,000 RIVER (~20.7%)12,000,000 RIVER (~20.7%)10,000,000 RIVER (~17.2%)👉 These figures indicate that RIVER is heavily centralized from a supply perspective.
As a result, price action is structurally dependent on the behavior of only a handful of wallets.
3️⃣ Wallet Network & Bubble Map Analysis
Bubble map visuals highlight:
Multiple interlinked wallet groupsRepeated micro-distribution behaviorsSeveral connected transaction trailsThis kind of wallet structure is commonly associated with:Coordinated wallet controlLiquidity management and routingInternal token allocation networks
👉 These formations do not suggest misconduct, but they do point to a non-organic distribution pattern.
In setups like this, price movement is usually driven more by liquidity dynamics than by true market demand.
4️⃣ Derivatives Activity & Whale Exposure
Perpetual futures metrics on RIVERUSDT point to a clear dominance from large players.
Current price:
$29.90 (+9.20%)
Whale positioning overview:
Total whale capital: ~$32.39MLong whales: 126 wallets — currently profitableShort whales: 52 wallets — currently underwater
Exposure split:
Long-side exposure: ~$29.30M
Short-side exposure: ~$3.10M
Average entry prices:
Longs: $24.21Shorts: $25.16
Unrealized performance:
Long PnL: +$5.57M
Short PnL: –$490K
👉 These figures reflect strong whale-controlled long bias, with the recent price increase being heavily supported by leveraged positions.
However, this structure also means:
⚠️ The market has become highly sensitive to liquidations.
Large price swings may increasingly result from forced position closures rather than natural trend strength.
5️⃣ Contract Review & Safety Signals
Smart contract analysis shows a mixed risk profile.
Positive indicators:
✅ Source code is verified
✅ Token is currently transferable/sellable
✅ No honeypot behavior detected
✅ Deployer and owner wallets hold 0% of the supply
⚠️ Risk Indicators
⚠️ Ownership has not been renounced
⚠️ The contract still includes modifiable control functions
⚠️ Audit rating remains 45 / 100
This implies the smart contract may still technically permit changes such as:
Adjustment of fee parameters
Limiting or altering certain functions
Updates to internal contract logic
👉 From a governance and control standpoint, this places RIVER in a medium-to-high operational risk bracket.
6️⃣ Market Structure Assessment
When all data points are viewed together:
Token supply is heavily concentrated
Wallet behavior reflects coordinated network patterns
Whale accounts control the majority of leveraged positions
Contract control remains active and centralized
This produces a market setup where:
• Price behavior is wallet-influenced
• Volatility is trigger-driven
• Risk is embedded in structure, not only in code
👉 Markets with this configuration often move in distinct, aggressive cycles — rapid expansion, tight consolidation, and sudden repricing.
They typically reward:
Strong liquidity awareness
Precise execution and timing
Disciplined risk management
While penalizing:
Emotion-based entries
Excessive leverage
Slow or delayed responses
7️⃣ Strategic Risk Perspective
$RIVER currently operates within a high-control, high-volatility market framework.
Primary strengths:
Heavy whale involvement
Elevated speculative activity
Strong participation in derivatives markets
Primary risk factors:
Severe concentration of token holders
Contract ownership has not been relinquished
Liquidity remains centrally influenced
Increased vulnerability to liquidation events
👉 This is not a conventional supply-and-demand-driven asset.
👉 It functions instead as a liquidity-managed trading ecosystem.
8️⃣ Strategic Summary
RIVER fits the profile of a structure-dominated speculative instrument, where price movement is driven less by usage or adoption and more by capital flows, wallet influence, and leverage dynamics.
In markets like this, sustainability is not determined by chart patterns alone —
it is shaped by who holds the supply, who commands leverage, and when incentive structures change.
#RIVER #zexium
🌊 RIVER ($RIVER) Market Research Report Structure, Distribution, Whale Behavior & Contract Risk
1️⃣ Asset Summary: River ($RIVER)
River ($RIVER) is an Ethereum-based token launched on 17 September 2025. Current on-chain metrics and derivatives signals suggest that RIVER has moved into a period of heightened speculative activity, shown by growing whale accumulation, upward price momentum, and a relatively concentrated holder distribution.
Key data highlights:
• Blockchain: Ethereum
• Token lifespan: ~121 days
• Data sources used: Bubble Map, Etherscan, DEX Screener, GMGN
• Audit rating: 45 / 100
2️⃣ Holder Composition & Supply Breakdown
On-chain wallet data shows that RIVER’s token supply is extremely concentrated.
Total supply:
57,838,999.73 RIVER
Number of holders:
356 wallets
Major concentration findings:
The top 100 wallets control nearly 100% of the circulating supplyThe top 4 wallets alone hold over ~70% of all tokensLargest wallet balances:18,000,000 RIVER (~31.1%)12,000,000 RIVER (~20.7%)12,000,000 RIVER (~20.7%)10,000,000 RIVER (~17.2%)👉 These figures indicate that RIVER is heavily centralized from a supply perspective.
As a result, price action is structurally dependent on the behavior of only a handful of wallets.
3️⃣ Wallet Network & Bubble Map Analysis
Bubble map visuals highlight:
Multiple interlinked wallet groupsRepeated micro-distribution behaviorsSeveral connected transaction trailsThis kind of wallet structure is commonly associated with:Coordinated wallet controlLiquidity management and routingInternal token allocation networks
👉 These formations do not suggest misconduct, but they do point to a non-organic distribution pattern.
In setups like this, price movement is usually driven more by liquidity dynamics than by true market demand.
4️⃣ Derivatives Activity & Whale Exposure
Perpetual futures metrics on RIVERUSDT point to a clear dominance from large players.
Current price:
$29.90 (+9.20%)
Whale positioning overview:
Total whale capital: ~$32.39MLong whales: 126 wallets — currently profitableShort whales: 52 wallets — currently underwater
Exposure split:
Long-side exposure: ~$29.30M
Short-side exposure: ~$3.10M
Average entry prices:
Longs: $24.21Shorts: $25.16
Unrealized performance:
Long PnL: +$5.57M
Short PnL: –$490K
👉 These figures reflect strong whale-controlled long bias, with the recent price increase being heavily supported by leveraged positions.
However, this structure also means:
⚠️ The market has become highly sensitive to liquidations.
Large price swings may increasingly result from forced position closures rather than natural trend strength.
5️⃣ Contract Review & Safety Signals
Smart contract analysis shows a mixed risk profile.
Positive indicators:
✅ Source code is verified
✅ Token is currently transferable/sellable
✅ No honeypot behavior detected
✅ Deployer and owner wallets hold 0% of the supply
⚠️ Risk Indicators
⚠️ Ownership has not been renounced
⚠️ The contract still includes modifiable control functions
⚠️ Audit rating remains 45 / 100
This implies the smart contract may still technically permit changes such as:
Adjustment of fee parameters
Limiting or altering certain functions
Updates to internal contract logic
👉 From a governance and control standpoint, this places RIVER in a medium-to-high operational risk bracket.
6️⃣ Market Structure Assessment
When all data points are viewed together:
Token supply is heavily concentrated
Wallet behavior reflects coordinated network patterns
Whale accounts control the majority of leveraged positions
Contract control remains active and centralized
This produces a market setup where:
• Price behavior is wallet-influenced
• Volatility is trigger-driven
• Risk is embedded in structure, not only in code
👉 Markets with this configuration often move in distinct, aggressive cycles — rapid expansion, tight consolidation, and sudden repricing.
They typically reward:
Strong liquidity awareness
Precise execution and timing
Disciplined risk management
While penalizing:
Emotion-based entries
Excessive leverage
Slow or delayed responses
7️⃣ Strategic Risk Perspective
$RIVER currently operates within a high-control, high-volatility market framework.
Primary strengths:
Heavy whale involvement
Elevated speculative activity
Strong participation in derivatives markets
Primary risk factors:
Severe concentration of token holders
Contract ownership has not been relinquished
Liquidity remains centrally influenced
Increased vulnerability to liquidation events
👉 This is not a conventional supply-and-demand-driven asset.
👉 It functions instead as a liquidity-managed trading ecosystem.
8️⃣ Strategic Summary
RIVER fits the profile of a structure-dominated speculative instrument, where price movement is driven less by usage or adoption and more by capital flows, wallet influence, and leverage dynamics.
In markets like this, sustainability is not determined by chart patterns alone —
it is shaped by who holds the supply, who commands leverage, and when incentive structures change.
#RIVER #zexium
River ($RIVER) is an Ethereum-based token launched on 17 September 2025. Current on-chain metrics and derivatives signals suggest that RIVER has moved into a period of heightened speculative activity, shown by growing whale accumulation, upward price momentum, and a relatively concentrated holder distribution.
Key data highlights:
• Blockchain: Ethereum
• Token lifespan: ~121 days
• Data sources used: Bubble Map, Etherscan, DEX Screener, GMGN
• Audit rating: 45 / 100
2️⃣ Holder Composition & Supply Breakdown
On-chain wallet data shows that RIVER’s token supply is extremely concentrated.
Total supply:
57,838,999.73 RIVER
Number of holders:
356 wallets
Major concentration findings:
The top 100 wallets control nearly 100% of the circulating supplyThe top 4 wallets alone hold over ~70% of all tokensLargest wallet balances:18,000,000 RIVER (~31.1%)12,000,000 RIVER (~20.7%)12,000,000 RIVER (~20.7%)10,000,000 RIVER (~17.2%)👉 These figures indicate that RIVER is heavily centralized from a supply perspective.
As a result, price action is structurally dependent on the behavior of only a handful of wallets.
3️⃣ Wallet Network & Bubble Map Analysis
Bubble map visuals highlight:
Multiple interlinked wallet groupsRepeated micro-distribution behaviorsSeveral connected transaction trailsThis kind of wallet structure is commonly associated with:Coordinated wallet controlLiquidity management and routingInternal token allocation networks
👉 These formations do not suggest misconduct, but they do point to a non-organic distribution pattern.
In setups like this, price movement is usually driven more by liquidity dynamics than by true market demand.
4️⃣ Derivatives Activity & Whale Exposure
Perpetual futures metrics on RIVERUSDT point to a clear dominance from large players.
Current price:
$29.90 (+9.20%)
Whale positioning overview:
Total whale capital: ~$32.39MLong whales: 126 wallets — currently profitableShort whales: 52 wallets — currently underwater
Exposure split:
Long-side exposure: ~$29.30M
Short-side exposure: ~$3.10M
Average entry prices:
Longs: $24.21Shorts: $25.16
Unrealized performance:
Long PnL: +$5.57M
Short PnL: –$490K
👉 These figures reflect strong whale-controlled long bias, with the recent price increase being heavily supported by leveraged positions.
However, this structure also means:
⚠️ The market has become highly sensitive to liquidations.
Large price swings may increasingly result from forced position closures rather than natural trend strength.
5️⃣ Contract Review & Safety Signals
Smart contract analysis shows a mixed risk profile.
Positive indicators:
✅ Source code is verified
✅ Token is currently transferable/sellable
✅ No honeypot behavior detected
✅ Deployer and owner wallets hold 0% of the supply
⚠️ Risk Indicators
⚠️ Ownership has not been renounced
⚠️ The contract still includes modifiable control functions
⚠️ Audit rating remains 45 / 100
This implies the smart contract may still technically permit changes such as:
Adjustment of fee parameters
Limiting or altering certain functions
Updates to internal contract logic
👉 From a governance and control standpoint, this places RIVER in a medium-to-high operational risk bracket.
6️⃣ Market Structure Assessment
When all data points are viewed together:
Token supply is heavily concentrated
Wallet behavior reflects coordinated network patterns
Whale accounts control the majority of leveraged positions
Contract control remains active and centralized
This produces a market setup where:
• Price behavior is wallet-influenced
• Volatility is trigger-driven
• Risk is embedded in structure, not only in code
👉 Markets with this configuration often move in distinct, aggressive cycles — rapid expansion, tight consolidation, and sudden repricing.
They typically reward:
Strong liquidity awareness
Precise execution and timing
Disciplined risk management
While penalizing:
Emotion-based entries
Excessive leverage
Slow or delayed responses
7️⃣ Strategic Risk Perspective
$RIVER currently operates within a high-control, high-volatility market framework.
Primary strengths:
Heavy whale involvement
Elevated speculative activity
Strong participation in derivatives markets
Primary risk factors:
Severe concentration of token holders
Contract ownership has not been relinquished
Liquidity remains centrally influenced
Increased vulnerability to liquidation events
👉 This is not a conventional supply-and-demand-driven asset.
👉 It functions instead as a liquidity-managed trading ecosystem.
8️⃣ Strategic Summary
RIVER fits the profile of a structure-dominated speculative instrument, where price movement is driven less by usage or adoption and more by capital flows, wallet influence, and leverage dynamics.
In markets like this, sustainability is not determined by chart patterns alone —
it is shaped by who holds the supply, who commands leverage, and when incentive structures change.
#RIVER #zexium
33
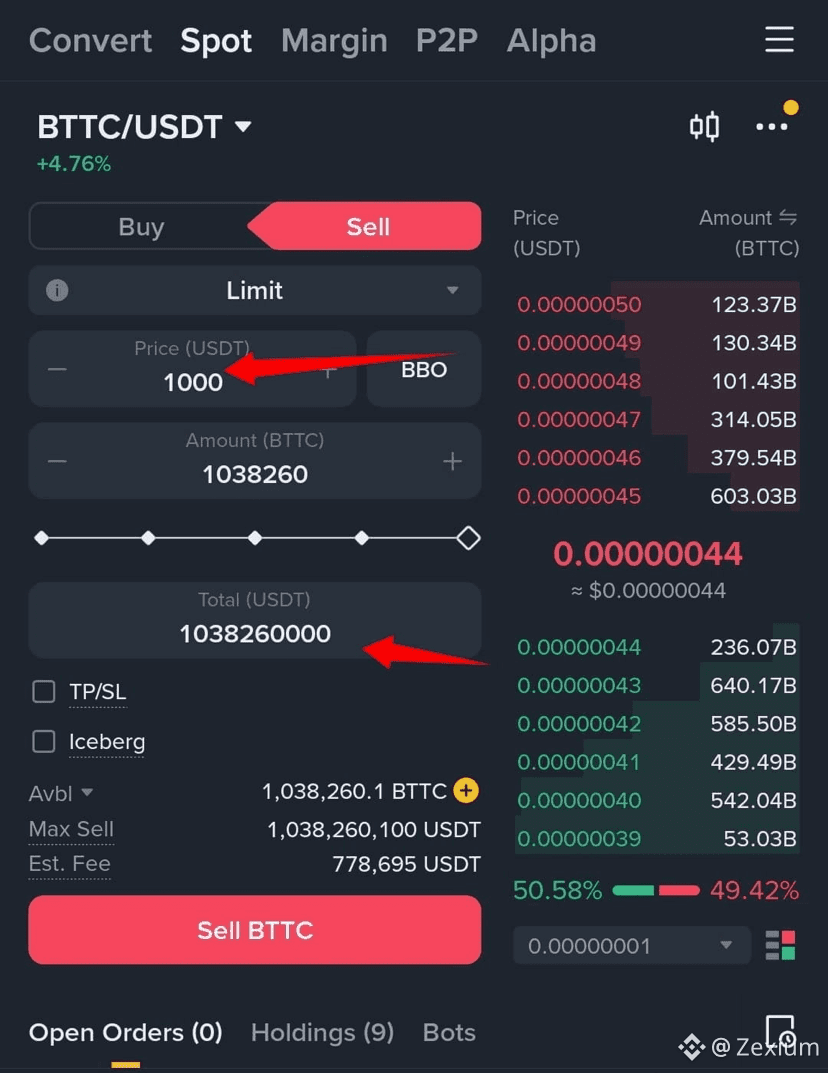
One move. $BTTC to $1,000… and I’m a billionaire 💪🤑
One move. $BTTC to $1,000… and I’m a billionaire 💪🤑
1
148
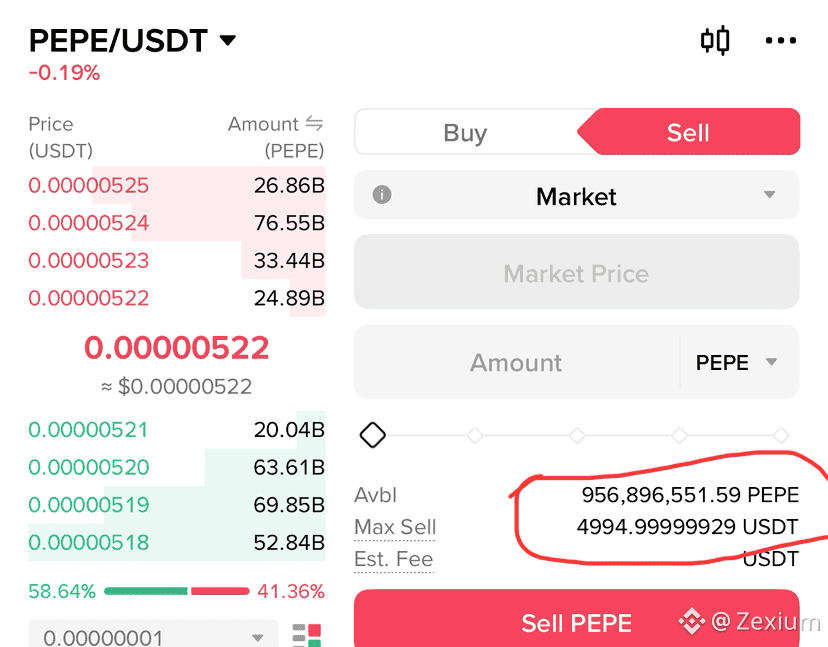
I’m holding 950M $PEPE .
If $PEPE hits $1.10, I’ll be a billionaire. 🚀
I’m holding 950M $PEPE .
If $PEPE hits $1.10, I’ll be a billionaire. 🚀
If $PEPE hits $1.10, I’ll be a billionaire. 🚀

138
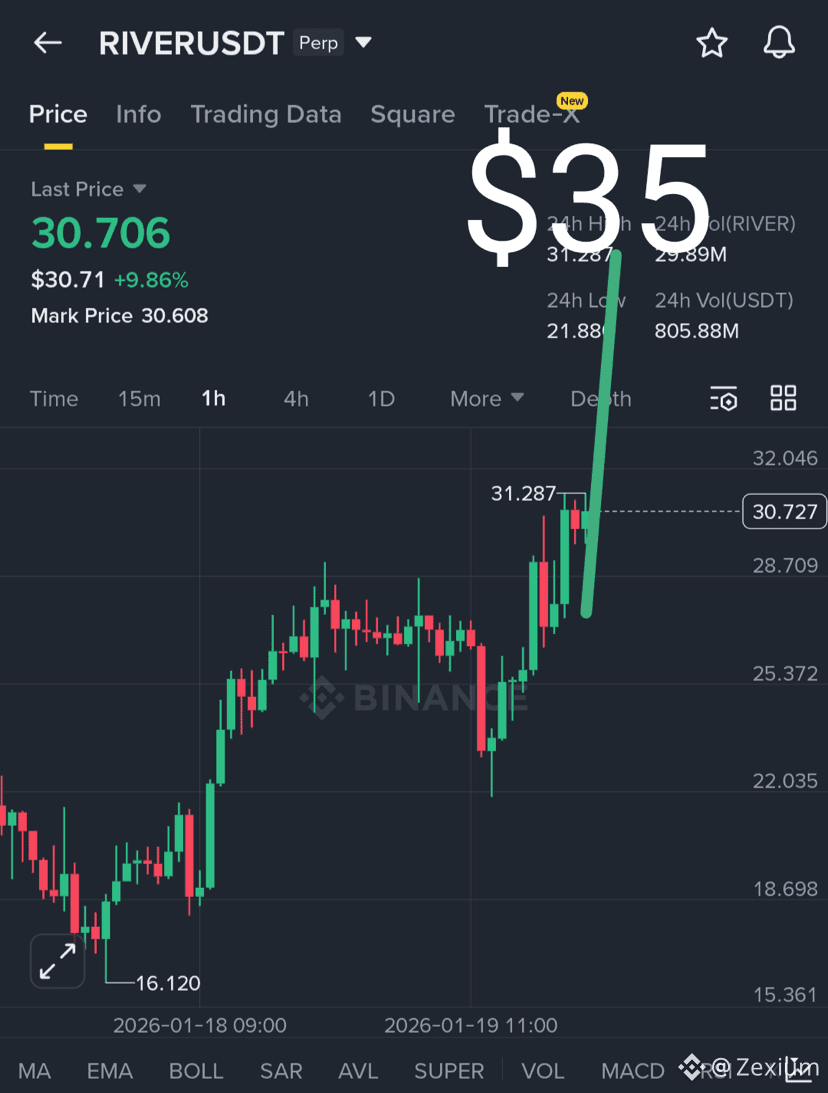
Let me know what you think — do you believe $RIVER will reach $35? I’m waiting for $35.
Let me know what you think — do you believe $RIVER will reach $35? I’m waiting for $35.
84
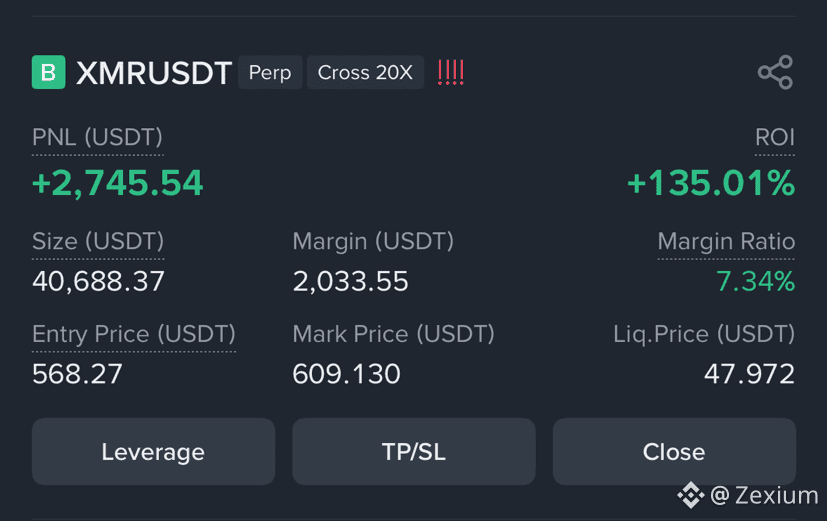
I gifted my neighbor’s wife an iPhone 17 Pro Max from my $XMR profits 🚀
I gifted my neighbor’s wife an iPhone 17 Pro Max from my $XMR profits 🚀

1
2
288
Log in to explore more content
Join global crypto users on Binance Square
⚡️ Get latest and useful information about crypto.
💬 Trusted by the world’s largest crypto exchange.
👍 Discover real insights from verified creators.
Email / Phone number