

CryptoJargon69
1.9k Posts

CryptoJargon69
 Square Verified
Report
Block User
6 Following
1.6K+ Followers
652 Liked
Posts
All
Videos
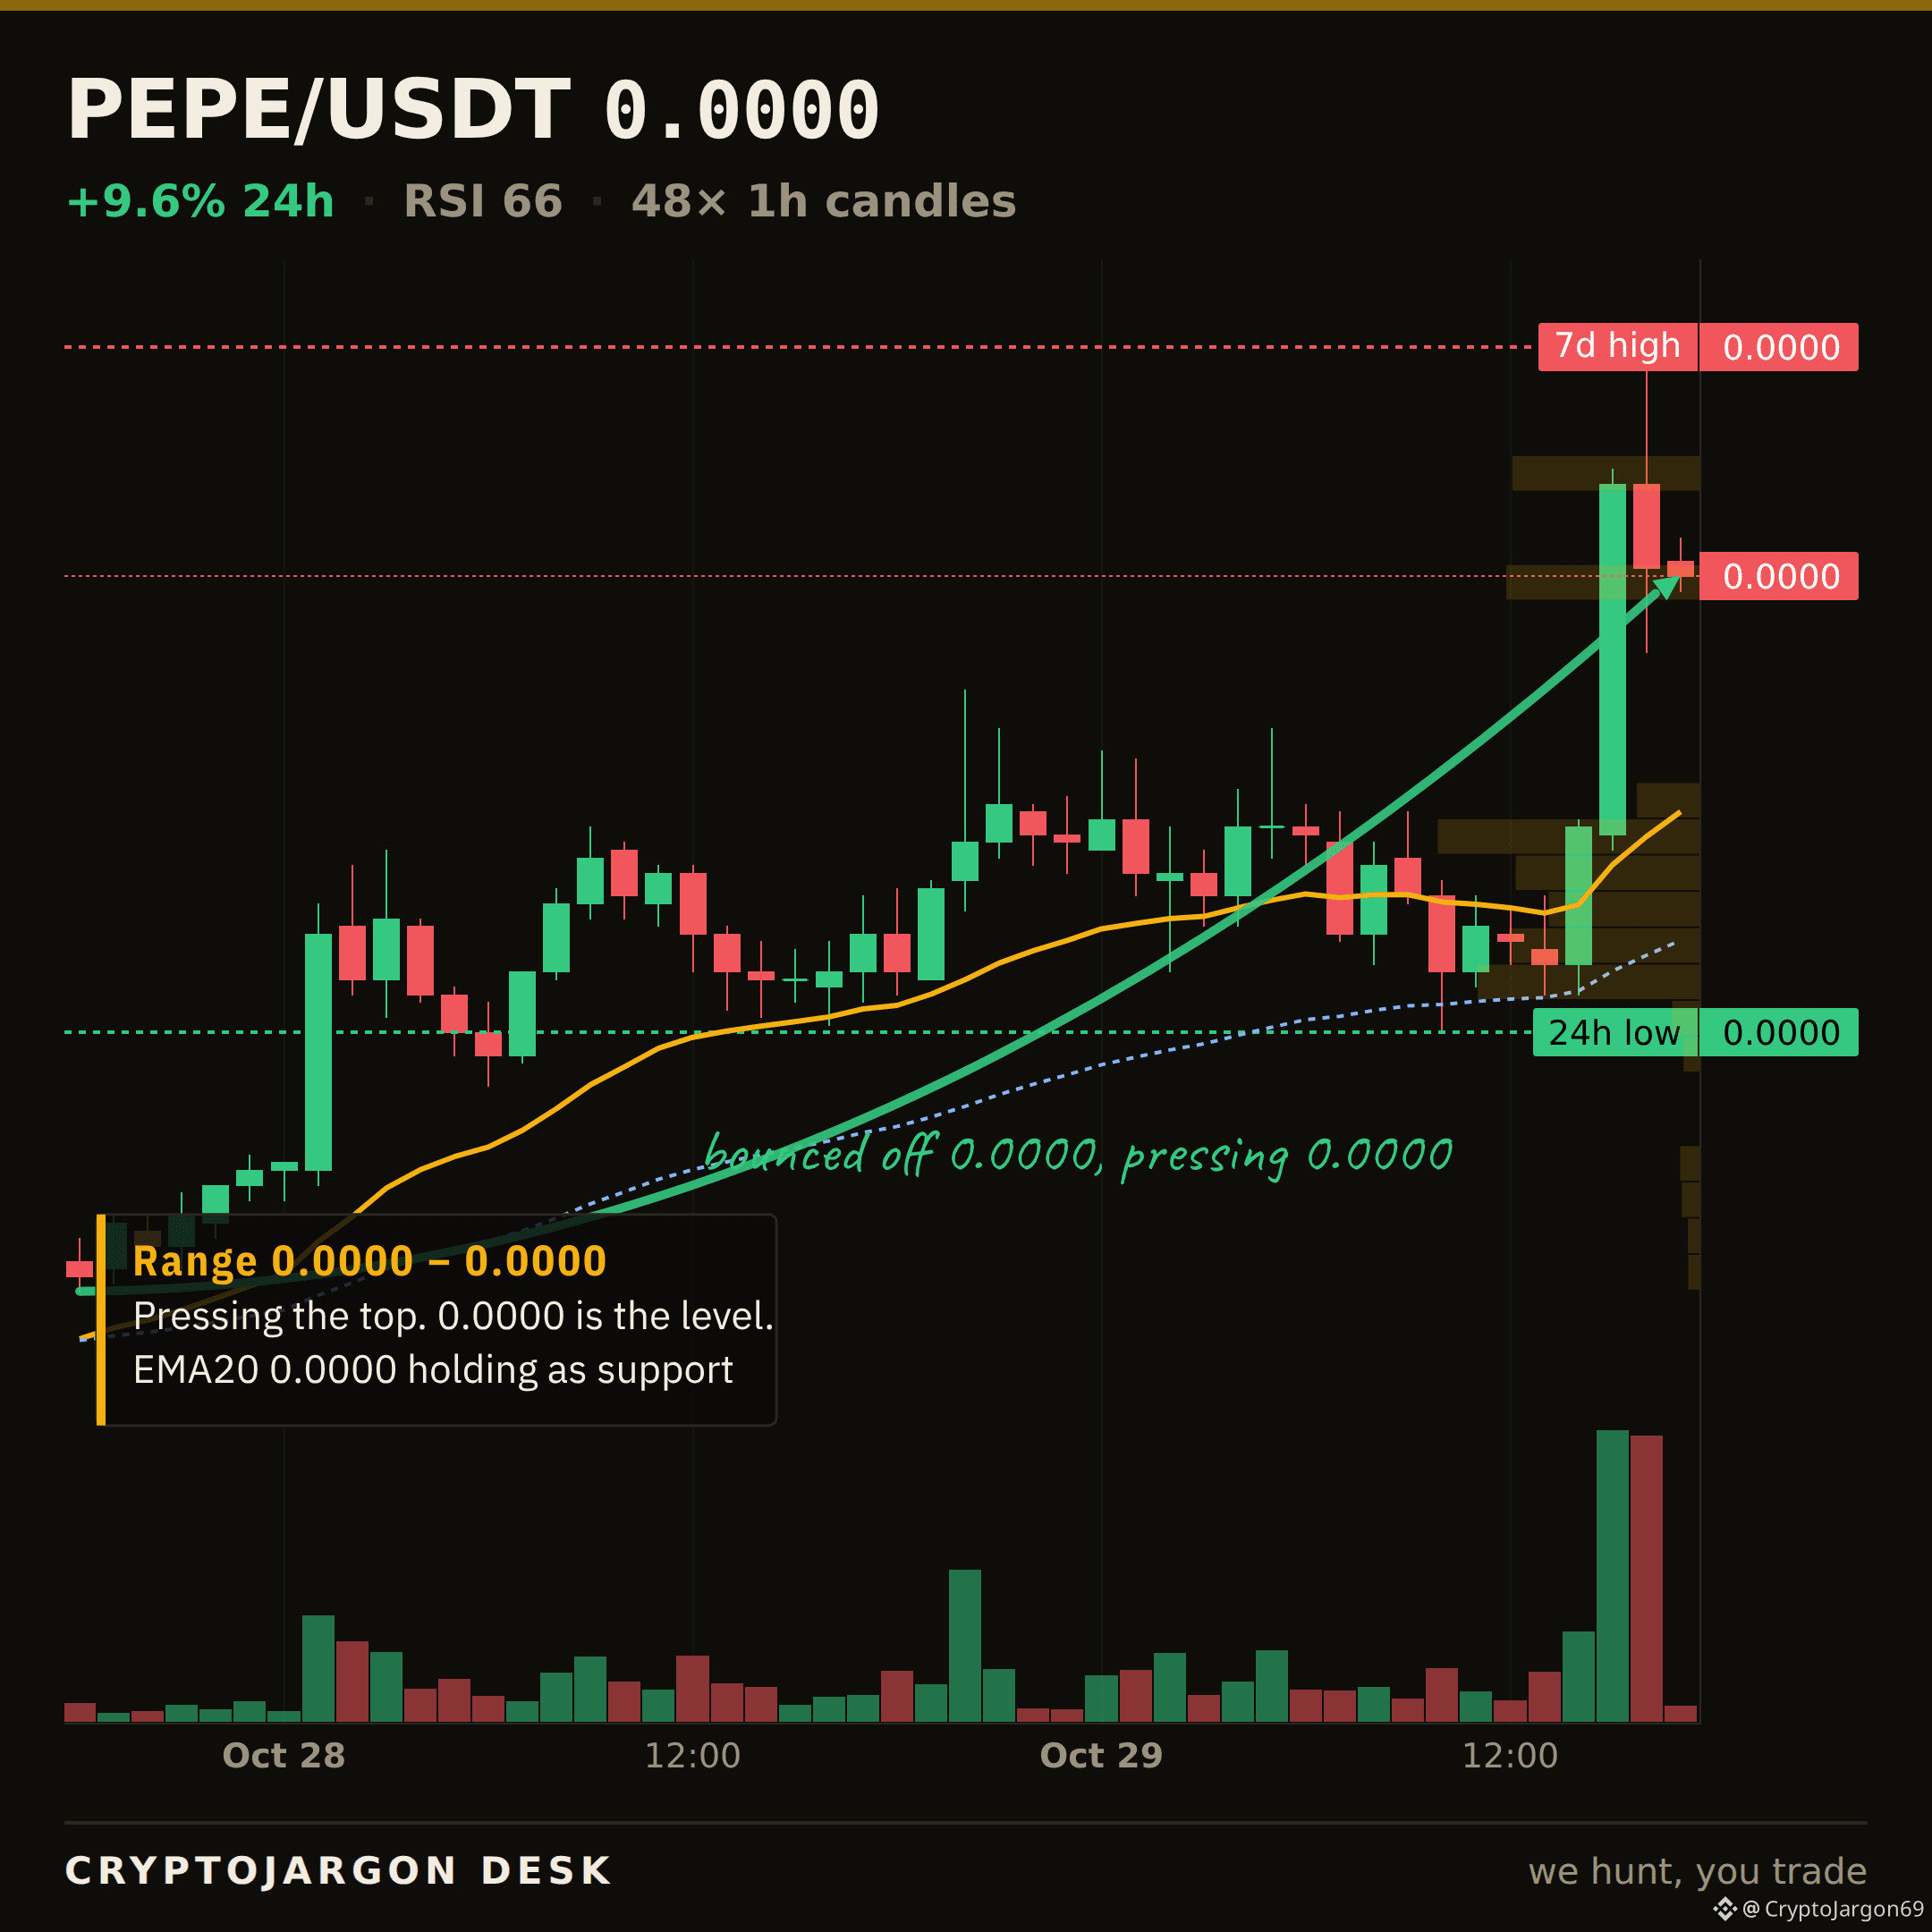
PEPE printed +11.4% today, right into the weekly range high at 0.00000568.
The tape is clean. Price is holding above the short-term EMAs and RSI is 67 — strong, but not yet overextended. Volume sits at $172M.
This is the test. A move like this on a neutral market day (Fear & Greed at 51) suggests it has its own momentum. But momentum means nothing if it can't break the week's highs.
Is this the real bid breaking out, or are you selling the top of the box?
$PEPE #PEPE
New reads post through the day. Follow so you don't miss the next one.
17
$BLUR · THE LEVEL BROKE
It didn't hold.
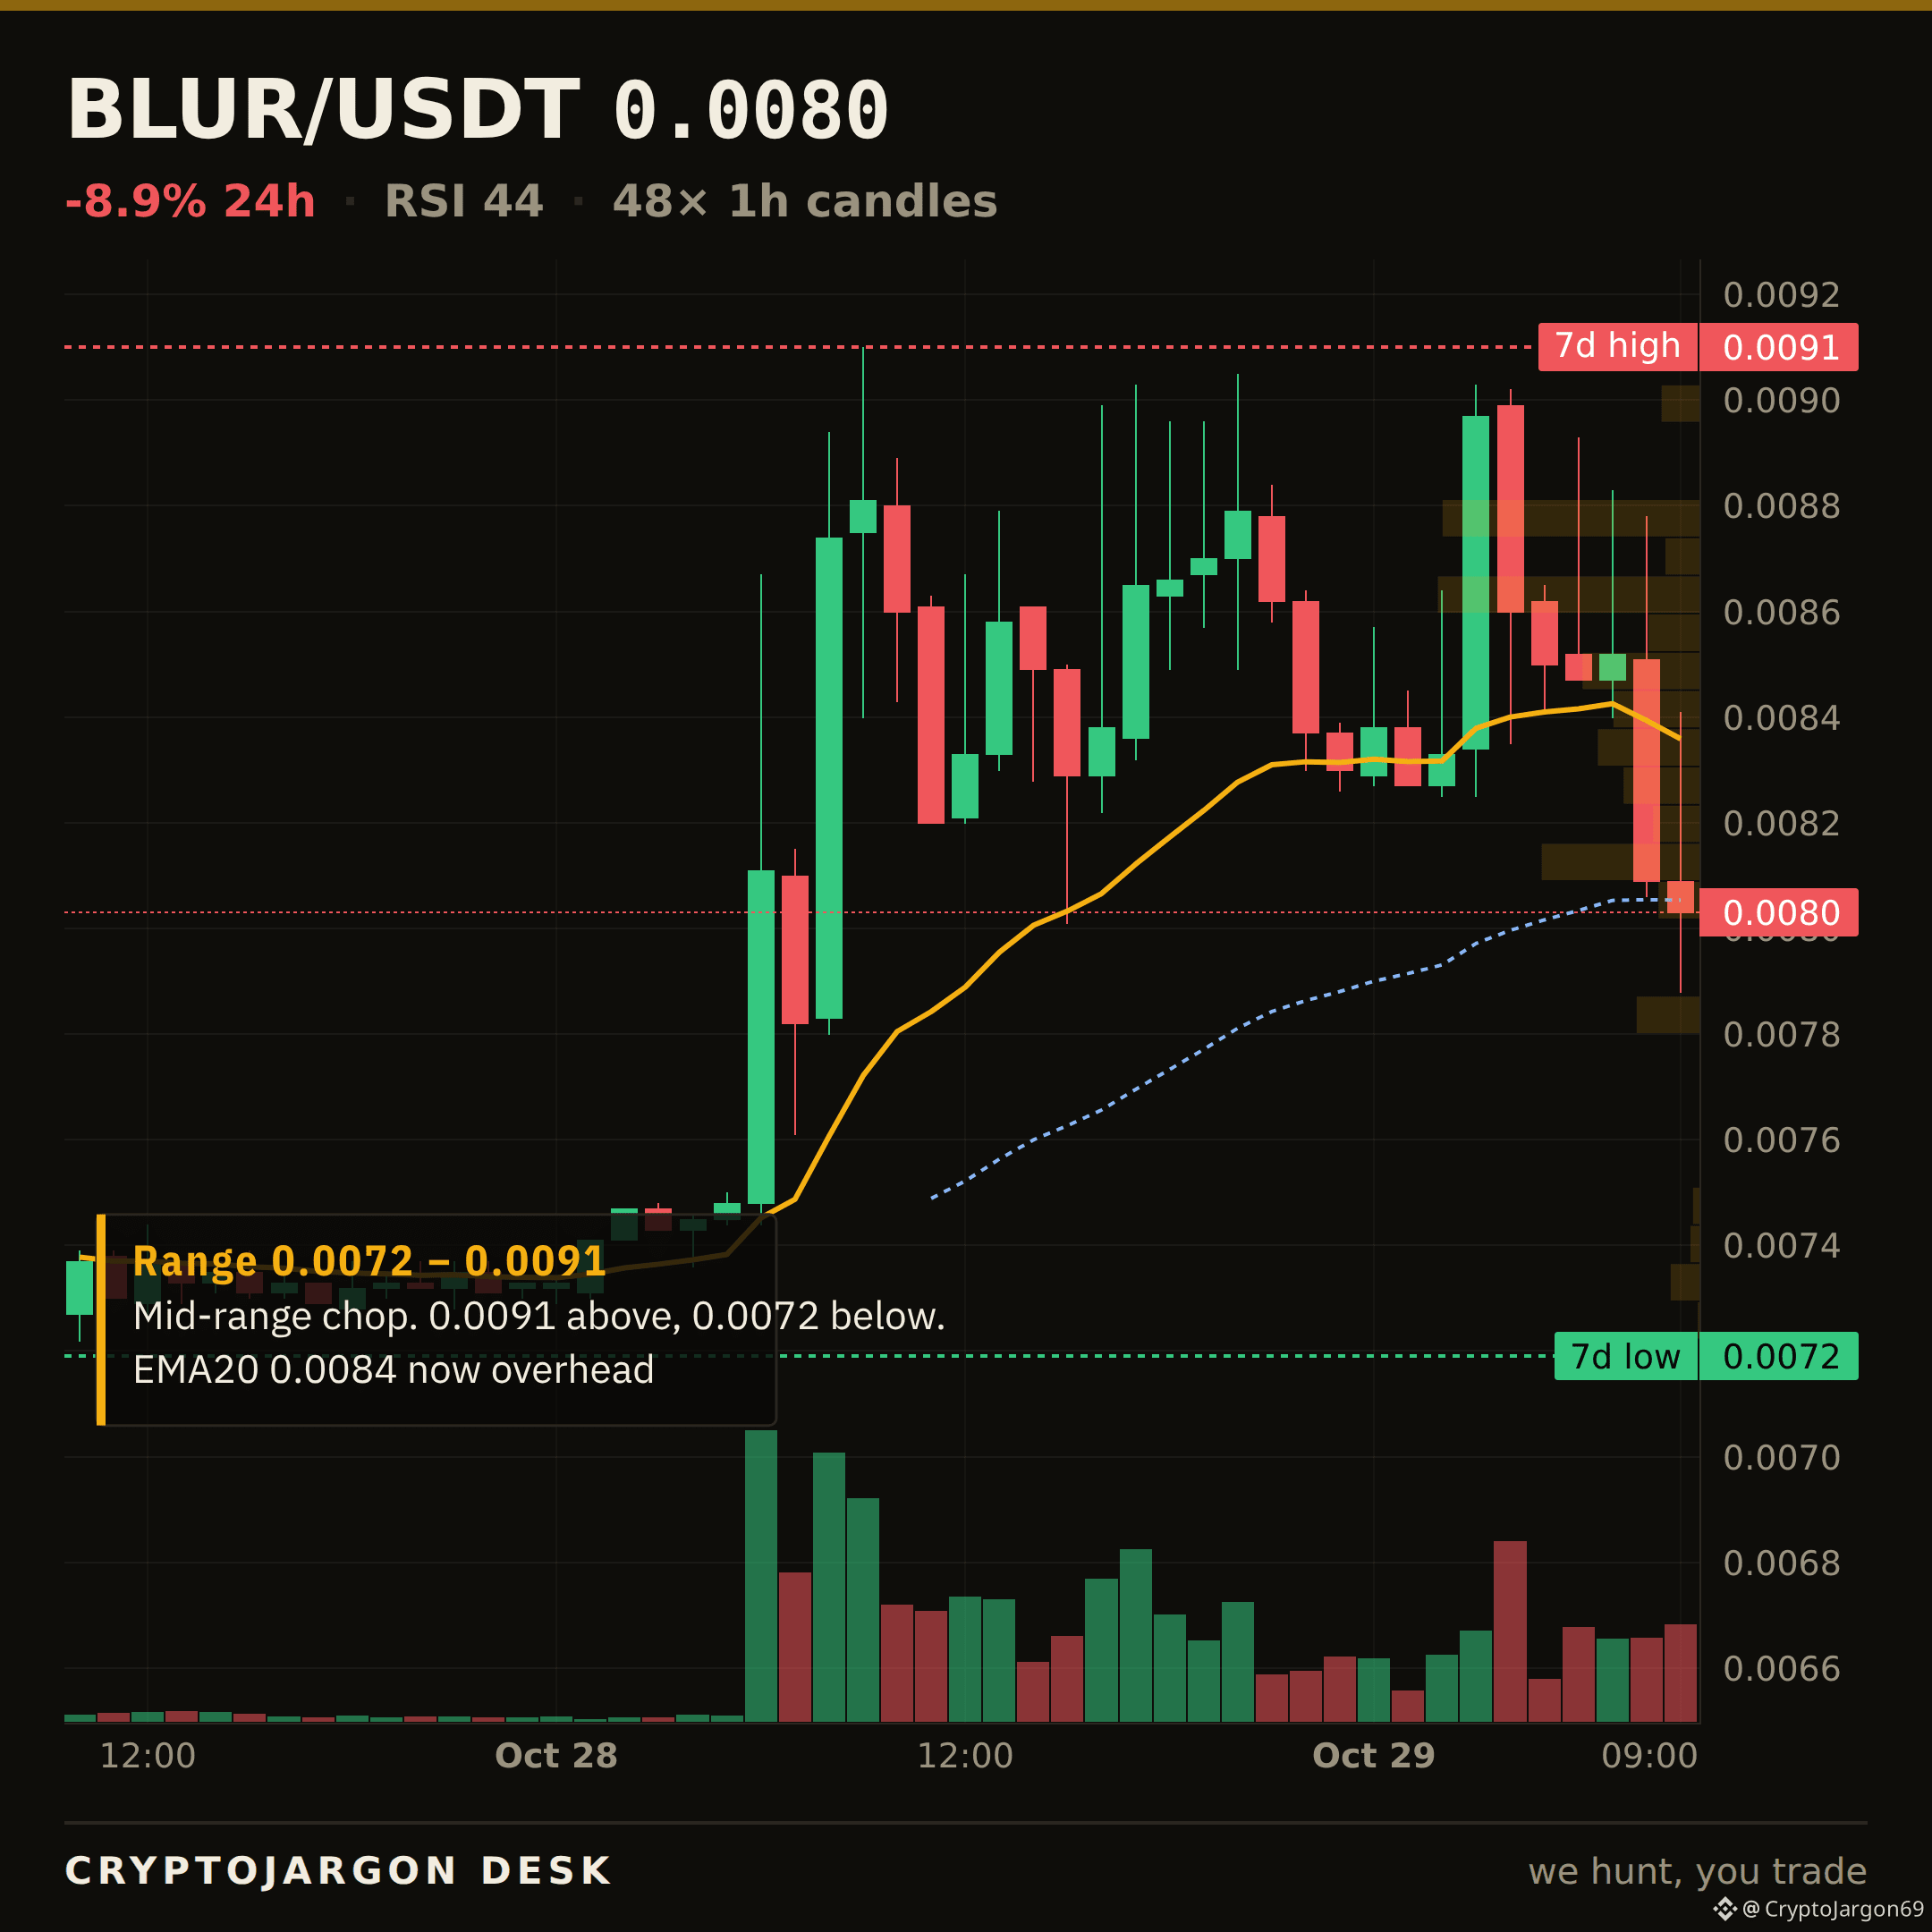
$0.0084 was the floor we flagged on $BLUR. Price closed below it — $0.00803 now. The range beneath opens up, and that line flips into the ceiling it has to win back.
Reclaim from here, or is this the start of the next leg down?
$BLUR
$BLUR · THE LEVEL BROKE
It didn't hold.
$0.0084 was the floor we flagged on $BLUR . Price closed below it — $0.00803 now. The range beneath opens up, and that line flips into the ceiling it has to win back.
Reclaim from here, or is this the start of the next leg down?
$BLUR
It didn't hold.
$0.0084 was the floor we flagged on $BLUR . Price closed below it — $0.00803 now. The range beneath opens up, and that line flips into the ceiling it has to win back.
Reclaim from here, or is this the start of the next leg down?
$BLUR
81
$BCH · THE LEVEL BROKE
It didn't hold.
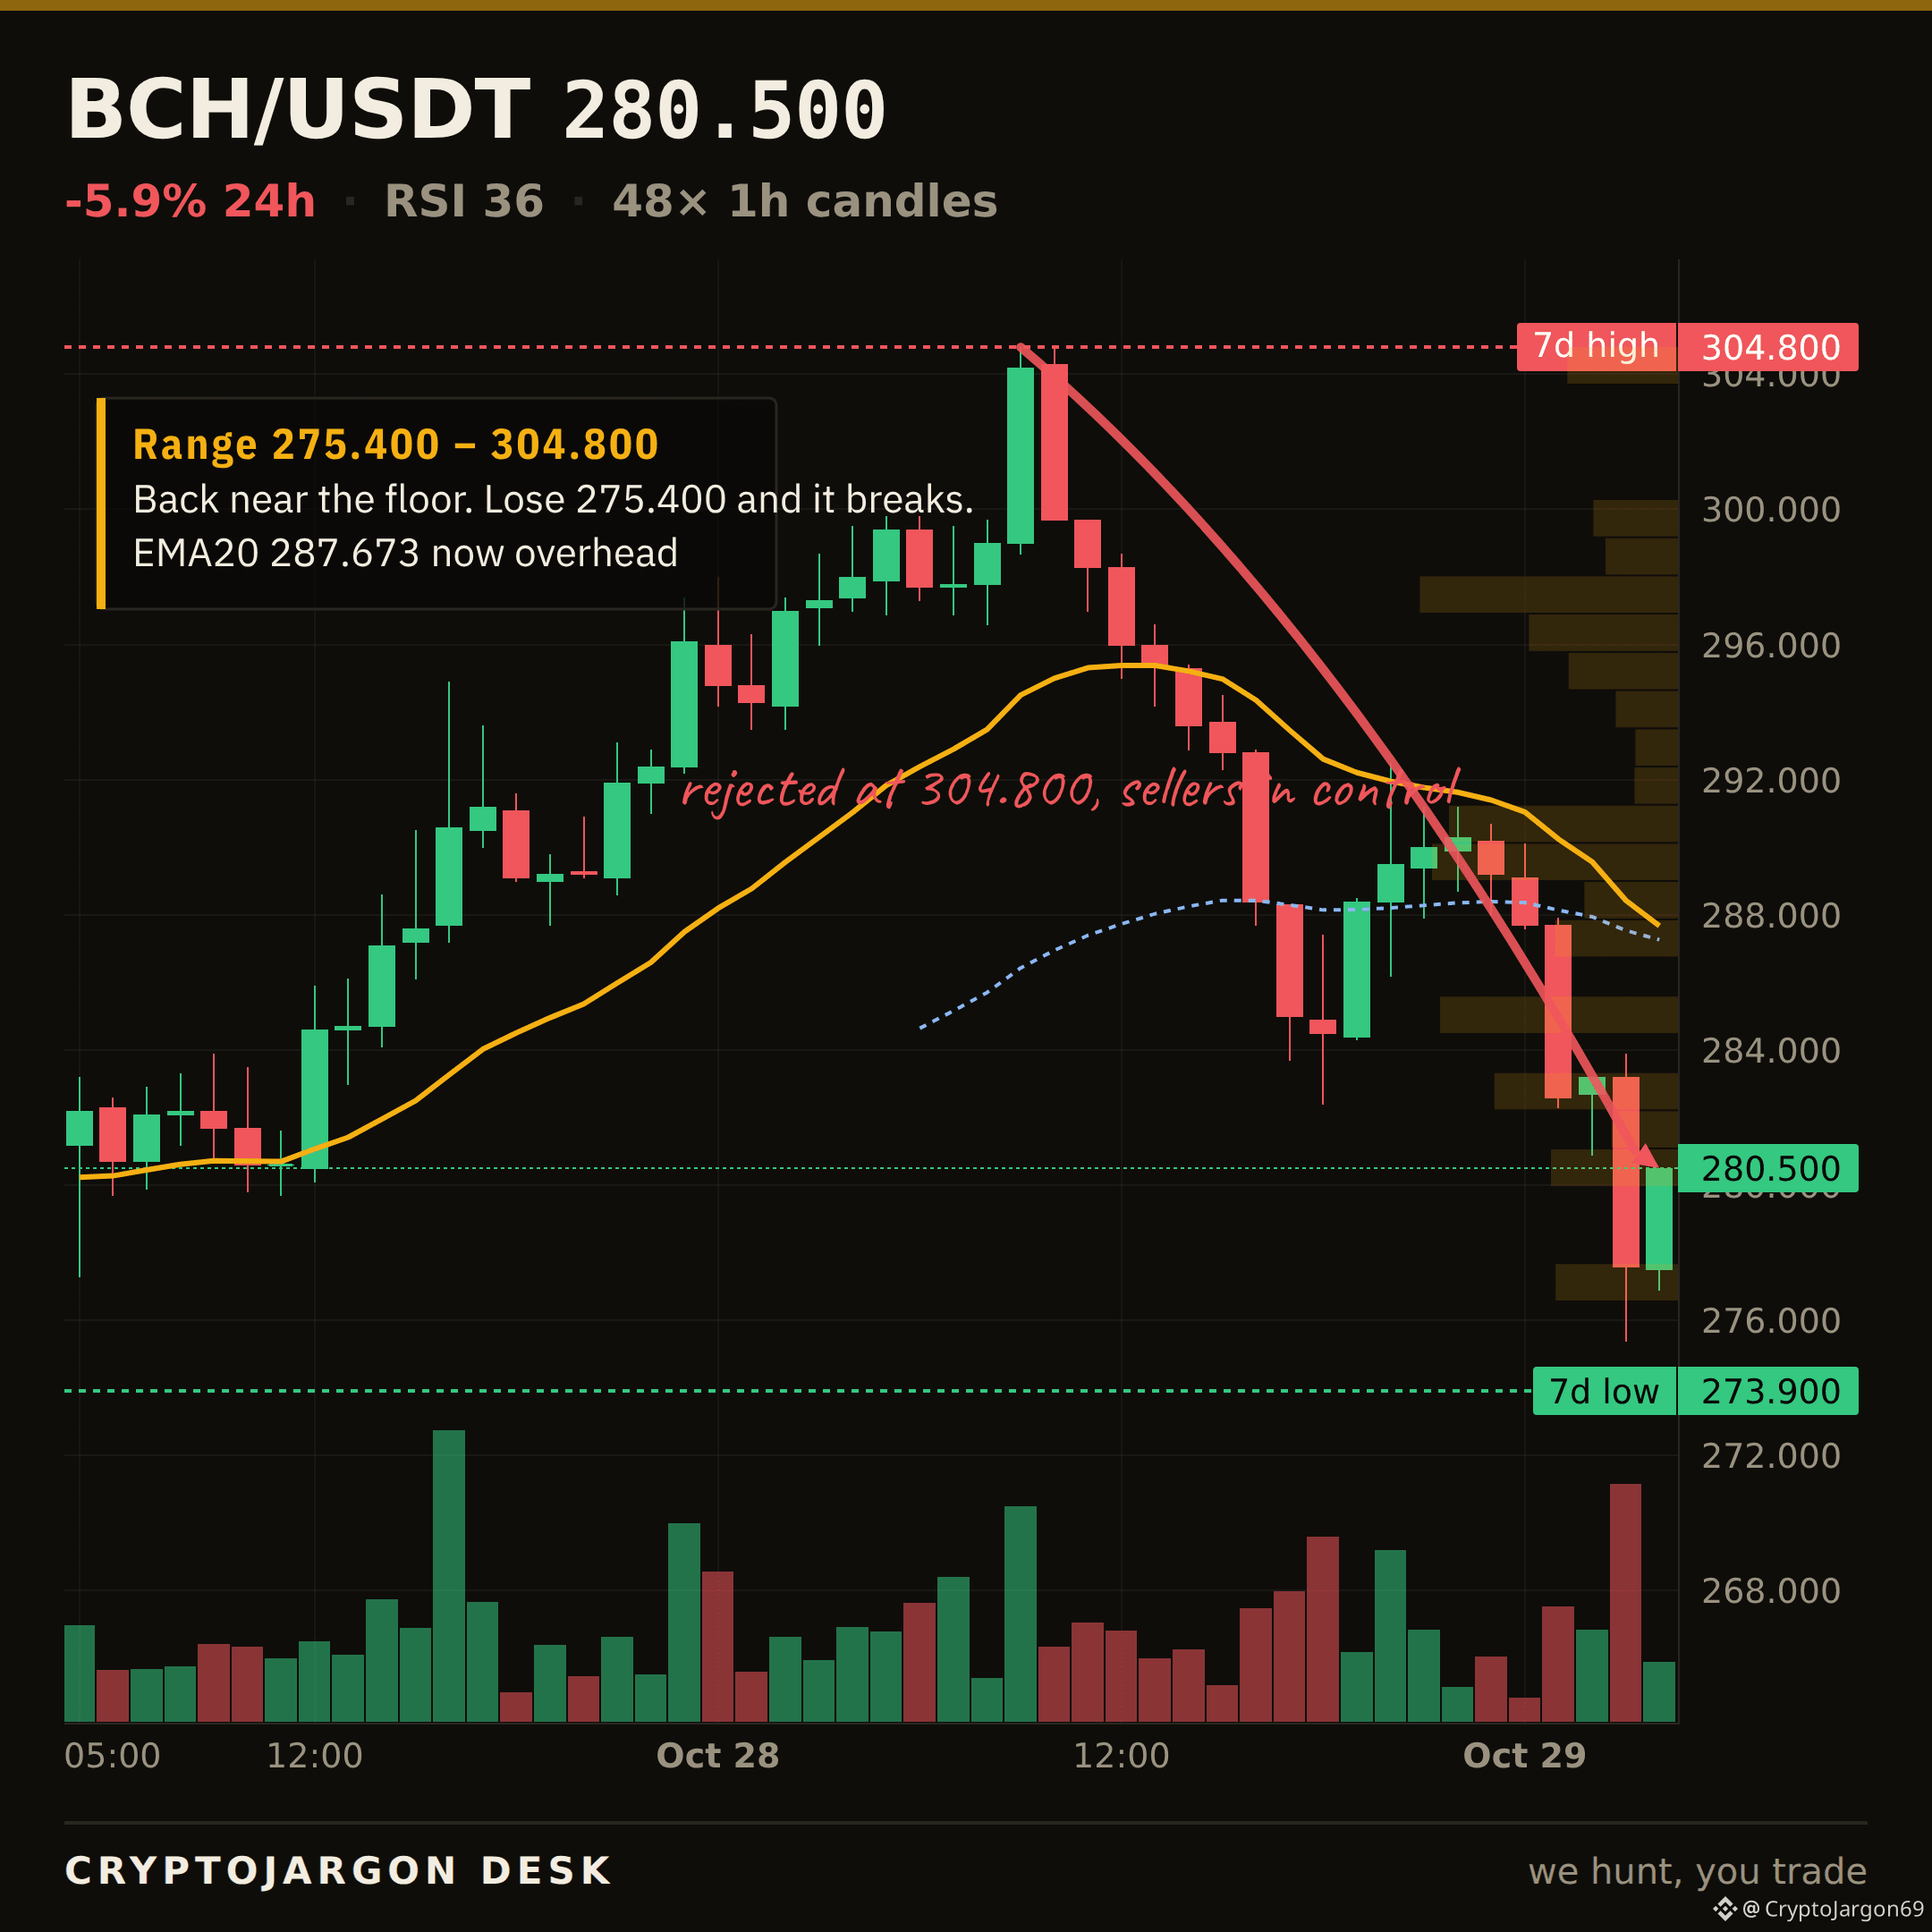
$282.40 was the floor we flagged on $BCH. Price closed below it — $280.50 now. The range beneath opens up, and that line flips into the ceiling it has to win back.
Does it reclaim $282.40, or is that the ceiling now?
$BCH
$BCH · THE LEVEL BROKE
It didn't hold.
$282.40 was the floor we flagged on $BCH . Price closed below it — $280.50 now. The range beneath opens up, and that line flips into the ceiling it has to win back.
Does it reclaim $282.40, or is that the ceiling now?
$BCH
It didn't hold.
$282.40 was the floor we flagged on $BCH . Price closed below it — $280.50 now. The range beneath opens up, and that line flips into the ceiling it has to win back.
Does it reclaim $282.40, or is that the ceiling now?
$BCH
31
$CHIP · MARKET STRUCTURE
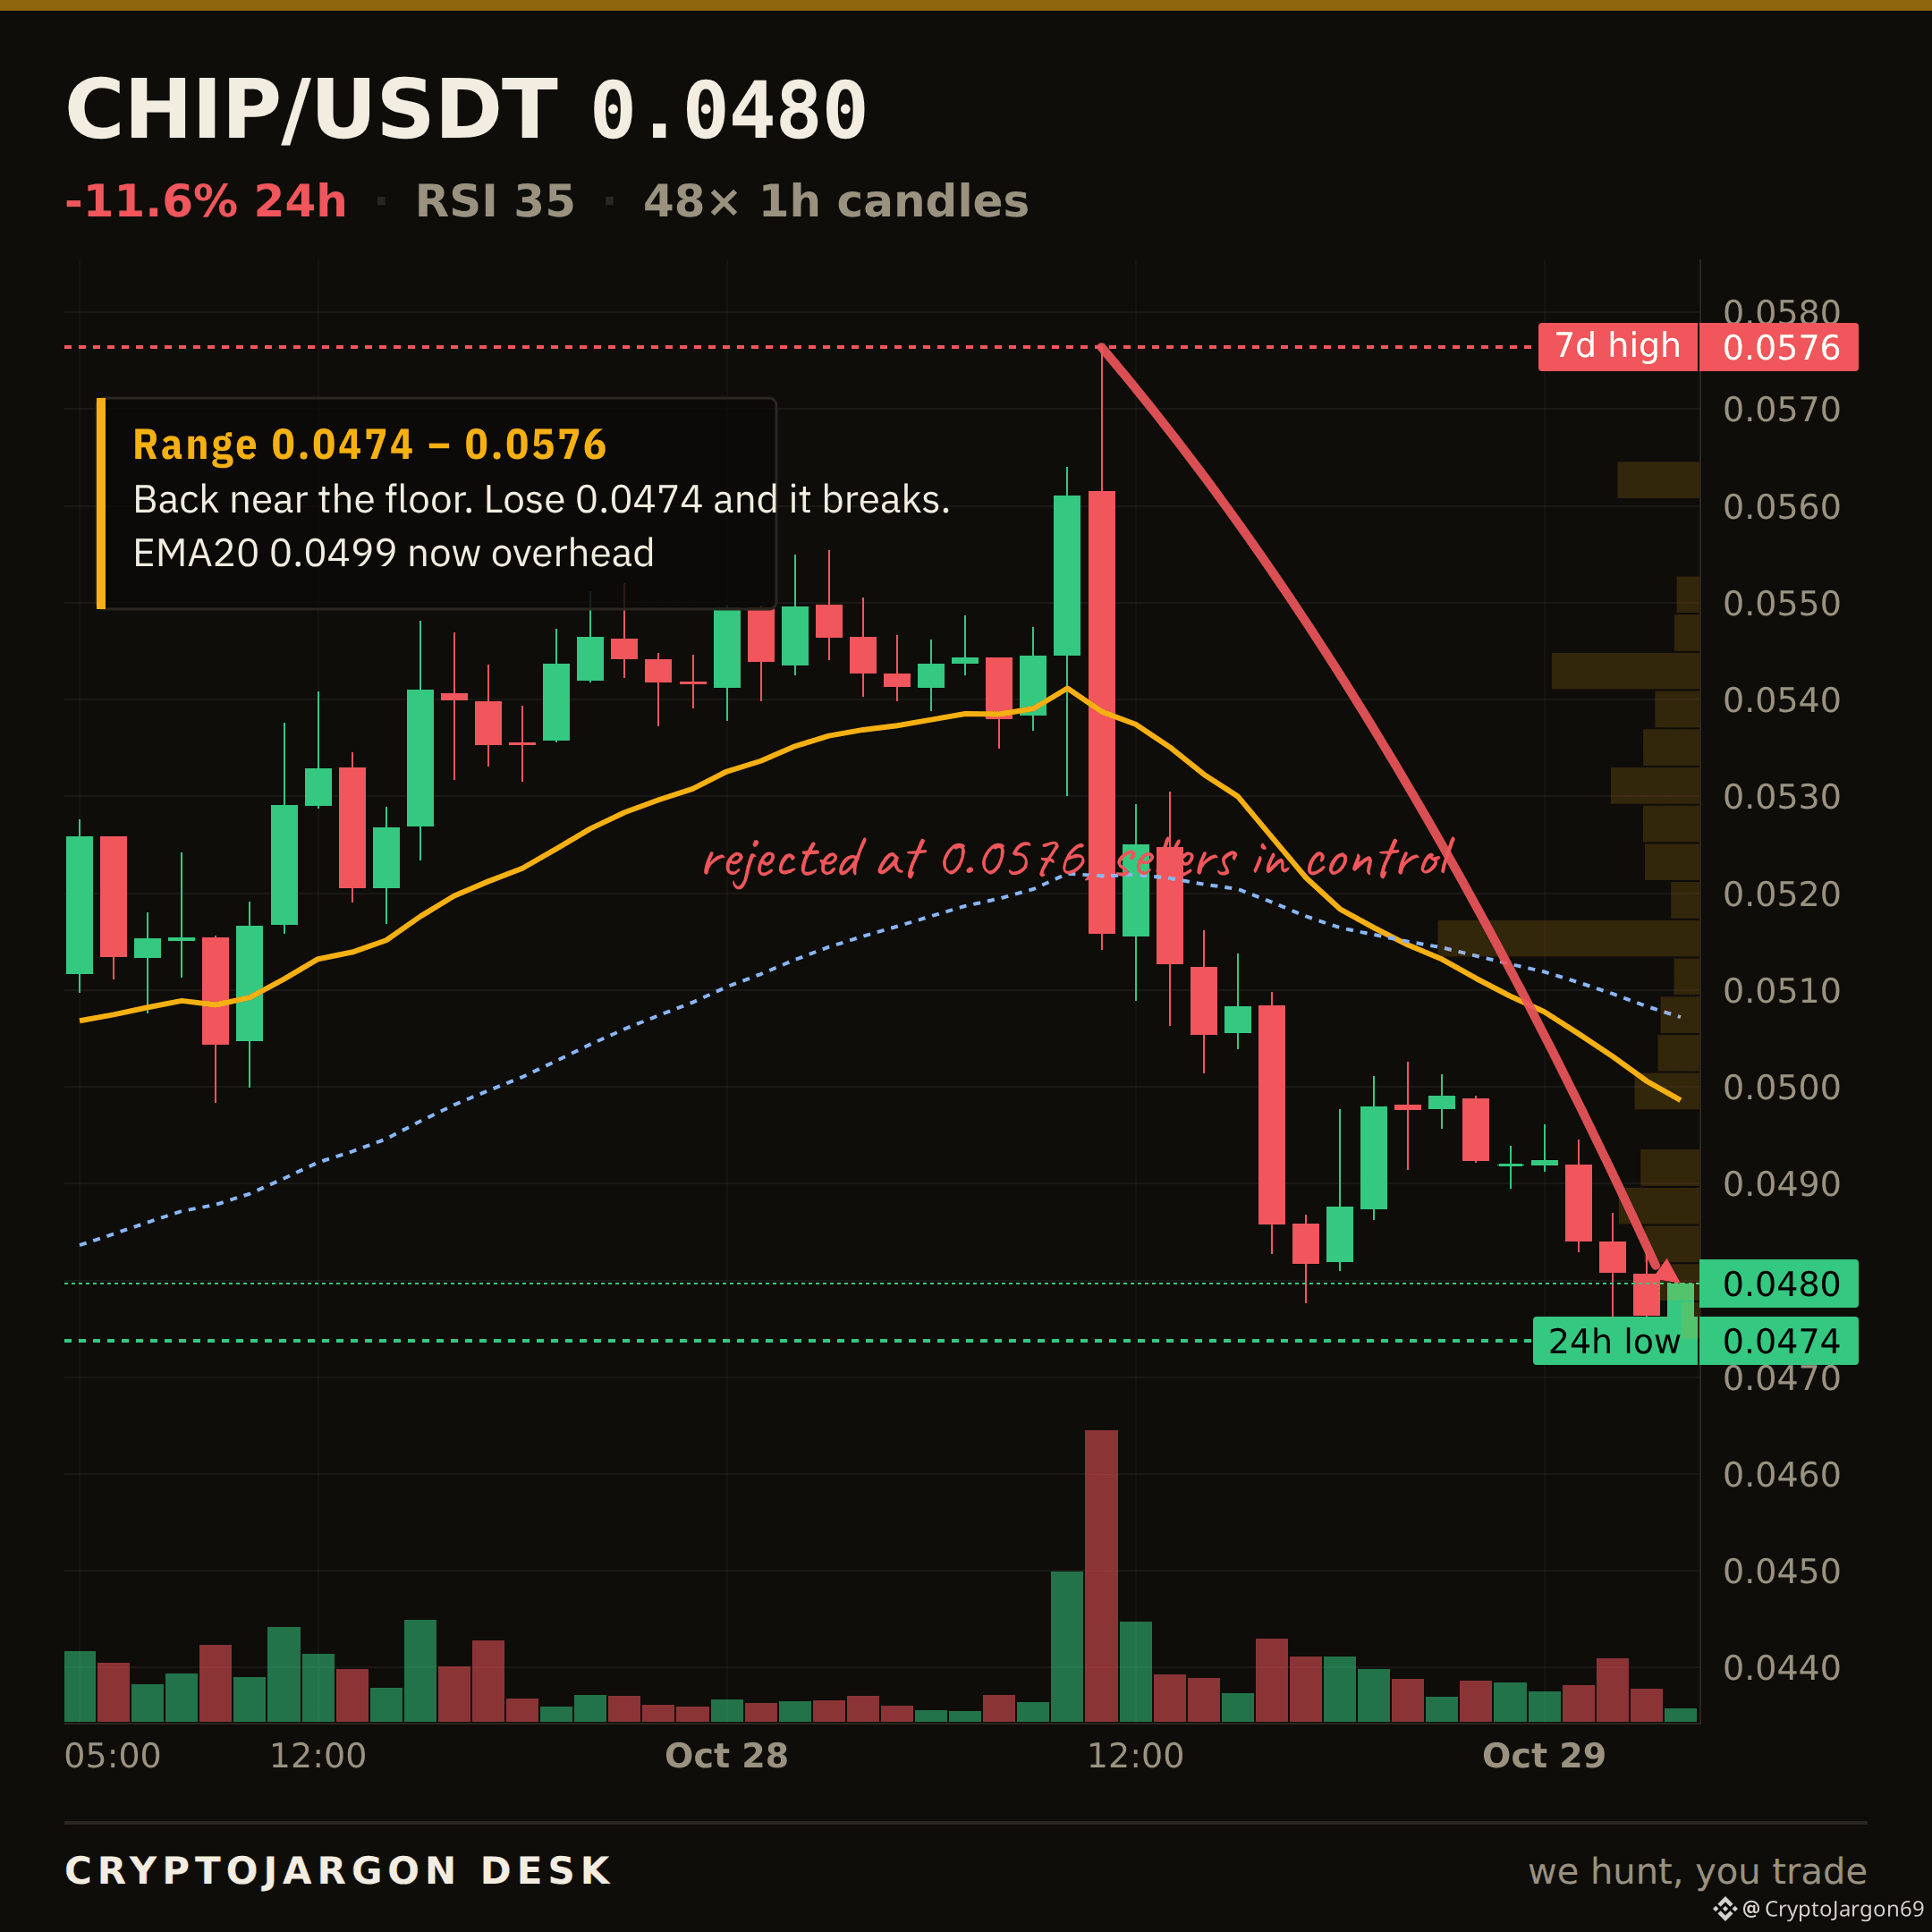
$0.048, -11.6% on the day.
Trend — price below both EMAs, the 20 under the 50.
Momentum — RSI 35.
Range — 6% up its 24h range ($0.0474–$0.0576).
Trend, momentum and range mostly point the same way — an aligned tape to the downside.
Levels: $0.0576 24h high (ceiling) · $0.0474 24h low (support) · 7d range $0.0409–$0.0576.
Chart: 1H candles, EMA20/50 + levels marked. $CHIP
32
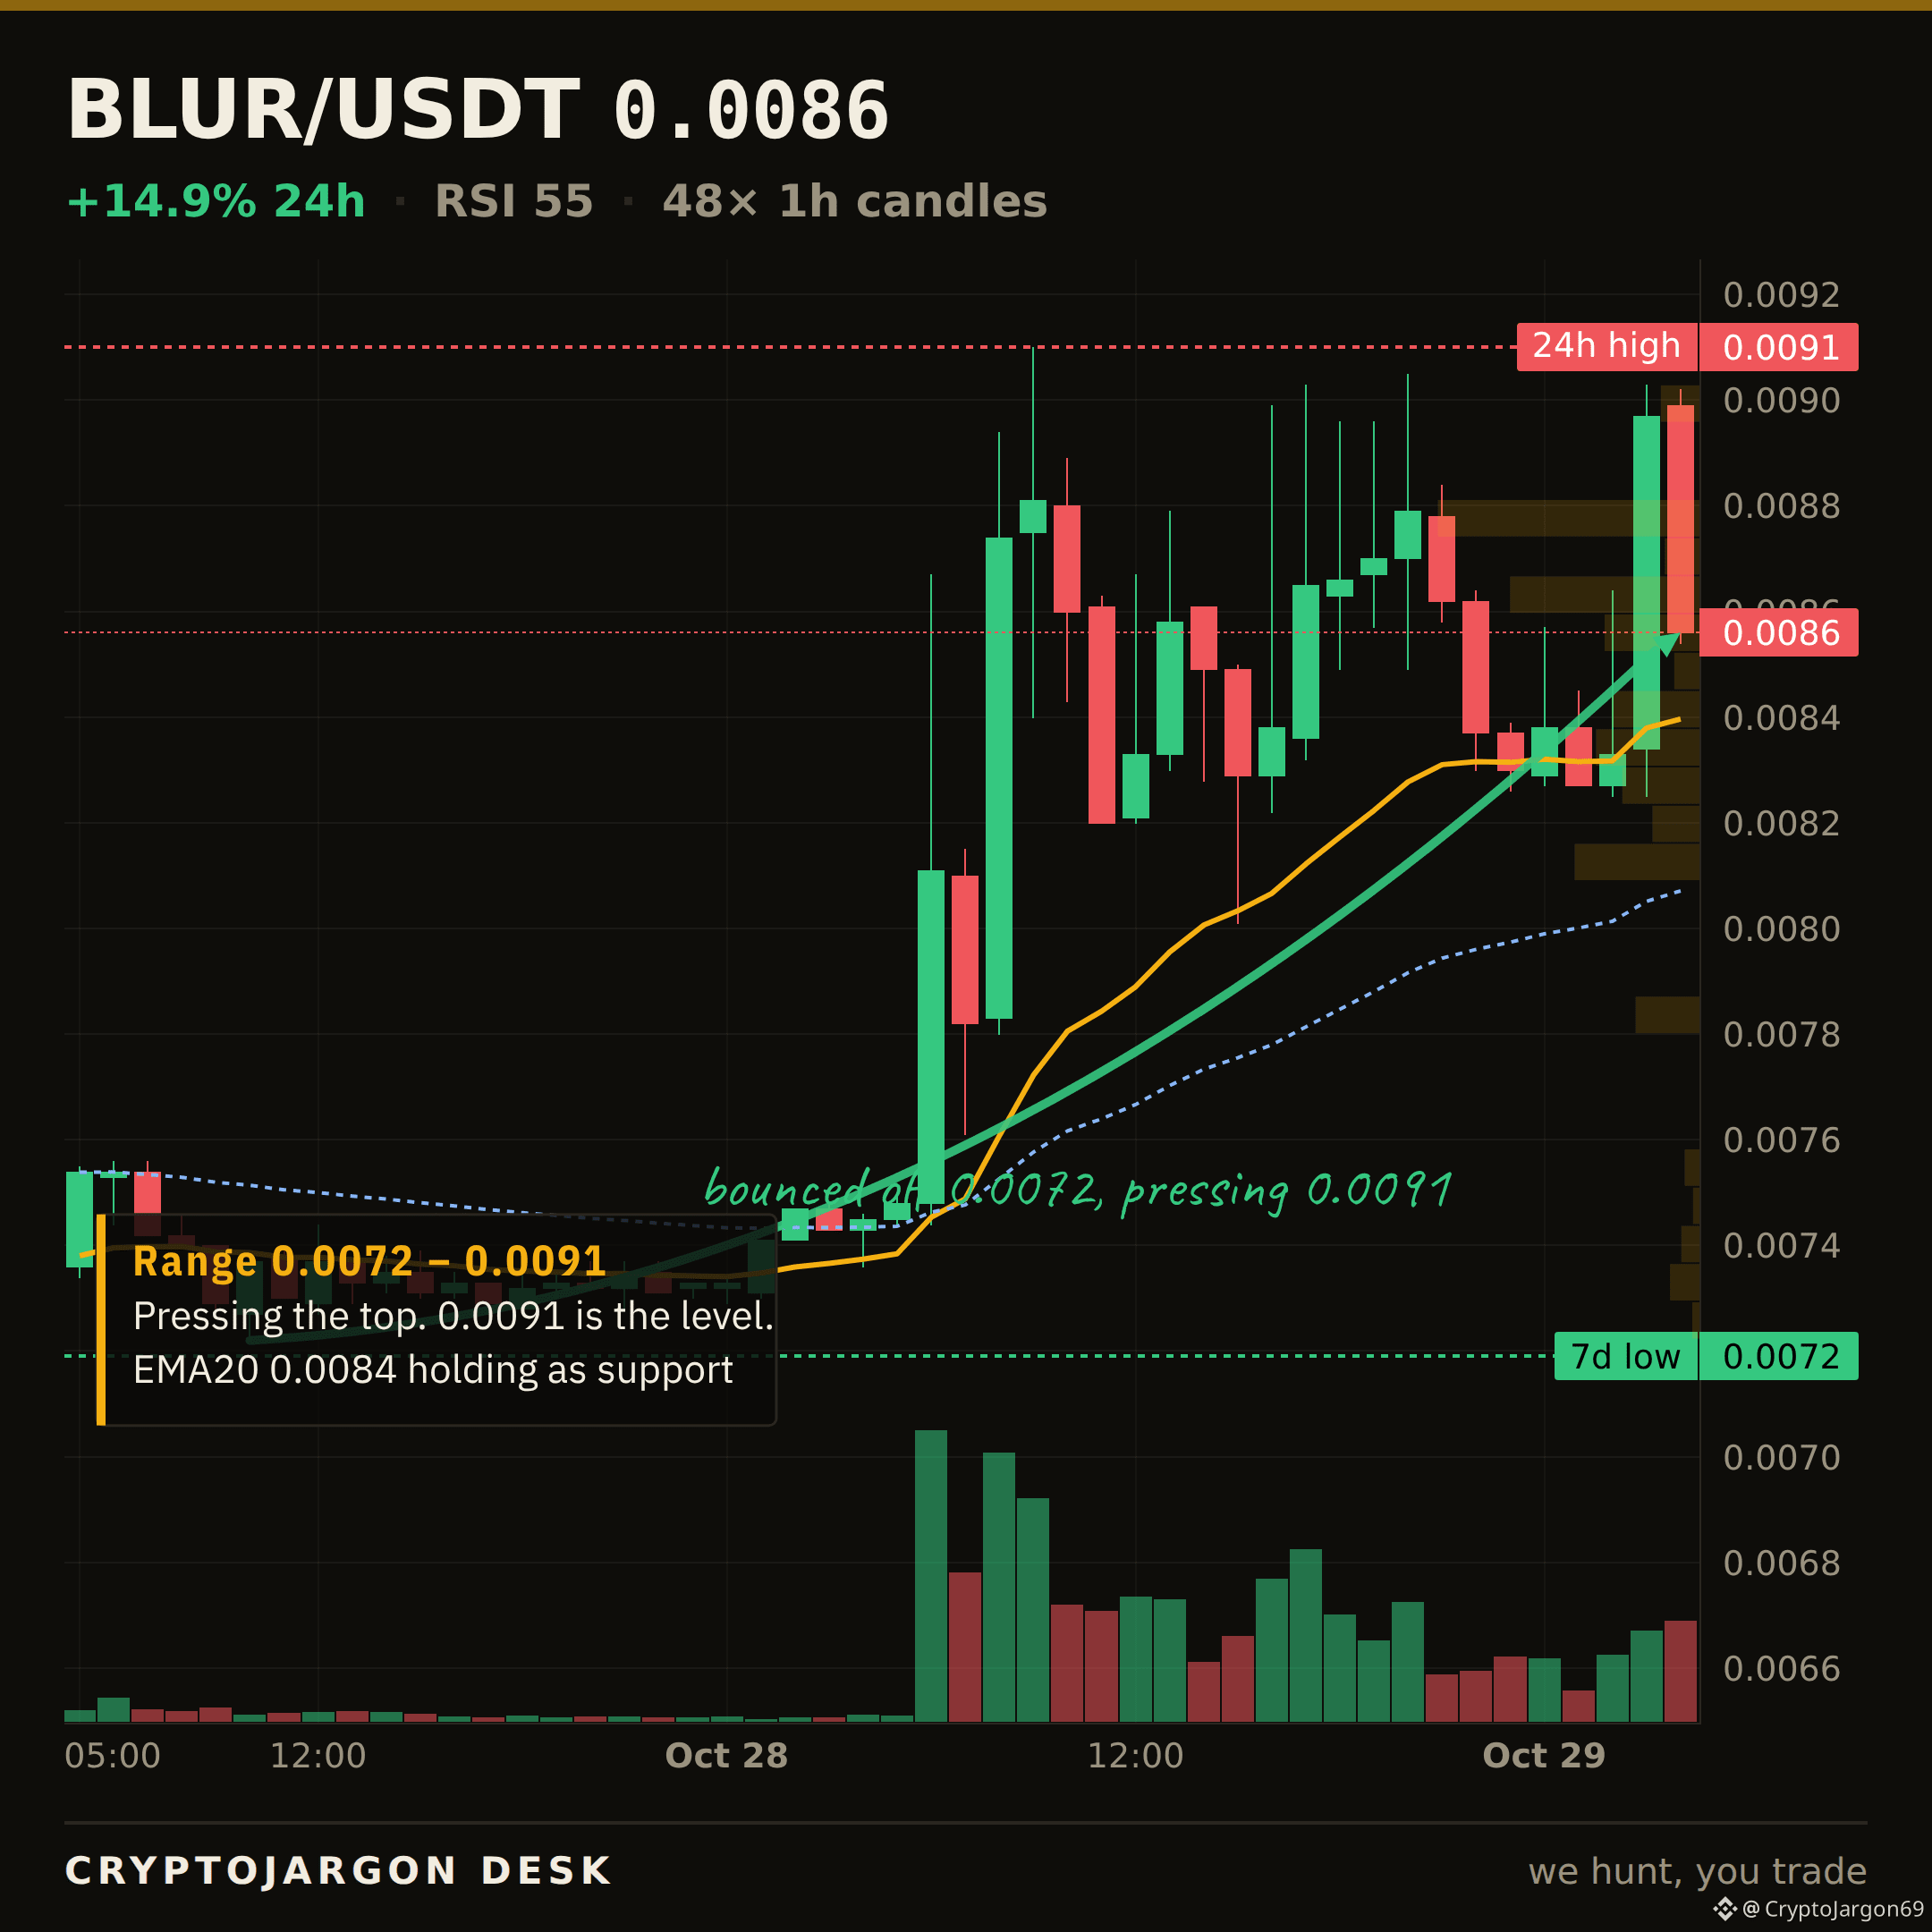
$BLUR · LEVEL TO WATCH
$0.00856 now.
The line that matters is $0.0084 — the 20-EMA, the floor the tape is sitting on.
Holding $0.0084 keeps the structure intact; a clean close below opens the range beneath it. I'll follow up when it resolves.
Chart: the level is on it. $BLUR
$BLUR · LEVEL TO WATCH
$0.00856 now.
The line that matters is $0.0084 — the 20-EMA, the floor the tape is sitting on.
Holding $0.0084 keeps the structure intact; a clean close below opens the range beneath it. I'll follow up when it resolves.
Chart: the level is on it. $BLUR
$0.00856 now.
The line that matters is $0.0084 — the 20-EMA, the floor the tape is sitting on.
Holding $0.0084 keeps the structure intact; a clean close below opens the range beneath it. I'll follow up when it resolves.
Chart: the level is on it. $BLUR
50
A company booked $150M in Bitcoin. It might not exist.
Datavault AI was credited 1,309 BTC at Biconomy via an "off-chain transfer." The exchange simply updated a number in its database; the coins never moved on-chain. Datavault hasn't been able to withdraw since June.
Now the company is restating four financial reports and questioning its own survival. It booked an exchange IOU as a liquid asset. A balance on a third-party platform is just a promise until coins are in your wallet. Always.
The market shrugs. Price holds just above the 7-day low of 79,221. Is another exchange story just noise, or is that the line in the sand?
$BTC
More of these coming today. Follow to catch them as they land.
11
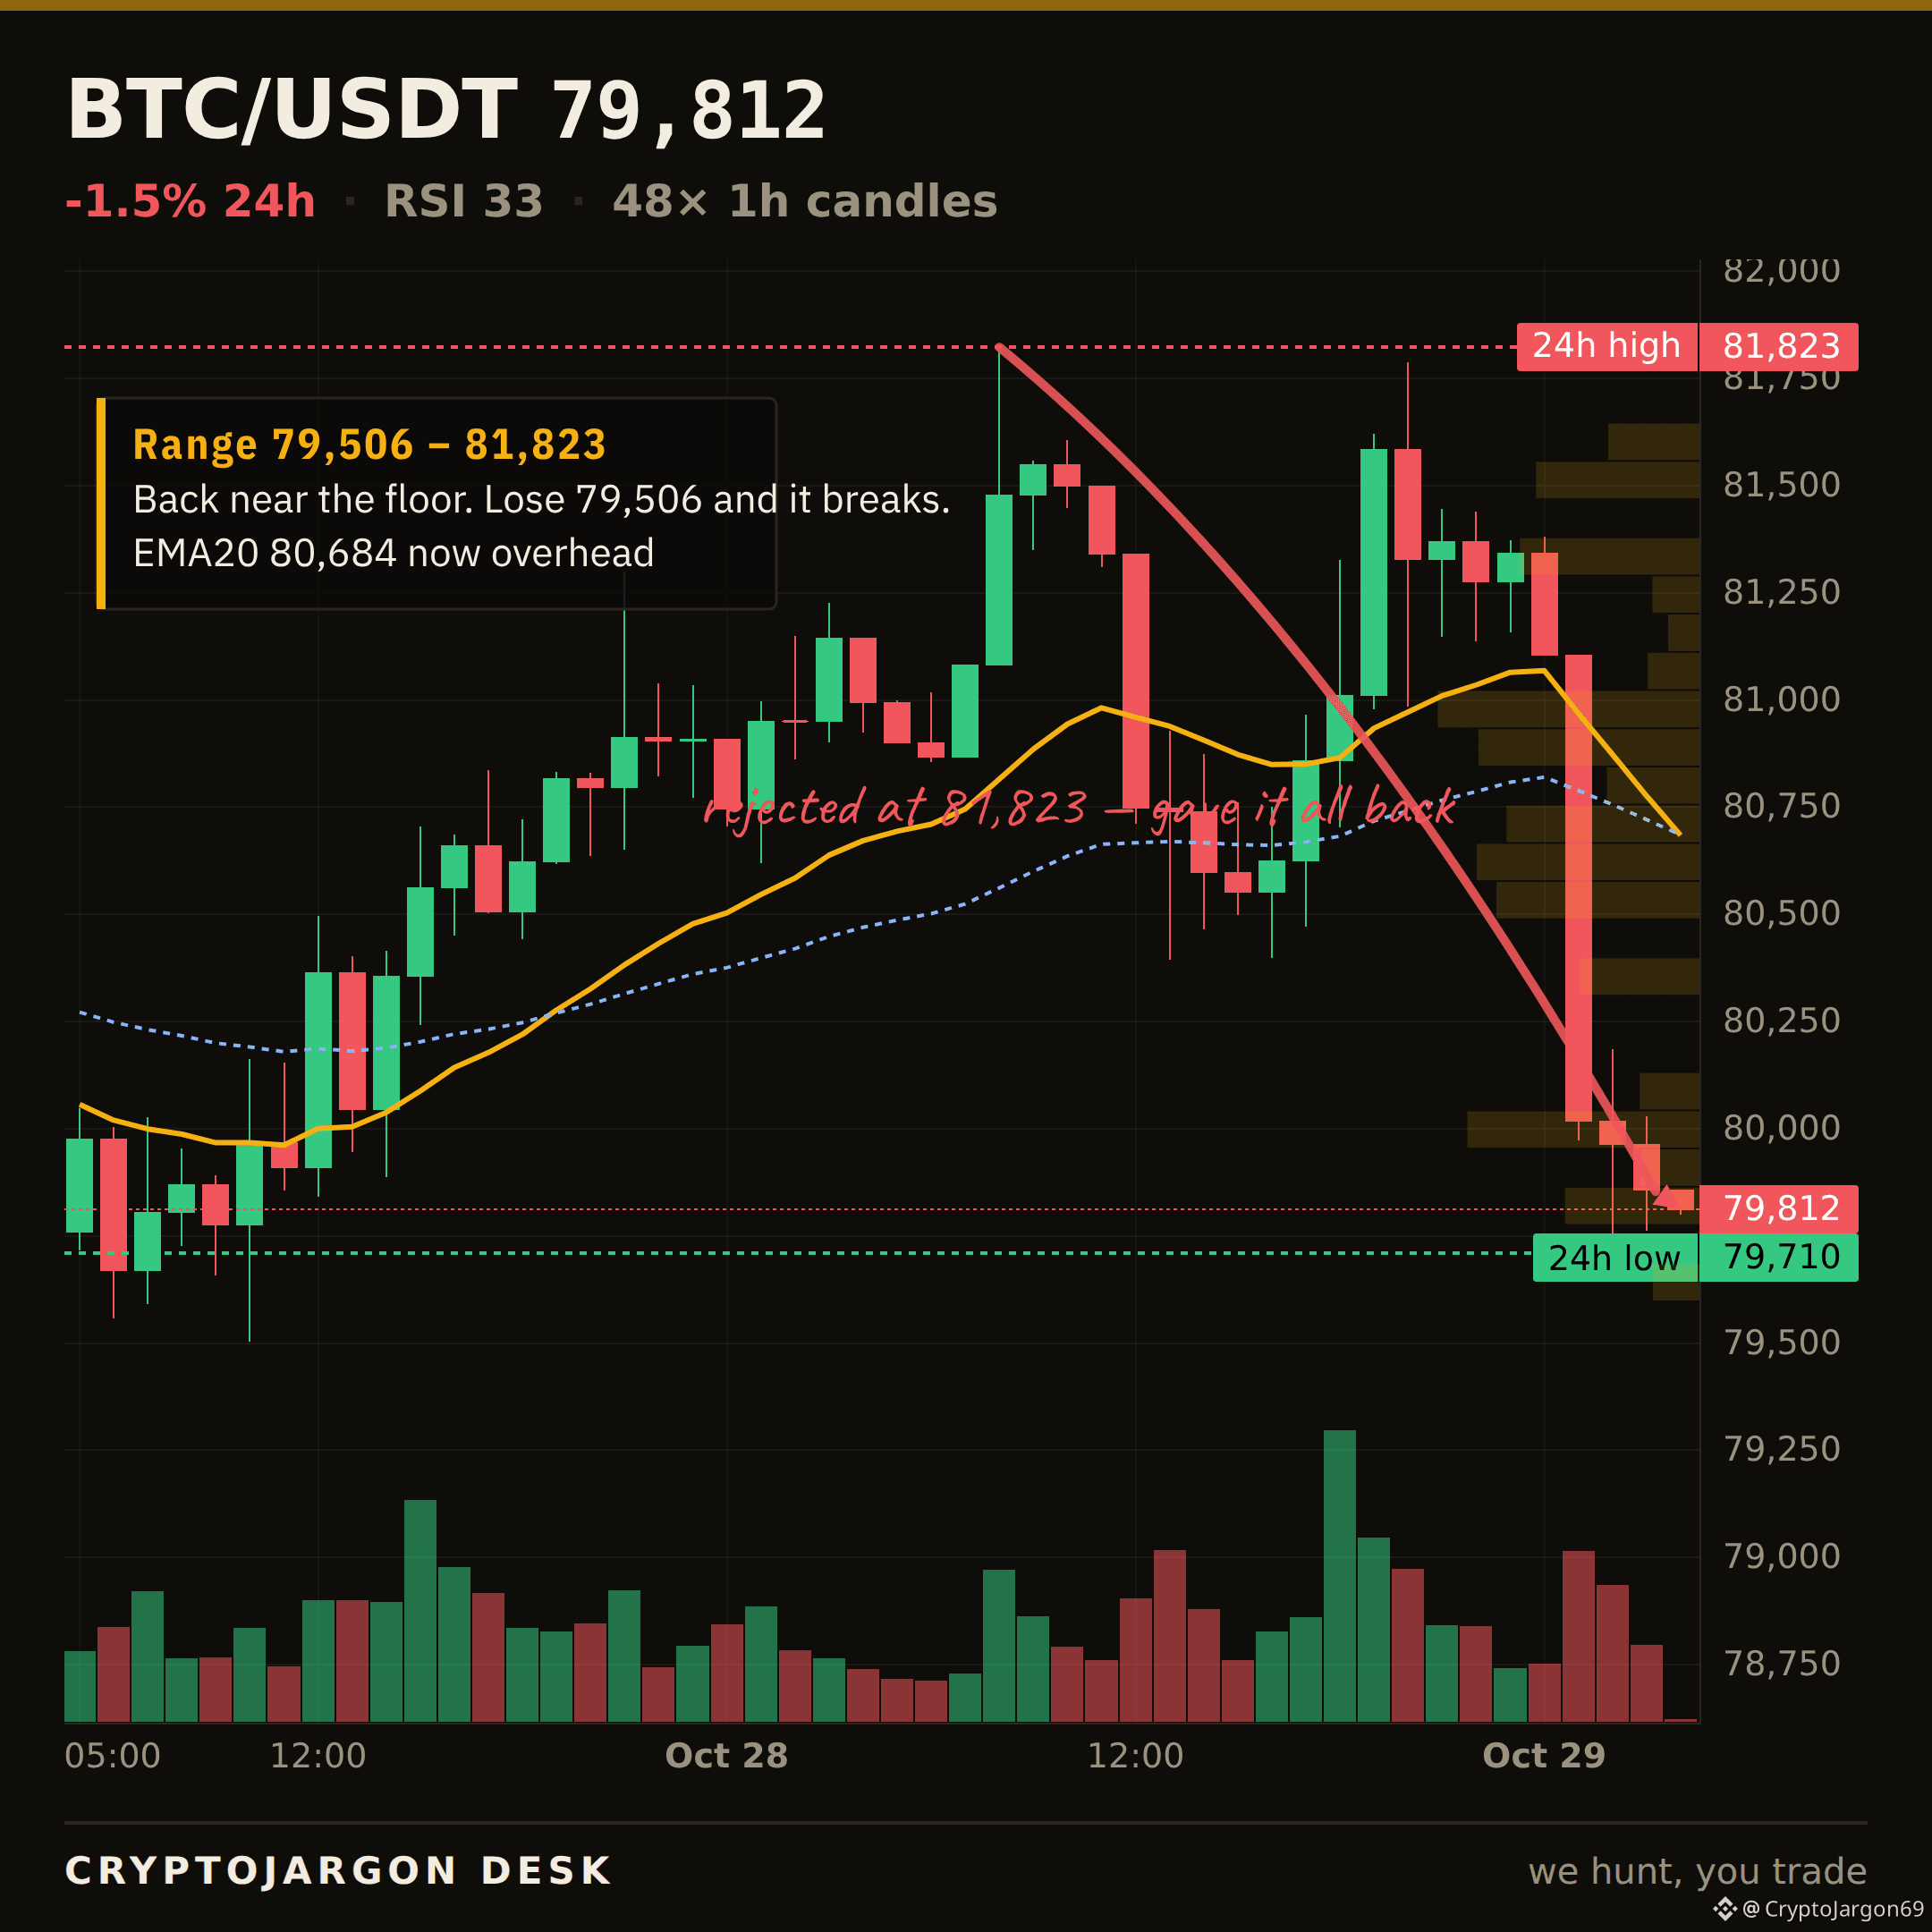
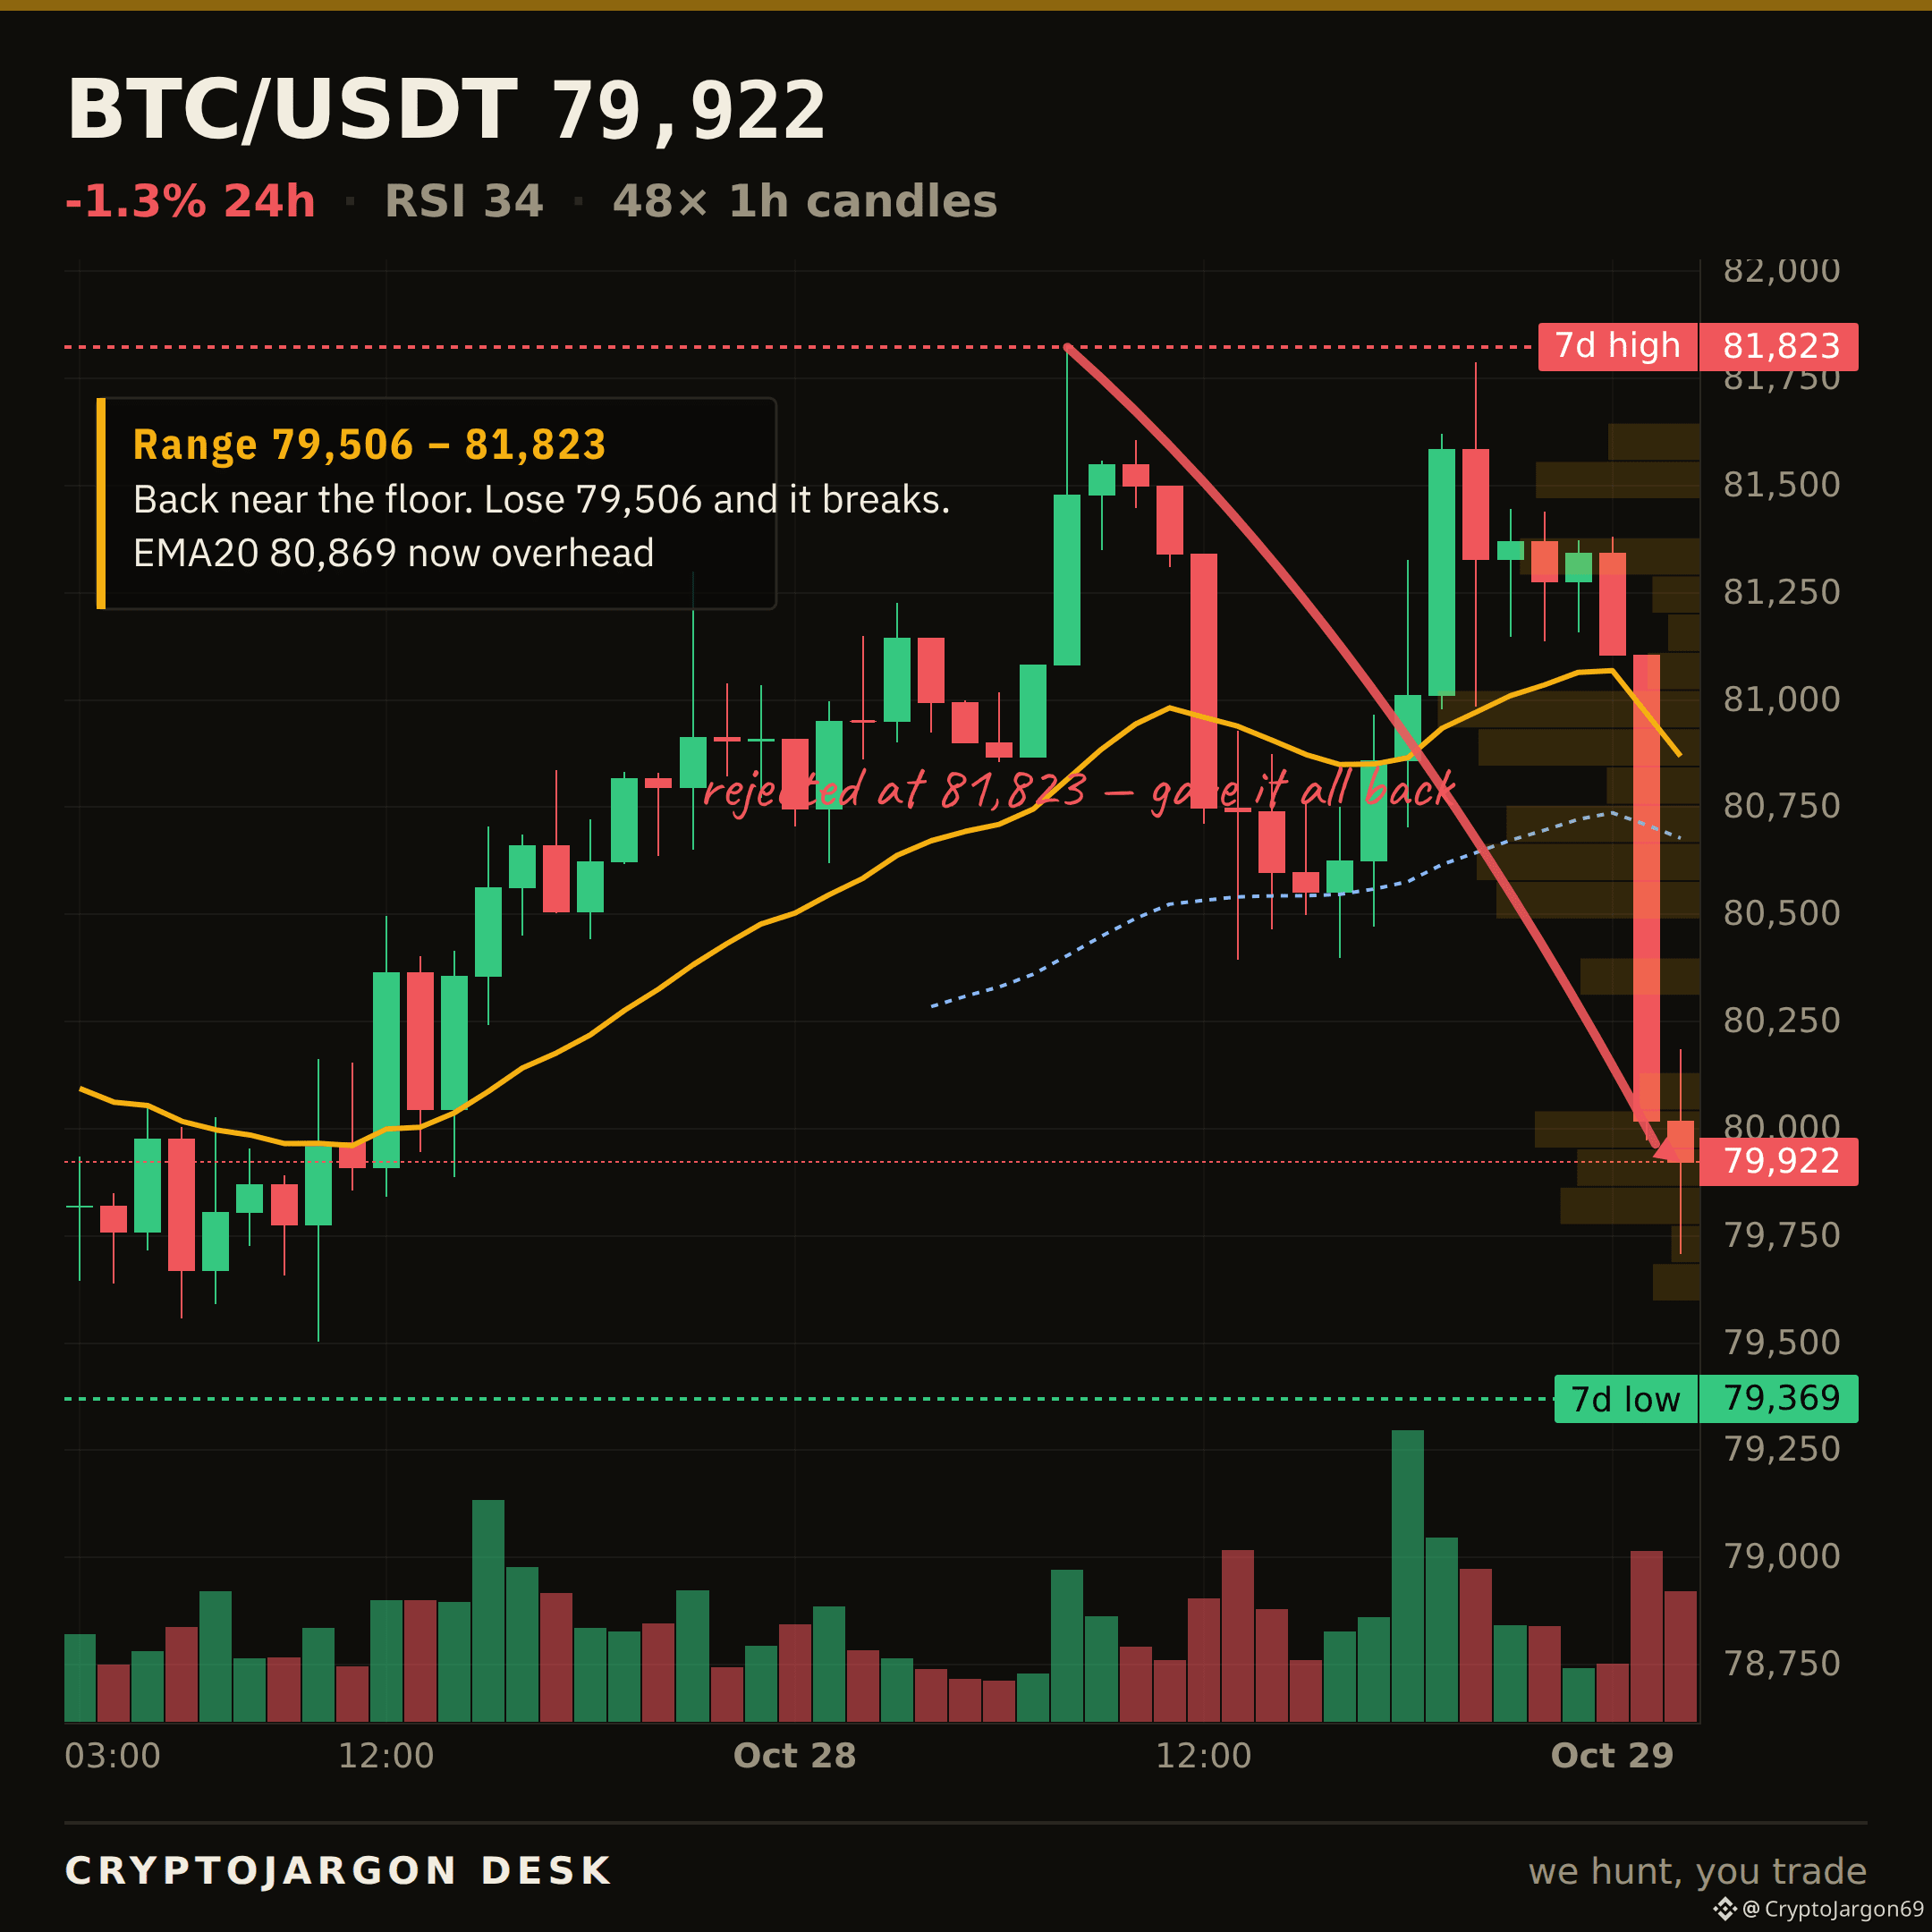
$BTC · THE LEVEL BROKE
That floor is gone.
$80,671 was the floor we flagged on $BTC. Price closed below it — $79,922 now. The range beneath opens up, and that line flips into the ceiling it has to win back.
Reclaim from here, or is this the start of the next leg down?
$BTC
$BTC · THE LEVEL BROKE
That floor is gone.
$80,671 was the floor we flagged on $BTC . Price closed below it — $79,922 now. The range beneath opens up, and that line flips into the ceiling it has to win back.
Reclaim from here, or is this the start of the next leg down?
$BTC
That floor is gone.
$80,671 was the floor we flagged on $BTC . Price closed below it — $79,922 now. The range beneath opens up, and that line flips into the ceiling it has to win back.
Reclaim from here, or is this the start of the next leg down?
$BTC
61
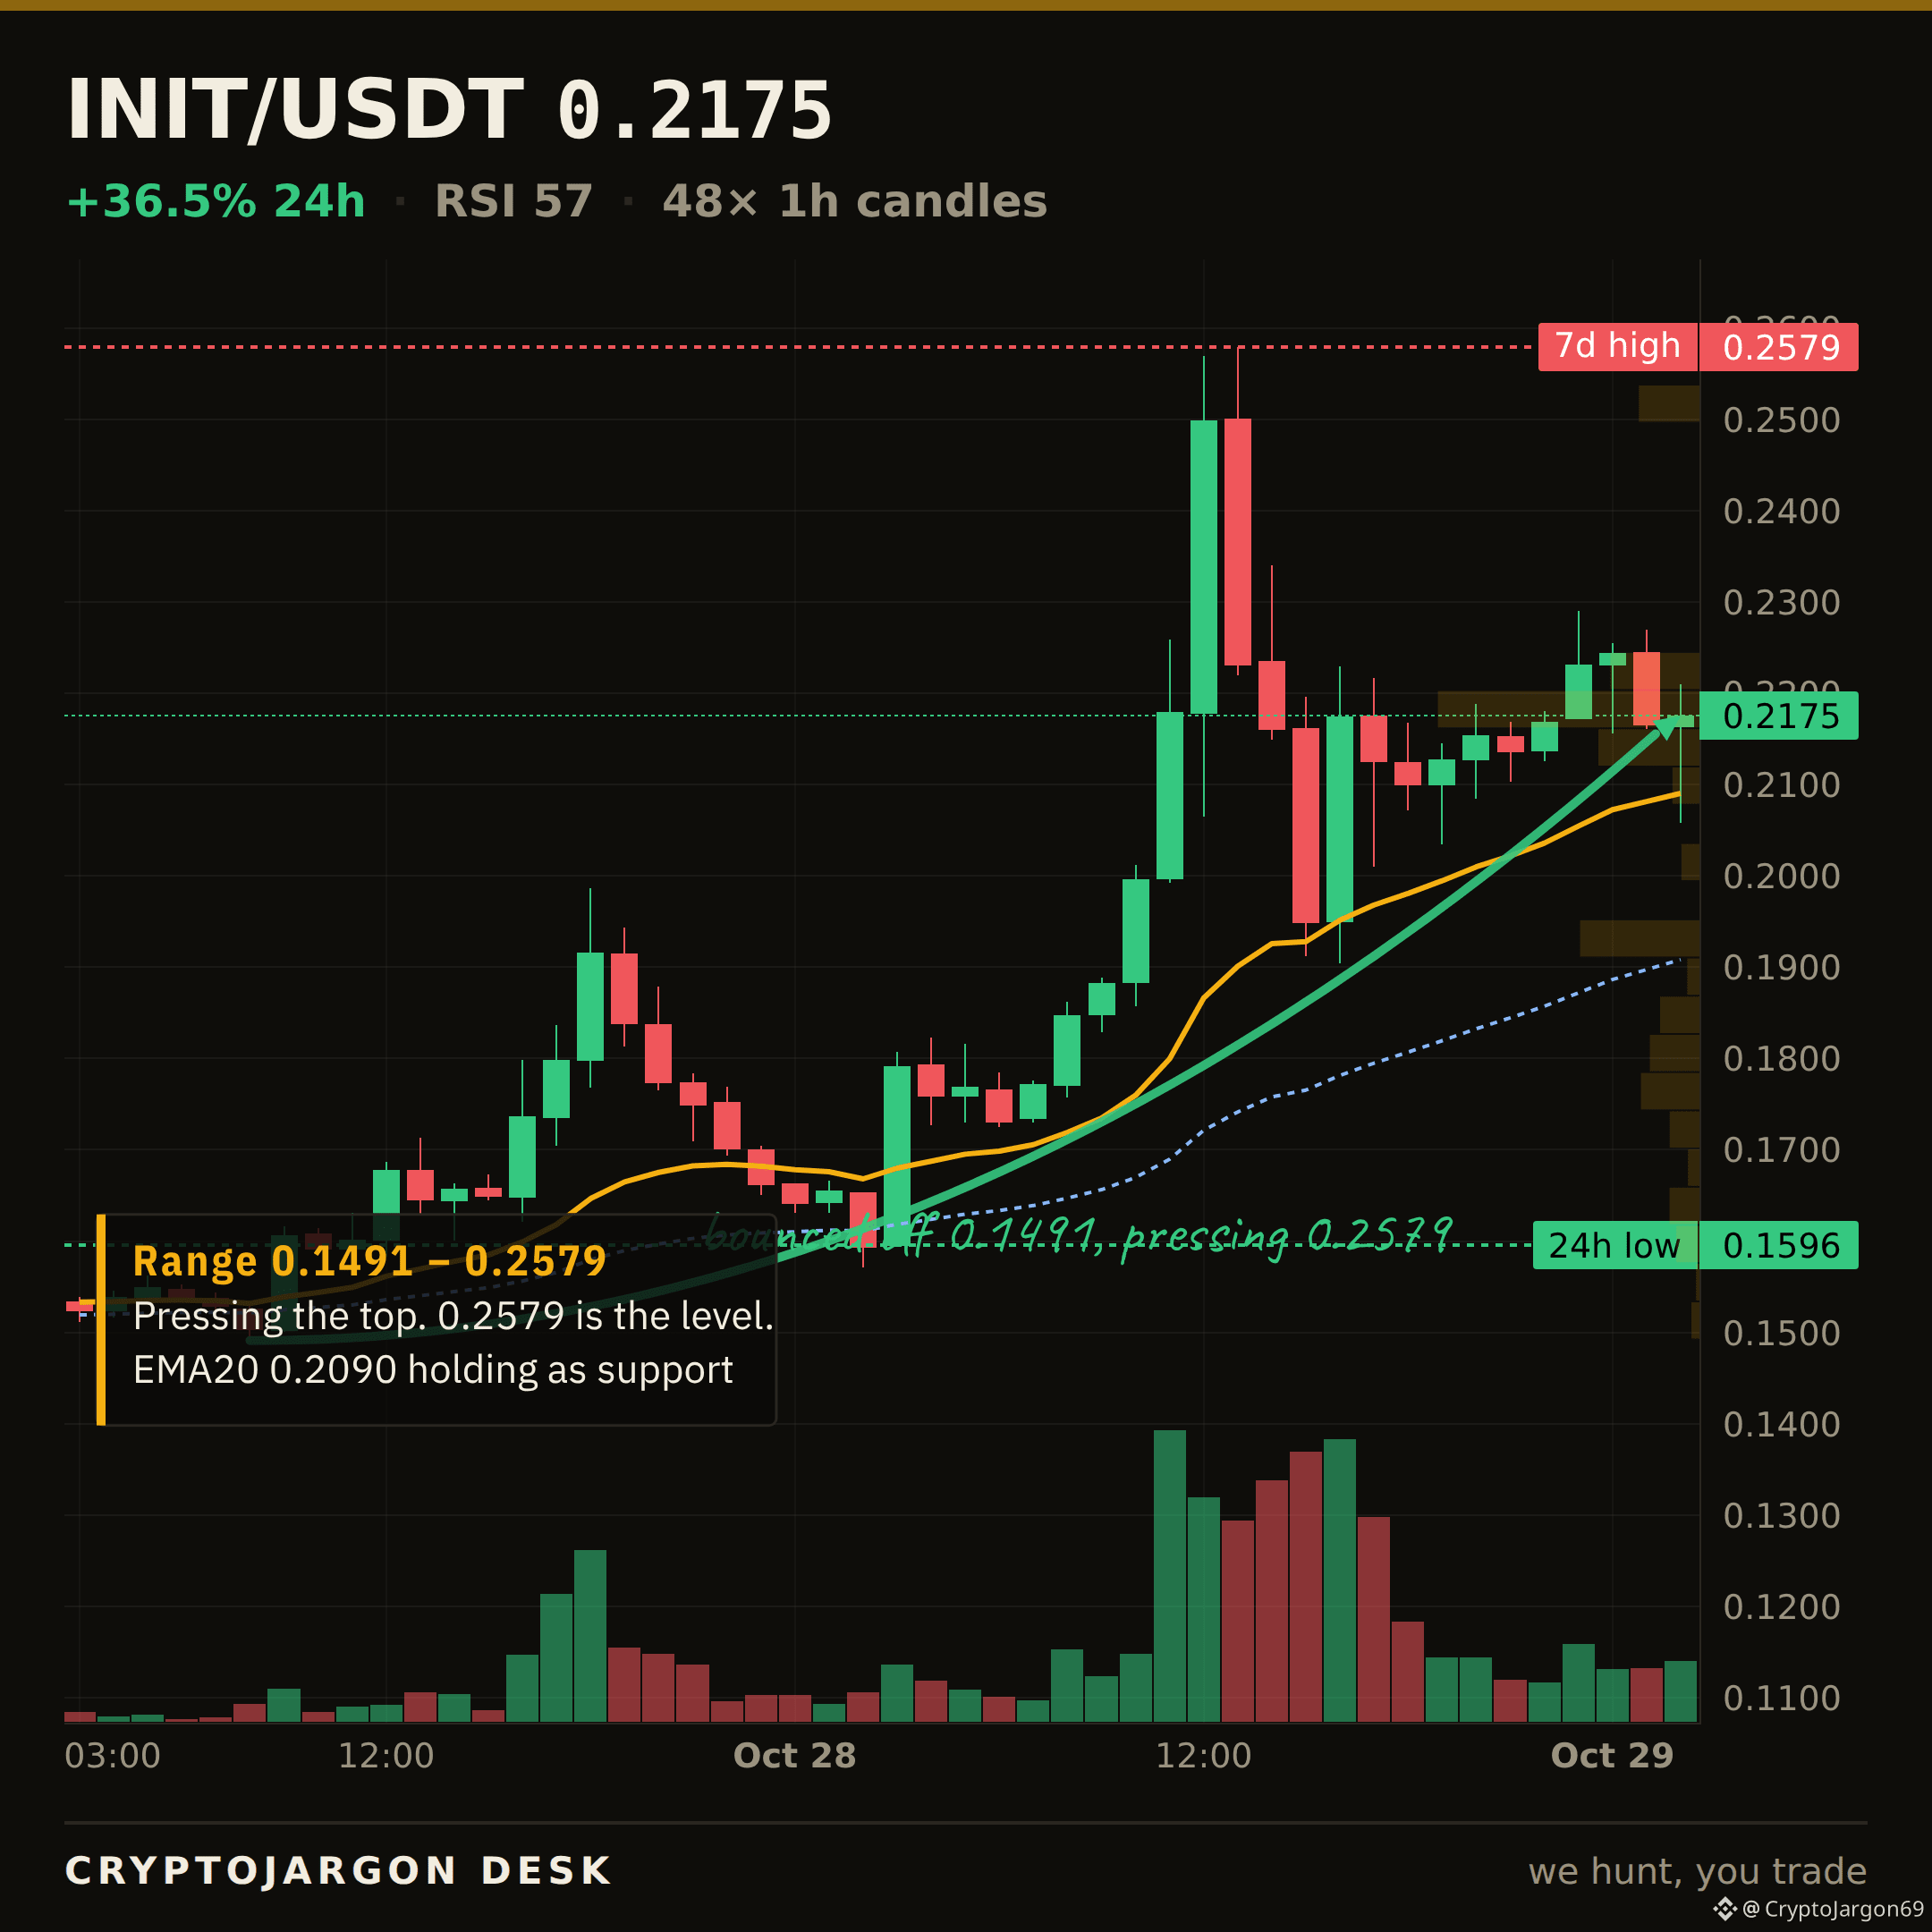
$INIT · MARKET STRUCTURE
$0.218, +36.5% on the day.
Trend — price above both EMAs, the 20 over the 50.
Momentum — RSI 57.
Range — 59% up its 24h range ($0.16–$0.258).
Trend, momentum and range mostly point the same way — an aligned tape to the upside.
Levels: $0.258 24h high (ceiling) · $0.16 24h low (support) · 7d range $0.113–$0.258.
Chart: 1H candles, EMA20/50 + levels marked. $INIT
87
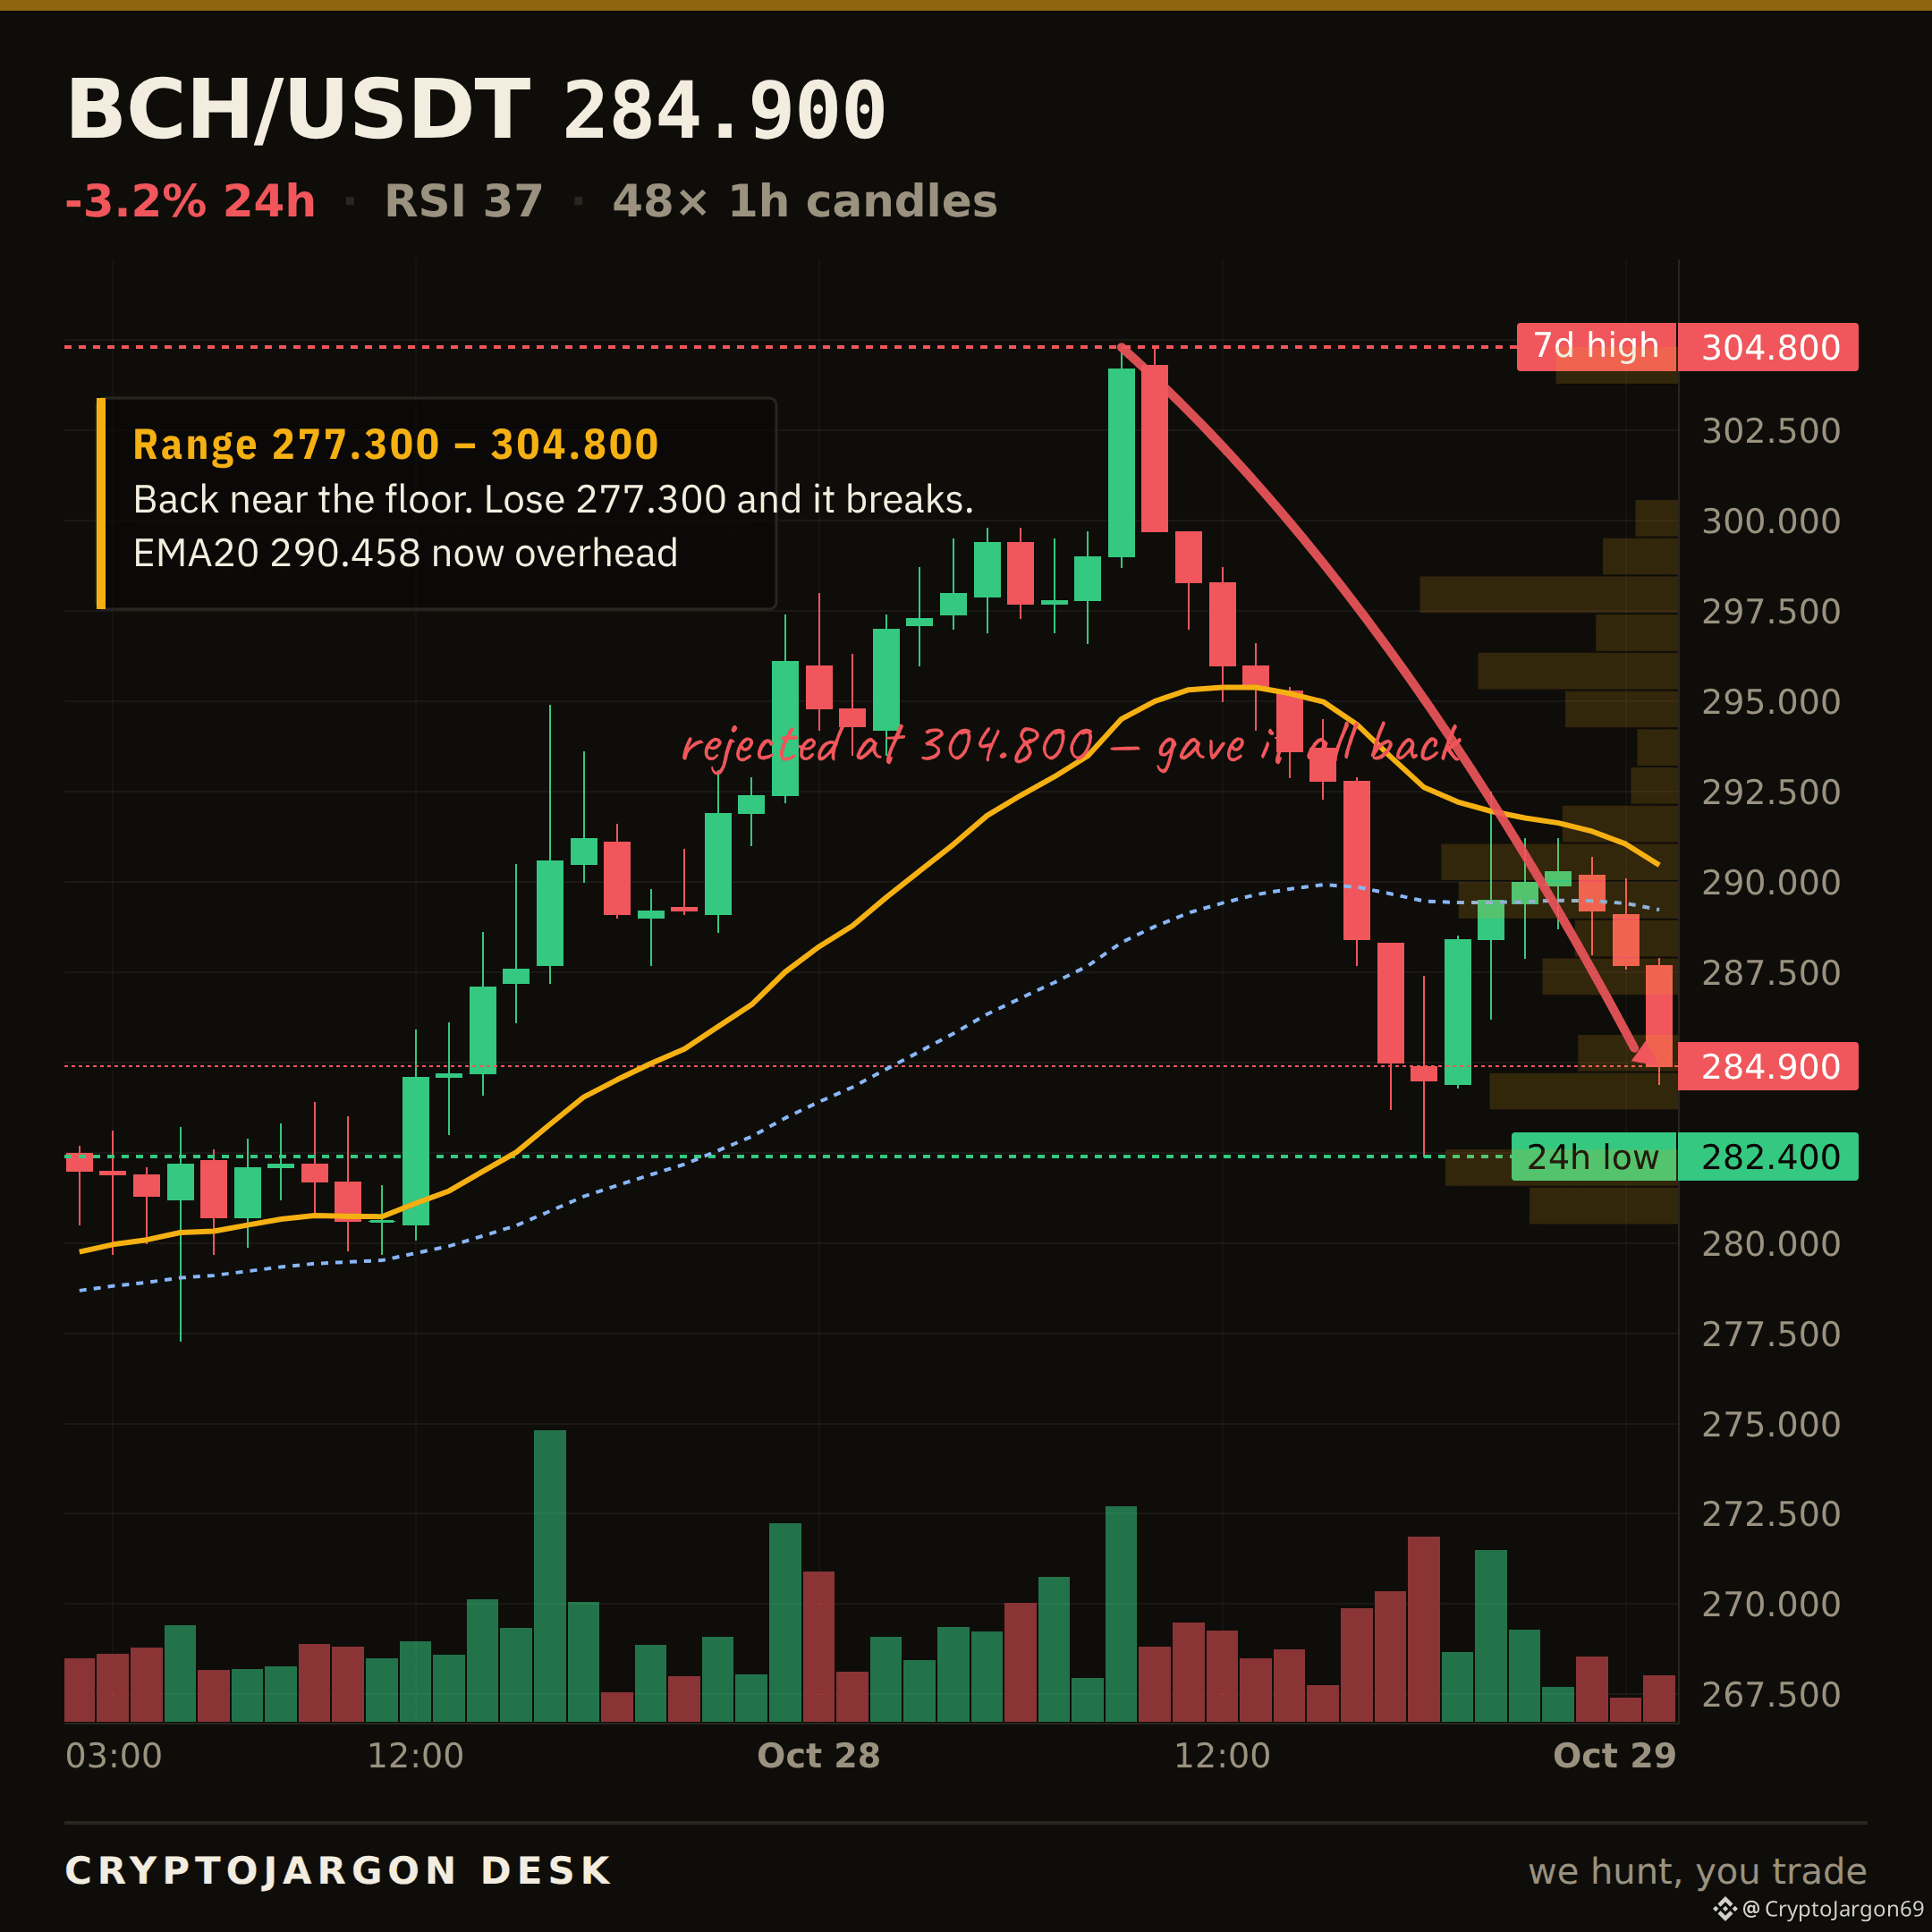
$BCH · LEVEL TO WATCH
$284.90 now.
The line that matters is $282.40 — the 24h low, the floor the tape is sitting on.
Holding $282.40 keeps the structure intact; a clean close below opens the range beneath it. I'll follow up when it resolves.
Chart: the level is on it. $BCH
$BCH · LEVEL TO WATCH
$284.90 now.
The line that matters is $282.40 — the 24h low, the floor the tape is sitting on.
Holding $282.40 keeps the structure intact; a clean close below opens the range beneath it. I'll follow up when it resolves.
Chart: the level is on it. $BCH
$284.90 now.
The line that matters is $282.40 — the 24h low, the floor the tape is sitting on.
Holding $282.40 keeps the structure intact; a clean close below opens the range beneath it. I'll follow up when it resolves.
Chart: the level is on it. $BCH
100
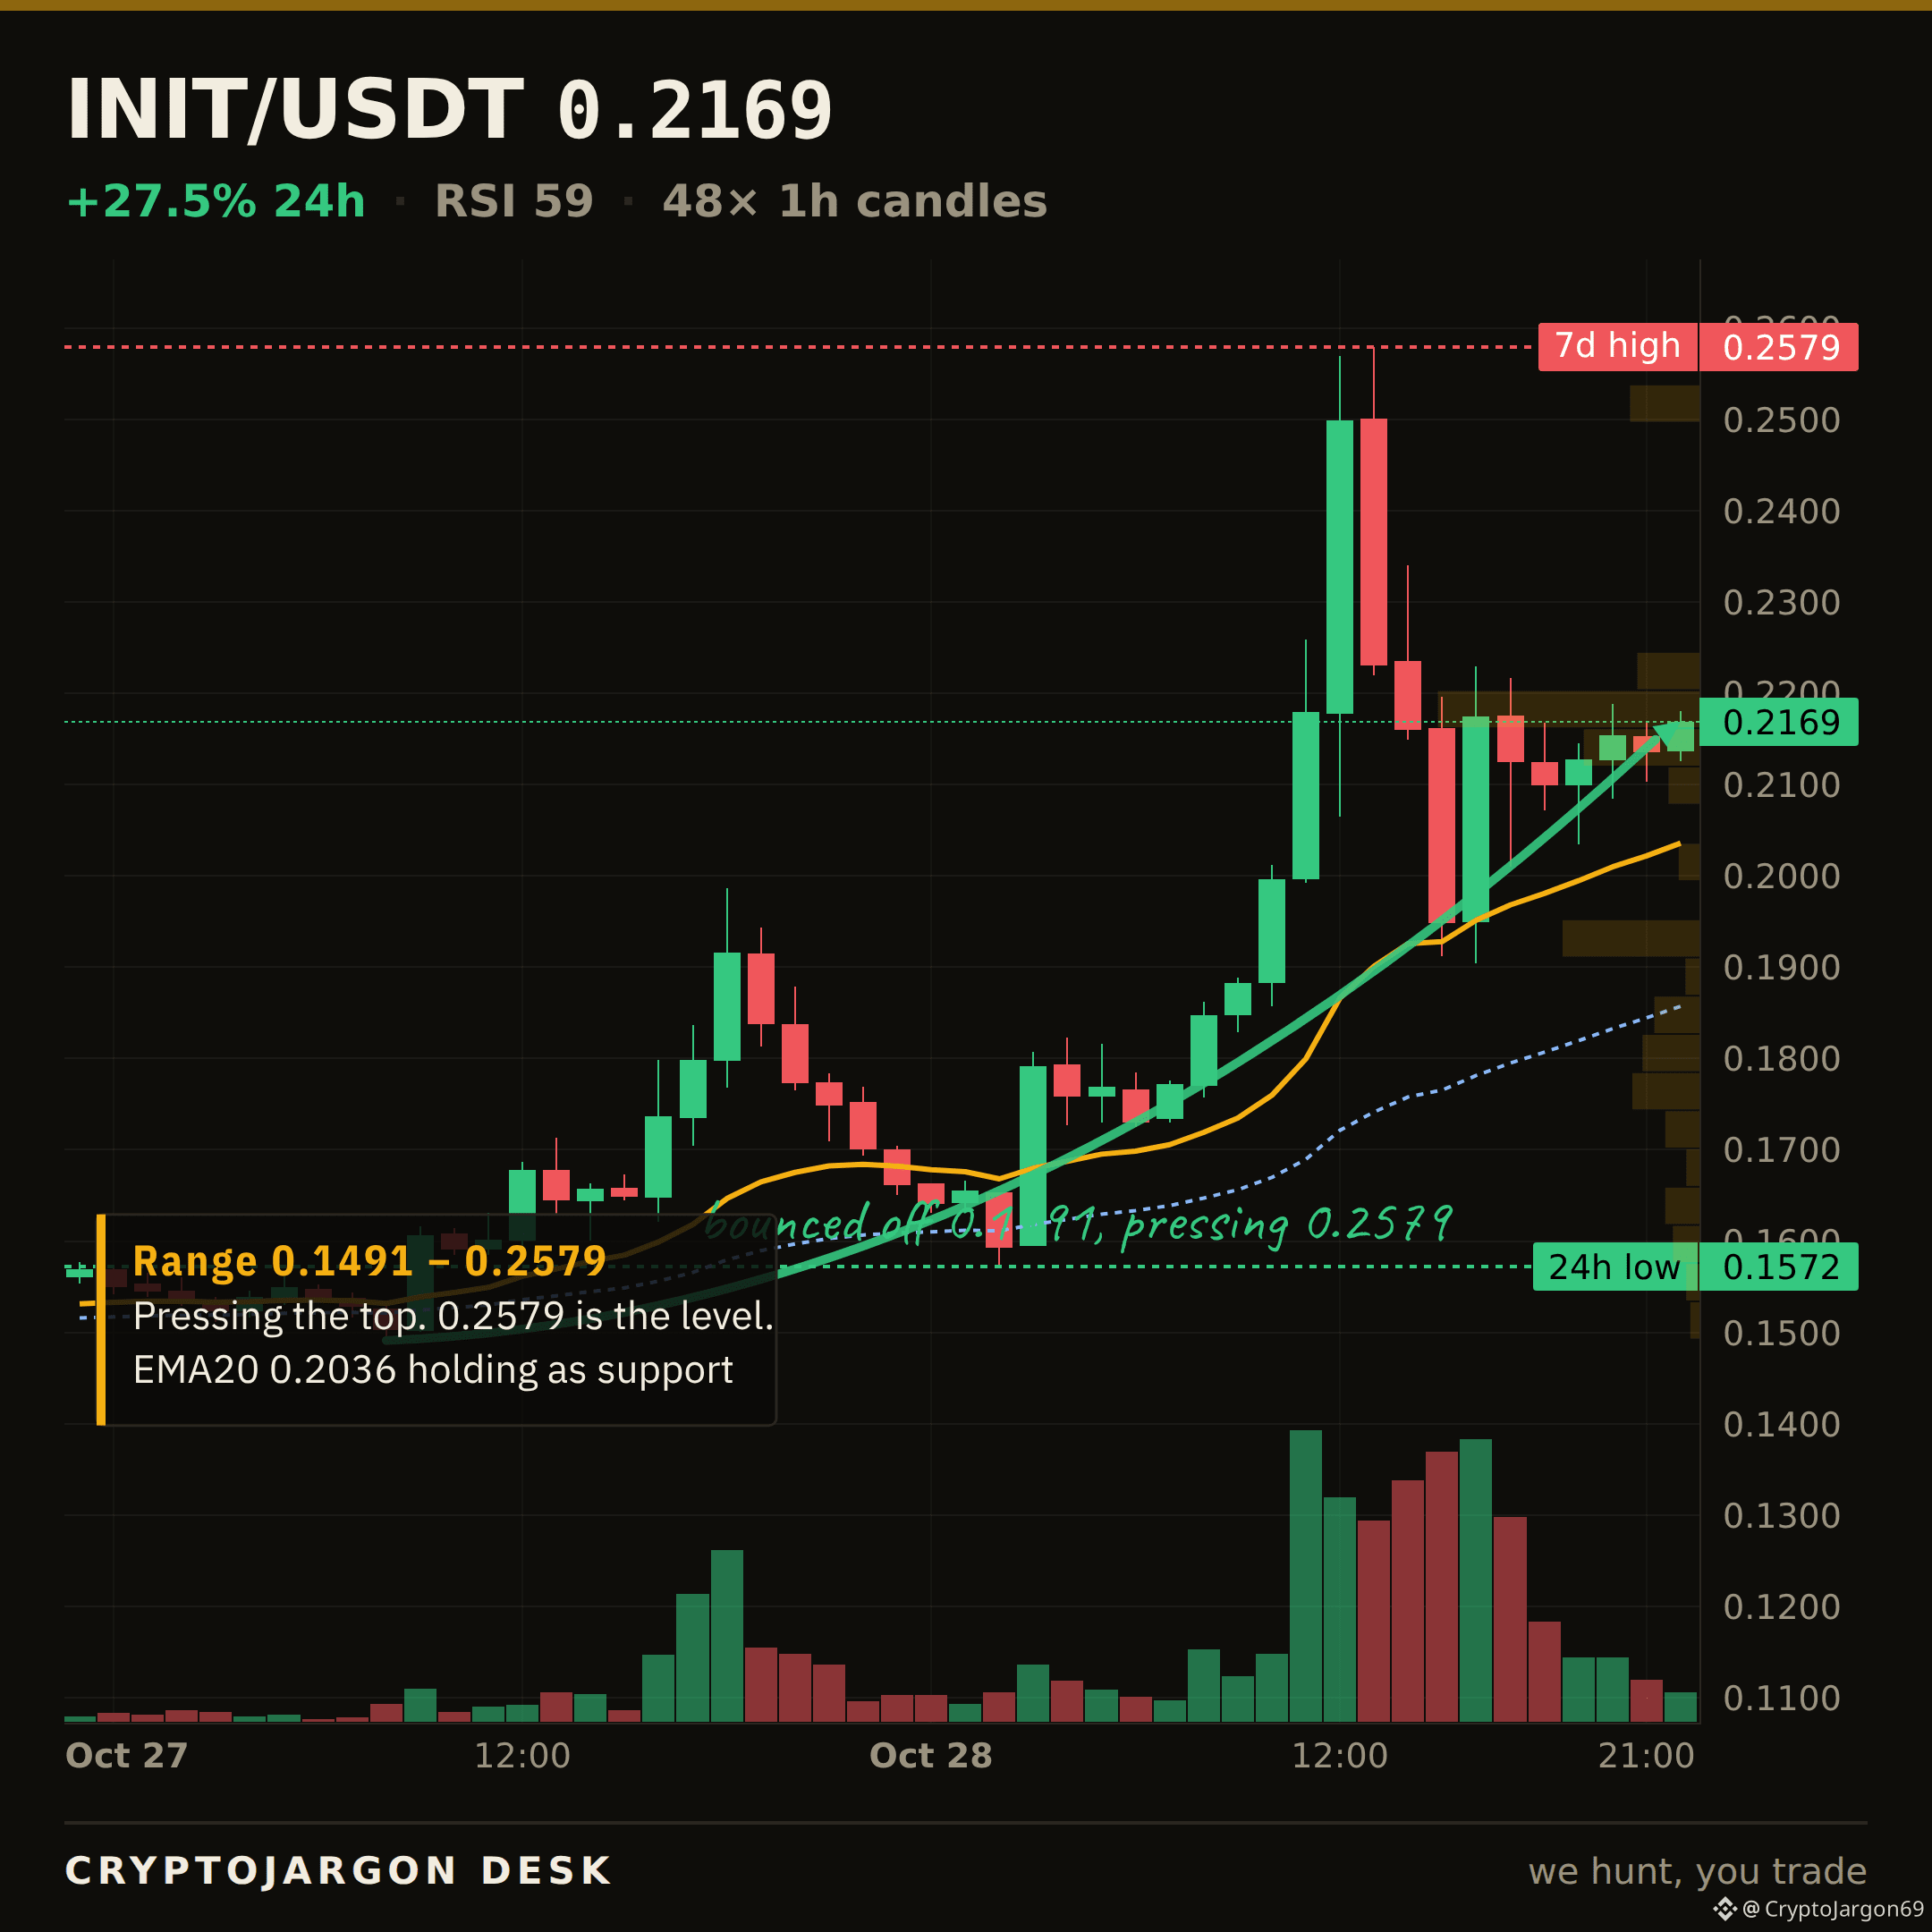
INIT ran +25.9% today but gave most of it back from the 0.258 high.
The candle shows a long upper wick on $19M of volume. That's a lot of supply showing up at the top of the 7-day range. For now, price is holding the EMA20 at 0.204.
This looks like a classic rejection. The momentum from the last 24 hours just hit a wall of sellers.
Is this a healthy pullback to buy before the next leg, or was that wick the exit liquidity?
$INIT
Follow for the next read — posted the moment the tape moves.
41
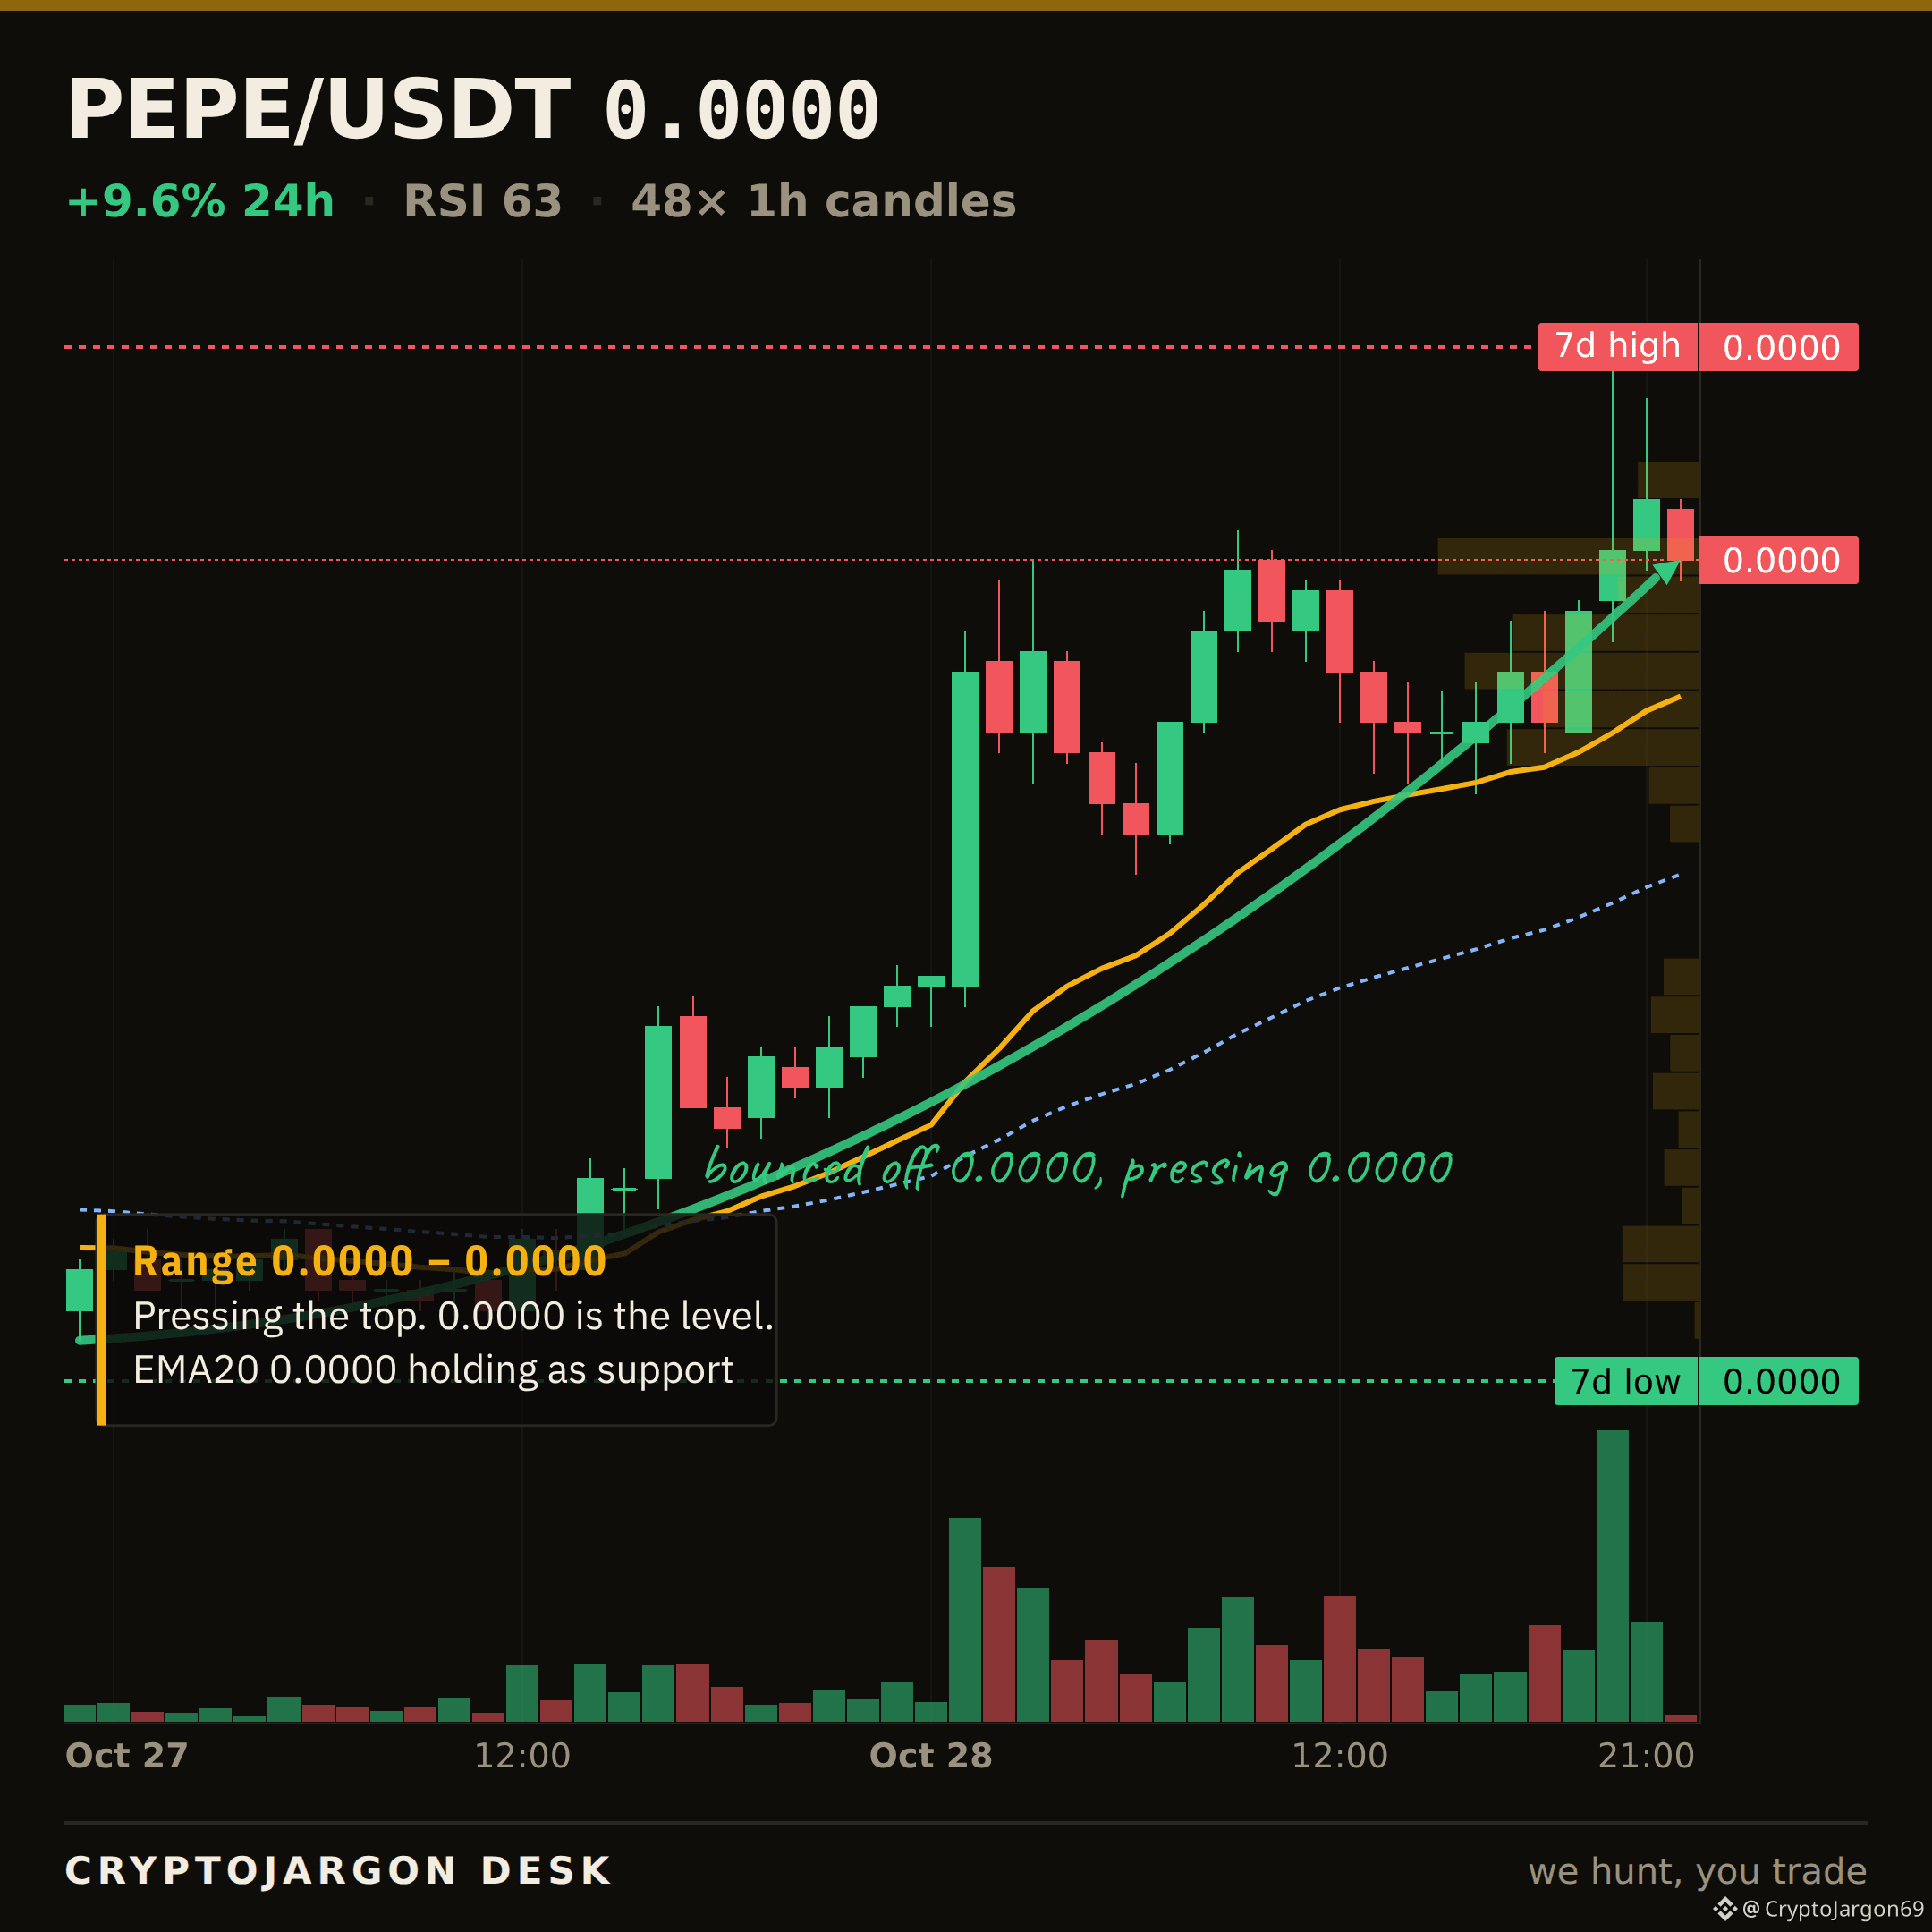
That's an 11.3% move on PEPE, pushing right into the 7-day high at 0.00000523.
The tape is holding above its short-term moving averages, but 24h volume is only $113M. People are calling this a spillover from the Asian chip rally. We're not seeing it. The broader market is neutral, with Fear & Greed at 51. This looks like a coin-specific test, not a macro tide lifting all boats.
So is this a clean breakout, or are they just running stops above the range?
$PEPE #PEPE
We post through the day, every day. Follow if this is useful.
46
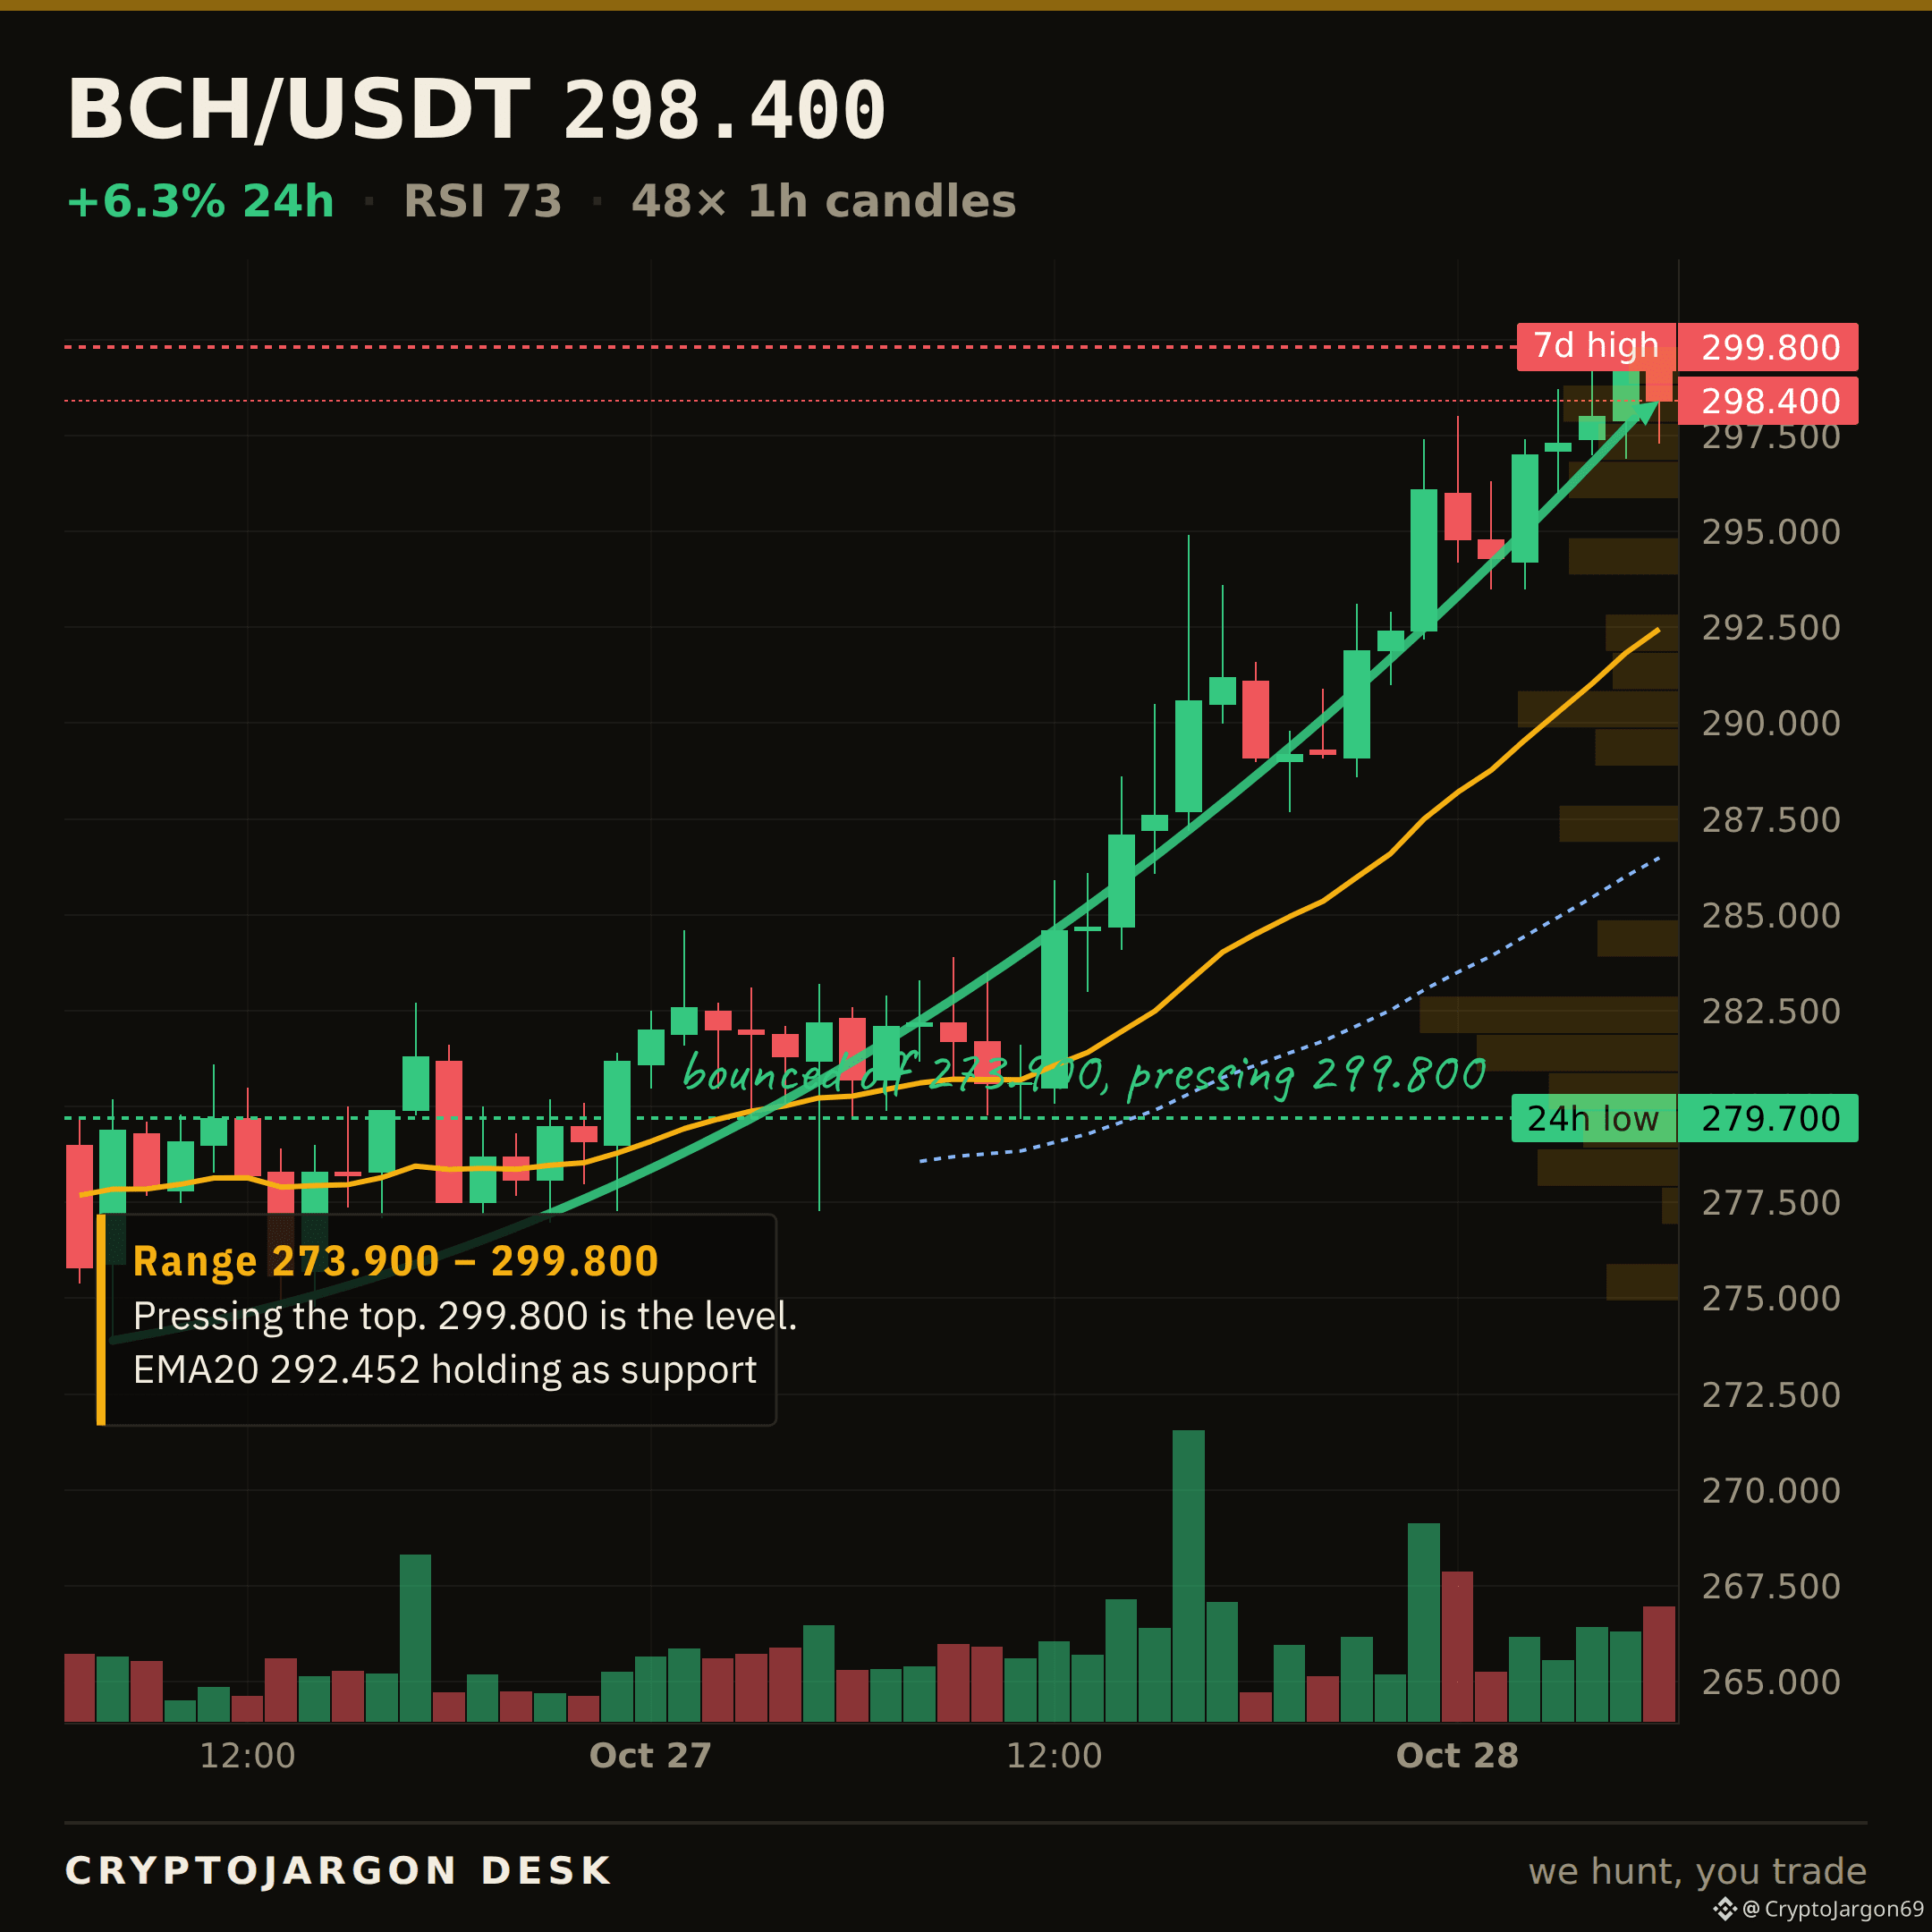
$BCH · THE LEVEL CLEARED
That ceiling is gone.
$298.00 was the ceiling we flagged on $BCH. Price closed back above it — $298.40 now. It flips into the floor that has to hold, and the upper range is open while it does.
Does $298.00 hold as support now, or is this a fakeout?
$BCH
$BCH · THE LEVEL CLEARED
That ceiling is gone.
$298.00 was the ceiling we flagged on $BCH . Price closed back above it — $298.40 now. It flips into the floor that has to hold, and the upper range is open while it does.
Does $298.00 hold as support now, or is this a fakeout?
$BCH
That ceiling is gone.
$298.00 was the ceiling we flagged on $BCH . Price closed back above it — $298.40 now. It flips into the floor that has to hold, and the upper range is open while it does.
Does $298.00 hold as support now, or is this a fakeout?
$BCH
120
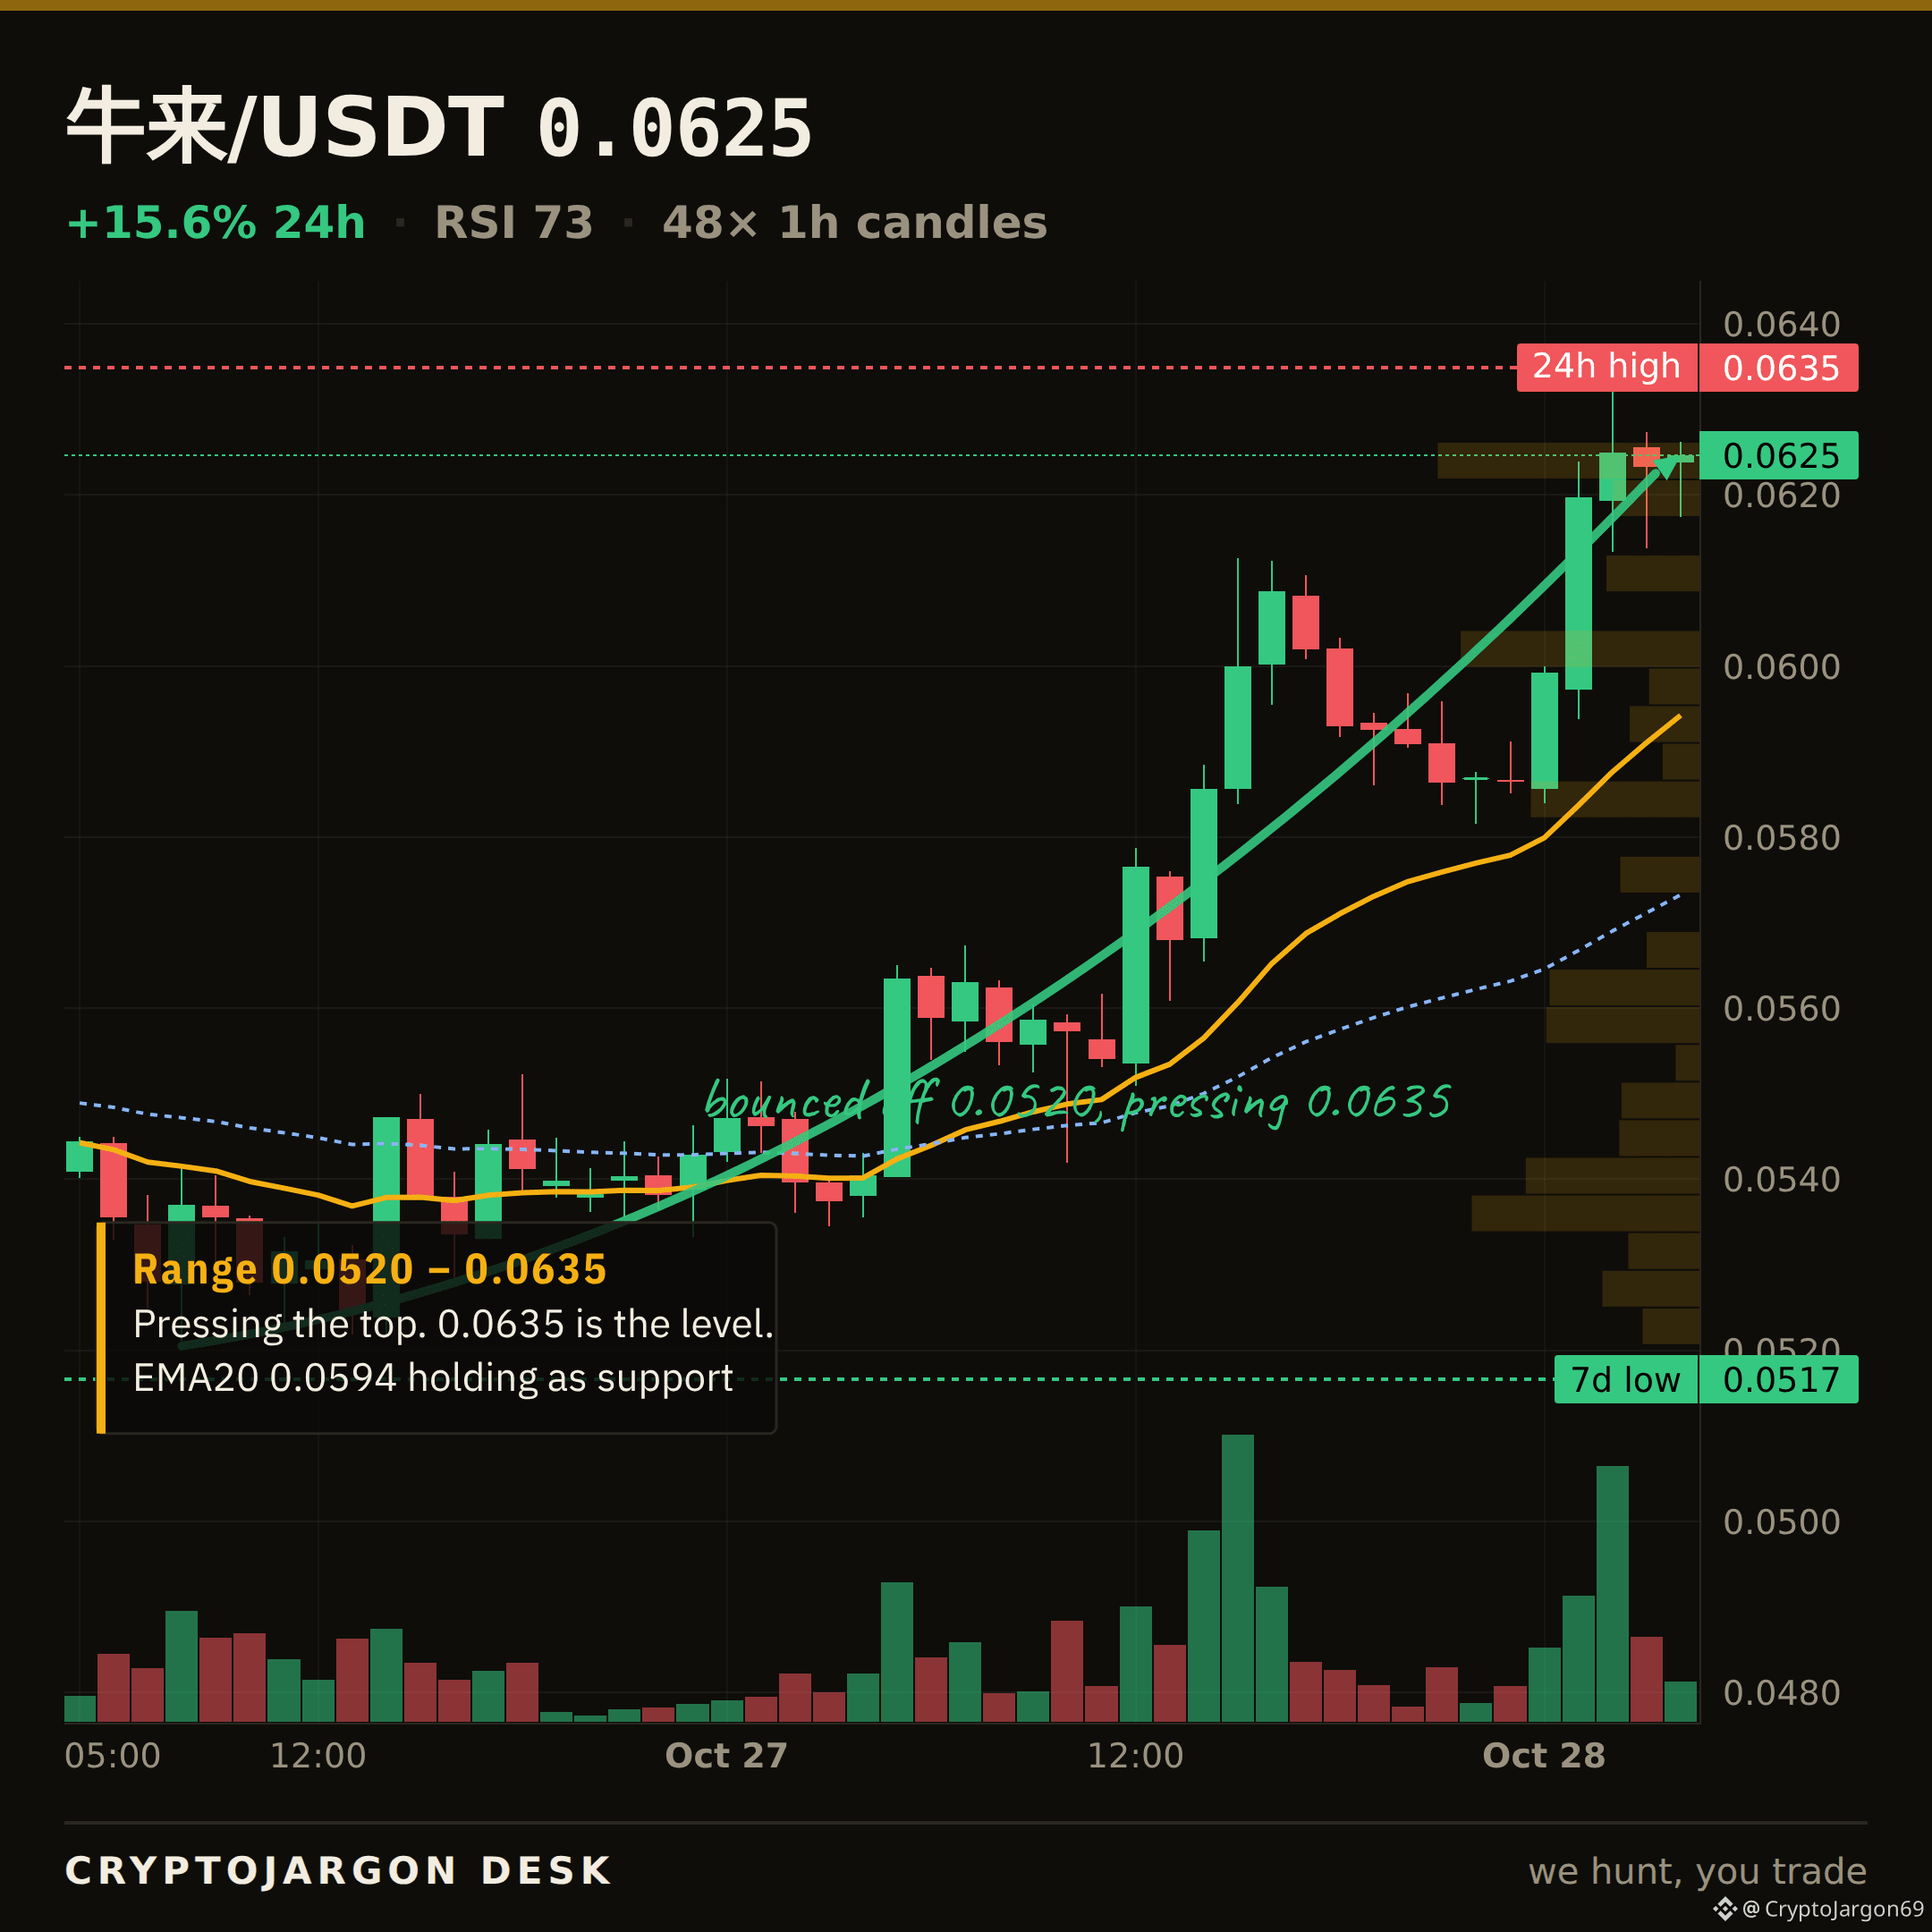
$牛来 · MARKET STRUCTURE
$0.0625, +15.6% on the day.
Trend — price above both EMAs, the 20 over the 50.
Momentum — RSI 73.
Range — 89% up its 24h range ($0.054–$0.0635).
Trend, momentum and range mostly point the same way — an aligned tape to the upside.
Levels: $0.0635 24h high (ceiling) · $0.054 24h low (support) · 7d range $0.0517–$0.0648.
Chart: 1H candles, EMA20/50 + levels marked. $牛来
41
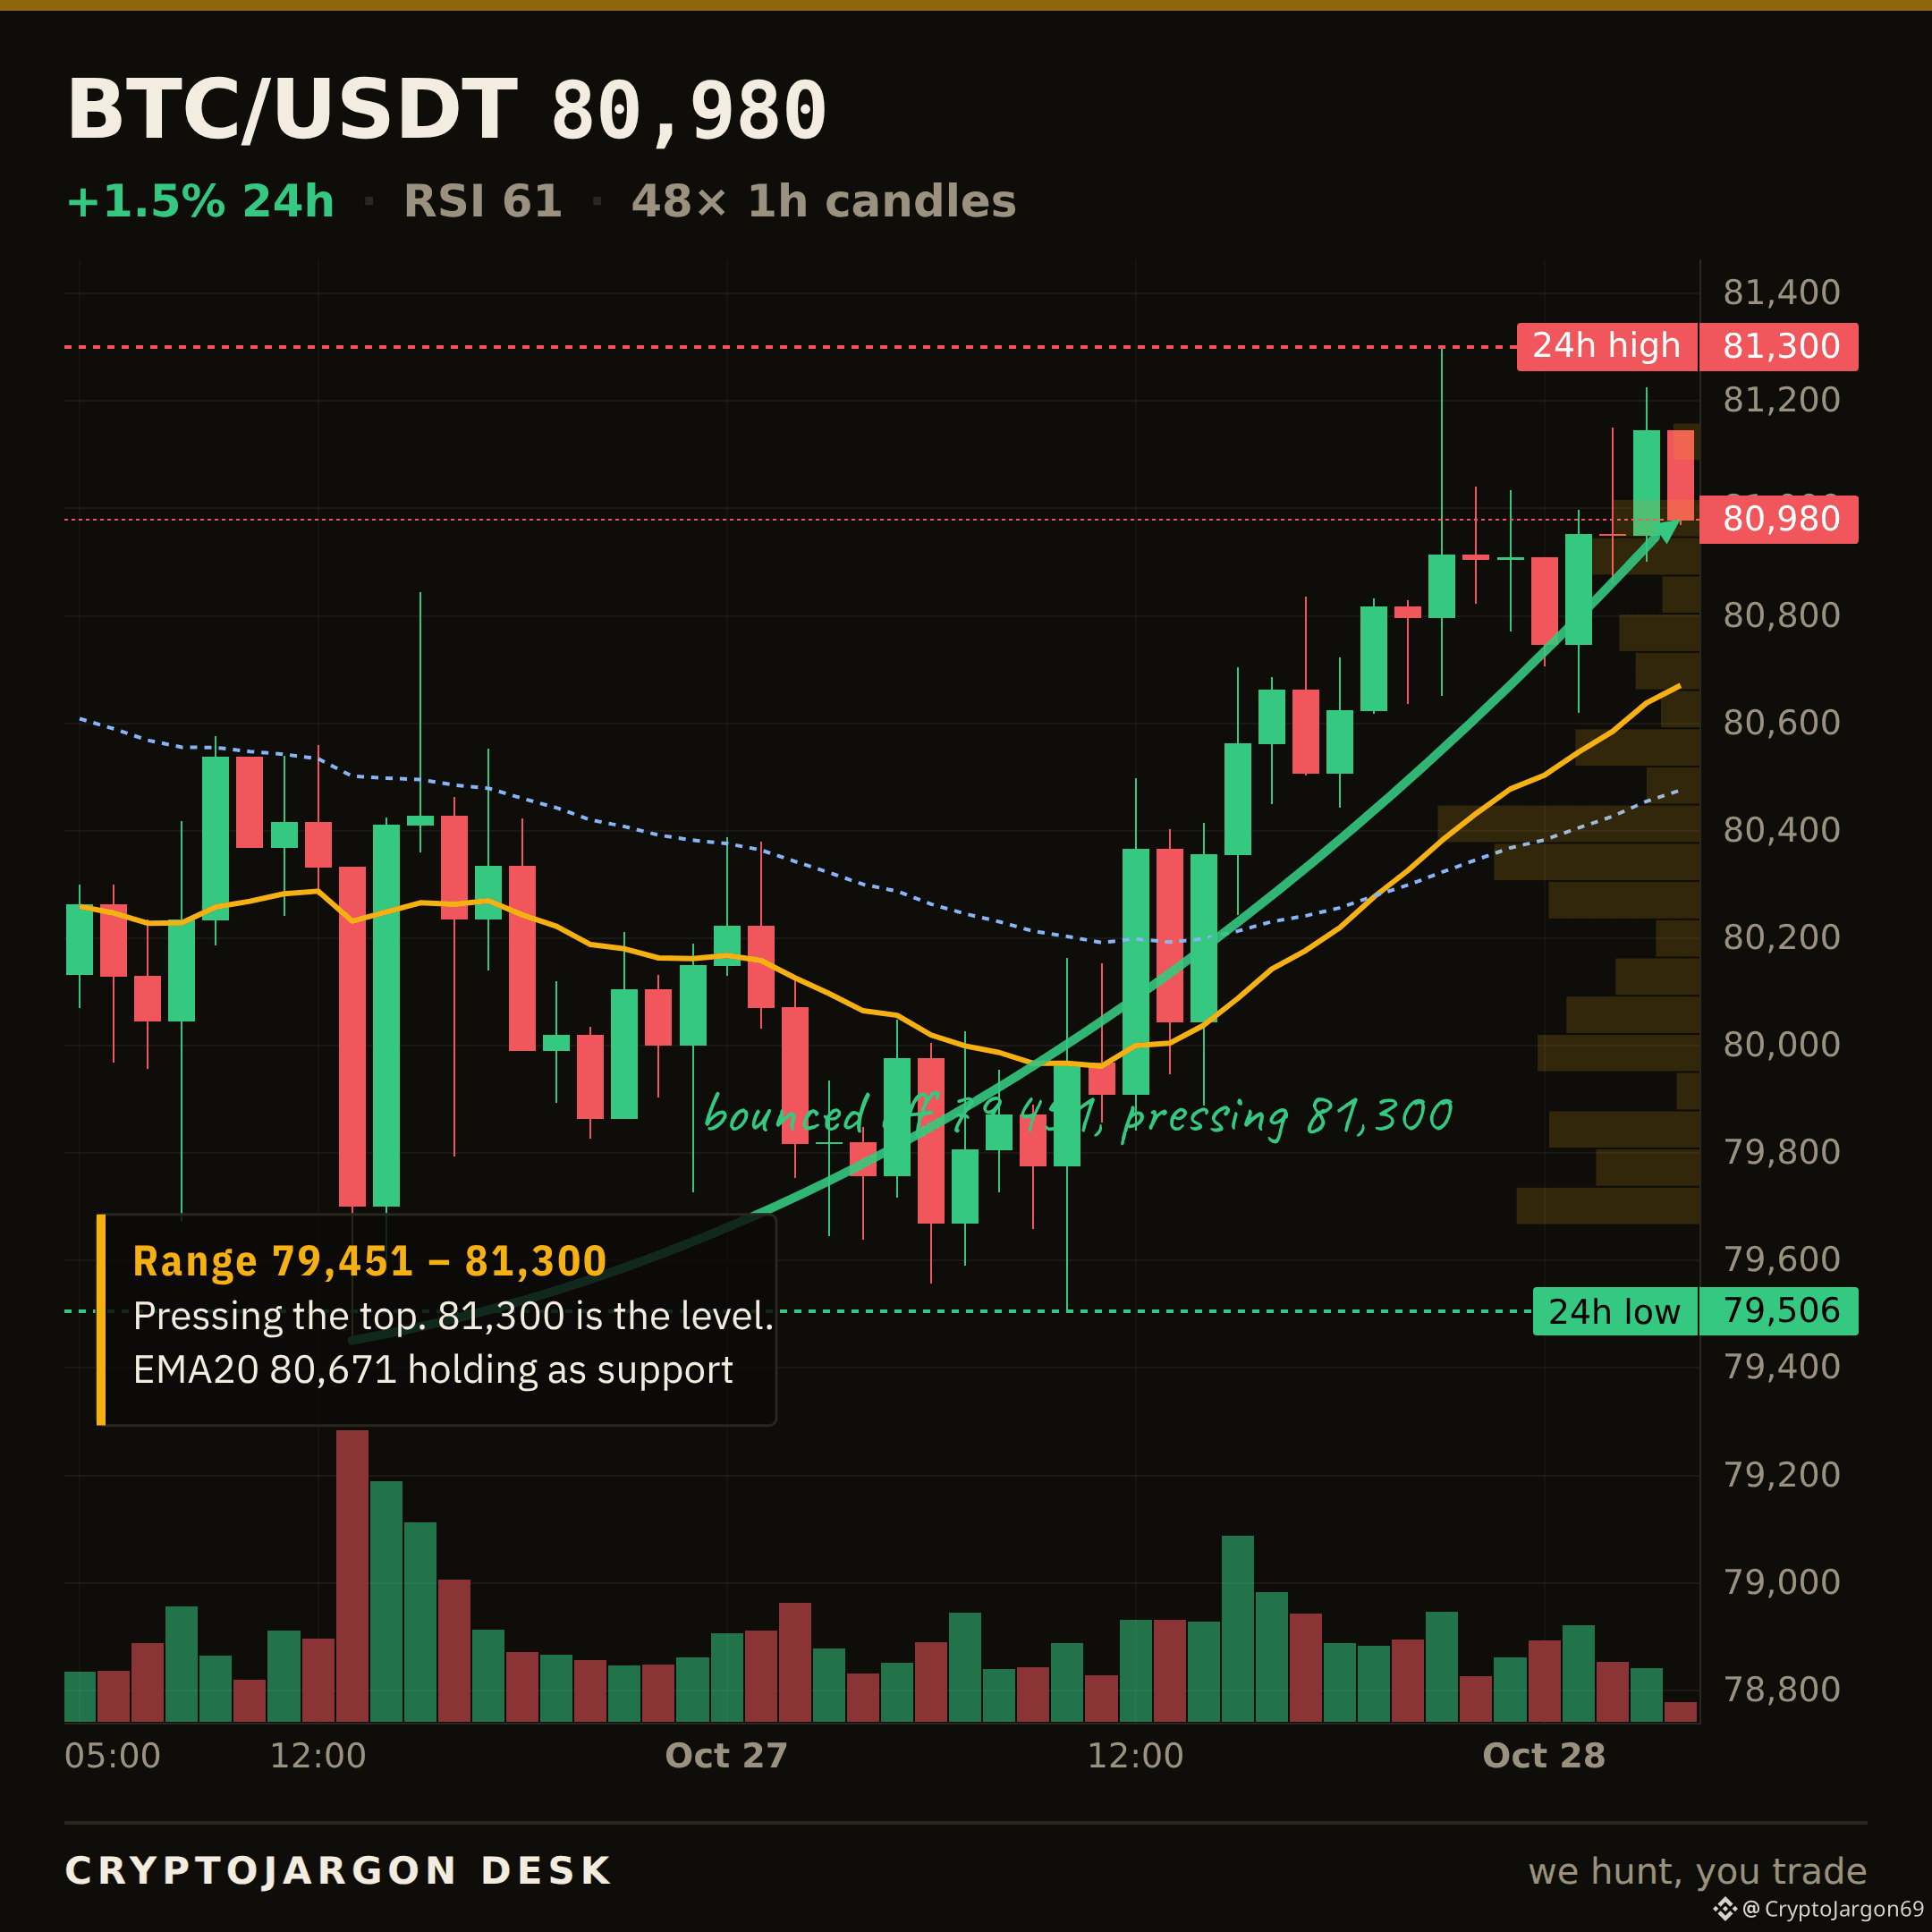
$BTC · LEVEL TO WATCH
$80,980 now.
The line that matters is $80,671 — the 20-EMA, the floor the tape is sitting on. It lines up with the 50-EMA too — a spot several things share.
Holding $80,671 keeps the structure intact; a clean close below opens the range beneath it. I'll follow up when it resolves.
Chart: the level is on it. $BTC
46
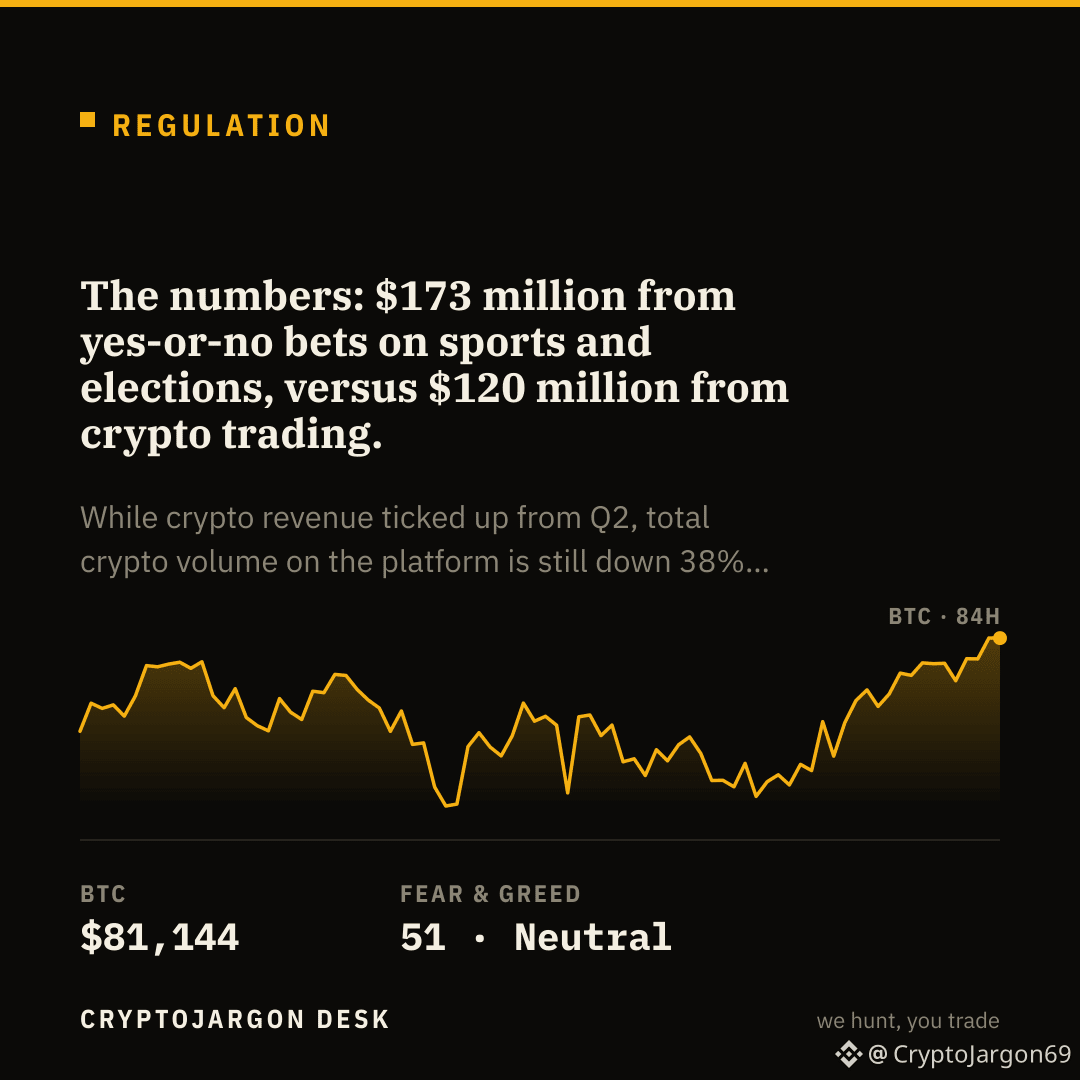
For the second quarter in a row, Robinhood made more money from prediction markets than from crypto.
The numbers: $173 million from yes-or-no bets on sports and elections, versus $120 million from crypto trading. While crypto revenue ticked up from Q2, total crypto volume on the platform is still down 38% from a year earlier.
This is a clean read on the retail mindset. The CEO called it a "prediction market supercycle," and the data is proving him right. The average user is reaching for a simple, binary bet, not for a complex crypto asset. It suggests the easiest-to-understand product wins, not necessarily the most technically advanced one.
Is the real retail 'supercycle' in simple yes/no bets, not crypto?
$BTC
New reads post through the day. Follow so you don't miss the next one.
44
Article
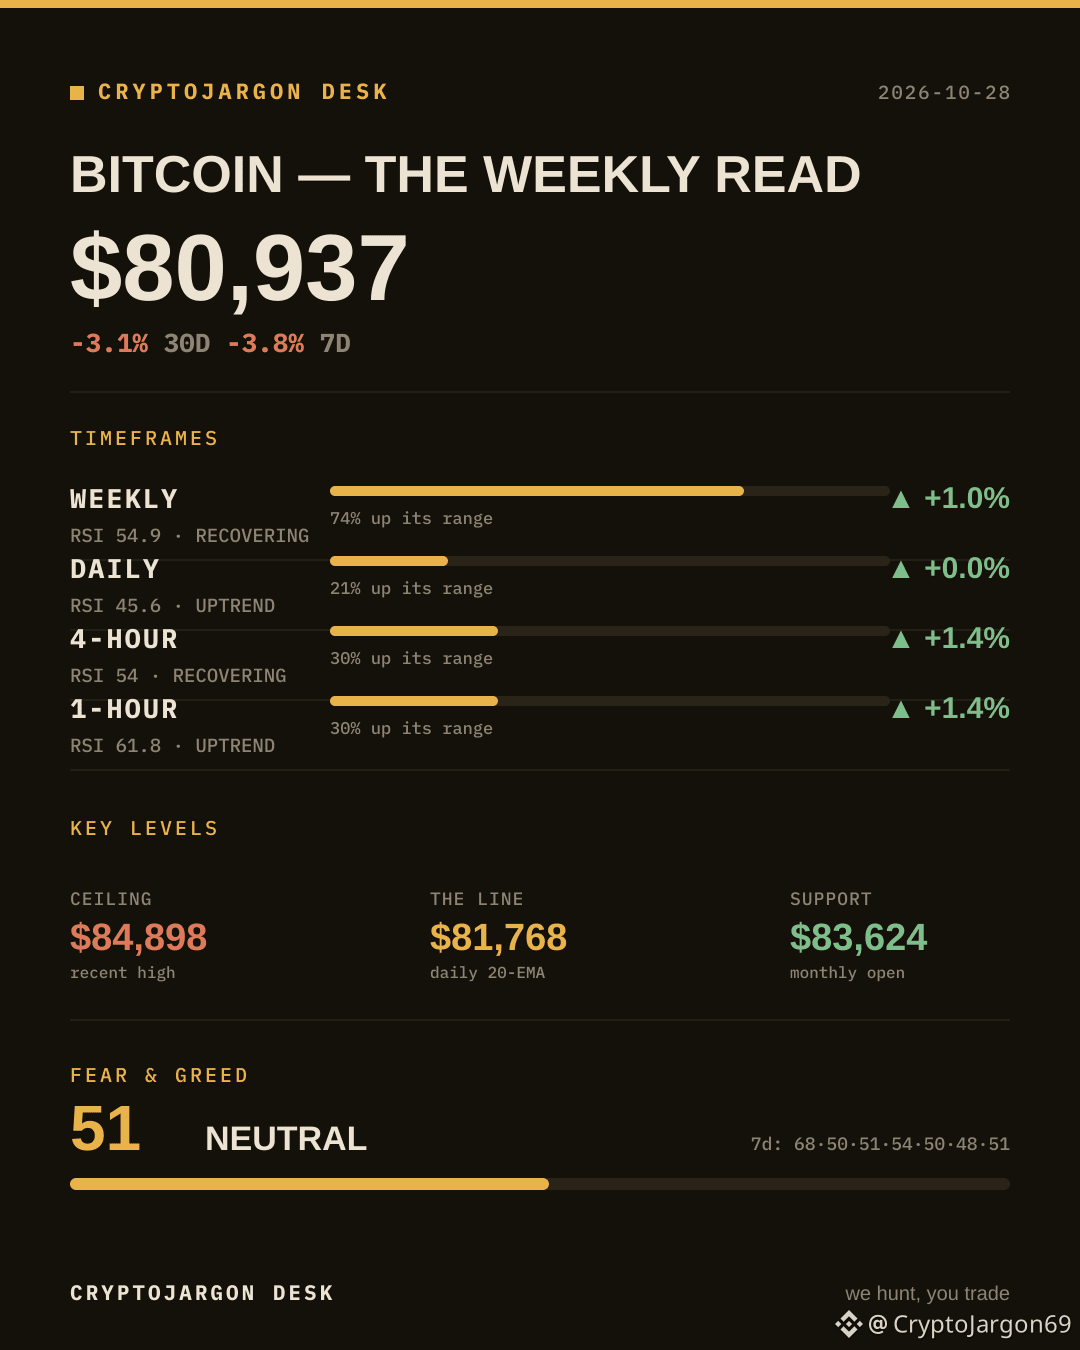
Bitcoin: The Weekly Read — Every Timeframe on One MapBitcoin sits at $80,937 after a slide that has it 3.1% lower over thirty days and -3.8% on the week. Fear & Greed reads 51 (Neutral). Here is what every timeframe is actually saying, top down.
THE 30-DAY / 7-DAY FRAME
-3.1% over thirty days, -3.8% on the week. The month is the trend; the week is the noise around it. Keep both in view — the higher timeframes carry the weight, the lower ones carry the swings.
THE MACRO BACKDROP
This week's sentiment is shaped by conflicting narratives of institutional integration and persistent risk. On the adoption front, a new diversified ETF blended Bitcoin with traditional assets, while a potential U.S. Treasury official framed crypto as a tool for dollar dominance. Conversely, headwinds persist from broader macro uncertainty, highlighted by significant losses in Chinese equity markets, alongside ongoing concerns about long-term technological threats and immediate hardware security vulnerabilities that continue to surface within the ecosystem.
WEEKLY
RSI 54.9 — neutral. The trend here reads recovering: price is above the 20-EMA ($77,137) and above the 50-EMA ($80,441), with the 20 still under the 50. It is sitting 74% up its range ($62,535–$87,396); the last closed candle came on a light 0.84x its average volume. On the weekly, the $80,441 50-EMA is the line the longer trend pivots on.
DAILY
RSI 45.6 — neutral. The trend here reads uptrend: price is below the 20-EMA ($81,768) and above the 50-EMA ($80,781), with the 20 leading the 50. It is sitting 21% up its range ($79,221–$87,220). The daily is the structure that matters most for the swing.
4-HOUR
RSI 54 — neutral. The trend here reads recovering: price is above the 20-EMA ($80,544) and below the 50-EMA ($81,016), with the 20 still under the 50. It is sitting 30% up its range ($79,221–$84,898). This is where the intraday chop lives.
1-HOUR
RSI 61.8 — firm, with room. The trend here reads uptrend: price is above the 20-EMA ($80,619) and above the 50-EMA ($80,416), with the 20 leading the 50. It is sitting 30% up its range ($79,221–$84,898); the last closed candle came on a light 0.67x its average volume. Shortest-term, this is momentum, not trend — treat it as timing, not direction.
THE LEVELS THAT MATTER
$84,898 — the recent high, the ceiling to clear.
$81,768 — the daily 20-EMA, the line price is riding. Hold above it and the trend is fine; lose it and momentum shifts.
$83,624 — the monthly open, the first real support below. Lose it and the $79,221 area comes into play.
SENTIMENT
Fear & Greed at 51 (Neutral), tracing 68, 50, 51, 54, 50, 48, 51 across the week. Sentiment is middling — no extreme to fade.
THE SYNTHESIS
Top to bottom, this is an aligned uptrend — the daily leads and the lower frames are following, not fighting it. The trend gets the benefit of the doubt while $83,624 holds as support.
For now: watch $81,768 on the way down and $84,898 on the way up. Everything in between is range.
Where are you leaning from here — continuation, or a retest of $83,624?
$BTC
Bitcoin: The Weekly Read — Every Timeframe on One Map
Bitcoin sits at $80,937 after a slide that has it 3.1% lower over thirty days and -3.8% on the week. Fear & Greed reads 51 (Neutral). Here is what every timeframe is actually saying, top down.
THE 30-DAY / 7-DAY FRAME
-3.1% over thirty days, -3.8% on the week. The month is the trend; the week is the noise around it. Keep both in view — the higher timeframes carry the weight, the lower ones carry the swings.
THE MACRO BACKDROP
This week's sentiment is shaped by conflicting narratives of institutional integration and persistent risk. On the adoption front, a new diversified ETF blended Bitcoin with traditional assets, while a potential U.S. Treasury official framed crypto as a tool for dollar dominance. Conversely, headwinds persist from broader macro uncertainty, highlighted by significant losses in Chinese equity markets, alongside ongoing concerns about long-term technological threats and immediate hardware security vulnerabilities that continue to surface within the ecosystem.
WEEKLY
RSI 54.9 — neutral. The trend here reads recovering: price is above the 20-EMA ($77,137) and above the 50-EMA ($80,441), with the 20 still under the 50. It is sitting 74% up its range ($62,535–$87,396); the last closed candle came on a light 0.84x its average volume. On the weekly, the $80,441 50-EMA is the line the longer trend pivots on.
DAILY
RSI 45.6 — neutral. The trend here reads uptrend: price is below the 20-EMA ($81,768) and above the 50-EMA ($80,781), with the 20 leading the 50. It is sitting 21% up its range ($79,221–$87,220). The daily is the structure that matters most for the swing.
4-HOUR
RSI 54 — neutral. The trend here reads recovering: price is above the 20-EMA ($80,544) and below the 50-EMA ($81,016), with the 20 still under the 50. It is sitting 30% up its range ($79,221–$84,898). This is where the intraday chop lives.
1-HOUR
RSI 61.8 — firm, with room. The trend here reads uptrend: price is above the 20-EMA ($80,619) and above the 50-EMA ($80,416), with the 20 leading the 50. It is sitting 30% up its range ($79,221–$84,898); the last closed candle came on a light 0.67x its average volume. Shortest-term, this is momentum, not trend — treat it as timing, not direction.
THE LEVELS THAT MATTER
$84,898 — the recent high, the ceiling to clear.
$81,768 — the daily 20-EMA, the line price is riding. Hold above it and the trend is fine; lose it and momentum shifts.
$83,624 — the monthly open, the first real support below. Lose it and the $79,221 area comes into play.
SENTIMENT
Fear & Greed at 51 (Neutral), tracing 68, 50, 51, 54, 50, 48, 51 across the week. Sentiment is middling — no extreme to fade.
THE SYNTHESIS
Top to bottom, this is an aligned uptrend — the daily leads and the lower frames are following, not fighting it. The trend gets the benefit of the doubt while $83,624 holds as support.
For now: watch $81,768 on the way down and $84,898 on the way up. Everything in between is range.
Where are you leaning from here — continuation, or a retest of $83,624?
$BTC
94
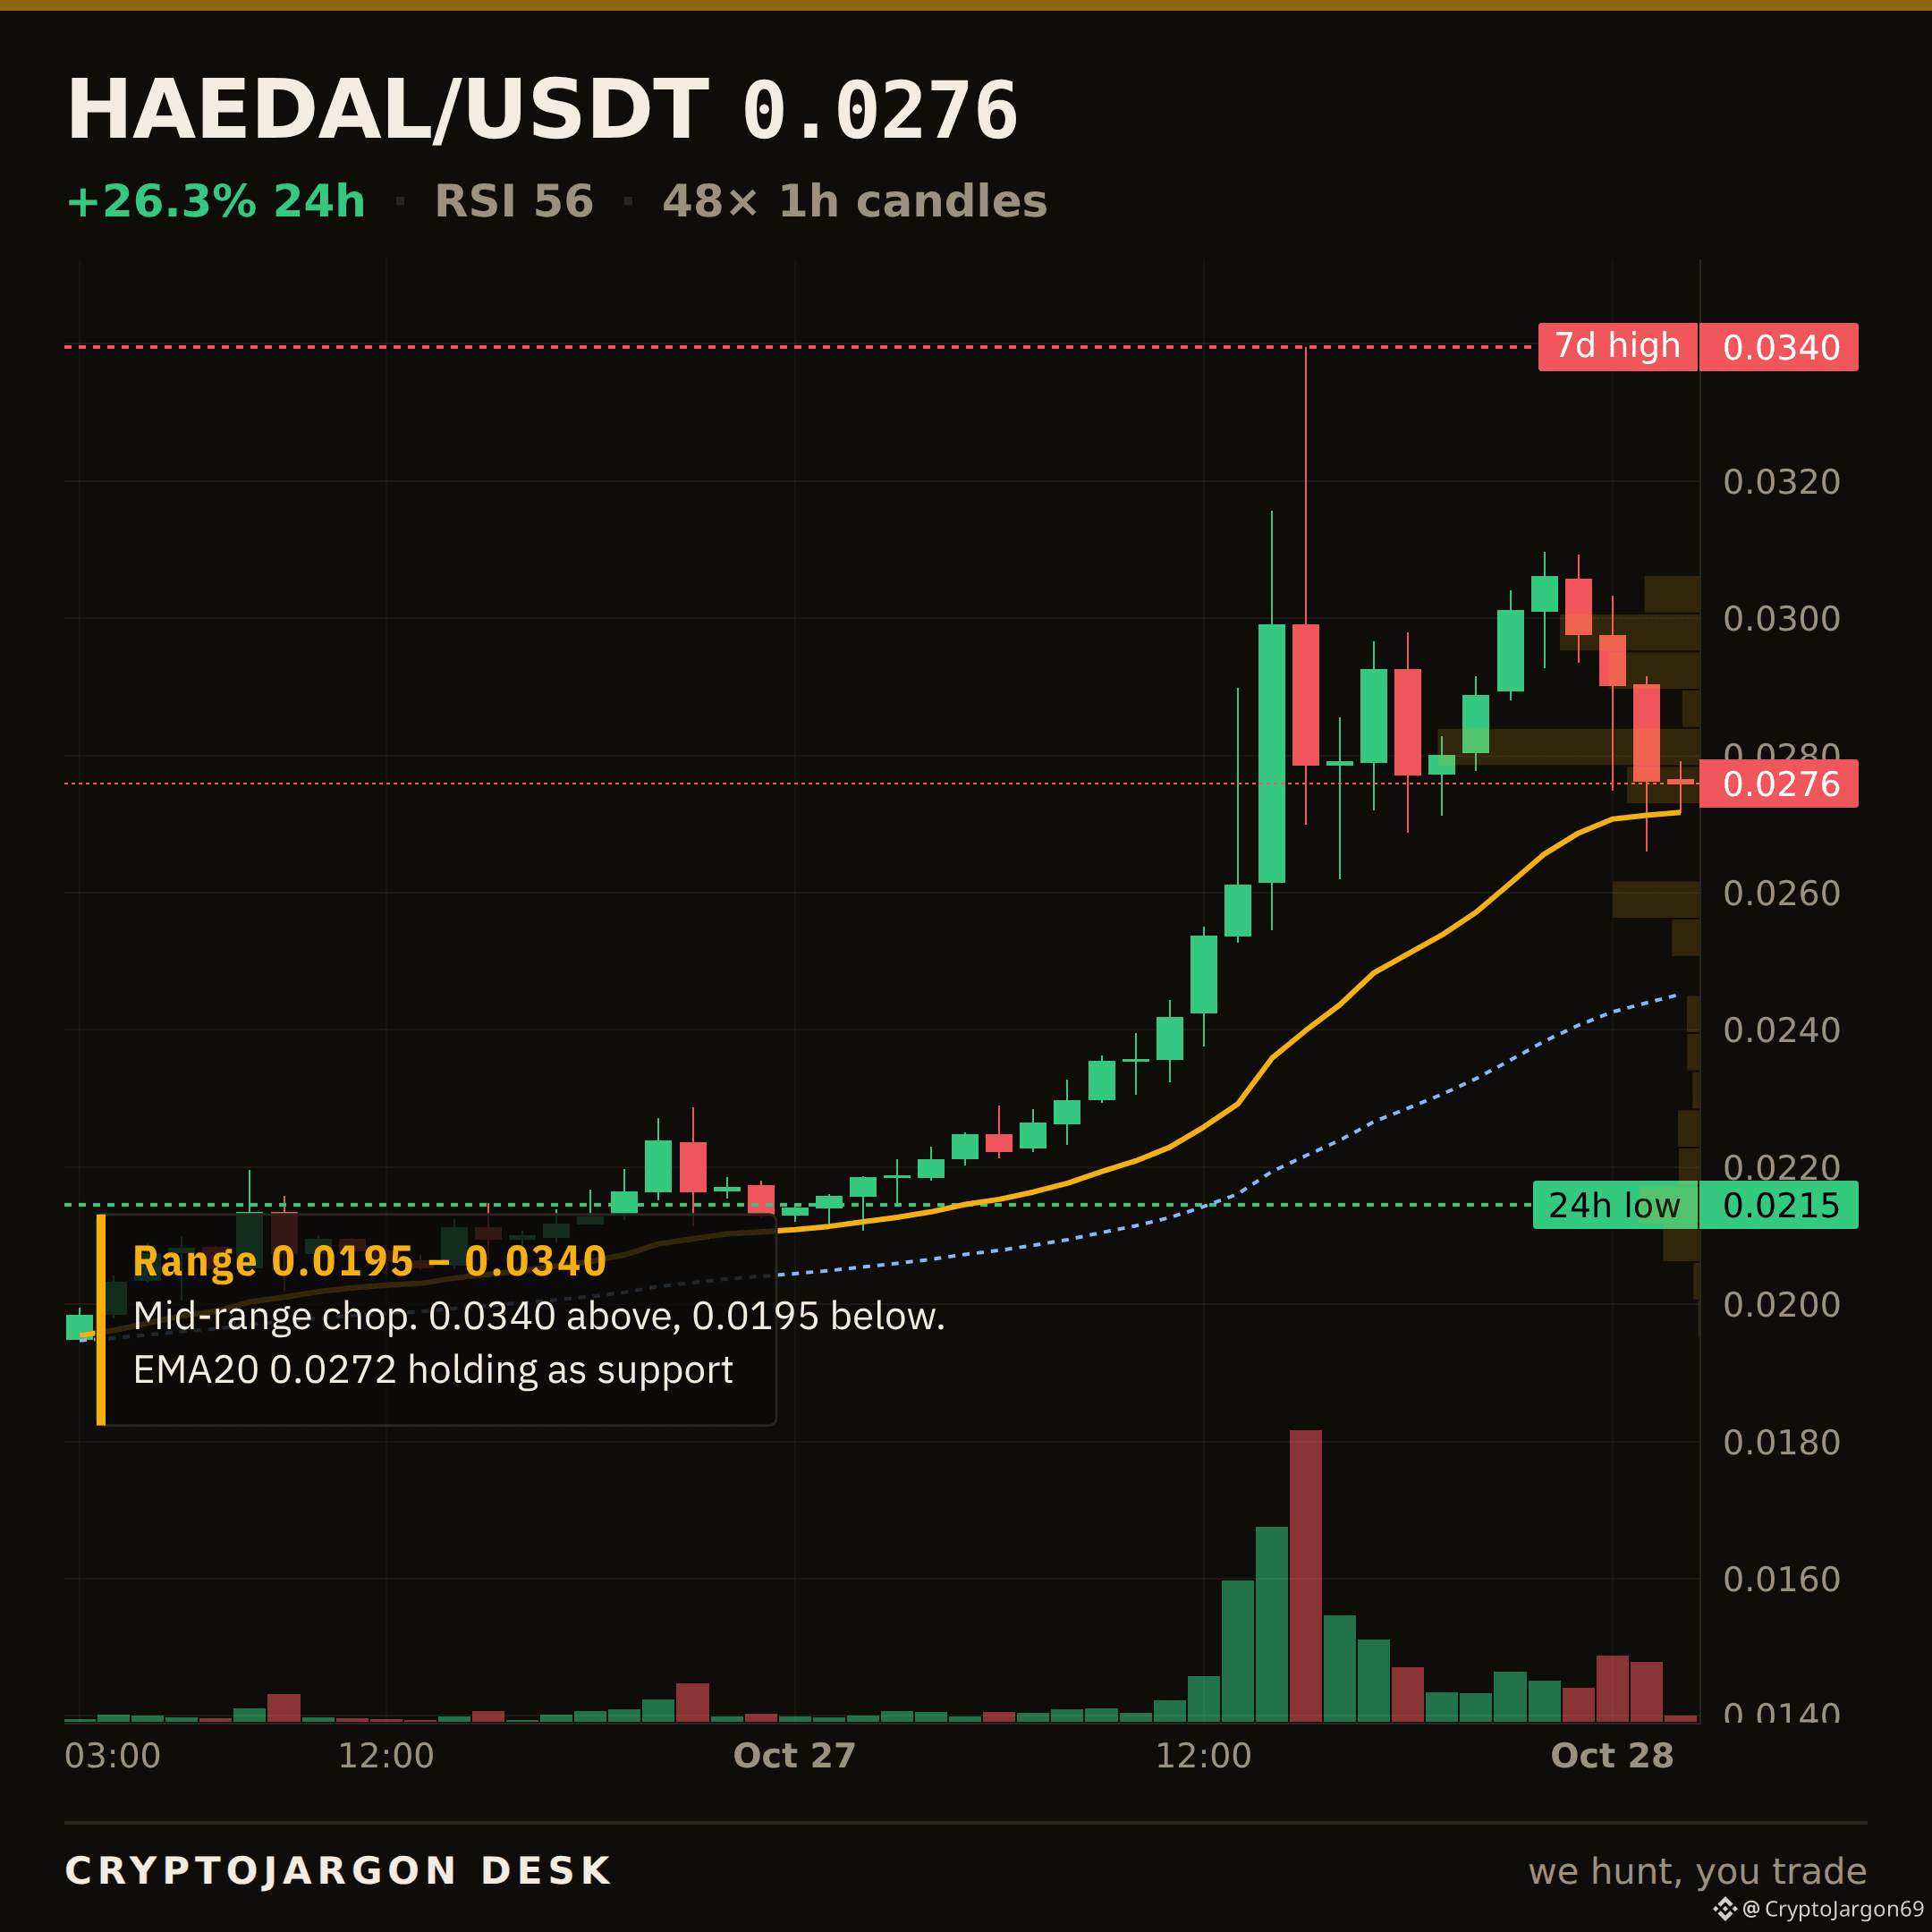
$HAEDAL · MARKET STRUCTURE
$0.0276, +26.3% on the day.
Trend — price above both EMAs, the 20 over the 50.
Momentum — RSI 56.
Range — 49% up its 24h range ($0.0215–$0.034).
Trend, momentum and range mostly point the same way — an aligned tape to the upside.
Levels: $0.034 24h high (ceiling) · $0.0215 24h low (support) · 7d range $0.0176–$0.034.
Chart: 1H candles, EMA20/50 + levels marked. $HAEDAL
97
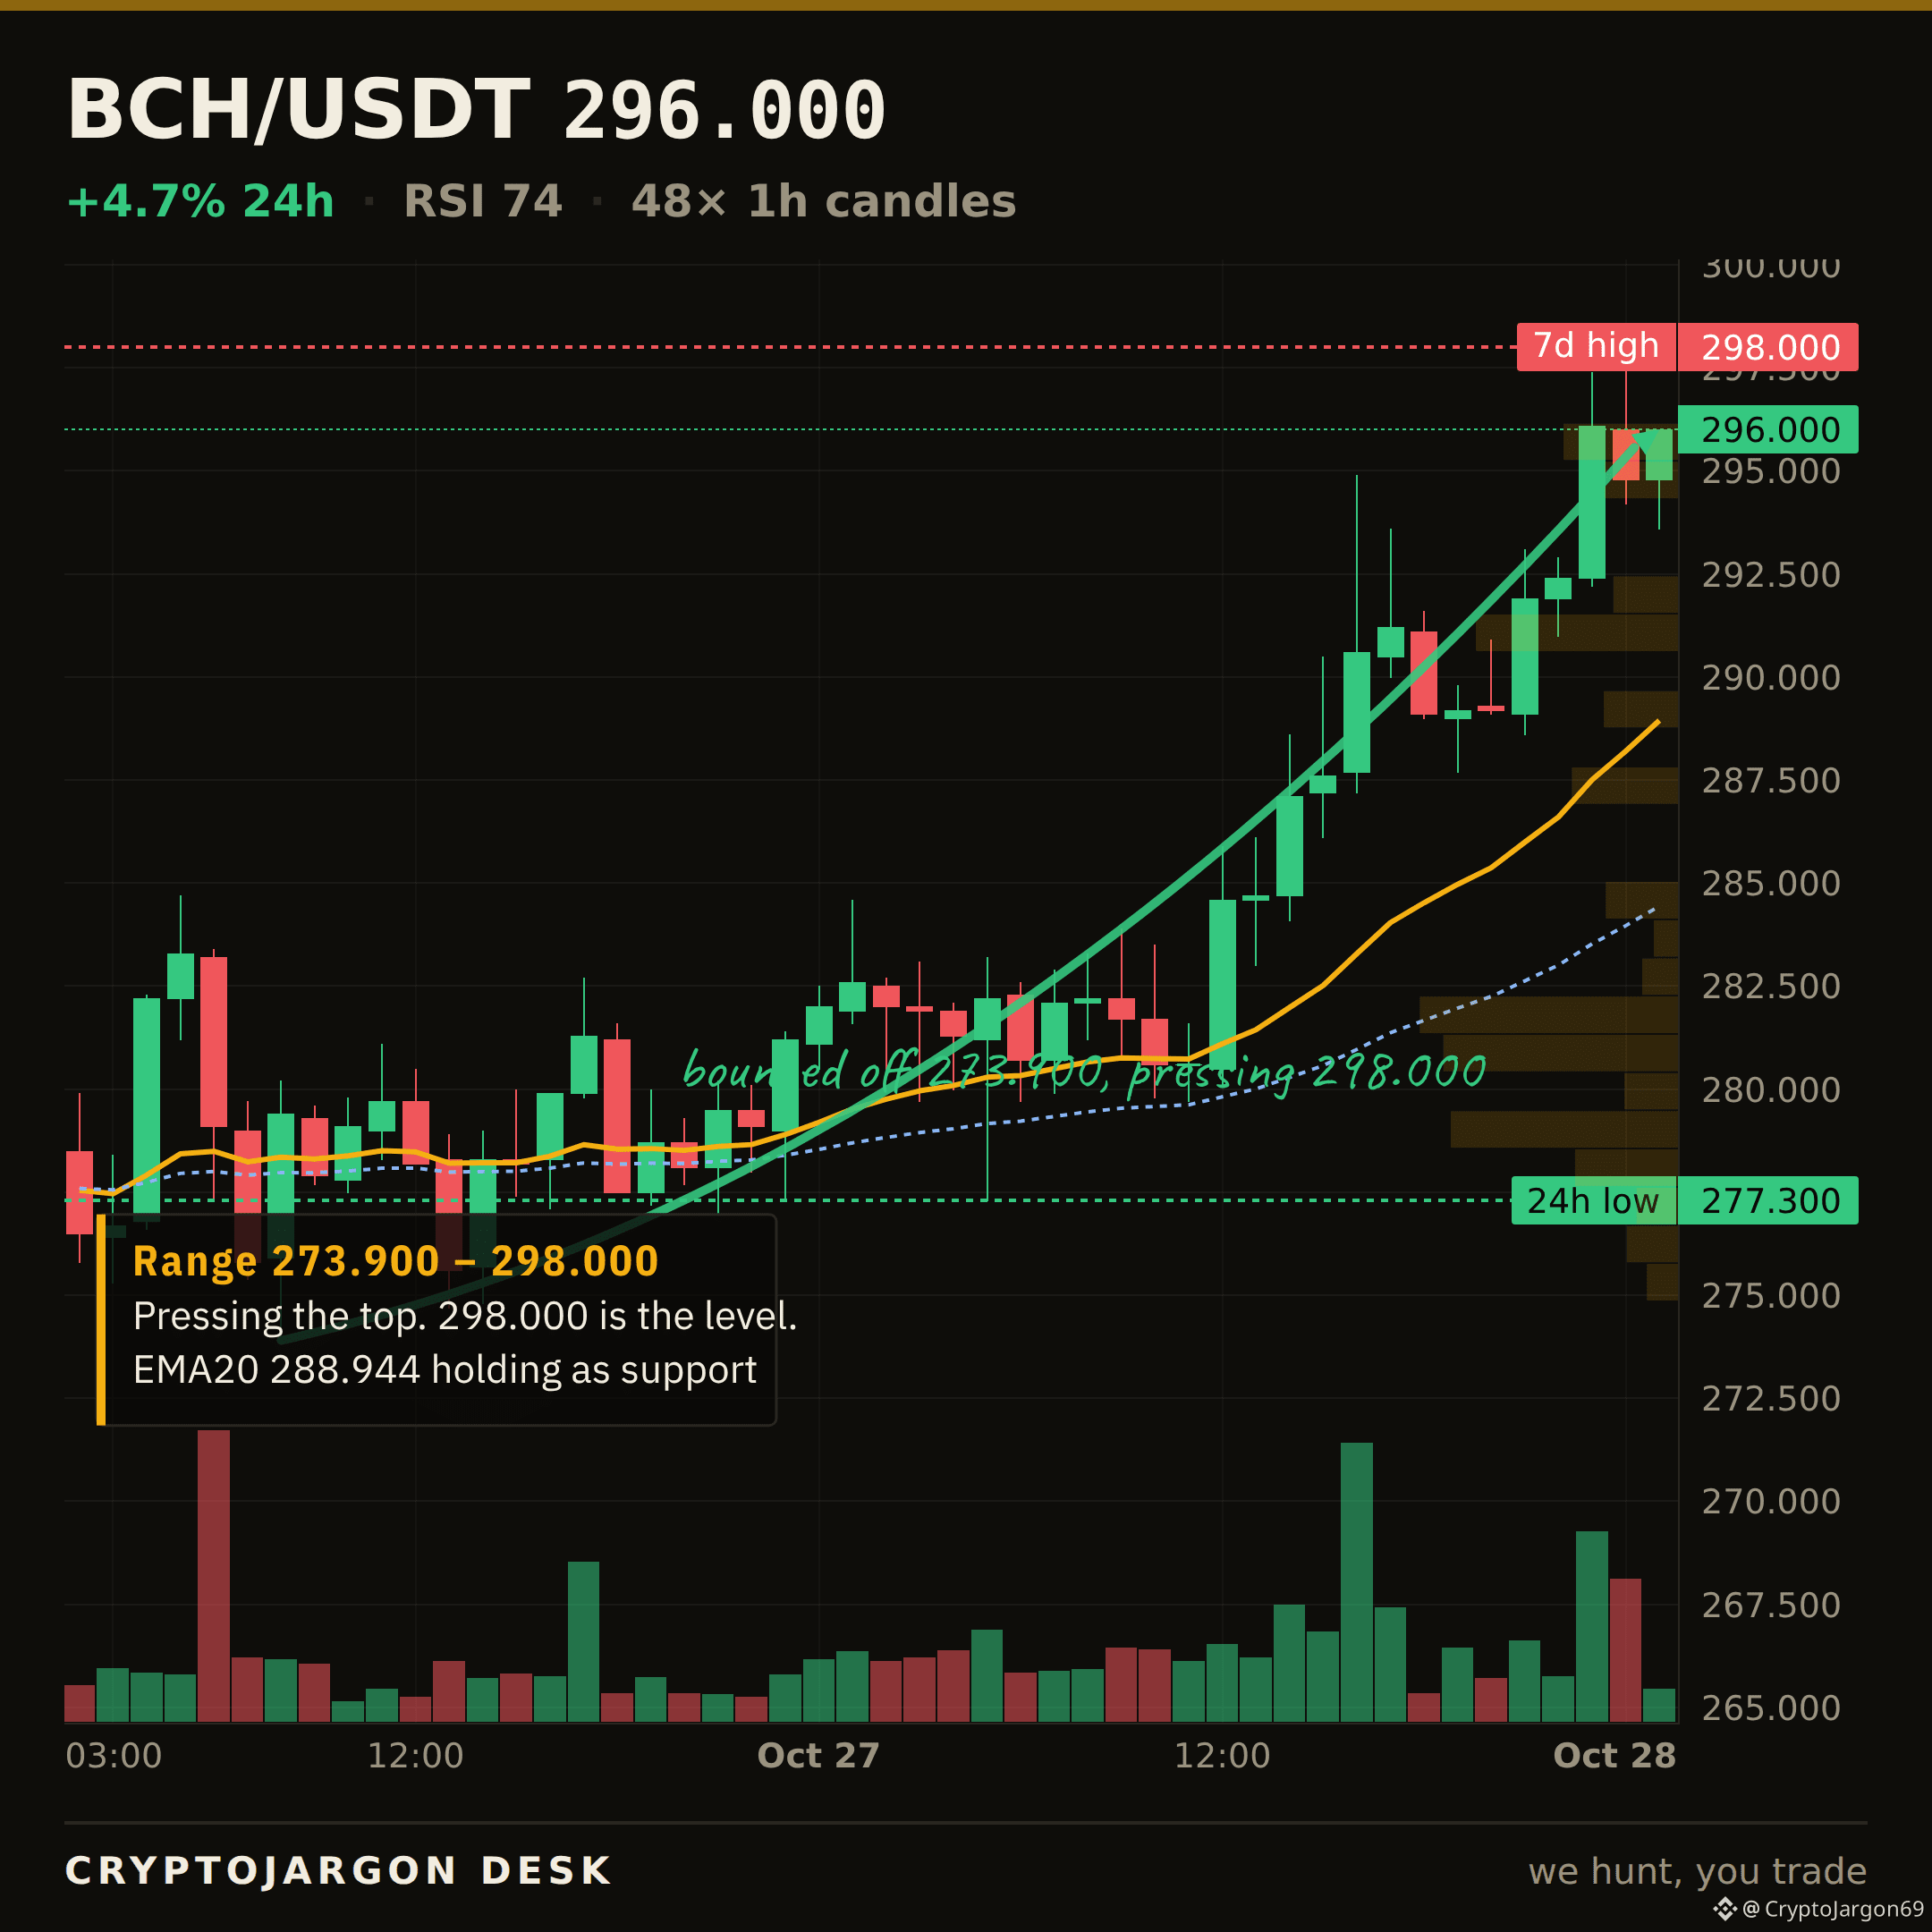
$BCH · LEVEL TO WATCH
$296.00 now.
The line that matters is $298.00 — the 24h high, the ceiling the tape is pressing from below. It lines up with the 7-day high too — a spot several things share.
A clean close back above $298.00 opens the upper range; stalling there keeps this a range. I'll follow up when it resolves.
Chart: the level is on it. $BCH
1
1
102
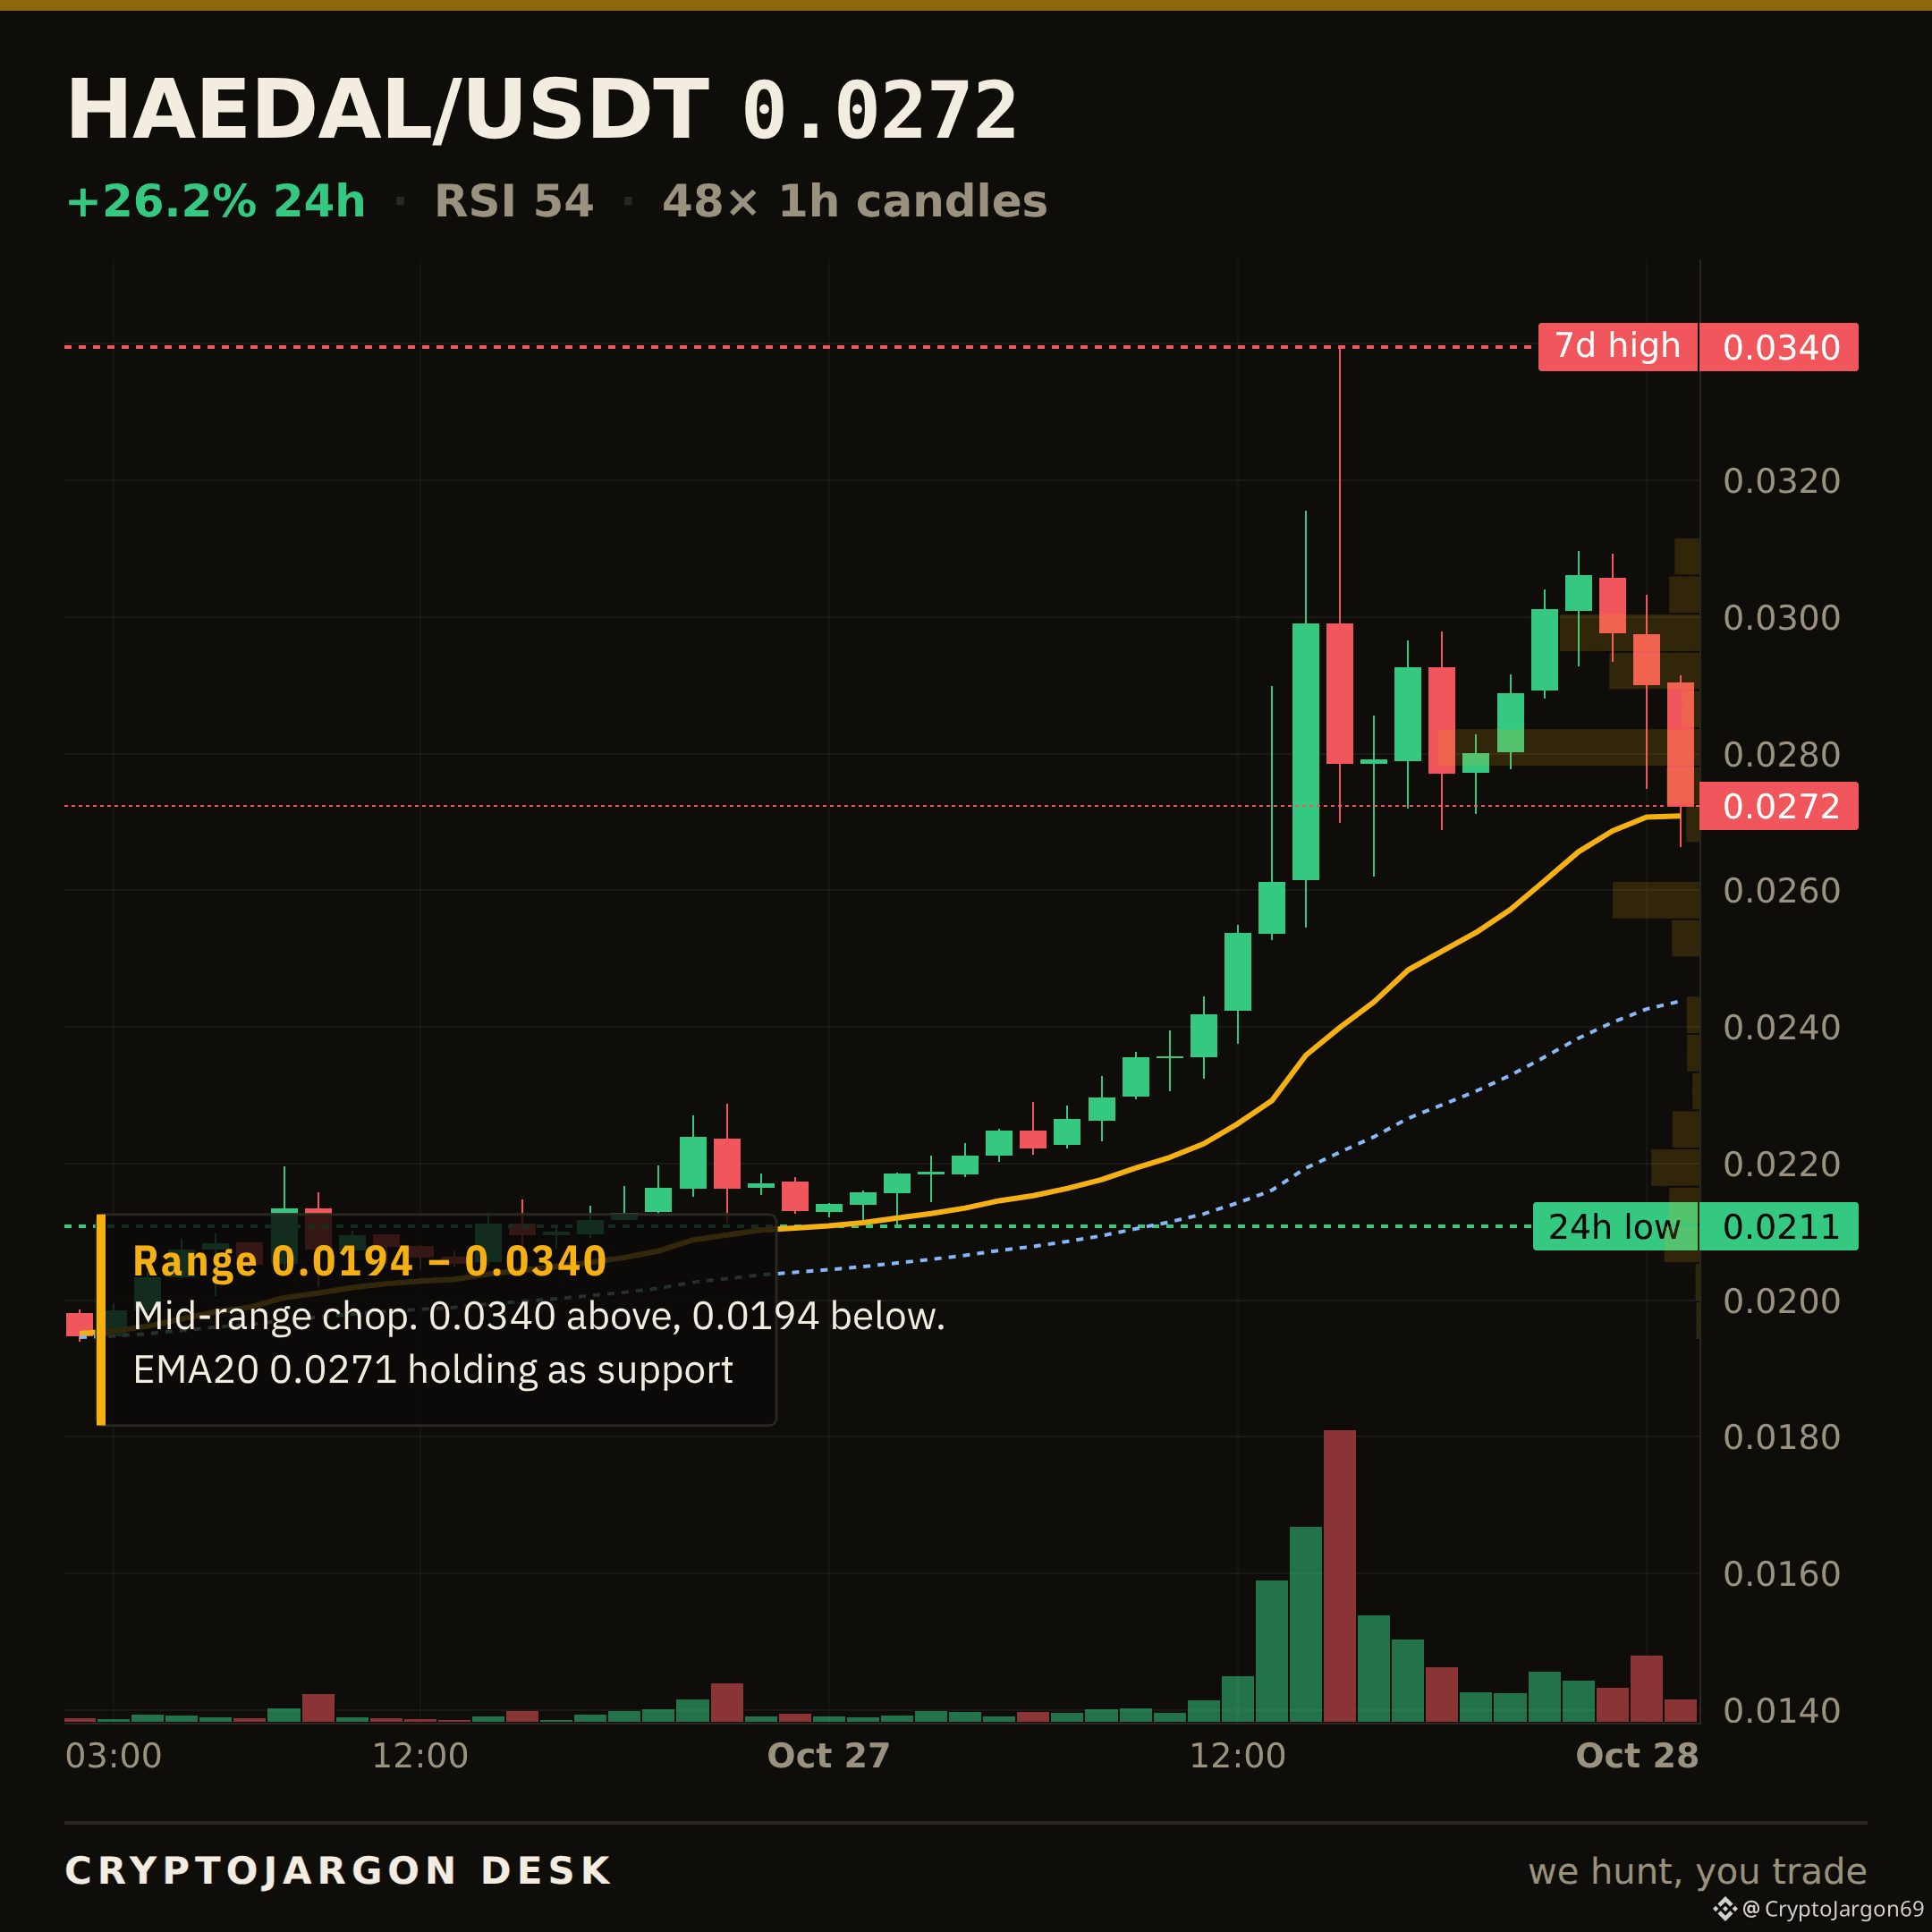
HAEDAL printed a +29.1% candle on $17M volume but has already given back a big piece of the move from the 0.0340 high.
Price is now sitting directly on its 20-day EMA at 0.0271. A strong impulse move that fails its first retest is just a wick. So this is the line that matters. The whole move is decided here.
Are bulls defending this level, or is it just exit liquidity for the run-up?
$HAEDAL
This desk posts all day. Follow to keep up with it.
125
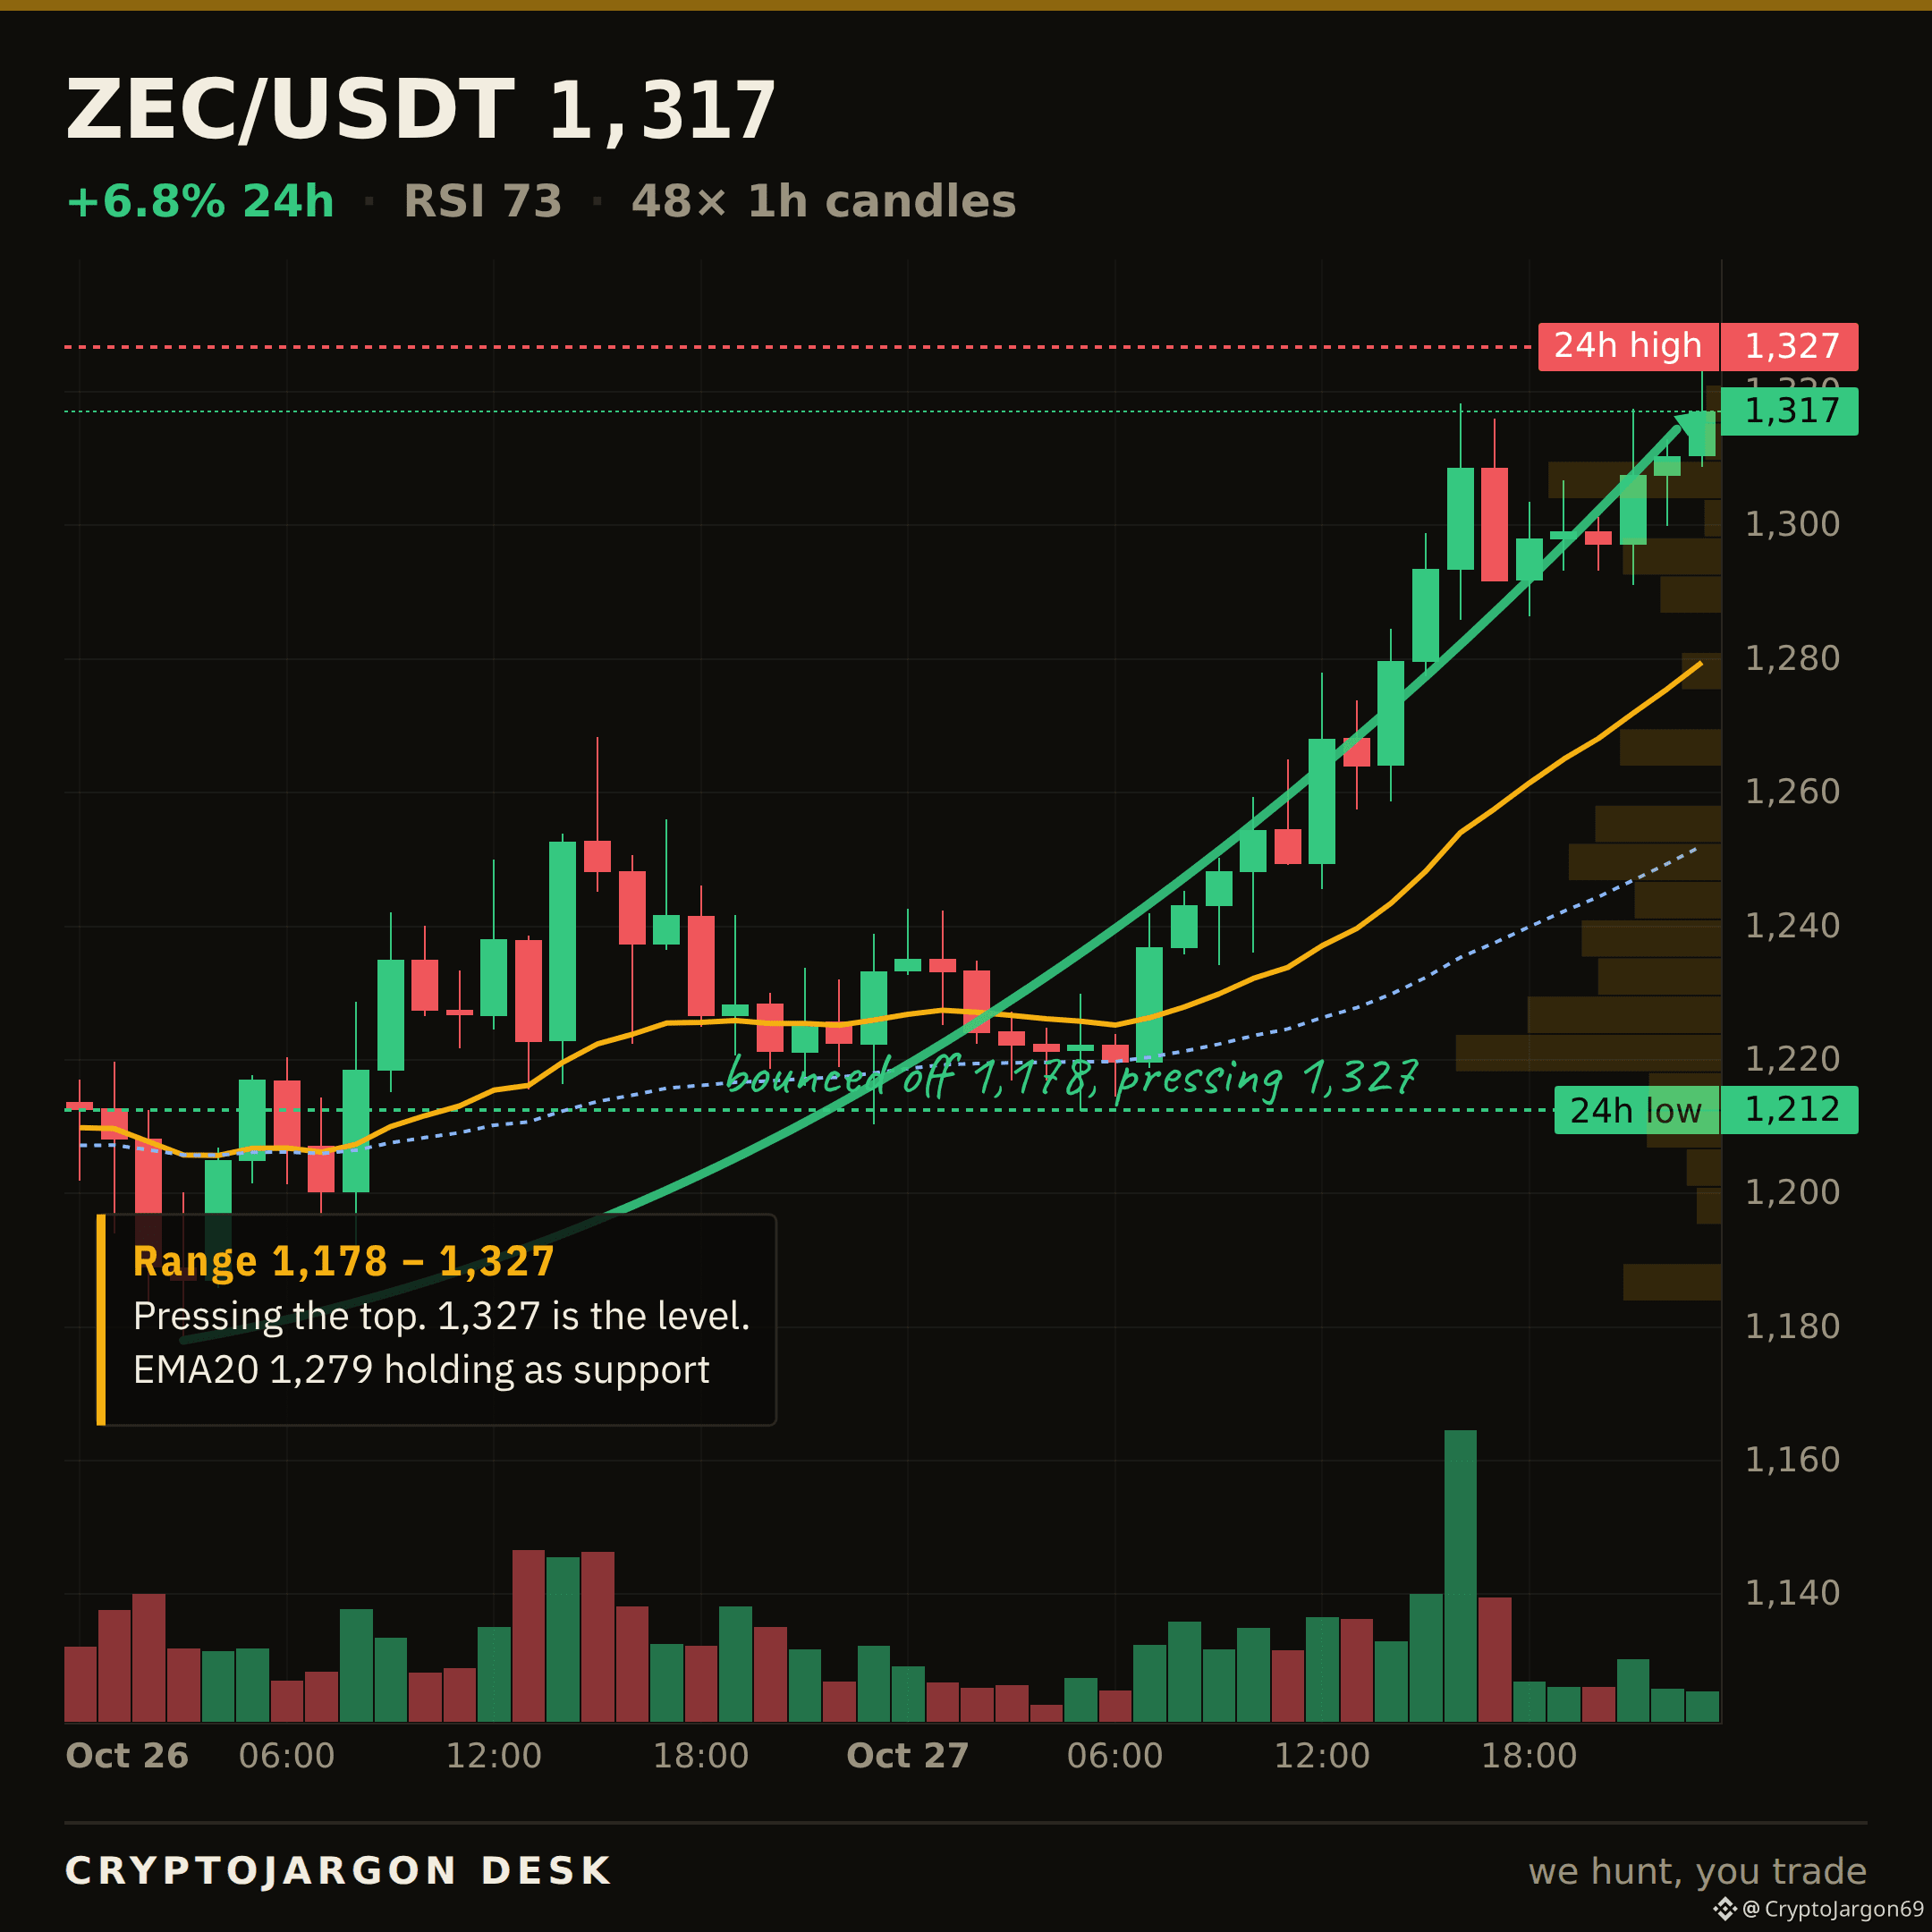
Zcash's co-founder wants to turn off the spigot for its grants program, which he says is sitting on over $125M.
The proposal would redirect ZEC inflation into a network reserve instead. The market reaction is clear: +8.3% on $154M volume, pushing price above the 20 and 50-day EMAs. This is a simple story: less ZEC for grantees means less potential sell pressure down the line.
The tape is front-running that idea, but the pump just sent the RSI to 73. Is this a fundamental shift in supply dynamics, or just exit liquidity on the news?
$ZEC
More of these coming today. Follow to catch them as they land.
50
Log in to explore more content
Join global crypto users on Binance Square
⚡️ Get latest and useful information about crypto.
💬 Trusted by the world’s largest crypto exchange.
👍 Discover real insights from verified creators.
Email / Phone number
Trending Topics
FedWatch
16.2M views
38,735 Discussing
🚨 BREAKING: THE US ECONOMY JUST BEAT ON EVERYTHING. THAT IS THE WORST NEWS FOR YOUR PORTFOLIO.
GDP Q3: 3.4% vs 3.2% expected. Previous: 2.2%
Jobless claims: 194K vs 199K expected. Previous: 194K
PCE inflation: 3.6%, as expected. Previous: 3.4%
Strong growth. Almost no layoffs. Inflation going UP, not down. The Fed has zero reason to stop, and a December hike is priced near 80%.
In this market, good news for the economy is bad news for stocks and crypto. PCE in line is not a relief, it is 0.2 points higher than last month.
Rate cut hopes are dead. Stay alert.
12 years in these markets. This is what I do.
Follow me and turn notifications on.
#FedWatch
#EarningsSeason
#Nasdaq100FuturesFall0.9%
$BTC
$SOL
$SUI
MARKET STRUCTURE GUIDE
·4 Likes
·1.1k views
EarningsSeason
6.3M views
31,474 Discussing
USMidtermElections
10,117 views
301 Discussing