Binance Square

灯塔说

Square Verified
老牌交易员,专注二级交易|投研,严谨计划交易,严格交易计划!合作|推特:@Cryptodengta
原创之星

原创之星
NOKB Holder
NOKB Holder
Frequent Trader
7 Years
64 Following
14.0K+ Followers
19.7K+ Liked
1 Badges
Posts
PINNED
·
--
Important Announcement: The market analysis and investment recommendations provided in this plaza are based solely on publicly available information and professional judgment, and do not constitute any guarantee of returns or assurance of principal safety. Investing involves risk; decisions should be made carefully. Please assess your own risk tolerance and financial situation prudently, and assume responsibility for any related investment risks. Note: All content on this plaza is for reference only and does not constitute any investment advice. ——Lighthouse Says. For business cooperation (copy-trading), please DM.
Important Announcement:
The market analysis and investment recommendations provided in this plaza are based solely on publicly available information and professional judgment, and do not constitute any guarantee of returns or assurance of principal safety.
Investing involves risk; decisions should be made carefully. Please assess your own risk tolerance and financial situation prudently, and assume responsibility for any related investment risks.
Note: All content on this plaza is for reference only and does not constitute any investment advice.
——Lighthouse Says. For business cooperation (copy-trading), please DM.
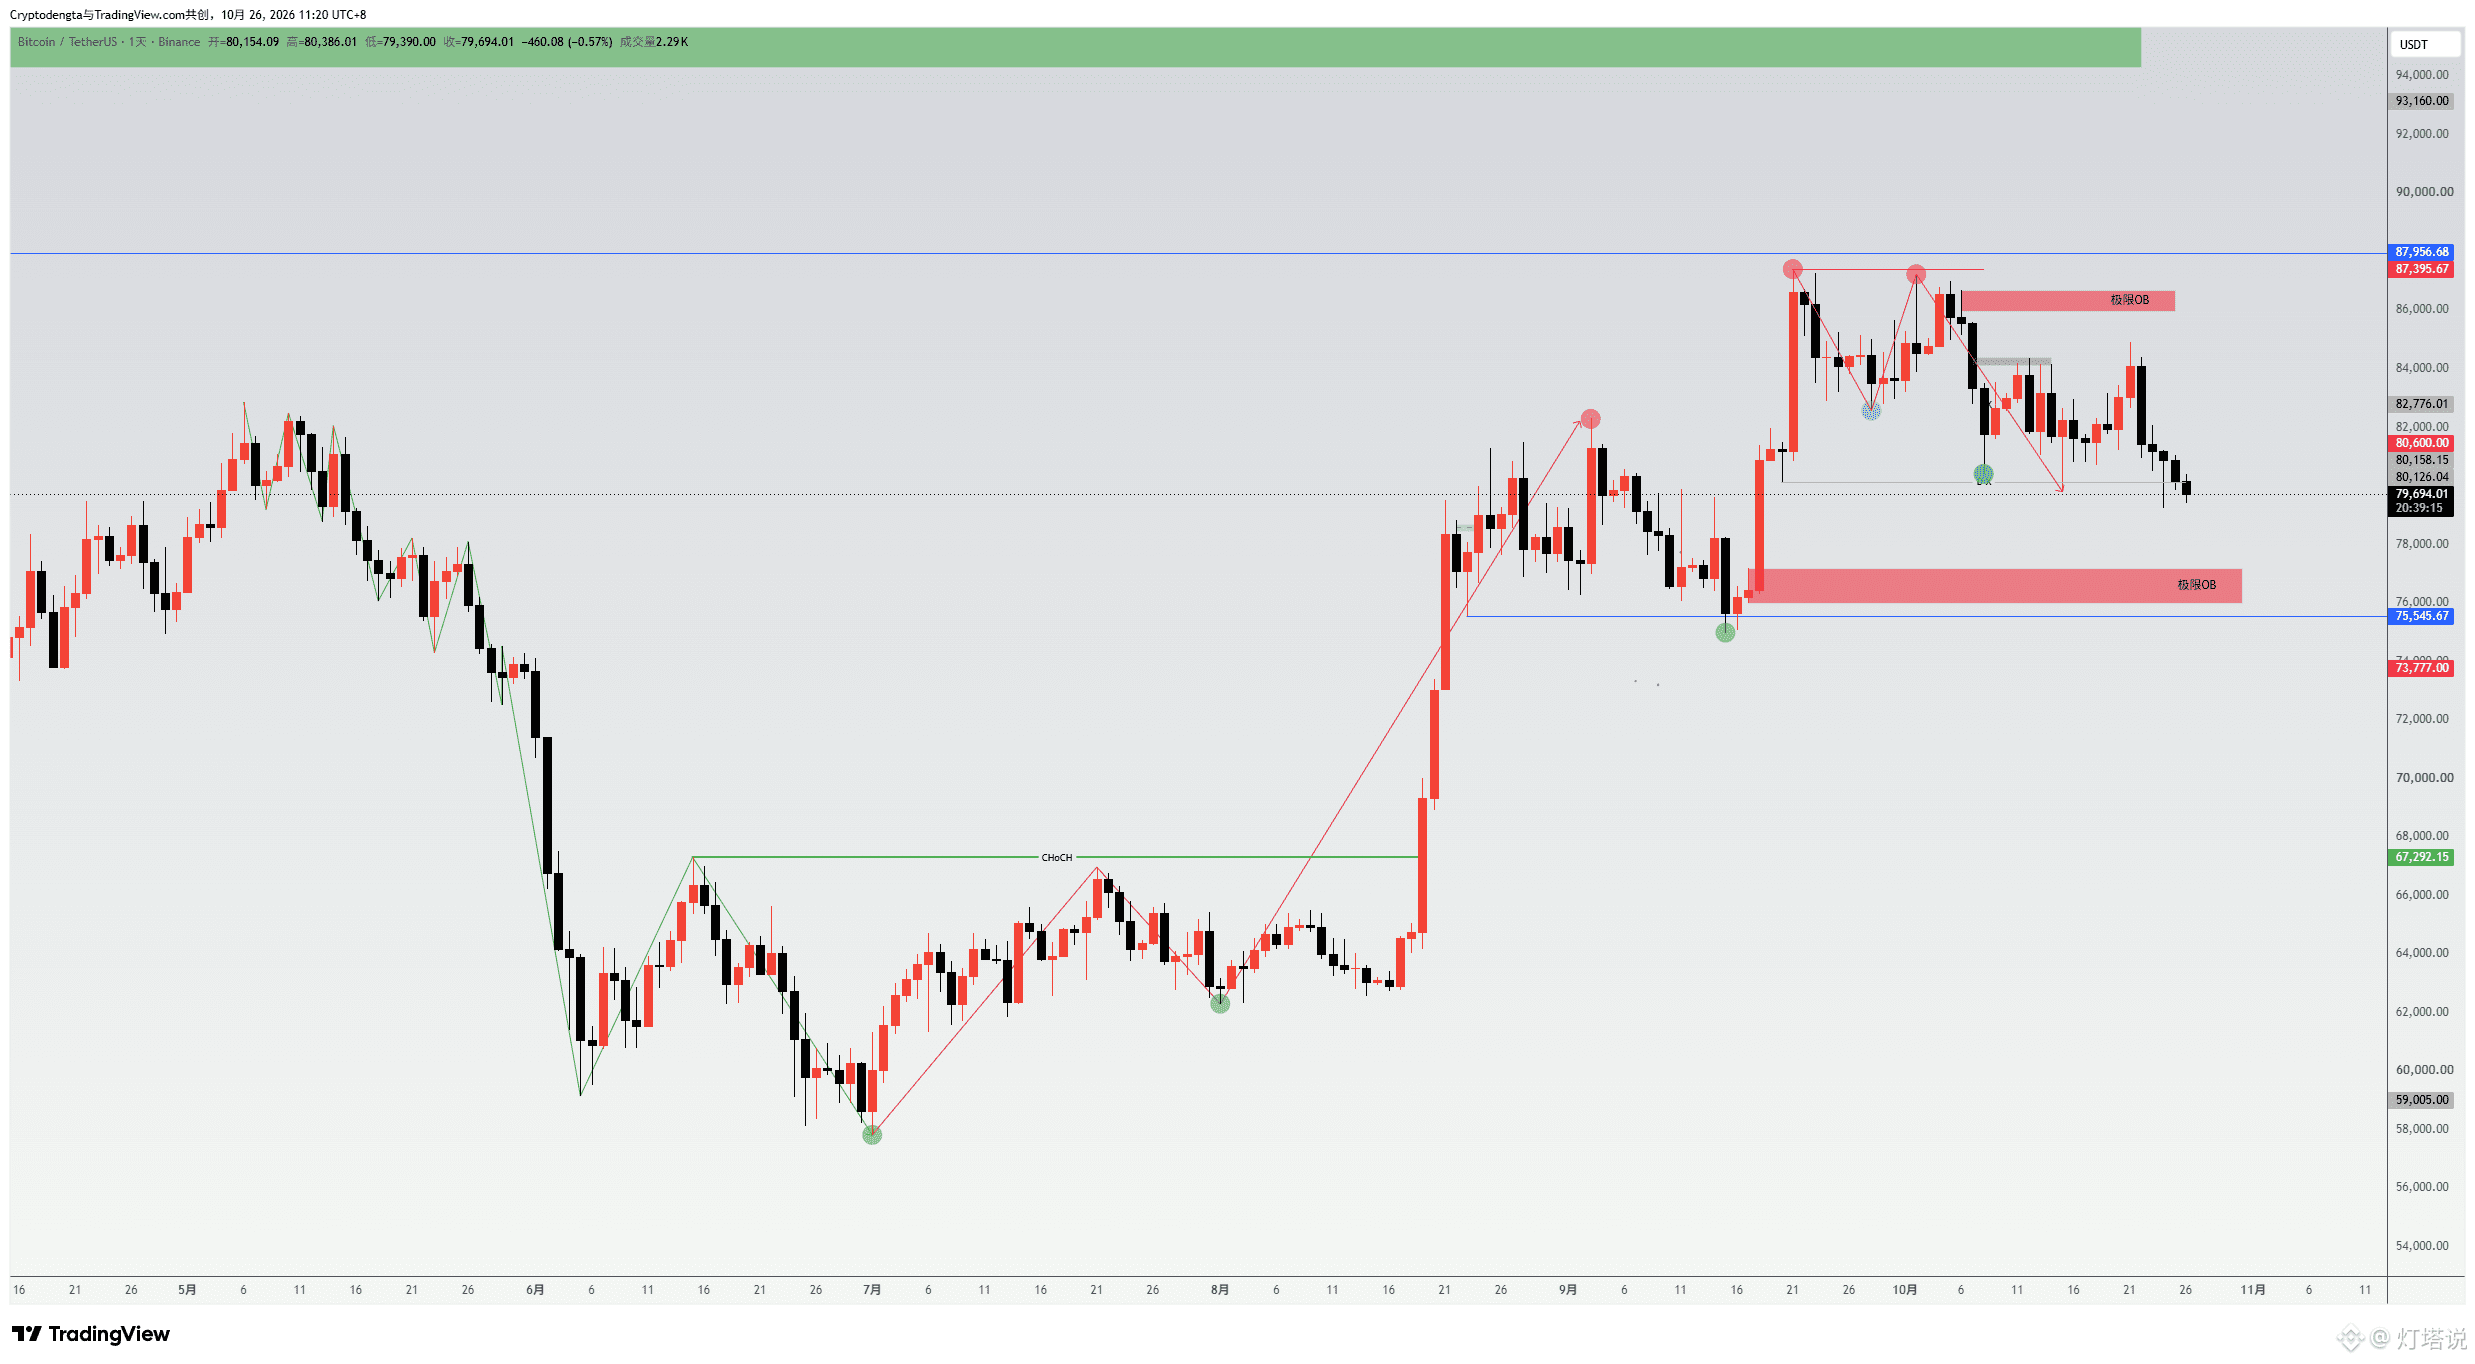
A high-risk contrarian view: bullish on BTC BTC has fallen for several consecutive days, sweeping the daily IDM liquidity. Ideally, it won’t close below 79,200 on the daily chart. If it does, price could reach the extreme OB at 77–76K. This is the final support zone and the long entry with the best risk-to-reward ratio. The stop-loss only needs to be placed below 75K, in case price closes below it. But if the decline reverses before reaching this zone, you may miss the move. So I’ll start scaling into long positions now. The current decline is pricing in future bearish news. Once that news comes to pass, the opportunity to go long may already be gone. I still believe this rally could top out at 96–97K, and I also think there’s room for another move up after this pullback. This time, I don’t want to sit on the sidelines—I’ll put my view to the test. $BTC {spot}(BTCUSDT)
A high-risk contrarian view: bullish on BTC
BTC has fallen for several consecutive days, sweeping the daily IDM liquidity. Ideally, it won’t close below 79,200 on the daily chart. If it does, price could reach the extreme OB at 77–76K. This is the final support zone and the long entry with the best risk-to-reward ratio. The stop-loss only needs to be placed below 75K, in case price closes below it.
But if the decline reverses before reaching this zone, you may miss the move.
So I’ll start scaling into long positions now.
The current decline is pricing in future bearish news. Once that news comes to pass, the opportunity to go long may already be gone.
I still believe this rally could top out at 96–97K,
and I also think there’s room for another move up after this pullback.
This time, I don’t want to sit on the sidelines—I’ll put my view to the test.
$BTC
灯塔说
·
--
$BTC went long on Bitcoin
😡😡
Partly True
Over the weekend, I saw a question on Jin10: Why isn’t gold acting as a safe haven this time? Why are investors rushing to buy U.S. Treasuries instead? I asked GPT’s highest reasoning mode to take a deep dive. Sharing it with everyone here: “Investors are rushing to buy U.S. Treasuries, while gold has fallen. What is the market really afraid of? A strange pattern has emerged in the market recently: Oil prices are rising, while Treasury yields and the U.S. dollar are both retreating—and even gold has failed to attract safe-haven flows. I believe the market is gradually shifting from worrying about inflation to worrying about economic growth. There are three forces behind this: ① U.S. Treasuries are rising: Institutions are starting to worry about U.S. stock valuations and an economic slowdown, so money is moving into Treasuries—which offer interest and liquidity—as a safe haven. ② Gold is falling: Pressure on stocks has prompted some investors to deleverage, selling gold to raise cash; at the same time, real interest rates remain high, weighing on gold’s appeal. ③ Oil prices are rising: In the short term, this pushes inflation higher; over the long term, it could squeeze consumer spending and corporate profits. The Fed is caught between being unable to cut rates and having to contend with the risk of an economic slowdown. That is the market’s biggest contradiction right now: inflation hasn’t been brought under control, and growth is coming under pressure. I’m cautious on gold in the short term, but remain bullish over the medium to long term. A decline in real interest rates and a return of investment flows are needed to confirm that view. There’s another question worth thinking about: Institutions are buying U.S. Treasuries today to shield themselves from economic risks. But if future risks stem from U.S. fiscal stability and confidence in the dollar itself, where will investors turn for shelter? I believe gold’s next truly major opportunity may come not from war, but from a global reassessment of confidence in the U.S. dollar.” $XAU
Over the weekend, I saw a question on Jin10:
Why isn’t gold acting as a safe haven this time? Why are investors rushing to buy U.S. Treasuries instead?
I asked GPT’s highest reasoning mode to take a deep dive.
Sharing it with everyone here:

“Investors are rushing to buy U.S. Treasuries, while gold has fallen. What is the market really afraid of?
A strange pattern has emerged in the market recently:
Oil prices are rising, while Treasury yields and the U.S. dollar are both retreating—and even gold has failed to attract safe-haven flows.
I believe the market is gradually shifting from worrying about inflation to worrying about economic growth.
There are three forces behind this:
① U.S. Treasuries are rising: Institutions are starting to worry about U.S. stock valuations and an economic slowdown, so money is moving into Treasuries—which offer interest and liquidity—as a safe haven.
② Gold is falling: Pressure on stocks has prompted some investors to deleverage, selling gold to raise cash; at the same time, real interest rates remain high, weighing on gold’s appeal.
③ Oil prices are rising: In the short term, this pushes inflation higher; over the long term, it could squeeze consumer spending and corporate profits. The Fed is caught between being unable to cut rates and having to contend with the risk of an economic slowdown.
That is the market’s biggest contradiction right now: inflation hasn’t been brought under control, and growth is coming under pressure.
I’m cautious on gold in the short term, but remain bullish over the medium to long term. A decline in real interest rates and a return of investment flows are needed to confirm that view.
There’s another question worth thinking about:
Institutions are buying U.S. Treasuries today to shield themselves from economic risks.
But if future risks stem from U.S. fiscal stability and confidence in the dollar itself, where will investors turn for shelter?
I believe gold’s next truly major opportunity may come not from war, but from a global reassessment of confidence in the U.S. dollar.”
$XAU
灯塔说
·
--
Why is gold dropping like this?
Aren't they all about to go to war?
A multinational military exercise on such a massive scale,
and I’m screwed again 😂😂😂
$XAU
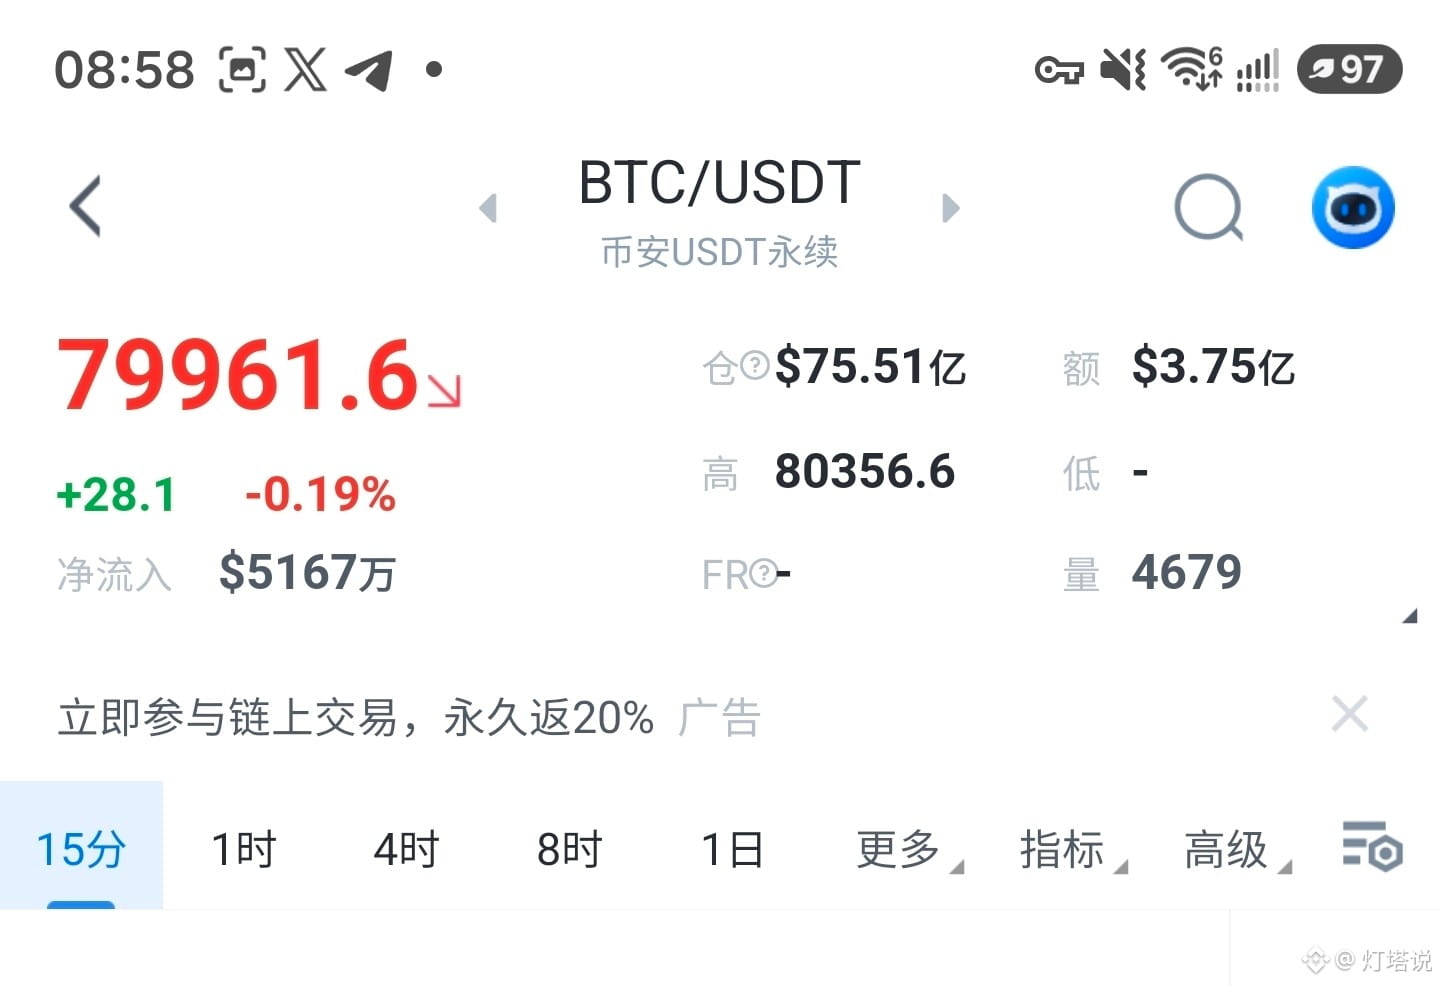
$BTC went long on Bitcoin 😡😡
$BTC went long on Bitcoin
😡😡
On October 22, the Nasdaq fell about 2.6%, while the 10-year U.S. Treasury yield dropped to around 4.95%. This points to investors seeking safe havens. On October 21, BTC ETFs saw net inflows of about $525 million, but on October 22 they shifted to net outflows of about $382 million. ETH ETFs saw net outflows of about $17.9 million on October 22. On October 22, oil prices continued to rise amid tensions in the Middle East, while tech stocks saw a significant pullback. This suggests that safe-haven buying likely contributed to the decline in bond yields. The Federal Reserve will hold its FOMC meeting on October 27–28, and the U.S. preliminary third-quarter GDP estimate and September PCE data will be released on October 29.
On October 22, the Nasdaq fell about 2.6%, while the 10-year U.S. Treasury yield dropped to around 4.95%. This points to investors seeking safe havens.
On October 21, BTC ETFs saw net inflows of about $525 million, but on October 22 they shifted to net outflows of about $382 million. ETH ETFs saw net outflows of about $17.9 million on October 22.
On October 22, oil prices continued to rise amid tensions in the Middle East, while tech stocks saw a significant pullback. This suggests that safe-haven buying likely contributed to the decline in bond yields.
The Federal Reserve will hold its FOMC meeting on October 27–28, and the U.S. preliminary third-quarter GDP estimate and September PCE data will be released on October 29.
Why is gold dropping like this? Aren't they all about to go to war? A multinational military exercise on such a massive scale, and I’m screwed again 😂😂😂 $XAU

Why is gold dropping like this?
Aren't they all about to go to war?
A multinational military exercise on such a massive scale,
and I’m screwed again 😂😂😂
$XAU
When you're trying to hold for the medium to long term, you wake up and it's been sent right back to square one. If you can't keep a level head, get ready to be played for a fool! Haha Still ranging. Ranging takes patience. Right now, Bitcoin has swept the liquidity below on the daily chart, but it hasn't touched the key support below. If the EMAs still show no reversal signal after price touches support, then that will be the bottom. Take some short-term trades, build up gradually, and wait patiently. $BTC
When you're trying to hold for the medium to long term,
you wake up and it's been sent right back to square one.
If you can't keep a level head,
get ready to be played for a fool!
Haha

Still ranging.
Ranging takes patience.
Right now, Bitcoin has swept the liquidity below on the daily chart,
but it hasn't touched the key support below.

If the EMAs still show no reversal signal after price touches support,
then that will be the bottom.

Take some short-term trades, build up gradually, and wait patiently.

$BTC
Verified
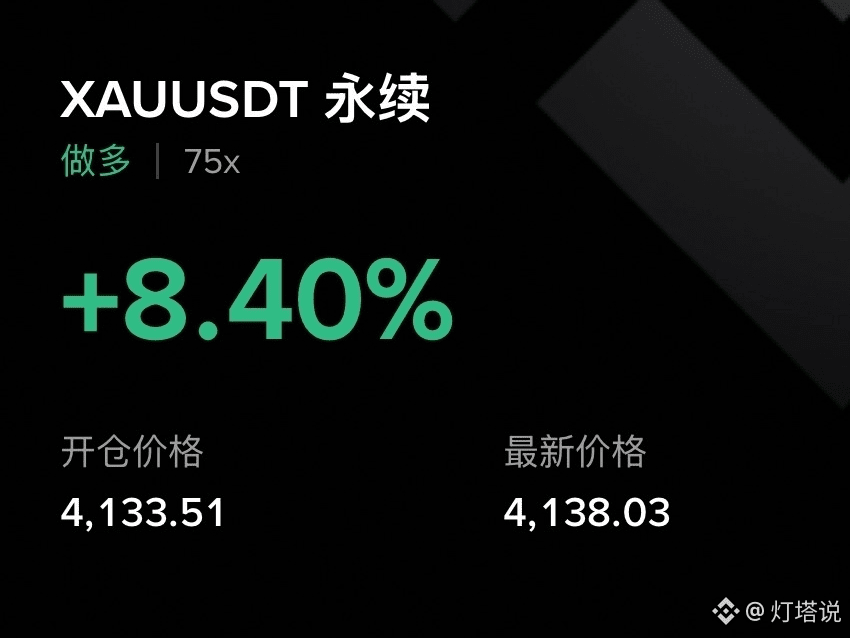
$BTC Bitcoin has finally broken above 82K and is holding above 83K. As mentioned earlier, BTC could move either way. It’s been trading sideways lately, so it’s unclear which direction it will move first. Based on its current movement, I’m leaning toward an upward push. $CL Oil once again showed yesterday that there’s still room for US-Iran negotiations. If oil prices fall going forward, that could drive the market higher. Expectations for an October rate hike have also been confirmed unchanged. There are currently no fundamental bearish catalysts expected, so hold on to long positions around 82K and see how things develop. $XAU {future}(XAUUSDT) Gold is still a buy on dips, and I’m likewise looking at the medium to long term. Gold is currently behaving much like it did around the previous 3980–4000 support zone. Waiting for an upward push. If it keeps moving sideways, just keep waiting.
$BTC Bitcoin has finally broken above 82K and is holding above 83K. As mentioned earlier, BTC could move either way. It’s been trading sideways lately, so it’s unclear which direction it will move first.
Based on its current movement, I’m leaning toward an upward push.
$CL Oil once again showed yesterday that there’s still room for US-Iran negotiations. If oil prices fall going forward, that could drive the market higher.
Expectations for an October rate hike have also been confirmed unchanged. There are currently no fundamental bearish catalysts expected, so hold on to long positions around 82K and see how things develop.
$XAU
Gold is still a buy on dips, and I’m likewise looking at the medium to long term. Gold is currently behaving much like it did around the previous 3980–4000 support zone. Waiting for an upward push.
If it keeps moving sideways, just keep waiting.
灯塔说
·
--
I bought too much gold
$XAU
I bought too much gold $XAU
I bought too much gold
$XAU
Verified
What should we expect from tonight’s CPI? The previous reading was 3.4, and the forecast is 3.6. Market movements over the past few days have already reflected the market’s assumption that inflation rebounded in September. So as long as the figure is in line with expectations, there shouldn’t be much of a bearish surprise. The key is core CPI, which is forecast at 0.2. This measures inflation excluding energy. As long as core CPI doesn’t exceed expectations, the impact from energy will be in line with what the market expects. To sum up, watch the core CPI figure. Above 0.2 would be bearish and raise expectations of an October rate hike. At or below 0.2 would be in line with expectations, and the market is expected to find a floor and rebound. $XAU $CL {future}(XAUUSDT)
What should we expect from tonight’s CPI?
The previous reading was 3.4, and the forecast is 3.6. Market movements over the past few days have already reflected the market’s assumption that inflation rebounded in September.
So as long as the figure is in line with expectations, there shouldn’t be much of a bearish surprise.
The key is core CPI, which is forecast at 0.2. This measures inflation excluding energy.
As long as core CPI doesn’t exceed expectations, the impact from energy will be in line with what the market expects.

To sum up, watch the core CPI figure. Above 0.2 would be bearish and raise expectations of an October rate hike. At or below 0.2 would be in line with expectations, and the market is expected to find a floor and rebound.
$XAU $CL
$BTC It could move either up or down here. The case for moving up is that the downward correction from the previous 87K high has already taken liquidity below on the 4-hour timeframe. The case for moving down is that the 4-hour pullback low has not been fully confirmed. Following the principle of trading with the larger trend and against smaller counter-trend moves, you can go long in the direction of the uptrend on a minor pullback to around 83000–82800. If it breaks below 82K, the correction may continue as it looks for a low. $ETH Ethereum is similar: it has also taken liquidity below, suggesting the correction may be nearing its initial completion. For trading, consider going long on a small pullback near 2500, targeting a new high. If resistance at 2600–2620 holds and price drops below 2480, then look toward 2400, with the possibility of further downside as it searches for a low. $XAU Gold has touched resistance at 4220 and is correcting. In line with the trend, wait for a low to go long. Enter around 4150 as originally planned, with a medium-term target of 4300–4500.
$BTC It could move either up or down here. The case for moving up is that the downward correction from the previous 87K high has already taken liquidity below on the 4-hour timeframe.
The case for moving down is that the 4-hour pullback low has not been fully confirmed.
Following the principle of trading with the larger trend and against smaller counter-trend moves, you can go long in the direction of the uptrend on a minor pullback to around 83000–82800. If it breaks below 82K, the correction may continue as it looks for a low.

$ETH Ethereum is similar: it has also taken liquidity below, suggesting the correction may be nearing its initial completion. For trading, consider going long on a small pullback near 2500, targeting a new high. If resistance at 2600–2620 holds and price drops below 2480, then look toward 2400, with the possibility of further downside as it searches for a low.

$XAU Gold has touched resistance at 4220 and is correcting. In line with the trend, wait for a low to go long. Enter around 4150 as originally planned, with a medium-term target of 4300–4500.
灯塔说
·
--
A few thoughts to share:
The sell-off a couple of days ago was attributed to several macro factors, but those factors had been deteriorating for quite some time. In particular, long-term U.S. Treasury yields kept making new highs, while crypto and U.S. stock indices also continued to hit new highs during that period.
This suggests that market pressure is coming not just from interest rates, but also from earnings expectations, positioning risk, and deleveraging.
The minutes from the meeting the day before yesterday also made clear that there will be another rate hike this year. Oil prices rebounded somewhat yesterday, possibly because the risks in the Middle East remain unresolved and the U.S. and Iran are still trying to find common ground. This suggests that with oil prices high, it will be difficult for markets to tighten much in the short term.

Yesterday’s sell-off flushed some leveraged longs out of the market, and short-term selling also appears to be running out of steam. But this is not a signal to buy the dip: the break below multiple support levels on the 4-hour chart has created a bearish structure. Let’s see how the market tests the lows over the next few days before deciding. In the near term, watch resistance around 83,000, with support below at 80,000.

Crude oil is now in a tug-of-war. I closed my short positions around 88 after opening them near 96, and have been trading the swings since. But there’s no clear direction now: will things escalate, or will there be negotiations? Iran is running out of time, though, and Trump will surely make a move around the midterm elections in November. Trade according to the market’s direction. If there’s still no news of negotiations by the end of the month and prices are below 90, I’ll look to trade a rebound.

As I noted yesterday, gold has reached the previously identified support zone of 4,080–4,060, which should bring a rebound. Today’s rebound came as expected. If macro conditions stabilize, gold’s rebound could continue to at least around 4,300–4,500. Stay positioned for buying on dips; if prices pull back to around 4,150 in the short term, I’ll add to my longs.
$BTC $CL $XAU
Verified
A few thoughts to share: The sell-off a couple of days ago was attributed to several macro factors, but those factors had been deteriorating for quite some time. In particular, long-term U.S. Treasury yields kept making new highs, while crypto and U.S. stock indices also continued to hit new highs during that period. This suggests that market pressure is coming not just from interest rates, but also from earnings expectations, positioning risk, and deleveraging. The minutes from the meeting the day before yesterday also made clear that there will be another rate hike this year. Oil prices rebounded somewhat yesterday, possibly because the risks in the Middle East remain unresolved and the U.S. and Iran are still trying to find common ground. This suggests that with oil prices high, it will be difficult for markets to tighten much in the short term. Yesterday’s sell-off flushed some leveraged longs out of the market, and short-term selling also appears to be running out of steam. But this is not a signal to buy the dip: the break below multiple support levels on the 4-hour chart has created a bearish structure. Let’s see how the market tests the lows over the next few days before deciding. In the near term, watch resistance around 83,000, with support below at 80,000. Crude oil is now in a tug-of-war. I closed my short positions around 88 after opening them near 96, and have been trading the swings since. But there’s no clear direction now: will things escalate, or will there be negotiations? Iran is running out of time, though, and Trump will surely make a move around the midterm elections in November. Trade according to the market’s direction. If there’s still no news of negotiations by the end of the month and prices are below 90, I’ll look to trade a rebound. As I noted yesterday, gold has reached the previously identified support zone of 4,080–4,060, which should bring a rebound. Today’s rebound came as expected. If macro conditions stabilize, gold’s rebound could continue to at least around 4,300–4,500. Stay positioned for buying on dips; if prices pull back to around 4,150 in the short term, I’ll add to my longs. $BTC $CL $XAU
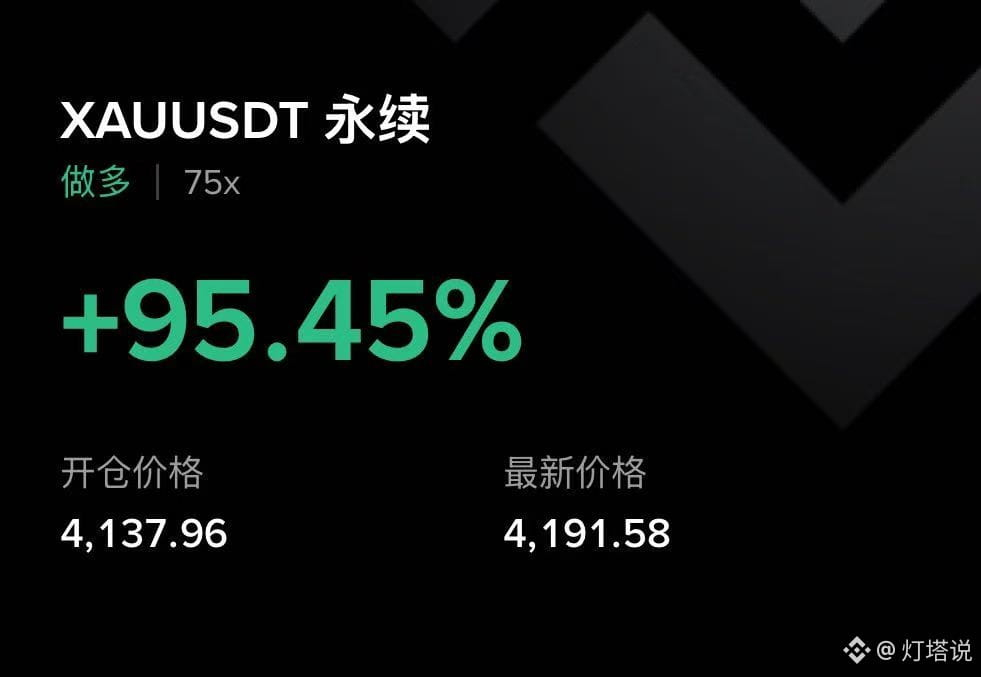
A few thoughts to share:
The sell-off a couple of days ago was attributed to several macro factors, but those factors had been deteriorating for quite some time. In particular, long-term U.S. Treasury yields kept making new highs, while crypto and U.S. stock indices also continued to hit new highs during that period.
This suggests that market pressure is coming not just from interest rates, but also from earnings expectations, positioning risk, and deleveraging.
The minutes from the meeting the day before yesterday also made clear that there will be another rate hike this year. Oil prices rebounded somewhat yesterday, possibly because the risks in the Middle East remain unresolved and the U.S. and Iran are still trying to find common ground. This suggests that with oil prices high, it will be difficult for markets to tighten much in the short term.

Yesterday’s sell-off flushed some leveraged longs out of the market, and short-term selling also appears to be running out of steam. But this is not a signal to buy the dip: the break below multiple support levels on the 4-hour chart has created a bearish structure. Let’s see how the market tests the lows over the next few days before deciding. In the near term, watch resistance around 83,000, with support below at 80,000.

Crude oil is now in a tug-of-war. I closed my short positions around 88 after opening them near 96, and have been trading the swings since. But there’s no clear direction now: will things escalate, or will there be negotiations? Iran is running out of time, though, and Trump will surely make a move around the midterm elections in November. Trade according to the market’s direction. If there’s still no news of negotiations by the end of the month and prices are below 90, I’ll look to trade a rebound.

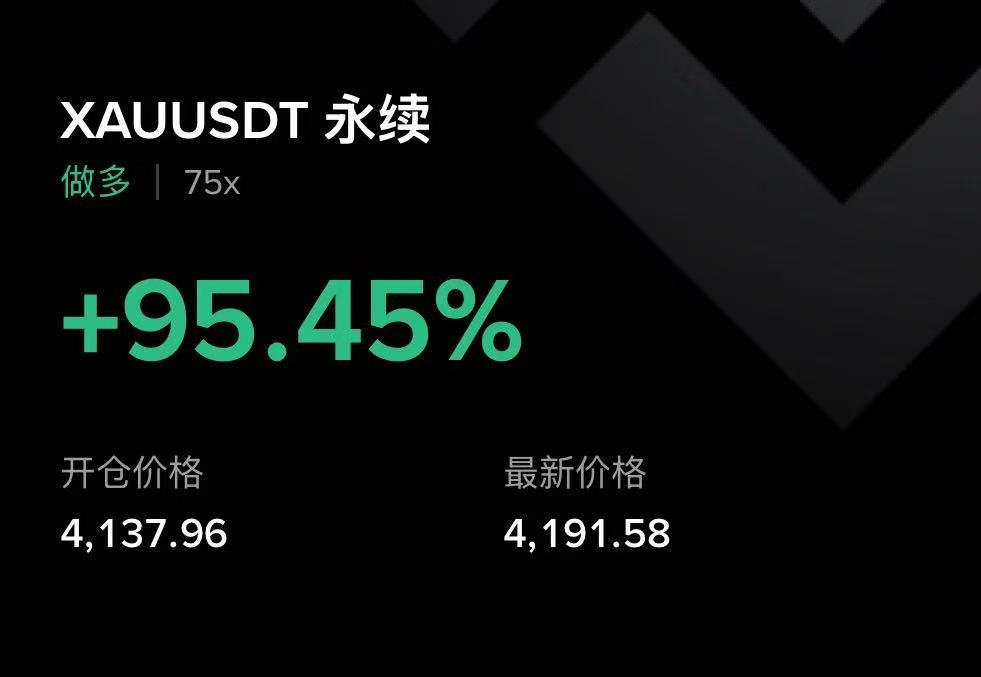
As I noted yesterday, gold has reached the previously identified support zone of 4,080–4,060, which should bring a rebound. Today’s rebound came as expected. If macro conditions stabilize, gold’s rebound could continue to at least around 4,300–4,500. Stay positioned for buying on dips; if prices pull back to around 4,150 in the short term, I’ll add to my longs.
$BTC $CL $XAU
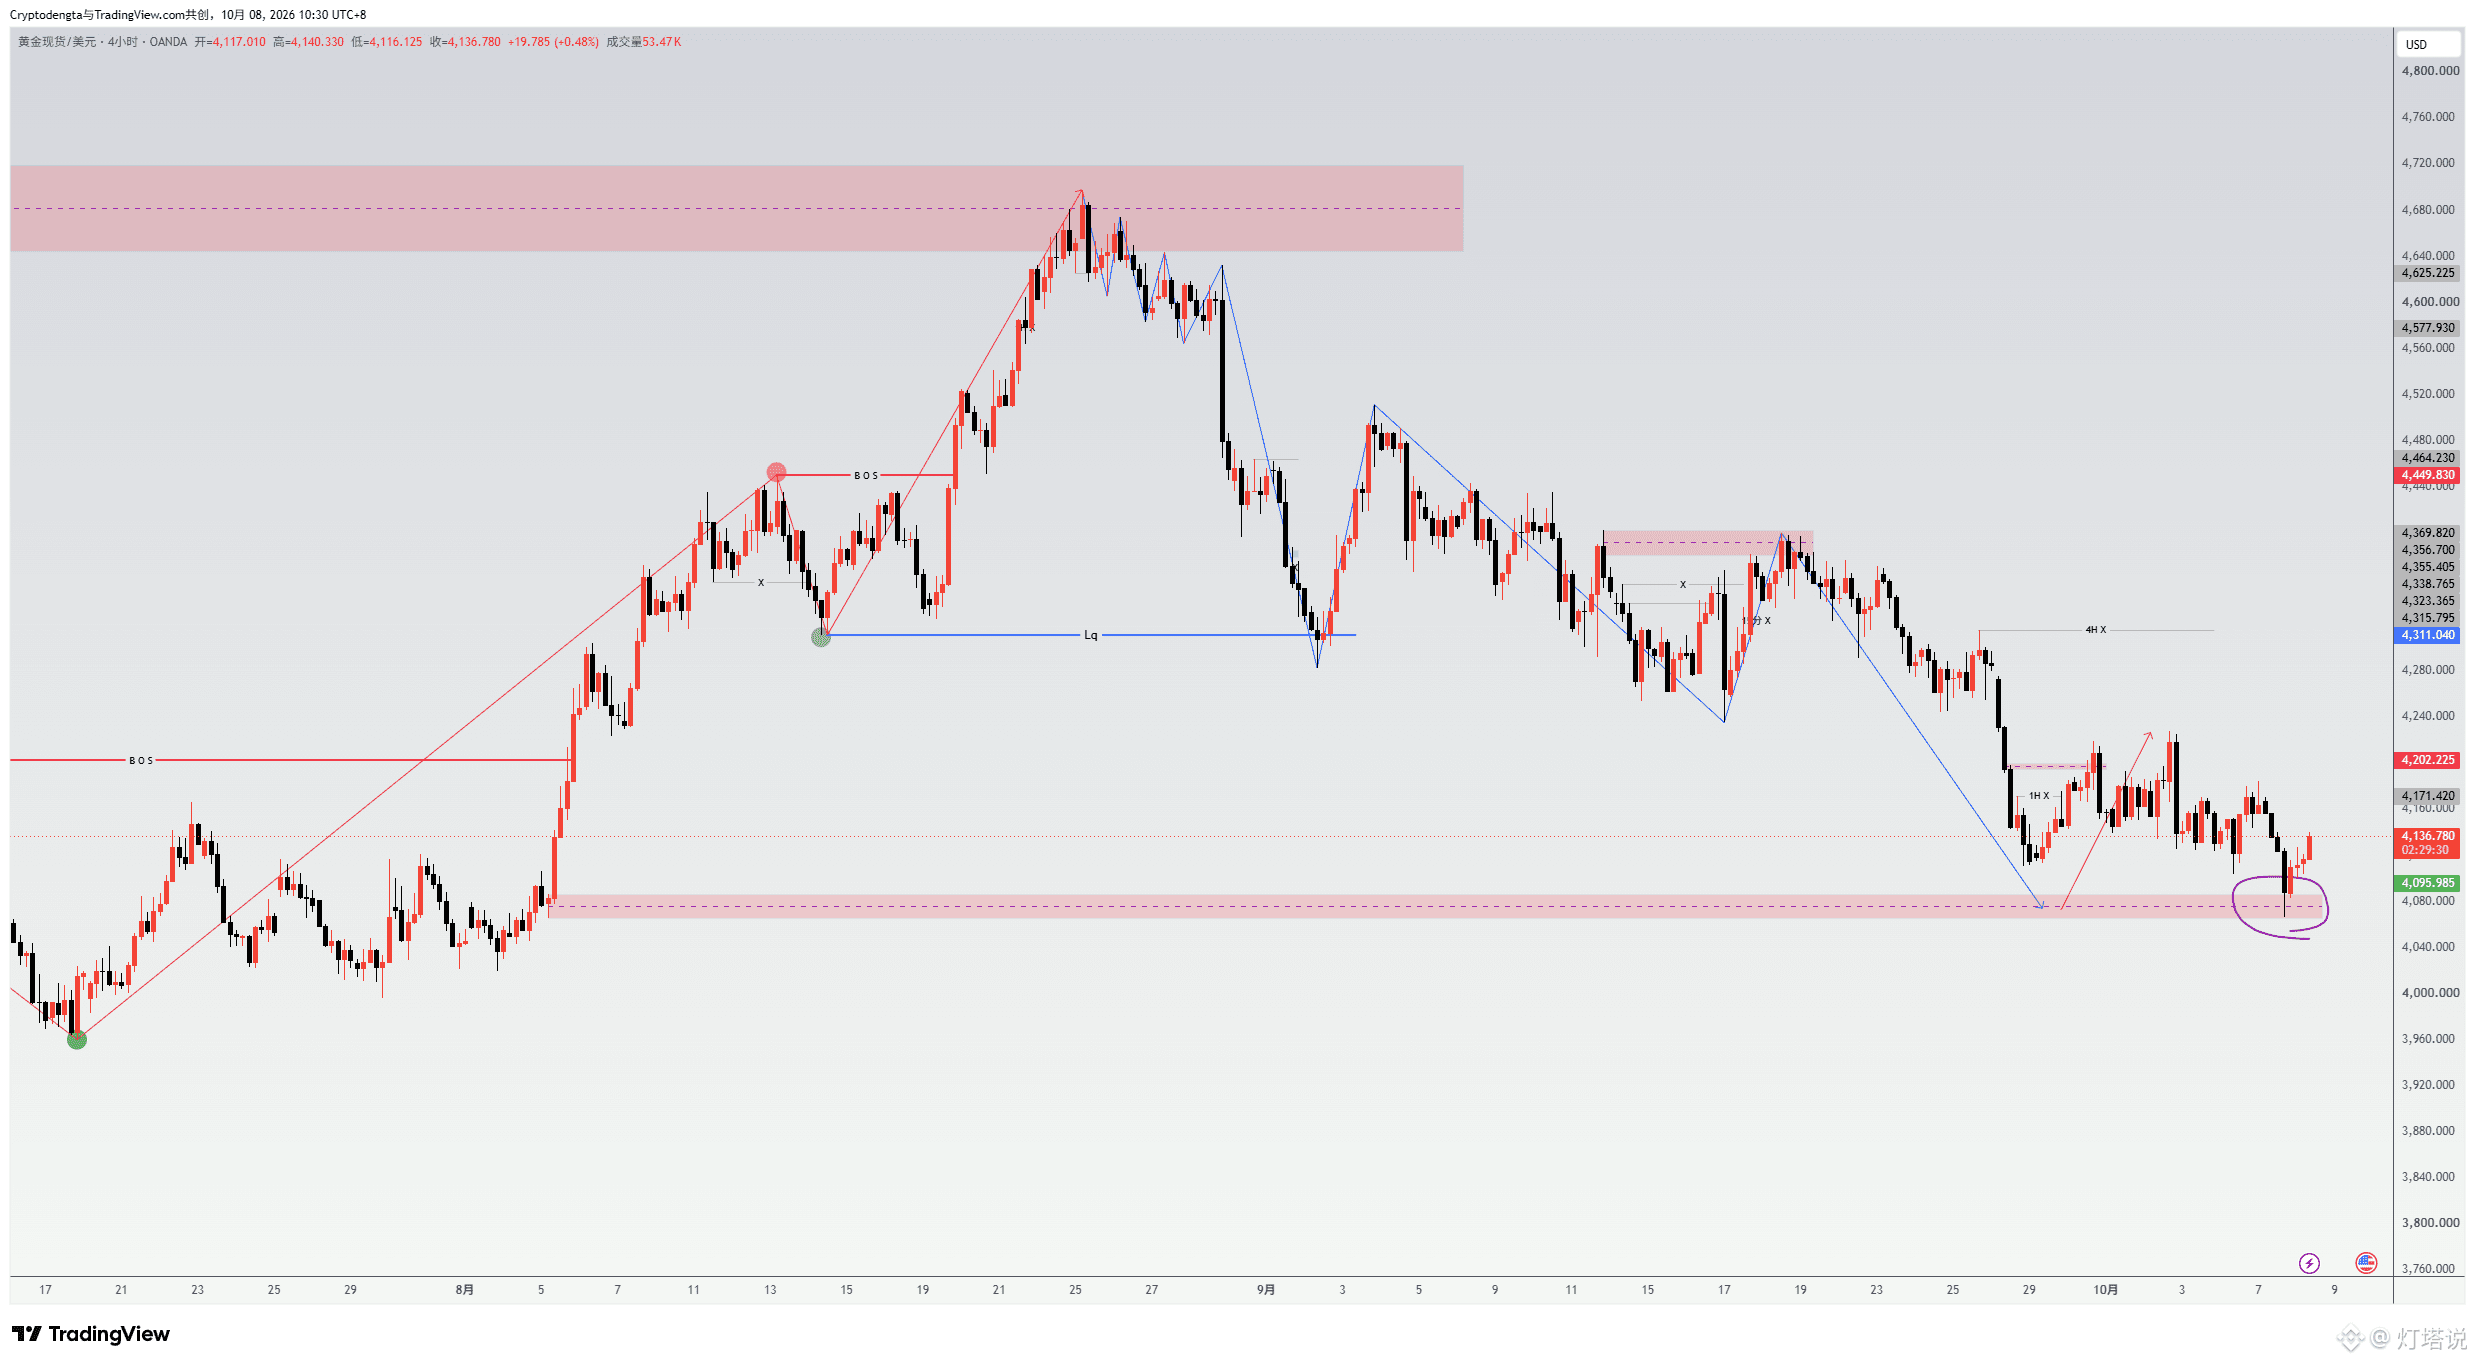
灯塔说
·
--
Gold reached the previously mentioned support zone around 4065–4080 and made its first rebound.
If it confirms that the decline has stopped,
gold may finally see a rebound.
$XAU
Gold reached the previously mentioned support zone around 4065–4080 and made its first rebound. If it confirms that the decline has stopped, gold may finally see a rebound. $XAU {future}(XAUUSDT)
Gold reached the previously mentioned support zone around 4065–4080 and made its first rebound.
If it confirms that the decline has stopped,
gold may finally see a rebound.
$XAU
灯塔说
·
--
Gold market:

Gold is currently continuing a 4-hour downtrend

This correction could fall to around 4000

For the key support on the 4-hour timeframe, watch the area around 4065–4085

If there is a structural shift on the smaller cycle here,

it would be a good bottom-buying opportunity.

$XAU

Verified
One long-form read per week: This week, I read an article about AI. It mainly addresses “Does AI really have a bubble?” When AI investments truly become oversupplied, who will ultimately pay the bill? According to estimates, cumulative investment in US AI data centers, chips, power, and network infrastructure from 2025 to 2032 could reach an astonishing $10.3 trillion. On average, that would be about 3.63% of the US GDP per year. Measured against economic scale, this even surpasses the construction booms in US history—railways, highways, electrification, and communications infrastructure. So can AI earn enough money to justify all this? If it can’t, then who will be responsible for the money already spent? When investments rely on cash flow, when the bubble bursts, first and foremost, shareholders are harmed. But when more and more investment starts to be supported by debt, SPVs, private credit, and asset securitization, the story changes. Because when the next real turning point in the AI cycle arrives, what we may need to watch won’t be just the Nasdaq. It will be— whether cracks appear first in the credit market. If they do, that crack may be the signal that this round of AI’s mega-capex supercycle has truly entered its second half. Although this kind of risk hasn’t appeared yet, the risks are becoming harder and harder to see. $BTC
One long-form read per week:

This week, I read an article about AI. It mainly addresses
“Does AI really have a bubble?”

When AI investments truly become oversupplied, who will ultimately pay the bill?

According to estimates, cumulative investment in US AI data centers, chips, power, and network infrastructure from 2025 to 2032 could reach an astonishing $10.3 trillion. On average, that would be about 3.63% of the US GDP per year. Measured against economic scale, this even surpasses the construction booms in US history—railways, highways, electrification, and communications infrastructure.

So can AI earn enough money to justify all this? If it can’t, then who will be responsible for the money already spent?

When investments rely on cash flow,
when the bubble bursts,
first and foremost, shareholders are harmed.
But when more and more investment starts to be supported by debt, SPVs, private credit, and asset securitization,
the story changes.
Because when the next real turning point in the AI cycle arrives,
what we may need to watch won’t be just the Nasdaq.
It will be—

whether cracks appear first in the credit market.

If they do,
that crack may be the signal that this round of AI’s mega-capex supercycle has truly entered its second half.

Although this kind of risk hasn’t appeared yet,
the risks are becoming harder and harder to see.
$BTC
After the Non-Farm Payrolls were released, I instinctively wanted to chase a long. But after waiting 15 minutes, I realized this should be the kind of data that would trigger a big rally in price— yet it never really broke out. Based on the data and the price action over the past two days, I chose to short 87K. And I successfully took profit. In the community, I shared this in advance. $BTC
After the Non-Farm Payrolls were released, I instinctively wanted to chase a long.
But after waiting 15 minutes,
I realized this should be the kind of data that would trigger a big rally in price—
yet it never really broke out.

Based on the data and the price action over the past two days,
I chose to short 87K.

And I successfully took profit.
In the community, I shared this in advance.
$BTC
灯塔说
·
--
The nonfarm payrolls release value deviated seriously from expectations
and is extremely bearish for the U.S. dollar.
Although expectations for further rate hikes continue to be lowered,
being far below expectations instead makes the market worry whether an economic recession is impacting things.
After a modest spike higher, the market consolidates—possibly because the market has already priced in the positive move in advance over the past two days.

If macro factors don’t cause a breakout,
then be careful: a move that keeps trying but doesn’t achieve results.
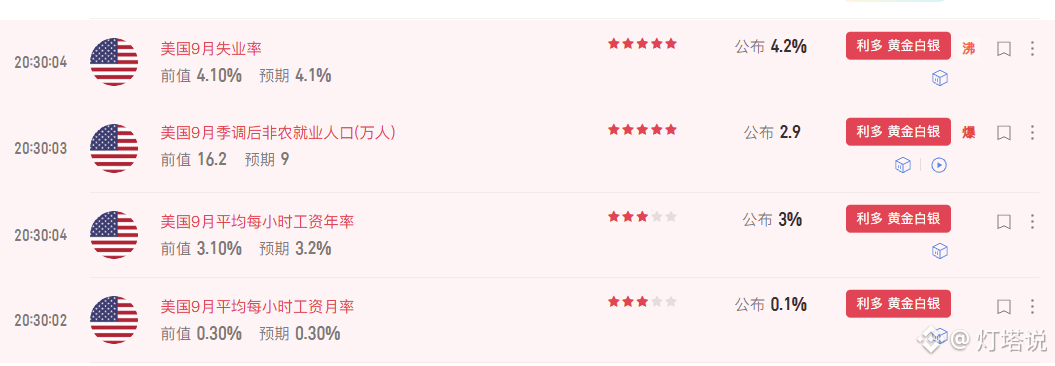
The nonfarm payrolls release value deviated seriously from expectations and is extremely bearish for the U.S. dollar. Although expectations for further rate hikes continue to be lowered, being far below expectations instead makes the market worry whether an economic recession is impacting things. After a modest spike higher, the market consolidates—possibly because the market has already priced in the positive move in advance over the past two days. If macro factors don’t cause a breakout, then be careful: a move that keeps trying but doesn’t achieve results.
The nonfarm payrolls release value deviated seriously from expectations
and is extremely bearish for the U.S. dollar.
Although expectations for further rate hikes continue to be lowered,
being far below expectations instead makes the market worry whether an economic recession is impacting things.
After a modest spike higher, the market consolidates—possibly because the market has already priced in the positive move in advance over the past two days.

If macro factors don’t cause a breakout,
then be careful: a move that keeps trying but doesn’t achieve results.
灯塔说
·
--
This evening’s Non-Farm Payrolls (NFP): market expectations are for an increase of 90,000 jobs. I think the published figure to watch is 80,000–100,000.

A Reuters survey expects 90,000, the Dow Jones survey expects 84,000, and this week’s ADP report is also 90,000. Compared with last month’s 162,000, I’m more inclined to believe hiring is cooling, but it’s not yet at the point of a slowdown.

However, a pullback doesn’t necessarily mean good news—markets were already waiting for a pullback.

To add fuel to the rebound for BTC and ETH, even if the result matches expectations, we still need to look at wages: if the hourly wage month-over-month falls to 0.2%, and the unemployment rate stays at 4.1%, I would view this combination more positively.

So, if employment numbers meet expectations, then wages are what may determine tonight’s surprise.
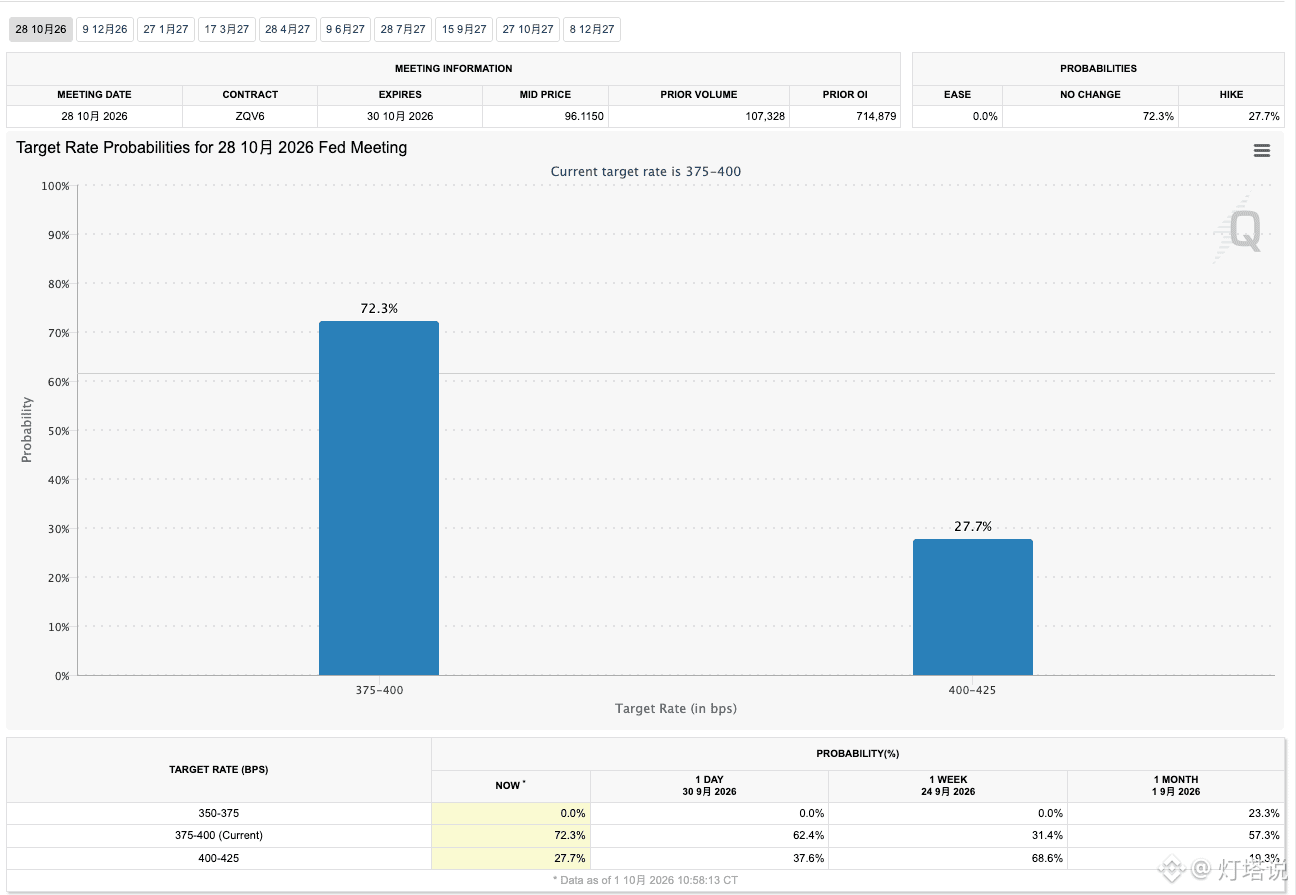
After the Wednesday PCE data came out, expectations for a rate hike in October fell from 66% to the current 27.7%. The nonfarm payrolls data tonight will refocus the market again. But judging from the BTC rally from last night to today, the market seems to be anticipating that tonight’s nonfarm payrolls will come in within expectations. There probably won’t be strong data or numbers that are unexpectedly cold. As long as employment data does not see a strong rebound, the probability of a rate hike will not rise significantly. So, if tonight’s employment report comes in within the range, first check whether the hourly wage rate also falls below expectations. If it’s above expectations, then don’t get overly bullish.
After the Wednesday PCE data came out, expectations for a rate hike in October fell from 66% to the current 27.7%.
The nonfarm payrolls data tonight will refocus the market again.
But judging from the BTC rally from last night to today,
the market seems to be anticipating that tonight’s nonfarm payrolls will come in within expectations.
There probably won’t be strong data or numbers that are unexpectedly cold.

As long as employment data does not see a strong rebound,
the probability of a rate hike will not rise significantly.

So, if tonight’s employment report comes in within the range, first check whether the hourly wage rate also falls below expectations.
If it’s above expectations, then don’t get overly bullish.
Verified
This evening’s Non-Farm Payrolls (NFP): market expectations are for an increase of 90,000 jobs. I think the published figure to watch is 80,000–100,000. A Reuters survey expects 90,000, the Dow Jones survey expects 84,000, and this week’s ADP report is also 90,000. Compared with last month’s 162,000, I’m more inclined to believe hiring is cooling, but it’s not yet at the point of a slowdown. However, a pullback doesn’t necessarily mean good news—markets were already waiting for a pullback. To add fuel to the rebound for BTC and ETH, even if the result matches expectations, we still need to look at wages: if the hourly wage month-over-month falls to 0.2%, and the unemployment rate stays at 4.1%, I would view this combination more positively. So, if employment numbers meet expectations, then wages are what may determine tonight’s surprise.
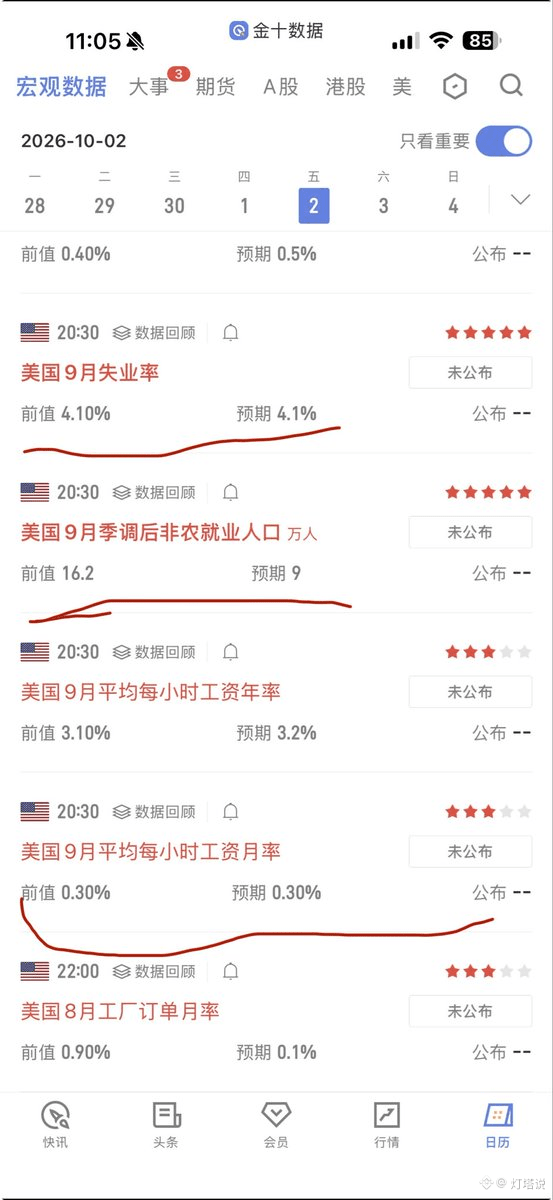
This evening’s Non-Farm Payrolls (NFP): market expectations are for an increase of 90,000 jobs. I think the published figure to watch is 80,000–100,000.

A Reuters survey expects 90,000, the Dow Jones survey expects 84,000, and this week’s ADP report is also 90,000. Compared with last month’s 162,000, I’m more inclined to believe hiring is cooling, but it’s not yet at the point of a slowdown.

However, a pullback doesn’t necessarily mean good news—markets were already waiting for a pullback.

To add fuel to the rebound for BTC and ETH, even if the result matches expectations, we still need to look at wages: if the hourly wage month-over-month falls to 0.2%, and the unemployment rate stays at 4.1%, I would view this combination more positively.

So, if employment numbers meet expectations, then wages are what may determine tonight’s surprise.
Verified
In sync: Below expectations—tonight’s released U.S. core PCE year-over-year rate is lower than expected, hitting a new six-month low. It eases the pressure for further rate hikes. Next, all eyes are on the U.S. nonfarm payrolls report for September to be released on October 2. As long as expectations stay below 60%, Wosh’s style will hold steady and do nothing. As long as there isn’t another rate hike, the market will improve and the pullback may end early. Also, crude oil has already gone flat from the short side; preparing for a swing trade. The U.S. and Iran are locked in a standoff, neither backing down. If it rebounds, look for a higher point to short again.$BTC $CL
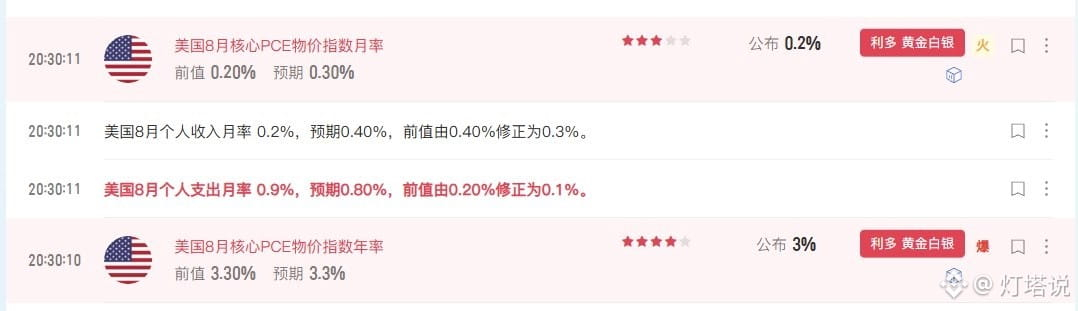
In sync: Below expectations—tonight’s released U.S. core PCE year-over-year rate is lower than expected, hitting a new six-month low.
It eases the pressure for further rate hikes.
Next, all eyes are on the U.S. nonfarm payrolls report for September to be released on October 2.
As long as expectations stay below 60%, Wosh’s style will hold steady and do nothing.
As long as there isn’t another rate hike, the market will improve and the pullback may end early.

Also, crude oil has already gone flat from the short side; preparing for a swing trade. The U.S. and Iran are locked in a standoff, neither backing down.
If it rebounds, look for a higher point to short again.$BTC $CL
Don't wait until crude oil drops to $80 before regretting that you didn't go short A ceasefire is the main storyline right now If you pause for a while, maybe it will flare up again But right now is the best time on the left side $CL
Don't wait until crude oil drops to $80 before regretting that you didn't go short

A ceasefire is the main storyline right now

If you pause for a while, maybe it will flare up again

But right now is the best time on the left side
$CL
灯塔说
·
--
Crude Oil Market:

Trump is using “Figure 1” every day to “numb” the market

Last night, we saw another精彩 “dialogue.” Saudi media reported that Iran has agreed to stop uranium enrichment in exchange for the United States easing sanctions. But this was quickly denied by Iranian officials, and Trump also denied this morning any easing of sanctions against Iran and the release of frozen funds in exchange for Iran taking substantive steps on the nuclear issue.

Yesterday, crude oil prices fell from 96 to 91, and are currently rebounding around 93–94.
I’m holding my crude short positions at 96–95, and it’s almost making me sick.

Now, the U.S. and Iran are in a standoff. The good news is there are no shelling sounds; a third party is still mediating. The bad news is that neither side is willing to back down.

Here’s an experience-based tip: once negotiations actually become effective, don’t miss the crude oil sell-off—at least a 10-point move as a starting point, with targets directly at 83–85. If the gunfire resumes, abandon every single short position.
$CL

Log in to explore more content
Join global crypto users on Binance Square
⚡️ Get latest and useful information about crypto.
💬 Trusted by the world’s largest crypto exchange.
👍 Discover real insights from verified creators.
Email / Phone number
Sitemap
Cookie Preferences
Platform T&Cs