

CryptoChan 熊猫
2.1k Posts

CryptoChan 熊猫
 Square Verified
Bitcoin on-chain & cycle analysis,比特币链上行情分析
|| NFA & DYOR
|| X:CryptoChan 熊猫(@0xCryptoChan)

Top traders by profit in 30D

Excellence Award (OnChain)

原创之星
15 Following
23.0K+ Followers
43.3K+ Liked
4 Badges
Posts
All
Quotes
PINNED
CryptoChan 熊猫
·
--
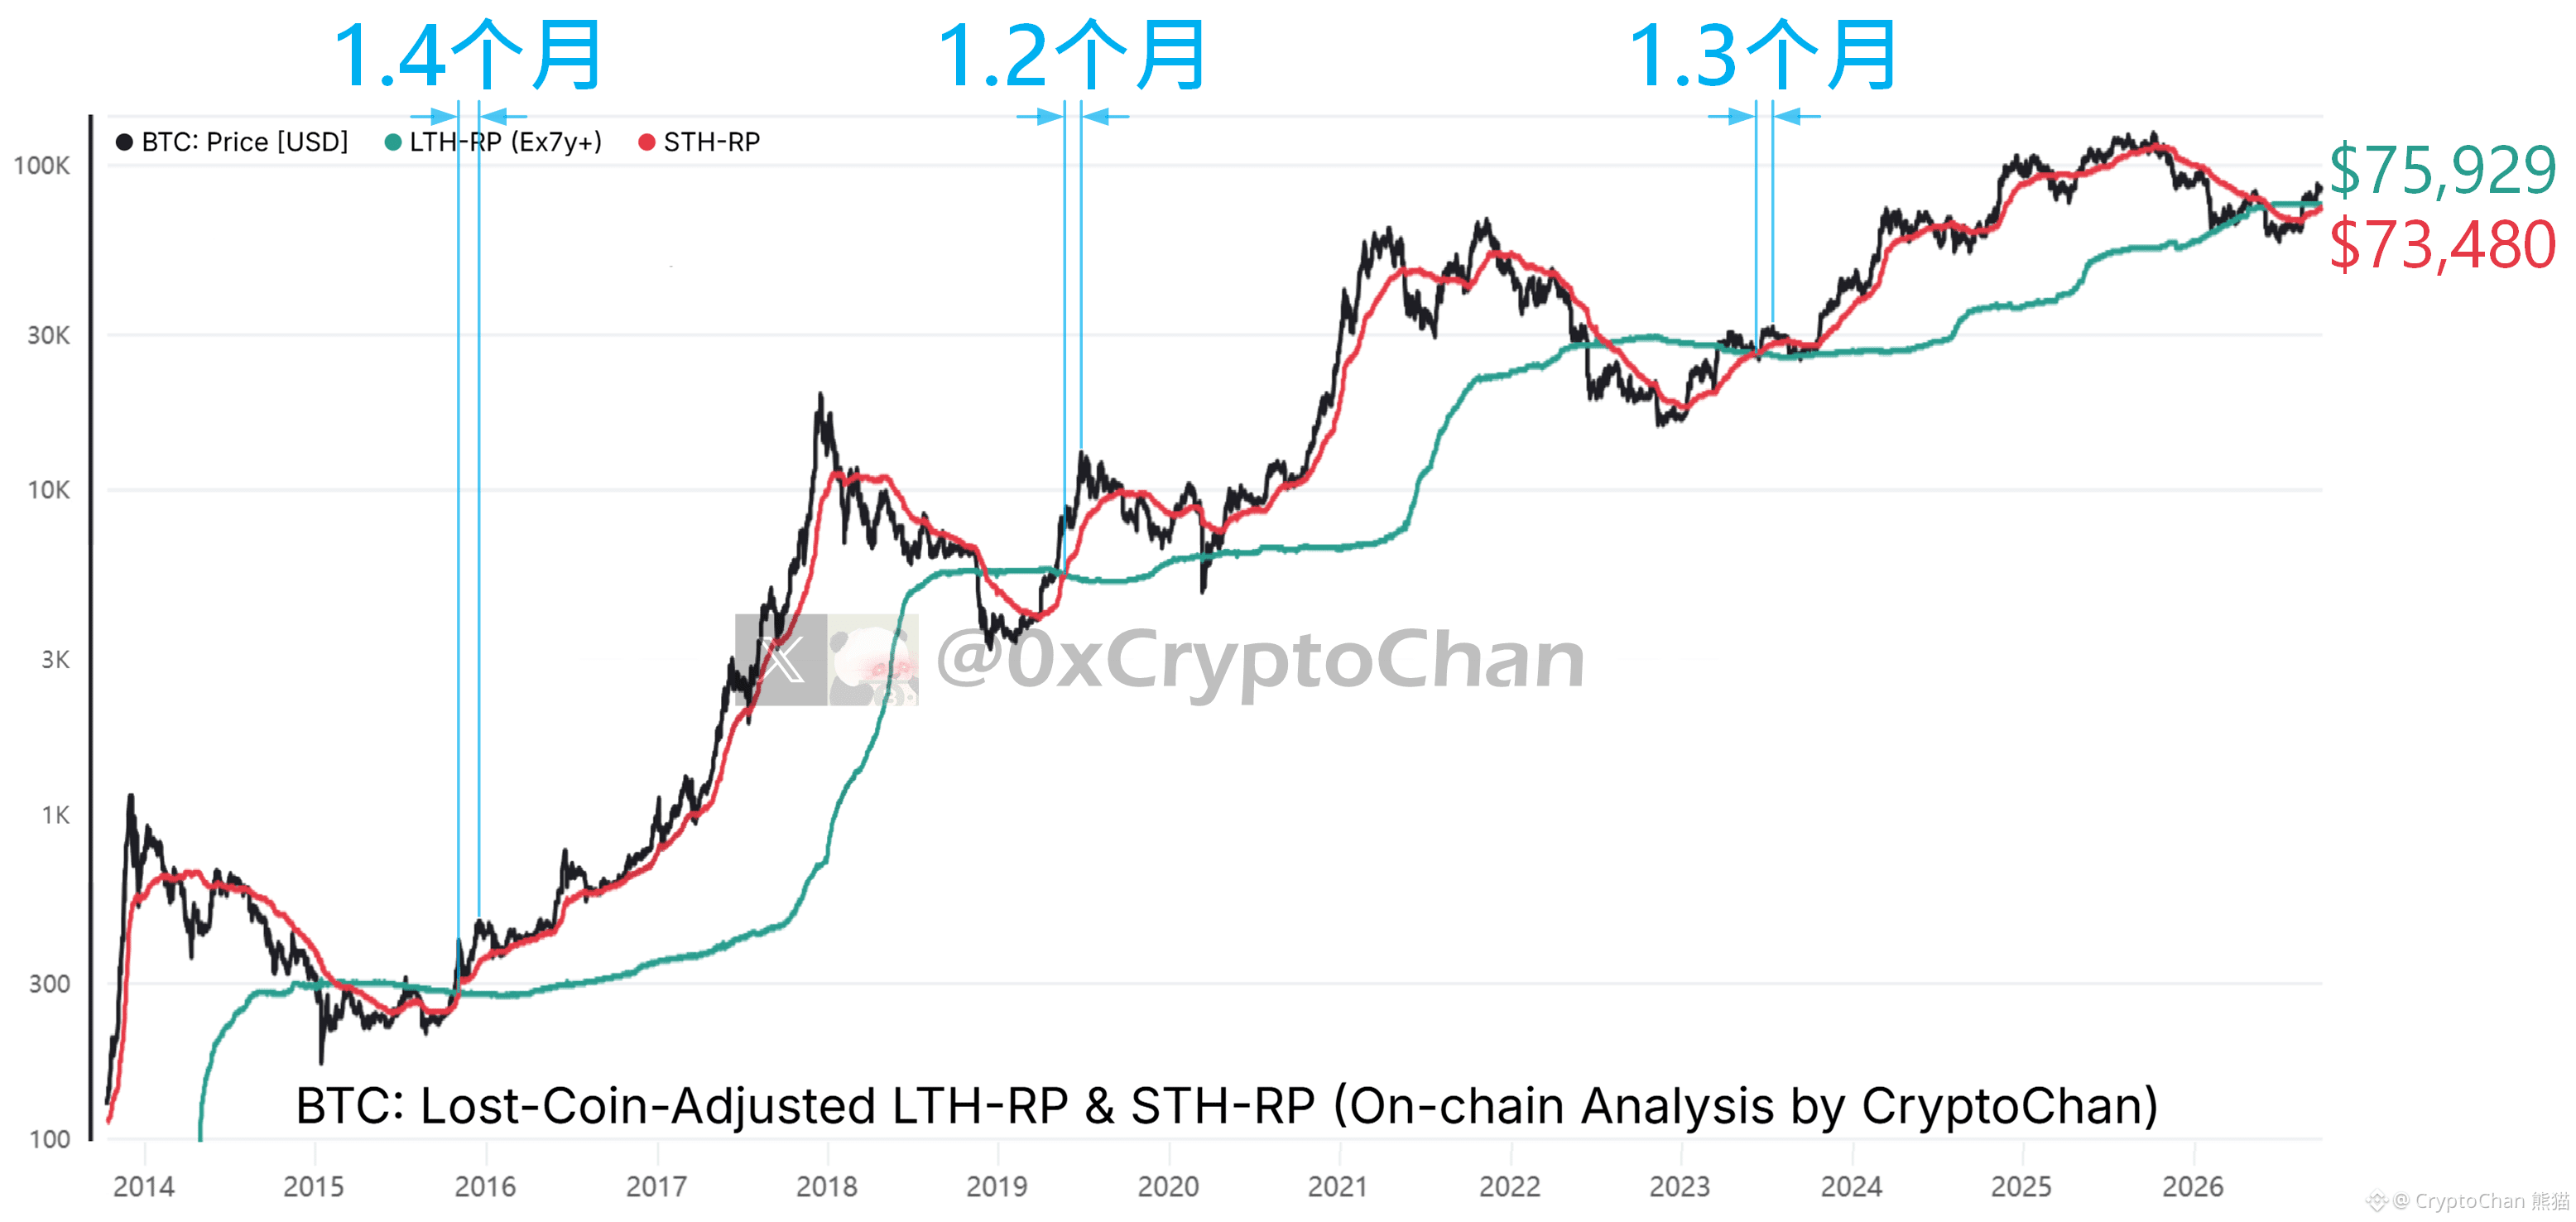
【 $BTC four-year cycle series 86】
November 2015: The red line breaks through the green line — 1.4 months later to the bull market recovery top
May 2019: The red line breaks through the green line — 1.2 months later to the bull market recovery top
June 2023: The red line breaks through the green line — 1.3 months later to the bull market recovery top
┌─ 🐼 Indicator Details ─┐
Red line: Average buy-in price of on-chain short-term holders’ coin lots
Green line: Average buy-in price of on-chain long-term holders’ coin lots (excluding BTC that hasn’t moved in >7 years)
November 2015: The red line breaks through the green line — 1.4 months later to the bull market recovery top
May 2019: The red line breaks through the green line — 1.2 months later to the bull market recovery top
June 2023: The red line breaks through the green line — 1.3 months later to the bull market recovery top
┌─ 🐼 Indicator Details ─┐
Red line: Average buy-in price of on-chain short-term holders’ coin lots
Green line: Average buy-in price of on-chain long-term holders’ coin lots (excluding BTC that hasn’t moved in >7 years)
CryptoChan 熊猫
·
--
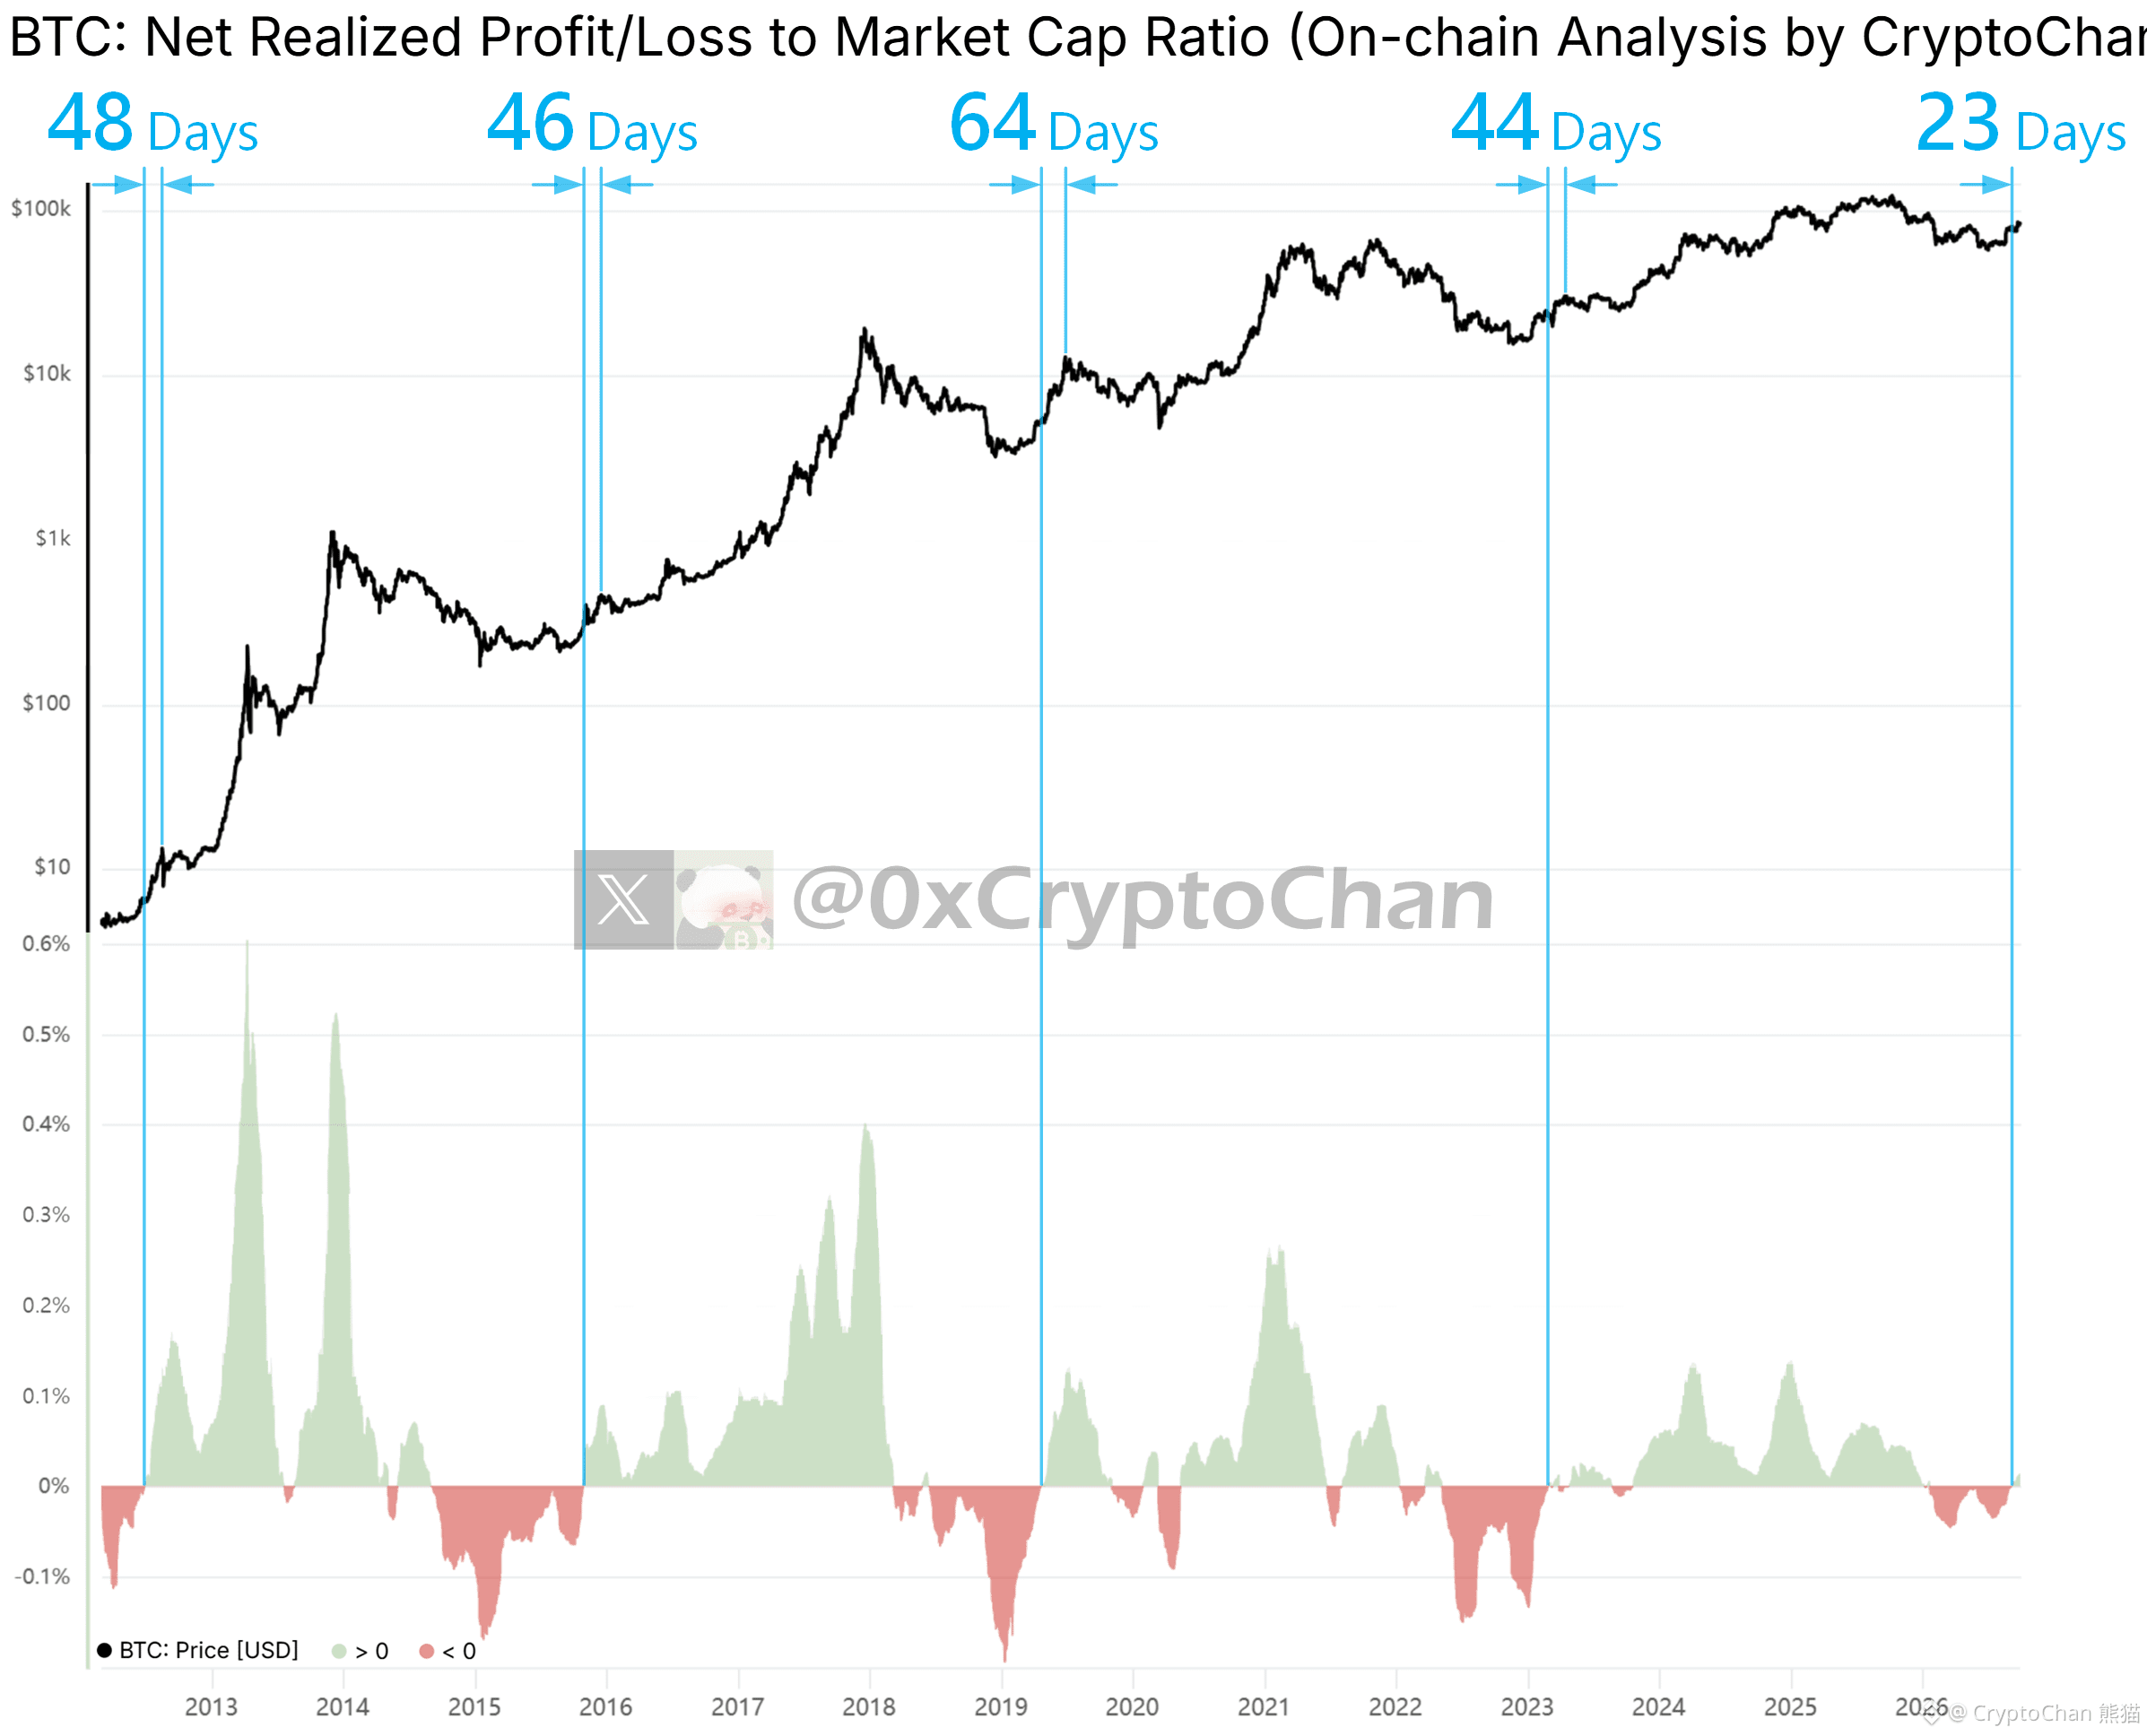
【 $BTC four-year cycle series 85】
2012 red to green: 48 days later, reaches the bull market recovery top
2015 red to green: 46 days later, reaches the bull market recovery top
2019 red to green: 64 days later, reaches the bull market recovery top
2023 red to green: 44 days later, reaches the bull market recovery secondary top
2026 red to green: 23 days have already passed
┌── 🐼 On-chain data details ──┐
The indicator at the bottom of the chart is the percentage of total market cap represented by Bitcoin’s 60-day net realized profit/loss (USD).<0 red, >0 green
2012 red to green: 48 days later, reaches the bull market recovery top
2015 red to green: 46 days later, reaches the bull market recovery top
2019 red to green: 64 days later, reaches the bull market recovery top
2023 red to green: 44 days later, reaches the bull market recovery secondary top
2026 red to green: 23 days have already passed
┌── 🐼 On-chain data details ──┐
The indicator at the bottom of the chart is the percentage of total market cap represented by Bitcoin’s 60-day net realized profit/loss (USD).<0 red, >0 green
CryptoChan 熊猫
·
--
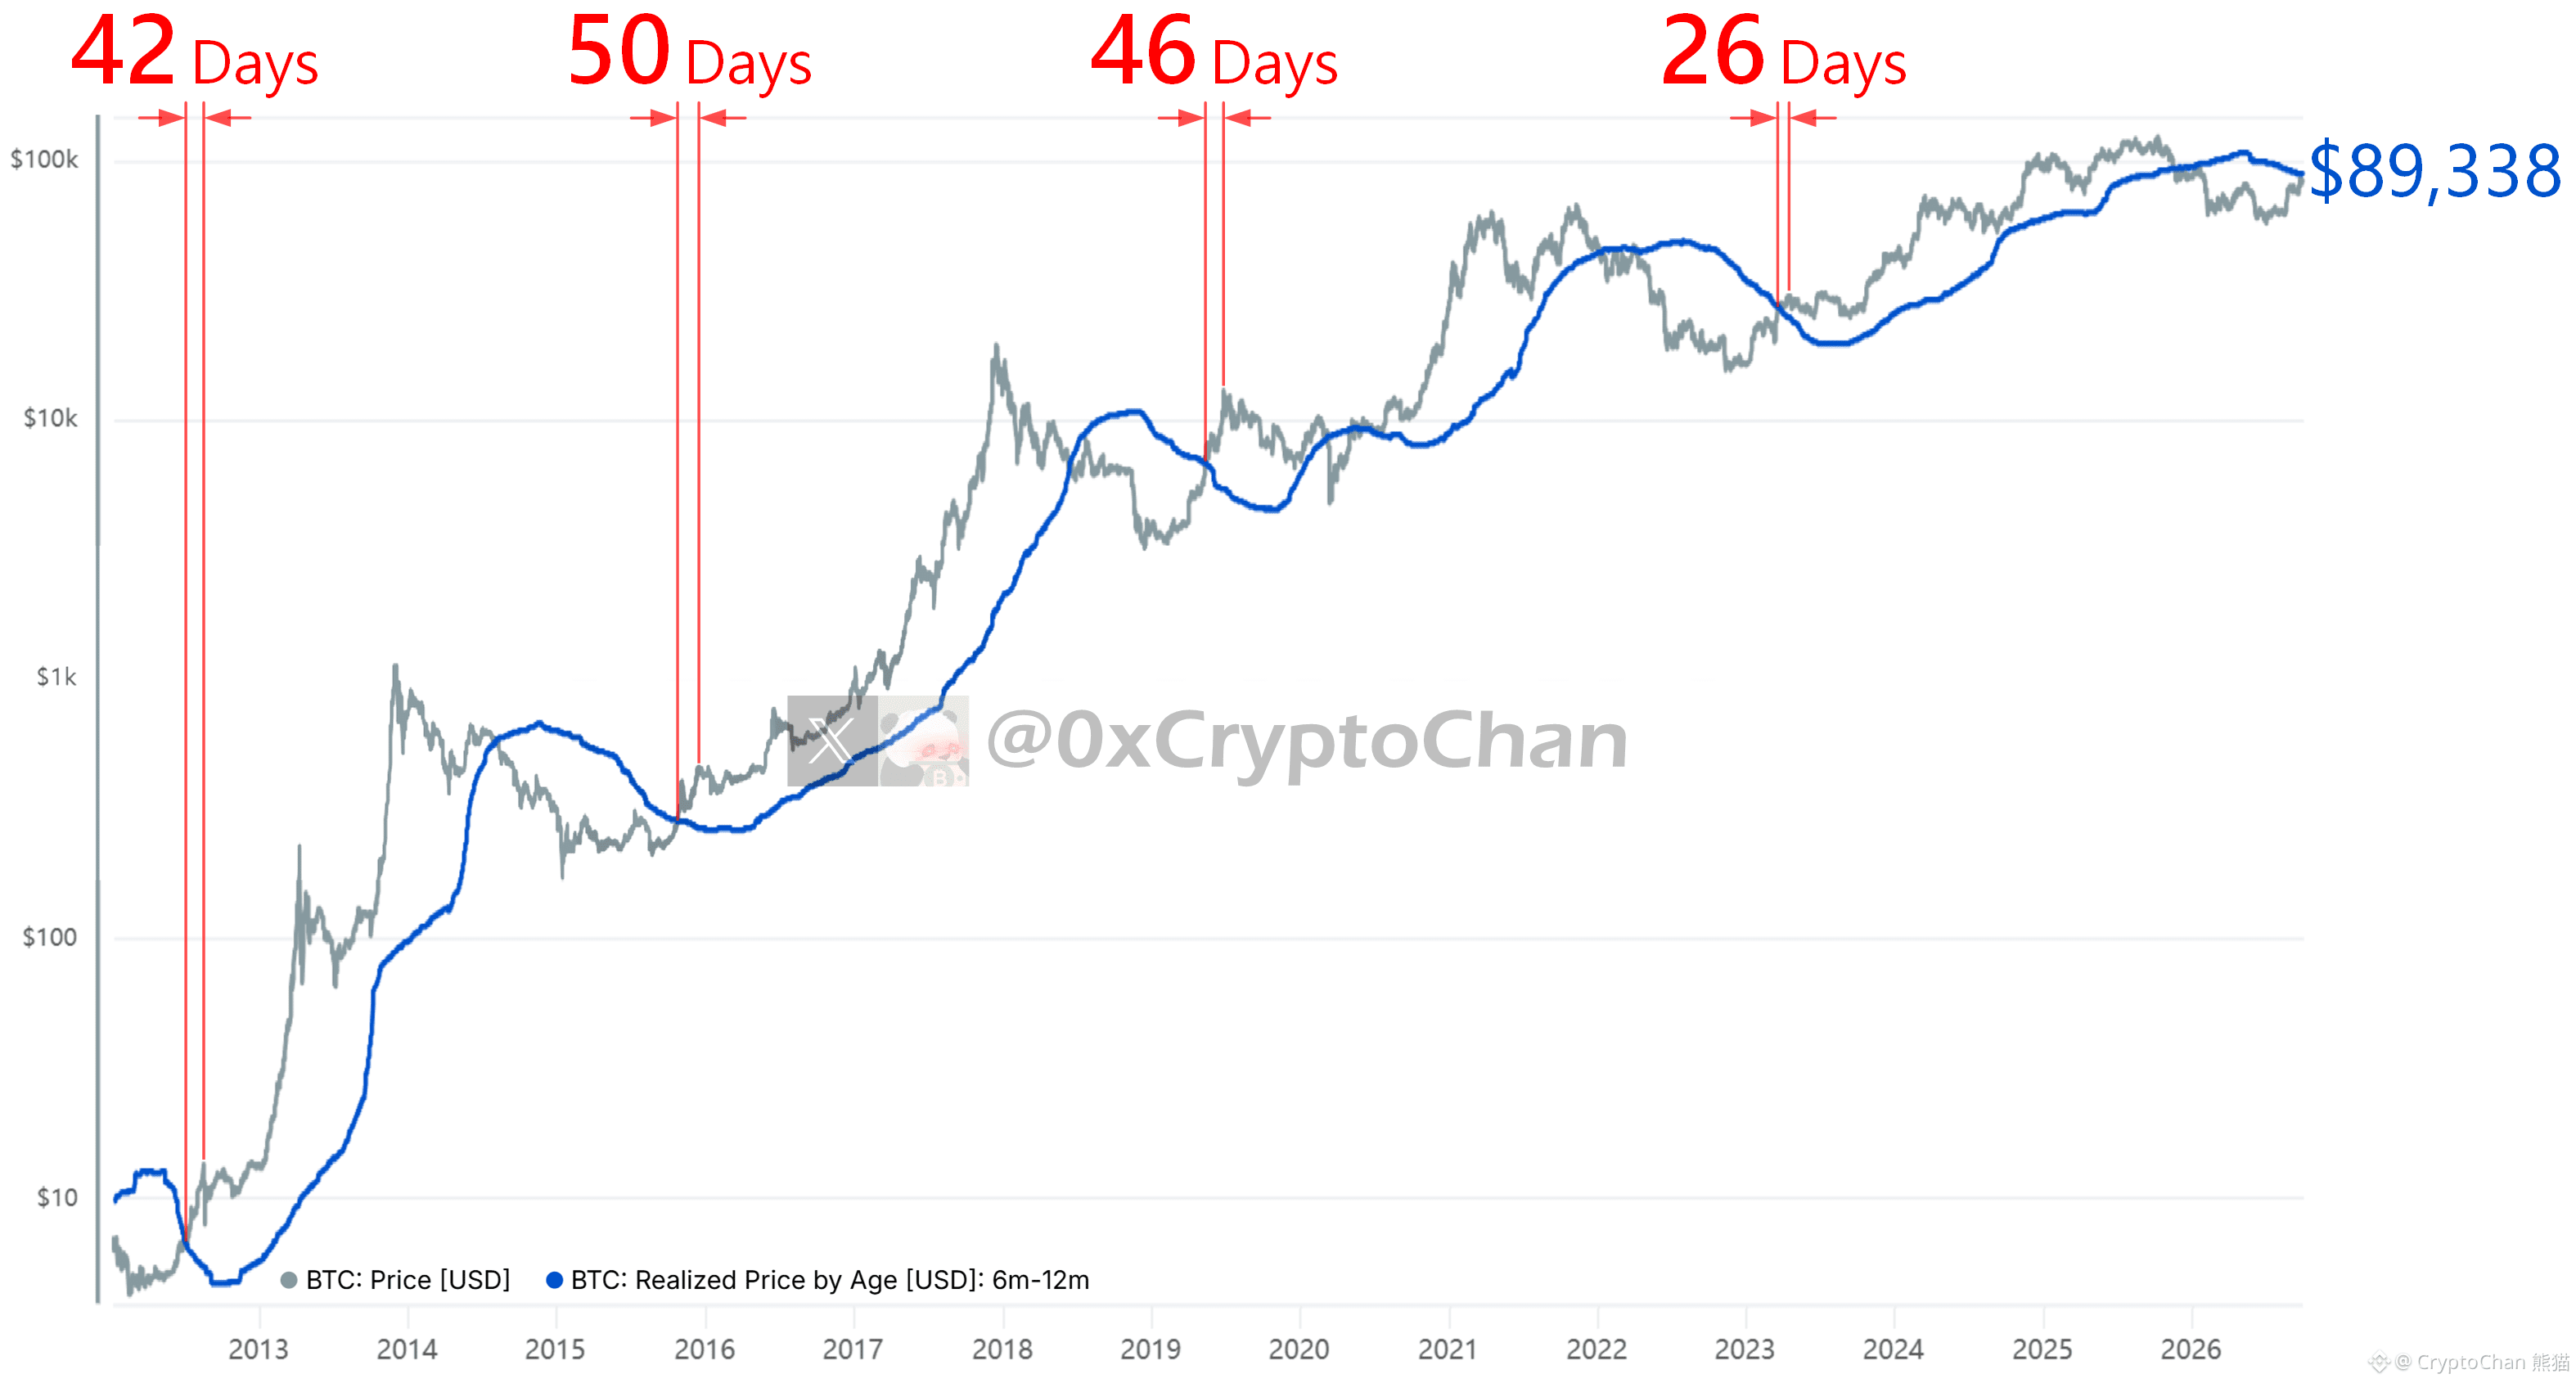
【 $BTC four-year cycle series 84】
In 2012, the BTC price broke through the blue line: the bull market recovery top came 42 days later
In 2015, the BTC price broke through the blue line: the bull market recovery top came 50 days later
In 2019, the BTC price broke through the blue line: the bull market recovery top came 46 days later
In 2023, the BTC price broke through the blue line: the bull market recovery secondary top came 26 days later
Current blue line: $89,338
┌── 🐼 Indicator Details ──┐
Grey line: Bitcoin price
Blue line: the average buy price of BTC held on-chain for 6–12 months
In 2012, the BTC price broke through the blue line: the bull market recovery top came 42 days later
In 2015, the BTC price broke through the blue line: the bull market recovery top came 50 days later
In 2019, the BTC price broke through the blue line: the bull market recovery top came 46 days later
In 2023, the BTC price broke through the blue line: the bull market recovery secondary top came 26 days later
Current blue line: $89,338
┌── 🐼 Indicator Details ──┐
Grey line: Bitcoin price
Blue line: the average buy price of BTC held on-chain for 6–12 months
CryptoChan 熊猫
·
--
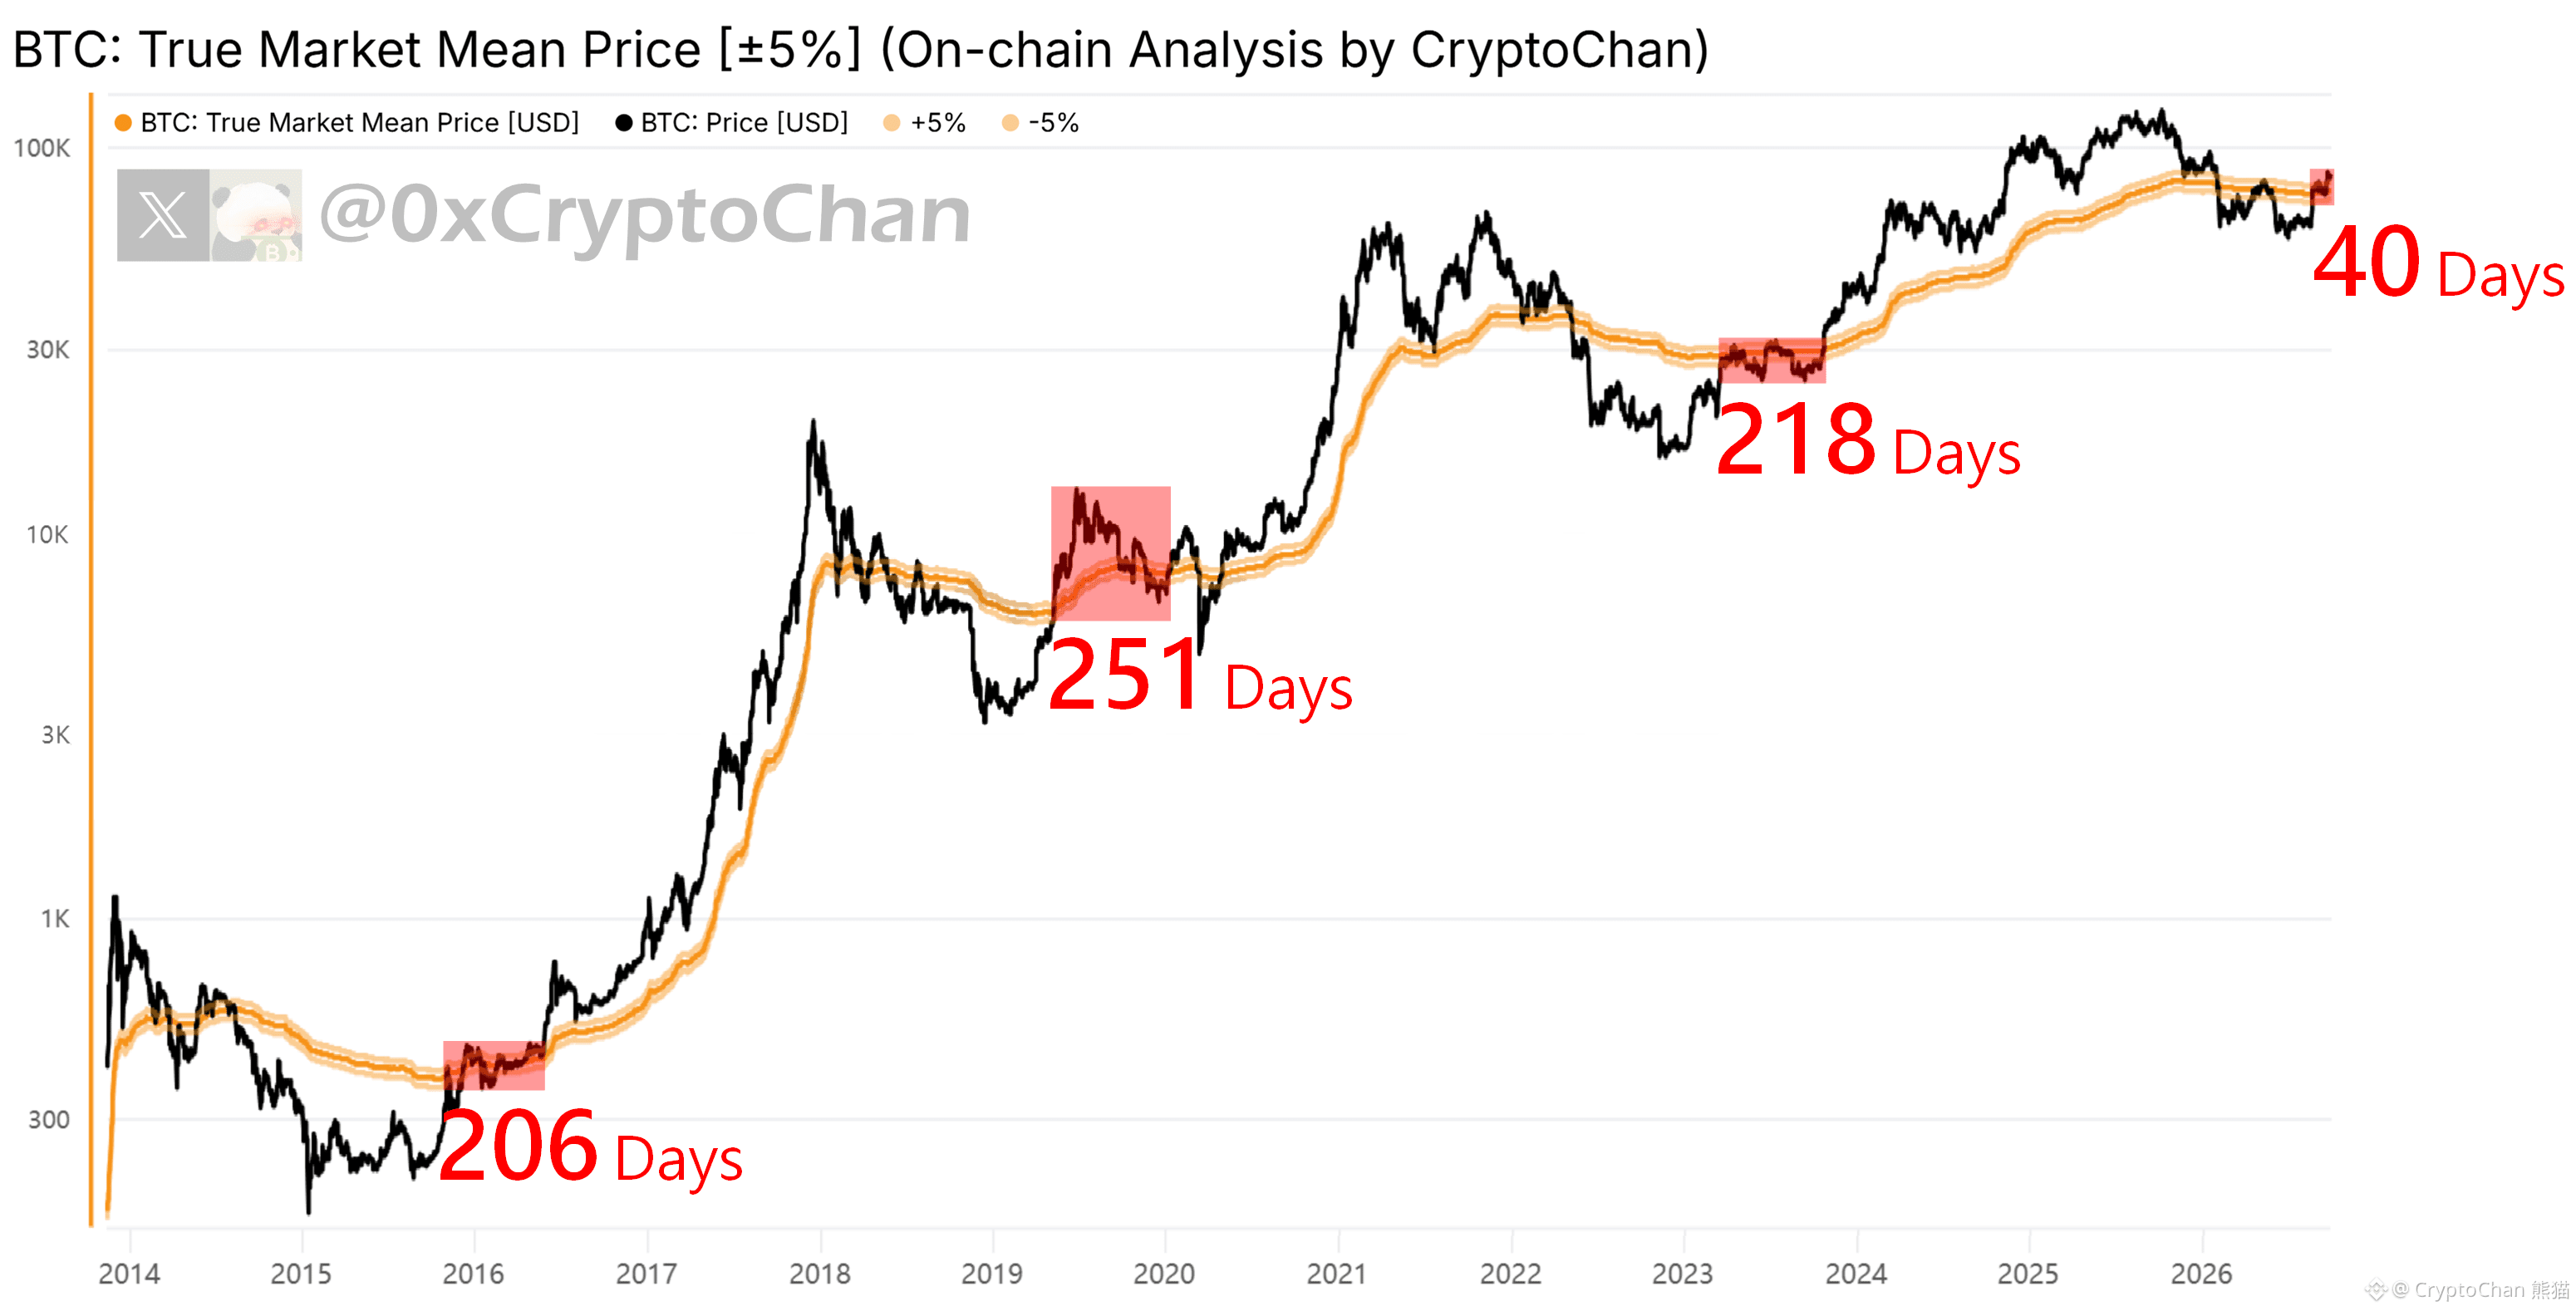
【 $BTC four-year cycle series 83】
Before the 16-17 Big Bull main surge: before the main surge, the coin price consolidated near the orange line for 206 days
Before the 20-21 Big Bull main surge: before the main surge, the coin price consolidated near the orange line for 251 days (ignore the subsequent 312 “black swan” days)
Before the 24-25 Big Bull main surge: before the main surge, the coin price consolidated near the orange line for 218 days
Before the 28-29 Big Bull main surge: before the main surge, the coin price had already been consolidating near the orange line for 40 days
┌── 🐼 On-chain data details ──┐
Orange line: True Market Mean Price (and its +5% / -5% lines). It measures the average purchase cost of genuinely actively traded circulating Bitcoins in the secondary market
Before the 16-17 Big Bull main surge: before the main surge, the coin price consolidated near the orange line for 206 days
Before the 20-21 Big Bull main surge: before the main surge, the coin price consolidated near the orange line for 251 days (ignore the subsequent 312 “black swan” days)
Before the 24-25 Big Bull main surge: before the main surge, the coin price consolidated near the orange line for 218 days
Before the 28-29 Big Bull main surge: before the main surge, the coin price had already been consolidating near the orange line for 40 days
┌── 🐼 On-chain data details ──┐
Orange line: True Market Mean Price (and its +5% / -5% lines). It measures the average purchase cost of genuinely actively traded circulating Bitcoins in the secondary market
CryptoChan 熊猫
·
--
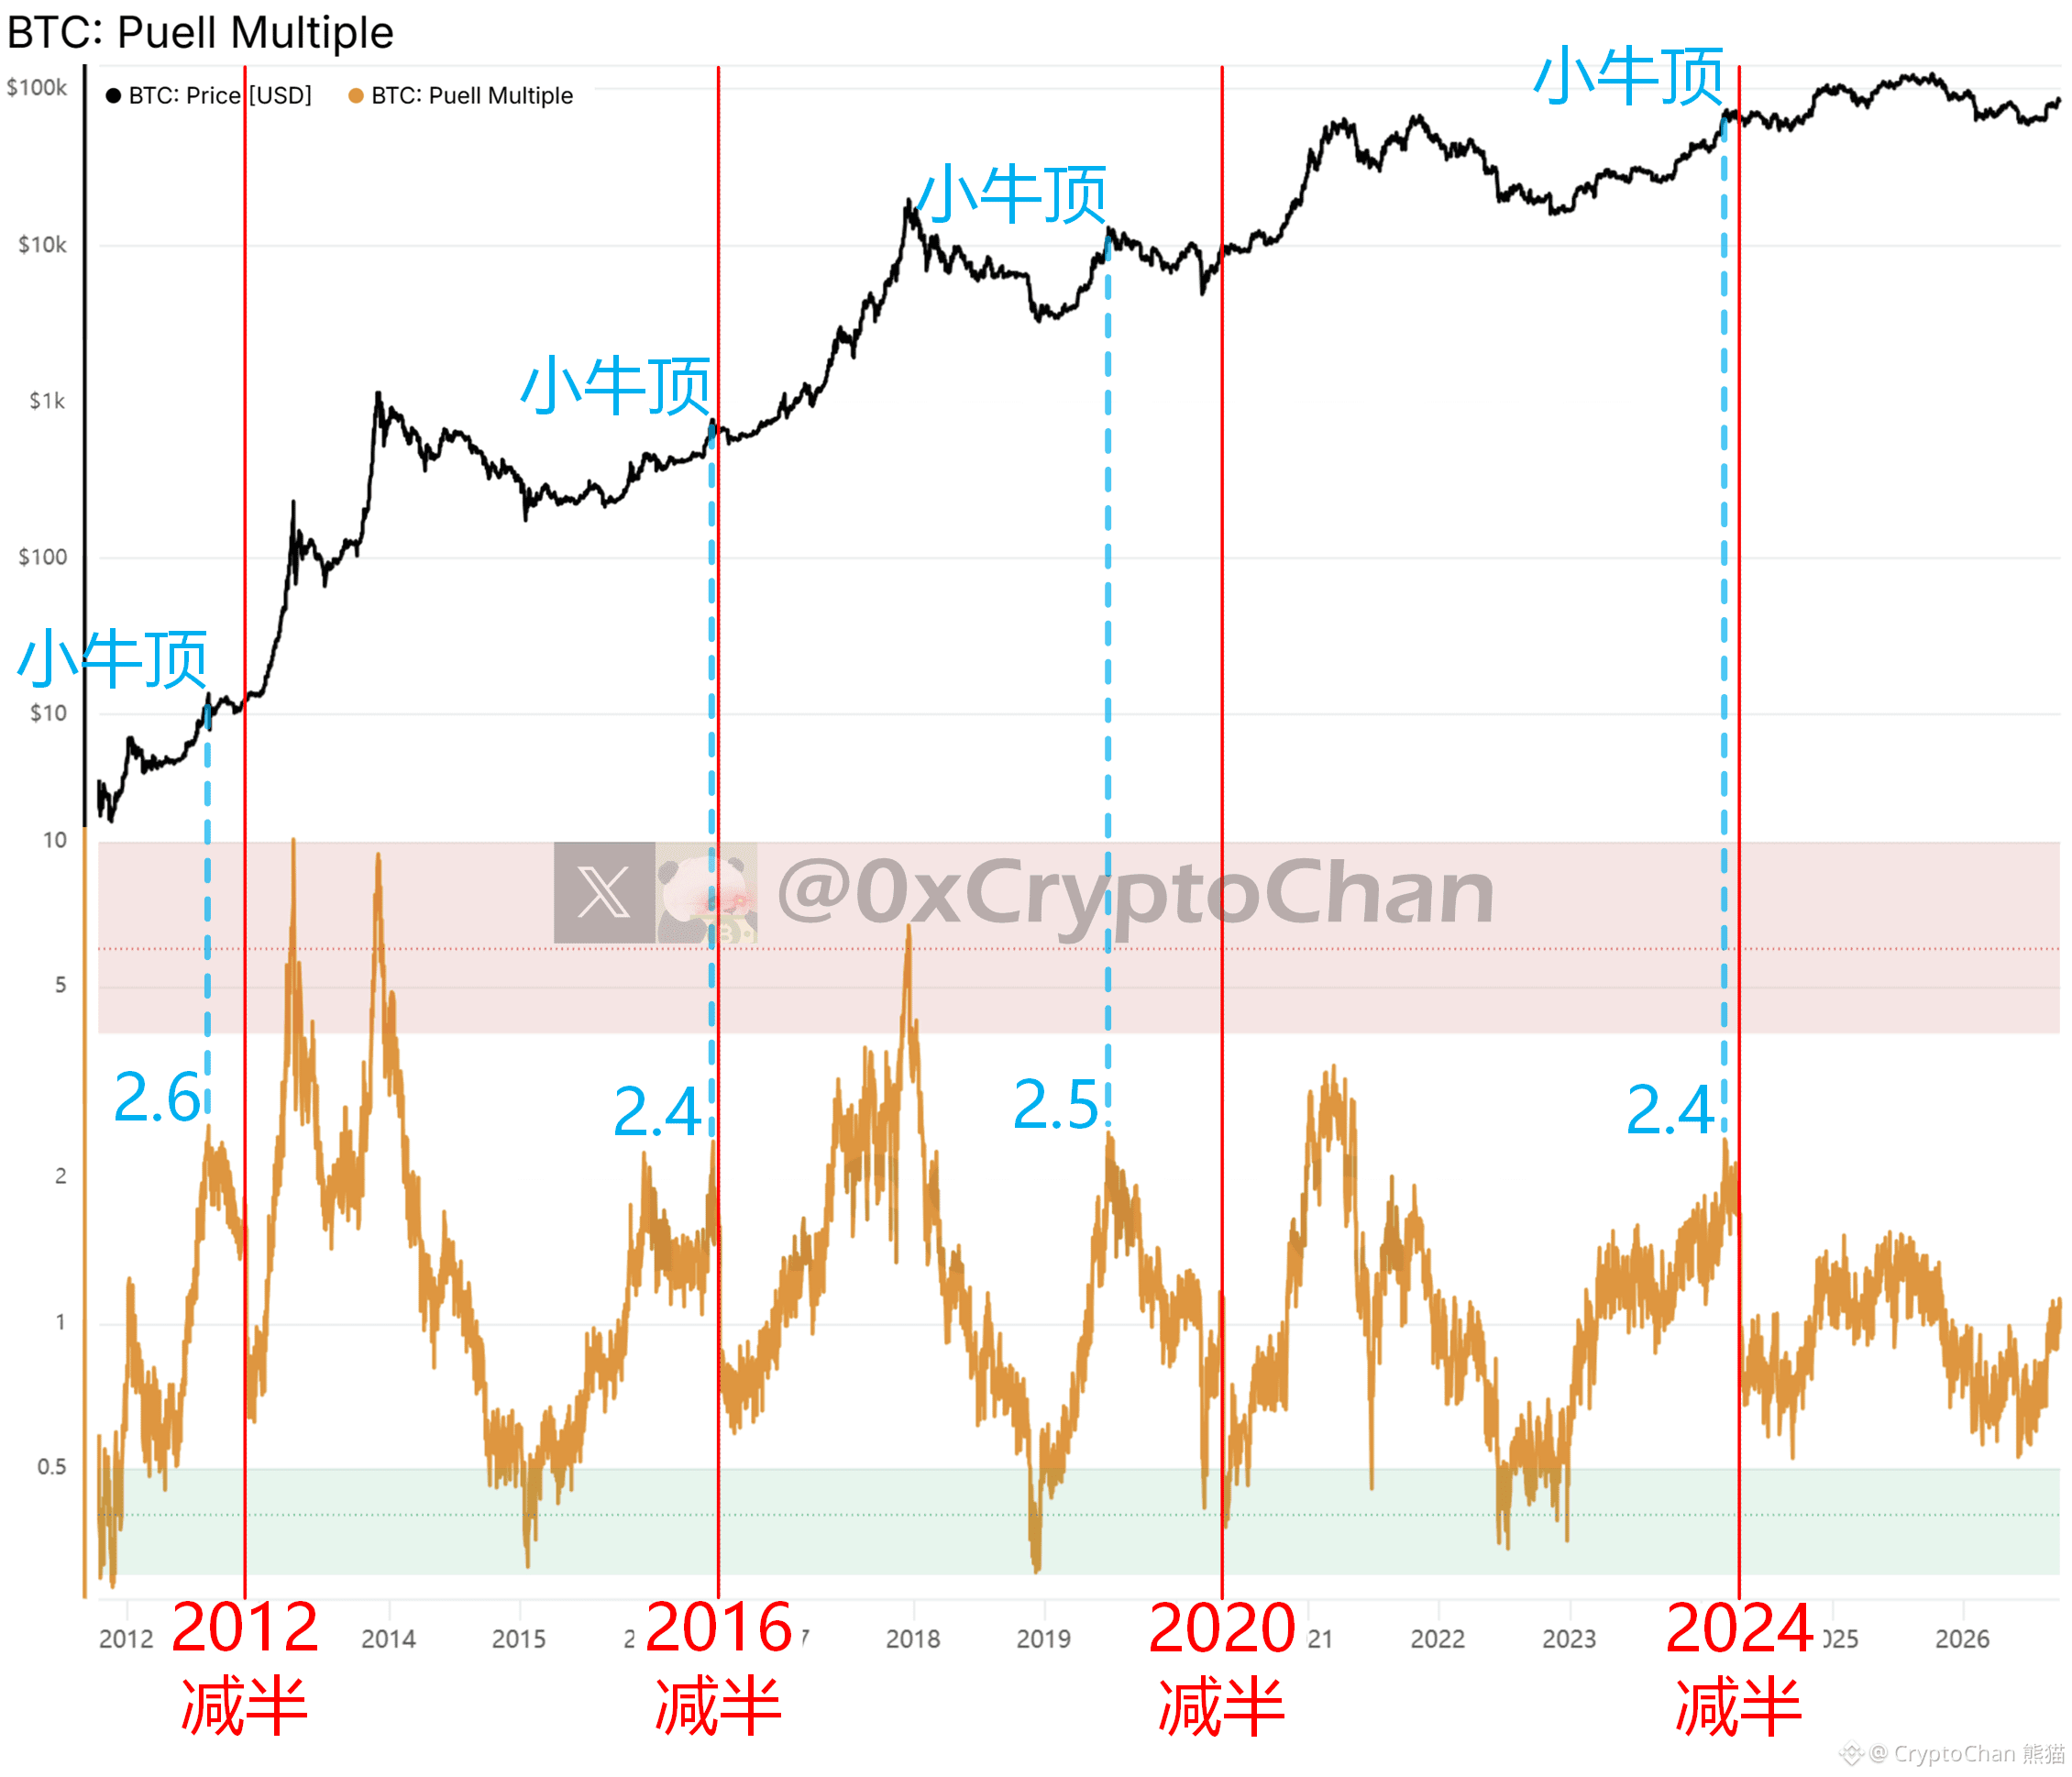
【 $BTC four-year cycle series 82】
Before the 2012 halving: the orange line reached a peak of 2.6 (corresponding to the bull market top)
Before the 2016 halving: the orange line reached a peak of 2.4 (corresponding to the bull market top)
Before the 2020 halving: the orange line reached a peak of 2.5 (corresponding to the bull market top)
Before the 2024 halving: the orange line reached a peak of 2.4 (corresponding to the bull market top)
┌─ 🐼 Indicator Details ─┐
Black line: Bitcoin price
Orange line: ratio of the daily mining output value (USD) to its 365-day average
Before the 2012 halving: the orange line reached a peak of 2.6 (corresponding to the bull market top)
Before the 2016 halving: the orange line reached a peak of 2.4 (corresponding to the bull market top)
Before the 2020 halving: the orange line reached a peak of 2.5 (corresponding to the bull market top)
Before the 2024 halving: the orange line reached a peak of 2.4 (corresponding to the bull market top)
┌─ 🐼 Indicator Details ─┐
Black line: Bitcoin price
Orange line: ratio of the daily mining output value (USD) to its 365-day average
CryptoChan 熊猫
·
--
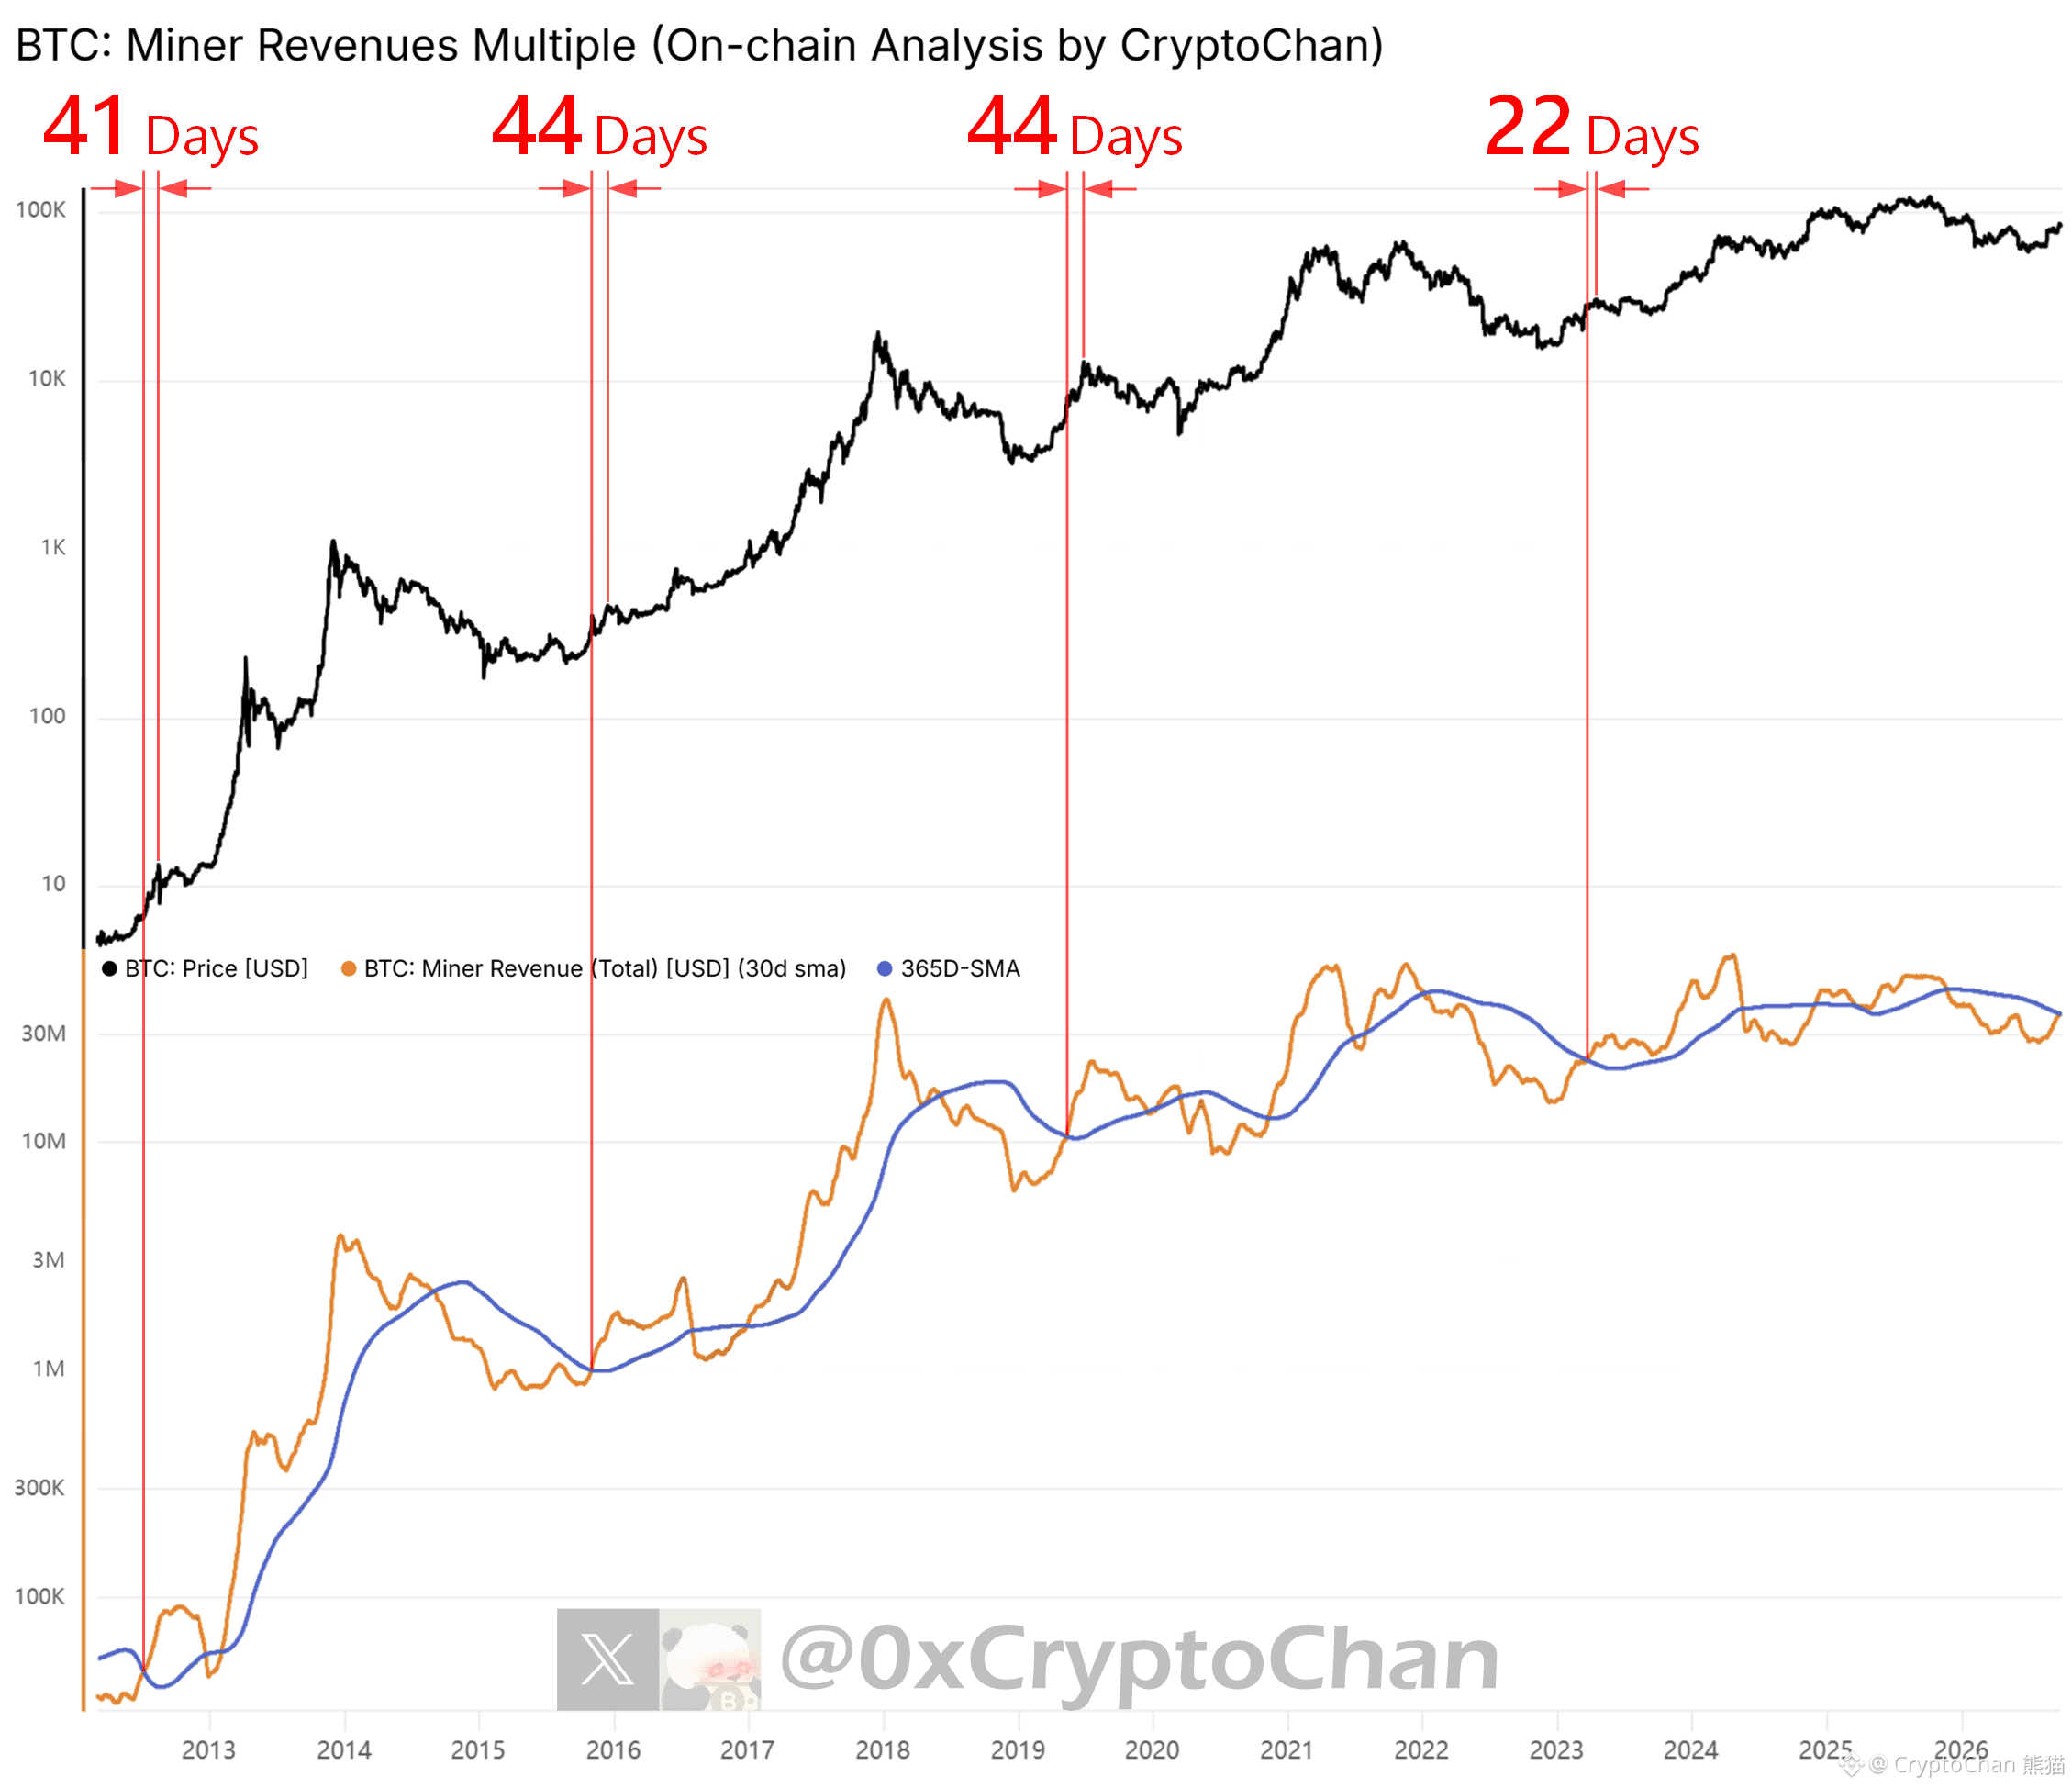
【 $BTC four-year cycle series 81】
2012 Orange-Blue golden cross: after 41 days, to the bull market recovery peak
2015 Orange-Blue golden cross: after 44 days, to the bull market recovery peak
2019 Orange-Blue golden cross: after 44 days, to the bull market recovery peak
2023 Orange-Blue golden cross: after 22 days, to the bull market recovery secondary top
2026: just crossed today
┌── 🐼 Indicator details ──┐
Black line: Bitcoin price
Orange line: Bitcoin miner revenue 30-day moving average
Blue line: Bitcoin miner revenue 365-day moving average
2012 Orange-Blue golden cross: after 41 days, to the bull market recovery peak
2015 Orange-Blue golden cross: after 44 days, to the bull market recovery peak
2019 Orange-Blue golden cross: after 44 days, to the bull market recovery peak
2023 Orange-Blue golden cross: after 22 days, to the bull market recovery secondary top
2026: just crossed today
┌── 🐼 Indicator details ──┐
Black line: Bitcoin price
Orange line: Bitcoin miner revenue 30-day moving average
Blue line: Bitcoin miner revenue 365-day moving average
CryptoChan 熊猫
·
--
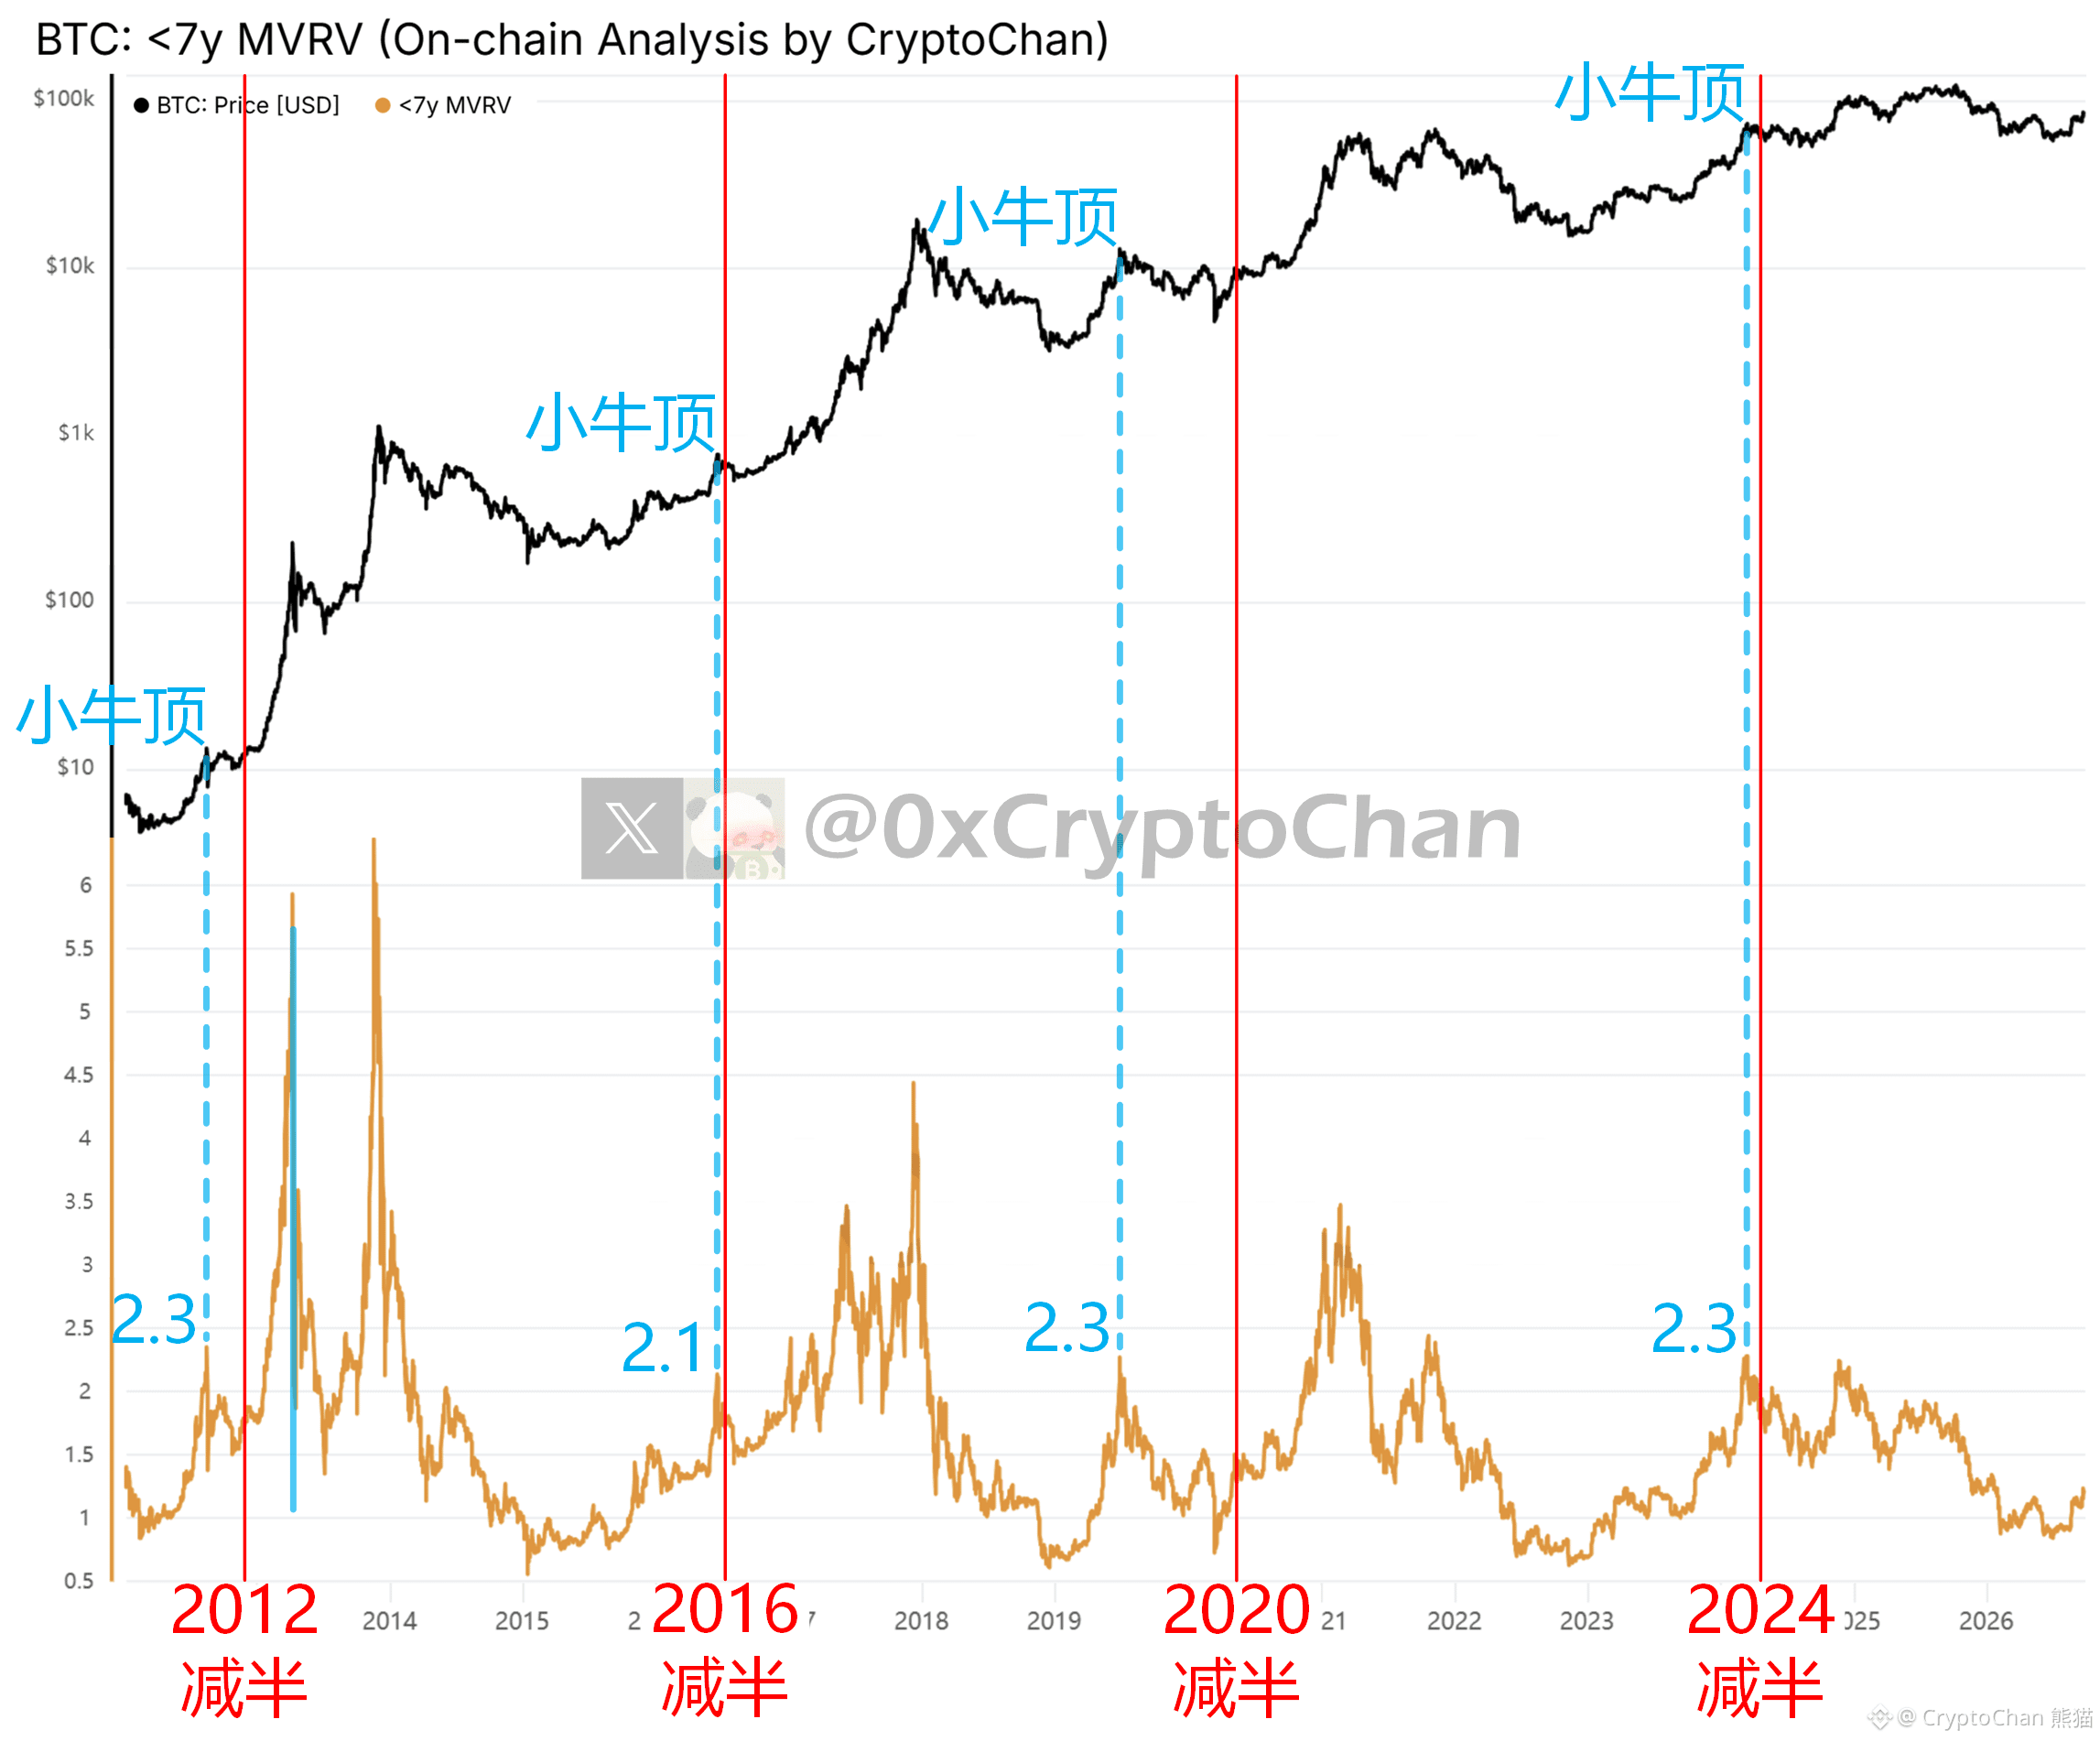
【 $BTC four-year cycle series 80】
Before the 2012 halving: the orange line peaked at 2.3 (corresponding to the bull market top)
Before the 2016 halving: the orange line peaked at 2.1 (corresponding to the bull market top)
Before the 2020 halving: the orange line peaked at 2.3 (corresponding to the bull market top)
Before the 2024 halving: the orange line peaked at 2.3 (corresponding to the bull market top)
┌── 🐼 On-chain data details ──┐
Black line: Bitcoin price
Orange line: Bitcoin MVRV (excluding >7-year unmoved BTC)
Before the 2012 halving: the orange line peaked at 2.3 (corresponding to the bull market top)
Before the 2016 halving: the orange line peaked at 2.1 (corresponding to the bull market top)
Before the 2020 halving: the orange line peaked at 2.3 (corresponding to the bull market top)
Before the 2024 halving: the orange line peaked at 2.3 (corresponding to the bull market top)
┌── 🐼 On-chain data details ──┐
Black line: Bitcoin price
Orange line: Bitcoin MVRV (excluding >7-year unmoved BTC)
CryptoChan 熊猫
·
--
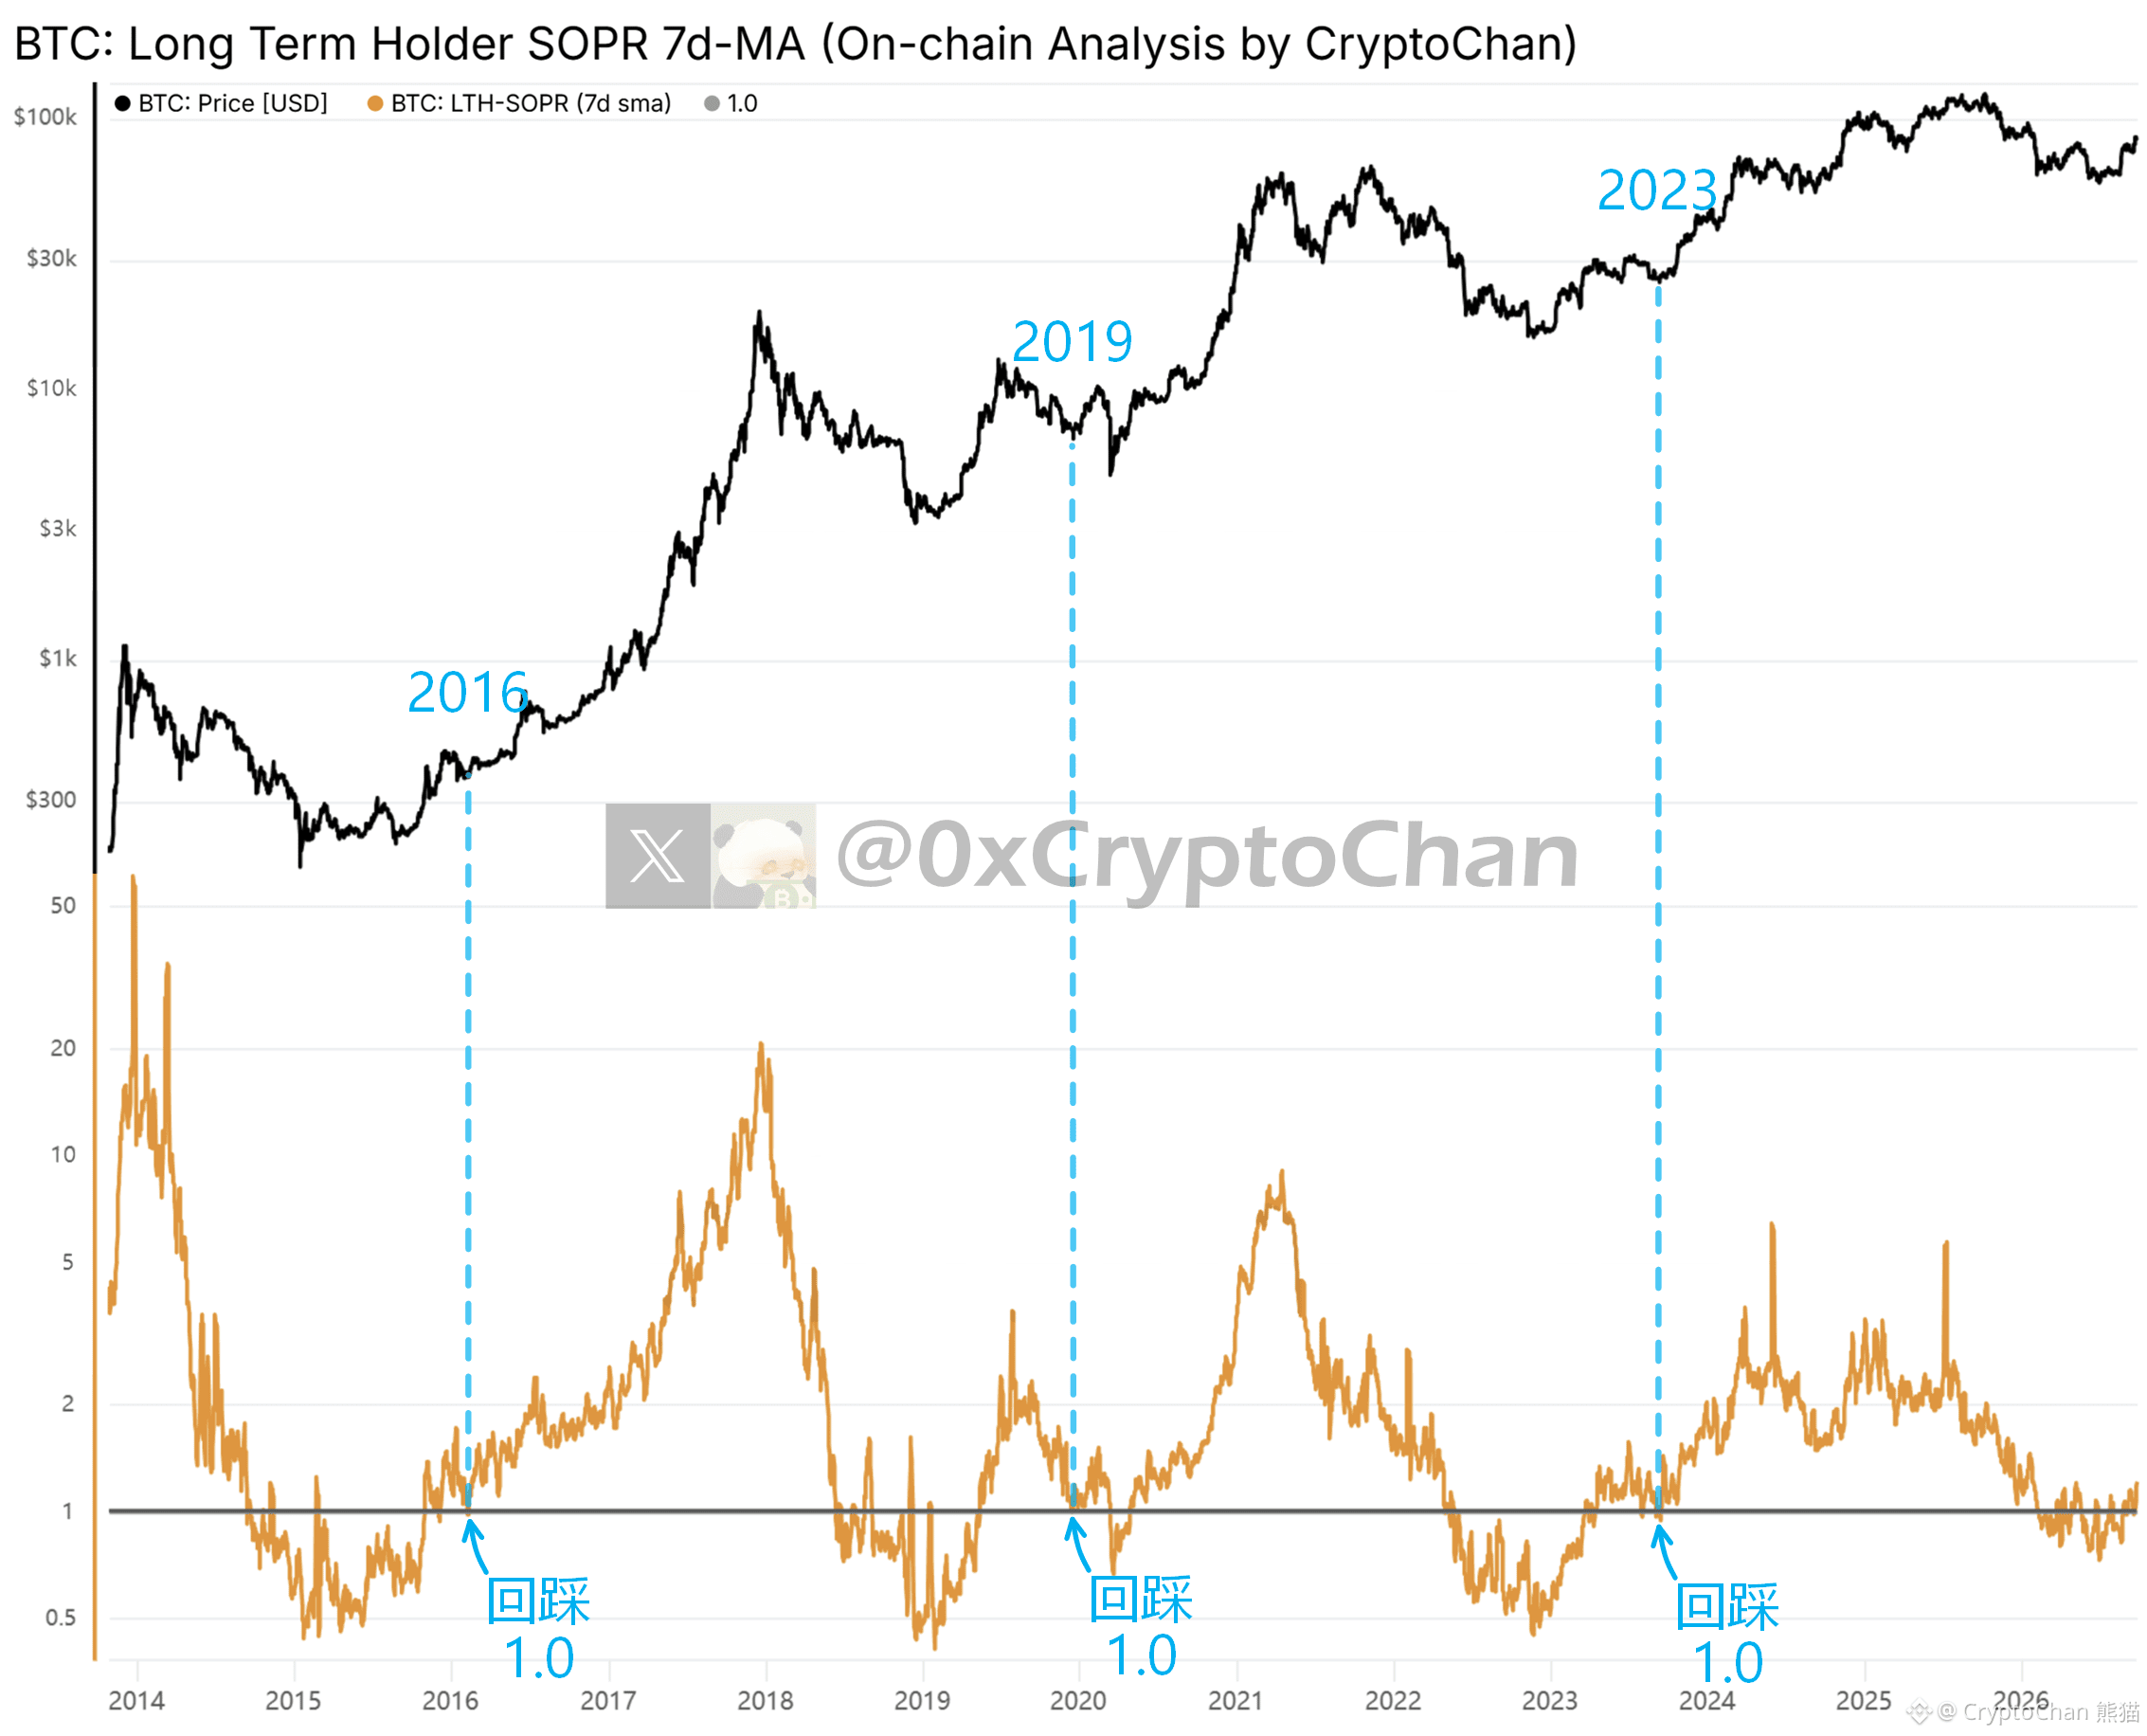
【 $BTC four-year cycle series 79】
After the 2016 bull market recovery period ended, the final dip before the main rally: orange line pullback 1
After the 2019 bull market recovery period ended, the final dip before the main rally: orange line pullback 1 (ignore the subsequent 312 Black Swan)
After the 2023 bull market recovery period ended, the final dip before the main rally: orange line pullback 1
┌ Indicator Details ┐
The orange line (LTH-SOPR) measures the profit-to-loss ratio of on-chain long-term holders (>155 days) selling BTC.
>1 profit, <1 loss
After the 2016 bull market recovery period ended, the final dip before the main rally: orange line pullback 1
After the 2019 bull market recovery period ended, the final dip before the main rally: orange line pullback 1 (ignore the subsequent 312 Black Swan)
After the 2023 bull market recovery period ended, the final dip before the main rally: orange line pullback 1
┌ Indicator Details ┐
The orange line (LTH-SOPR) measures the profit-to-loss ratio of on-chain long-term holders (>155 days) selling BTC.
>1 profit, <1 loss
CryptoChan 熊猫
·
--
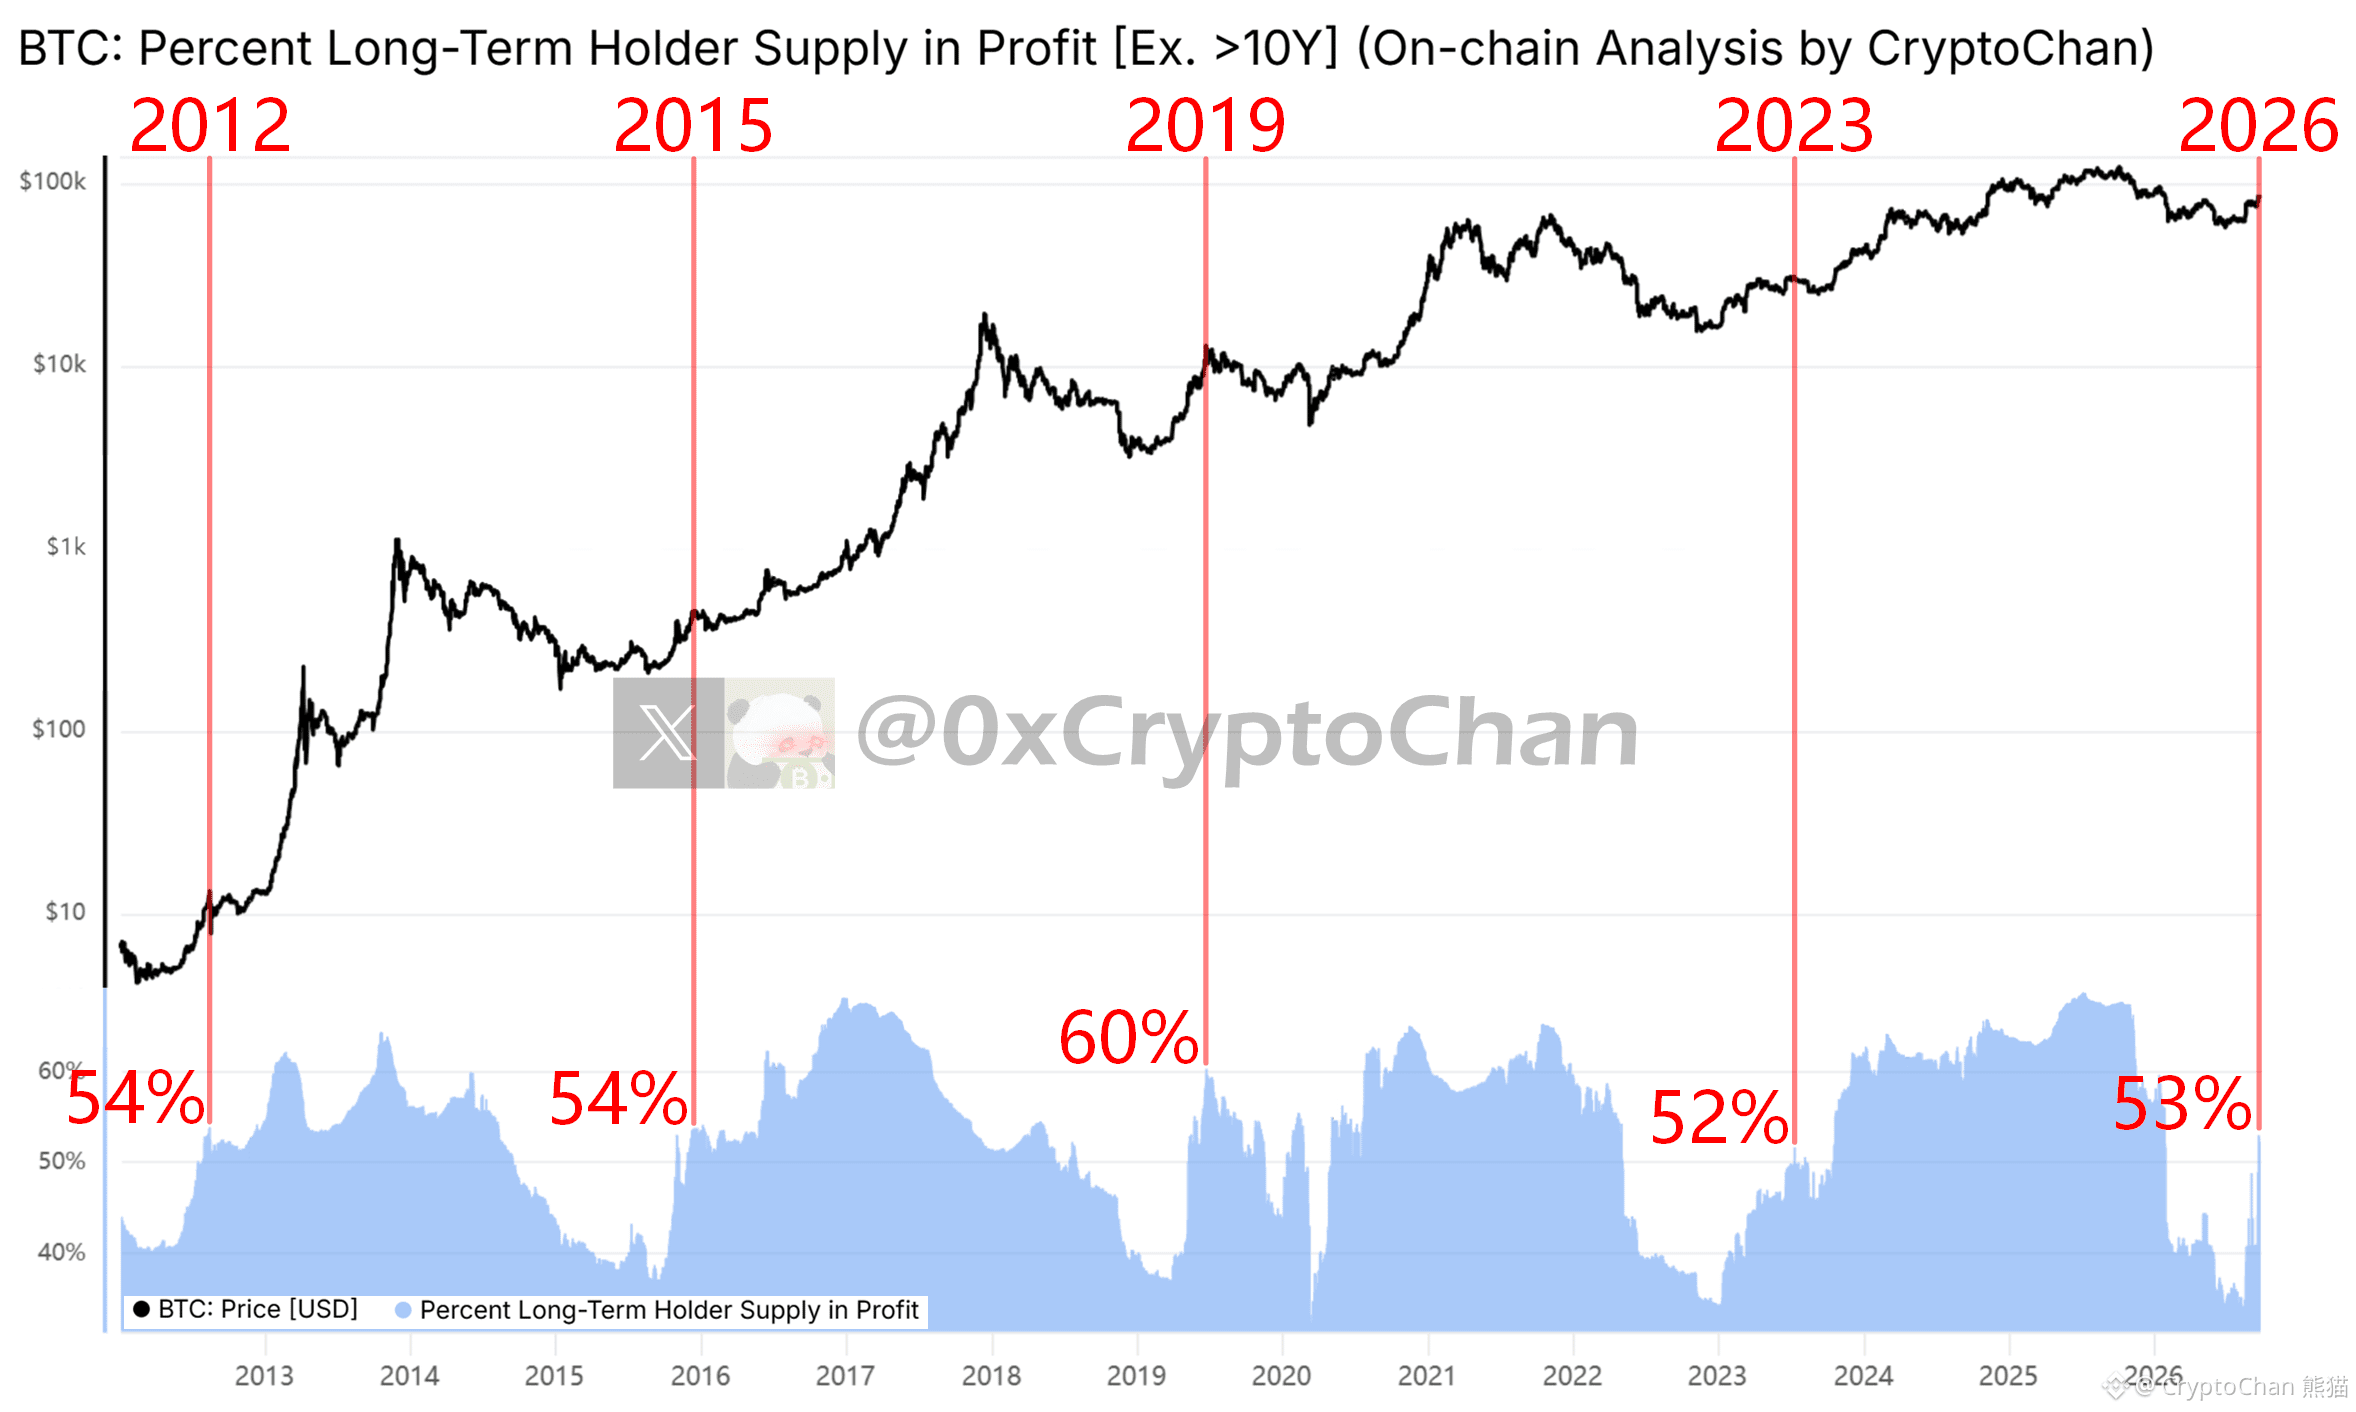
【 $BTC four-year cycle series 78】
2012 Bull market recovery peak: Blue bar up to 54%
2015 Bull market recovery peak: Blue bar up to 54%
2019 Bull market recovery peak: Blue bar up to 60%
2023 Bull market recovery peak: Blue bar up to 52%
2026 current: Blue bar up to 53%
┌── 🐼 Indicator details ──┐
Blue bar: The percentage of Bitcoin total circulating supply represented by unrealized profit chip volume held by long-term on-chain holders (excluding BTC that has not moved for over 10 years)
2012 Bull market recovery peak: Blue bar up to 54%
2015 Bull market recovery peak: Blue bar up to 54%
2019 Bull market recovery peak: Blue bar up to 60%
2023 Bull market recovery peak: Blue bar up to 52%
2026 current: Blue bar up to 53%
┌── 🐼 Indicator details ──┐
Blue bar: The percentage of Bitcoin total circulating supply represented by unrealized profit chip volume held by long-term on-chain holders (excluding BTC that has not moved for over 10 years)
CryptoChan 熊猫
·
--
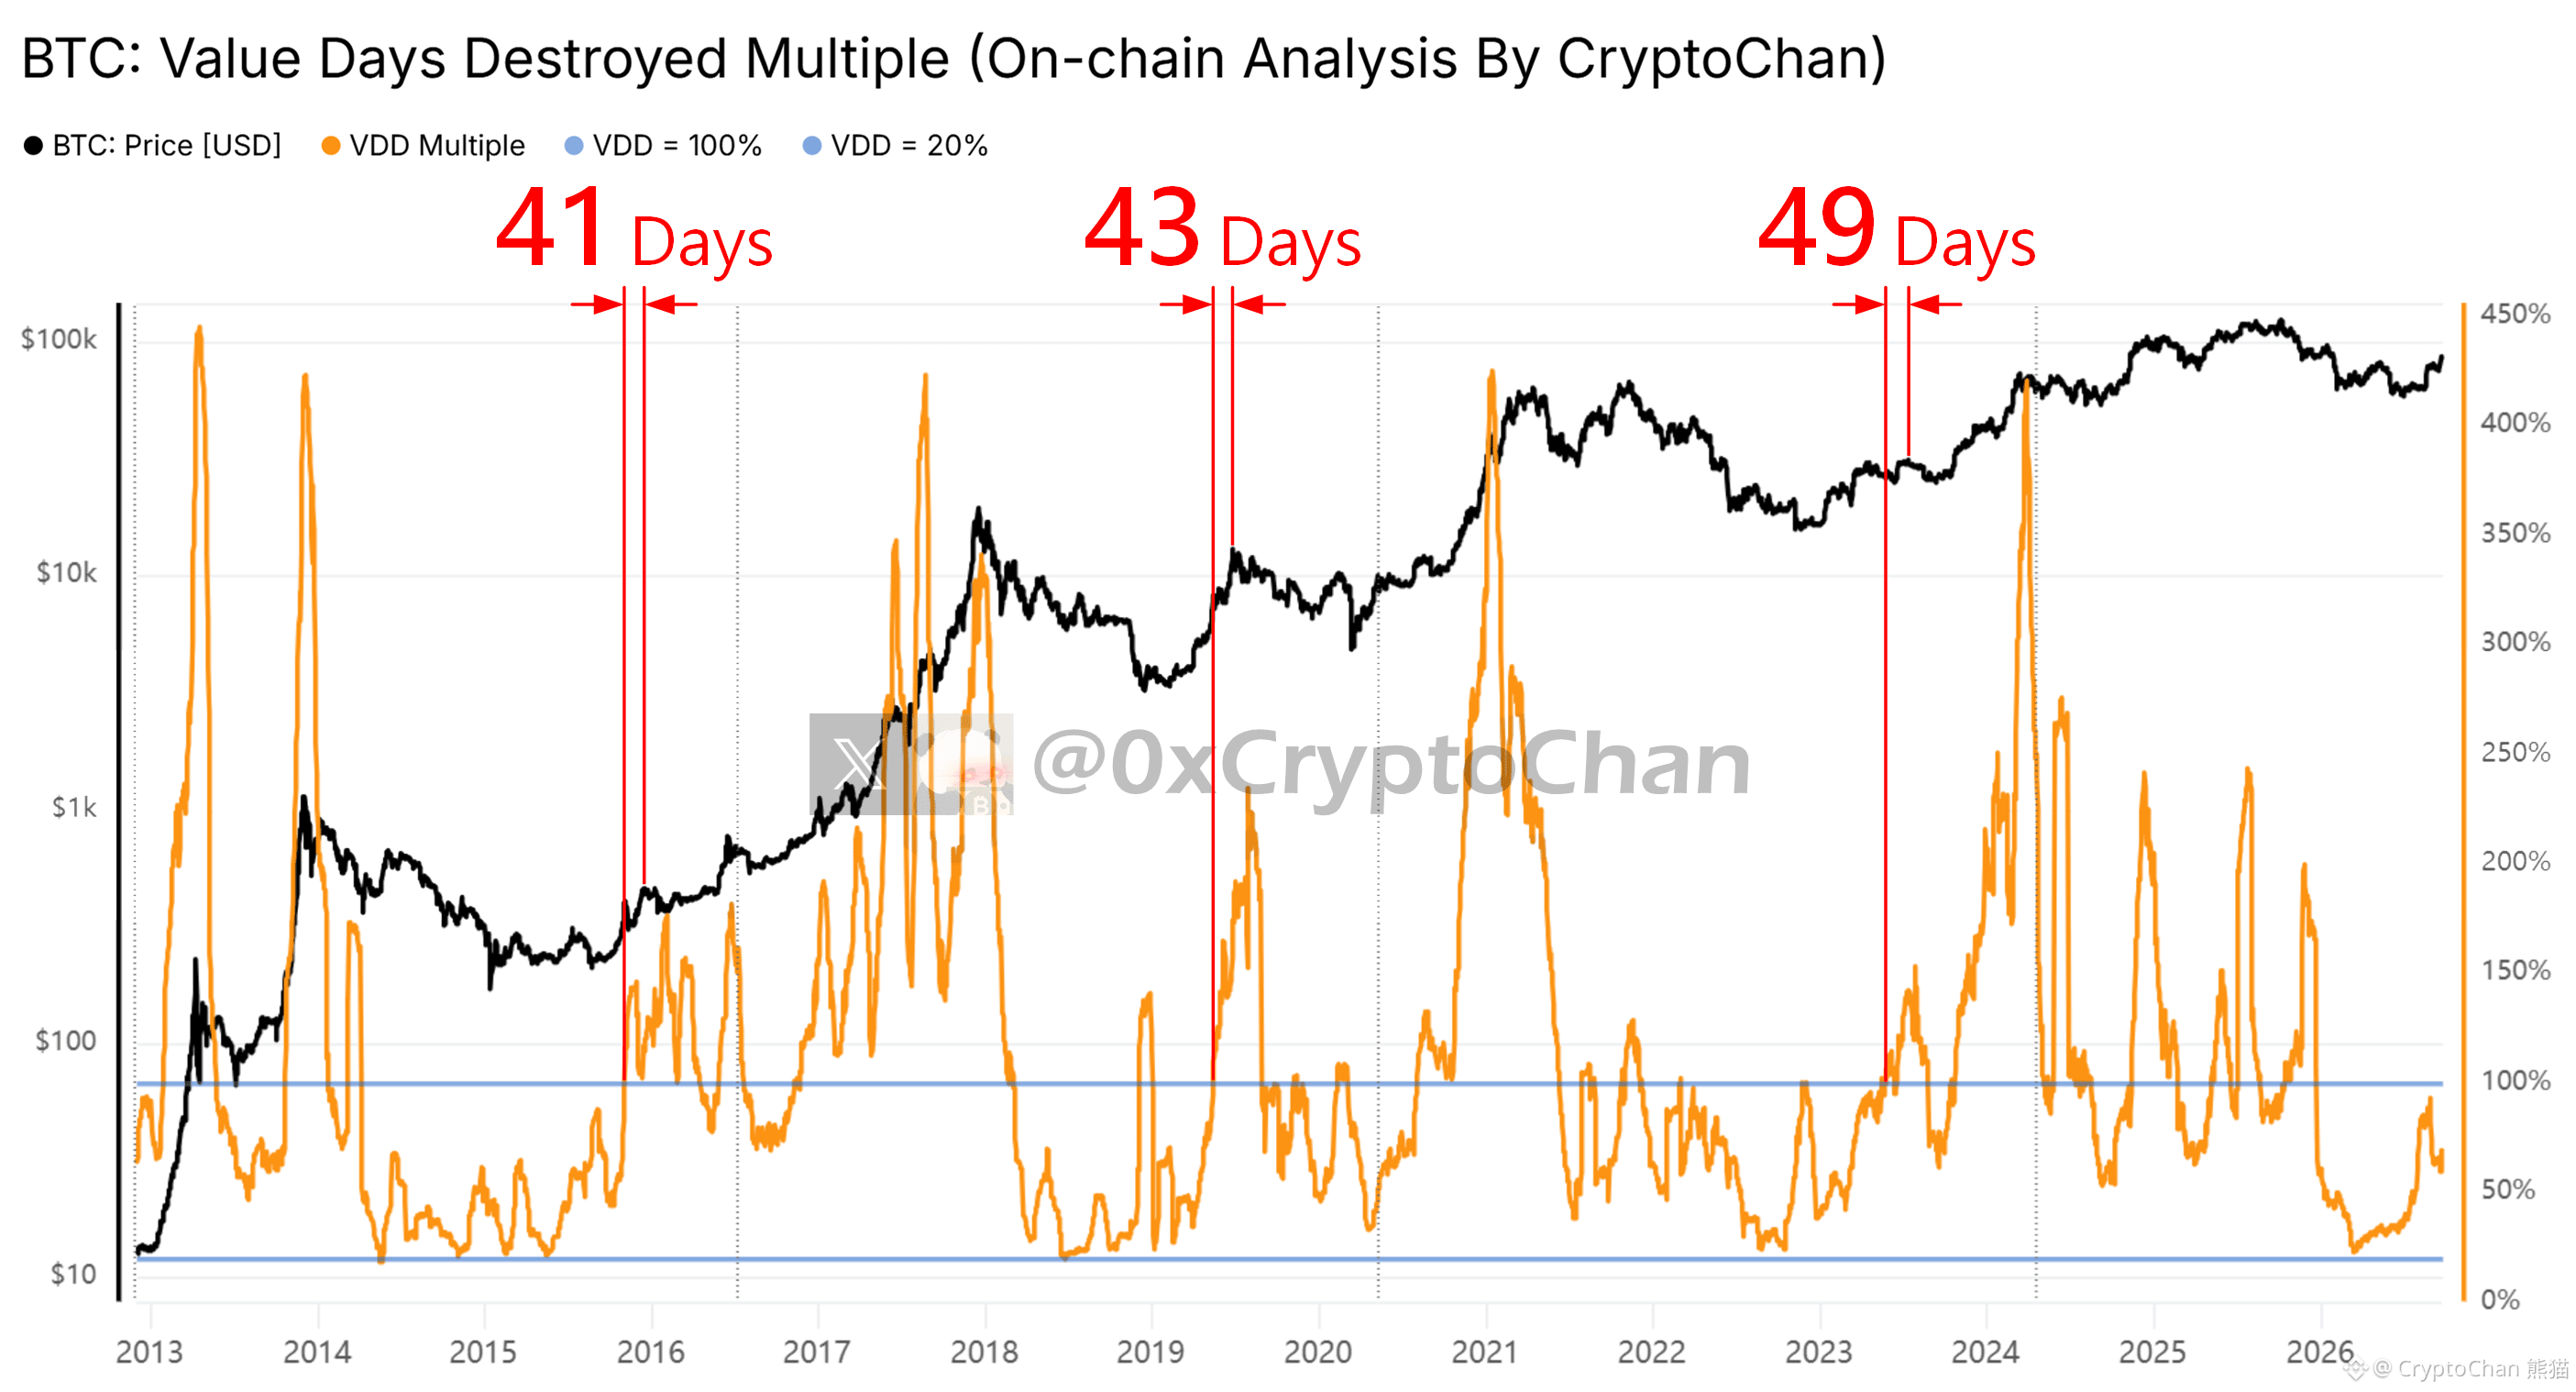
【 $BTC four-year cycle total engraving series 77】
November 2015 orange line breaks through 100%: 41 days later to the bull market recovery top
May 2019 orange line breaks through 100%: 43 days later to the bull market recovery top
May 2023 orange line breaks through 100%: 49 days later to the bull market recovery top
┌─ 🐼 Indicator details ─┐
Black line: Bitcoin price
Orange line: Bitcoin value day-sale burn multiple (VDD Multiple), showing the ratio of on-chain short-term coin-selling strength to the annual average level
November 2015 orange line breaks through 100%: 41 days later to the bull market recovery top
May 2019 orange line breaks through 100%: 43 days later to the bull market recovery top
May 2023 orange line breaks through 100%: 49 days later to the bull market recovery top
┌─ 🐼 Indicator details ─┐
Black line: Bitcoin price
Orange line: Bitcoin value day-sale burn multiple (VDD Multiple), showing the ratio of on-chain short-term coin-selling strength to the annual average level
CryptoChan 熊猫
·
--
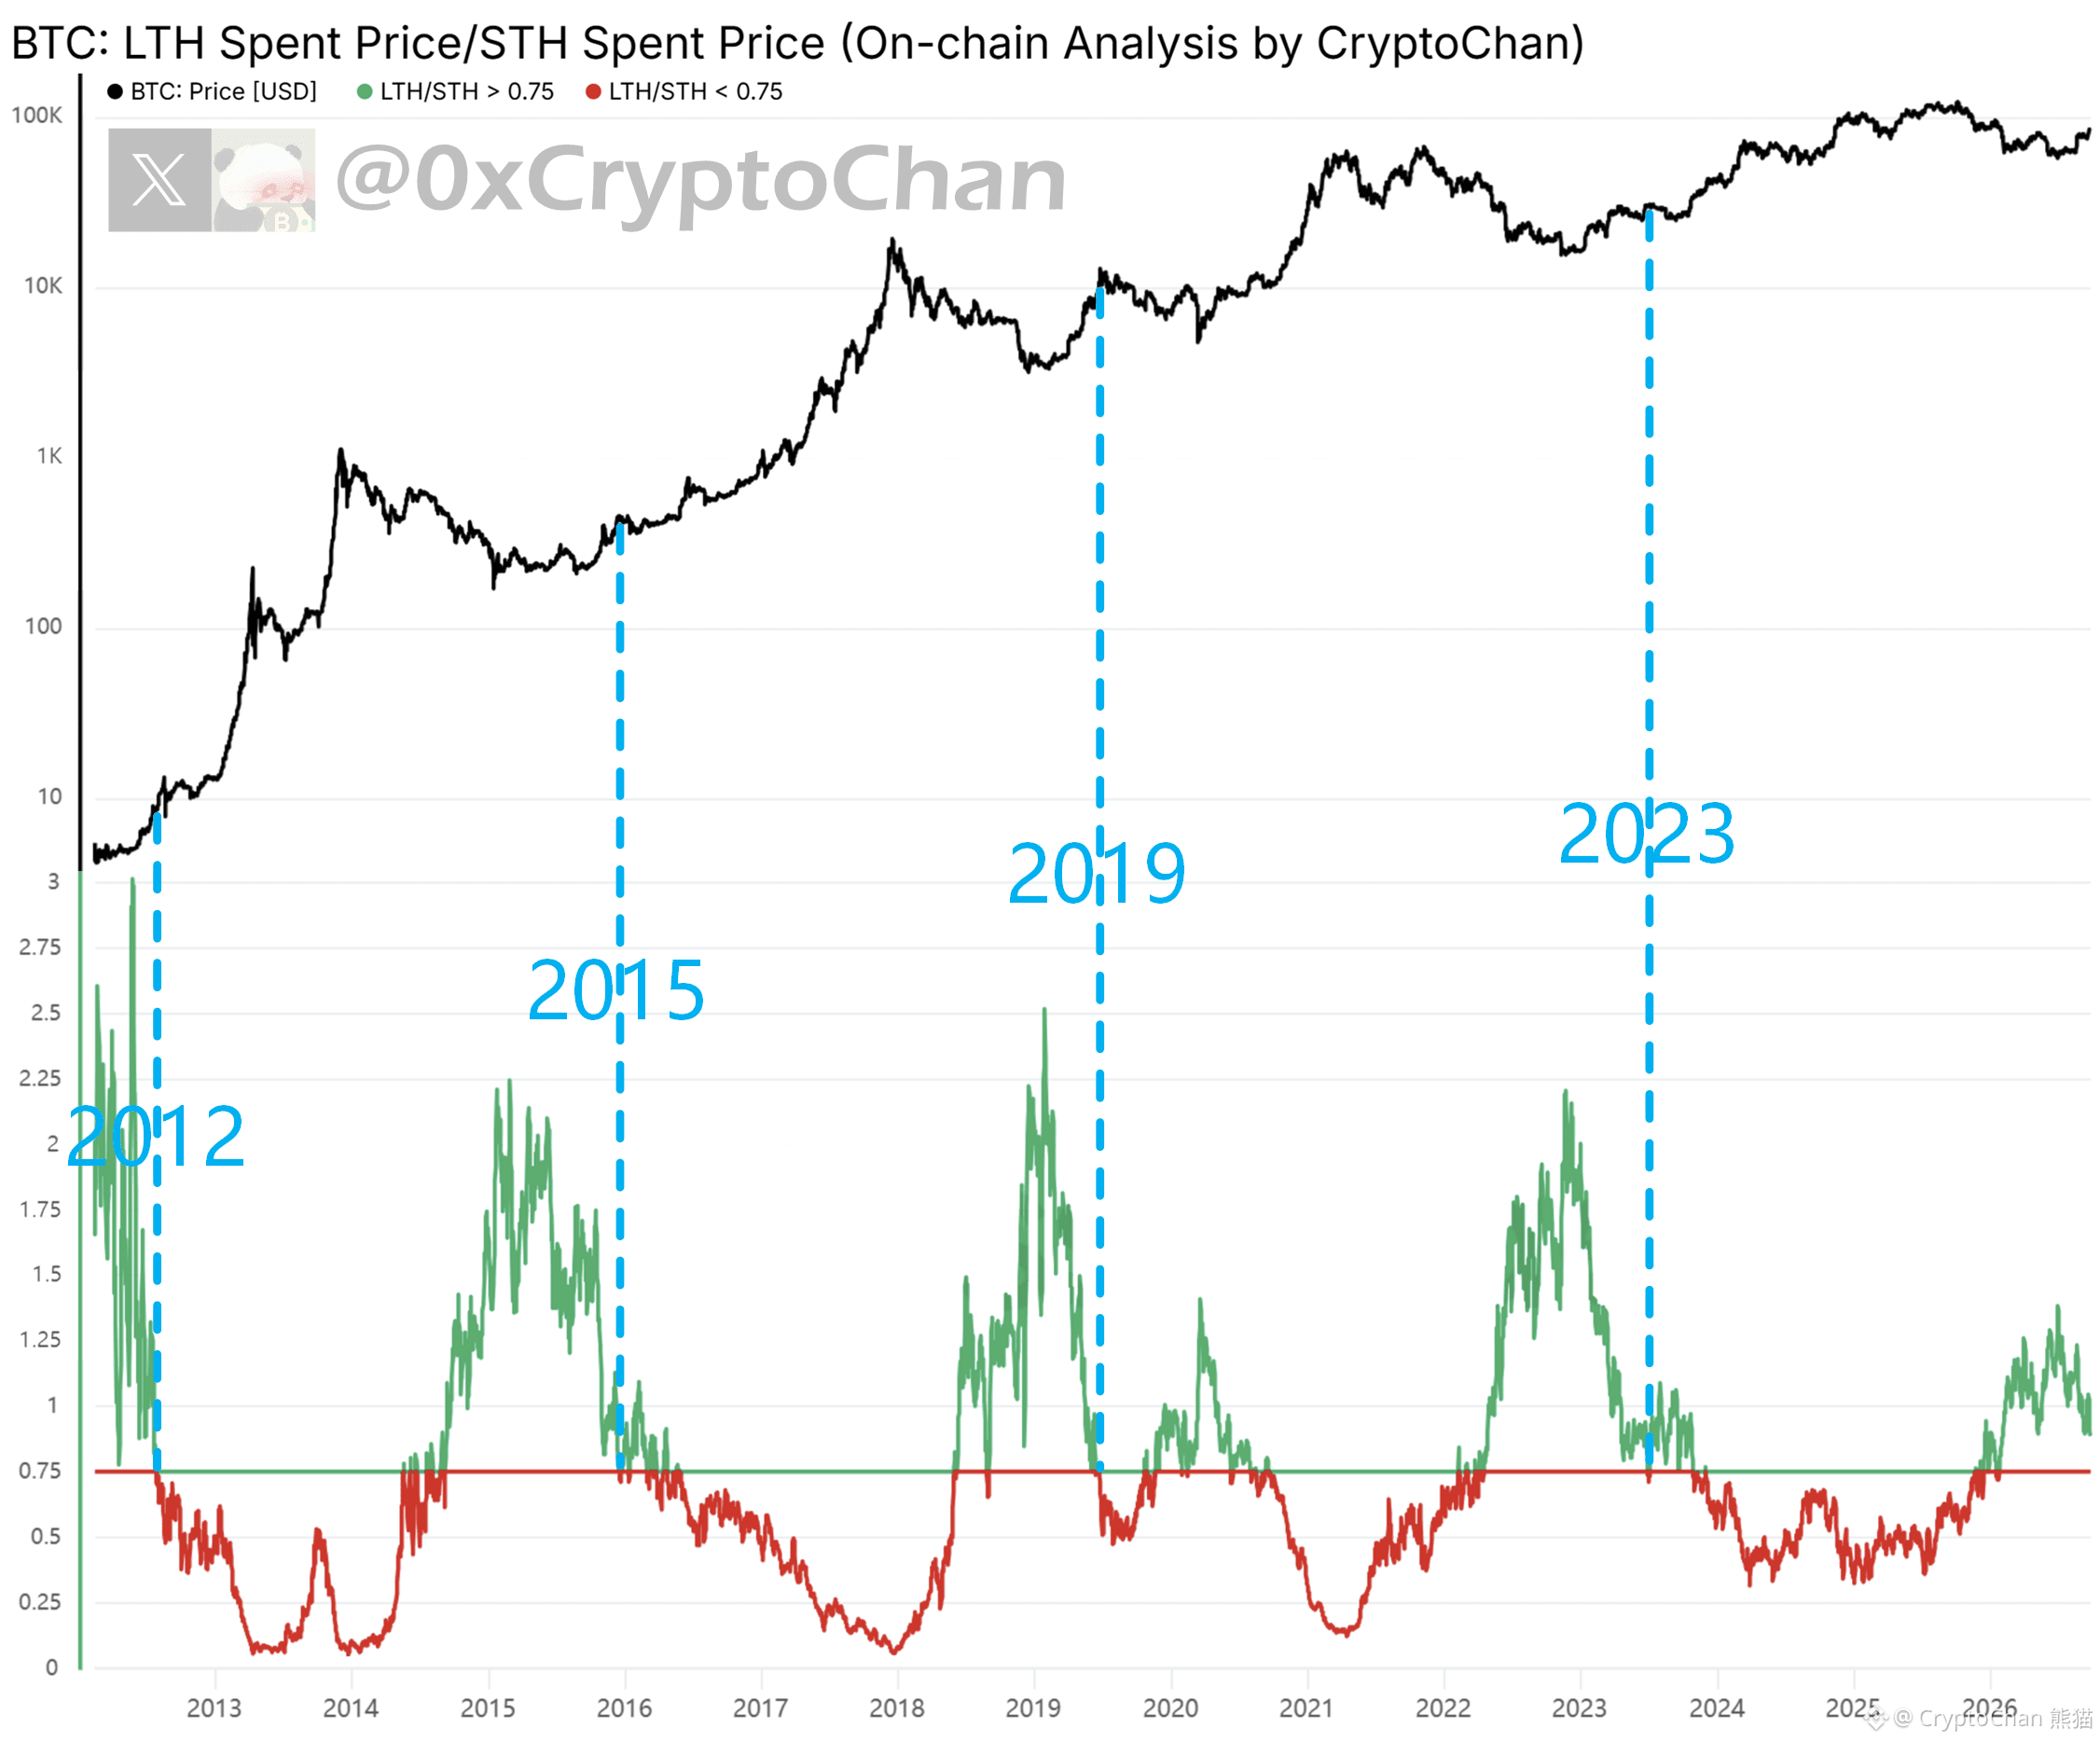
【 $BTC four-year cycle total cutting series 76】
2012 indicator turns red: BTC reaches near the bull market recovery top
2015 indicator turns red: BTC happens to reach the bull market recovery top
2019 indicator turns red: BTC happens to reach the bull market recovery top
2023 indicator turns red: BTC happens to reach the bull market recovery top
It hasn’t turned red yet
┌─ Indicator Details ─┐
The indicator at the bottom of the chart is the ratio of the average buy-in cost of on-chain long- and short-term coin holders’ selling positions ( >0.75 green; <0.75 red )
2012 indicator turns red: BTC reaches near the bull market recovery top
2015 indicator turns red: BTC happens to reach the bull market recovery top
2019 indicator turns red: BTC happens to reach the bull market recovery top
2023 indicator turns red: BTC happens to reach the bull market recovery top
It hasn’t turned red yet
┌─ Indicator Details ─┐
The indicator at the bottom of the chart is the ratio of the average buy-in cost of on-chain long- and short-term coin holders’ selling positions ( >0.75 green; <0.75 red )
CryptoChan 熊猫
·
--
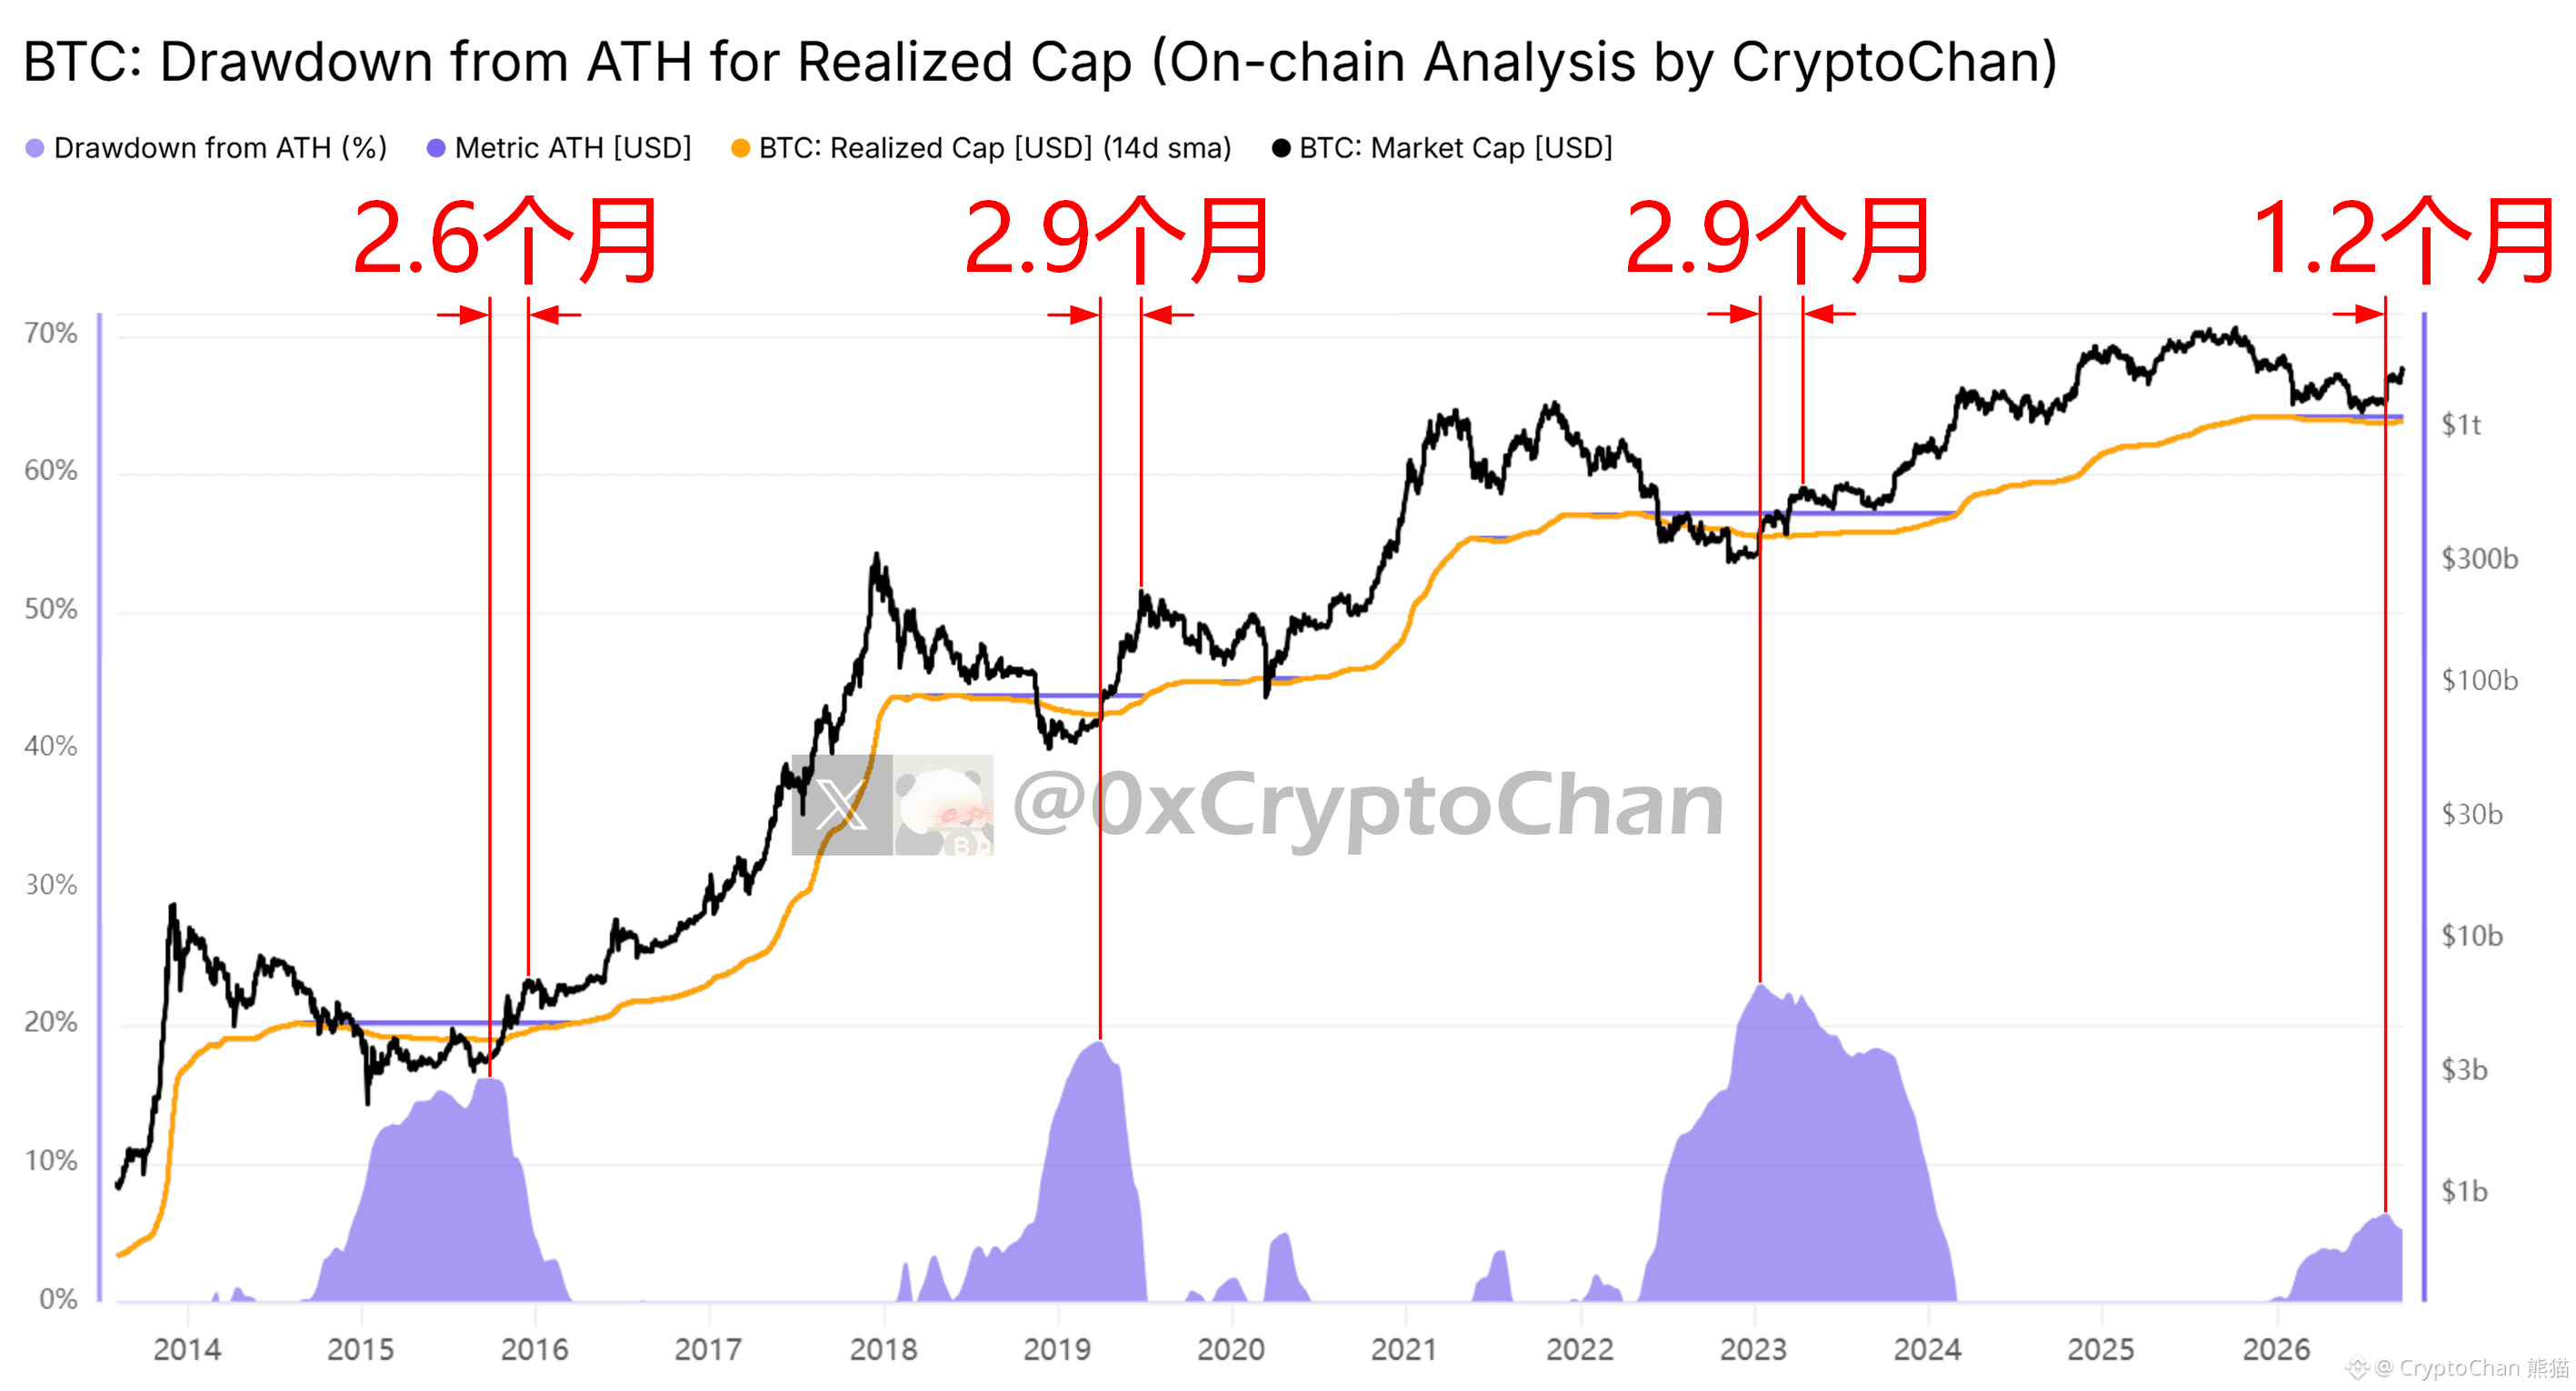
【 $BTC four-year cycle total engraving series 75】
September 2015: Purple column reaches the top — 2.6 months later, the peak of the bull market recovery phase
April 2019: Purple column reaches the top — 2.9 months later, the peak of the bull market recovery phase
January 2023: Purple column reaches the top — 2.9 months later, the secondary peak of the bull market recovery phase
August 2026: Purple column reaches the top — 1.2 months have passed since then
┌── 🐼 Indicator Details ──┐
Orange line: Bitcoin total cost market cap
Purple column: Percentage drawdown of the orange line compared with the previous high
September 2015: Purple column reaches the top — 2.6 months later, the peak of the bull market recovery phase
April 2019: Purple column reaches the top — 2.9 months later, the peak of the bull market recovery phase
January 2023: Purple column reaches the top — 2.9 months later, the secondary peak of the bull market recovery phase
August 2026: Purple column reaches the top — 1.2 months have passed since then
┌── 🐼 Indicator Details ──┐
Orange line: Bitcoin total cost market cap
Purple column: Percentage drawdown of the orange line compared with the previous high
CryptoChan 熊猫
·
--
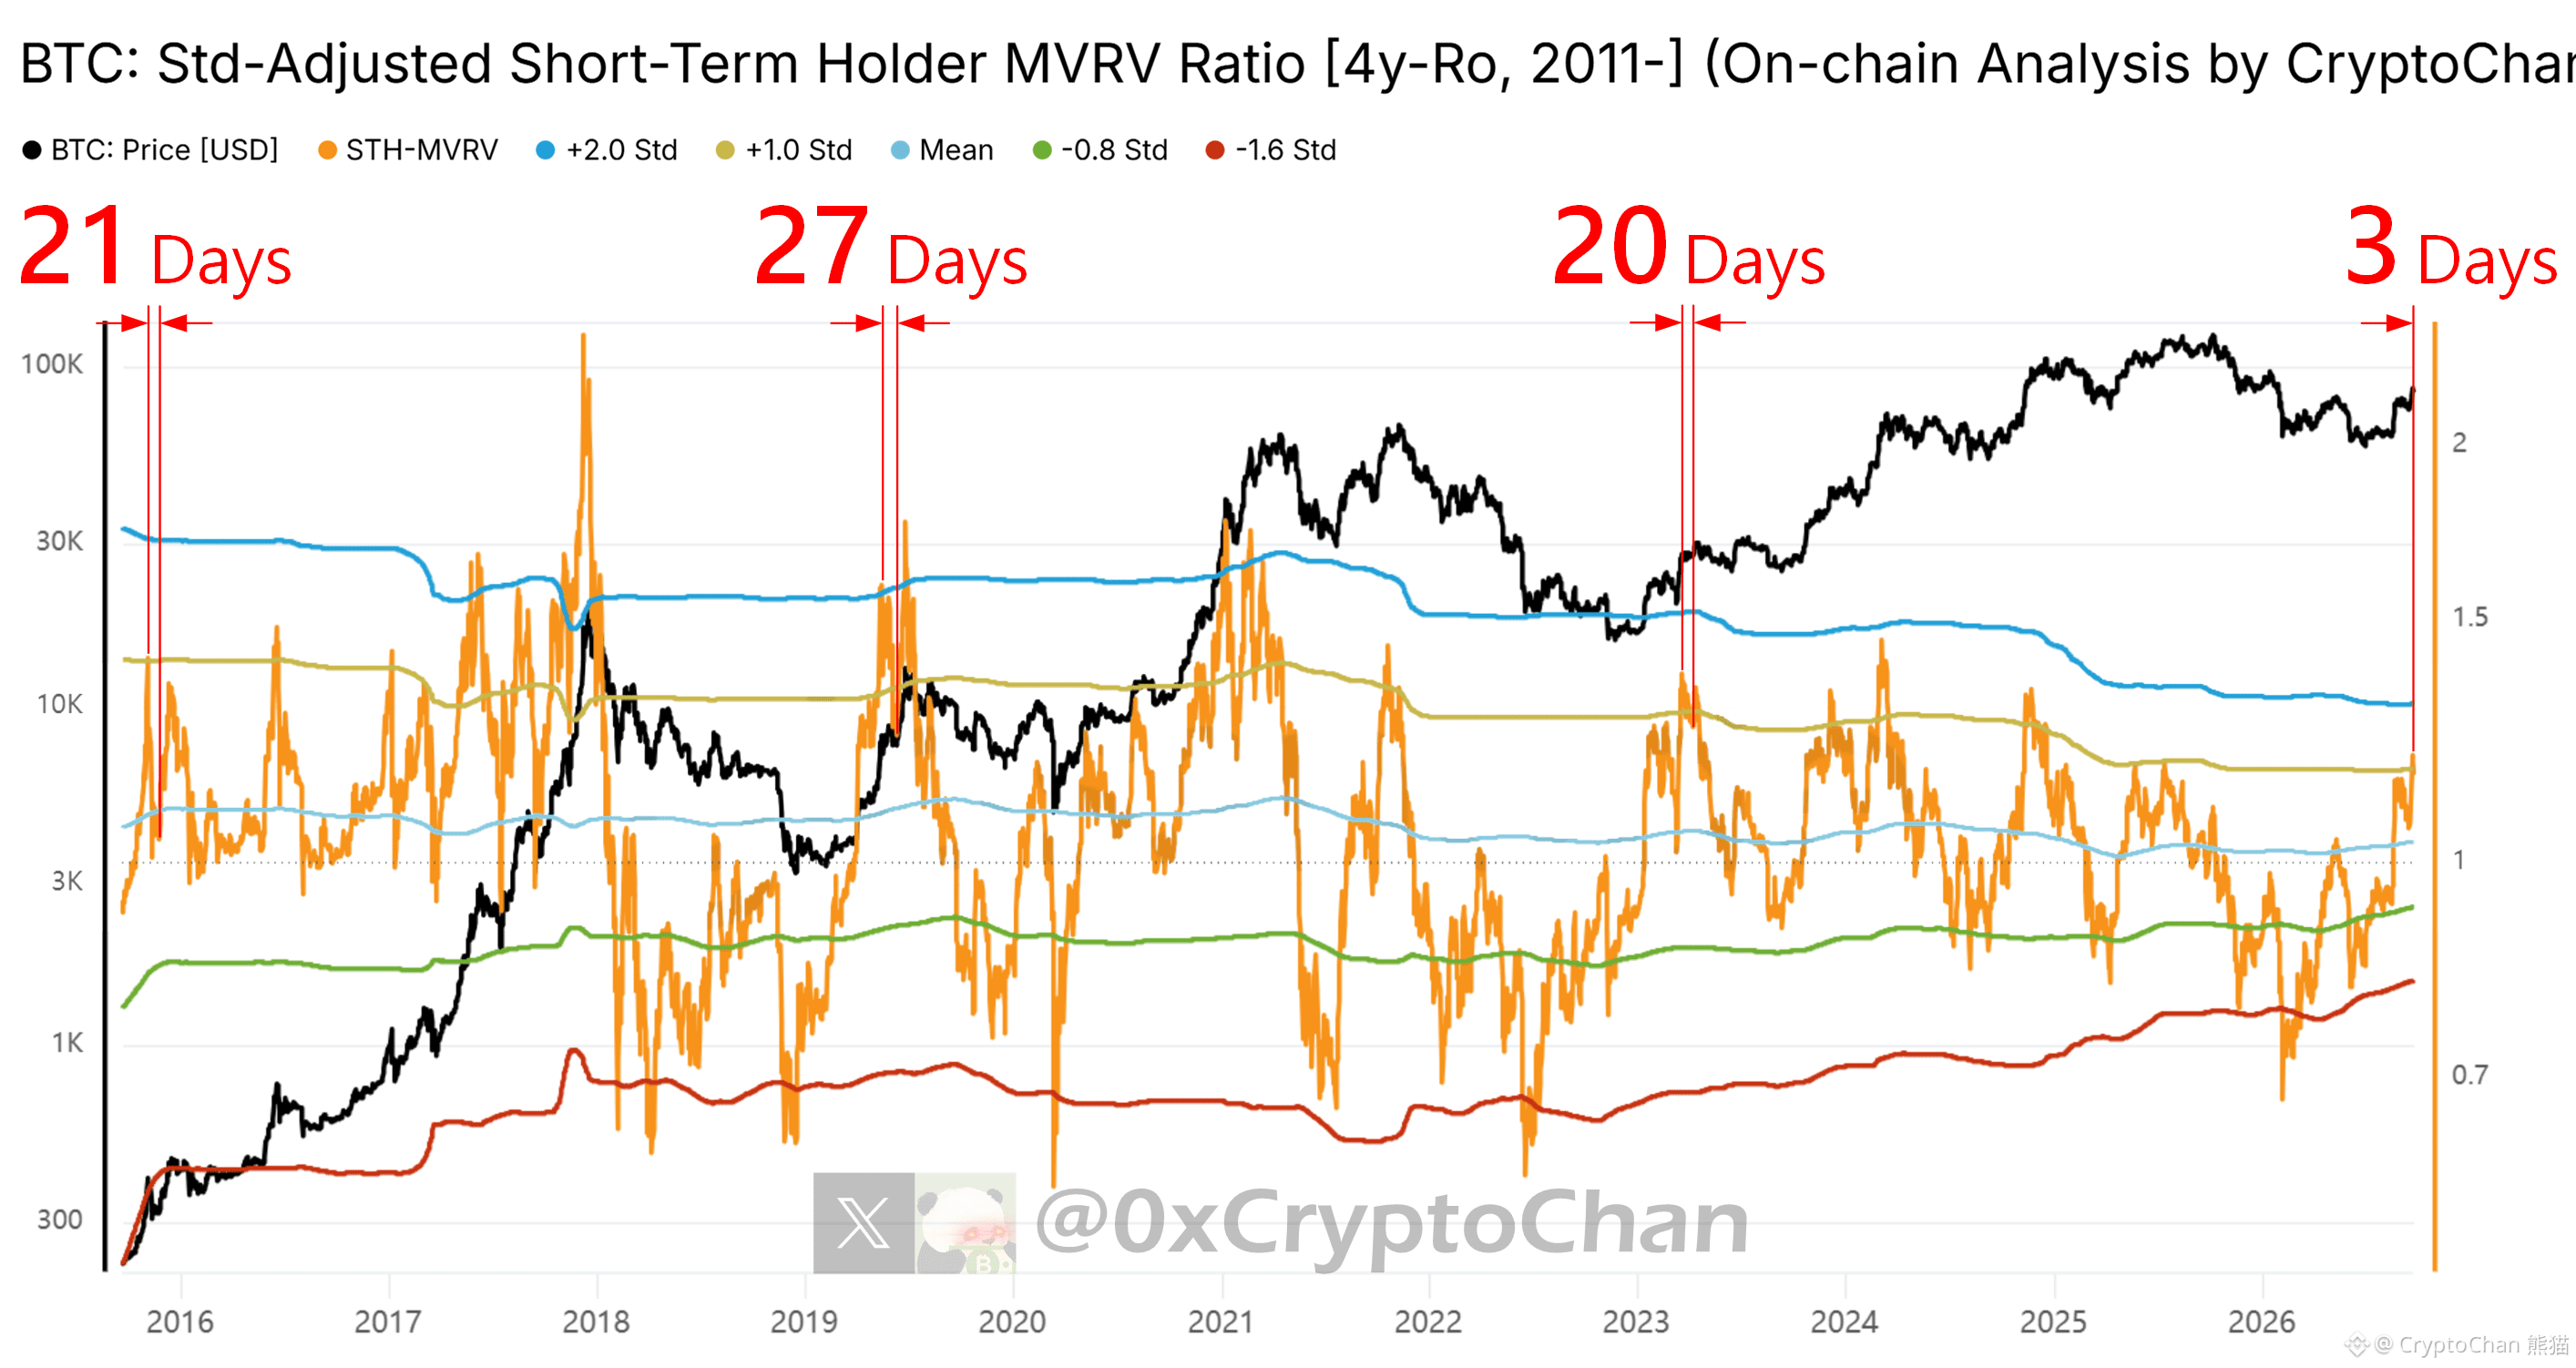
【 $BTC four-year cycle total notch series 74】
📌 In Nov 2015, this indicator broke above the +1 standard deviation line: after 21 days, it started the bull-market recovery top run
📌 In May 2019, this indicator broke above the +2 standard deviation line: after 27 days, it started the bull-market recovery top run
📌 In Mar 2023, this indicator broke above the +1 standard deviation line: after 20 days, it started the bull-market recovery secondary top run
📌 In Sep 2026, this indicator broke above the +1 standard deviation line: adjusted by 3 days
┌── 🐼 On-chain data details ──┐
Black line: Bitcoin price
Orange line: Bitcoin on-chain short-term holder MVRV, and its five standard deviation lines: +2σ, +1σ, 0σ, -0.8σ, -1.6σ (4-year rolling window sampled data)
📌 In Nov 2015, this indicator broke above the +1 standard deviation line: after 21 days, it started the bull-market recovery top run
📌 In May 2019, this indicator broke above the +2 standard deviation line: after 27 days, it started the bull-market recovery top run
📌 In Mar 2023, this indicator broke above the +1 standard deviation line: after 20 days, it started the bull-market recovery secondary top run
📌 In Sep 2026, this indicator broke above the +1 standard deviation line: adjusted by 3 days
┌── 🐼 On-chain data details ──┐
Black line: Bitcoin price
Orange line: Bitcoin on-chain short-term holder MVRV, and its five standard deviation lines: +2σ, +1σ, 0σ, -0.8σ, -1.6σ (4-year rolling window sampled data)
CryptoChan 熊猫
·
--
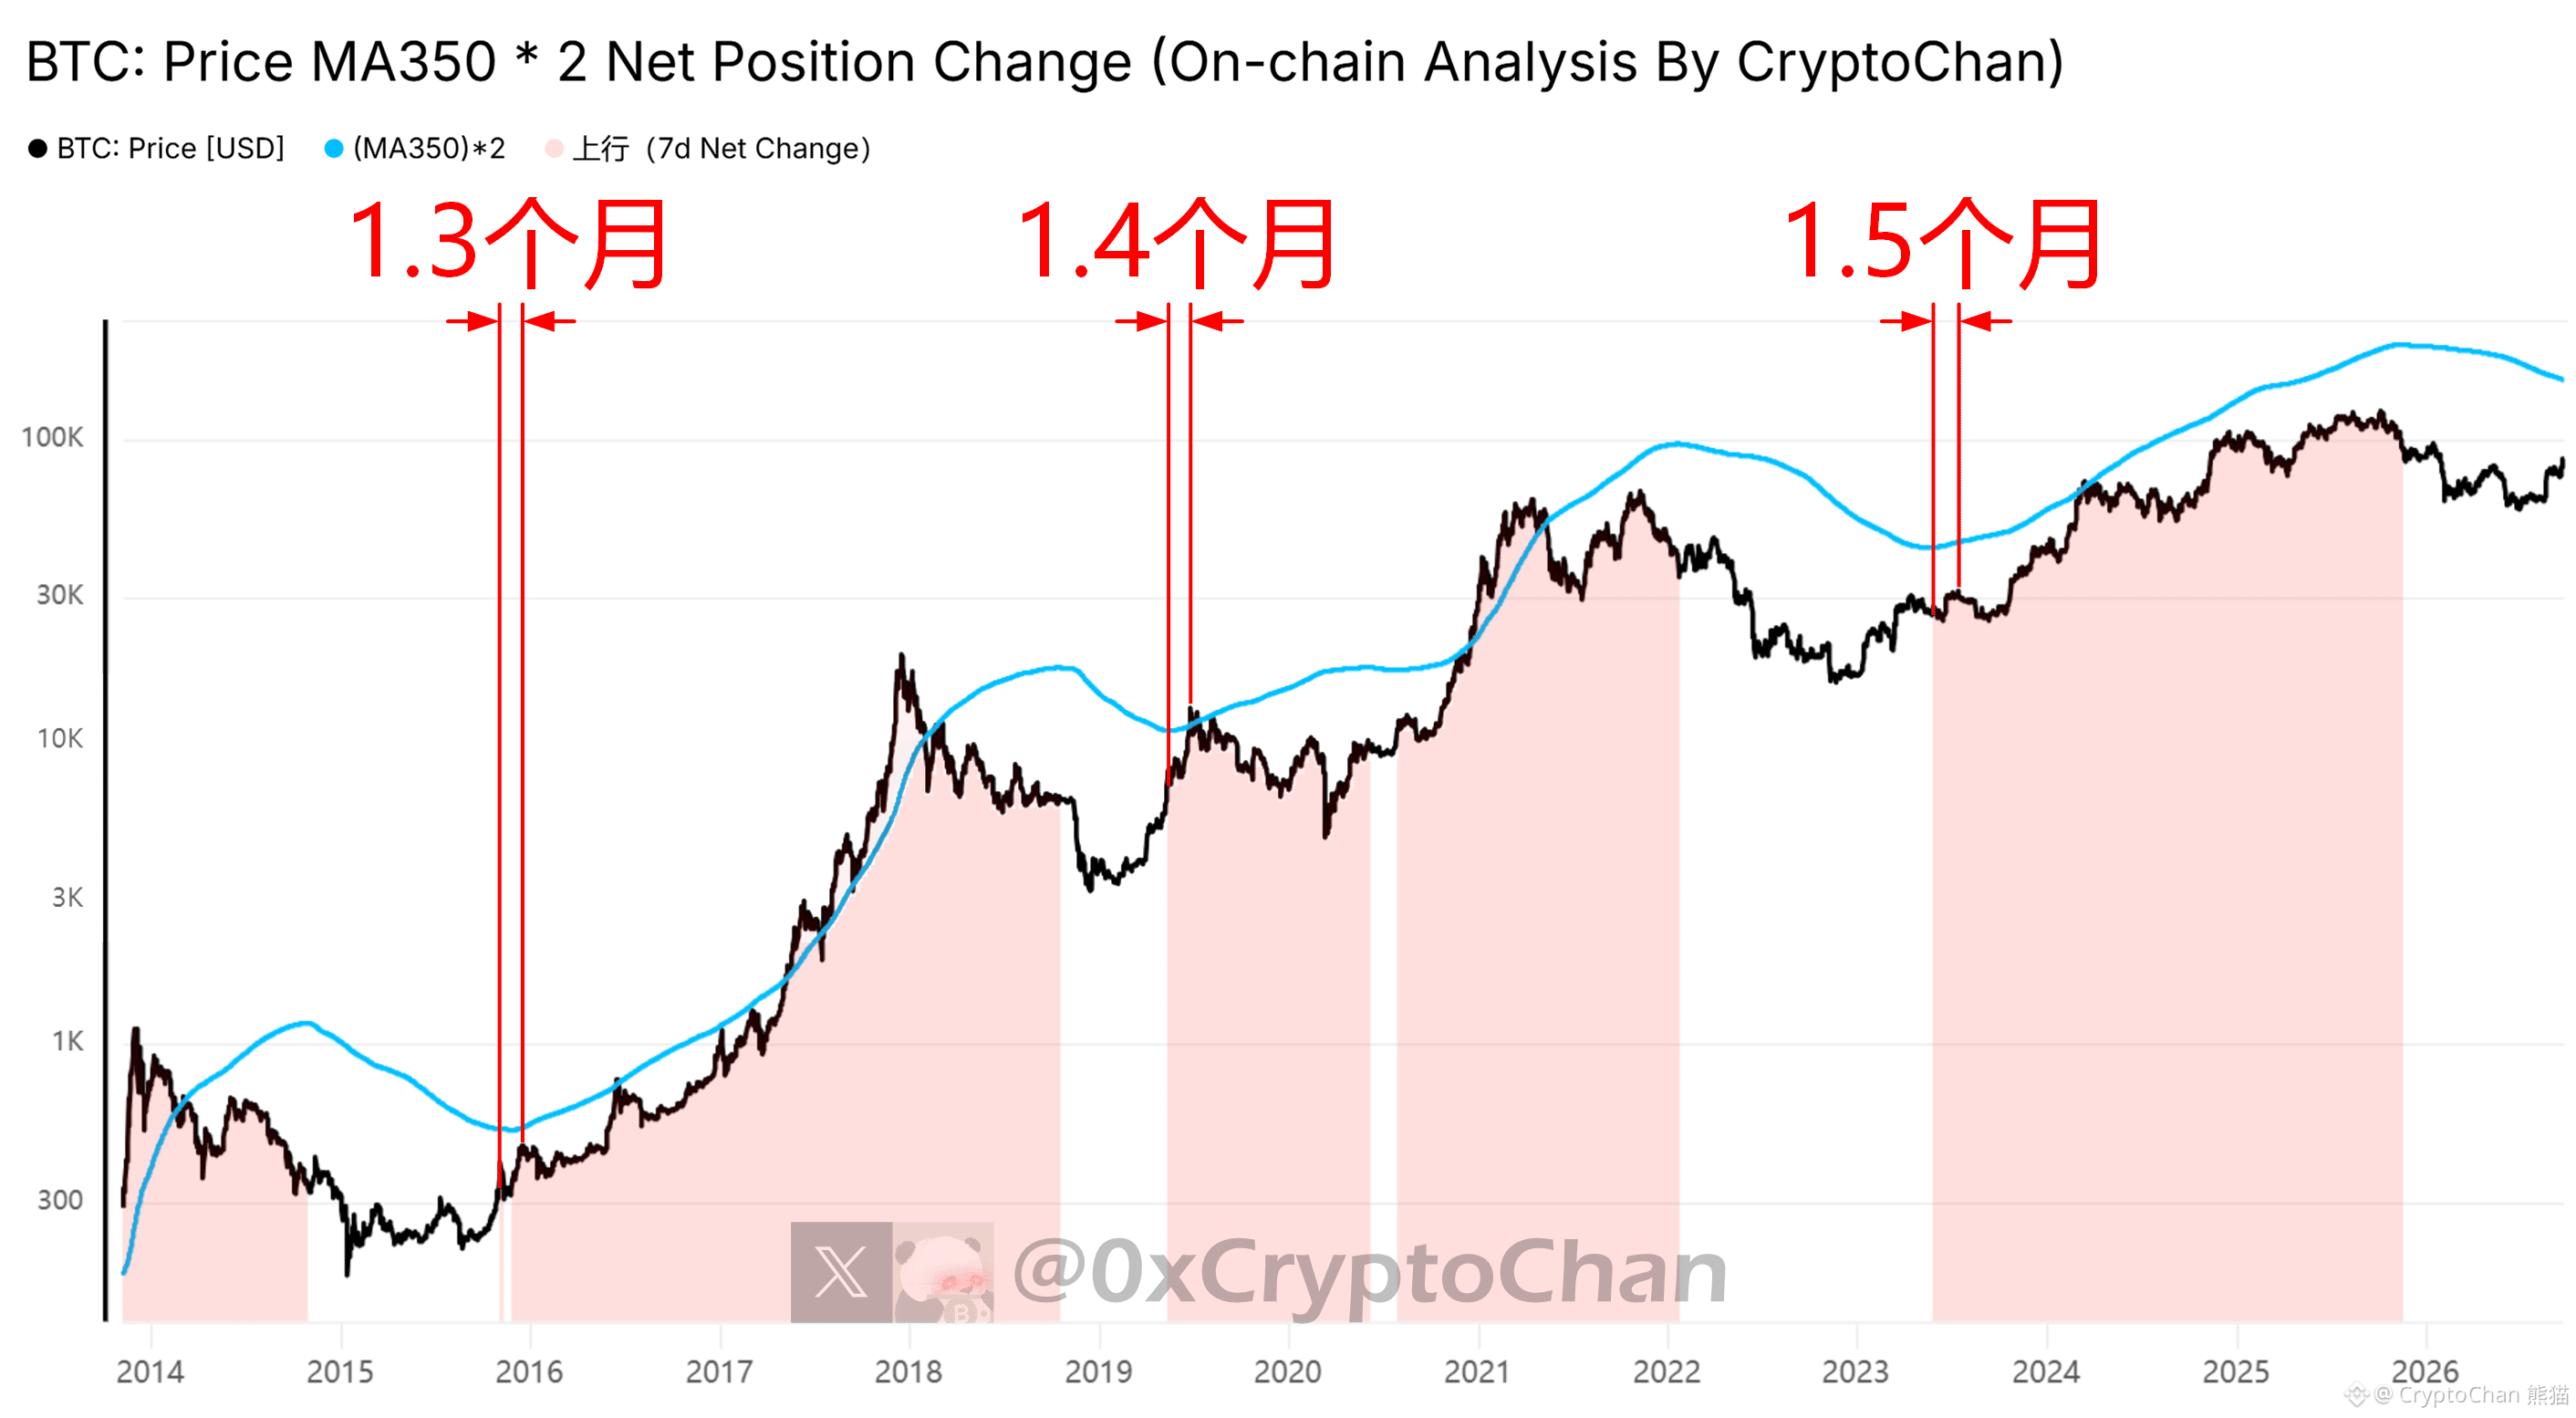
【 $BTC four-year cycle total ke series 73】
📌 November 2015: the blue line turns upward—1.3 months later, the bull market recovery phase reaches its peak
📌 May 2019: the blue line turns upward—1.4 months later, the bull market recovery phase reaches its peak
📌 May 2023: the blue line turns upward—1.5 months later, the bull market recovery phase reaches its peak
┌── 🐼 Indicator details ──┐
Black line: Bitcoin price
Blue line: Bitcoin price 350-day moving average * 2
📌 November 2015: the blue line turns upward—1.3 months later, the bull market recovery phase reaches its peak
📌 May 2019: the blue line turns upward—1.4 months later, the bull market recovery phase reaches its peak
📌 May 2023: the blue line turns upward—1.5 months later, the bull market recovery phase reaches its peak
┌── 🐼 Indicator details ──┐
Black line: Bitcoin price
Blue line: Bitcoin price 350-day moving average * 2
CryptoChan 熊猫
·
--
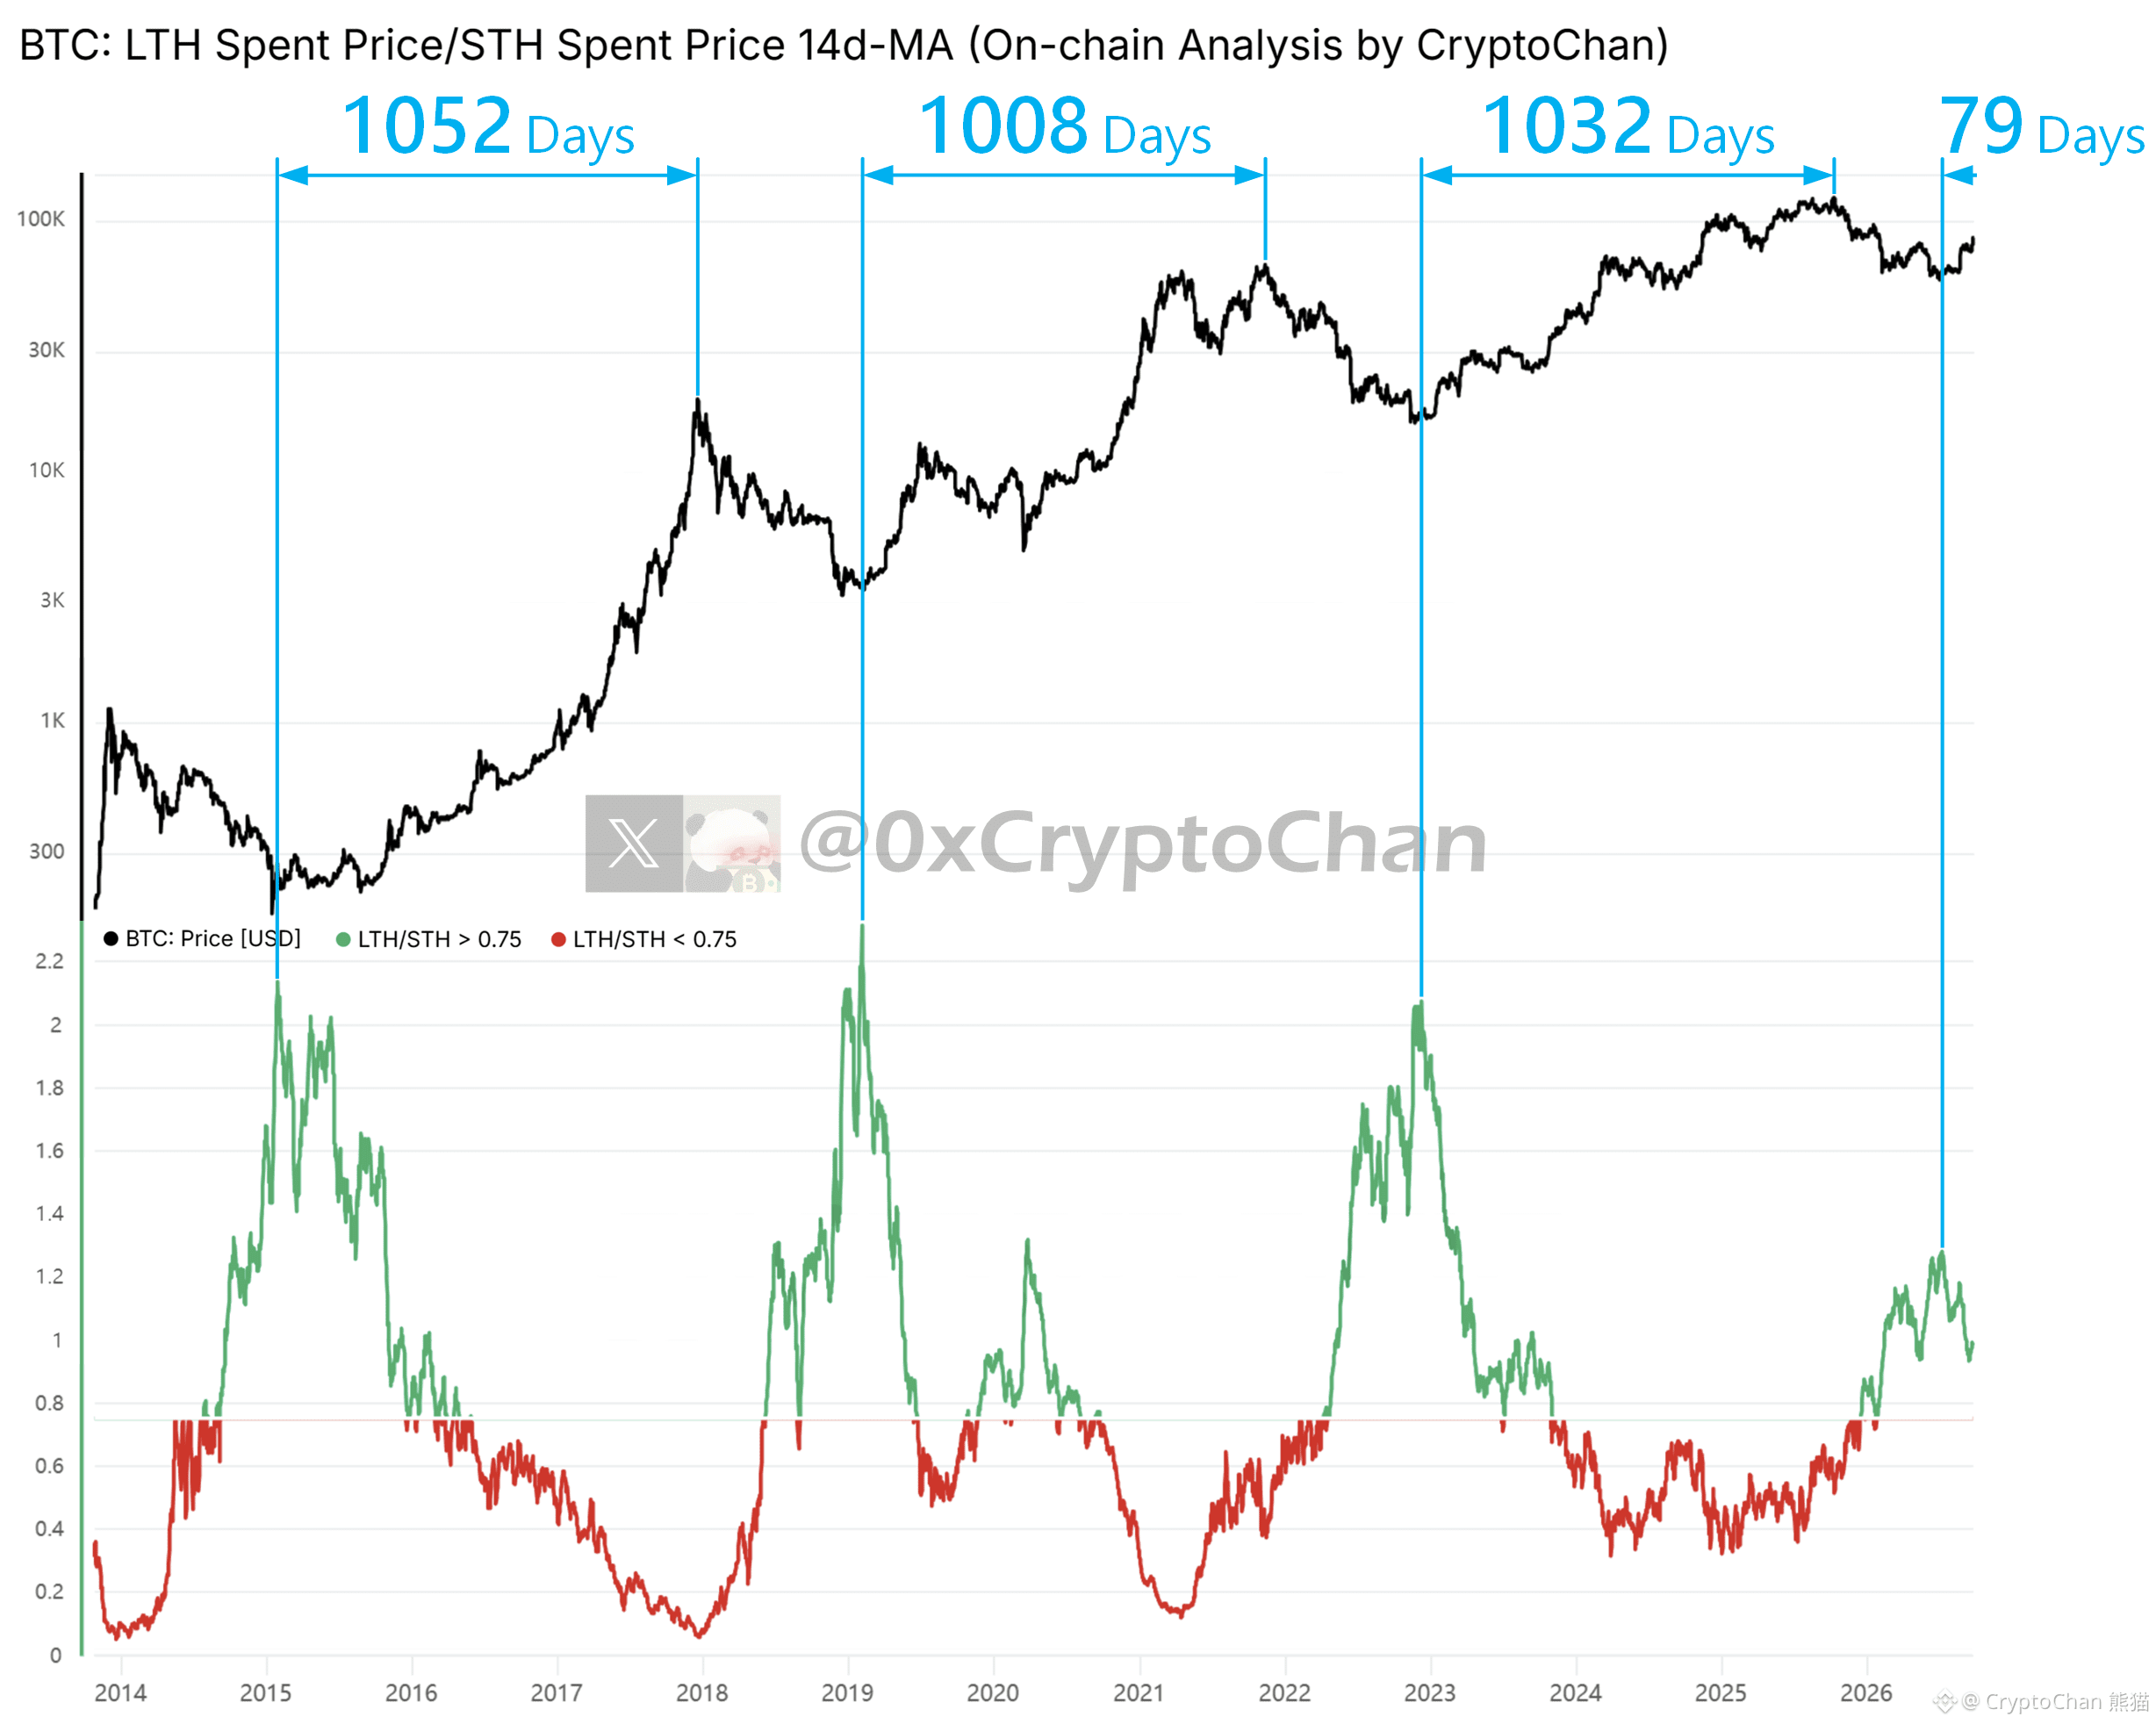
【Bitcoin Bull Market Escape-Topping Countdown Series 05】
2015 Bear Market Bottom: After the green-orange death cross, 1045 days to the great bull top
2019 Bear Market Bottom: After the green-orange death cross, 1028 days to the great bull top
2022 Bear Market Bottom: After the green-orange death cross, 1063 days to the great bull top
2026 Bear Market Bottom: After the green-orange death cross, 59 days have passed
┌─ Indicator Details ─┐
Green line: The average buy price of $BTC for on-chain positions held for 6–12 months
Orange line: The average buy price of $BTC for on-chain positions held for 12–18 months
2015 Bear Market Bottom: After the green-orange death cross, 1045 days to the great bull top
2019 Bear Market Bottom: After the green-orange death cross, 1028 days to the great bull top
2022 Bear Market Bottom: After the green-orange death cross, 1063 days to the great bull top
2026 Bear Market Bottom: After the green-orange death cross, 59 days have passed
┌─ Indicator Details ─┐
Green line: The average buy price of $BTC for on-chain positions held for 6–12 months
Orange line: The average buy price of $BTC for on-chain positions held for 12–18 months
CryptoChan 熊猫
·
--
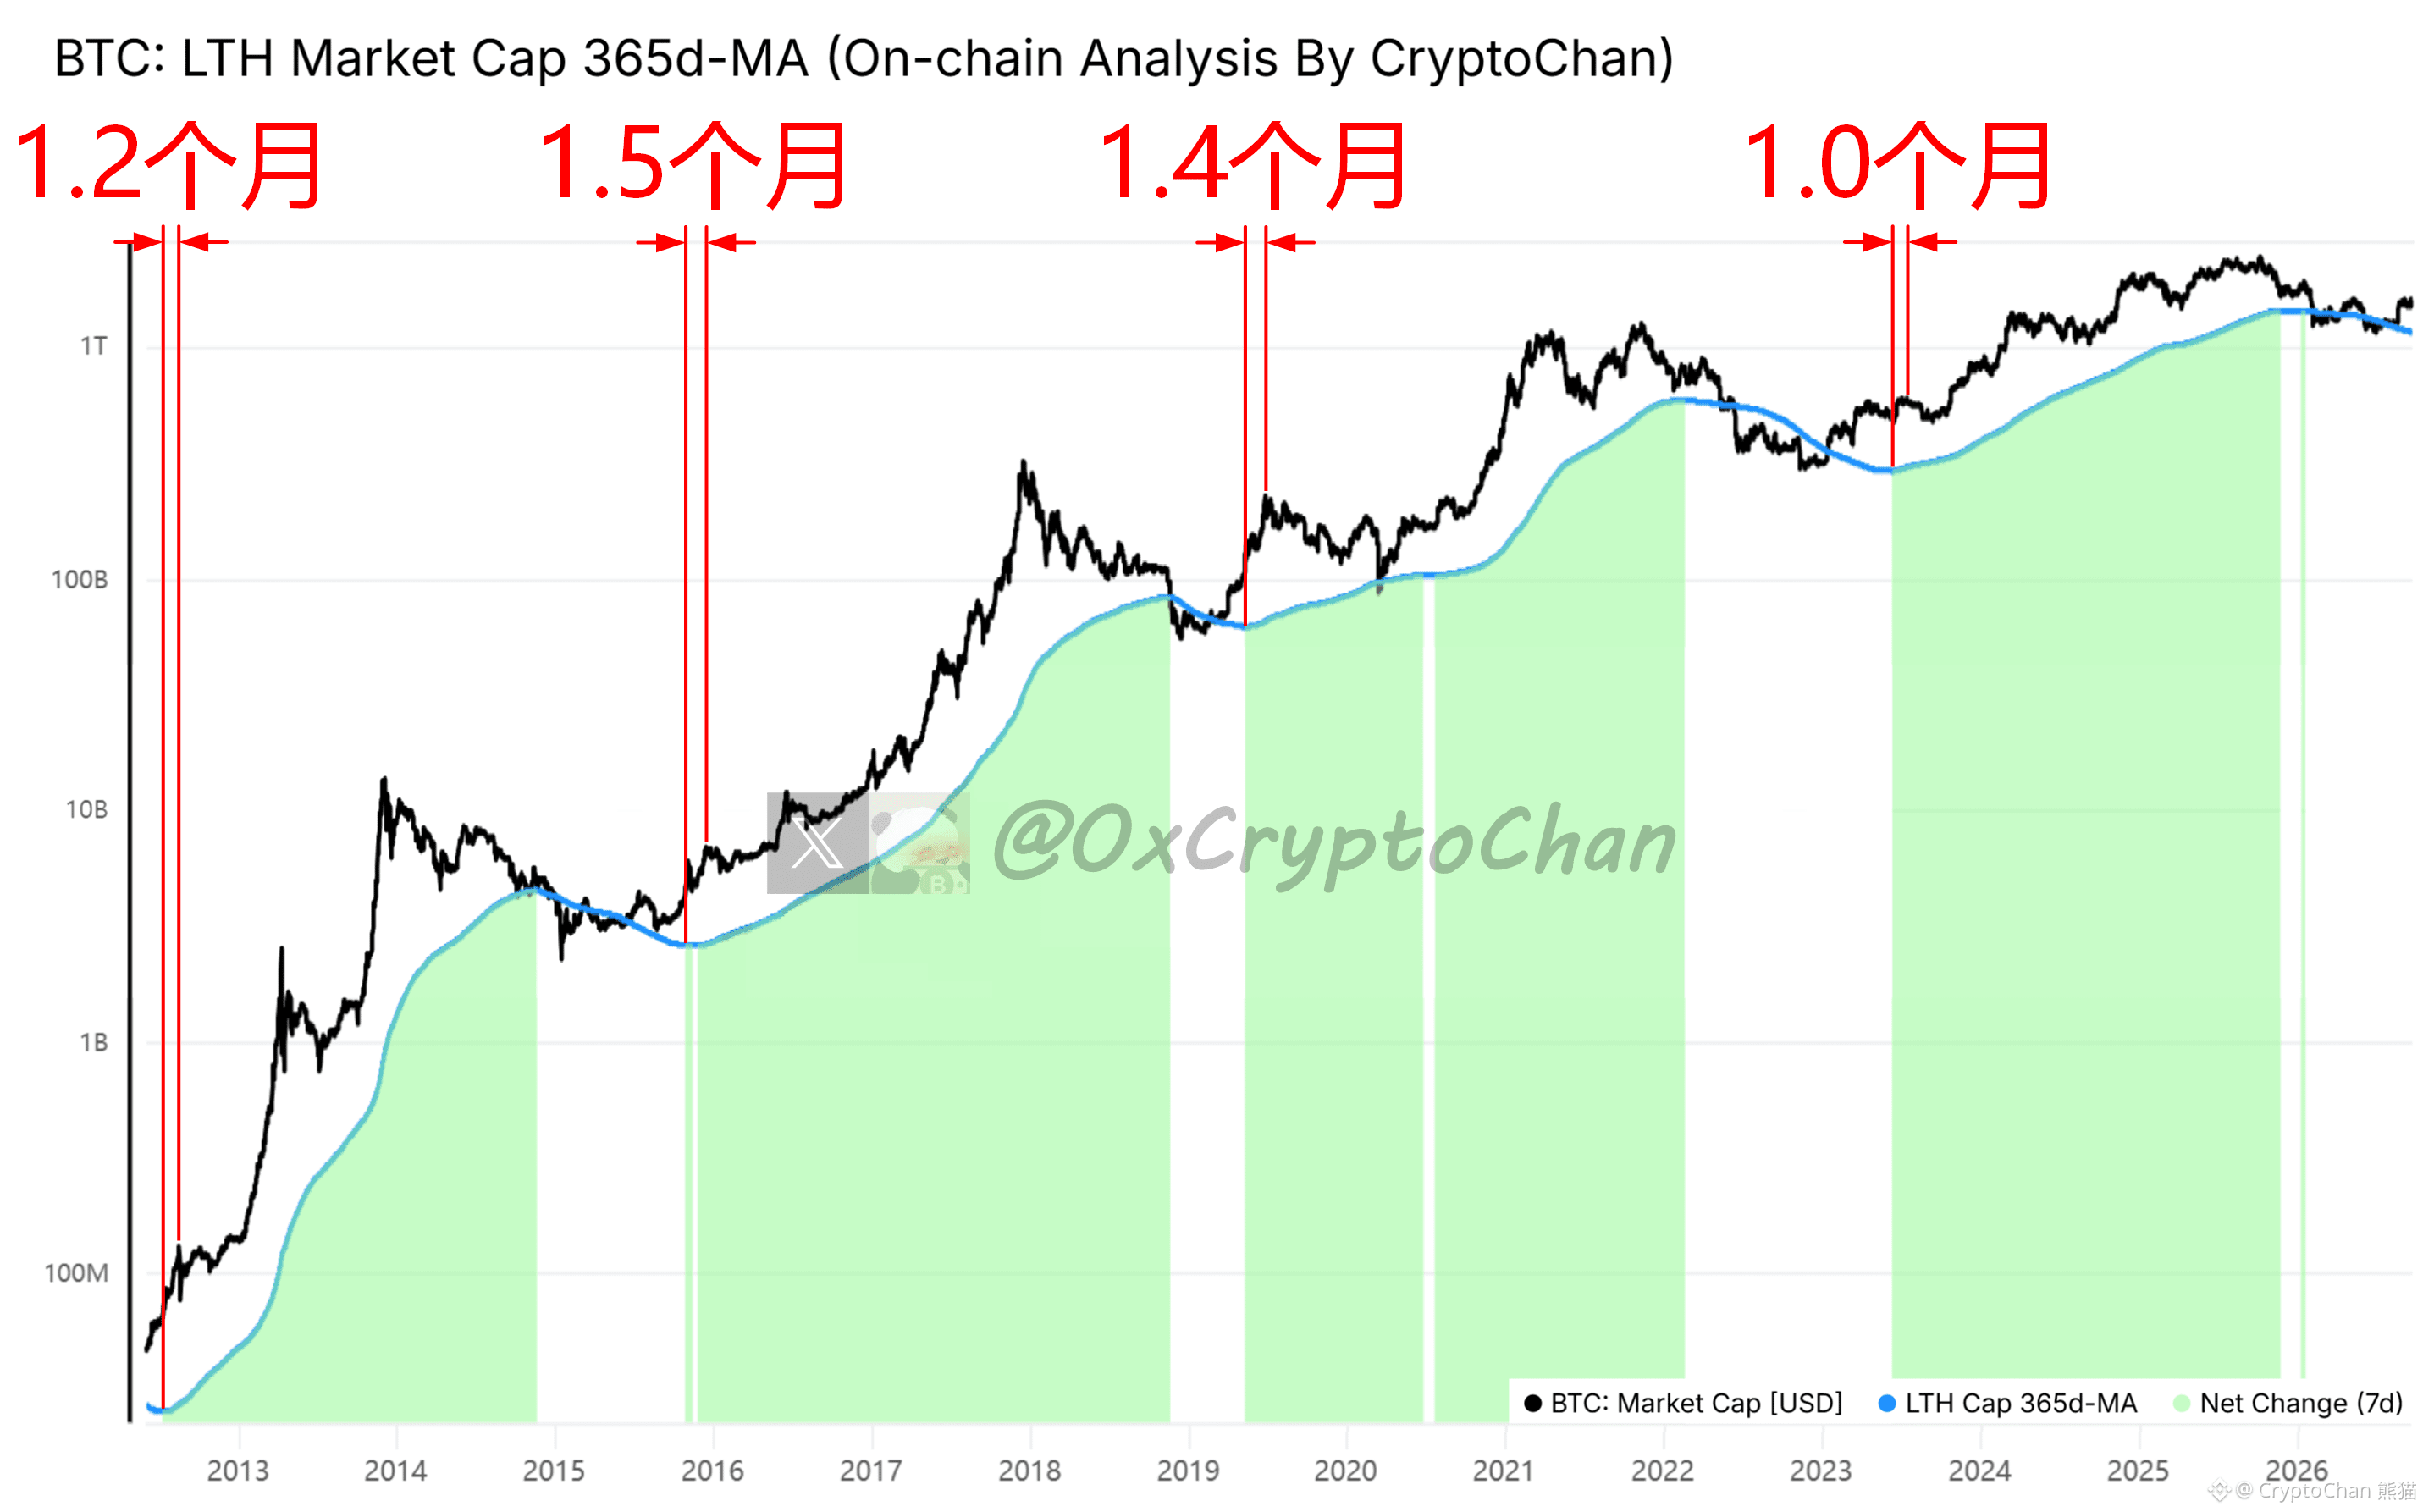
【 $BTC four-year cycle total cut series 72】
In July 2012, the blue line turns: after 1.2 months, it reaches the bull market recovery top
In November 2015, the blue line turns: after 1.5 months, it reaches the bull market recovery top
In May 2019, the blue line turns: after 1.4 months, it reaches the bull market recovery top
In June 2023, the blue line turns: after 1.0 month, it reaches the bull market recovery top
┌── Indicator Details ──┐
Black line: Bitcoin circulating market cap
Blue line: On-chain long-term holders' total coin holdings market cap 365-day MA
In July 2012, the blue line turns: after 1.2 months, it reaches the bull market recovery top
In November 2015, the blue line turns: after 1.5 months, it reaches the bull market recovery top
In May 2019, the blue line turns: after 1.4 months, it reaches the bull market recovery top
In June 2023, the blue line turns: after 1.0 month, it reaches the bull market recovery top
┌── Indicator Details ──┐
Black line: Bitcoin circulating market cap
Blue line: On-chain long-term holders' total coin holdings market cap 365-day MA
CryptoChan 熊猫
·
--
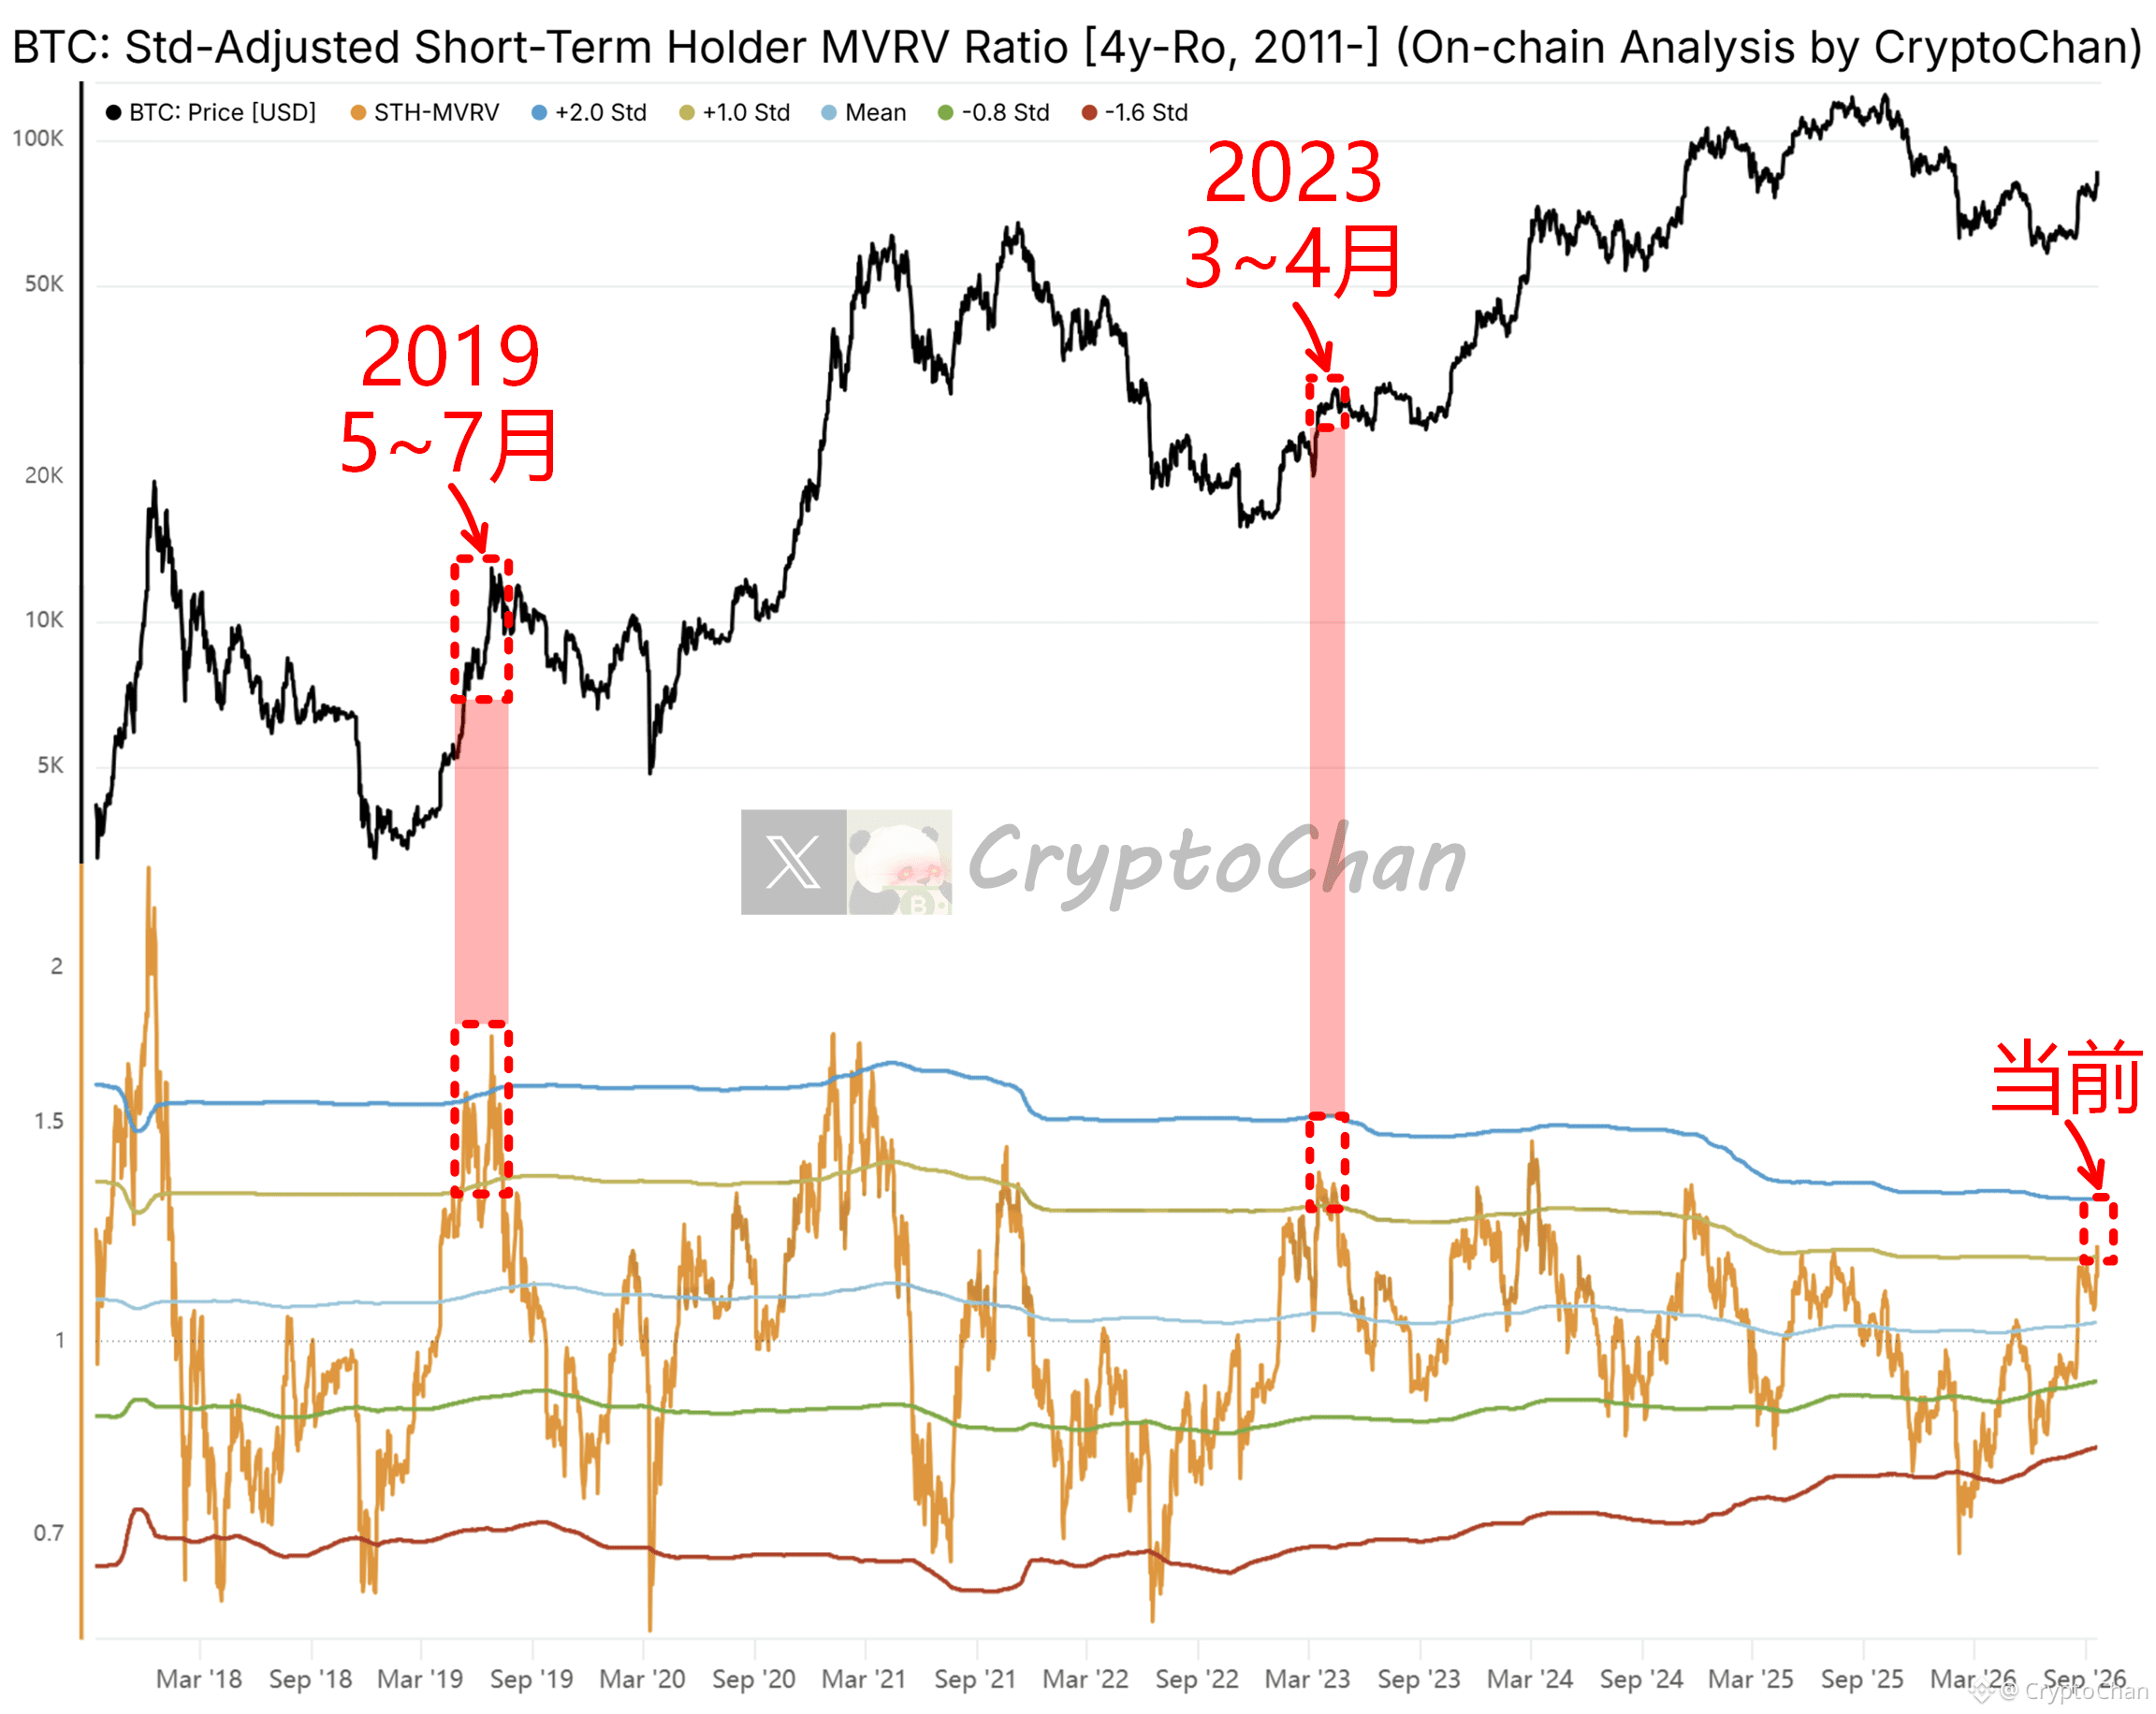
【 $BTC four-year cycle total mark series 71】
2012.06 broke through the orange line: 70 days later, reached the peak of the bull market recovery period
2015.10 broke through the orange line: 60 days later, reached the peak of the bull market recovery period
2019.05 broke through the orange line: 54 days later, reached the peak of the bull market recovery period
2023.03 broke through the orange line: 31 days later, reached the secondary peak of the bull market recovery period
2026.09 broke through the orange line: 3 days have passed
┌ Indicator Details ┐
Black line: Bitcoin circulating market value
Orange line: Bitcoin circulating market value 365-day moving average
2012.06 broke through the orange line: 70 days later, reached the peak of the bull market recovery period
2015.10 broke through the orange line: 60 days later, reached the peak of the bull market recovery period
2019.05 broke through the orange line: 54 days later, reached the peak of the bull market recovery period
2023.03 broke through the orange line: 31 days later, reached the secondary peak of the bull market recovery period
2026.09 broke through the orange line: 3 days have passed
┌ Indicator Details ┐
Black line: Bitcoin circulating market value
Orange line: Bitcoin circulating market value 365-day moving average
CryptoChan 熊猫
·
--
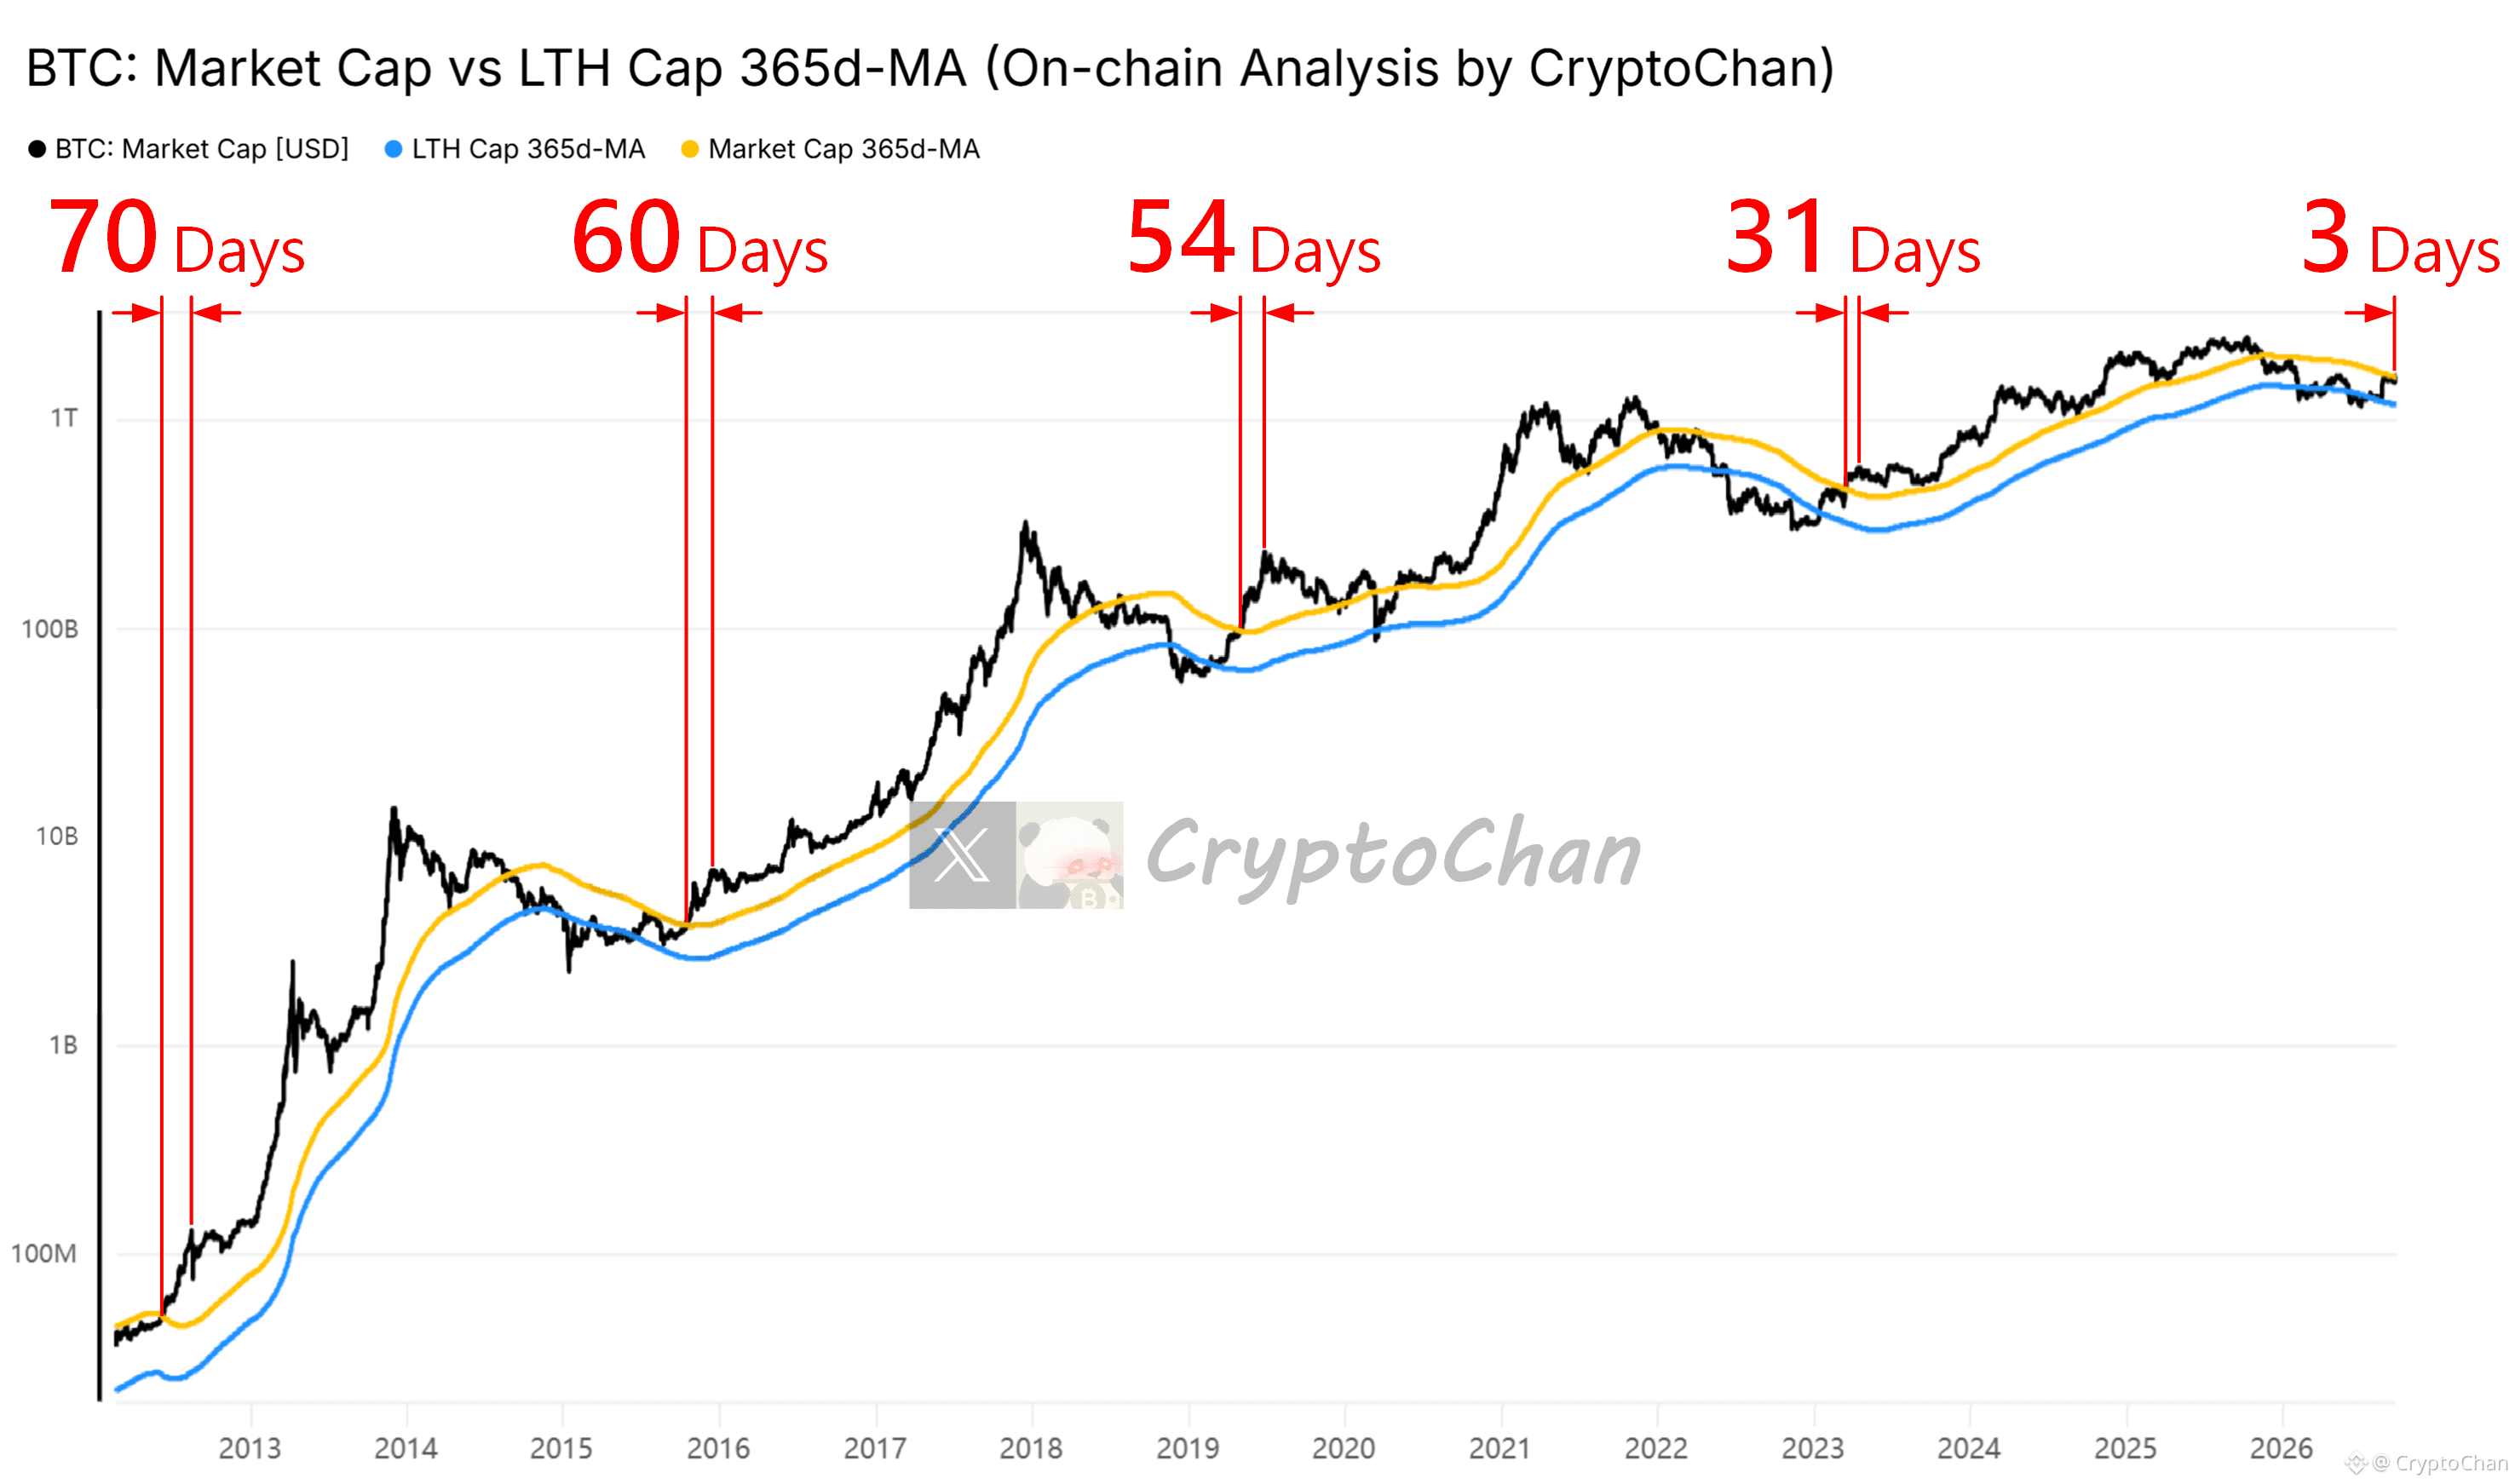
【 $BTC Four-Year Cycle Total Engraving Series 58】
Engraving 2019: There are still two big waves
Engraving 2023: There is still one big wave
┌── 🐼 On-chain data details ──┐
The upper indicator in the chart is the Bitcoin price; the lower indicator in the chart is the Bitcoin on-chain short-term holder MVRV (calculated using a 4-year rolling window), as well as its 5 standard deviation lines: +2σ, +1σ, 0σ, -0.8σ, -1.6σ
Engraving 2019: There are still two big waves
Engraving 2023: There is still one big wave
┌── 🐼 On-chain data details ──┐
The upper indicator in the chart is the Bitcoin price; the lower indicator in the chart is the Bitcoin on-chain short-term holder MVRV (calculated using a 4-year rolling window), as well as its 5 standard deviation lines: +2σ, +1σ, 0σ, -0.8σ, -1.6σ
CryptoChan 熊猫
·
--
【 $BTC four-year cycle total-cut series 70】
In the 2018 bear market, this indicator reached its lowest point: 6.6 months later to the peak of the Bitcoin bull market recovery period
In the 2022 bear market, this indicator reached its lowest point: 6.0 months later to the second-highest peak of the Bitcoin bull market recovery period
In the 2026 bear market, this indicator reached its lowest point: 2.7 months have already passed since now
┌── 🐼 On-chain data details ──┐
The indicator at the bottom of the chart (SLRV) measures the ratio of Bitcoin’s short-term flow speed relative to the flow speed of long-term holders: = (24-hour realized HODL wave) ÷ (realized HODL wave from 6 months to 1 year)
In the 2018 bear market, this indicator reached its lowest point: 6.6 months later to the peak of the Bitcoin bull market recovery period
In the 2022 bear market, this indicator reached its lowest point: 6.0 months later to the second-highest peak of the Bitcoin bull market recovery period
In the 2026 bear market, this indicator reached its lowest point: 2.7 months have already passed since now
┌── 🐼 On-chain data details ──┐
The indicator at the bottom of the chart (SLRV) measures the ratio of Bitcoin’s short-term flow speed relative to the flow speed of long-term holders: = (24-hour realized HODL wave) ÷ (realized HODL wave from 6 months to 1 year)
Log in to explore more content