
CryptoAizen
517 Posts

CryptoAizen
Report
Block User
Crypto Analyst with 9 Years of Fruitful Experience.
11 Following
400 Followers
1.6K+ Liked
Posts
All
Quotes
PINNED
·
--
Bullish
Why Are LUNA Coins Pumping All of a Sudden?
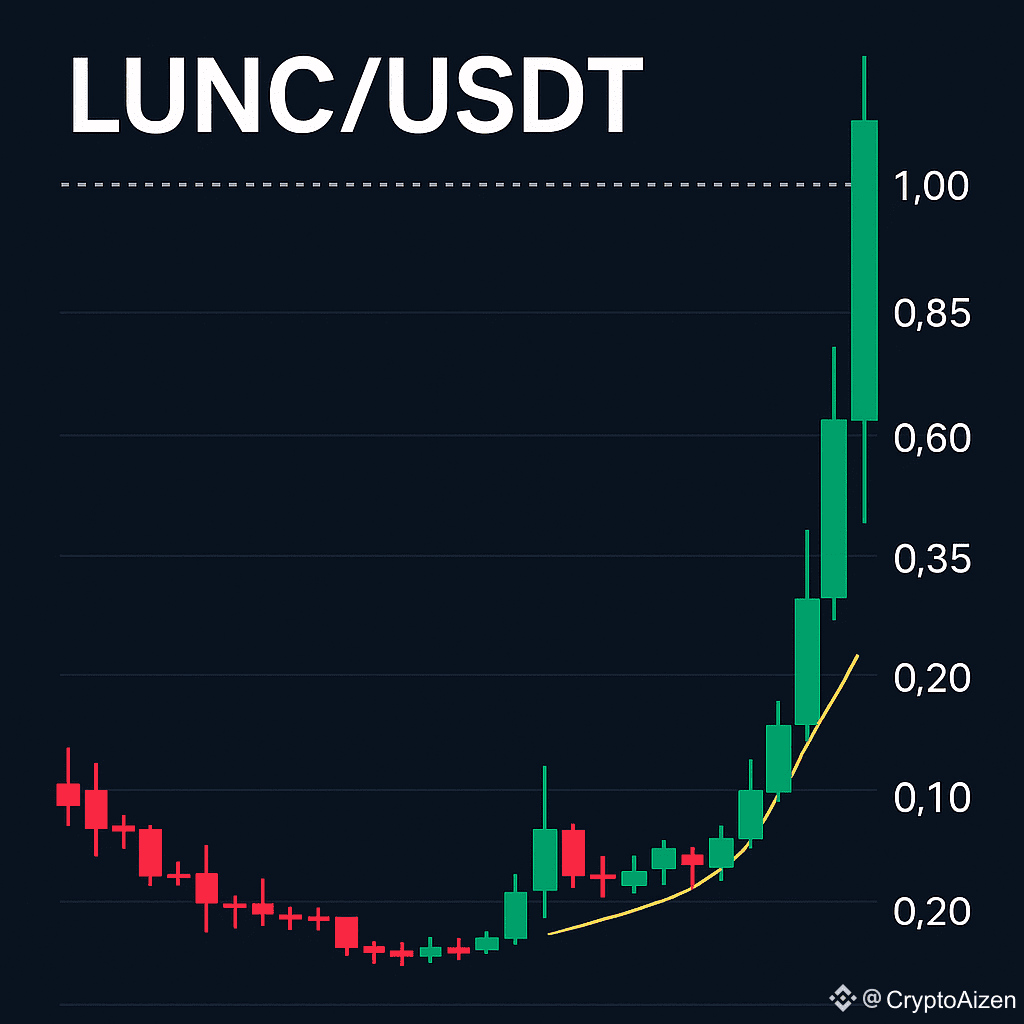
Let’s stop pretending this pump came out of nowhere there are real reasons behind the sudden explosion in $LUNC and LUNA activity, and most people haven’t even connected the dots yet.
This isn’t some random whale manipulation.
This isn’t a temporary bounce.
This is the result of months of developments finally hitting the market at the same time and the reaction was inevitable.
Here’s exactly what triggered the sudden pump:
1. The Major Network Upgrade Finally Went Live
The recent chain update wasn’t just a cosmetic patch it fixed long-standing efficiency issues, improved transaction flow, and boosted validator stability.
For a chain with LUNC’s history, these upgrades are massive.
Investors love seeing a project that’s alive and still evolving.
This was the first spark.
2. Massive Volume Spike Higher Than Most Major Alts
This is the part nobody can ignore.
LUNC started printing volume candles bigger than coins with 10x its market cap.
This is accumulation, not hype.
When serious volume returns to a beaten-down token, it means the smart money is rotating in early.
3. The Community Is Going All-In Again
Love it or hate it, the LUNC community is one of the strongest in crypto.
They showed up again. Burn campaigns restarted. Social activity exploded.
Sentiment flipped bullish at the exact moment the fundamentals improved that’s a perfect storm.
4. Market Loves a Comeback Narrative
And right now?
LUNA coins are giving the market exactly what it wants:
a redemption arc powerful enough to attract new investors while waking up the old ones.
The result?
A sudden, aggressive pump that was not accidental it was earned.
And if these developments continue…
This won’t be the last pump you see.
It might actually be the beginning of the comeback everyone thought was impossible.
#LUNAUpdate
#LUNCAnalysis
#USTCsurge
#PumpLuna
#BullishMomentum
{future}(1000LUNCUSDT)
{future}(LUNA2USDT)
{future}(USTCUSDT)
Why Are LUNA Coins Pumping All of a Sudden?
Let’s stop pretending this pump came out of nowhere there are real reasons behind the sudden explosion in $LUNC and LUNA activity, and most people haven’t even connected the dots yet.
This isn’t some random whale manipulation.
This isn’t a temporary bounce.
This is the result of months of developments finally hitting the market at the same time and the reaction was inevitable.
Here’s exactly what triggered the sudden pump:
1. The Major Network Upgrade Finally Went Live
The recent chain update wasn’t just a cosmetic patch it fixed long-standing efficiency issues, improved transaction flow, and boosted validator stability.
For a chain with LUNC’s history, these upgrades are massive.
Investors love seeing a project that’s alive and still evolving.
This was the first spark.
2. Massive Volume Spike Higher Than Most Major Alts
This is the part nobody can ignore.
LUNC started printing volume candles bigger than coins with 10x its market cap.
This is accumulation, not hype.
When serious volume returns to a beaten-down token, it means the smart money is rotating in early.
3. The Community Is Going All-In Again
Love it or hate it, the LUNC community is one of the strongest in crypto.
They showed up again. Burn campaigns restarted. Social activity exploded.
Sentiment flipped bullish at the exact moment the fundamentals improved that’s a perfect storm.
4. Market Loves a Comeback Narrative
And right now?
LUNA coins are giving the market exactly what it wants:
a redemption arc powerful enough to attract new investors while waking up the old ones.
The result?
A sudden, aggressive pump that was not accidental it was earned.
And if these developments continue…
This won’t be the last pump you see.
It might actually be the beginning of the comeback everyone thought was impossible.
#LUNAUpdate
#LUNCAnalysis
#USTCsurge
#PumpLuna
#BullishMomentum
Let’s stop pretending this pump came out of nowhere there are real reasons behind the sudden explosion in $LUNC and LUNA activity, and most people haven’t even connected the dots yet.
This isn’t some random whale manipulation.
This isn’t a temporary bounce.
This is the result of months of developments finally hitting the market at the same time and the reaction was inevitable.
Here’s exactly what triggered the sudden pump:
1. The Major Network Upgrade Finally Went Live
The recent chain update wasn’t just a cosmetic patch it fixed long-standing efficiency issues, improved transaction flow, and boosted validator stability.
For a chain with LUNC’s history, these upgrades are massive.
Investors love seeing a project that’s alive and still evolving.
This was the first spark.
2. Massive Volume Spike Higher Than Most Major Alts
This is the part nobody can ignore.
LUNC started printing volume candles bigger than coins with 10x its market cap.
This is accumulation, not hype.
When serious volume returns to a beaten-down token, it means the smart money is rotating in early.
3. The Community Is Going All-In Again
Love it or hate it, the LUNC community is one of the strongest in crypto.
They showed up again. Burn campaigns restarted. Social activity exploded.
Sentiment flipped bullish at the exact moment the fundamentals improved that’s a perfect storm.
4. Market Loves a Comeback Narrative
And right now?
LUNA coins are giving the market exactly what it wants:
a redemption arc powerful enough to attract new investors while waking up the old ones.
The result?
A sudden, aggressive pump that was not accidental it was earned.
And if these developments continue…
This won’t be the last pump you see.
It might actually be the beginning of the comeback everyone thought was impossible.
#LUNAUpdate
#LUNCAnalysis
#USTCsurge
#PumpLuna
#BullishMomentum
16
4
81
26k
PINNED
·
--
Bearish
Why 90% of Altcoins Will Never See Their ATH Again
Most people in crypto don’t want to hear this truth… but it’s the reality that hits every cycle.
The majority of altcoins will never return to their All-Time Highs and the reason is brutally simple: the market changes, liquidity dries up, and the hype that once carried these coins disappears forever.
Every cycle creates new winners… and quietly buries the old ones.
Teams abandon projects, token unlocks crush the charts, early VCs dump without mercy, and the retail crowd moves to whatever narrative is shining next.
Without real demand, the price doesn’t “recover” it just slowly bleeds until no one even checks the chart anymore.
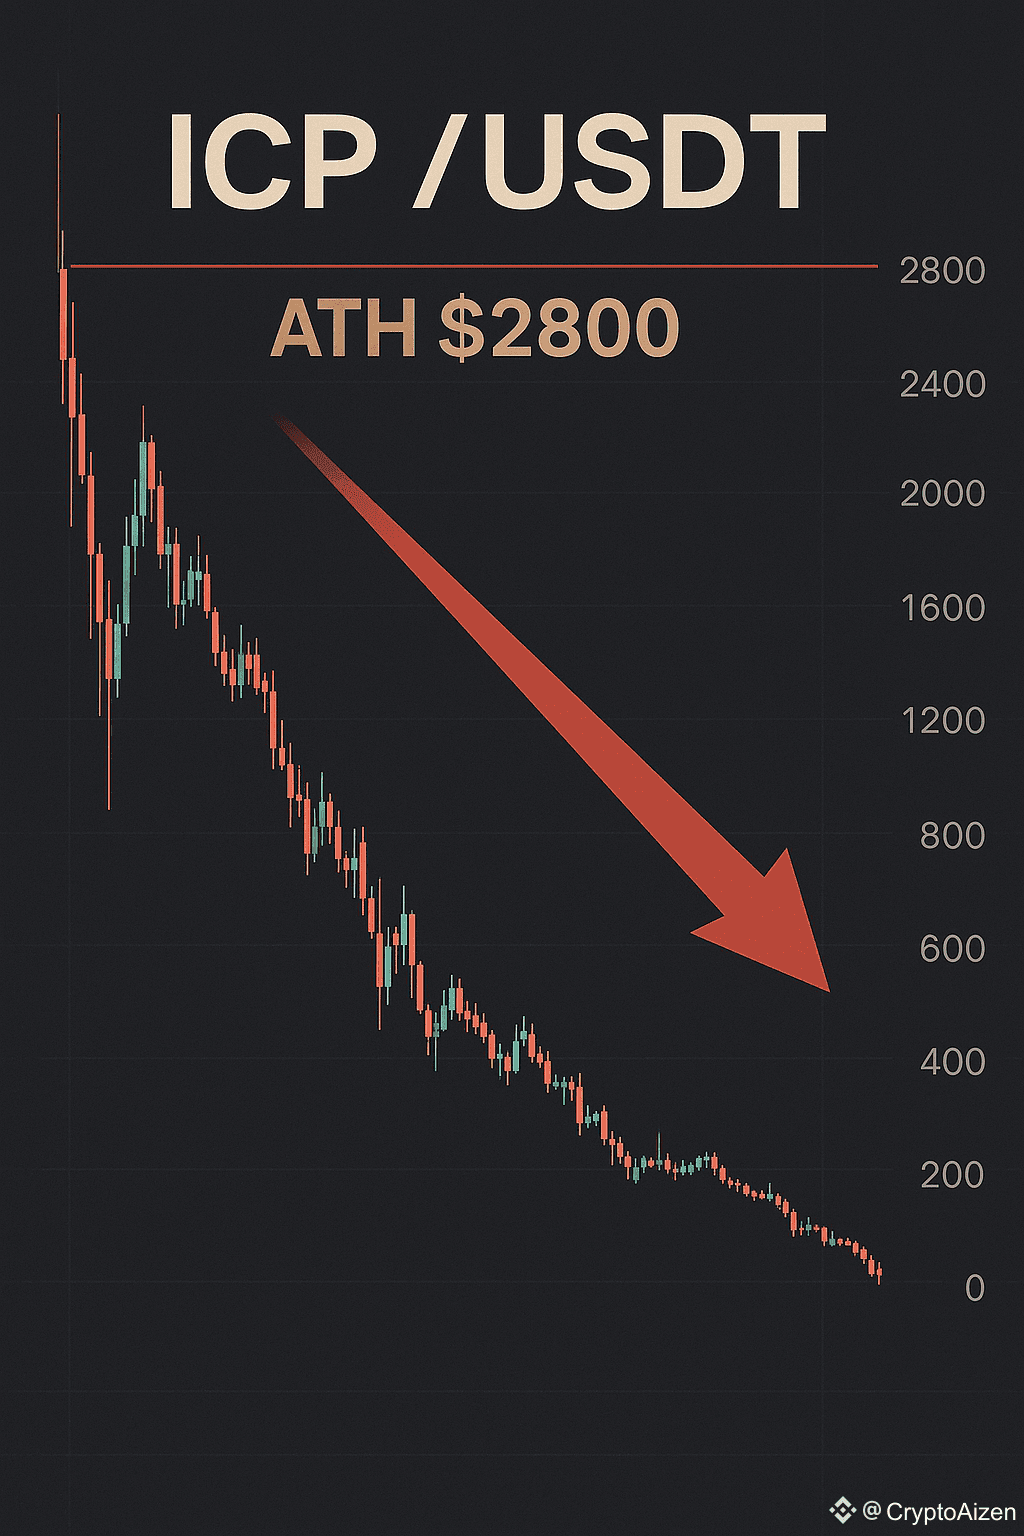
Take $ICP for example.
Its ATH was $2,800 an insane launch valuation that never made sense.
Today it trades so far below that peak that expecting a comeback to $2.8K is basically the same as hoping a dead star reignites.
The market moved on. The hype died. The liquidity vanished.
And new narratives replaced it.
And ICP isn’t alone.
Hundreds of altcoins from 2017 never came back in 2021.
Hundreds from 2021 won’t come back in 2025.
And the cycle will repeat again and again.
Crypto rewards rotation not nostalgia.
So next time someone says
“Bro, it’ll hit ATH again… just wait,”
remember: only a tiny handful of projects actually break their previous highs.
The rest?
They become historic charts reminders of how euphoric the market once was.
Stay sharp, stay realistic, and rotate into strength… not memories.
#icpAnalysis
#fakepump
#SharpMove
#BearishPattern
{future}(ICPUSDT)
{future}(PYTHUSDT)
{future}(MELANIAUSDT)
Why 90% of Altcoins Will Never See Their ATH Again
Most people in crypto don’t want to hear this truth… but it’s the reality that hits every cycle.
The majority of altcoins will never return to their All-Time Highs and the reason is brutally simple: the market changes, liquidity dries up, and the hype that once carried these coins disappears forever.
Every cycle creates new winners… and quietly buries the old ones.
Teams abandon projects, token unlocks crush the charts, early VCs dump without mercy, and the retail crowd moves to whatever narrative is shining next.
Without real demand, the price doesn’t “recover” it just slowly bleeds until no one even checks the chart anymore.
Take $ICP for example.
Its ATH was $2,800 an insane launch valuation that never made sense.
Today it trades so far below that peak that expecting a comeback to $2.8K is basically the same as hoping a dead star reignites.
The market moved on. The hype died. The liquidity vanished.
And new narratives replaced it.
And ICP isn’t alone.
Hundreds of altcoins from 2017 never came back in 2021.
Hundreds from 2021 won’t come back in 2025.
And the cycle will repeat again and again.
Crypto rewards rotation not nostalgia.
So next time someone says
“Bro, it’ll hit ATH again… just wait,”
remember: only a tiny handful of projects actually break their previous highs.
The rest?
They become historic charts reminders of how euphoric the market once was.
Stay sharp, stay realistic, and rotate into strength… not memories.
#icpAnalysis
#fakepump
#SharpMove
#BearishPattern
Most people in crypto don’t want to hear this truth… but it’s the reality that hits every cycle.
The majority of altcoins will never return to their All-Time Highs and the reason is brutally simple: the market changes, liquidity dries up, and the hype that once carried these coins disappears forever.
Every cycle creates new winners… and quietly buries the old ones.
Teams abandon projects, token unlocks crush the charts, early VCs dump without mercy, and the retail crowd moves to whatever narrative is shining next.
Without real demand, the price doesn’t “recover” it just slowly bleeds until no one even checks the chart anymore.
Take $ICP for example.
Its ATH was $2,800 an insane launch valuation that never made sense.
Today it trades so far below that peak that expecting a comeback to $2.8K is basically the same as hoping a dead star reignites.
The market moved on. The hype died. The liquidity vanished.
And new narratives replaced it.
And ICP isn’t alone.
Hundreds of altcoins from 2017 never came back in 2021.
Hundreds from 2021 won’t come back in 2025.
And the cycle will repeat again and again.
Crypto rewards rotation not nostalgia.
So next time someone says
“Bro, it’ll hit ATH again… just wait,”
remember: only a tiny handful of projects actually break their previous highs.
The rest?
They become historic charts reminders of how euphoric the market once was.
Stay sharp, stay realistic, and rotate into strength… not memories.
#icpAnalysis
#fakepump
#SharpMove
#BearishPattern
19
5
29
20.5k
·
--
Bullish
THE DANGEROUS PSYCHOLOGY BEHIND THE $KAT +29% PUMP (DON'T GET LIQUIDATED)
⠀
When a micro-cap altcoin surges thirty percent on nine-figure turnover, retail immediately splits into two losing camps. One side FOMOs into the top with extreme leverage, while the other stubbornly shorts resistance expecting an instant collapse.
⠀
Both impulses usually end in total liquidation.
⠀
Looking under the hood of $KAT on Binance Futures right now, the underlying order flow reveals an aggressive institutional accumulation engine:
⠀
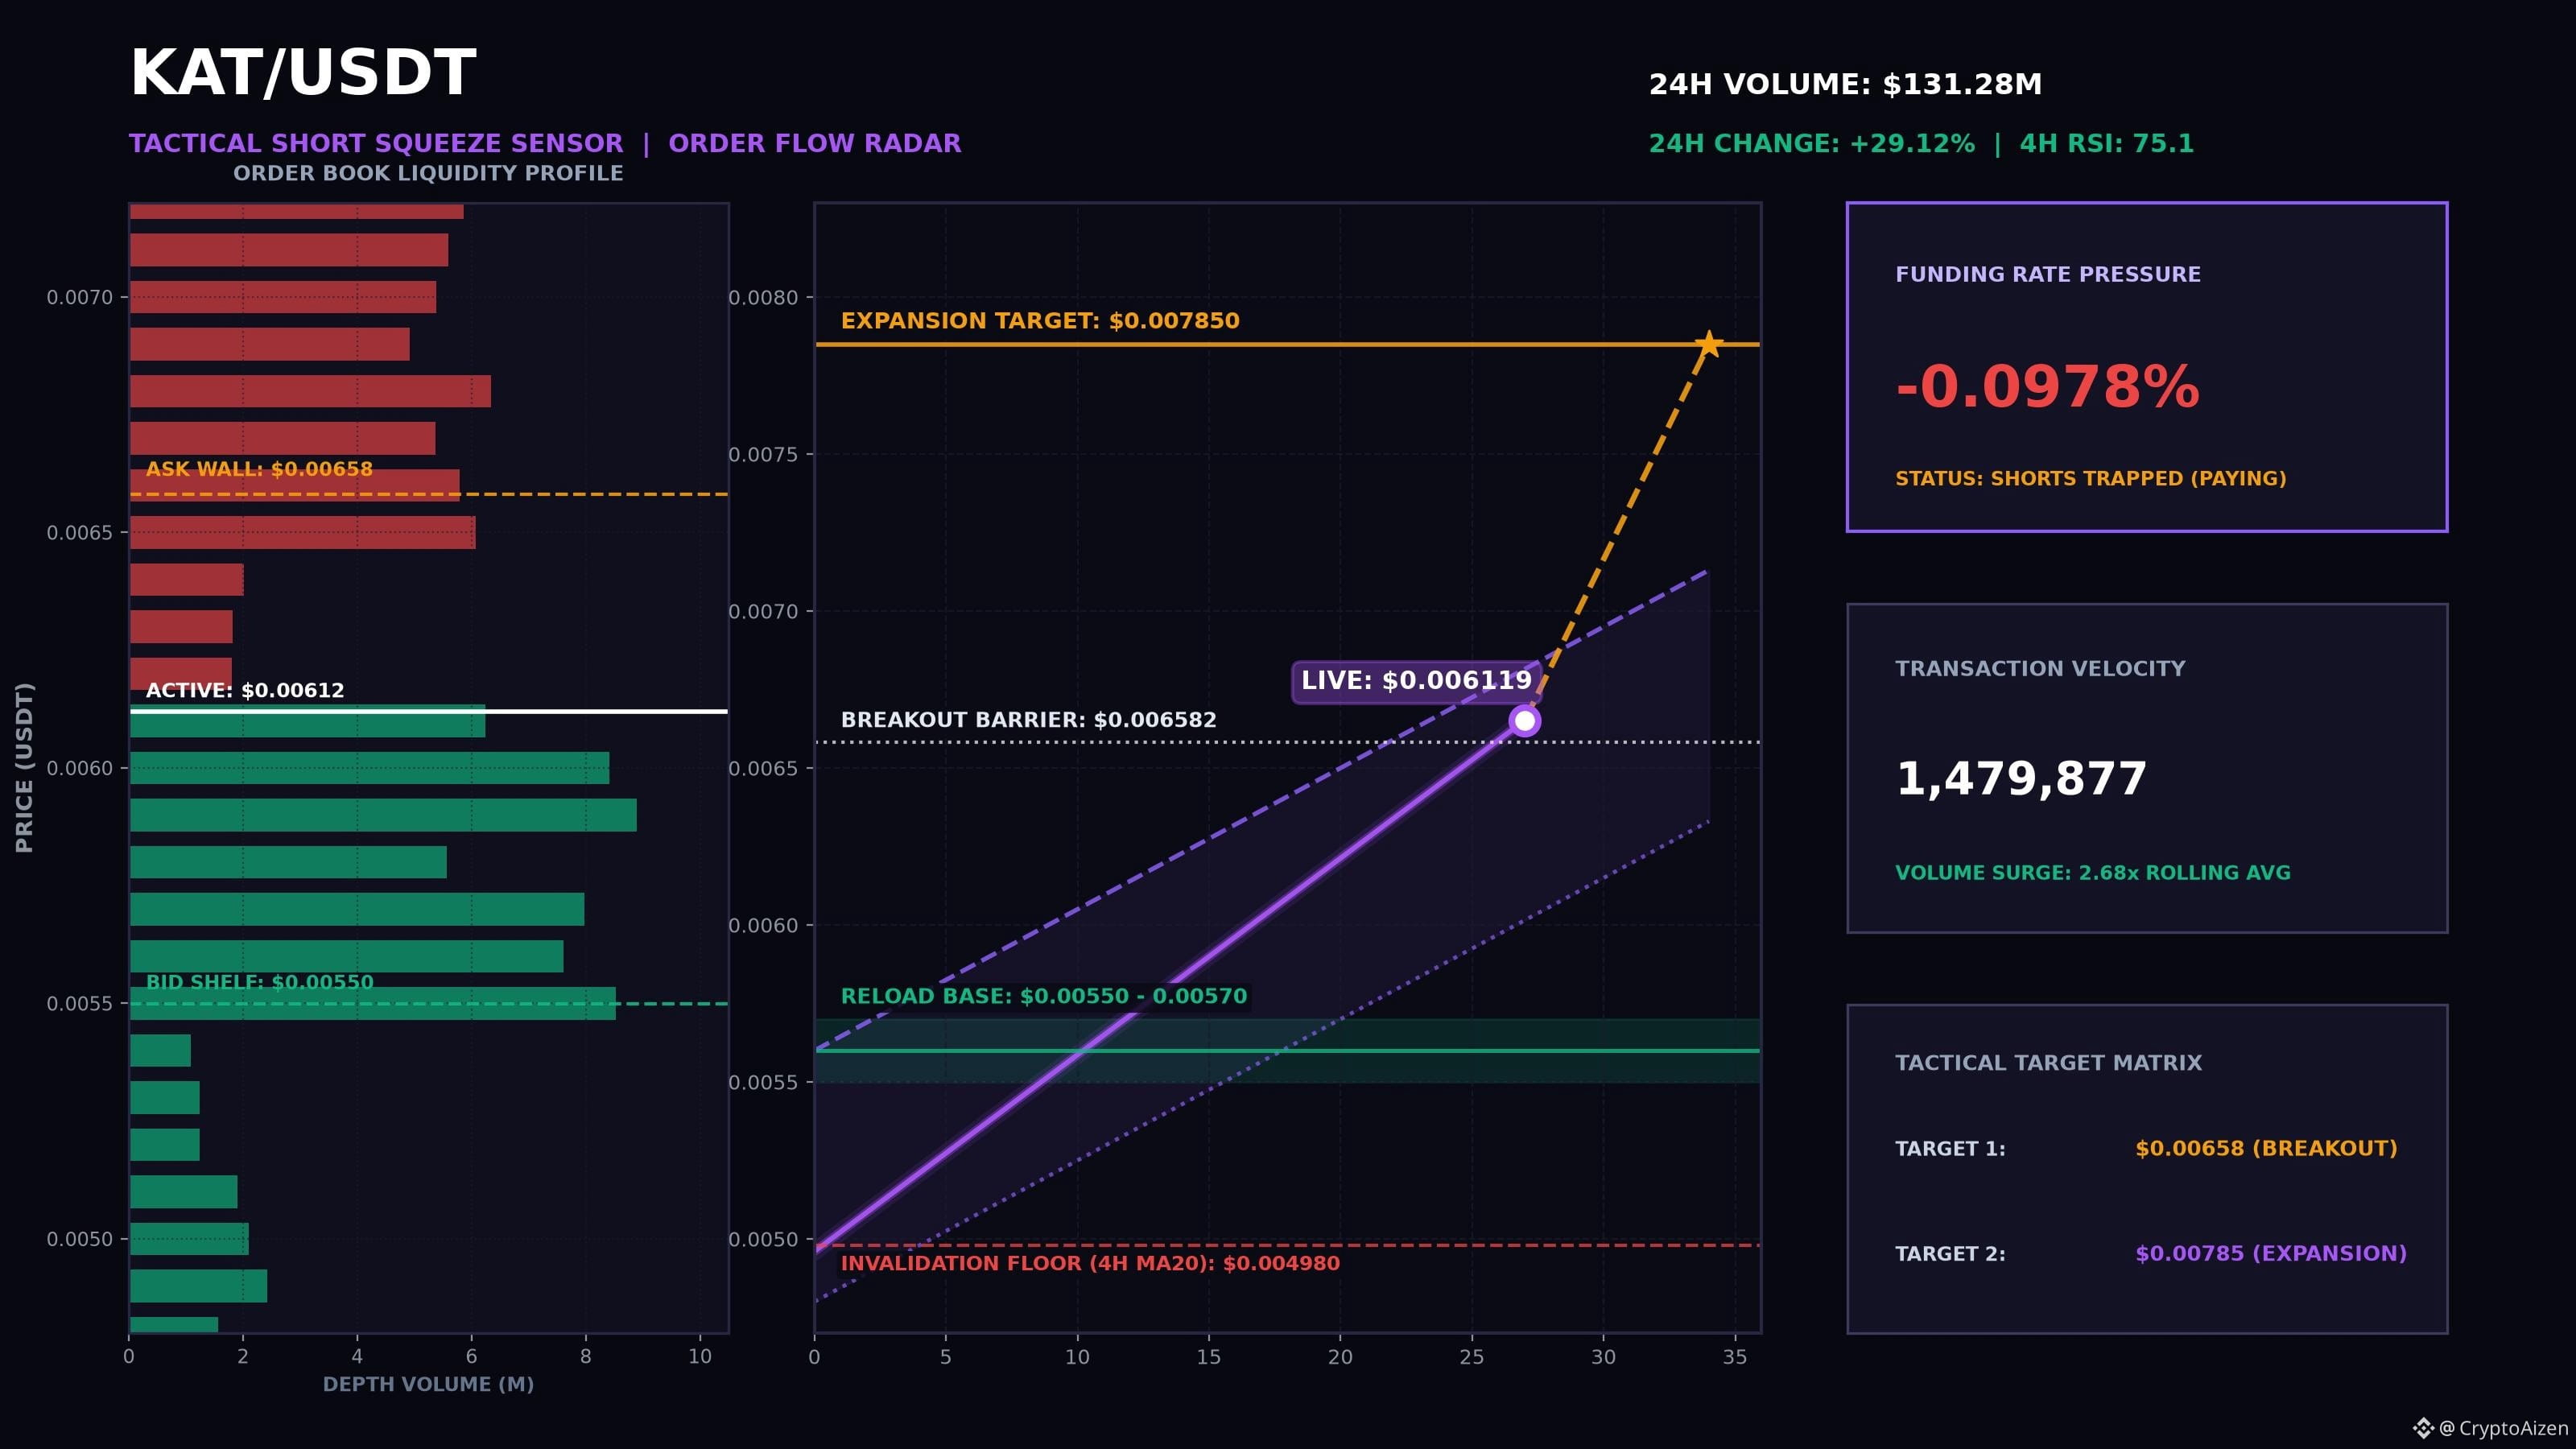
◈ THE SQUEEZE IGNITION AT -0.0978% FUNDING
Futures funding has cratered into deep negative territory at minus zero point zero nine seven eight percent. Shorters are actively paying longs every single window. In low-float, high-velocity breakouts, smart money rarely reverses price until trapped bears are forced into buying back at the highs.
⠀
◈ THE $131M SPOT ABSORPTION
Over 131 million dollars in volume has rotated through KAT across 1.48 million individual trades. That level of participation confirms spot buyers are absorbing limit sell walls between 0.0055 and 0.0057.
⠀
◈ THE TACTICAL ROADMAP:
→ Local Ceiling: The 24-hour high at 0.00658 represents the immediate breakout trigger.
→ Reload Base: The 0.00550 to 0.00570 pocket is the primary demand shelf.
→ Squeeze Target: A clean reclaim of 0.00658 unlocks an acceleration run toward 0.00785.
→ Invalidation: A 4-Hour close below 0.00498 breaks the bullish structure.
⠀
The market punishes emotional consensus. When the crowd rushes to fade an aggressive expansion against negative funding, the path of least resistance is upward.
⠀
I will publish the follow-up chart as soon as the 4-Hour candle closes at 04:00 UTC. Tap follow so you do not miss the execution update.
⠀
#KAT #CryptoBreakout #BinanceSquare #ShortSqueeze #Altcoins
THE DANGEROUS PSYCHOLOGY BEHIND THE $KAT +29% PUMP (DON'T GET LIQUIDATED)
⠀
When a micro-cap altcoin surges thirty percent on nine-figure turnover, retail immediately splits into two losing camps. One side FOMOs into the top with extreme leverage, while the other stubbornly shorts resistance expecting an instant collapse.
⠀
Both impulses usually end in total liquidation.
⠀
Looking under the hood of $KAT on Binance Futures right now, the underlying order flow reveals an aggressive institutional accumulation engine:
⠀
◈ THE SQUEEZE IGNITION AT -0.0978% FUNDING
Futures funding has cratered into deep negative territory at minus zero point zero nine seven eight percent. Shorters are actively paying longs every single window. In low-float, high-velocity breakouts, smart money rarely reverses price until trapped bears are forced into buying back at the highs.
⠀
◈ THE $131M SPOT ABSORPTION
Over 131 million dollars in volume has rotated through KAT across 1.48 million individual trades. That level of participation confirms spot buyers are absorbing limit sell walls between 0.0055 and 0.0057.
⠀
◈ THE TACTICAL ROADMAP:
→ Local Ceiling: The 24-hour high at 0.00658 represents the immediate breakout trigger.
→ Reload Base: The 0.00550 to 0.00570 pocket is the primary demand shelf.
→ Squeeze Target: A clean reclaim of 0.00658 unlocks an acceleration run toward 0.00785.
→ Invalidation: A 4-Hour close below 0.00498 breaks the bullish structure.
⠀
The market punishes emotional consensus. When the crowd rushes to fade an aggressive expansion against negative funding, the path of least resistance is upward.
⠀
I will publish the follow-up chart as soon as the 4-Hour candle closes at 04:00 UTC. Tap follow so you do not miss the execution update.
⠀
#KAT #CryptoBreakout #BinanceSquare #ShortSqueeze #Altcoins
⠀
When a micro-cap altcoin surges thirty percent on nine-figure turnover, retail immediately splits into two losing camps. One side FOMOs into the top with extreme leverage, while the other stubbornly shorts resistance expecting an instant collapse.
⠀
Both impulses usually end in total liquidation.
⠀
Looking under the hood of $KAT on Binance Futures right now, the underlying order flow reveals an aggressive institutional accumulation engine:
⠀
◈ THE SQUEEZE IGNITION AT -0.0978% FUNDING
Futures funding has cratered into deep negative territory at minus zero point zero nine seven eight percent. Shorters are actively paying longs every single window. In low-float, high-velocity breakouts, smart money rarely reverses price until trapped bears are forced into buying back at the highs.
⠀
◈ THE $131M SPOT ABSORPTION
Over 131 million dollars in volume has rotated through KAT across 1.48 million individual trades. That level of participation confirms spot buyers are absorbing limit sell walls between 0.0055 and 0.0057.
⠀
◈ THE TACTICAL ROADMAP:
→ Local Ceiling: The 24-hour high at 0.00658 represents the immediate breakout trigger.
→ Reload Base: The 0.00550 to 0.00570 pocket is the primary demand shelf.
→ Squeeze Target: A clean reclaim of 0.00658 unlocks an acceleration run toward 0.00785.
→ Invalidation: A 4-Hour close below 0.00498 breaks the bullish structure.
⠀
The market punishes emotional consensus. When the crowd rushes to fade an aggressive expansion against negative funding, the path of least resistance is upward.
⠀
I will publish the follow-up chart as soon as the 4-Hour candle closes at 04:00 UTC. Tap follow so you do not miss the execution update.
⠀
#KAT #CryptoBreakout #BinanceSquare #ShortSqueeze #Altcoins
1
30
·
--
Bullish
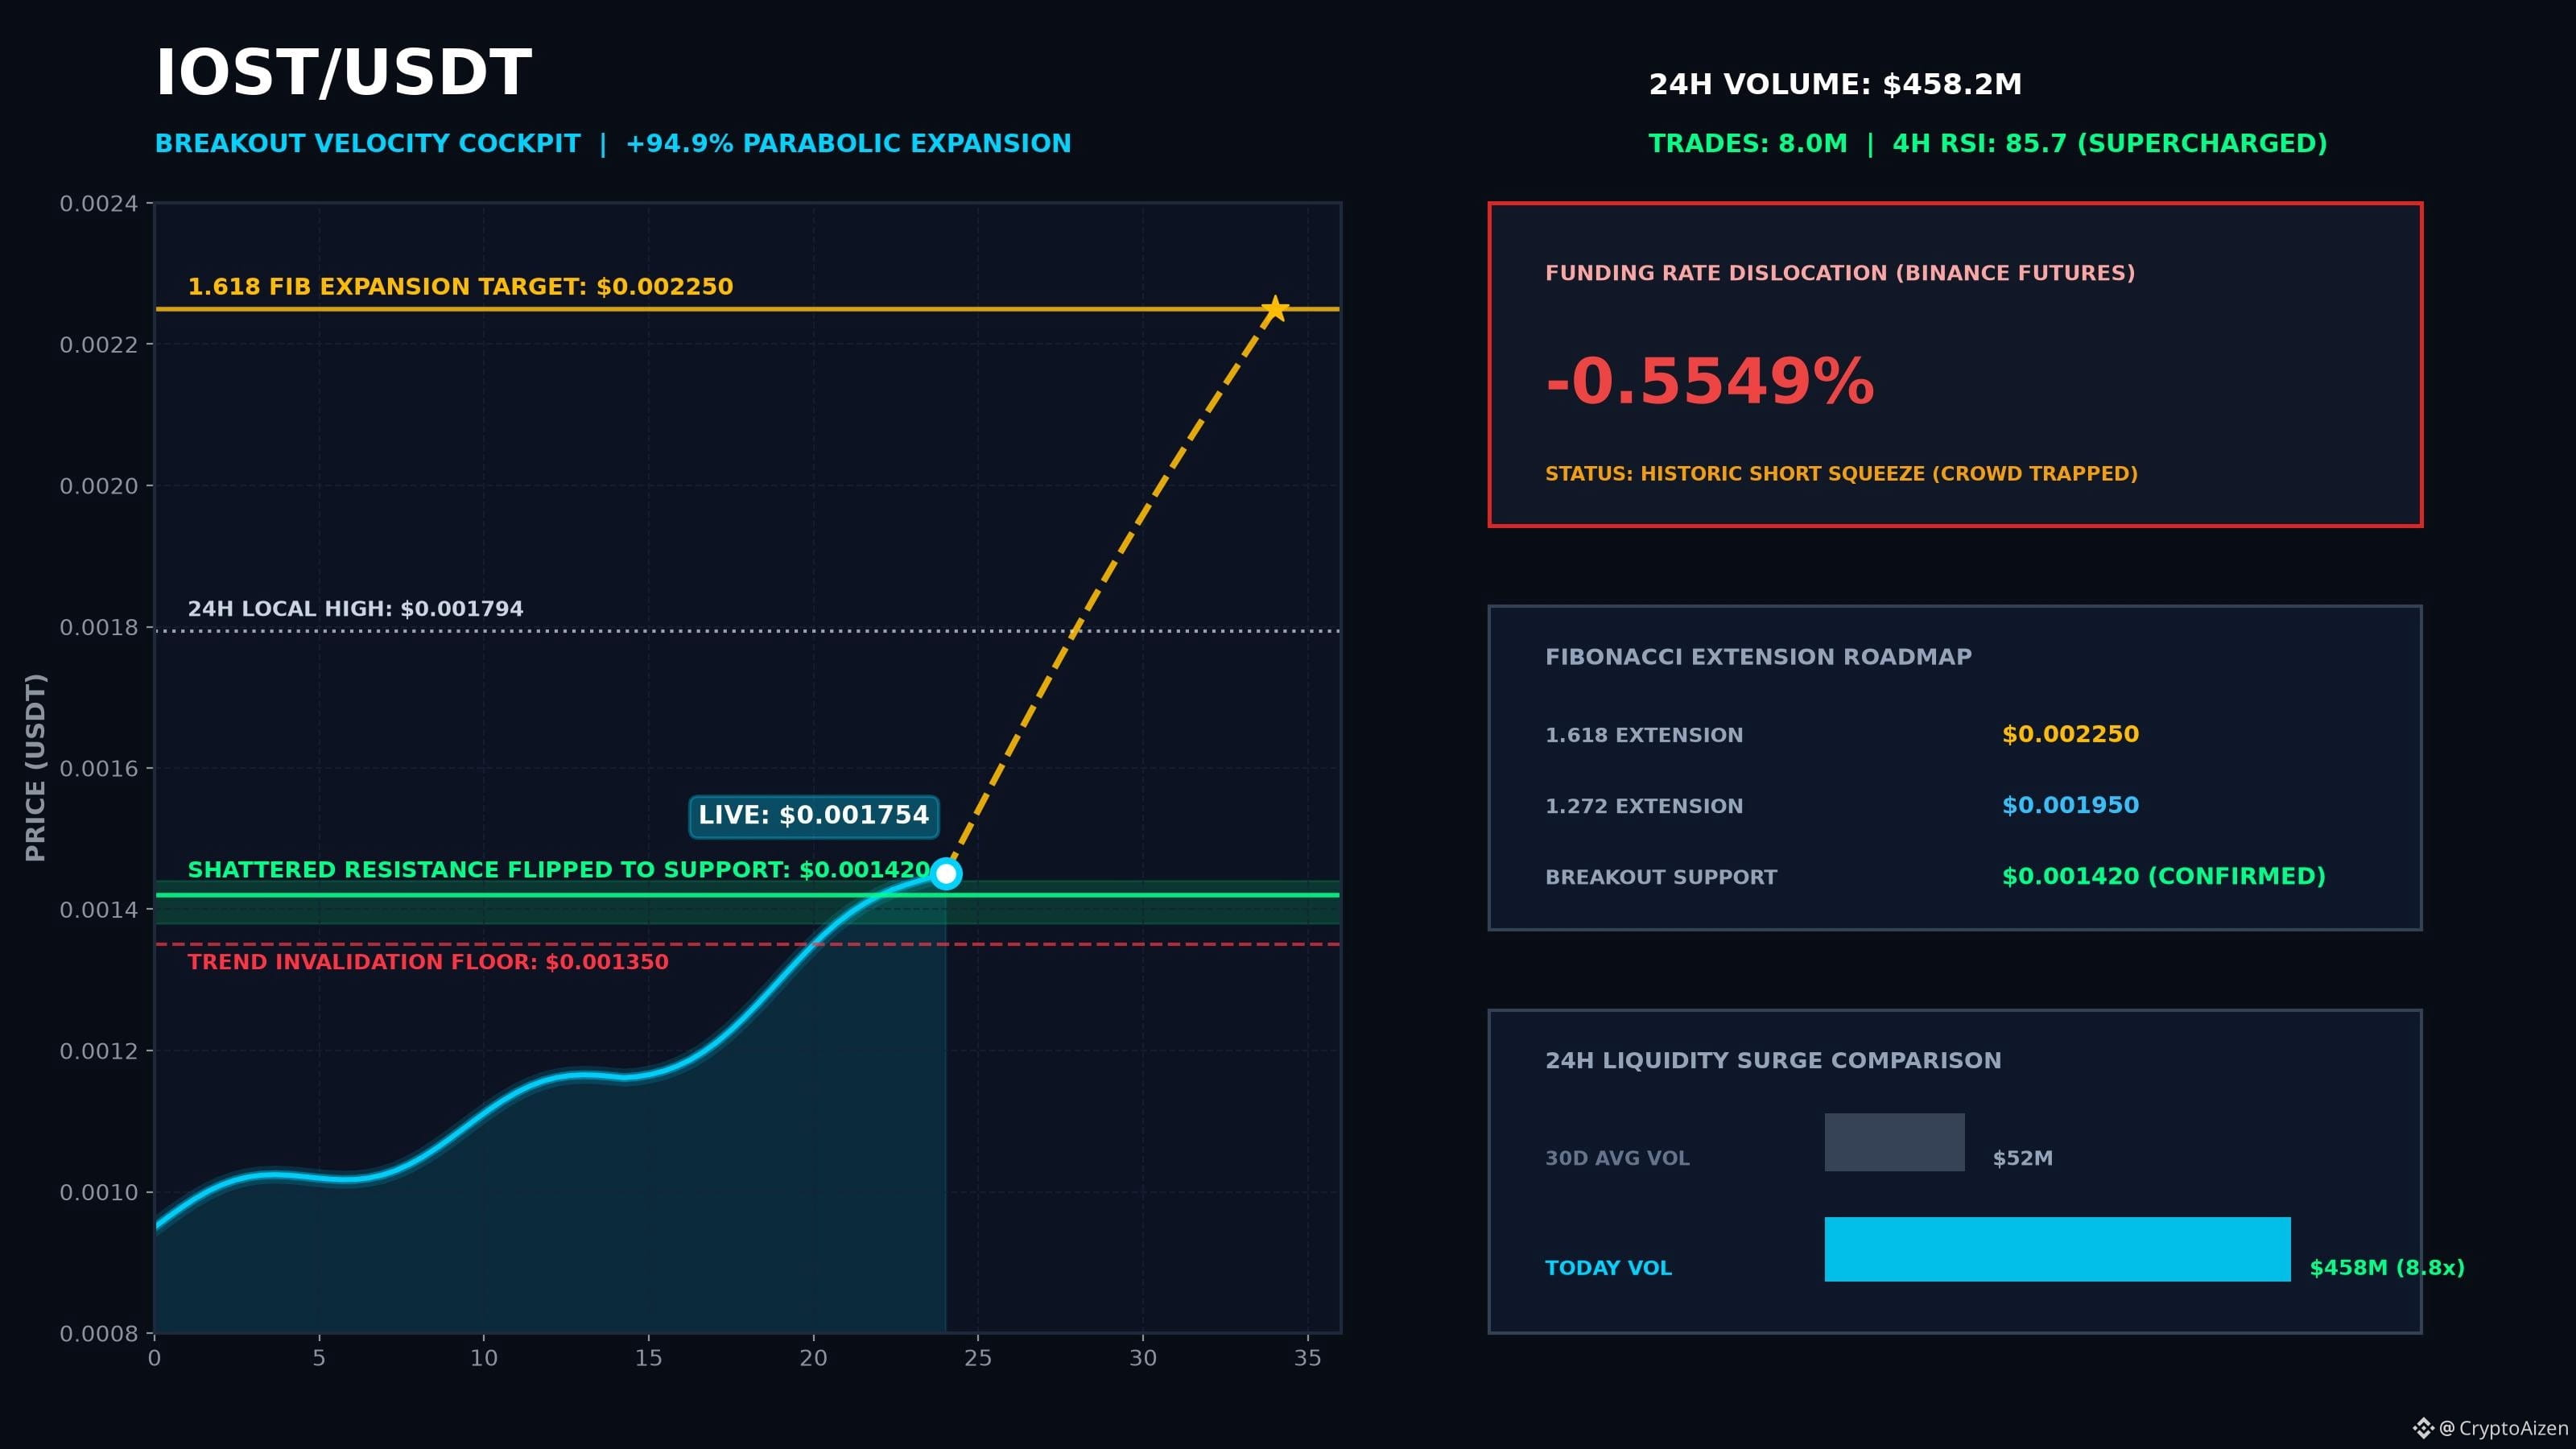
IOST NEARLY DOUBLES TO +95%: THE DERIVATIVES ENGINE FUELING THE $450M RUN
⠀
When an altcoin surges nearly one hundred percent in twenty-four hours, retail almost always makes the fatal error of fighting the trend. That impulse is currently producing one of the most aggressive short squeezes of the month on $IOST.
⠀
Earlier today, the asset faced heavy resistance at the 0.00142 ceiling. Instead of rejecting, spot absorption devoured overhead supply, triggering a structural breakout straight into 0.00175 on relentless volume.
⠀
Here is the derivatives reality behind this explosion:
⠀
THE NEGATIVE FUNDING CRUSH
Futures funding rates on Binance have cratered to an extraordinary minus zero point fifty-five percent. Shorters are hemorrhaging capital every eight hours simply to keep their positions open. This severe imbalance turns every short liquidation into forced market buying that propels price higher.
⠀
THE HALF-BILLION DOLLAR TURNOVER
Over 458 million dollars in volume has rotated through IOST contracts across eight million trades. This is institutional size systematically hunting liquidity pockets.
⠀
THE CRITICAL LEVELS TO MONITOR:
• Expansion Target: The 1.618 Fibonacci zone sits at 0.00225.
• Breakout Shelf: The prior 0.00142 ceiling has now flipped into key demand.
• Invalidation: A 4-Hour close below 0.00135 resets the trend structure.
⠀
Parabolic expansions reward disciplined execution, not stubborn bias. Those who respect market structure survive; those who fight extreme negative funding get liquidated.
⠀
I will publish the follow-up chart as soon as the 4-Hour candle closes at 20:00 UTC. Tap follow so you do not miss the entry confirmation.
⠀
#IOST #CryptoBreakout #BinanceSquare #Altcoins #TradingAlpha
IOST NEARLY DOUBLES TO +95%: THE DERIVATIVES ENGINE FUELING THE $450M RUN
⠀
When an altcoin surges nearly one hundred percent in twenty-four hours, retail almost always makes the fatal error of fighting the trend. That impulse is currently producing one of the most aggressive short squeezes of the month on $IOST.
⠀
Earlier today, the asset faced heavy resistance at the 0.00142 ceiling. Instead of rejecting, spot absorption devoured overhead supply, triggering a structural breakout straight into 0.00175 on relentless volume.
⠀
Here is the derivatives reality behind this explosion:
⠀
THE NEGATIVE FUNDING CRUSH
Futures funding rates on Binance have cratered to an extraordinary minus zero point fifty-five percent. Shorters are hemorrhaging capital every eight hours simply to keep their positions open. This severe imbalance turns every short liquidation into forced market buying that propels price higher.
⠀
THE HALF-BILLION DOLLAR TURNOVER
Over 458 million dollars in volume has rotated through IOST contracts across eight million trades. This is institutional size systematically hunting liquidity pockets.
⠀
THE CRITICAL LEVELS TO MONITOR:
• Expansion Target: The 1.618 Fibonacci zone sits at 0.00225.
• Breakout Shelf: The prior 0.00142 ceiling has now flipped into key demand.
• Invalidation: A 4-Hour close below 0.00135 resets the trend structure.
⠀
Parabolic expansions reward disciplined execution, not stubborn bias. Those who respect market structure survive; those who fight extreme negative funding get liquidated.
⠀
I will publish the follow-up chart as soon as the 4-Hour candle closes at 20:00 UTC. Tap follow so you do not miss the entry confirmation.
⠀
#IOST #CryptoBreakout #BinanceSquare #Altcoins #TradingAlpha
⠀
When an altcoin surges nearly one hundred percent in twenty-four hours, retail almost always makes the fatal error of fighting the trend. That impulse is currently producing one of the most aggressive short squeezes of the month on $IOST.
⠀
Earlier today, the asset faced heavy resistance at the 0.00142 ceiling. Instead of rejecting, spot absorption devoured overhead supply, triggering a structural breakout straight into 0.00175 on relentless volume.
⠀
Here is the derivatives reality behind this explosion:
⠀
THE NEGATIVE FUNDING CRUSH
Futures funding rates on Binance have cratered to an extraordinary minus zero point fifty-five percent. Shorters are hemorrhaging capital every eight hours simply to keep their positions open. This severe imbalance turns every short liquidation into forced market buying that propels price higher.
⠀
THE HALF-BILLION DOLLAR TURNOVER
Over 458 million dollars in volume has rotated through IOST contracts across eight million trades. This is institutional size systematically hunting liquidity pockets.
⠀
THE CRITICAL LEVELS TO MONITOR:
• Expansion Target: The 1.618 Fibonacci zone sits at 0.00225.
• Breakout Shelf: The prior 0.00142 ceiling has now flipped into key demand.
• Invalidation: A 4-Hour close below 0.00135 resets the trend structure.
⠀
Parabolic expansions reward disciplined execution, not stubborn bias. Those who respect market structure survive; those who fight extreme negative funding get liquidated.
⠀
I will publish the follow-up chart as soon as the 4-Hour candle closes at 20:00 UTC. Tap follow so you do not miss the entry confirmation.
⠀
#IOST #CryptoBreakout #BinanceSquare #Altcoins #TradingAlpha
1
134
·
--
Bullish
RAYSOL SHORT SQUEEZE: WHY THE CROWD BETTING ON A DUMP JUST BECAME THE FUEL
⠀
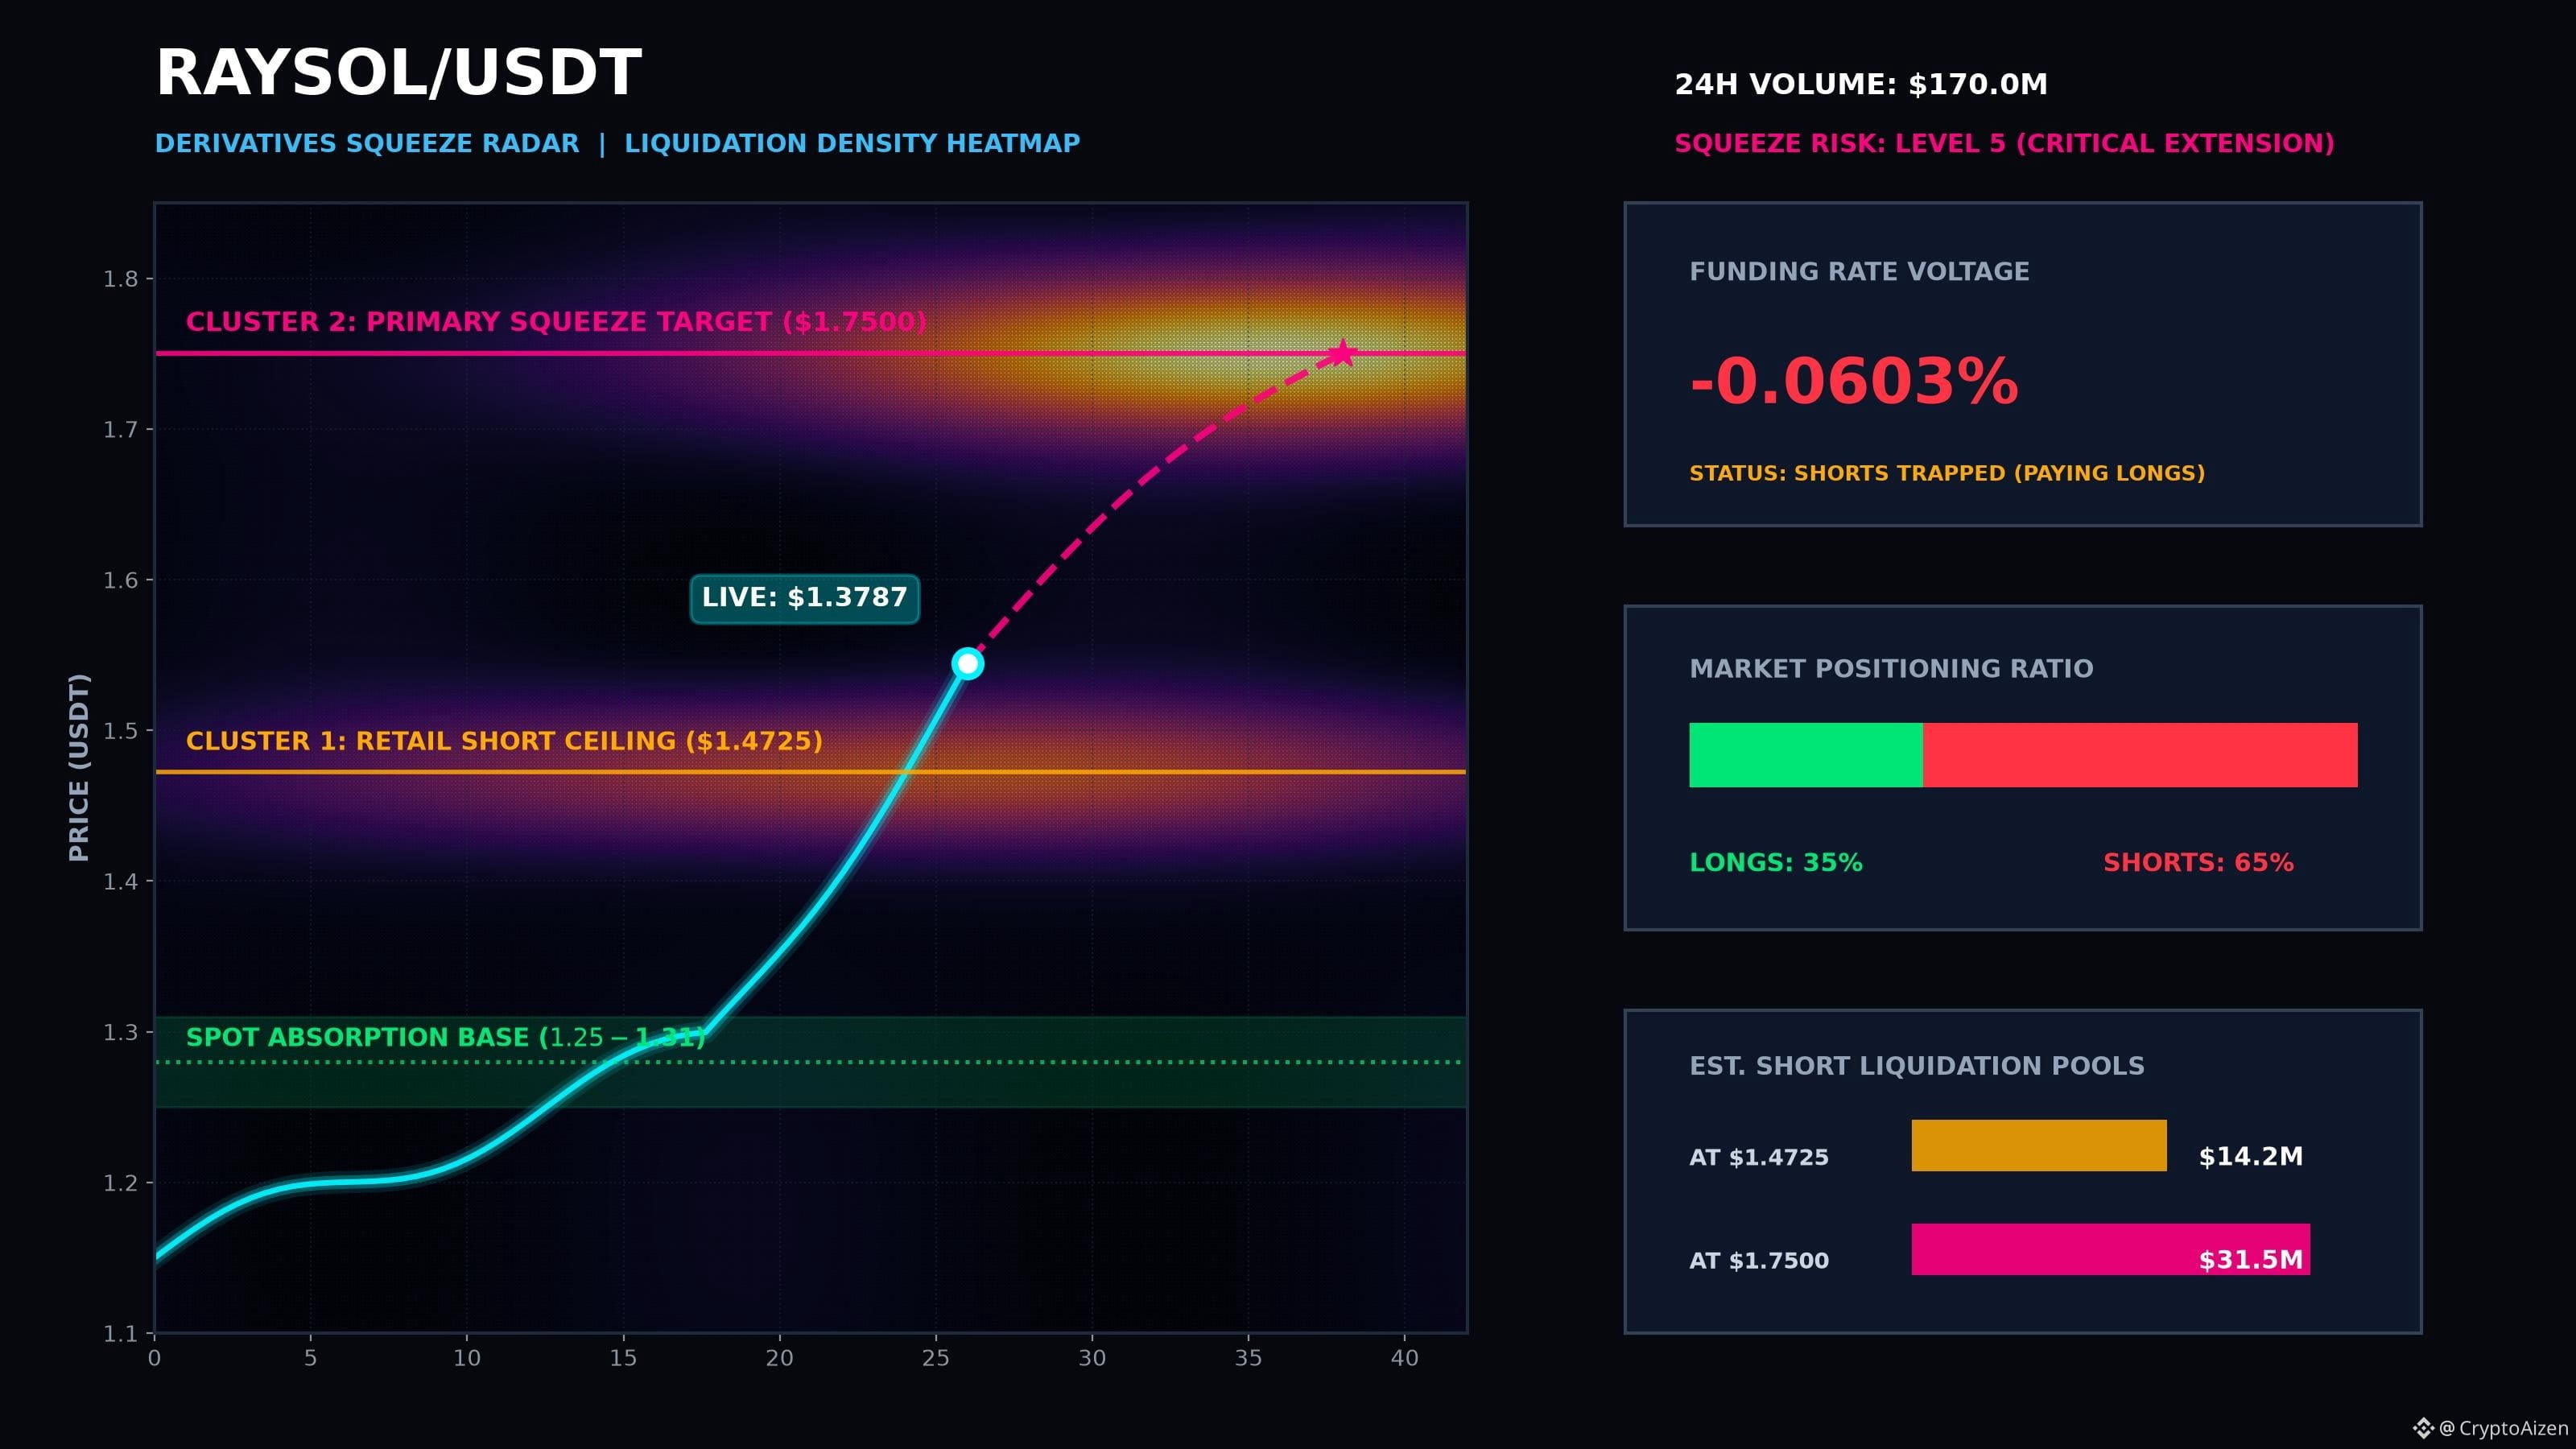
Most retail traders see a coin up twenty percent in a single session and immediately rush to open short positions at resistance. That exact impulse is currently walking bears directly into a violent liquidation trap on $RAYSOL.
⠀
While order books look crowded near the 1.47 resistance level, the underlying derivatives mechanics tell an entirely different story. Futures funding rates on Binance have flipped deeply negative at minus zero point zero six percent. For anyone unfamiliar with how market makers operate, that means short sellers are actively paying long holders every single funding window just to keep their positions alive.
⠀
When funding goes this heavily negative during a high-volume breakout, price rarely collapses the way retail expects. Instead, smart money uses that aggressive short interest as exit liquidity, systematically driving price upward through clustered stop losses.
⠀
The 170 million dollar turnover across the last twenty-four hours confirms that spot absorption is soaking up every attempt by bears to push price beneath the 1.25 to 1.31 support shelf. As long as this base holds on the four-hour timeframe, any shallow dip is merely fuel being gathered for the next squeeze leg toward 1.75.
⠀
Chasing green candles after a vertical expansion is how late buyers get trapped, but stubbornly shorting against negative funding in an aggressive expansion is how accounts get wiped out entirely. The market will always punish the side with the most crowded consensus.
⠀
I will publish the follow-up chart as soon as the 4-Hour candle closes at 20:00 UTC. Tap follow so you do not miss the execution update.
⠀
#RAYSOL #CryptoAnalysis #BinanceSquare #ShortSqueeze #TradingAlpha
RAYSOL SHORT SQUEEZE: WHY THE CROWD BETTING ON A DUMP JUST BECAME THE FUEL
⠀
Most retail traders see a coin up twenty percent in a single session and immediately rush to open short positions at resistance. That exact impulse is currently walking bears directly into a violent liquidation trap on $RAYSOL.
⠀
While order books look crowded near the 1.47 resistance level, the underlying derivatives mechanics tell an entirely different story. Futures funding rates on Binance have flipped deeply negative at minus zero point zero six percent. For anyone unfamiliar with how market makers operate, that means short sellers are actively paying long holders every single funding window just to keep their positions alive.
⠀
When funding goes this heavily negative during a high-volume breakout, price rarely collapses the way retail expects. Instead, smart money uses that aggressive short interest as exit liquidity, systematically driving price upward through clustered stop losses.
⠀
The 170 million dollar turnover across the last twenty-four hours confirms that spot absorption is soaking up every attempt by bears to push price beneath the 1.25 to 1.31 support shelf. As long as this base holds on the four-hour timeframe, any shallow dip is merely fuel being gathered for the next squeeze leg toward 1.75.
⠀
Chasing green candles after a vertical expansion is how late buyers get trapped, but stubbornly shorting against negative funding in an aggressive expansion is how accounts get wiped out entirely. The market will always punish the side with the most crowded consensus.
⠀
I will publish the follow-up chart as soon as the 4-Hour candle closes at 20:00 UTC. Tap follow so you do not miss the execution update.
⠀
#RAYSOL #CryptoAnalysis #BinanceSquare #ShortSqueeze #TradingAlpha
⠀
Most retail traders see a coin up twenty percent in a single session and immediately rush to open short positions at resistance. That exact impulse is currently walking bears directly into a violent liquidation trap on $RAYSOL.
⠀
While order books look crowded near the 1.47 resistance level, the underlying derivatives mechanics tell an entirely different story. Futures funding rates on Binance have flipped deeply negative at minus zero point zero six percent. For anyone unfamiliar with how market makers operate, that means short sellers are actively paying long holders every single funding window just to keep their positions alive.
⠀
When funding goes this heavily negative during a high-volume breakout, price rarely collapses the way retail expects. Instead, smart money uses that aggressive short interest as exit liquidity, systematically driving price upward through clustered stop losses.
⠀
The 170 million dollar turnover across the last twenty-four hours confirms that spot absorption is soaking up every attempt by bears to push price beneath the 1.25 to 1.31 support shelf. As long as this base holds on the four-hour timeframe, any shallow dip is merely fuel being gathered for the next squeeze leg toward 1.75.
⠀
Chasing green candles after a vertical expansion is how late buyers get trapped, but stubbornly shorting against negative funding in an aggressive expansion is how accounts get wiped out entirely. The market will always punish the side with the most crowded consensus.
⠀
I will publish the follow-up chart as soon as the 4-Hour candle closes at 20:00 UTC. Tap follow so you do not miss the execution update.
⠀
#RAYSOL #CryptoAnalysis #BinanceSquare #ShortSqueeze #TradingAlpha
1
63
·
--
Bullish
Partly True
IS ELON MUSK ABOUT TO UNLOCK A $200B SPACEX LIQUIDITY TSUNAMI?
⠀
While retail traders chase daily meme rotations, the biggest institutional liquidity play in tech is quietly preparing its next monumental leap.
⠀
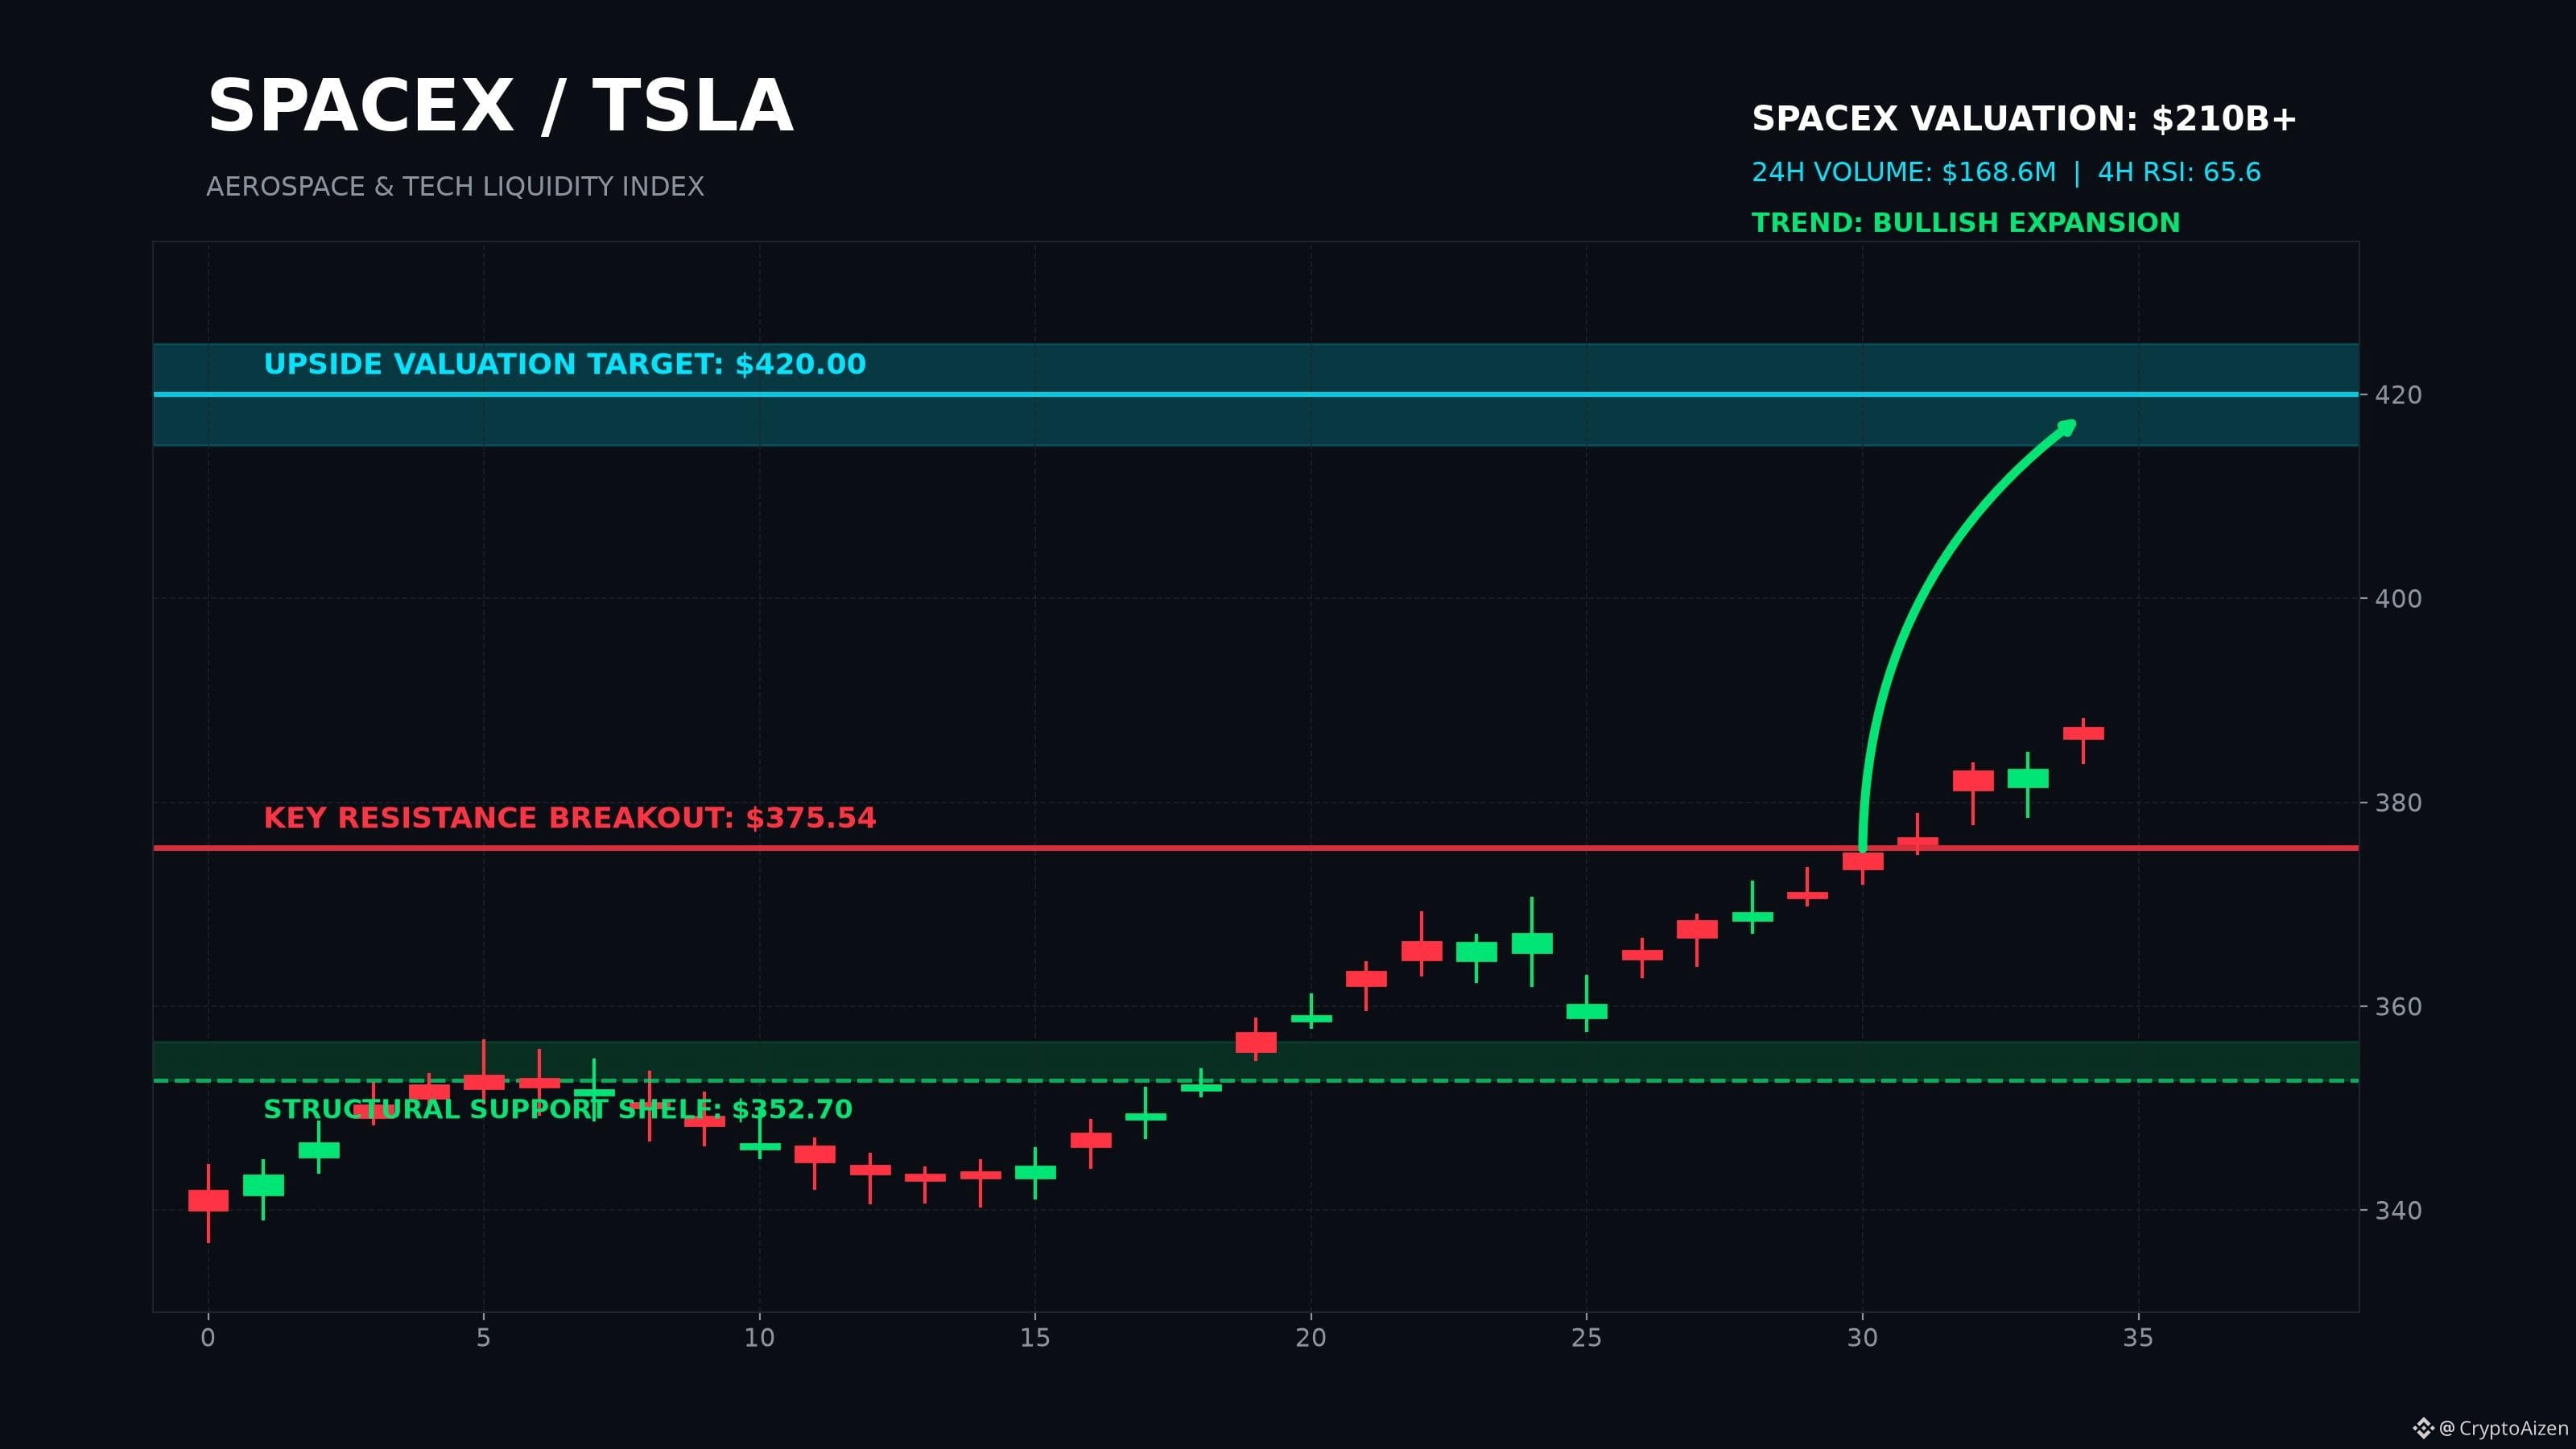
SpaceX secondary valuation has officially surged past $210 Billion following unprecedented Starship test milestones and accelerating Starlink direct-to-cell contracts.
⠀
Because SpaceX remains private, global markets and Binance derivatives traders actively price this ecosystem through Elon Musk's public equity engine $TSLA.
⠀
Looking at the live technical structure, capital rotation is hitting a critical inflection zone:
⠀
▪️ THE $375 RESISTANCE BREAKOUT TRIGGER
Price is aggressively testing the $375.54 macro ceiling after establishing a solid structural support shelf at $352.70. Over $168 Million in 24-hour derivatives volume confirmed high institutional participation.
⠀
▪️ THE STARLINK LIQUIDITY MULTIPLIER
Rumors of a standalone Starlink IPO are accelerating. Historically, every milestone announcement in Elon's aerospace pipeline has catalyzed massive liquidity expansion across his public and digital assets.
⠀
▪️ THE RSI MOMENTUM RUNWAY
The 4-Hour RSI sits at 65.6. Unlike overheated altcoins, this shows strong bullish recovery without flashing exhaustion signals, leaving room for an upside extension.
⠀
THE SCENARIO ROADMAP:
• Bullish Expansion: A decisive 4H close above $375 opens immediate targets at $395 and the psychological $420 milestone.
• Pullback Defense Floor: The $352 to $360 demand block remains the invalidation zone for swing momentum.
⠀
Smart money does not trade hype, it trades liquidity flows. When Elon Musk expands a private balance sheet, the ripples hit public markets first.
⠀
I will publish the next structural update as soon as the daily session closes at 20:00 UTC. Tap follow to track the macro rotation.
⠀
#SpaceX #Tesla #ElonMusk #CryptoMacro #BinanceSquare #TradingSetup
{future}(TSLAUSDT)
IS ELON MUSK ABOUT TO UNLOCK A $200B SPACEX LIQUIDITY TSUNAMI?
⠀
While retail traders chase daily meme rotations, the biggest institutional liquidity play in tech is quietly preparing its next monumental leap.
⠀
SpaceX secondary valuation has officially surged past $210 Billion following unprecedented Starship test milestones and accelerating Starlink direct-to-cell contracts.
⠀
Because SpaceX remains private, global markets and Binance derivatives traders actively price this ecosystem through Elon Musk's public equity engine $TSLA.
⠀
Looking at the live technical structure, capital rotation is hitting a critical inflection zone:
⠀
▪️ THE $375 RESISTANCE BREAKOUT TRIGGER
Price is aggressively testing the $375.54 macro ceiling after establishing a solid structural support shelf at $352.70. Over $168 Million in 24-hour derivatives volume confirmed high institutional participation.
⠀
▪️ THE STARLINK LIQUIDITY MULTIPLIER
Rumors of a standalone Starlink IPO are accelerating. Historically, every milestone announcement in Elon's aerospace pipeline has catalyzed massive liquidity expansion across his public and digital assets.
⠀
▪️ THE RSI MOMENTUM RUNWAY
The 4-Hour RSI sits at 65.6. Unlike overheated altcoins, this shows strong bullish recovery without flashing exhaustion signals, leaving room for an upside extension.
⠀
THE SCENARIO ROADMAP:
• Bullish Expansion: A decisive 4H close above $375 opens immediate targets at $395 and the psychological $420 milestone.
• Pullback Defense Floor: The $352 to $360 demand block remains the invalidation zone for swing momentum.
⠀
Smart money does not trade hype, it trades liquidity flows. When Elon Musk expands a private balance sheet, the ripples hit public markets first.
⠀
I will publish the next structural update as soon as the daily session closes at 20:00 UTC. Tap follow to track the macro rotation.
⠀
#SpaceX #Tesla #ElonMusk #CryptoMacro #BinanceSquare #TradingSetup
⠀
While retail traders chase daily meme rotations, the biggest institutional liquidity play in tech is quietly preparing its next monumental leap.
⠀
SpaceX secondary valuation has officially surged past $210 Billion following unprecedented Starship test milestones and accelerating Starlink direct-to-cell contracts.
⠀
Because SpaceX remains private, global markets and Binance derivatives traders actively price this ecosystem through Elon Musk's public equity engine $TSLA.
⠀
Looking at the live technical structure, capital rotation is hitting a critical inflection zone:
⠀
▪️ THE $375 RESISTANCE BREAKOUT TRIGGER
Price is aggressively testing the $375.54 macro ceiling after establishing a solid structural support shelf at $352.70. Over $168 Million in 24-hour derivatives volume confirmed high institutional participation.
⠀
▪️ THE STARLINK LIQUIDITY MULTIPLIER
Rumors of a standalone Starlink IPO are accelerating. Historically, every milestone announcement in Elon's aerospace pipeline has catalyzed massive liquidity expansion across his public and digital assets.
⠀
▪️ THE RSI MOMENTUM RUNWAY
The 4-Hour RSI sits at 65.6. Unlike overheated altcoins, this shows strong bullish recovery without flashing exhaustion signals, leaving room for an upside extension.
⠀
THE SCENARIO ROADMAP:
• Bullish Expansion: A decisive 4H close above $375 opens immediate targets at $395 and the psychological $420 milestone.
• Pullback Defense Floor: The $352 to $360 demand block remains the invalidation zone for swing momentum.
⠀
Smart money does not trade hype, it trades liquidity flows. When Elon Musk expands a private balance sheet, the ripples hit public markets first.
⠀
I will publish the next structural update as soon as the daily session closes at 20:00 UTC. Tap follow to track the macro rotation.
⠀
#SpaceX #Tesla #ElonMusk #CryptoMacro #BinanceSquare #TradingSetup
1
52
·
--
Bearish
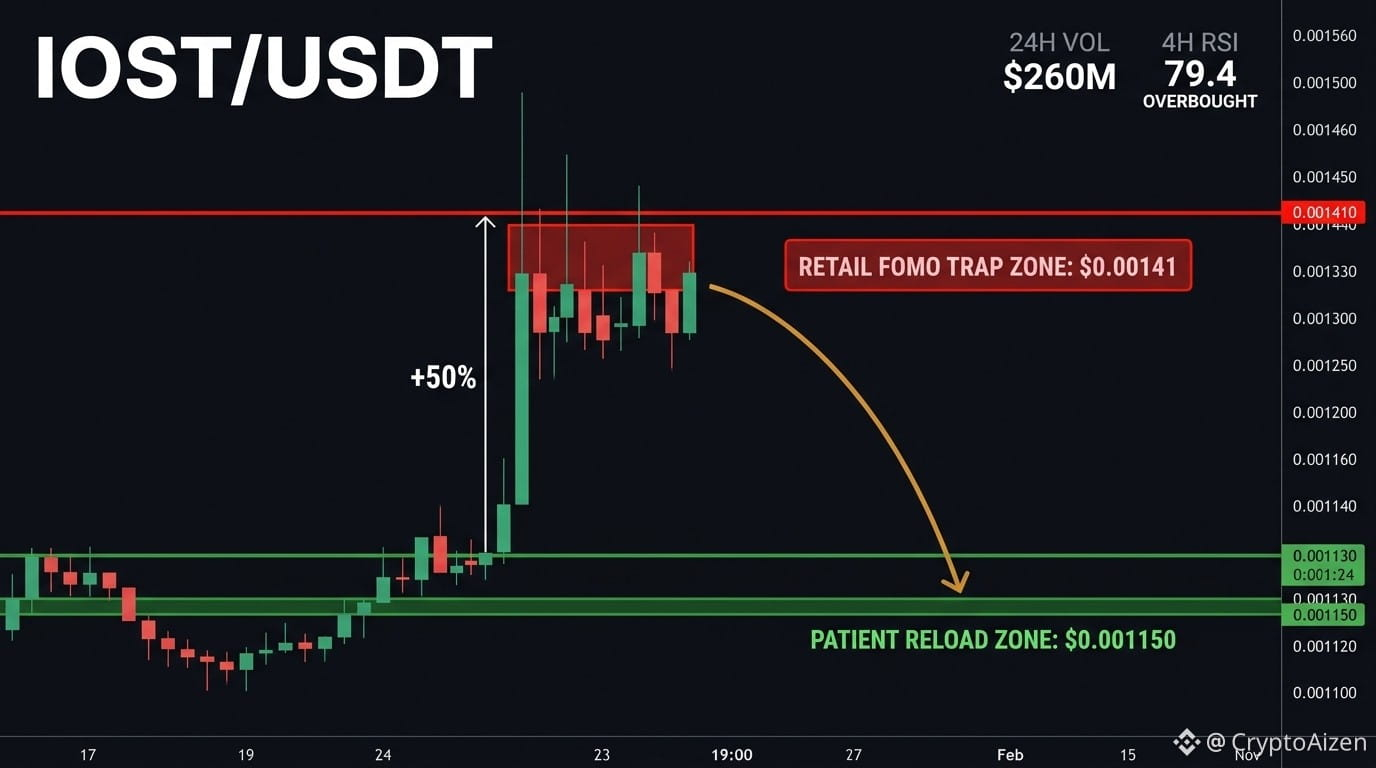
THE COLD REALITY OF THE $IOST +50% PUMP (AVOID THE LIQUIDATION TRAP)
⠀
Seeing $IOST explode over +50% in a single day has retail rushing in with blind market orders.
⠀
The timeline is screaming for an instant 5X. But looking at the live order books right now, this is where late buyers get systematically harvested for exit liquidity.
⠀
Over $260 Million in volume surged through IOST derivatives across 5.1 million trades today. The momentum is real, but the technical structure is flashing an urgent warning.
⠀
Here is the reality behind the green candles:
⠀
► THE OVEREXTENDED MOMENTUM EXTREME
The 4-Hour RSI has spiked to 79.4, pushing the asset into severe overbought territory. When price goes vertical without establishing support, chasing the top of a parabolic wick carries massive downside risk.
⠀
► THE $0.00141 CEILING SQUEEZE
Price is aggressively testing the multi-week resistance shelf at $0.001408. Notice the heavy upper wicks on lower timeframes, smart money is actively absorbing buy orders and locking in profits.
⠀
► THE DERIVATIVES RESET DYNAMICS
Volume expanded by 2.12x, confirming real capital rotation. However, healthy breakout continuations always require an orderly consolidation before initiating the next sustainable leg.
⠀
THE EXECUTION ROADMAP:
• Breakout Trigger: High-volume 4H close above $0.001420
• Patient Reload Zone: $0.001120 to $0.001180
• Upside Target: $0.001750
• Trap Warning Floor: Breakdown below $0.001100 opens a flush to $0.000920
⠀
Chasing a vertical green candle into resistance with an 80 RSI is how retail donates liquidity to market makers. The chart does not reward emotional FOMO, it rewards disciplined execution at confirmed support.
⠀
I will publish the follow-up chart as soon as the 4-Hour candle closes at 20:00 UTC. Tap follow so you do not miss the confirmation.
⠀
#IOST #CryptoAnalysis #BinanceSquare #Altcoins #TradingStrategy
THE COLD REALITY OF THE $IOST +50% PUMP (AVOID THE LIQUIDATION TRAP)
⠀
Seeing $IOST explode over +50% in a single day has retail rushing in with blind market orders.
⠀
The timeline is screaming for an instant 5X. But looking at the live order books right now, this is where late buyers get systematically harvested for exit liquidity.
⠀
Over $260 Million in volume surged through IOST derivatives across 5.1 million trades today. The momentum is real, but the technical structure is flashing an urgent warning.
⠀
Here is the reality behind the green candles:
⠀
► THE OVEREXTENDED MOMENTUM EXTREME
The 4-Hour RSI has spiked to 79.4, pushing the asset into severe overbought territory. When price goes vertical without establishing support, chasing the top of a parabolic wick carries massive downside risk.
⠀
► THE $0.00141 CEILING SQUEEZE
Price is aggressively testing the multi-week resistance shelf at $0.001408. Notice the heavy upper wicks on lower timeframes, smart money is actively absorbing buy orders and locking in profits.
⠀
► THE DERIVATIVES RESET DYNAMICS
Volume expanded by 2.12x, confirming real capital rotation. However, healthy breakout continuations always require an orderly consolidation before initiating the next sustainable leg.
⠀
THE EXECUTION ROADMAP:
• Breakout Trigger: High-volume 4H close above $0.001420
• Patient Reload Zone: $0.001120 to $0.001180
• Upside Target: $0.001750
• Trap Warning Floor: Breakdown below $0.001100 opens a flush to $0.000920
⠀
Chasing a vertical green candle into resistance with an 80 RSI is how retail donates liquidity to market makers. The chart does not reward emotional FOMO, it rewards disciplined execution at confirmed support.
⠀
I will publish the follow-up chart as soon as the 4-Hour candle closes at 20:00 UTC. Tap follow so you do not miss the confirmation.
⠀
#IOST #CryptoAnalysis #BinanceSquare #Altcoins #TradingStrategy
⠀
Seeing $IOST explode over +50% in a single day has retail rushing in with blind market orders.
⠀
The timeline is screaming for an instant 5X. But looking at the live order books right now, this is where late buyers get systematically harvested for exit liquidity.
⠀
Over $260 Million in volume surged through IOST derivatives across 5.1 million trades today. The momentum is real, but the technical structure is flashing an urgent warning.
⠀
Here is the reality behind the green candles:
⠀
► THE OVEREXTENDED MOMENTUM EXTREME
The 4-Hour RSI has spiked to 79.4, pushing the asset into severe overbought territory. When price goes vertical without establishing support, chasing the top of a parabolic wick carries massive downside risk.
⠀
► THE $0.00141 CEILING SQUEEZE
Price is aggressively testing the multi-week resistance shelf at $0.001408. Notice the heavy upper wicks on lower timeframes, smart money is actively absorbing buy orders and locking in profits.
⠀
► THE DERIVATIVES RESET DYNAMICS
Volume expanded by 2.12x, confirming real capital rotation. However, healthy breakout continuations always require an orderly consolidation before initiating the next sustainable leg.
⠀
THE EXECUTION ROADMAP:
• Breakout Trigger: High-volume 4H close above $0.001420
• Patient Reload Zone: $0.001120 to $0.001180
• Upside Target: $0.001750
• Trap Warning Floor: Breakdown below $0.001100 opens a flush to $0.000920
⠀
Chasing a vertical green candle into resistance with an 80 RSI is how retail donates liquidity to market makers. The chart does not reward emotional FOMO, it rewards disciplined execution at confirmed support.
⠀
I will publish the follow-up chart as soon as the 4-Hour candle closes at 20:00 UTC. Tap follow so you do not miss the confirmation.
⠀
#IOST #CryptoAnalysis #BinanceSquare #Altcoins #TradingStrategy
1
175
·
--
Bullish
CAN $PEPE PULL OFF THE GREATEST MEME COMEBACK IN CRYPTO HISTORY?
⠀
Most people wrote off $PEPE the moment the initial mania cooled down.
⠀
They called it a dead narrative. But looking at the live order books right now, smart money is telling a completely different story.
⠀
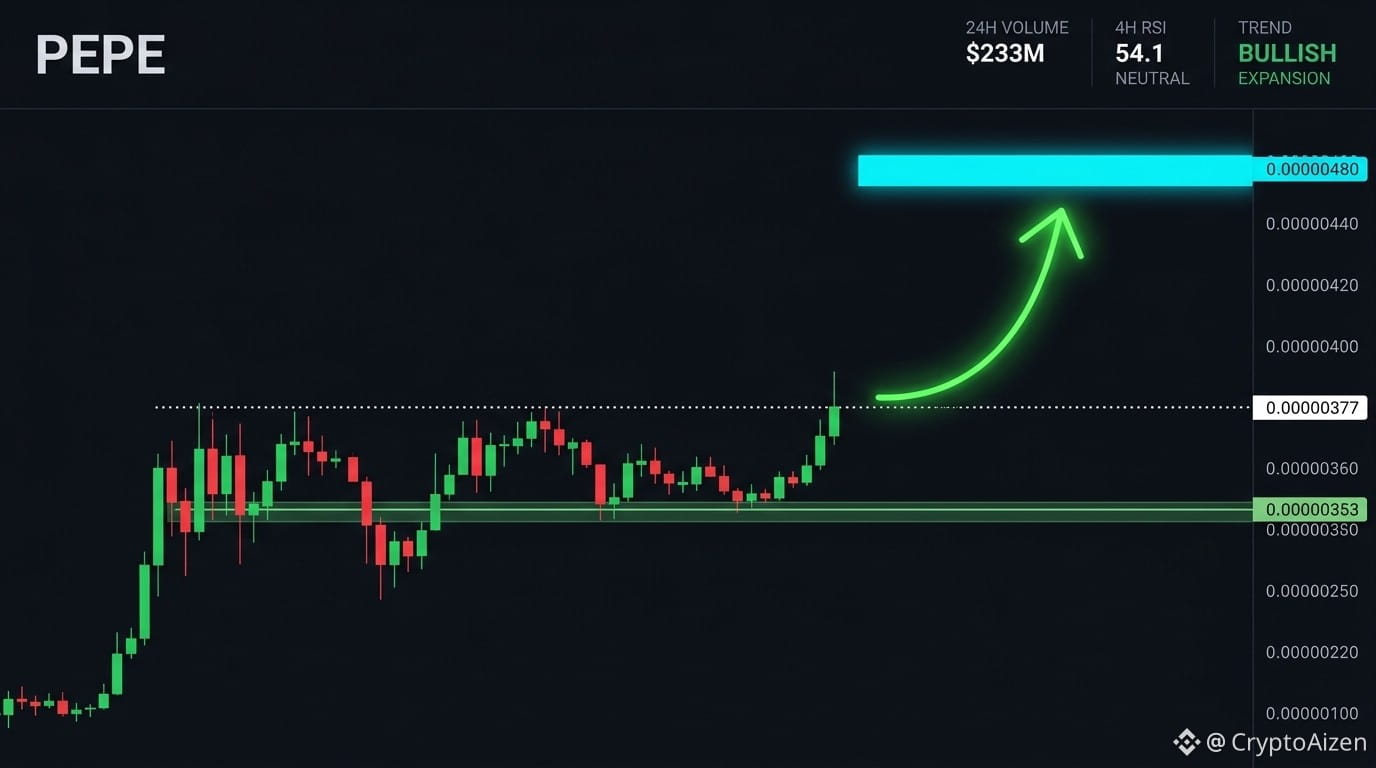
Over $233M in volume rotated through PEPE derivatives in the last 24 hours alone across 1.5 million individual trades. That is institutional accumulation operating quietly while the crowd looks away.
⠀
Here is what the multi-timeframe structure is showing:
⠀
1. THE MULTI-WEEK ACCUMULATION SHELF
Price has established a solid demand floor between $0.00000350 and $0.00000353. Every aggressive sell wick into this pocket has been immediately absorbed by limit bids.
⠀
2. THE 4-HOUR MOVING AVERAGE SQUEEZE
PEPE has reclaimed both the 20 and 50 moving averages on the 4H chart. The 4H RSI is at 54.1, leaving immense runway for expansion before exhaustion hits.
⠀
3. THE DERIVATIVES RESET
Funding rates are at a neutral 0.0100%. This is the most bullish signal on the board. The move is driven by real spot-futures balance, not a fragile retail long squeeze.
⠀
THE EXECUTION ROADMAP:
• Breakout Trigger: 4H close above $0.00000377
• Accumulation Zone: $0.00000353 to $0.00000365
• Target 1: $0.00000420
• Target 2: $0.00000480
• Invalidation: Breakdown below $0.00000340
⠀
If $0.00000377 breaks with volume, the liquidity pocket above it could trigger an explosive multi-day runner.
⠀
Are you accumulating before the breakout confirms, or do you think the meme supercycle is permanently over? Drop your entry price below.
⠀
I will publish the follow-up chart as soon as the 4H candle closes at 20:00 UTC. Tap follow to catch the entry confirmation.
⠀
#PEPE #MemeCoins #CryptoAnalysis #BinanceSquare #TradingSetup
CAN $PEPE PULL OFF THE GREATEST MEME COMEBACK IN CRYPTO HISTORY?
⠀
Most people wrote off $PEPE the moment the initial mania cooled down.
⠀
They called it a dead narrative. But looking at the live order books right now, smart money is telling a completely different story.
⠀
Over $233M in volume rotated through PEPE derivatives in the last 24 hours alone across 1.5 million individual trades. That is institutional accumulation operating quietly while the crowd looks away.
⠀
Here is what the multi-timeframe structure is showing:
⠀
1. THE MULTI-WEEK ACCUMULATION SHELF
Price has established a solid demand floor between $0.00000350 and $0.00000353. Every aggressive sell wick into this pocket has been immediately absorbed by limit bids.
⠀
2. THE 4-HOUR MOVING AVERAGE SQUEEZE
PEPE has reclaimed both the 20 and 50 moving averages on the 4H chart. The 4H RSI is at 54.1, leaving immense runway for expansion before exhaustion hits.
⠀
3. THE DERIVATIVES RESET
Funding rates are at a neutral 0.0100%. This is the most bullish signal on the board. The move is driven by real spot-futures balance, not a fragile retail long squeeze.
⠀
THE EXECUTION ROADMAP:
• Breakout Trigger: 4H close above $0.00000377
• Accumulation Zone: $0.00000353 to $0.00000365
• Target 1: $0.00000420
• Target 2: $0.00000480
• Invalidation: Breakdown below $0.00000340
⠀
If $0.00000377 breaks with volume, the liquidity pocket above it could trigger an explosive multi-day runner.
⠀
Are you accumulating before the breakout confirms, or do you think the meme supercycle is permanently over? Drop your entry price below.
⠀
I will publish the follow-up chart as soon as the 4H candle closes at 20:00 UTC. Tap follow to catch the entry confirmation.
⠀
#PEPE #MemeCoins #CryptoAnalysis #BinanceSquare #TradingSetup
⠀
Most people wrote off $PEPE the moment the initial mania cooled down.
⠀
They called it a dead narrative. But looking at the live order books right now, smart money is telling a completely different story.
⠀
Over $233M in volume rotated through PEPE derivatives in the last 24 hours alone across 1.5 million individual trades. That is institutional accumulation operating quietly while the crowd looks away.
⠀
Here is what the multi-timeframe structure is showing:
⠀
1. THE MULTI-WEEK ACCUMULATION SHELF
Price has established a solid demand floor between $0.00000350 and $0.00000353. Every aggressive sell wick into this pocket has been immediately absorbed by limit bids.
⠀
2. THE 4-HOUR MOVING AVERAGE SQUEEZE
PEPE has reclaimed both the 20 and 50 moving averages on the 4H chart. The 4H RSI is at 54.1, leaving immense runway for expansion before exhaustion hits.
⠀
3. THE DERIVATIVES RESET
Funding rates are at a neutral 0.0100%. This is the most bullish signal on the board. The move is driven by real spot-futures balance, not a fragile retail long squeeze.
⠀
THE EXECUTION ROADMAP:
• Breakout Trigger: 4H close above $0.00000377
• Accumulation Zone: $0.00000353 to $0.00000365
• Target 1: $0.00000420
• Target 2: $0.00000480
• Invalidation: Breakdown below $0.00000340
⠀
If $0.00000377 breaks with volume, the liquidity pocket above it could trigger an explosive multi-day runner.
⠀
Are you accumulating before the breakout confirms, or do you think the meme supercycle is permanently over? Drop your entry price below.
⠀
I will publish the follow-up chart as soon as the 4H candle closes at 20:00 UTC. Tap follow to catch the entry confirmation.
⠀
#PEPE #MemeCoins #CryptoAnalysis #BinanceSquare #TradingSetup
1
78
·
--
Bearish
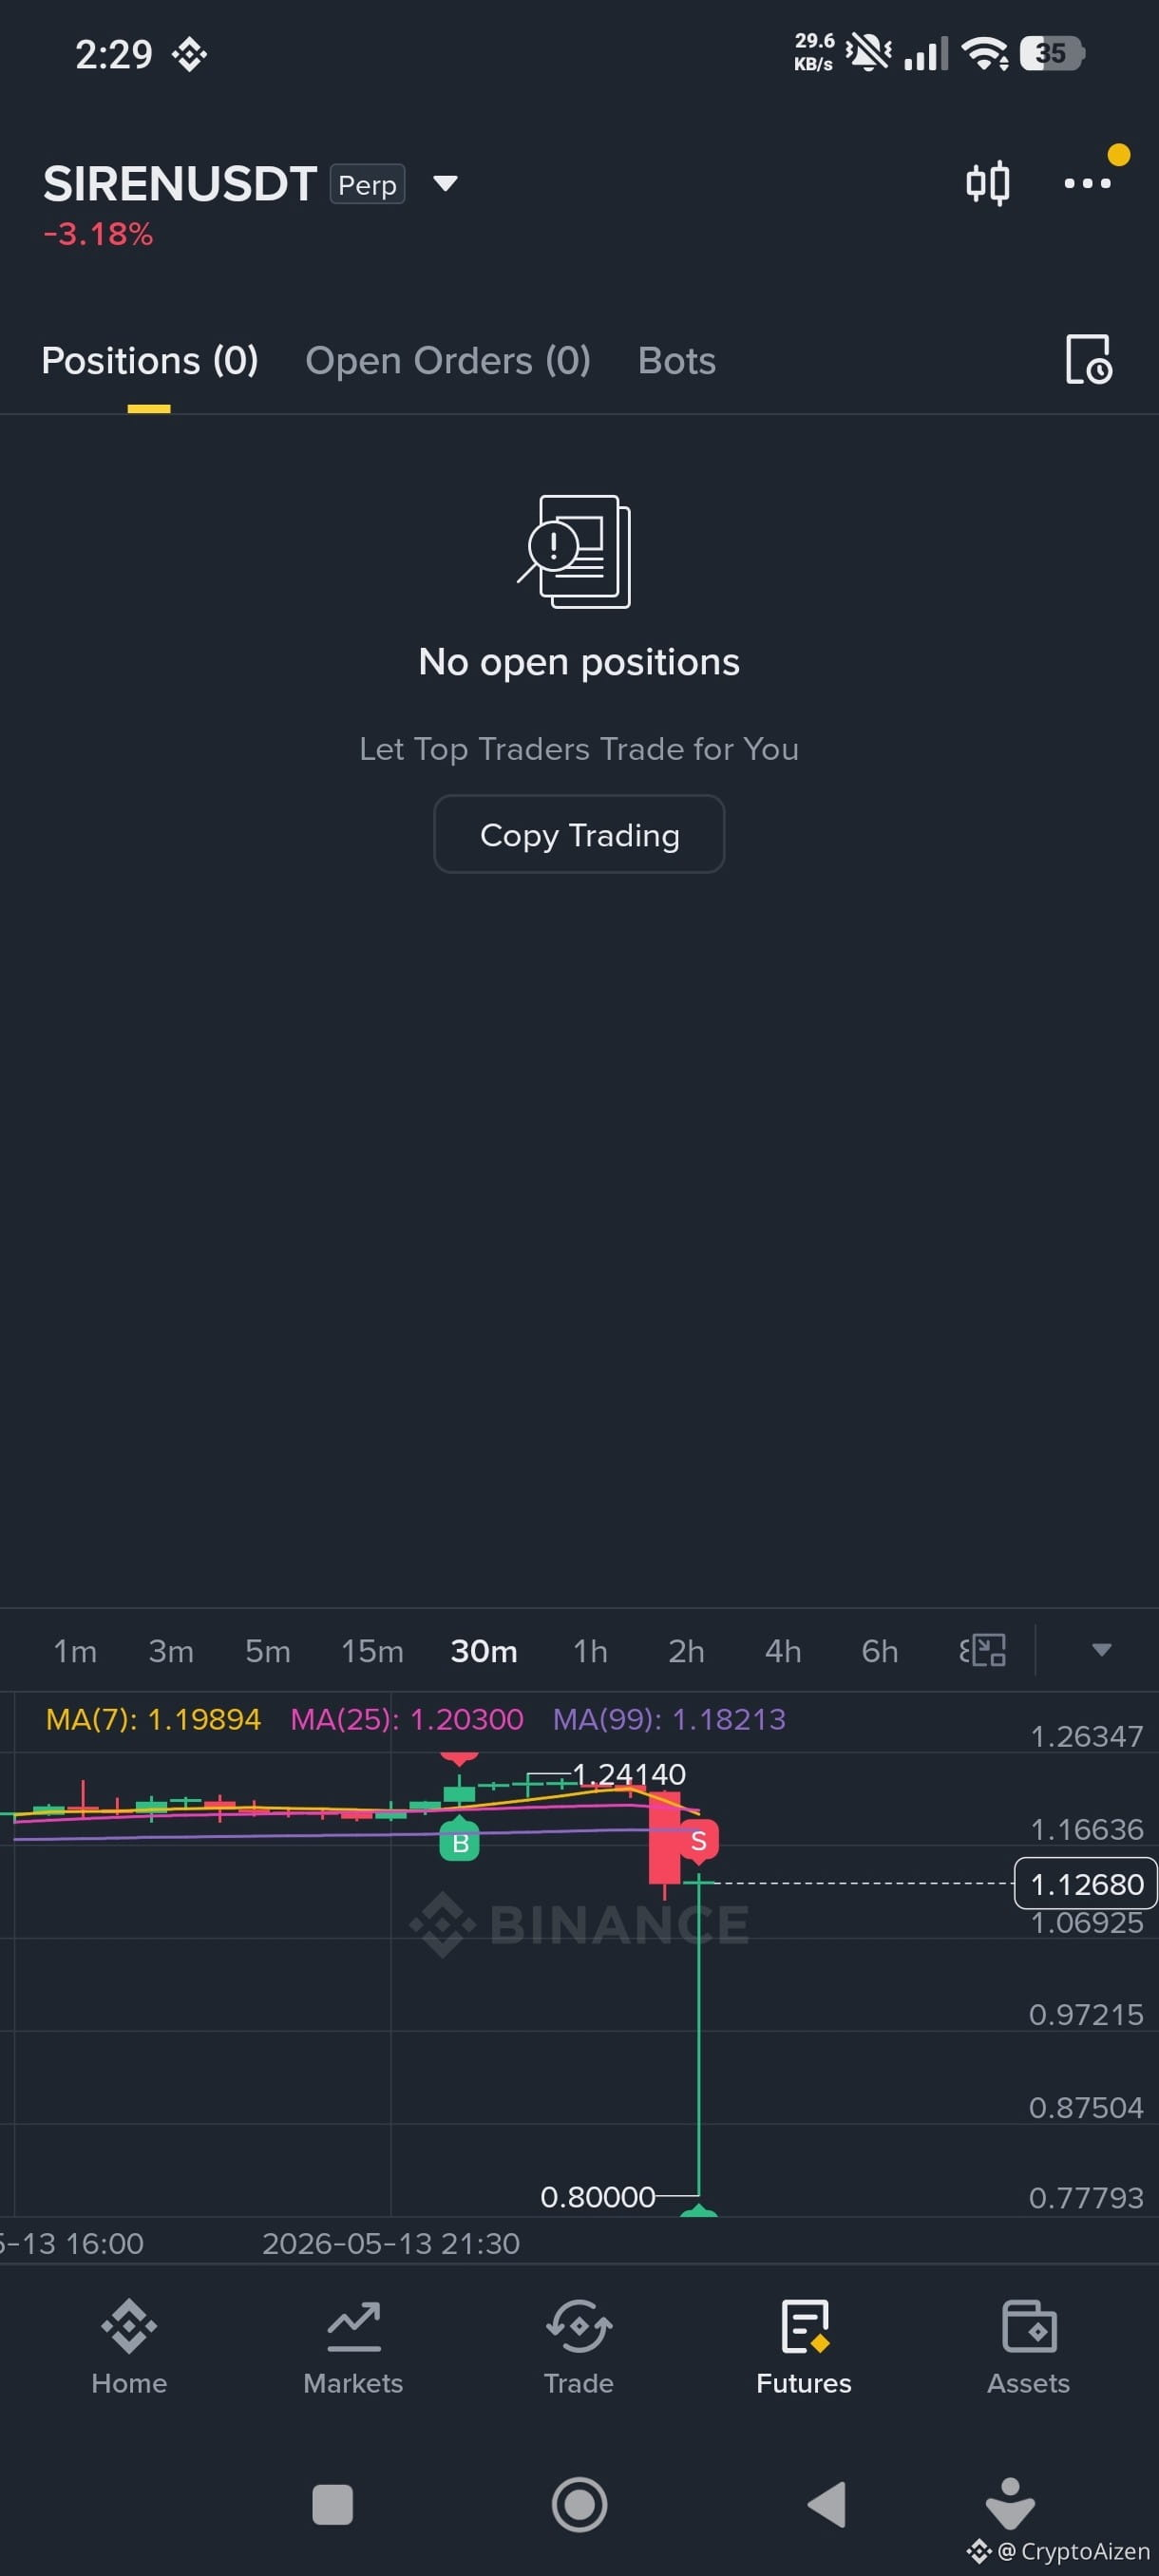
I wonder What The Whales From Binance "Alpha" are thinking.
First They Squeeze all The Longs,
And Now they are Squeezing all the Shorts.
Stay careful While Trading in Such Shitcoins.
#siren
#SIRENAnalysis
#sirenpumpanddump
#SirenScam
#BitcoinBelow79K
I wonder What The Whales From Binance "Alpha" are thinking.
First They Squeeze all The Longs,
And Now they are Squeezing all the Shorts.
Stay careful While Trading in Such Shitcoins.
#siren
#SIRENAnalysis
#sirenpumpanddump
#SirenScam
#BitcoinBelow79K
First They Squeeze all The Longs,
And Now they are Squeezing all the Shorts.
Stay careful While Trading in Such Shitcoins.
#siren
#SIRENAnalysis
#sirenpumpanddump
#SirenScam
#BitcoinBelow79K
1
450
·
--
Bearish
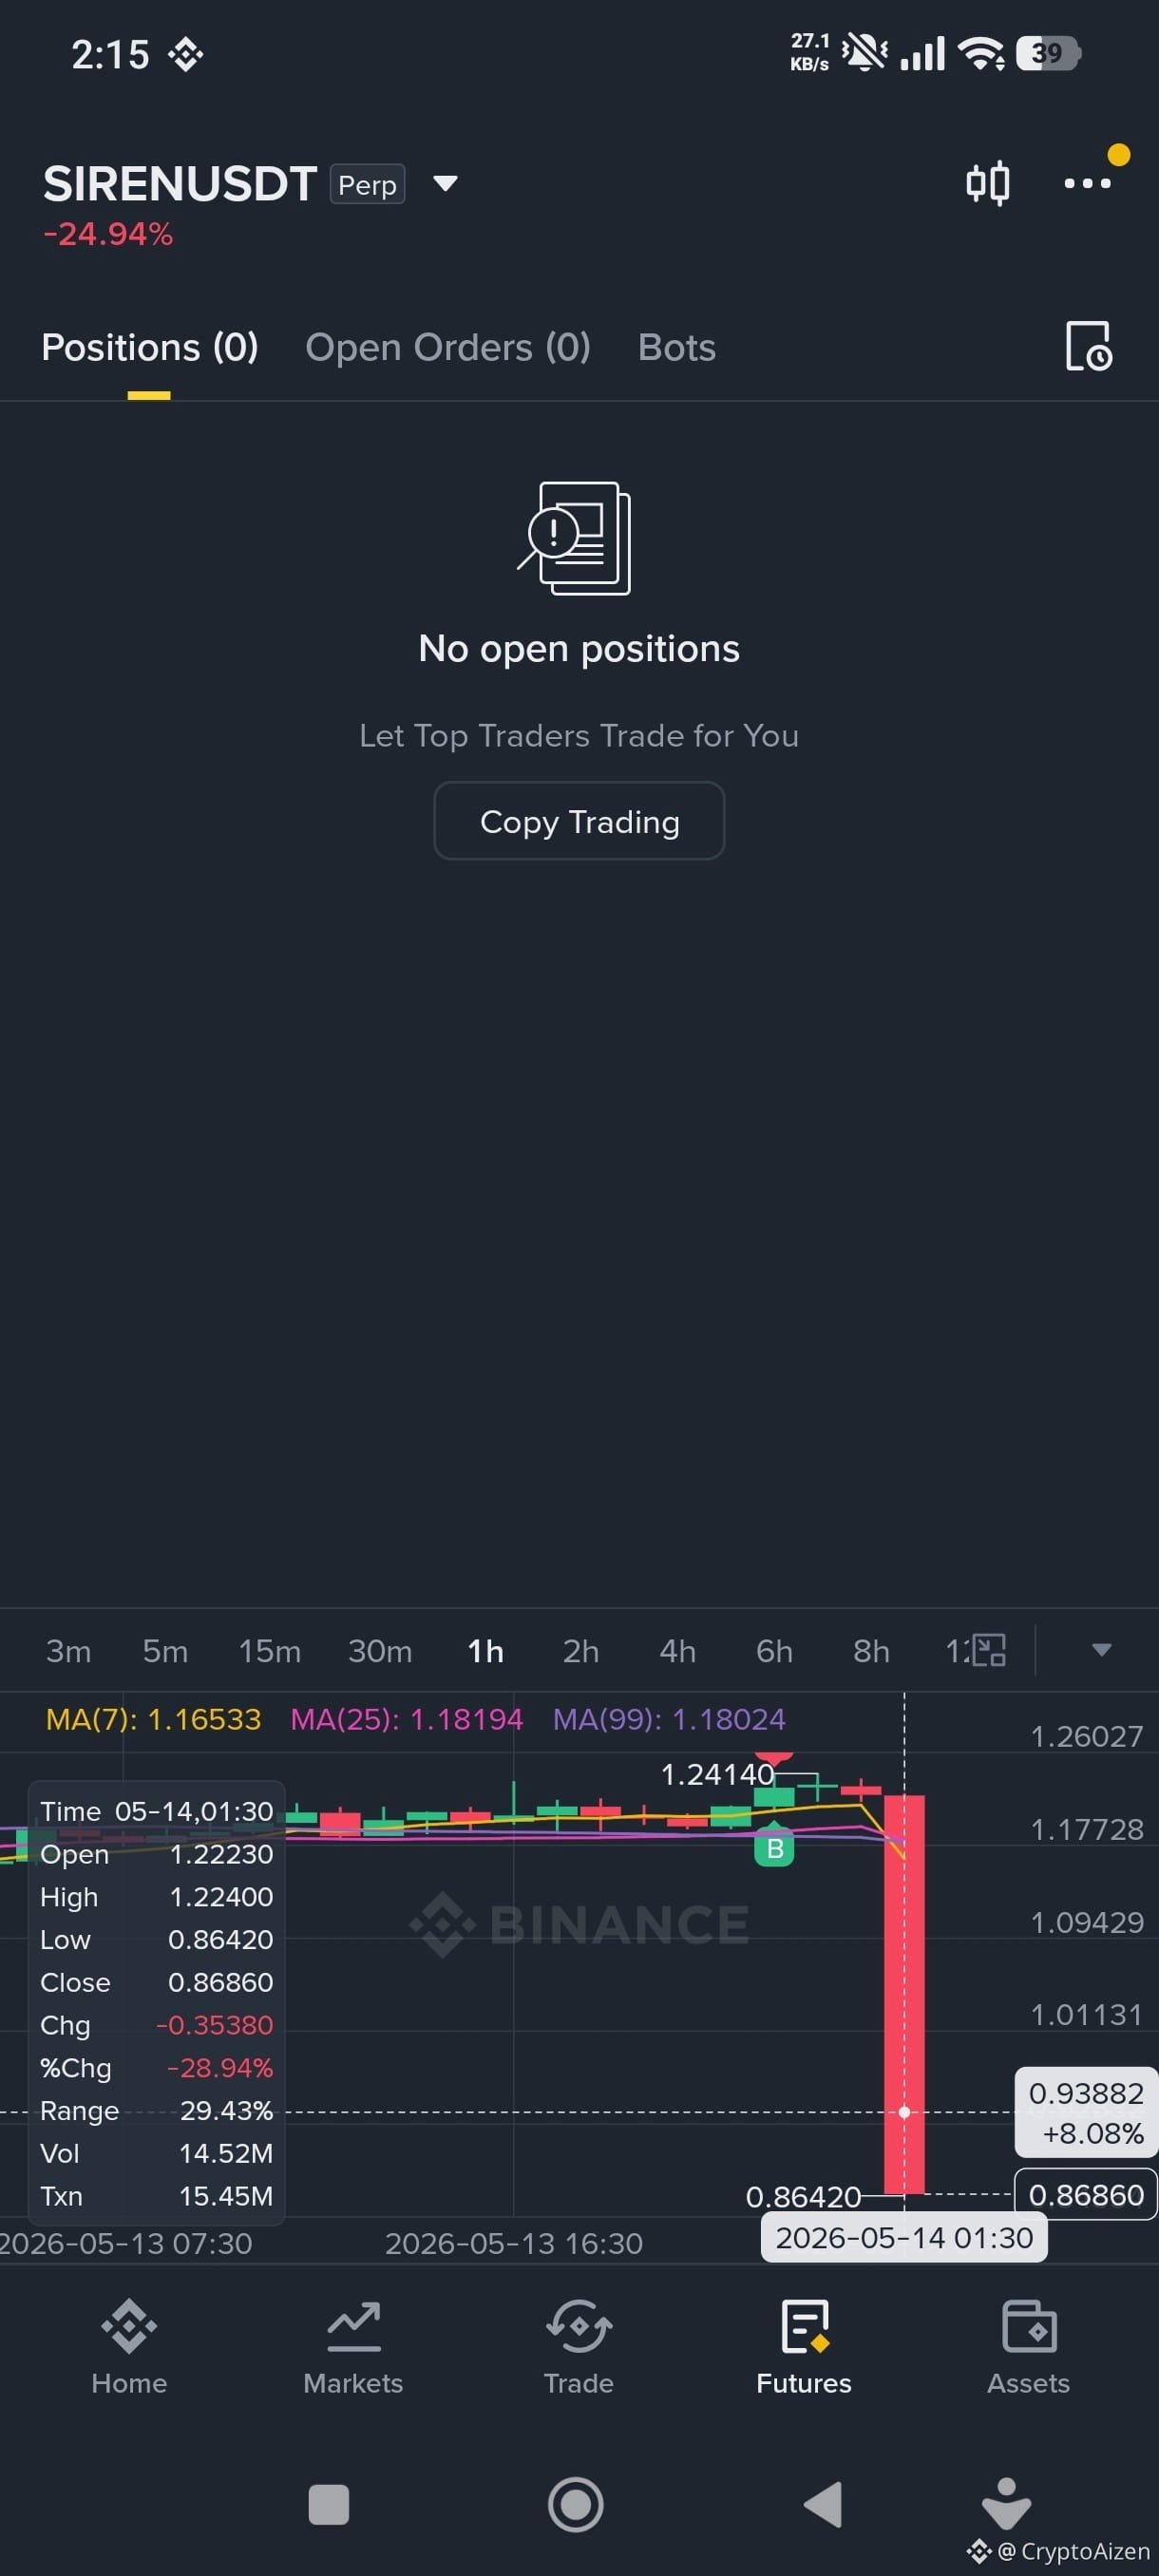
$SIREN Rugpull 6.0
Trust me Guys it's all Rigged.
Binance will Never Delist this token nd You will Only keep losing all your money In such Scam Alpha tokens.
Open your Eyes,
and Just see.
how many Alpha tokens has it been?
Why Do They Crash Non stop 90/95 even 99%??
You are always the Exit Liquidity For Whales.
Don't Long Such tokens and Keep Shorting.
$SIREN Rugpull 6.0
Trust me Guys it's all Rigged.
Binance will Never Delist this token nd You will Only keep losing all your money In such Scam Alpha tokens.
Open your Eyes,
and Just see.
how many Alpha tokens has it been?
Why Do They Crash Non stop 90/95 even 99%??
You are always the Exit Liquidity For Whales.
Don't Long Such tokens and Keep Shorting.
Trust me Guys it's all Rigged.
Binance will Never Delist this token nd You will Only keep losing all your money In such Scam Alpha tokens.
Open your Eyes,
and Just see.
how many Alpha tokens has it been?
Why Do They Crash Non stop 90/95 even 99%??
You are always the Exit Liquidity For Whales.
Don't Long Such tokens and Keep Shorting.
1
403
·
--
Bearish
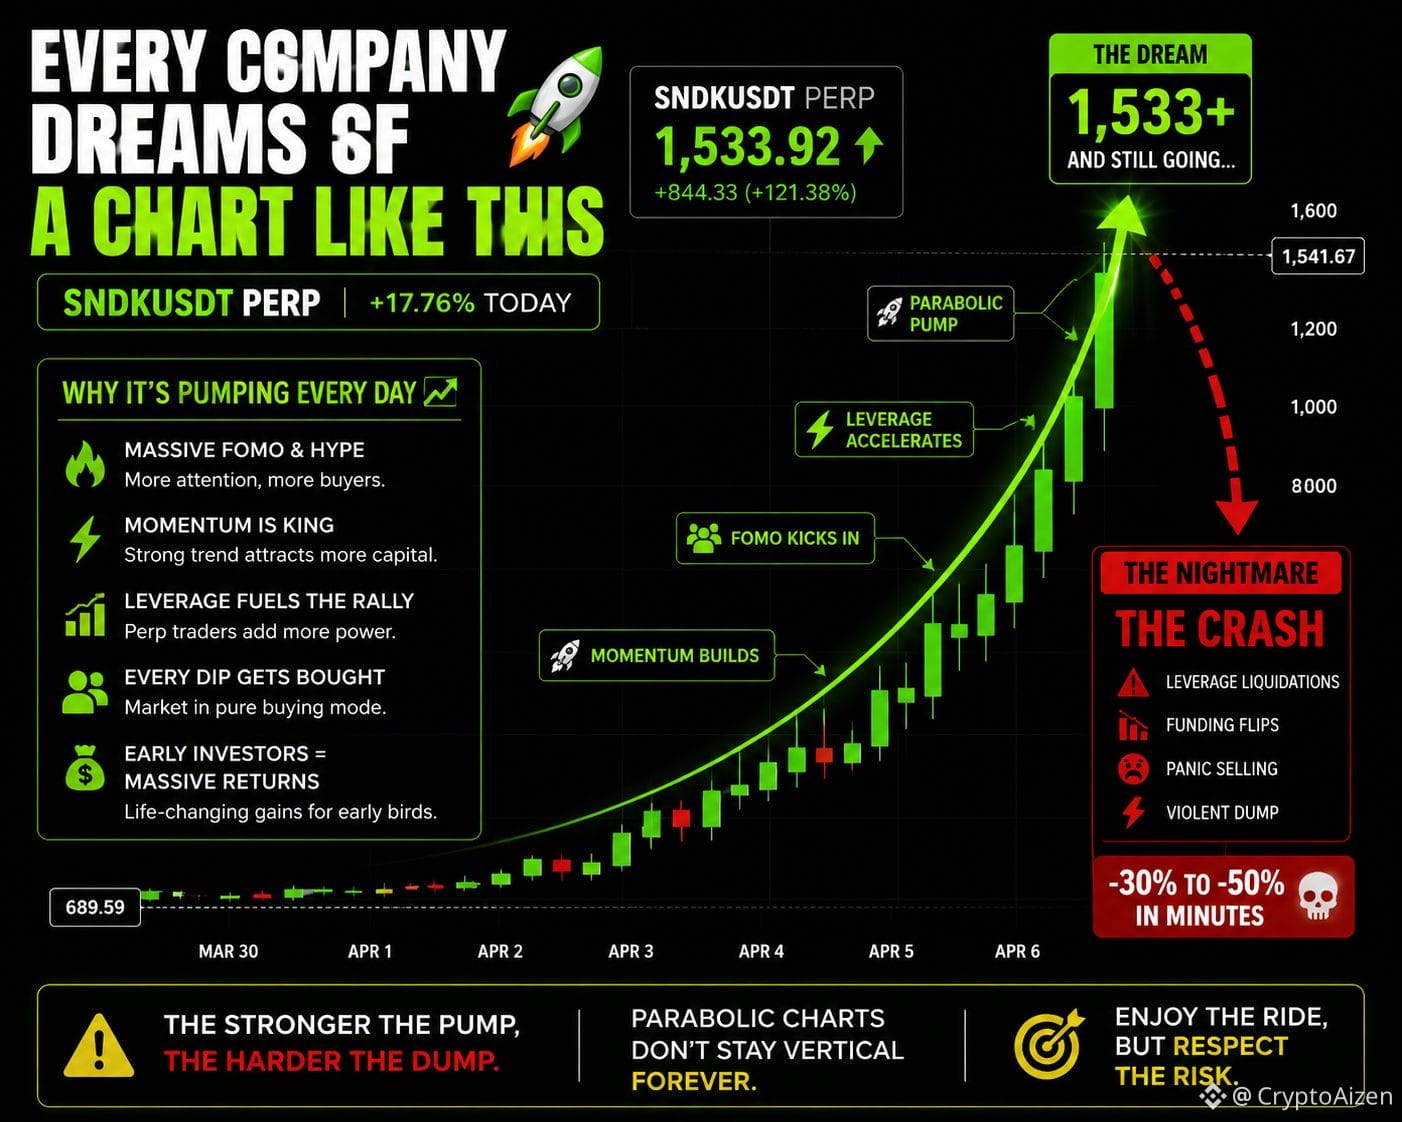
The move in $SNDK Hints a Massive Bubble Forming in US markets.
Every company dreams of a chart like this,
Straight green candles. No fear. No pullbacks. No mercy.
$SNDK looks less like a normal market and more like a vertical liquidity machine right now.
Week after week this thing keeps printing higher candles while late traders keep asking the same question:
“How is it still going up?”
That’s what happens when momentum becomes stronger than logic.
The higher it pumps, the more attention it gets. The more attention it gets, the more FOMO enters. And the more leverage enters… the more violent the move becomes.
A chart like this creates the illusion that buying late is still safe.
Investors start calculating fantasy returns. Perp traders start overleveraging. Social media turns euphoric. Every dip gets instantly bought.
That’s how parabolic phases are born.
And yes… people who entered early are making absurd returns right now.
But the dangerous part about charts like this is that they stop behaving like investments.
They start behaving like traps.
Because vertical rallies are built on emotion, leverage, and momentum not stability.
The same market makers pushing price upward can reverse the move just as aggressively once liquidity becomes crowded.
And when that happens, the crash usually doesn’t look normal either.
It becomes a liquidation cascade.
Longs get wiped. Late buyers panic sell. Funding flips. And a chart that looked “unstoppable” suddenly drops 30%-50% faster than anyone expected.
That’s the hidden rule of every euphoric chart:
The stronger the straight-line pump… the more brutal the eventual correction.
Right now SNDK looks invincible.
But parabolic charts don’t stay vertical forever.
Eventually the market stops rewarding greed.
And that’s usually when reality returns.
#SNDKUSDT
#stock
#PERPUpdate
#BubbleBurst
#USMarkets
The move in $SNDK Hints a Massive Bubble Forming in US markets.
Every company dreams of a chart like this,
Straight green candles. No fear. No pullbacks. No mercy.
$SNDK looks less like a normal market and more like a vertical liquidity machine right now.
Week after week this thing keeps printing higher candles while late traders keep asking the same question:
“How is it still going up?”
That’s what happens when momentum becomes stronger than logic.
The higher it pumps, the more attention it gets. The more attention it gets, the more FOMO enters. And the more leverage enters… the more violent the move becomes.
A chart like this creates the illusion that buying late is still safe.
Investors start calculating fantasy returns. Perp traders start overleveraging. Social media turns euphoric. Every dip gets instantly bought.
That’s how parabolic phases are born.
And yes… people who entered early are making absurd returns right now.
But the dangerous part about charts like this is that they stop behaving like investments.
They start behaving like traps.
Because vertical rallies are built on emotion, leverage, and momentum not stability.
The same market makers pushing price upward can reverse the move just as aggressively once liquidity becomes crowded.
And when that happens, the crash usually doesn’t look normal either.
It becomes a liquidation cascade.
Longs get wiped. Late buyers panic sell. Funding flips. And a chart that looked “unstoppable” suddenly drops 30%-50% faster than anyone expected.
That’s the hidden rule of every euphoric chart:
The stronger the straight-line pump… the more brutal the eventual correction.
Right now SNDK looks invincible.
But parabolic charts don’t stay vertical forever.
Eventually the market stops rewarding greed.
And that’s usually when reality returns.
#SNDKUSDT
#stock
#PERPUpdate
#BubbleBurst
#USMarkets
Every company dreams of a chart like this,
Straight green candles. No fear. No pullbacks. No mercy.
$SNDK looks less like a normal market and more like a vertical liquidity machine right now.
Week after week this thing keeps printing higher candles while late traders keep asking the same question:
“How is it still going up?”
That’s what happens when momentum becomes stronger than logic.
The higher it pumps, the more attention it gets. The more attention it gets, the more FOMO enters. And the more leverage enters… the more violent the move becomes.
A chart like this creates the illusion that buying late is still safe.
Investors start calculating fantasy returns. Perp traders start overleveraging. Social media turns euphoric. Every dip gets instantly bought.
That’s how parabolic phases are born.
And yes… people who entered early are making absurd returns right now.
But the dangerous part about charts like this is that they stop behaving like investments.
They start behaving like traps.
Because vertical rallies are built on emotion, leverage, and momentum not stability.
The same market makers pushing price upward can reverse the move just as aggressively once liquidity becomes crowded.
And when that happens, the crash usually doesn’t look normal either.
It becomes a liquidation cascade.
Longs get wiped. Late buyers panic sell. Funding flips. And a chart that looked “unstoppable” suddenly drops 30%-50% faster than anyone expected.
That’s the hidden rule of every euphoric chart:
The stronger the straight-line pump… the more brutal the eventual correction.
Right now SNDK looks invincible.
But parabolic charts don’t stay vertical forever.
Eventually the market stops rewarding greed.
And that’s usually when reality returns.
#SNDKUSDT
#stock
#PERPUpdate
#BubbleBurst
#USMarkets
2
536
·
--
Bullish
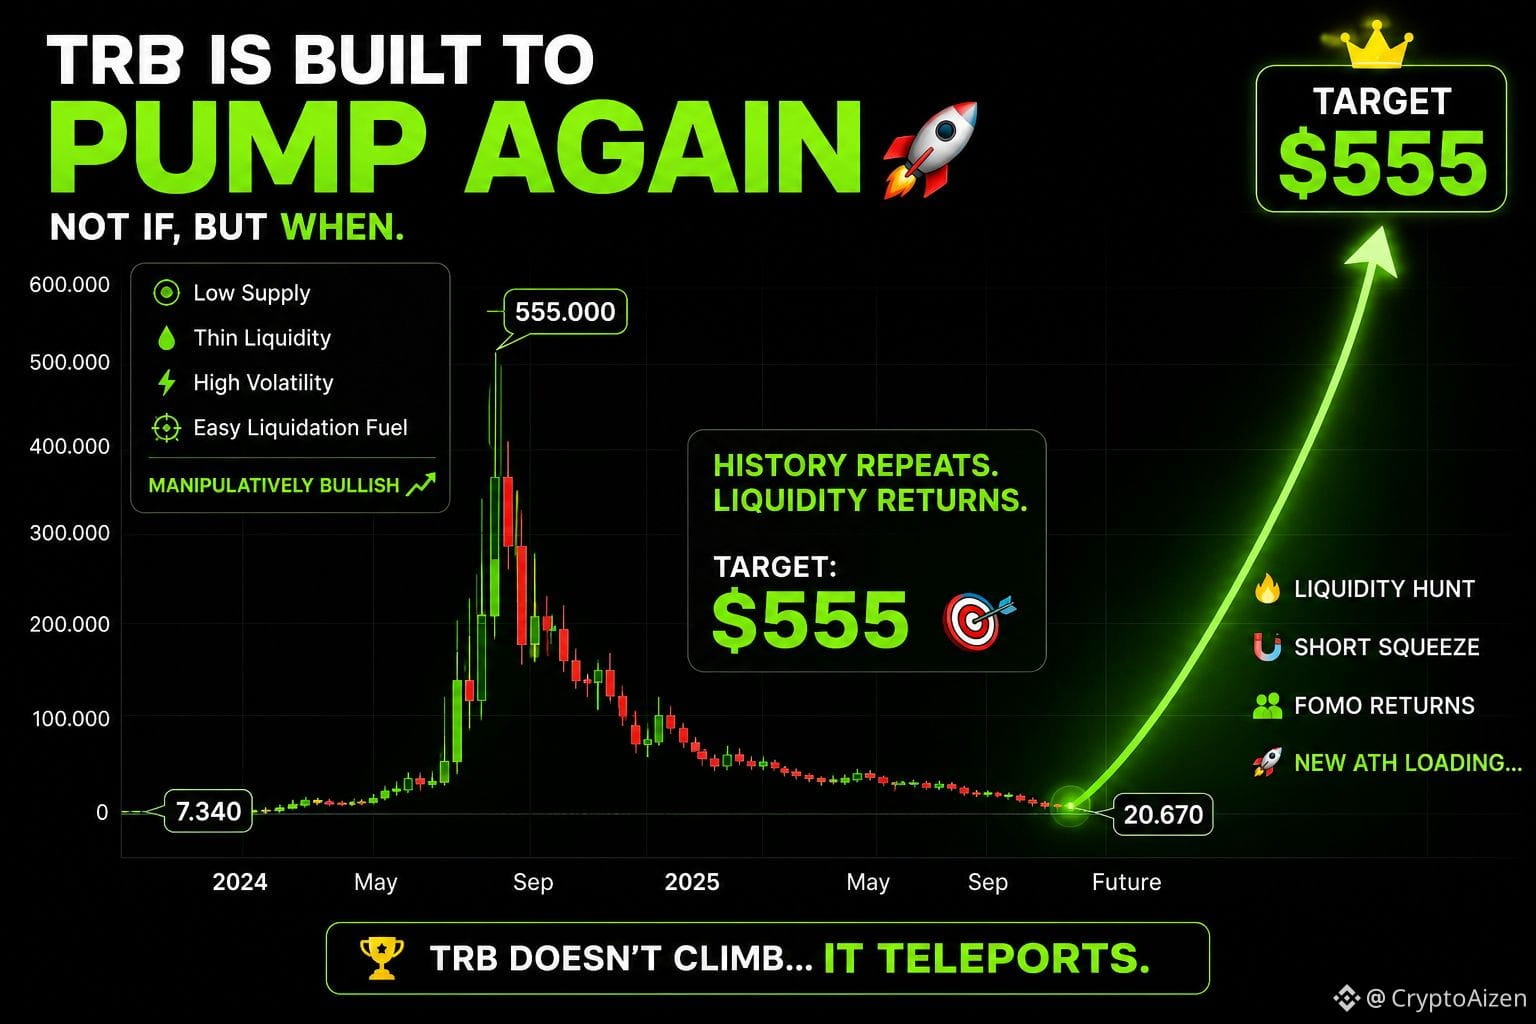
Why $TRB Will Touch 555$ again!!!
TRB doesn’t move like a normal coin.
It disappears for months. Volume dries up. Retail forgets it even exists.
Then out of nowhere this thing starts printing violent candles that leave the entire market confused.
From $7 to $555 wasn’t “organic growth”. That was pure liquidity warfare.
The scary part?
TRB is one of the few tokens on Binance that has repeatedly proven it can survive massive crashes… and still come back for another engineered move.
Most traders only see the dump after the hype dies.
Whales see something else entirely:
Low circulating supply, Thin order books, High volatility, Easy liquidation fuel, And a chart that historically rewards aggressive momentum.
That combination is dangerous.
Every cycle TRB creates the exact same psychology: “it’s dead” “it’ll never recover” “ATH was manipulation”
Then suddenly it starts squeezing shorts with 20%, 40%, 80% candles until FOMO returns again.
And once liquidity comes back, this token becomes one of the most manipulatively bullish assets in the entire market.
The monthly chart still looks like unfinished business.
A slow accumulation zone sitting near historical depression levels after one of the biggest synthetic rallies Binance futures has ever seen.
If Bitcoin stays strong and altcoin mania returns, TRB doesn’t need retail support to move.
It only needs market makers to decide the next liquidity hunt begins.
Because tokens like this don’t climb normally.
They teleport.
And if history repeats the way it has before…
Watching TRB revisit $555 again won’t feel impossible.
It’ll feel engineered.
#TRB
#Trbpump
#Manipulated
#breakout
#TRB_UPDATE
Why $TRB Will Touch 555$ again!!!
TRB doesn’t move like a normal coin.
It disappears for months. Volume dries up. Retail forgets it even exists.
Then out of nowhere this thing starts printing violent candles that leave the entire market confused.
From $7 to $555 wasn’t “organic growth”. That was pure liquidity warfare.
The scary part?
TRB is one of the few tokens on Binance that has repeatedly proven it can survive massive crashes… and still come back for another engineered move.
Most traders only see the dump after the hype dies.
Whales see something else entirely:
Low circulating supply, Thin order books, High volatility, Easy liquidation fuel, And a chart that historically rewards aggressive momentum.
That combination is dangerous.
Every cycle TRB creates the exact same psychology: “it’s dead” “it’ll never recover” “ATH was manipulation”
Then suddenly it starts squeezing shorts with 20%, 40%, 80% candles until FOMO returns again.
And once liquidity comes back, this token becomes one of the most manipulatively bullish assets in the entire market.
The monthly chart still looks like unfinished business.
A slow accumulation zone sitting near historical depression levels after one of the biggest synthetic rallies Binance futures has ever seen.
If Bitcoin stays strong and altcoin mania returns, TRB doesn’t need retail support to move.
It only needs market makers to decide the next liquidity hunt begins.
Because tokens like this don’t climb normally.
They teleport.
And if history repeats the way it has before…
Watching TRB revisit $555 again won’t feel impossible.
It’ll feel engineered.
#TRB
#Trbpump
#Manipulated
#breakout
#TRB_UPDATE
TRB doesn’t move like a normal coin.
It disappears for months. Volume dries up. Retail forgets it even exists.
Then out of nowhere this thing starts printing violent candles that leave the entire market confused.
From $7 to $555 wasn’t “organic growth”. That was pure liquidity warfare.
The scary part?
TRB is one of the few tokens on Binance that has repeatedly proven it can survive massive crashes… and still come back for another engineered move.
Most traders only see the dump after the hype dies.
Whales see something else entirely:
Low circulating supply, Thin order books, High volatility, Easy liquidation fuel, And a chart that historically rewards aggressive momentum.
That combination is dangerous.
Every cycle TRB creates the exact same psychology: “it’s dead” “it’ll never recover” “ATH was manipulation”
Then suddenly it starts squeezing shorts with 20%, 40%, 80% candles until FOMO returns again.
And once liquidity comes back, this token becomes one of the most manipulatively bullish assets in the entire market.
The monthly chart still looks like unfinished business.
A slow accumulation zone sitting near historical depression levels after one of the biggest synthetic rallies Binance futures has ever seen.
If Bitcoin stays strong and altcoin mania returns, TRB doesn’t need retail support to move.
It only needs market makers to decide the next liquidity hunt begins.
Because tokens like this don’t climb normally.
They teleport.
And if history repeats the way it has before…
Watching TRB revisit $555 again won’t feel impossible.
It’ll feel engineered.
#TRB
#Trbpump
#Manipulated
#breakout
#TRB_UPDATE
1
1
6
576
·
--
Bearish
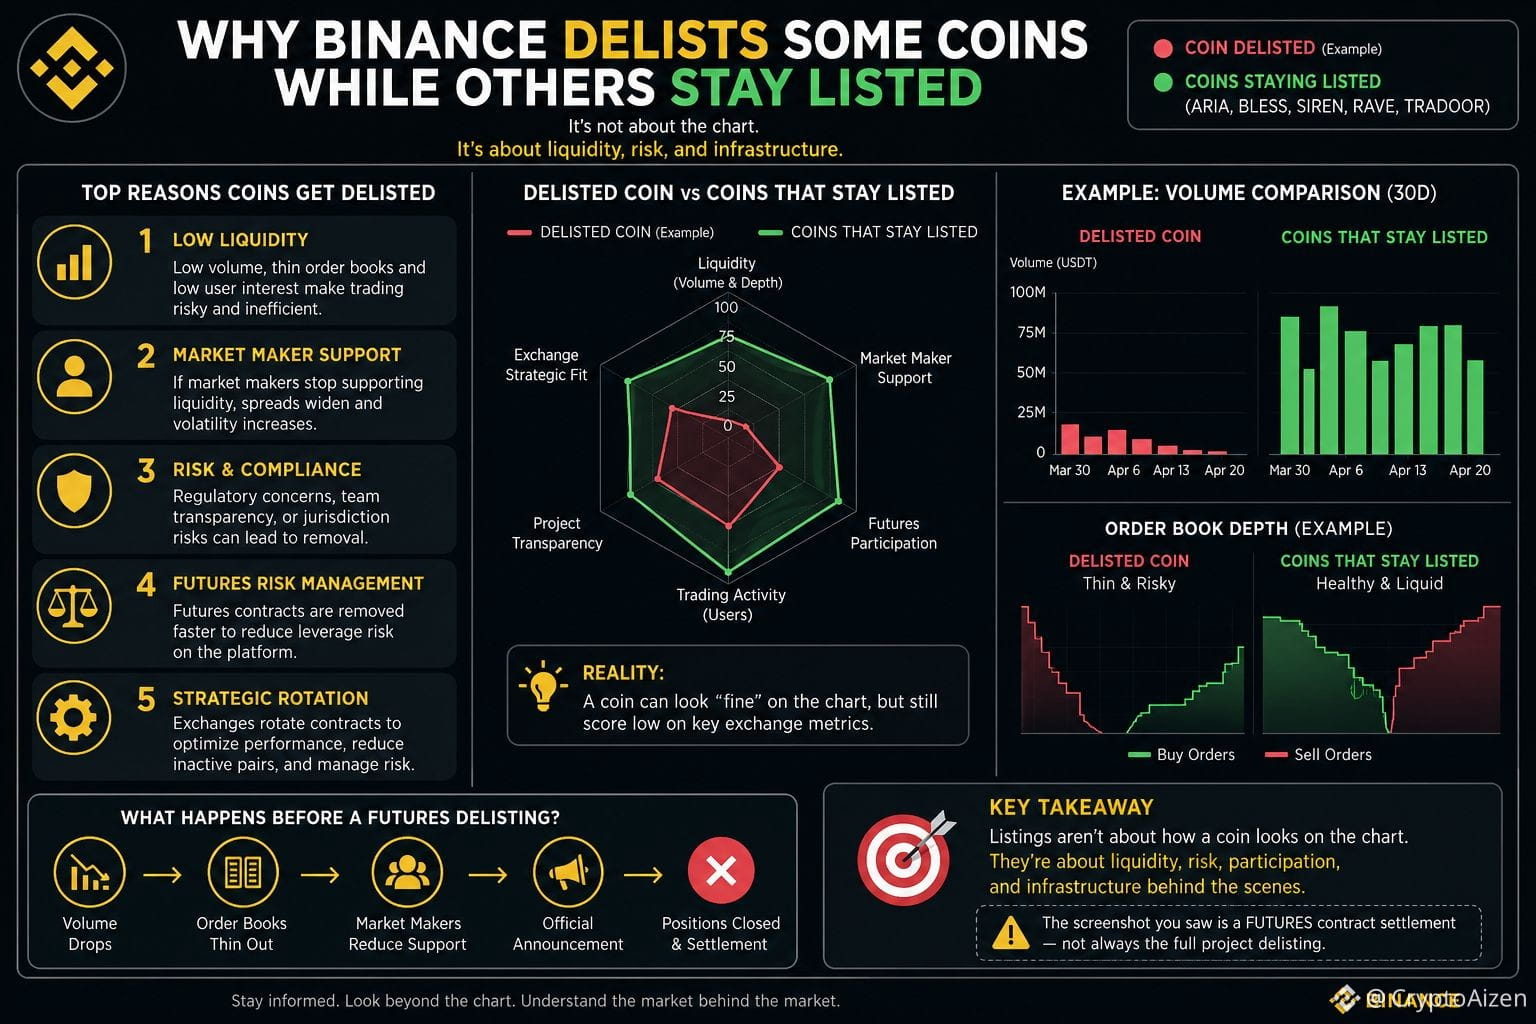
Why a Quite Healthy coin like $VINE Gets Delisted and Other Scam coins like SIREN, RAVE still gets Traded, Without even a Warning on them.
The reason a coin like VINE gets removed while tokens like ARIA, BLESS, SIREN, RAVE or TRADOOR stay listed isn’t because Binance thinks those other coins are “better.”
Exchanges don’t judge listings based on chart strength or how stable the price looks.
They mostly look at liquidity support, derivatives participation, internal risk exposure, and whether market makers are still actively maintaining the pair.
When a perpetual futures contract loses enough trading activity or market-maker backing, the exchange shuts it down to reduce leverage risk on their platform.
That decision can happen even if the chart looks calm or “healthy” to traders.
Meanwhile, some weaker-looking tokens remain listed simply because they still have active volume programs, promotional agreements, or liquidity providers keeping the order books alive behind the scenes.
So what looks unfair from the chart perspective is usually just invisible infrastructure decisions happening underneath the market.
It’s less about which coin deserves to stay, and more about which contract is still useful for the exchange to keep running safely.
#DelistingAlert
#vinedelist
#SCAMalerts
#DelistingPanic
#BinanceSquareTalks
Why a Quite Healthy coin like $VINE Gets Delisted and Other Scam coins like SIREN, RAVE still gets Traded, Without even a Warning on them.
The reason a coin like VINE gets removed while tokens like ARIA, BLESS, SIREN, RAVE or TRADOOR stay listed isn’t because Binance thinks those other coins are “better.”
Exchanges don’t judge listings based on chart strength or how stable the price looks.
They mostly look at liquidity support, derivatives participation, internal risk exposure, and whether market makers are still actively maintaining the pair.
When a perpetual futures contract loses enough trading activity or market-maker backing, the exchange shuts it down to reduce leverage risk on their platform.
That decision can happen even if the chart looks calm or “healthy” to traders.
Meanwhile, some weaker-looking tokens remain listed simply because they still have active volume programs, promotional agreements, or liquidity providers keeping the order books alive behind the scenes.
So what looks unfair from the chart perspective is usually just invisible infrastructure decisions happening underneath the market.
It’s less about which coin deserves to stay, and more about which contract is still useful for the exchange to keep running safely.
#DelistingAlert
#vinedelist
#SCAMalerts
#DelistingPanic
#BinanceSquareTalks
The reason a coin like VINE gets removed while tokens like ARIA, BLESS, SIREN, RAVE or TRADOOR stay listed isn’t because Binance thinks those other coins are “better.”
Exchanges don’t judge listings based on chart strength or how stable the price looks.
They mostly look at liquidity support, derivatives participation, internal risk exposure, and whether market makers are still actively maintaining the pair.
When a perpetual futures contract loses enough trading activity or market-maker backing, the exchange shuts it down to reduce leverage risk on their platform.
That decision can happen even if the chart looks calm or “healthy” to traders.
Meanwhile, some weaker-looking tokens remain listed simply because they still have active volume programs, promotional agreements, or liquidity providers keeping the order books alive behind the scenes.
So what looks unfair from the chart perspective is usually just invisible infrastructure decisions happening underneath the market.
It’s less about which coin deserves to stay, and more about which contract is still useful for the exchange to keep running safely.
#DelistingAlert
#vinedelist
#SCAMalerts
#DelistingPanic
#BinanceSquareTalks
1
2
5
653
·
--
Bullish
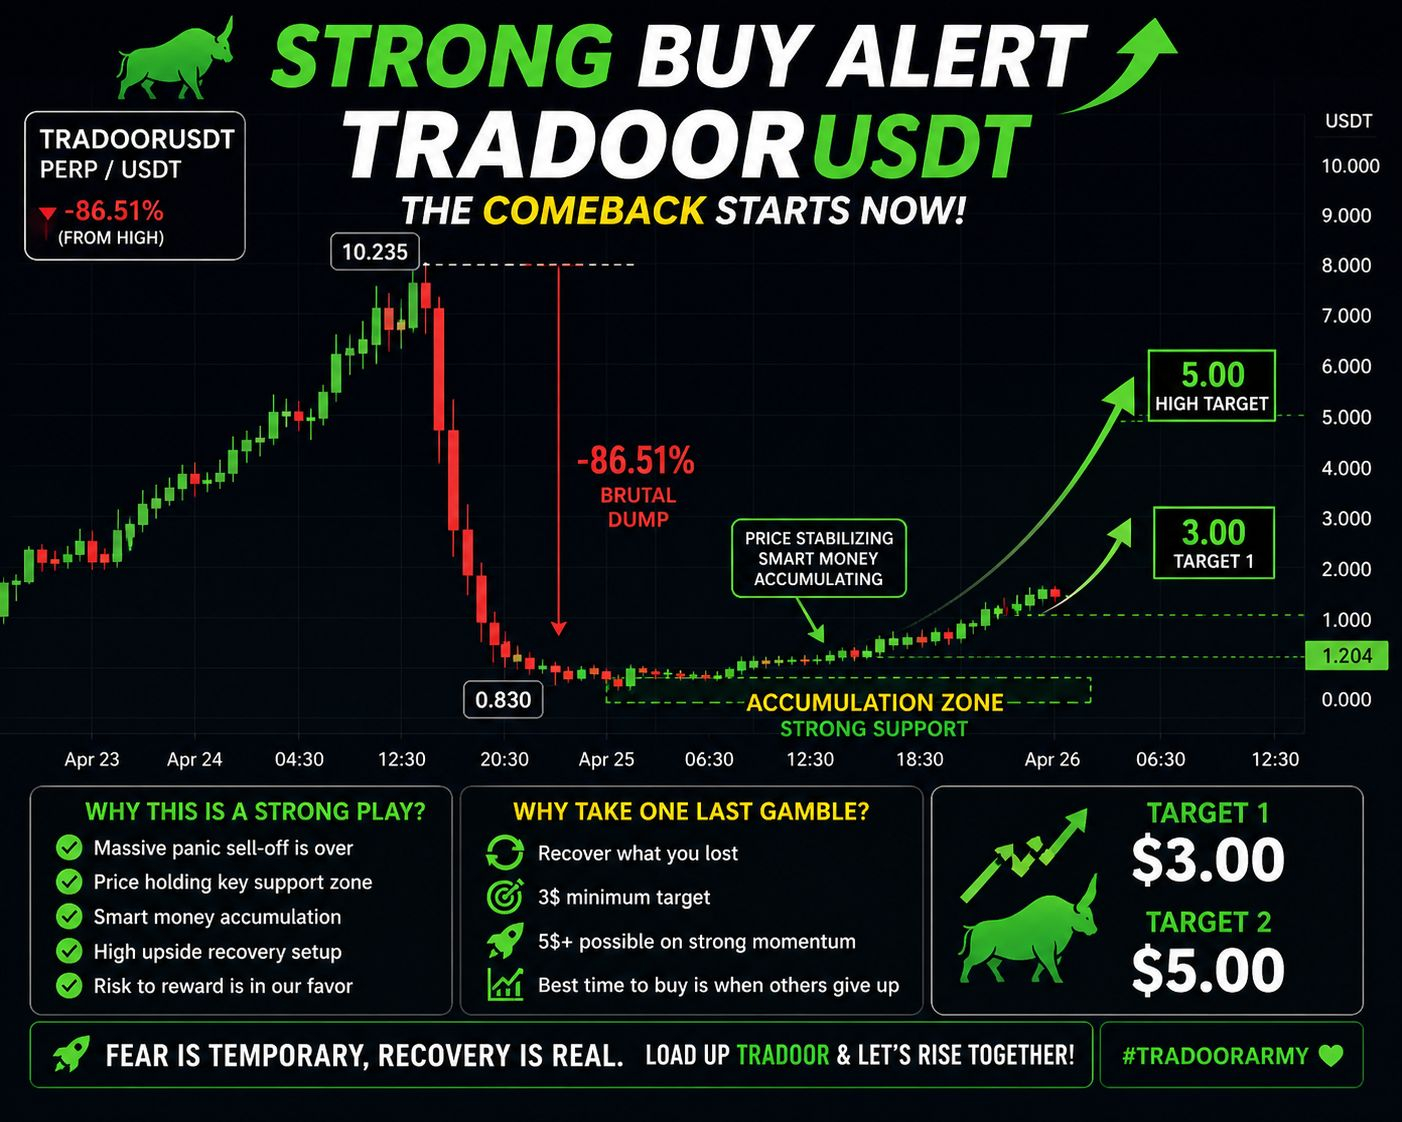
Strong buy alert in $TRADOOR 🚨
After a brutal collapse of more than 80%, most retail traders are already out of the market emotionally, financially, and mentally.
This is exactly the phase where smart recovery trades usually begin. Not when everyone is excited.
Not when the chart is trending up. But when fear is at its peak and nobody wants to touch the coin anymore.
Many traders who lost heavily in TRADOOR are now sitting on the sidelines watching price stabilize near the bottom zone around the 0.8–1.2$ range.
Historically, these post-crash accumulation zones often become the launchpads for the first aggressive relief rally.
This is why one last calculated recovery trade here makes sense for those looking to recover losses instead of chasing new risky listings elsewhere.
Liquidity returns first. Then short covering begins. Then comes the sudden upside move that nobody expects.
A move back toward 3$ is realistic once momentum returns.
And if the recovery rally turns aggressive, a spike toward 5$ is absolutely possible during the first strong bounce phase.
Most traders panic near the bottom,
But recoveries are always built from exactly these levels. 📈
#TRADOORSignal
#tradoorpumping
#lossrecovery
#tradoorusdt
#BullishReversals
Strong buy alert in $TRADOOR 🚨
After a brutal collapse of more than 80%, most retail traders are already out of the market emotionally, financially, and mentally.
This is exactly the phase where smart recovery trades usually begin. Not when everyone is excited.
Not when the chart is trending up. But when fear is at its peak and nobody wants to touch the coin anymore.
Many traders who lost heavily in TRADOOR are now sitting on the sidelines watching price stabilize near the bottom zone around the 0.8–1.2$ range.
Historically, these post-crash accumulation zones often become the launchpads for the first aggressive relief rally.
This is why one last calculated recovery trade here makes sense for those looking to recover losses instead of chasing new risky listings elsewhere.
Liquidity returns first. Then short covering begins. Then comes the sudden upside move that nobody expects.
A move back toward 3$ is realistic once momentum returns.
And if the recovery rally turns aggressive, a spike toward 5$ is absolutely possible during the first strong bounce phase.
Most traders panic near the bottom,
But recoveries are always built from exactly these levels. 📈
#TRADOORSignal
#tradoorpumping
#lossrecovery
#tradoorusdt
#BullishReversals
After a brutal collapse of more than 80%, most retail traders are already out of the market emotionally, financially, and mentally.
This is exactly the phase where smart recovery trades usually begin. Not when everyone is excited.
Not when the chart is trending up. But when fear is at its peak and nobody wants to touch the coin anymore.
Many traders who lost heavily in TRADOOR are now sitting on the sidelines watching price stabilize near the bottom zone around the 0.8–1.2$ range.
Historically, these post-crash accumulation zones often become the launchpads for the first aggressive relief rally.
This is why one last calculated recovery trade here makes sense for those looking to recover losses instead of chasing new risky listings elsewhere.
Liquidity returns first. Then short covering begins. Then comes the sudden upside move that nobody expects.
A move back toward 3$ is realistic once momentum returns.
And if the recovery rally turns aggressive, a spike toward 5$ is absolutely possible during the first strong bounce phase.
Most traders panic near the bottom,
But recoveries are always built from exactly these levels. 📈
#TRADOORSignal
#tradoorpumping
#lossrecovery
#tradoorusdt
#BullishReversals
1
2
595
·
--
Bearish
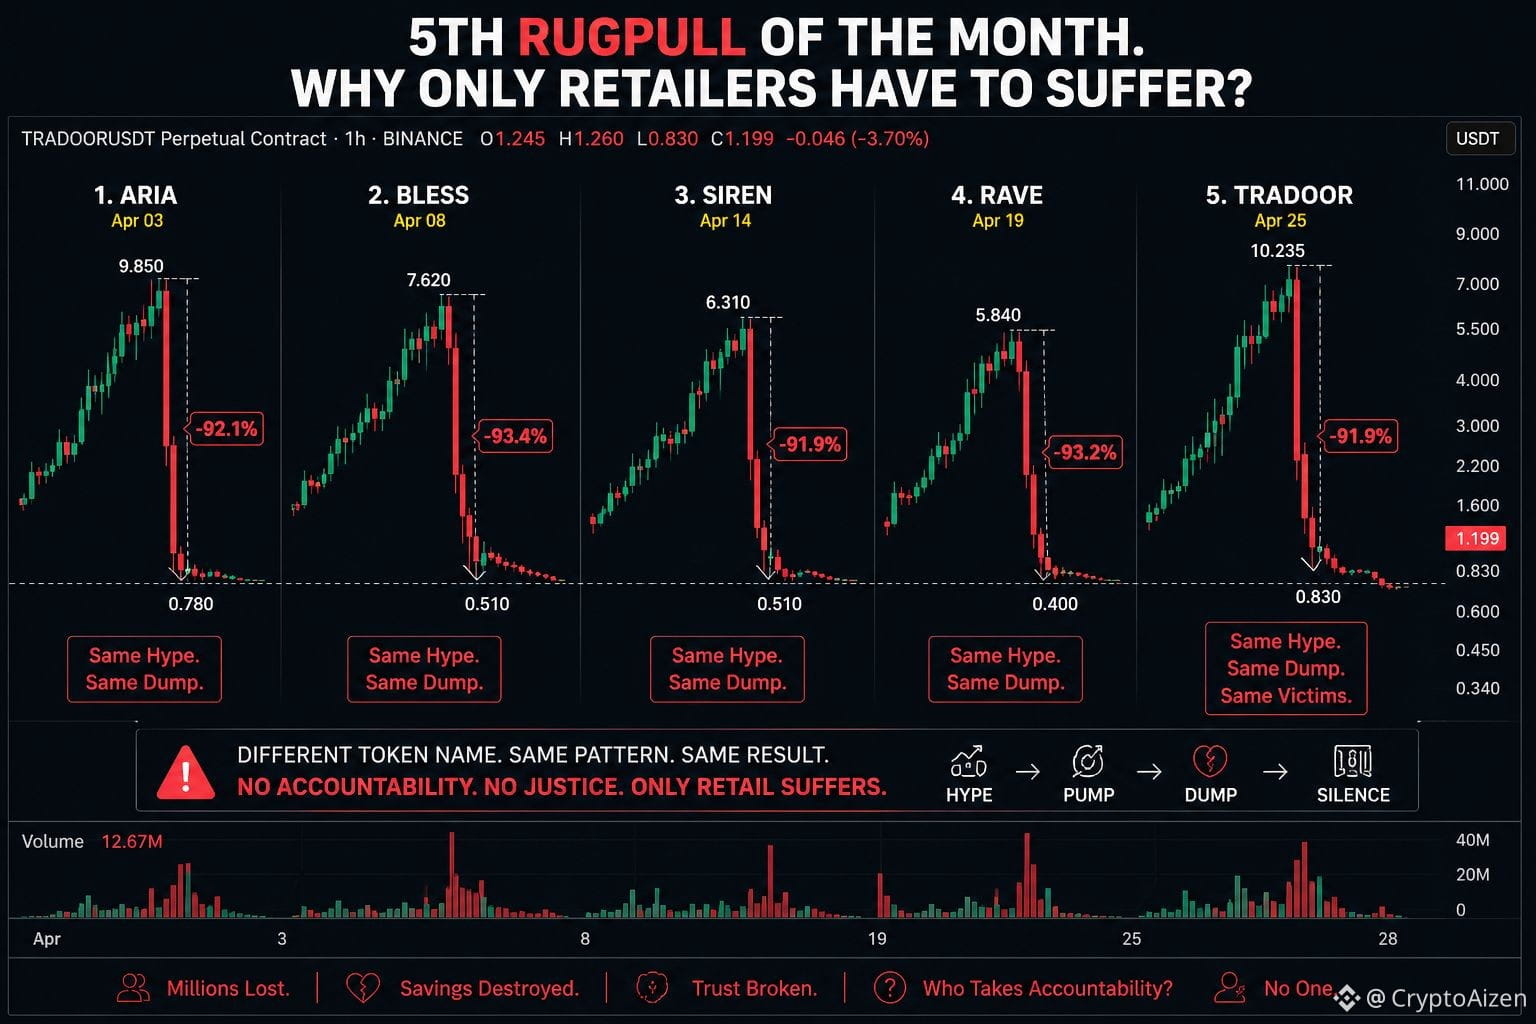
5th rugpull Like Crash of the month!!!
And they still call this a “market.”
First it was ARIA.
Then BLESS followed the exact same pattern.
After that came SIREN.
Then RAVE wiped out another wave of traders.
And now $TRADOOR joins the list.
Same setup. Same hype. Same listing excitement. Same sudden collapse. Different token name. Same victims.
Every time retail traders enter thinking this is the breakout opportunity of their life, liquidity disappears, charts collapse, and portfolios get destroyed within hours.
This is no longer random volatility. This is a cycle repeating itself again and again in front of everyone’s eyes.
Why is it always the small traders who pay the price?
Why does the dump always come right after the hype peak?
Why does accountability never exist when millions vanish overnight?
People are not just losing trades.
They are losing savings. Confidence. Months of effort. Sometimes even their entire capital.
And when the crash happens, silence follows.
No explanations.
No responsibility.
No protection.
Only another chart going straight down 📉
And another group of retail traders left behind.
#AccountabilityNow
#tradoorcrash
#SirenScam
#ariarugpull
#BLESSSCAM
@CZ @heyi
@richardteng
5th rugpull Like Crash of the month!!!
And they still call this a “market.”
First it was ARIA.
Then BLESS followed the exact same pattern.
After that came SIREN.
Then RAVE wiped out another wave of traders.
And now $TRADOOR joins the list.
Same setup. Same hype. Same listing excitement. Same sudden collapse. Different token name. Same victims.
Every time retail traders enter thinking this is the breakout opportunity of their life, liquidity disappears, charts collapse, and portfolios get destroyed within hours.
This is no longer random volatility. This is a cycle repeating itself again and again in front of everyone’s eyes.
Why is it always the small traders who pay the price?
Why does the dump always come right after the hype peak?
Why does accountability never exist when millions vanish overnight?
People are not just losing trades.
They are losing savings. Confidence. Months of effort. Sometimes even their entire capital.
And when the crash happens, silence follows.
No explanations.
No responsibility.
No protection.
Only another chart going straight down 📉
And another group of retail traders left behind.
#AccountabilityNow
#tradoorcrash
#SirenScam
#ariarugpull
#BLESSSCAM
@CZ @Yi He
@Richard Teng
And they still call this a “market.”
First it was ARIA.
Then BLESS followed the exact same pattern.
After that came SIREN.
Then RAVE wiped out another wave of traders.
And now $TRADOOR joins the list.
Same setup. Same hype. Same listing excitement. Same sudden collapse. Different token name. Same victims.
Every time retail traders enter thinking this is the breakout opportunity of their life, liquidity disappears, charts collapse, and portfolios get destroyed within hours.
This is no longer random volatility. This is a cycle repeating itself again and again in front of everyone’s eyes.
Why is it always the small traders who pay the price?
Why does the dump always come right after the hype peak?
Why does accountability never exist when millions vanish overnight?
People are not just losing trades.
They are losing savings. Confidence. Months of effort. Sometimes even their entire capital.
And when the crash happens, silence follows.
No explanations.
No responsibility.
No protection.
Only another chart going straight down 📉
And another group of retail traders left behind.
#AccountabilityNow
#tradoorcrash
#SirenScam
#ariarugpull
#BLESSSCAM
@CZ @Yi He
@Richard Teng
2
4
1.6k
·
--
Bullish
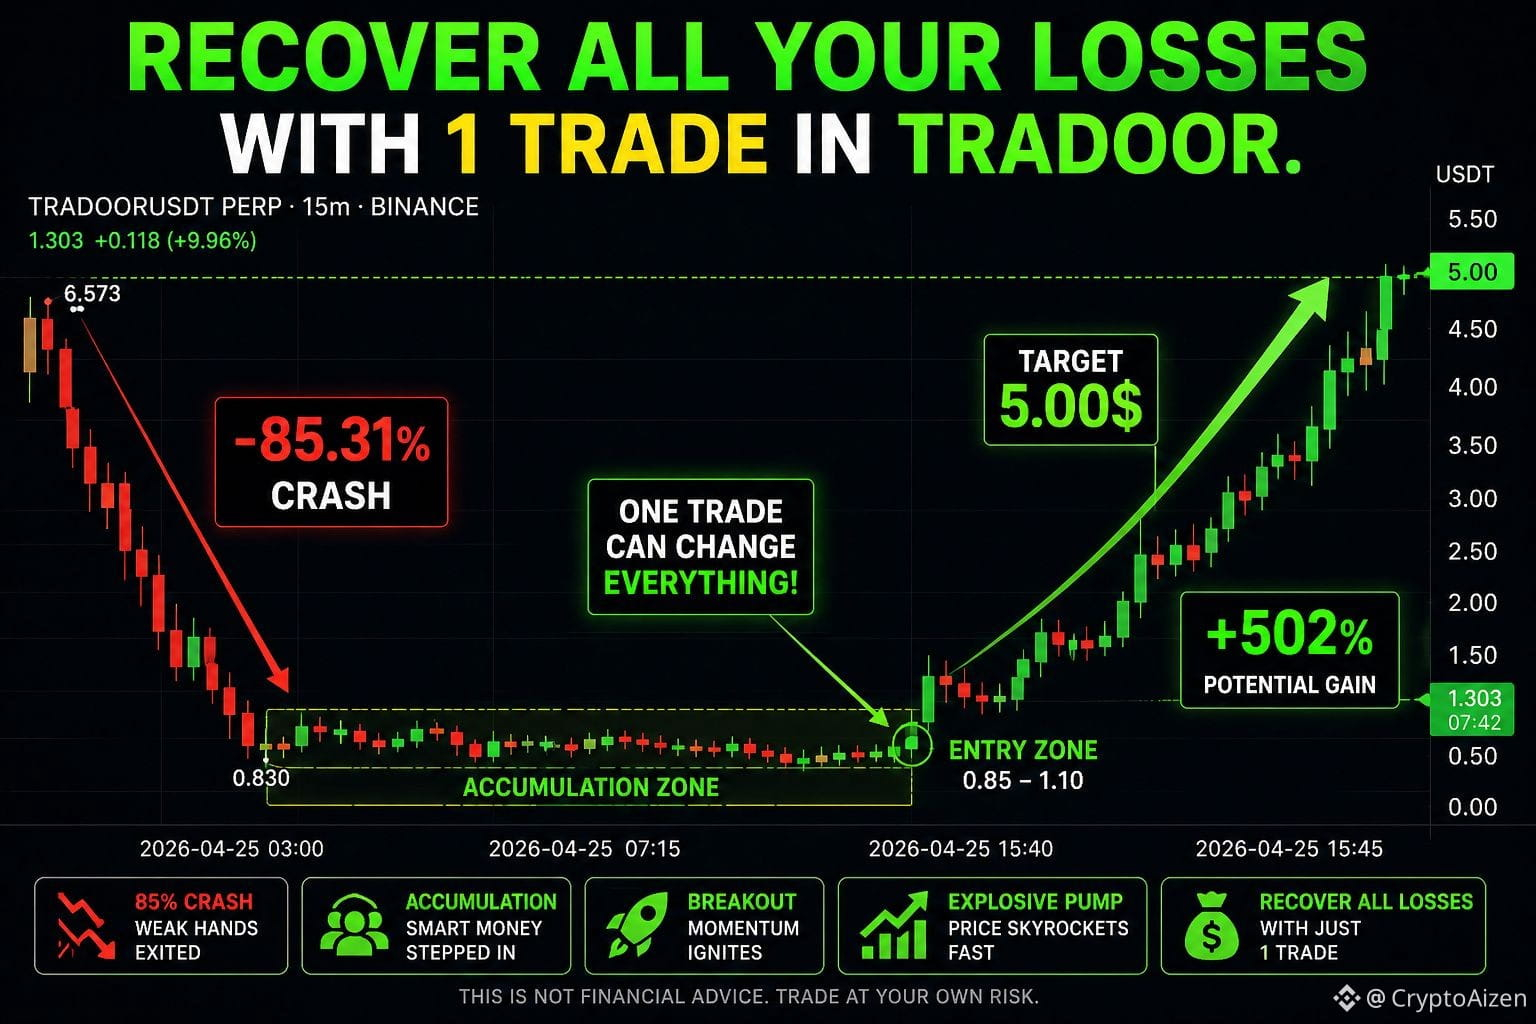
Recover all your losses with 1 trade in $TRADOOR
Most traders make the mistake of chasing green candles after a pump is already obvious.
The smarter move usually comes after the crash, when the chart looks silent and confidence disappears.
TRADOOR has already completed its biggest fear phase. The 80%+ drop removed weak hands and reset expectations across the market.
That’s exactly the environment where explosive recovery trades are born.
When a freshly listed futures coin survives its initial collapse and continues trading with liquidity on Binance, it rarely stays inactive for long.
These charts are built on volatility cycles. First comes the listing spike, then the crash, then accumulation, and then the sudden expansion move that nobody believes until it has already started.
This same structure appeared earlier in Siren and RAVE before their unexpected recovery waves.
Right now TRADOOR is sitting in the zone where risk is compressed but upside remains wide open. That imbalance is what creates high-impact trades.
If momentum returns and short positions begin stacking above resistance, the squeeze effect alone can push price much faster than traders expect.
Sometimes one correctly timed entry after a major crash can do what dozens of small trades couldn’t.
The market rarely gives second chances at the same setup twice.
When volatility returns to a coin that already wiped out most sellers, the recovery move can be sharp enough to change everything. 🚀📈
#lossrecovery
#tradooranalysis
#tradoorupdate
#BullishReversals
#tradoorpumping
Recover all your losses with 1 trade in $TRADOOR
Most traders make the mistake of chasing green candles after a pump is already obvious.
The smarter move usually comes after the crash, when the chart looks silent and confidence disappears.
TRADOOR has already completed its biggest fear phase. The 80%+ drop removed weak hands and reset expectations across the market.
That’s exactly the environment where explosive recovery trades are born.
When a freshly listed futures coin survives its initial collapse and continues trading with liquidity on Binance, it rarely stays inactive for long.
These charts are built on volatility cycles. First comes the listing spike, then the crash, then accumulation, and then the sudden expansion move that nobody believes until it has already started.
This same structure appeared earlier in Siren and RAVE before their unexpected recovery waves.
Right now TRADOOR is sitting in the zone where risk is compressed but upside remains wide open. That imbalance is what creates high-impact trades.
If momentum returns and short positions begin stacking above resistance, the squeeze effect alone can push price much faster than traders expect.
Sometimes one correctly timed entry after a major crash can do what dozens of small trades couldn’t.
The market rarely gives second chances at the same setup twice.
When volatility returns to a coin that already wiped out most sellers, the recovery move can be sharp enough to change everything. 🚀📈
#lossrecovery
#tradooranalysis
#tradoorupdate
#BullishReversals
#tradoorpumping
Most traders make the mistake of chasing green candles after a pump is already obvious.
The smarter move usually comes after the crash, when the chart looks silent and confidence disappears.
TRADOOR has already completed its biggest fear phase. The 80%+ drop removed weak hands and reset expectations across the market.
That’s exactly the environment where explosive recovery trades are born.
When a freshly listed futures coin survives its initial collapse and continues trading with liquidity on Binance, it rarely stays inactive for long.
These charts are built on volatility cycles. First comes the listing spike, then the crash, then accumulation, and then the sudden expansion move that nobody believes until it has already started.
This same structure appeared earlier in Siren and RAVE before their unexpected recovery waves.
Right now TRADOOR is sitting in the zone where risk is compressed but upside remains wide open. That imbalance is what creates high-impact trades.
If momentum returns and short positions begin stacking above resistance, the squeeze effect alone can push price much faster than traders expect.
Sometimes one correctly timed entry after a major crash can do what dozens of small trades couldn’t.
The market rarely gives second chances at the same setup twice.
When volatility returns to a coin that already wiped out most sellers, the recovery move can be sharp enough to change everything. 🚀📈
#lossrecovery
#tradooranalysis
#tradoorupdate
#BullishReversals
#tradoorpumping
3
453
·
--
Bullish
Buy $TRADOOR now,
And Make the biggest profit of your life.
TRADOOR has already done what most early-stage alpha coins always do first it crashed hard enough to scare away almost everyone.
That’s exactly the phase where the opportunity begins, not where it ends. After an 80%+ collapse, weak hands are gone, panic sellers are exhausted, and the chart usually enters the quiet accumulation zone before the next expansion move starts.
Right now the structure looks very similar to what happened earlier with coins like Siren and RAVE. First comes the brutal listing drop.
Then comes silence. Then comes disbelief. And suddenly the price starts moving again when shorts become overcrowded and liquidity returns.
That second phase is where the fastest upside moves happen.
As long as Binance keeps TRADOOR listed and the futures pair active, the token remains inside the volatility cycle that creates repeated pump opportunities.
These are not slow utility-style recoveries. These are sharp momentum-driven expansions where price moves much faster than traders expect.
The market always rewards the people who enter when confidence is lowest and sentiment looks dead. Buying after hype is expensive.
Buying after fear is where life-changing moves usually begin.
If TRADOOR follows the same post-crash recovery structure seen in similar alpha listings, the move toward the higher resistance zones can happen much faster than most traders are prepared for.
Sometimes the biggest profits don’t come from chasing pumps.
They come from recognizing when the crash itself is the setup. 🚀📉📈
#tradooranalysis
#tradoorpump
#tradoorcrash
#PostCrash
#bullishreversal
Buy $TRADOOR now,
And Make the biggest profit of your life.
TRADOOR has already done what most early-stage alpha coins always do first it crashed hard enough to scare away almost everyone.
That’s exactly the phase where the opportunity begins, not where it ends. After an 80%+ collapse, weak hands are gone, panic sellers are exhausted, and the chart usually enters the quiet accumulation zone before the next expansion move starts.
Right now the structure looks very similar to what happened earlier with coins like Siren and RAVE. First comes the brutal listing drop.
Then comes silence. Then comes disbelief. And suddenly the price starts moving again when shorts become overcrowded and liquidity returns.
That second phase is where the fastest upside moves happen.
As long as Binance keeps TRADOOR listed and the futures pair active, the token remains inside the volatility cycle that creates repeated pump opportunities.
These are not slow utility-style recoveries. These are sharp momentum-driven expansions where price moves much faster than traders expect.
The market always rewards the people who enter when confidence is lowest and sentiment looks dead. Buying after hype is expensive.
Buying after fear is where life-changing moves usually begin.
If TRADOOR follows the same post-crash recovery structure seen in similar alpha listings, the move toward the higher resistance zones can happen much faster than most traders are prepared for.
Sometimes the biggest profits don’t come from chasing pumps.
They come from recognizing when the crash itself is the setup. 🚀📉📈
#tradooranalysis
#tradoorpump
#tradoorcrash
#PostCrash
#bullishreversal
And Make the biggest profit of your life.
TRADOOR has already done what most early-stage alpha coins always do first it crashed hard enough to scare away almost everyone.
That’s exactly the phase where the opportunity begins, not where it ends. After an 80%+ collapse, weak hands are gone, panic sellers are exhausted, and the chart usually enters the quiet accumulation zone before the next expansion move starts.
Right now the structure looks very similar to what happened earlier with coins like Siren and RAVE. First comes the brutal listing drop.
Then comes silence. Then comes disbelief. And suddenly the price starts moving again when shorts become overcrowded and liquidity returns.
That second phase is where the fastest upside moves happen.
As long as Binance keeps TRADOOR listed and the futures pair active, the token remains inside the volatility cycle that creates repeated pump opportunities.
These are not slow utility-style recoveries. These are sharp momentum-driven expansions where price moves much faster than traders expect.
The market always rewards the people who enter when confidence is lowest and sentiment looks dead. Buying after hype is expensive.
Buying after fear is where life-changing moves usually begin.
If TRADOOR follows the same post-crash recovery structure seen in similar alpha listings, the move toward the higher resistance zones can happen much faster than most traders are prepared for.
Sometimes the biggest profits don’t come from chasing pumps.
They come from recognizing when the crash itself is the setup. 🚀📉📈
#tradooranalysis
#tradoorpump
#tradoorcrash
#PostCrash
#bullishreversal
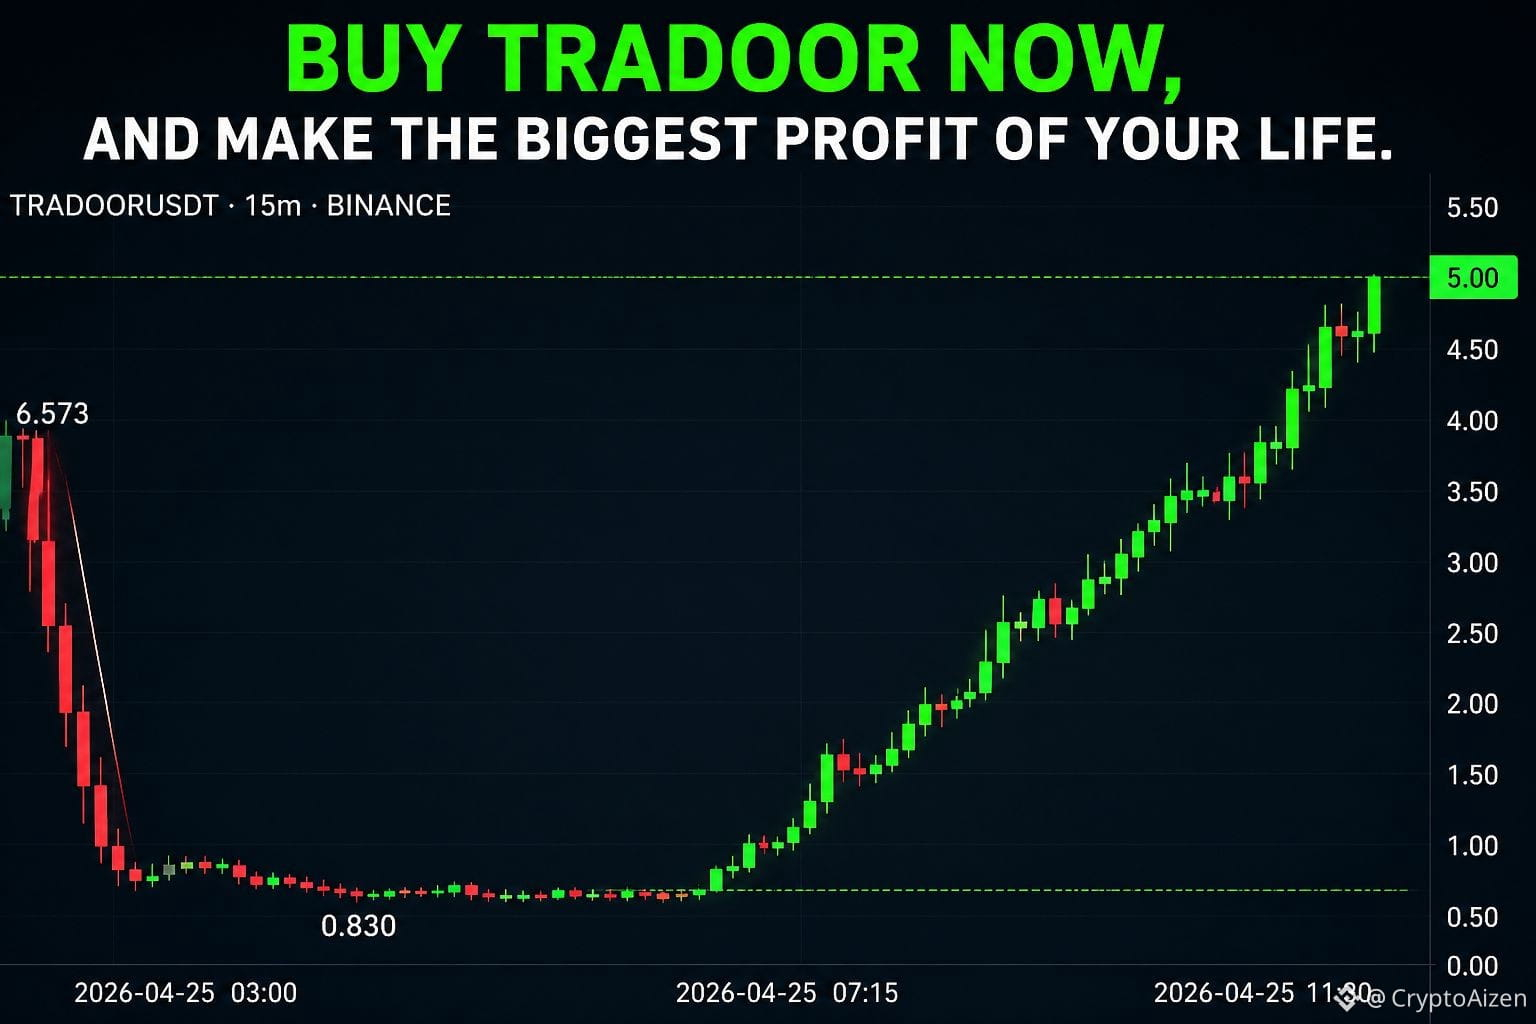
3
383
·
--
Bullish
Why $TRADOOR will Pump Hard Back to 5$.
TRADOOR dropping 95% doesn’t mean the move is over.
For coins like this, the real volatility usually starts after the crash, not before it.
As long as Binance keeps the futures pair active and doesn’t delist the token, the market structure stays alive.
That means liquidity stays, traders stay, leverage stays, and whales keep using the chart as a playground.
This is exactly how coins like Siren and RAVE behaved earlier. They didn’t die after crashing they entered a cycle of repeated pump and dump waves.
What usually happens after a collapse like this is simple.
Retail panic sells near the bottom, strong hands quietly accumulate during the flat phase, volatility compresses, and then price suddenly expands upward when shorts begin stacking too aggressively.
These rebounds are rarely slow. They are sharp, fast and designed to surprise the majority of traders watching the chart.
Another important detail is psychological positioning. After a 90% crash, almost nobody expects a recovery. That disbelief itself becomes fuel for the next move.
When price starts moving up even slightly, shorts rush to exit and that creates a squeeze effect which accelerates the pump much faster than normal market conditions.
As long as Binance keeps TRADOOR listed, the chart is unlikely to stay dead.
Coins in this category usually repeat the same pattern again and again crash hard, stabilize quietly, then explode unexpectedly.
That’s why a move back toward 5$ after this phase is not unrealistic at all. 🚀📉📈
#tradooranalysis
#tradoorpumping
#tradoorusdt
#tradoorupdate
#BullishReversalTrend
Why $TRADOOR will Pump Hard Back to 5$.
TRADOOR dropping 95% doesn’t mean the move is over.
For coins like this, the real volatility usually starts after the crash, not before it.
As long as Binance keeps the futures pair active and doesn’t delist the token, the market structure stays alive.
That means liquidity stays, traders stay, leverage stays, and whales keep using the chart as a playground.
This is exactly how coins like Siren and RAVE behaved earlier. They didn’t die after crashing they entered a cycle of repeated pump and dump waves.
What usually happens after a collapse like this is simple.
Retail panic sells near the bottom, strong hands quietly accumulate during the flat phase, volatility compresses, and then price suddenly expands upward when shorts begin stacking too aggressively.
These rebounds are rarely slow. They are sharp, fast and designed to surprise the majority of traders watching the chart.
Another important detail is psychological positioning. After a 90% crash, almost nobody expects a recovery. That disbelief itself becomes fuel for the next move.
When price starts moving up even slightly, shorts rush to exit and that creates a squeeze effect which accelerates the pump much faster than normal market conditions.
As long as Binance keeps TRADOOR listed, the chart is unlikely to stay dead.
Coins in this category usually repeat the same pattern again and again crash hard, stabilize quietly, then explode unexpectedly.
That’s why a move back toward 5$ after this phase is not unrealistic at all. 🚀📉📈
#tradooranalysis
#tradoorpumping
#tradoorusdt
#tradoorupdate
#BullishReversalTrend
TRADOOR dropping 95% doesn’t mean the move is over.
For coins like this, the real volatility usually starts after the crash, not before it.
As long as Binance keeps the futures pair active and doesn’t delist the token, the market structure stays alive.
That means liquidity stays, traders stay, leverage stays, and whales keep using the chart as a playground.
This is exactly how coins like Siren and RAVE behaved earlier. They didn’t die after crashing they entered a cycle of repeated pump and dump waves.
What usually happens after a collapse like this is simple.
Retail panic sells near the bottom, strong hands quietly accumulate during the flat phase, volatility compresses, and then price suddenly expands upward when shorts begin stacking too aggressively.
These rebounds are rarely slow. They are sharp, fast and designed to surprise the majority of traders watching the chart.
Another important detail is psychological positioning. After a 90% crash, almost nobody expects a recovery. That disbelief itself becomes fuel for the next move.
When price starts moving up even slightly, shorts rush to exit and that creates a squeeze effect which accelerates the pump much faster than normal market conditions.
As long as Binance keeps TRADOOR listed, the chart is unlikely to stay dead.
Coins in this category usually repeat the same pattern again and again crash hard, stabilize quietly, then explode unexpectedly.
That’s why a move back toward 5$ after this phase is not unrealistic at all. 🚀📉📈
#tradooranalysis
#tradoorpumping
#tradoorusdt
#tradoorupdate
#BullishReversalTrend
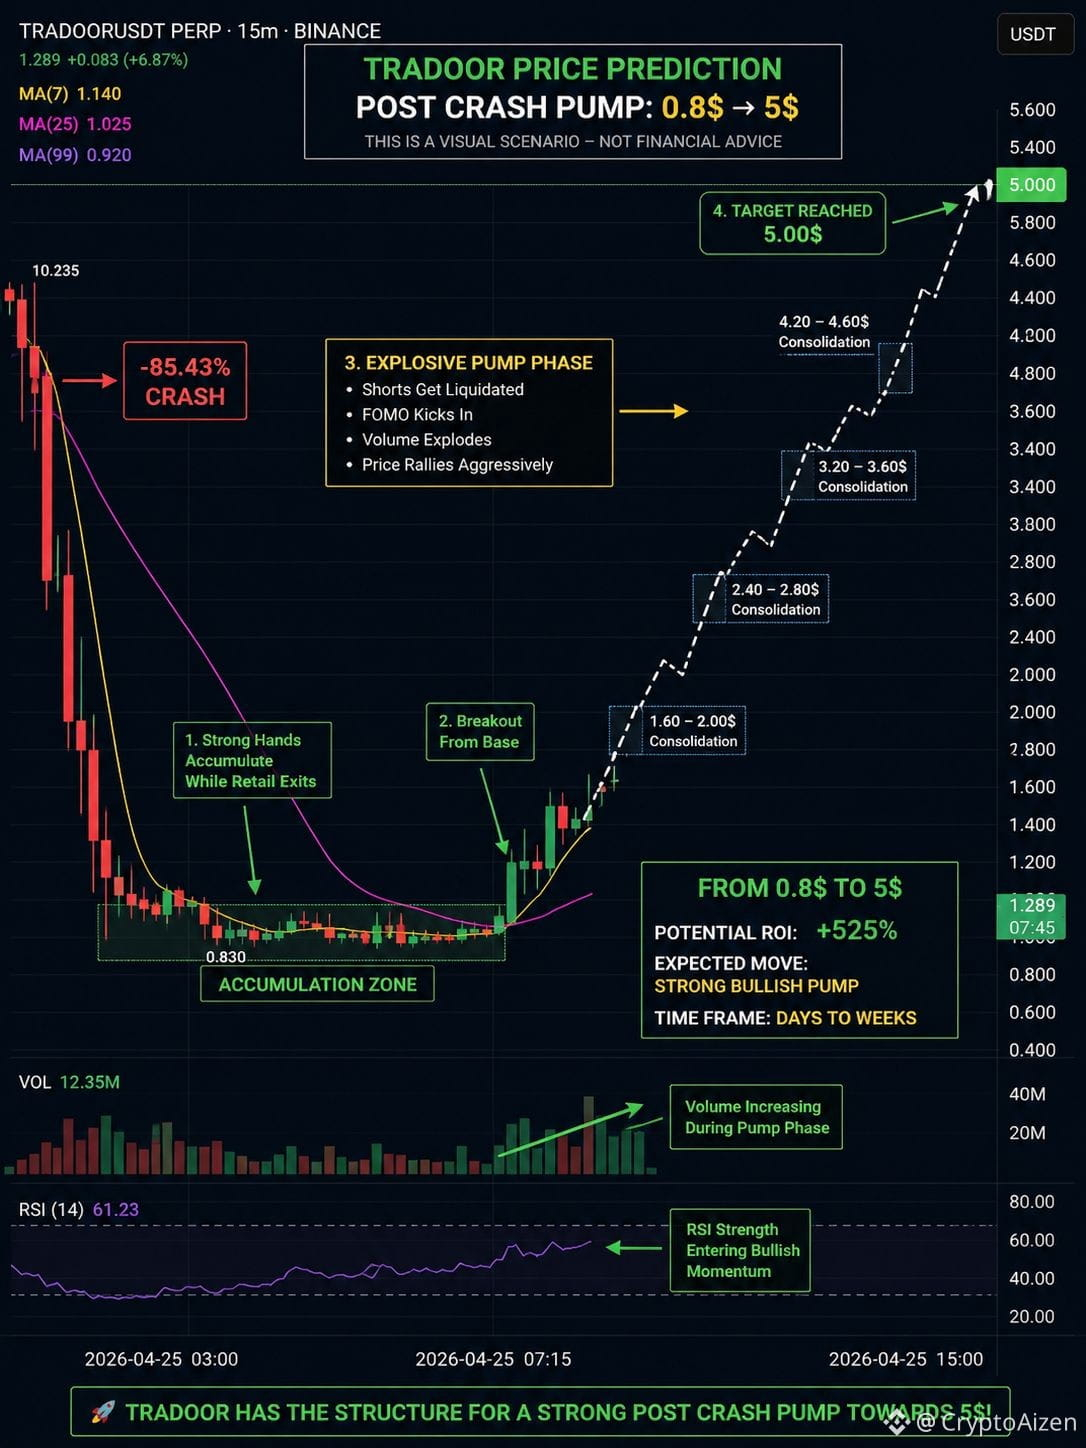
2
621
·
--
Bearish
$TRADOOR crashing 95%+ in hours is not shocking at all.
It was always a high-probability outcome the moment it launched as an Alpha coin.
These tokens follow a very predictable lifecycle.
Low liquidity. Thin order books. Insider allocations. Early unlock pressure.
Then one aggressive distribution candle and suddenly the chart looks exactly like $SIREN $BLESS and ARIA before it.
Retail traders usually enter thinking they’re early.
In reality, they’re entering after insiders are already positioned.
That single vertical red candle on your chart is not random volatility. It’s what happens when early wallets exit into hype liquidity.
Once support breaks, there’s no real buyer base underneath so price doesn’t correct slowly… it falls straight down.
Alpha coins are not investments.
They are high-risk liquidity events disguised as opportunities.
Some traders make quick gains if timing is perfect.
But most participants enter late, average down emotionally, and end up trapped watching a 70%/99% collapse unfold in real time.
If someone treats Alpha listings like long-term holds instead of short-term trades, the market can punish them brutally.
TRADOOR didn’t “unexpectedly crash.”
It simply followed the same script the market has already shown multiple times. 📉⚠️
#tradoorupdate
#tradoorcrash
#tradooranalysis
#AlphaCrash
#RugpullSeason
$TRADOOR crashing 95%+ in hours is not shocking at all.
It was always a high-probability outcome the moment it launched as an Alpha coin.
These tokens follow a very predictable lifecycle.
Low liquidity. Thin order books. Insider allocations. Early unlock pressure.
Then one aggressive distribution candle and suddenly the chart looks exactly like $SIREN $BLESS and ARIA before it.
Retail traders usually enter thinking they’re early.
In reality, they’re entering after insiders are already positioned.
That single vertical red candle on your chart is not random volatility. It’s what happens when early wallets exit into hype liquidity.
Once support breaks, there’s no real buyer base underneath so price doesn’t correct slowly… it falls straight down.
Alpha coins are not investments.
They are high-risk liquidity events disguised as opportunities.
Some traders make quick gains if timing is perfect.
But most participants enter late, average down emotionally, and end up trapped watching a 70%/99% collapse unfold in real time.
If someone treats Alpha listings like long-term holds instead of short-term trades, the market can punish them brutally.
TRADOOR didn’t “unexpectedly crash.”
It simply followed the same script the market has already shown multiple times. 📉⚠️
#tradoorupdate
#tradoorcrash
#tradooranalysis
#AlphaCrash
#RugpullSeason
It was always a high-probability outcome the moment it launched as an Alpha coin.
These tokens follow a very predictable lifecycle.
Low liquidity. Thin order books. Insider allocations. Early unlock pressure.
Then one aggressive distribution candle and suddenly the chart looks exactly like $SIREN $BLESS and ARIA before it.
Retail traders usually enter thinking they’re early.
In reality, they’re entering after insiders are already positioned.
That single vertical red candle on your chart is not random volatility. It’s what happens when early wallets exit into hype liquidity.
Once support breaks, there’s no real buyer base underneath so price doesn’t correct slowly… it falls straight down.
Alpha coins are not investments.
They are high-risk liquidity events disguised as opportunities.
Some traders make quick gains if timing is perfect.
But most participants enter late, average down emotionally, and end up trapped watching a 70%/99% collapse unfold in real time.
If someone treats Alpha listings like long-term holds instead of short-term trades, the market can punish them brutally.
TRADOOR didn’t “unexpectedly crash.”
It simply followed the same script the market has already shown multiple times. 📉⚠️
#tradoorupdate
#tradoorcrash
#tradooranalysis
#AlphaCrash
#RugpullSeason
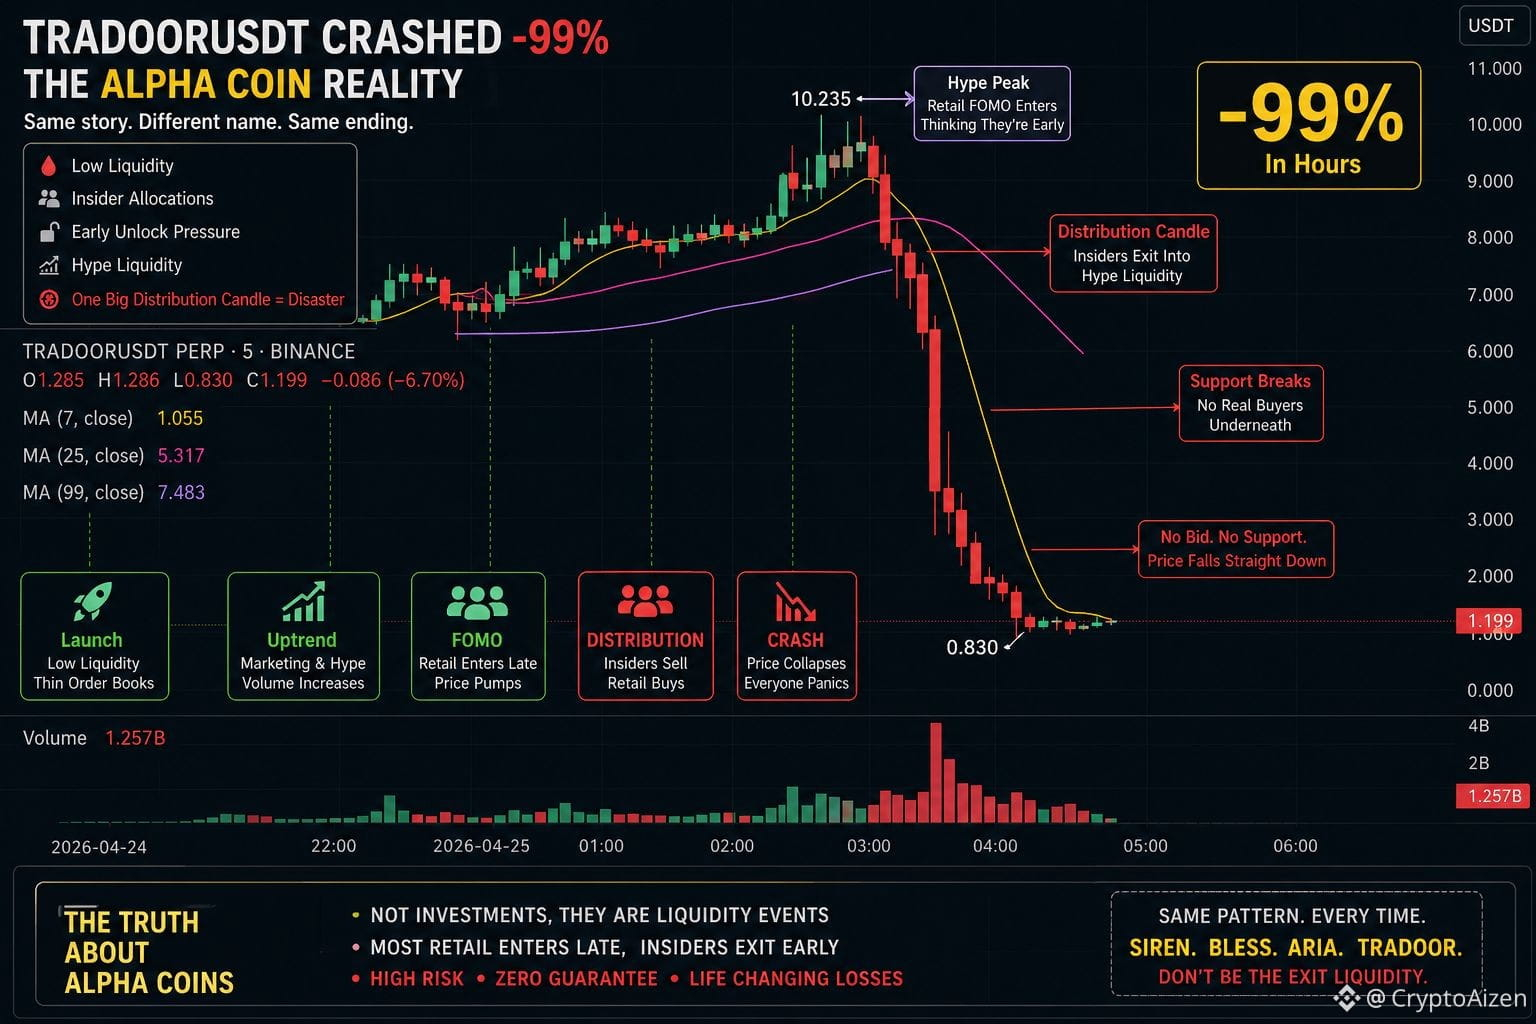
2
630
·
--
Bearish
Why tokens like $OPG and 99% of other Alpha listed Coins Immediately Crash After Listing.
Most traders still believe getting into Alpha listings early means getting rich early.
But the reality is the opposite.
By the time a token like OPG reaches the public market, early investors, private wallets, ecosystem insiders, and market-makers already hold massive allocations bought at extremely low prices.
The listing candle you see is not the beginning of the move it is usually the end of accumulation and the start of distribution.
The first spike after listing creates excitement.
Retail starts chasing.
Volume increases.
Social media turns bullish.
That is exactly when smart money begins selling quietly into strength.
Once the initial hype fades, price stops making higher highs and starts forming lower highs and weaker rebounds.
Support levels begin breaking one after another. Buyers slowly disappear because there is no real long-term demand yet only listing hype demand.
This is the phase OPG is entering right now.
The structure already shows classic post-listing behavior. Momentum is turning bearish, recovery candles are weak, and sellers are clearly in control of direction.
Unless strong exchange support or artificial liquidity steps in, these patterns usually continue until the token reaches a deep exhaustion zone.
For most Alpha listings, that zone appears near 70%–90% below listing spike levels.
For OPG, that places the realistic downside magnet around 0.10$.
This is not fear.
This is not guessing.
This is the same cycle repeated again and again across almost every new listing in this market.
Retail buys the listing narrative.
Smart money sells the listing event.
#opganalysis
#opgcrash
#opgusdt
#NewListingOpportunity
#ExitLiquidityAwareness
Why tokens like $OPG and 99% of other Alpha listed Coins Immediately Crash After Listing.
Most traders still believe getting into Alpha listings early means getting rich early.
But the reality is the opposite.
By the time a token like OPG reaches the public market, early investors, private wallets, ecosystem insiders, and market-makers already hold massive allocations bought at extremely low prices.
The listing candle you see is not the beginning of the move it is usually the end of accumulation and the start of distribution.
The first spike after listing creates excitement.
Retail starts chasing.
Volume increases.
Social media turns bullish.
That is exactly when smart money begins selling quietly into strength.
Once the initial hype fades, price stops making higher highs and starts forming lower highs and weaker rebounds.
Support levels begin breaking one after another. Buyers slowly disappear because there is no real long-term demand yet only listing hype demand.
This is the phase OPG is entering right now.
The structure already shows classic post-listing behavior. Momentum is turning bearish, recovery candles are weak, and sellers are clearly in control of direction.
Unless strong exchange support or artificial liquidity steps in, these patterns usually continue until the token reaches a deep exhaustion zone.
For most Alpha listings, that zone appears near 70%–90% below listing spike levels.
For OPG, that places the realistic downside magnet around 0.10$.
This is not fear.
This is not guessing.
This is the same cycle repeated again and again across almost every new listing in this market.
Retail buys the listing narrative.
Smart money sells the listing event.
#opganalysis
#opgcrash
#opgusdt
#NewListingOpportunity
#ExitLiquidityAwareness
Most traders still believe getting into Alpha listings early means getting rich early.
But the reality is the opposite.
By the time a token like OPG reaches the public market, early investors, private wallets, ecosystem insiders, and market-makers already hold massive allocations bought at extremely low prices.
The listing candle you see is not the beginning of the move it is usually the end of accumulation and the start of distribution.
The first spike after listing creates excitement.
Retail starts chasing.
Volume increases.
Social media turns bullish.
That is exactly when smart money begins selling quietly into strength.
Once the initial hype fades, price stops making higher highs and starts forming lower highs and weaker rebounds.
Support levels begin breaking one after another. Buyers slowly disappear because there is no real long-term demand yet only listing hype demand.
This is the phase OPG is entering right now.
The structure already shows classic post-listing behavior. Momentum is turning bearish, recovery candles are weak, and sellers are clearly in control of direction.
Unless strong exchange support or artificial liquidity steps in, these patterns usually continue until the token reaches a deep exhaustion zone.
For most Alpha listings, that zone appears near 70%–90% below listing spike levels.
For OPG, that places the realistic downside magnet around 0.10$.
This is not fear.
This is not guessing.
This is the same cycle repeated again and again across almost every new listing in this market.
Retail buys the listing narrative.
Smart money sells the listing event.
#opganalysis
#opgcrash
#opgusdt
#NewListingOpportunity
#ExitLiquidityAwareness
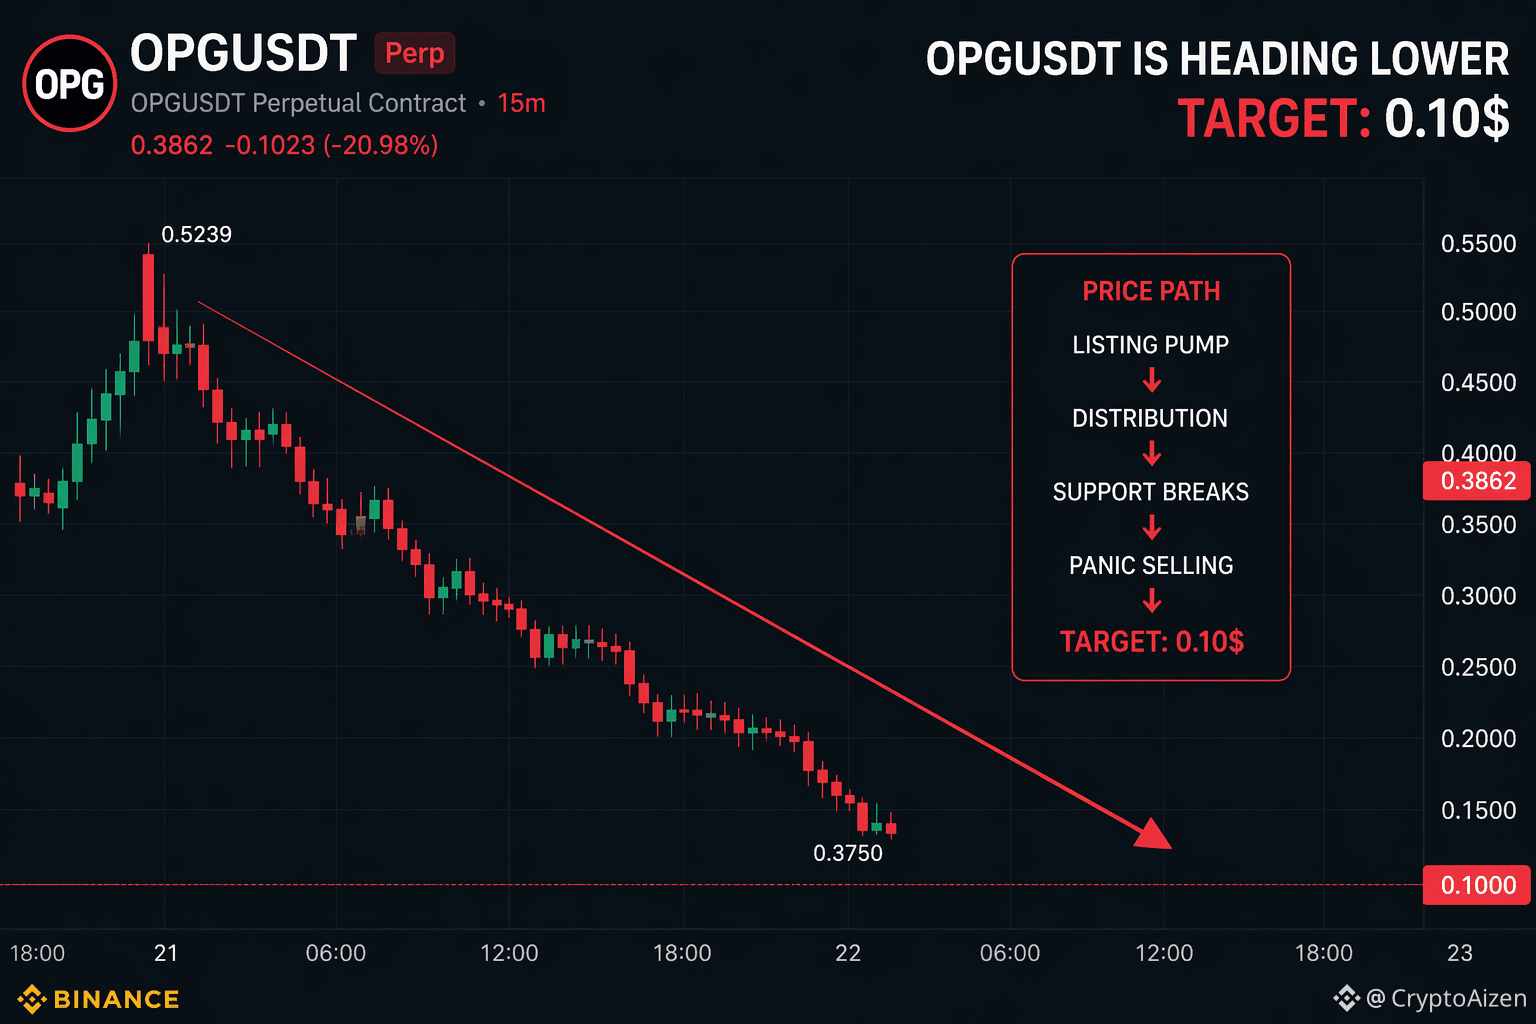
1
2
539
Log in to explore more content
Join global crypto users on Binance Square
⚡️ Get latest and useful information about crypto.
💬 Trusted by the world’s largest crypto exchange.
👍 Discover real insights from verified creators.
Email / Phone number
Trending Topics
AppleDebutsFoldablePhone
344 views
38 Discussing
#appledebutsfoldablephone Apple just redefined the smartphone era with the iPhone Duo.
This isn’t just another foldable—it’s full iPad mini-level productivity engineered into a razor-thin pocketable device.
Apple took its time to solve the form factor properly, debuting an invisible crease, dual-battery architecture, and custom vapor chamber thermals.
Key highlights:
Silicon: Next-gen A20 Pro chip delivering unprecedented efficiency and power.
Form Factor: Book-style hinge transforming a sleek everyday phone into an expansive canvas.
Software: Adaptive multi-window multitasking built natively for iOS.
Pricing & Availability: Starting at $1,999, pre-orders open October 16.
The wait was long, but Apple entered the foldable arena to dominate it, not just participate.
Are you making the switch, or staying on a classic slab?$VELVET $APR $USELESS
Isabella-I
·0 Likes
·7 views
US10YTreasuryYieldHitsHighestSinceNov2023
3,732 views
106 Discussing
USTreasuryToBuyBackUpTo$6BLongDatedDebt
8,508 views
126 Discussing