

三思交易
789 Posts

三思交易
Report
Block User
公众号:三思交易; x:@bn6813; 币安20%自动返佣邀请码:bn2017 学习SNR,ICT,SMC交易,肯特通道线战法,与君共勉!
Open Trade
High-Frequency Trader
7.2 Years
64 Following
809 Followers
1.4K+ Liked
Posts
Portfolio
All
Quotes
PINNED
·
--
Bullish
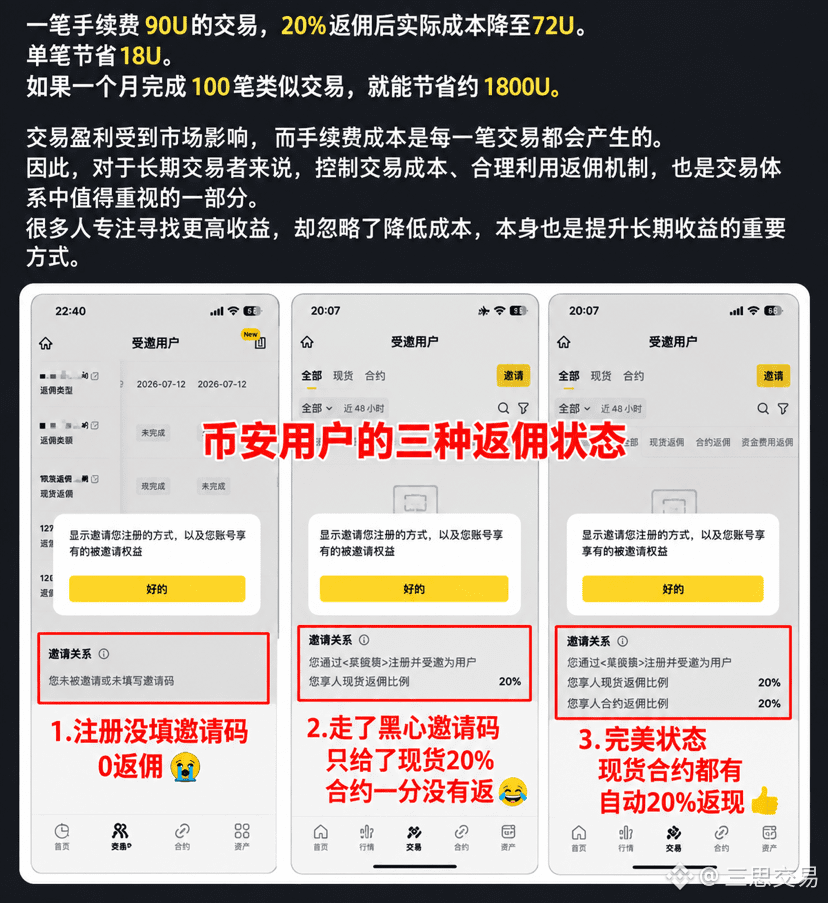
If you are an older user of Binance, and you have no inviter—after 90 days with almost no trading—you can use the following methods to bind referral commissions.
Method ① (Conditions: no trading in the past 90 days)
https://www.bsmkweb.cc/zh-CN/join?ref=bn2017
Method ② (Conditions: trading volume in the past 90 days is less than 5000 USDT; after applying with the link, you can succeed if your monthly trading exceeds 150,000 USDT)
https://www.bsmkweb.cc/zh-CN/activity/referral/bind-ref
Invitation code: bn2017
(Referral commission: 20%)
Advantages of binding referral commissions:
① Permanent automatic rebate of trading fees
Knowledge is priceless, networks are priceless—saving money is earning money.$BTC
{future}(BTCUSDT)
$ETH
{future}(ETHUSDT)
$HYPE
{future}(HYPEUSDT)
If you are an older user of Binance, and you have no inviter—after 90 days with almost no trading—you can use the following methods to bind referral commissions.
Method ① (Conditions: no trading in the past 90 days)
https://www.bsmkweb.cc/zh-CN/join?ref=bn2017
Method ② (Conditions: trading volume in the past 90 days is less than 5000 USDT; after applying with the link, you can succeed if your monthly trading exceeds 150,000 USDT)
https://www.bsmkweb.cc/zh-CN/activity/referral/bind-ref
Invitation code: bn2017
(Referral commission: 20%)
Advantages of binding referral commissions:
① Permanent automatic rebate of trading fees
Knowledge is priceless, networks are priceless—saving money is earning money.$BTC
$ETH
$HYPE
Method ① (Conditions: no trading in the past 90 days)
https://www.bsmkweb.cc/zh-CN/join?ref=bn2017
Method ② (Conditions: trading volume in the past 90 days is less than 5000 USDT; after applying with the link, you can succeed if your monthly trading exceeds 150,000 USDT)
https://www.bsmkweb.cc/zh-CN/activity/referral/bind-ref
Invitation code: bn2017
(Referral commission: 20%)
Advantages of binding referral commissions:
① Permanent automatic rebate of trading fees
Knowledge is priceless, networks are priceless—saving money is earning money.$BTC
$ETH
$HYPE
86
PINNED
·
--
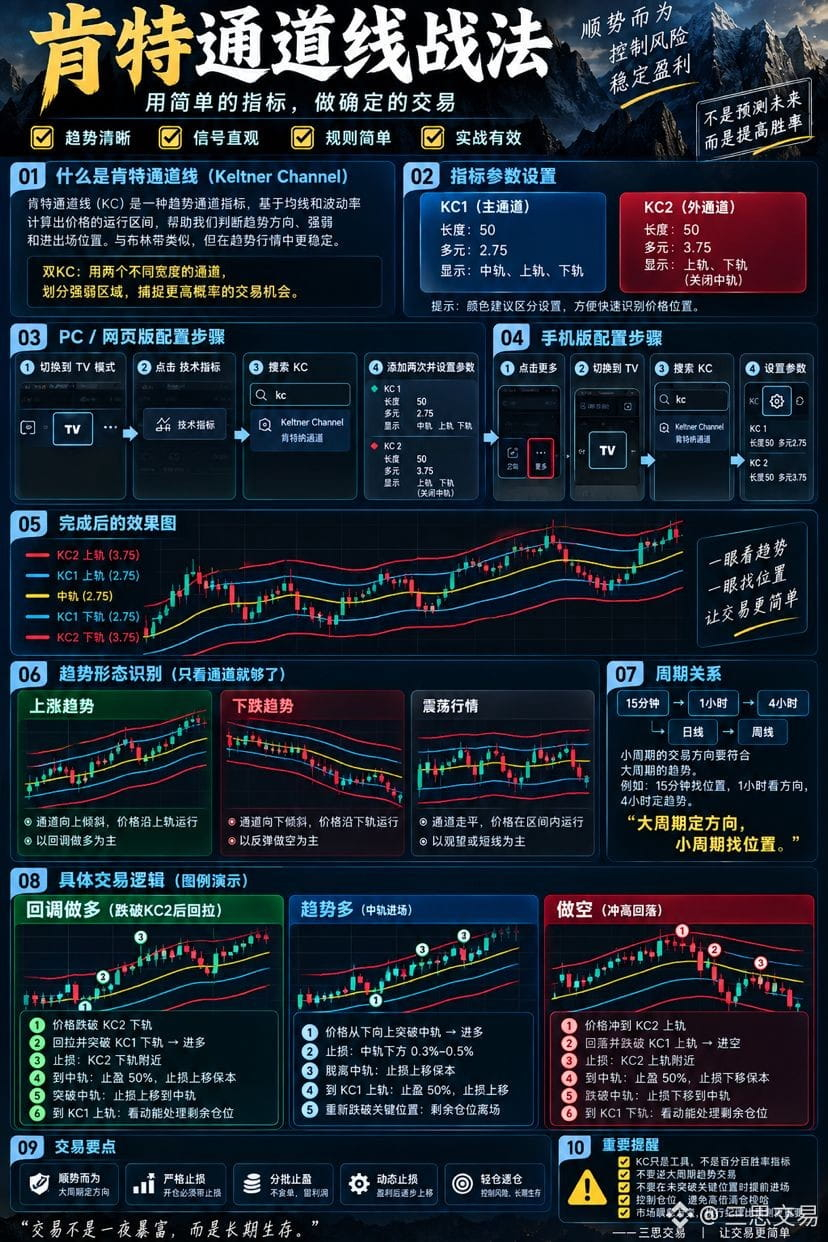
☆ Kent Channel Line Trading Strategy
Indicator: Keltner Channel (KC)
Parameters:
KC1: Length 50, multiplier 2.75
KC2: Length 50, multiplier 3.75, turn off the midline
The core is just one sentence: The larger time frame determines the direction; the smaller time frame finds the entry position.
Time-frame relationship:
15m looks at 1H → 1H looks at 4H → 4H looks at the daily chart → the daily chart looks at the weekly chart
When the larger time frame is trending up, only look for longs.
When the larger time frame is trending down, only look for shorts.
The smaller time frame runs opposite to the larger time frame—treat it as a retracement first.
1. Buy on Pullbacks
Prerequisite: The larger time frame cannot be a clearly bearish trend.
Price breaks below the KC2 lower band → then pulls back and breaks above the KC1 lower band → enter long.
Stop loss: Near the KC2 lower band.
After departing from the lower band: Move stop loss to break-even.
To the midline: Take profit 50%.
Break above the midline: Move stop loss to the midline.
To the KC1 upper band: Manage the remaining position based on momentum.
2. Trend Longs
In a strong uptrend, it is likely that price won’t give you an opportunity to reach the KC2 lower band—then focus on the midline.
Price breaks above the midline from below → enter long.
Stop loss: About 0.3%–0.5% below the midline.
After leaving the midline → protect profit (move stop to break-even).
To the KC1 upper band → take profit 50%, and simultaneously move the stop loss up.
If it falls back below the key level again → exit the remaining position.
3. Shorting
The logic is completely the opposite.
Price rallies to the KC2 upper band → then pulls back and breaks below the KC1 upper band → enter short.
Stop loss: Near the KC2 upper band.
If it doesn’t break below the KC1 upper band, don’t try to top-tick early.
In a strong trend, the easiest way to lose money is to see “it’s gone up too much” and open a short immediately.
Finally, remember these 4 rules:
The larger time frame sets the direction; the smaller time frame finds the entry.
KC1 is for the first target; KC2 is for extreme areas.
Whenever you open a position, you must have a stop loss; after you’re in profit, gradually move the stop loss up.
Light position sizing, staged entries—better to miss than to hold a losing position.
KC helps me judge trend, position, and momentum—not a 100% win-rate indicator.
In the market, living longer matters more than making more profit on any single trade.
$BTC
{future}(BTCUSDT)
$ETH
{future}(ETHUSDT)
$HYPE
{future}(HYPEUSDT)
#MichaelSaylor暗示增持BTC
☆ Kent Channel Line Trading Strategy
Indicator: Keltner Channel (KC)
Parameters:
KC1: Length 50, multiplier 2.75
KC2: Length 50, multiplier 3.75, turn off the midline
The core is just one sentence: The larger time frame determines the direction; the smaller time frame finds the entry position.
Time-frame relationship:
15m looks at 1H → 1H looks at 4H → 4H looks at the daily chart → the daily chart looks at the weekly chart
When the larger time frame is trending up, only look for longs.
When the larger time frame is trending down, only look for shorts.
The smaller time frame runs opposite to the larger time frame—treat it as a retracement first.
1. Buy on Pullbacks
Prerequisite: The larger time frame cannot be a clearly bearish trend.
Price breaks below the KC2 lower band → then pulls back and breaks above the KC1 lower band → enter long.
Stop loss: Near the KC2 lower band.
After departing from the lower band: Move stop loss to break-even.
To the midline: Take profit 50%.
Break above the midline: Move stop loss to the midline.
To the KC1 upper band: Manage the remaining position based on momentum.
2. Trend Longs
In a strong uptrend, it is likely that price won’t give you an opportunity to reach the KC2 lower band—then focus on the midline.
Price breaks above the midline from below → enter long.
Stop loss: About 0.3%–0.5% below the midline.
After leaving the midline → protect profit (move stop to break-even).
To the KC1 upper band → take profit 50%, and simultaneously move the stop loss up.
If it falls back below the key level again → exit the remaining position.
3. Shorting
The logic is completely the opposite.
Price rallies to the KC2 upper band → then pulls back and breaks below the KC1 upper band → enter short.
Stop loss: Near the KC2 upper band.
If it doesn’t break below the KC1 upper band, don’t try to top-tick early.
In a strong trend, the easiest way to lose money is to see “it’s gone up too much” and open a short immediately.
Finally, remember these 4 rules:
The larger time frame sets the direction; the smaller time frame finds the entry.
KC1 is for the first target; KC2 is for extreme areas.
Whenever you open a position, you must have a stop loss; after you’re in profit, gradually move the stop loss up.
Light position sizing, staged entries—better to miss than to hold a losing position.
KC helps me judge trend, position, and momentum—not a 100% win-rate indicator.
In the market, living longer matters more than making more profit on any single trade.
$BTC
$ETH
$HYPE
#MichaelSaylor暗示增持BTC
Indicator: Keltner Channel (KC)
Parameters:
KC1: Length 50, multiplier 2.75
KC2: Length 50, multiplier 3.75, turn off the midline
The core is just one sentence: The larger time frame determines the direction; the smaller time frame finds the entry position.
Time-frame relationship:
15m looks at 1H → 1H looks at 4H → 4H looks at the daily chart → the daily chart looks at the weekly chart
When the larger time frame is trending up, only look for longs.
When the larger time frame is trending down, only look for shorts.
The smaller time frame runs opposite to the larger time frame—treat it as a retracement first.
1. Buy on Pullbacks
Prerequisite: The larger time frame cannot be a clearly bearish trend.
Price breaks below the KC2 lower band → then pulls back and breaks above the KC1 lower band → enter long.
Stop loss: Near the KC2 lower band.
After departing from the lower band: Move stop loss to break-even.
To the midline: Take profit 50%.
Break above the midline: Move stop loss to the midline.
To the KC1 upper band: Manage the remaining position based on momentum.
2. Trend Longs
In a strong uptrend, it is likely that price won’t give you an opportunity to reach the KC2 lower band—then focus on the midline.
Price breaks above the midline from below → enter long.
Stop loss: About 0.3%–0.5% below the midline.
After leaving the midline → protect profit (move stop to break-even).
To the KC1 upper band → take profit 50%, and simultaneously move the stop loss up.
If it falls back below the key level again → exit the remaining position.
3. Shorting
The logic is completely the opposite.
Price rallies to the KC2 upper band → then pulls back and breaks below the KC1 upper band → enter short.
Stop loss: Near the KC2 upper band.
If it doesn’t break below the KC1 upper band, don’t try to top-tick early.
In a strong trend, the easiest way to lose money is to see “it’s gone up too much” and open a short immediately.
Finally, remember these 4 rules:
The larger time frame sets the direction; the smaller time frame finds the entry.
KC1 is for the first target; KC2 is for extreme areas.
Whenever you open a position, you must have a stop loss; after you’re in profit, gradually move the stop loss up.
Light position sizing, staged entries—better to miss than to hold a losing position.
KC helps me judge trend, position, and momentum—not a 100% win-rate indicator.
In the market, living longer matters more than making more profit on any single trade.
$BTC
$ETH
$HYPE
#MichaelSaylor暗示增持BTC
1
288
·
--
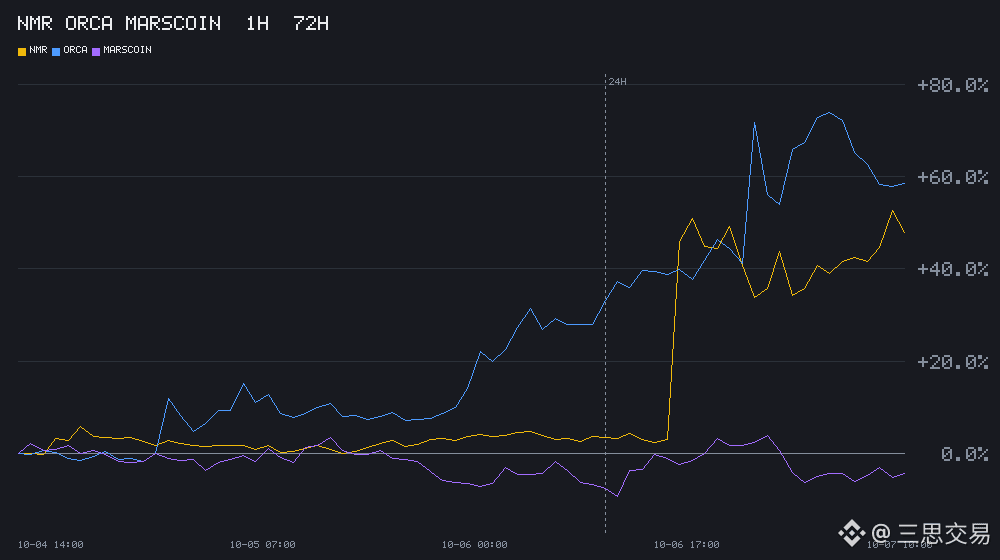
The three biggest gainers over the past 24 hours; the top one rose 43.71%.
$NMR +43.71%, trading volume 40.95 million
$ORCA +22.70%, trading volume 49.48 million
$MARSCOIN +3.43%, trading volume 20.75 million
$NMR 's funding rate is -0.5235%; shorts are paying longs.
BTC was down 1.79% over the same period; among those with trading volume above 20 million, 26 were up, including 5.
These three saw a total of 760,000 trades in 24 hours. Volume isn't keeping up, so I'm not convinced by this kind of rally.
$NMR $ORCA $MARSCOIN #Crypto
The three biggest gainers over the past 24 hours; the top one rose 43.71%.
$NMR +43.71%, trading volume 40.95 million
$ORCA +22.70%, trading volume 49.48 million
$MARSCOIN +3.43%, trading volume 20.75 million
$NMR 's funding rate is -0.5235%; shorts are paying longs.
BTC was down 1.79% over the same period; among those with trading volume above 20 million, 26 were up, including 5.
These three saw a total of 760,000 trades in 24 hours. Volume isn't keeping up, so I'm not convinced by this kind of rally.
$NMR $ORCA $MARSCOIN #Crypto
$NMR +43.71%, trading volume 40.95 million
$ORCA +22.70%, trading volume 49.48 million
$MARSCOIN +3.43%, trading volume 20.75 million
$NMR 's funding rate is -0.5235%; shorts are paying longs.
BTC was down 1.79% over the same period; among those with trading volume above 20 million, 26 were up, including 5.
These three saw a total of 760,000 trades in 24 hours. Volume isn't keeping up, so I'm not convinced by this kind of rally.
$NMR $ORCA $MARSCOIN #Crypto
136
·
--
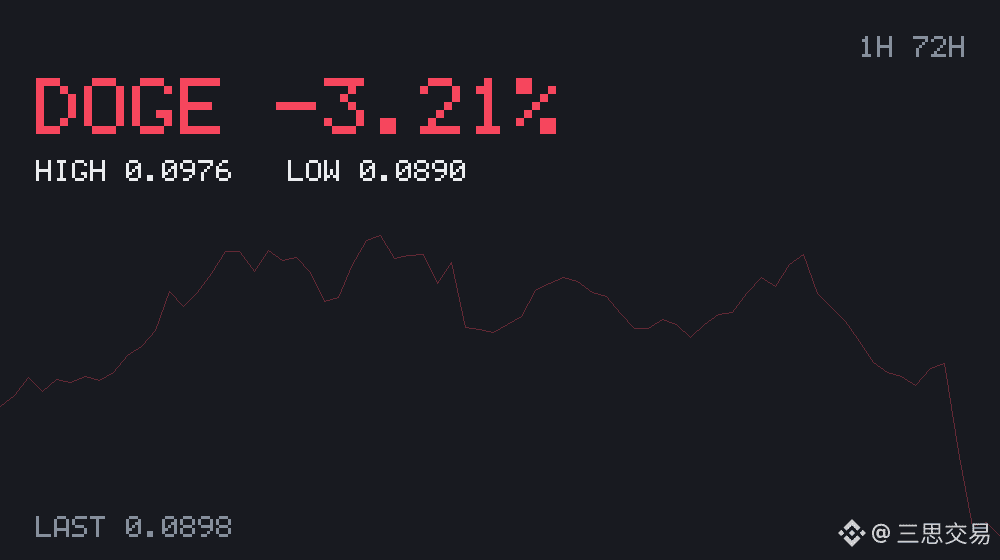
Whales' long positions on $DOGE account for 79.47%, with a long/short ratio of 3.8701; the current price is 0.08983, down 5.20% in 24 hours.
This figure is based on the amount of money, not the number of people, so it shows which side the positions are on.
With this positioning structure, the price can move more easily in the direction of least resistance. Good-looking data and money flowing in are two different things; I keep them fairly separate.
$DOGE #Dogecoin
Whales' long positions on $DOGE account for 79.47%, with a long/short ratio of 3.8701; the current price is 0.08983, down 5.20% in 24 hours.
This figure is based on the amount of money, not the number of people, so it shows which side the positions are on.
With this positioning structure, the price can move more easily in the direction of least resistance. Good-looking data and money flowing in are two different things; I keep them fairly separate.
$DOGE #Dogecoin
This figure is based on the amount of money, not the number of people, so it shows which side the positions are on.
With this positioning structure, the price can move more easily in the direction of least resistance. Good-looking data and money flowing in are two different things; I keep them fairly separate.
$DOGE #Dogecoin
61
·
--
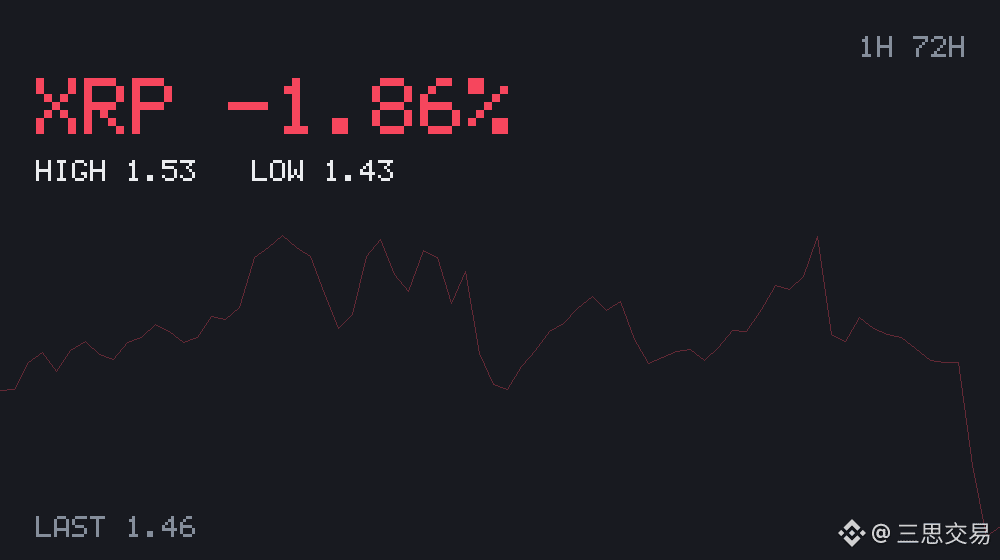
Long positions in contract accounts make up 72.82% of $XRP , with a long/short ratio of 2.6792. By number of traders, the market is clearly skewed to one side.
The current price is 1.464, down 2.26% over 24 hours, with a trading volume of 180 million USDT.
When the number of traders is this skewed, it usually means those on the opposite side are holding larger positions. I care more about whether the price can hold up over the next few days; a single day's move doesn't mean much.
$XRP #Ripple
Long positions in contract accounts make up 72.82% of $XRP , with a long/short ratio of 2.6792. By number of traders, the market is clearly skewed to one side.
The current price is 1.464, down 2.26% over 24 hours, with a trading volume of 180 million USDT.
When the number of traders is this skewed, it usually means those on the opposite side are holding larger positions. I care more about whether the price can hold up over the next few days; a single day's move doesn't mean much.
$XRP #Ripple
The current price is 1.464, down 2.26% over 24 hours, with a trading volume of 180 million USDT.
When the number of traders is this skewed, it usually means those on the opposite side are holding larger positions. I care more about whether the price can hold up over the next few days; a single day's move doesn't mean much.
$XRP #Ripple
75
·
--
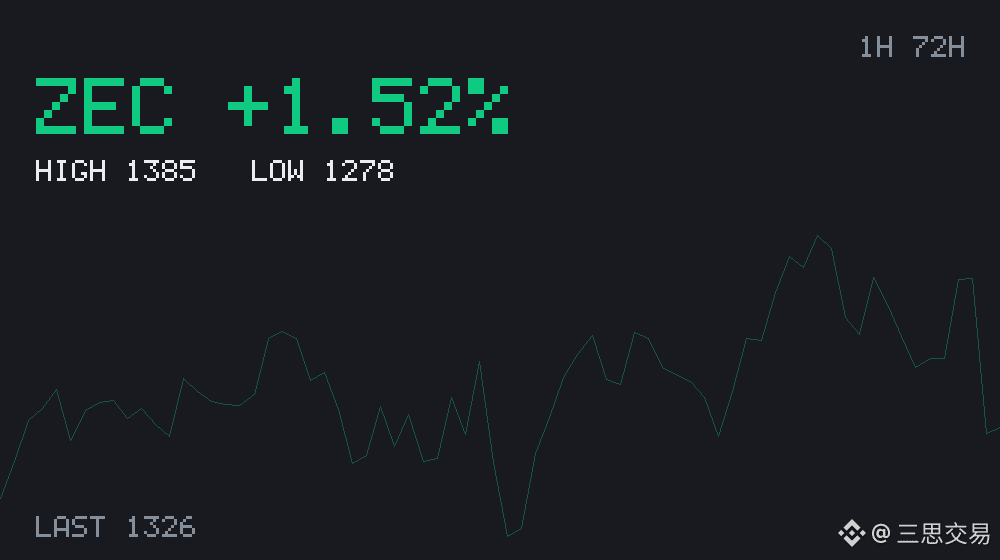
$ZEC The positioning on the two sides doesn’t line up: 39.50% of retail traders are long, compared with 62.45% of large traders—a gap of 22.95 percentage points.
The current price is 1325, down 1.39% over 24 hours.
Its 24-hour trading volume is 172 million USDT, putting it among the higher-ranked assets that meet the threshold.
With such a large gap, one metric counts traders while the other measures positions. This time, the side with larger positions is more heavily skewed long.
This mismatch doesn’t predict market direction; it shows that the two groups have very different position structures. My own rule is: the noisier the market gets, the smaller my moves.
$ZEC #Crypto
$ZEC The positioning on the two sides doesn’t line up: 39.50% of retail traders are long, compared with 62.45% of large traders—a gap of 22.95 percentage points.
The current price is 1325, down 1.39% over 24 hours.
Its 24-hour trading volume is 172 million USDT, putting it among the higher-ranked assets that meet the threshold.
With such a large gap, one metric counts traders while the other measures positions. This time, the side with larger positions is more heavily skewed long.
This mismatch doesn’t predict market direction; it shows that the two groups have very different position structures. My own rule is: the noisier the market gets, the smaller my moves.
$ZEC #Crypto
The current price is 1325, down 1.39% over 24 hours.
Its 24-hour trading volume is 172 million USDT, putting it among the higher-ranked assets that meet the threshold.
With such a large gap, one metric counts traders while the other measures positions. This time, the side with larger positions is more heavily skewed long.
This mismatch doesn’t predict market direction; it shows that the two groups have very different position structures. My own rule is: the noisier the market gets, the smaller my moves.
$ZEC #Crypto
108
·
--
October 7 | Crypto Morning Brief
$BTC $85470 -0.57% Volume $1.089 billion
$ETH $2695 -0.78% Volume $623 million
$SOL $120.40 -0.55% Volume $176 million
Total crypto market cap $2.93 trillion 24h trading volume $64,990.1 billion BTC dominance 58.7% (24h -3.05%)
Three things to watch:
· October 7: U.S. Federal Reserve interest rate decision
· October 8: Bank of England Governor Bailey speaks
· October 9: Canada Employment Change (forecast: 6.2K)
View: All three closed lower, moving broadly in sync, with none clearly singled out for a sell-off. This looks more like overall sentiment than an issue specific to any one coin.
Risk warning: Crypto assets are highly volatile. The above is a compilation of publicly available data and does not constitute investment advice.
$BTC $ETH $SOL #Ethereum
October 7 | Crypto Morning Brief
$BTC $85470 -0.57% Volume $1.089 billion
$ETH $2695 -0.78% Volume $623 million
$SOL $120.40 -0.55% Volume $176 million
Total crypto market cap $2.93 trillion 24h trading volume $64,990.1 billion BTC dominance 58.7% (24h -3.05%)
Three things to watch:
· October 7: U.S. Federal Reserve interest rate decision
· October 8: Bank of England Governor Bailey speaks
· October 9: Canada Employment Change (forecast: 6.2K)
View: All three closed lower, moving broadly in sync, with none clearly singled out for a sell-off. This looks more like overall sentiment than an issue specific to any one coin.
Risk warning: Crypto assets are highly volatile. The above is a compilation of publicly available data and does not constitute investment advice.
$BTC $ETH $SOL #Ethereum
$BTC $85470 -0.57% Volume $1.089 billion
$ETH $2695 -0.78% Volume $623 million
$SOL $120.40 -0.55% Volume $176 million
Total crypto market cap $2.93 trillion 24h trading volume $64,990.1 billion BTC dominance 58.7% (24h -3.05%)
Three things to watch:
· October 7: U.S. Federal Reserve interest rate decision
· October 8: Bank of England Governor Bailey speaks
· October 9: Canada Employment Change (forecast: 6.2K)
View: All three closed lower, moving broadly in sync, with none clearly singled out for a sell-off. This looks more like overall sentiment than an issue specific to any one coin.
Risk warning: Crypto assets are highly volatile. The above is a compilation of publicly available data and does not constitute investment advice.
$BTC $ETH $SOL #Ethereum
87
·
--
$SOL had a trading volume of 176 million USDT, ranking No. 1 among all instruments, yet its price moved just +0.03% over 24 hours.
The current price is 120.77, with a 24-hour low of 118.88 and a high of 122.00. The funding rate for $SOL is 0.0100%, meaning longs are paying shorts.
With this kind of volume-price structure, a breakout in either direction would be easier to trade than continued choppy movement around the middle. I don't think that's a bad thing; it just needs a little time.
$SOL #Solana
$SOL had a trading volume of 176 million USDT, ranking No. 1 among all instruments, yet its price moved just +0.03% over 24 hours.
The current price is 120.77, with a 24-hour low of 118.88 and a high of 122.00. The funding rate for $SOL is 0.0100%, meaning longs are paying shorts.
With this kind of volume-price structure, a breakout in either direction would be easier to trade than continued choppy movement around the middle. I don't think that's a bad thing; it just needs a little time.
$SOL #Solana
The current price is 120.77, with a 24-hour low of 118.88 and a high of 122.00. The funding rate for $SOL is 0.0100%, meaning longs are paying shorts.
With this kind of volume-price structure, a breakout in either direction would be easier to trade than continued choppy movement around the middle. I don't think that's a bad thing; it just needs a little time.
$SOL #Solana
56
·
--
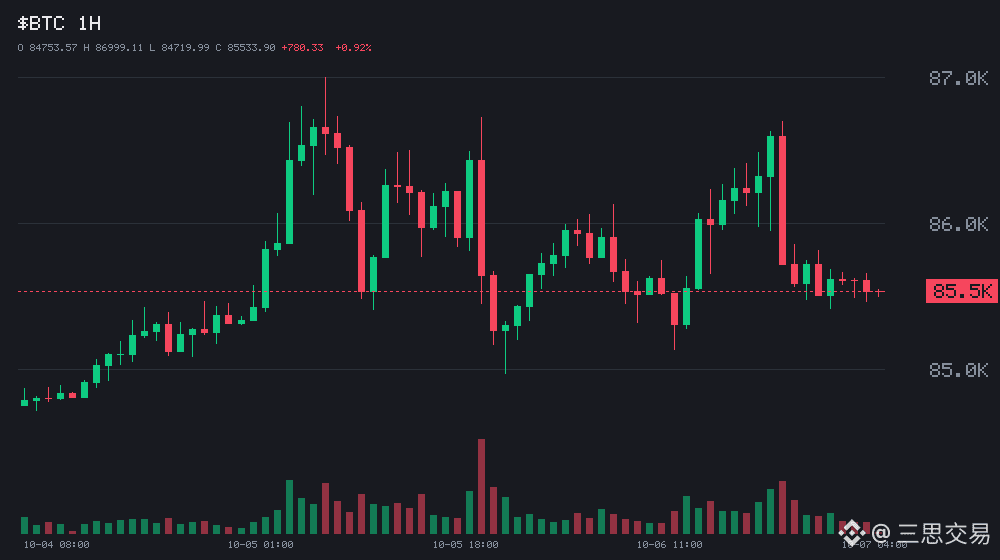
$BTC 24 hours: -0.45%, moving back and forth between 85136 and 86699.
Current price: 85534, trading volume: 1.072 billion USDT; over the same period, $ETH -0.64%.
On the futures side, $BTC funding rate is -0.0015%, so shorts are paying to keep their positions open.
These are the hardest days to trade: the more it moves, the more mistakes you make. Better to wait for it to finish moving through the range. The smoother the market looks, the more I lower my expectations.
$BTC $ETH #Ethereum
$BTC 24 hours: -0.45%, moving back and forth between 85136 and 86699.
Current price: 85534, trading volume: 1.072 billion USDT; over the same period, $ETH -0.64%.
On the futures side, $BTC funding rate is -0.0015%, so shorts are paying to keep their positions open.
These are the hardest days to trade: the more it moves, the more mistakes you make. Better to wait for it to finish moving through the range. The smoother the market looks, the more I lower my expectations.
$BTC $ETH #Ethereum
Current price: 85534, trading volume: 1.072 billion USDT; over the same period, $ETH -0.64%.
On the futures side, $BTC funding rate is -0.0015%, so shorts are paying to keep their positions open.
These are the hardest days to trade: the more it moves, the more mistakes you make. Better to wait for it to finish moving through the range. The smoother the market looks, the more I lower my expectations.
$BTC $ETH #Ethereum
10
·
--
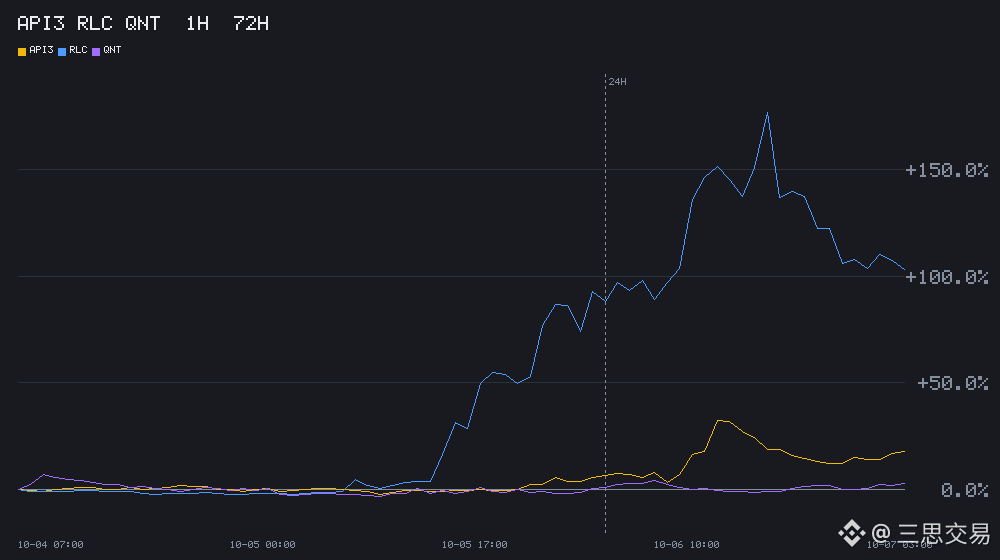
$API3 is up +10.13% today, making it the fastest mover in its sector.
Strongest sector: Infrastructure, 5 constituents, 24-hour median +2.29%.
Weakest sector: DeFi, 5 constituents, median -3.10%, a 5.39 percentage-point spread between the two ends.
The top performers are $API3 +10.13%, $RLC +4.02%, and $QNT +2.29%.
For the leader, $API3 , the funding rate is -0.2973%—shorts are paying longs.
When an entire sector starts moving, the ones that haven’t moved yet are often the last to get noticed. I’ve seen this setup a few times, and most of the time it needs to grind a bit longer.
$API3 $RLC $QNT #Crypto
$API3 is up +10.13% today, making it the fastest mover in its sector.
Strongest sector: Infrastructure, 5 constituents, 24-hour median +2.29%.
Weakest sector: DeFi, 5 constituents, median -3.10%, a 5.39 percentage-point spread between the two ends.
The top performers are $API3 +10.13%, $RLC +4.02%, and $QNT +2.29%.
For the leader, $API3 , the funding rate is -0.2973%—shorts are paying longs.
When an entire sector starts moving, the ones that haven’t moved yet are often the last to get noticed. I’ve seen this setup a few times, and most of the time it needs to grind a bit longer.
$API3 $RLC $QNT #Crypto
Strongest sector: Infrastructure, 5 constituents, 24-hour median +2.29%.
Weakest sector: DeFi, 5 constituents, median -3.10%, a 5.39 percentage-point spread between the two ends.
The top performers are $API3 +10.13%, $RLC +4.02%, and $QNT +2.29%.
For the leader, $API3 , the funding rate is -0.2973%—shorts are paying longs.
When an entire sector starts moving, the ones that haven’t moved yet are often the last to get noticed. I’ve seen this setup a few times, and most of the time it needs to grind a bit longer.
$API3 $RLC $QNT #Crypto
102
·
--
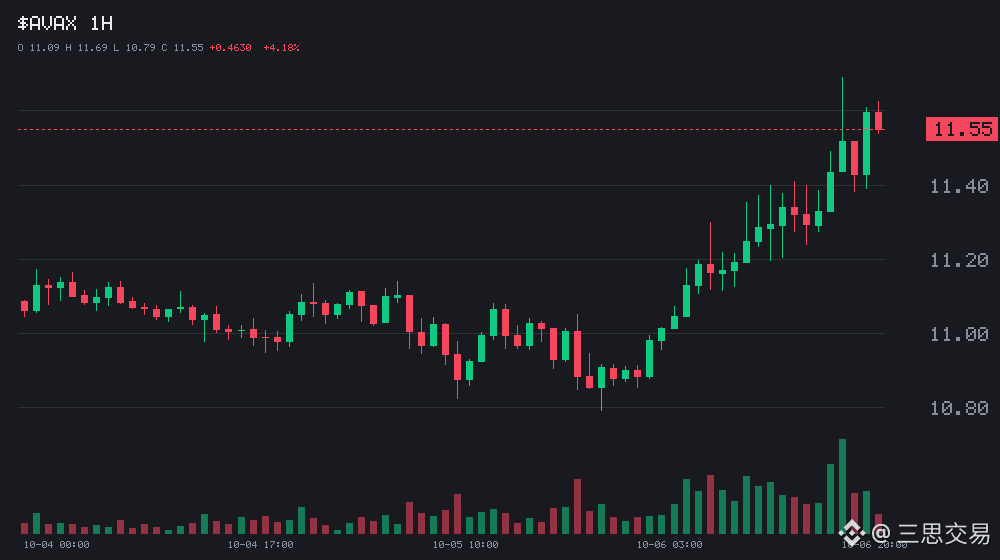
$AVAX 24-hour change: +5.62%; open interest in perpetual futures increased 3.41% over the same period.
The current price is 11.551, with a trading volume of 59.37 million USDT. Prices and open interest are rising together, suggesting that bulls are still adding to their positions.
Closing positions and opening positions in the opposite direction are two different things in the market, but the open-interest figure alone can't tell them apart. This figure doesn't mean much on its own; you need to track it over several days.
$AVAX #Cryptocurrency
$AVAX 24-hour change: +5.62%; open interest in perpetual futures increased 3.41% over the same period.
The current price is 11.551, with a trading volume of 59.37 million USDT. Prices and open interest are rising together, suggesting that bulls are still adding to their positions.
Closing positions and opening positions in the opposite direction are two different things in the market, but the open-interest figure alone can't tell them apart. This figure doesn't mean much on its own; you need to track it over several days.
$AVAX #Cryptocurrency
The current price is 11.551, with a trading volume of 59.37 million USDT. Prices and open interest are rising together, suggesting that bulls are still adding to their positions.
Closing positions and opening positions in the opposite direction are two different things in the market, but the open-interest figure alone can't tell them apart. This figure doesn't mean much on its own; you need to track it over several days.
$AVAX #Cryptocurrency
60
·
--
Shorts are paying longs: $NMR perpetual funding rate is -2.0000%, the most negative on the board.
Hold a position overnight at this rate, and shorts have to keep paying out every so often. Current price: 16.980, up 43.78% in 24 hours.
With shorts piled up like this, are they about to get squeezed, or have they spotted something others haven't? At this level, it's neither cheap nor expensive. I'd rather wait and see.
$NMR #Cryptocurrency
Shorts are paying longs: $NMR perpetual funding rate is -2.0000%, the most negative on the board.
Hold a position overnight at this rate, and shorts have to keep paying out every so often. Current price: 16.980, up 43.78% in 24 hours.
With shorts piled up like this, are they about to get squeezed, or have they spotted something others haven't? At this level, it's neither cheap nor expensive. I'd rather wait and see.
$NMR #Cryptocurrency
Hold a position overnight at this rate, and shorts have to keep paying out every so often. Current price: 16.980, up 43.78% in 24 hours.
With shorts piled up like this, are they about to get squeezed, or have they spotted something others haven't? At this level, it's neither cheap nor expensive. I'd rather wait and see.
$NMR #Cryptocurrency
130
·
--
Bullish
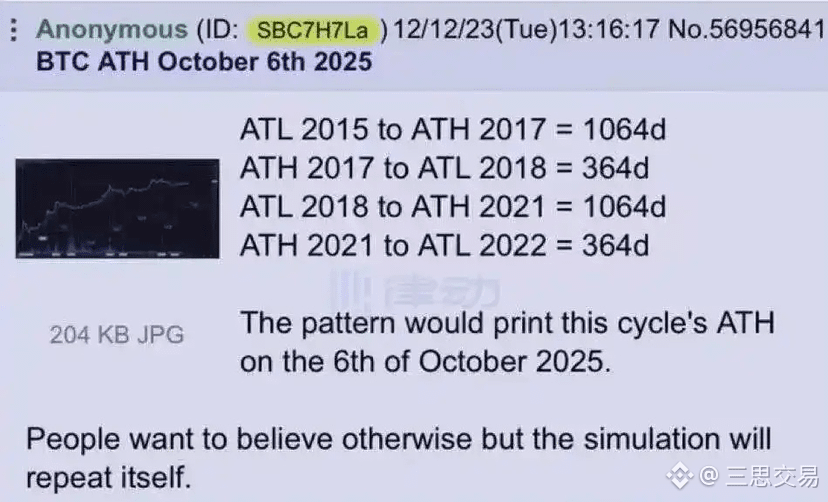
If Bitcoin’s four-year cycle still holds, the bear market may already be over.
The past two cycles followed a remarkably consistent pattern:
Bottom → peak: about 1,064 days
Peak → bottom: about 364 days
2015 low → 2017 high: about 1,064 days.
2017 high → 2018 low: about 364 days.
2018 low → 2021 high: about 1,064 days.
2021 high → 2022 low: about 364 days.
If we apply the same rhythm to the October 2025 peak, we’re now right in the window the market expects for a new cycle.
Quite a few traders have already started looking further ahead:
alicharts: BTC at $190,000, ETH at $8,800.
Peter Brandt believes Bitcoin has likely already hit its cycle low and has raised his target for the cycle peak at the end of 2029 to $300,000–$600,000. (Cointelegraph)
Trader Killa predicts that BTC could break above its all-time high again between April 26 and August 2, 2027. (Binance)
Of course, cycles aren’t formulas.
But if history rhymes again this time, the question worth exploring may no longer be how much further the bear market has to fall.
It may be where the next bull market will take us.$BTC
{future}(BTCUSDT)
$ETH
{future}(ETHUSDT)
If Bitcoin’s four-year cycle still holds, the bear market may already be over.
The past two cycles followed a remarkably consistent pattern:
Bottom → peak: about 1,064 days
Peak → bottom: about 364 days
2015 low → 2017 high: about 1,064 days.
2017 high → 2018 low: about 364 days.
2018 low → 2021 high: about 1,064 days.
2021 high → 2022 low: about 364 days.
If we apply the same rhythm to the October 2025 peak, we’re now right in the window the market expects for a new cycle.
Quite a few traders have already started looking further ahead:
alicharts: BTC at $190,000, ETH at $8,800.
Peter Brandt believes Bitcoin has likely already hit its cycle low and has raised his target for the cycle peak at the end of 2029 to $300,000–$600,000. (Cointelegraph)
Trader Killa predicts that BTC could break above its all-time high again between April 26 and August 2, 2027. (Binance)
Of course, cycles aren’t formulas.
But if history rhymes again this time, the question worth exploring may no longer be how much further the bear market has to fall.
It may be where the next bull market will take us.$BTC
$ETH
The past two cycles followed a remarkably consistent pattern:
Bottom → peak: about 1,064 days
Peak → bottom: about 364 days
2015 low → 2017 high: about 1,064 days.
2017 high → 2018 low: about 364 days.
2018 low → 2021 high: about 1,064 days.
2021 high → 2022 low: about 364 days.
If we apply the same rhythm to the October 2025 peak, we’re now right in the window the market expects for a new cycle.
Quite a few traders have already started looking further ahead:
alicharts: BTC at $190,000, ETH at $8,800.
Peter Brandt believes Bitcoin has likely already hit its cycle low and has raised his target for the cycle peak at the end of 2029 to $300,000–$600,000. (Cointelegraph)
Trader Killa predicts that BTC could break above its all-time high again between April 26 and August 2, 2027. (Binance)
Of course, cycles aren’t formulas.
But if history rhymes again this time, the question worth exploring may no longer be how much further the bear market has to fall.
It may be where the next bull market will take us.$BTC
$ETH
163
·
--
$FIL is strengthening against the trend: $BTC is falling, while it’s rising.
Over 24 hours, $FIL is up 10.17% and $BTC is down 0.84%—a gap of 11.02 percentage points.
The current price is 1.168, with 24.57 million USDT in trading volume. Spot buyers haven’t been idle either; trading has stayed steady throughout this stretch.
Plenty of coins rose on the same day. The hard part is rising while the broader market is falling—those are two different things. I tend to take a beat before joining the action.
$FIL $BTC #Bitcoin
$FIL is strengthening against the trend: $BTC is falling, while it’s rising.
Over 24 hours, $FIL is up 10.17% and $BTC is down 0.84%—a gap of 11.02 percentage points.
The current price is 1.168, with 24.57 million USDT in trading volume. Spot buyers haven’t been idle either; trading has stayed steady throughout this stretch.
Plenty of coins rose on the same day. The hard part is rising while the broader market is falling—those are two different things. I tend to take a beat before joining the action.
$FIL $BTC #Bitcoin
Over 24 hours, $FIL is up 10.17% and $BTC is down 0.84%—a gap of 11.02 percentage points.
The current price is 1.168, with 24.57 million USDT in trading volume. Spot buyers haven’t been idle either; trading has stayed steady throughout this stretch.
Plenty of coins rose on the same day. The hard part is rising while the broader market is falling—those are two different things. I tend to take a beat before joining the action.
$FIL $BTC #Bitcoin
184
·
--
Oct 6 | Crypto Morning Brief
$BTC $85914 -0.60% Volume 1.371 billion
$ETH $2715 -0.41% Volume 728 million
$SOL $121.01 -0.29% Volume 193 million
Total crypto market cap $2.94 trillion 24h trading volume $89.6 billion BTC dominance 58.7% (24h -2.40%)
Three things to watch:
· Oct 7: US Federal Reserve interest rate decision
· Oct 6: Japan BOJ Gov. Ueda speaks
· Oct 8: UK BOE Gov. Bailey speaks
View: All three closed lower, moving largely in sync, with none clearly left behind. This looks more like overall market sentiment than an issue specific to any one coin.
Risk warning: Crypto assets are highly volatile. The above is a compilation of publicly available data and does not constitute investment advice.
$BTC $ETH $SOL #Ethereum
Oct 6 | Crypto Morning Brief
$BTC $85914 -0.60% Volume 1.371 billion
$ETH $2715 -0.41% Volume 728 million
$SOL $121.01 -0.29% Volume 193 million
Total crypto market cap $2.94 trillion 24h trading volume $89.6 billion BTC dominance 58.7% (24h -2.40%)
Three things to watch:
· Oct 7: US Federal Reserve interest rate decision
· Oct 6: Japan BOJ Gov. Ueda speaks
· Oct 8: UK BOE Gov. Bailey speaks
View: All three closed lower, moving largely in sync, with none clearly left behind. This looks more like overall market sentiment than an issue specific to any one coin.
Risk warning: Crypto assets are highly volatile. The above is a compilation of publicly available data and does not constitute investment advice.
$BTC $ETH $SOL #Ethereum
$BTC $85914 -0.60% Volume 1.371 billion
$ETH $2715 -0.41% Volume 728 million
$SOL $121.01 -0.29% Volume 193 million
Total crypto market cap $2.94 trillion 24h trading volume $89.6 billion BTC dominance 58.7% (24h -2.40%)
Three things to watch:
· Oct 7: US Federal Reserve interest rate decision
· Oct 6: Japan BOJ Gov. Ueda speaks
· Oct 8: UK BOE Gov. Bailey speaks
View: All three closed lower, moving largely in sync, with none clearly left behind. This looks more like overall market sentiment than an issue specific to any one coin.
Risk warning: Crypto assets are highly volatile. The above is a compilation of publicly available data and does not constitute investment advice.
$BTC $ETH $SOL #Ethereum
212
·
--
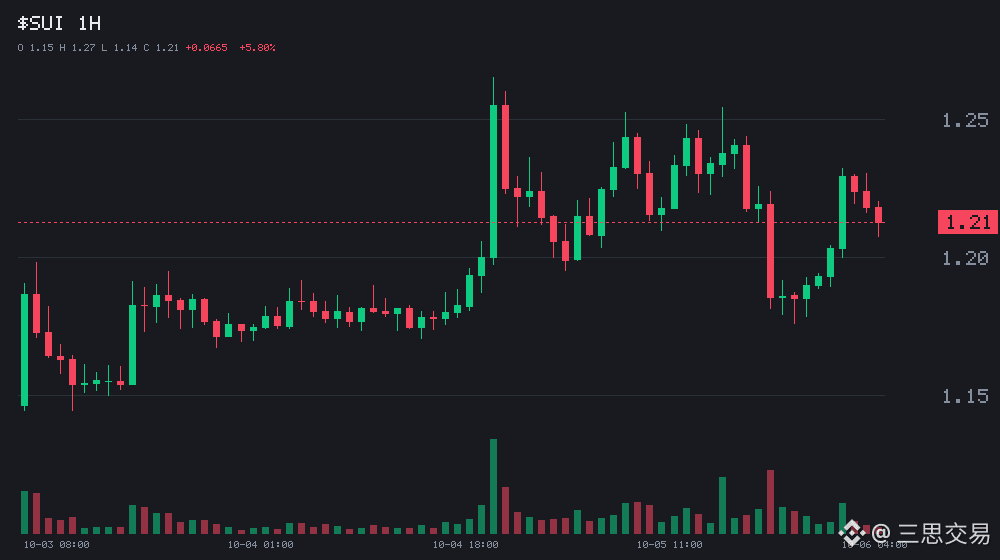
$SUI had a trading volume of 108 million USDT, ranking 6th among all assets, yet its price moved just +0.25% over 24 hours.
The current price is 1.213, with a 24-hour low of 1.176 and a high of 1.254. $SUI 's funding rate is 0.0100%, meaning longs are paying shorts.
Money is flowing in, but the price hasn't moved. That suggests neither bulls nor bears are willing to give ground at this level. I'm more interested in whether it can hold over the next few days; a single day's move doesn't count for much.
$SUI #Cryptocurrency
$SUI had a trading volume of 108 million USDT, ranking 6th among all assets, yet its price moved just +0.25% over 24 hours.
The current price is 1.213, with a 24-hour low of 1.176 and a high of 1.254. $SUI 's funding rate is 0.0100%, meaning longs are paying shorts.
Money is flowing in, but the price hasn't moved. That suggests neither bulls nor bears are willing to give ground at this level. I'm more interested in whether it can hold over the next few days; a single day's move doesn't count for much.
$SUI #Cryptocurrency
The current price is 1.213, with a 24-hour low of 1.176 and a high of 1.254. $SUI 's funding rate is 0.0100%, meaning longs are paying shorts.
Money is flowing in, but the price hasn't moved. That suggests neither bulls nor bears are willing to give ground at this level. I'm more interested in whether it can hold over the next few days; a single day's move doesn't count for much.
$SUI #Cryptocurrency
77
·
--
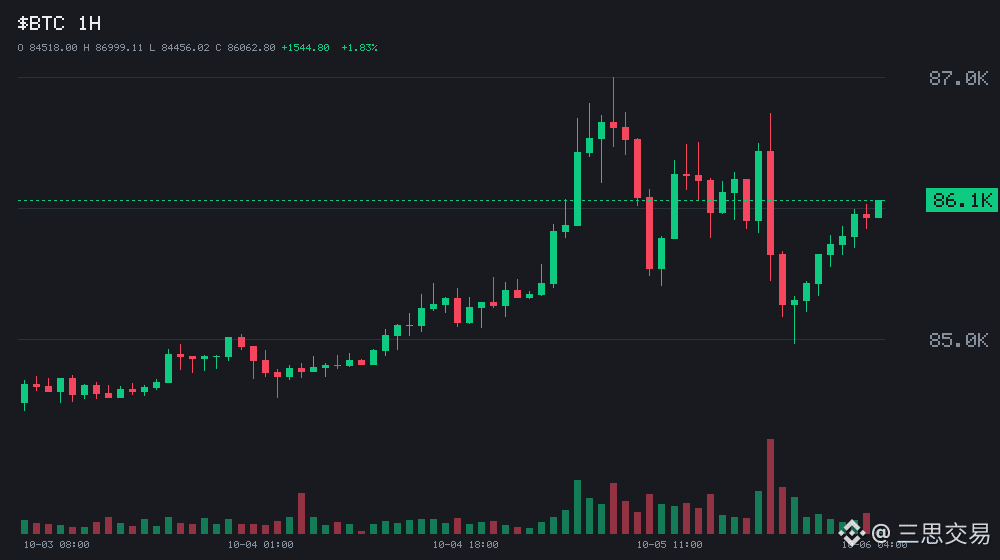
$BTC 24 hours: -0.47%, moving back and forth between 84972 and 86999.
Current price: 86063, trading volume: 1.429 billion USDT; over the same period, $ETH : -0.44%.
On the futures side, $BTC 's funding rate is -0.0016%, so shorts are paying to keep their positions open.
Until the range breaks, position matters more than direction. Don't keep getting battered trading back and forth in the middle. Rather than chasing the latest hot topic, I'd rather see whether anyone is buying consistently.
$BTC $ETH #Ethereum
$BTC 24 hours: -0.47%, moving back and forth between 84972 and 86999.
Current price: 86063, trading volume: 1.429 billion USDT; over the same period, $ETH : -0.44%.
On the futures side, $BTC 's funding rate is -0.0016%, so shorts are paying to keep their positions open.
Until the range breaks, position matters more than direction. Don't keep getting battered trading back and forth in the middle. Rather than chasing the latest hot topic, I'd rather see whether anyone is buying consistently.
$BTC $ETH #Ethereum
Current price: 86063, trading volume: 1.429 billion USDT; over the same period, $ETH : -0.44%.
On the futures side, $BTC 's funding rate is -0.0016%, so shorts are paying to keep their positions open.
Until the range breaks, position matters more than direction. Don't keep getting battered trading back and forth in the middle. Rather than chasing the latest hot topic, I'd rather see whether anyone is buying consistently.
$BTC $ETH #Ethereum
31
·
--
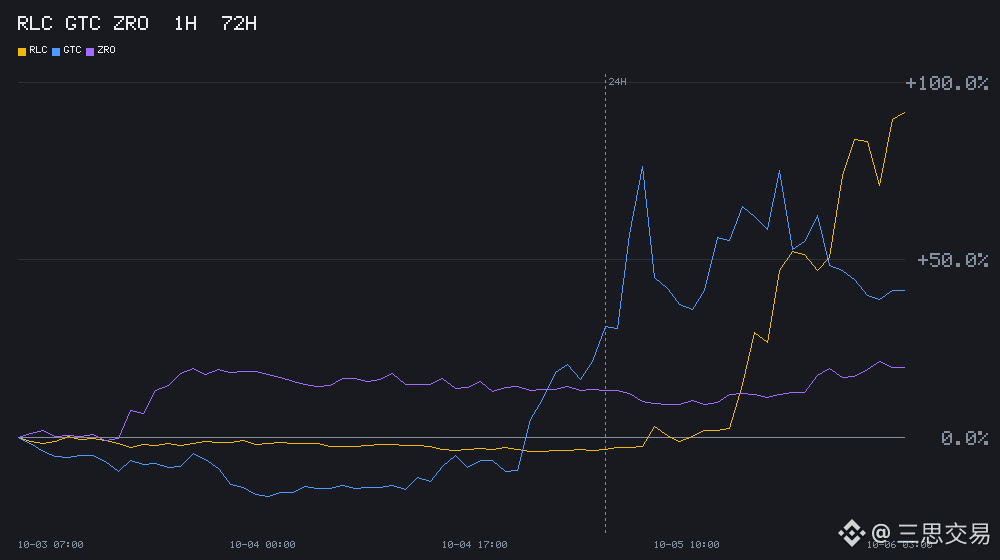
$RLC is up +98.32% today, making it the fastest mover in its sector.
Strongest sector: Infrastructure, with 8 members and a 24-hour median gain of +3.41%.
Weakest sector: RWA, with 3 members and a median loss of -0.36%, a 3.77-percentage-point gap between the two.
Leading the pack are $RLC at +98.32%, $GTC at +16.40%, and $ZRO at +4.98%.
For the leader, $RLC , the funding rate is -0.0159%, meaning shorts are paying longs.
When a whole sector starts moving, the ones within it that haven’t moved yet are often the last to get noticed. I tend to wait a beat when things get crowded.
$RLC $GTC $ZRO #cryptocurrency
$RLC is up +98.32% today, making it the fastest mover in its sector.
Strongest sector: Infrastructure, with 8 members and a 24-hour median gain of +3.41%.
Weakest sector: RWA, with 3 members and a median loss of -0.36%, a 3.77-percentage-point gap between the two.
Leading the pack are $RLC at +98.32%, $GTC at +16.40%, and $ZRO at +4.98%.
For the leader, $RLC , the funding rate is -0.0159%, meaning shorts are paying longs.
When a whole sector starts moving, the ones within it that haven’t moved yet are often the last to get noticed. I tend to wait a beat when things get crowded.
$RLC $GTC $ZRO #cryptocurrency
Strongest sector: Infrastructure, with 8 members and a 24-hour median gain of +3.41%.
Weakest sector: RWA, with 3 members and a median loss of -0.36%, a 3.77-percentage-point gap between the two.
Leading the pack are $RLC at +98.32%, $GTC at +16.40%, and $ZRO at +4.98%.
For the leader, $RLC , the funding rate is -0.0159%, meaning shorts are paying longs.
When a whole sector starts moving, the ones within it that haven’t moved yet are often the last to get noticed. I tend to wait a beat when things get crowded.
$RLC $GTC $ZRO #cryptocurrency
275
·
--
$MOVR 's perpetual mark price is 0.18% below spot, making it one of the most significantly deviated assets among those meeting today's threshold.
Mark price: 2.001; spot price: 2.005—a difference of 18 basis points. 24-hour change: +9.92%.
The perpetual is cheaper than spot, suggesting somewhat heavier selling pressure on the futures side.
This discount won't disappear on its own: either the perpetual price rises back up, or the spot price falls.
This spread doesn't predict direction; it only shows that the futures side is more urgent than spot. I've seen this pattern a few times, and most of the time it takes a while to play out.
$MOVR #Cryptocurrency
$MOVR 's perpetual mark price is 0.18% below spot, making it one of the most significantly deviated assets among those meeting today's threshold.
Mark price: 2.001; spot price: 2.005—a difference of 18 basis points. 24-hour change: +9.92%.
The perpetual is cheaper than spot, suggesting somewhat heavier selling pressure on the futures side.
This discount won't disappear on its own: either the perpetual price rises back up, or the spot price falls.
This spread doesn't predict direction; it only shows that the futures side is more urgent than spot. I've seen this pattern a few times, and most of the time it takes a while to play out.
$MOVR #Cryptocurrency
Mark price: 2.001; spot price: 2.005—a difference of 18 basis points. 24-hour change: +9.92%.
The perpetual is cheaper than spot, suggesting somewhat heavier selling pressure on the futures side.
This discount won't disappear on its own: either the perpetual price rises back up, or the spot price falls.
This spread doesn't predict direction; it only shows that the futures side is more urgent than spot. I've seen this pattern a few times, and most of the time it takes a while to play out.
$MOVR #Cryptocurrency
48
·
--
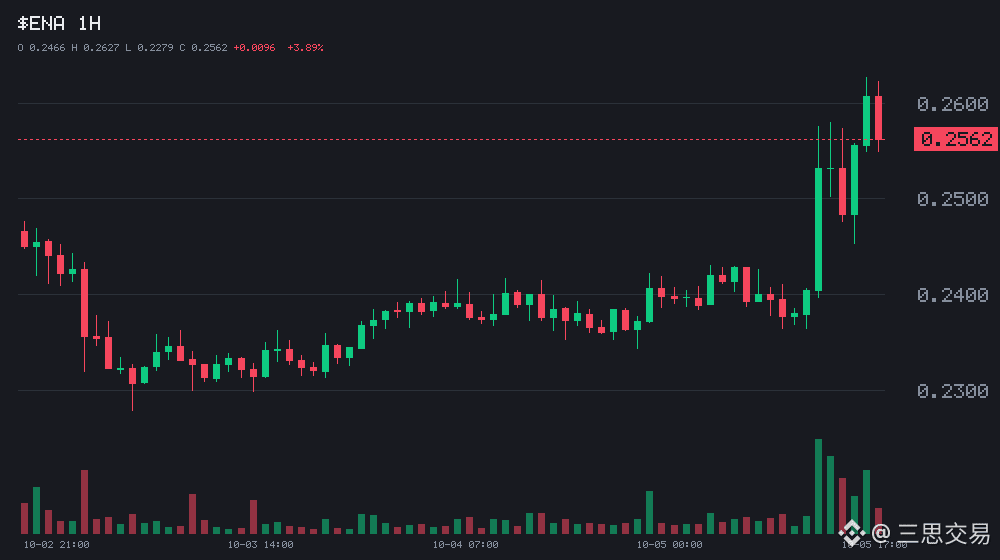
Over the past hour, aggressive selling in $ENA was 1.3441 times that of the other side.
When one side keeps taking orders until it reaches this ratio within an hour, it usually means someone is in a hurry—not that the volume came from scattered trades.
Current price: 0.25620, up 7.92% in 24 hours.
The direction of aggressive trades says more about who’s driving the price this hour than the trading volume itself. Good-looking data and money flowing in are two different things—I keep them separate.
$ENA #Cryptocurrency
Over the past hour, aggressive selling in $ENA was 1.3441 times that of the other side.
When one side keeps taking orders until it reaches this ratio within an hour, it usually means someone is in a hurry—not that the volume came from scattered trades.
Current price: 0.25620, up 7.92% in 24 hours.
The direction of aggressive trades says more about who’s driving the price this hour than the trading volume itself. Good-looking data and money flowing in are two different things—I keep them separate.
$ENA #Cryptocurrency
When one side keeps taking orders until it reaches this ratio within an hour, it usually means someone is in a hurry—not that the volume came from scattered trades.
Current price: 0.25620, up 7.92% in 24 hours.
The direction of aggressive trades says more about who’s driving the price this hour than the trading volume itself. Good-looking data and money flowing in are two different things—I keep them separate.
$ENA #Cryptocurrency
72
Log in to explore more content
Join global crypto users on Binance Square
⚡️ Get latest and useful information about crypto.
💬 Trusted by the world’s largest crypto exchange.
👍 Discover real insights from verified creators.
Email / Phone number
Trending Topics
BinanceLaunchesBinanceIntelligence
694,068 views
4,362 Discussing
#binancelaunchesbinanceintelligence 🚨 WHAT IF THE NEXT BIG EXCHANGE BATTLE ISN’T ABOUT FEES? 👀
Binance just made a bigger move than adding another AI chatbot.
With Binance Intelligence, AI is moving deeper into the exchange — from understanding market data to building trading workflows. 🤖⚡
The real question is:
Who has the best liquidity?
Or who has the smartest AI layer?
If users can research, test ideas and manage trading workflows without switching between different tools, the exchange itself could become a financial assistant.
That could be a much bigger shift than it looks today.
If Binance Intelligence drives more users, more strategies and more trading activity, $BNB could become one of the tokens to watch. 👀
Is Binance building the future of AI-powered finance?
$BNB
#binancelaunchesbinanceintelligence #BinanceAI #CryptoAI #AITrading
Suleman Khan Haqqani
·15 Likes
·21.7k views
BTCFallsBelow$84K
21,452 views
81 Discussing
DubaiVARAIssuesReserveAssetAuditCircular
2,908 views
234 Discussing