

TEKT0NIC 1
1.2k Posts

TEKT0NIC 1
Report
Block User
Passionate about crypto and blockchain | Crypto Enthusiastic | Technical Analysis | Fundamental News
0 Following
9 Followers
39 Liked
Posts
·
--
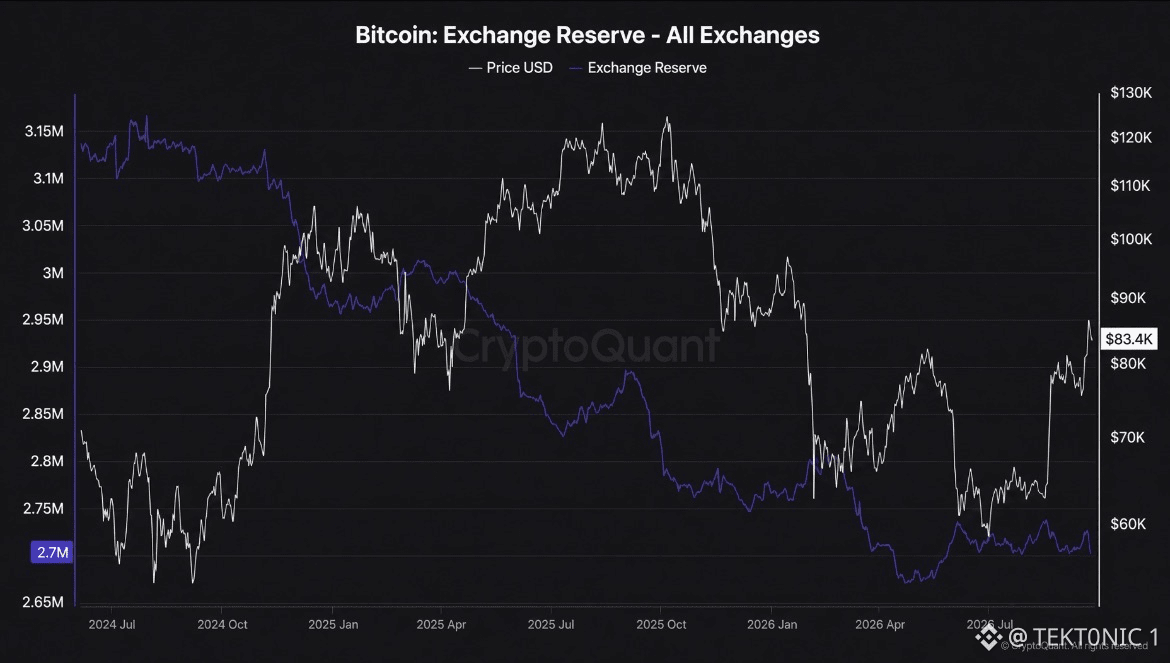
$BTC reserves on exchanges are sitting near multi-year lows. CryptoQuant’s all-exchange series is about 2.7 million BTC, down from roughly 3.15 million in mid-2024. the drop has been steady. Reserves fell through the 2024 rally, kept falling into the 2025 high near $126,000, and made a low around 2.67 million in April 2026. They have barely rebuilt since. Price on the chart is about $83,400, so the supply on exchanges did not snap back with the Q3 bounce. less Bitcoin on exchanges means less inventory sitting where a market sell can hit immediately. Some of that coin moved to cold storage. Some of it sits with ETF custodians, which this series does not count as exchange inventory. A lower reserve is tighter spot supply. It is not a guarantee that holders will not sell. price already fell from $126,000 to the low $60,000s while this reserve was declining. Scarcity did not stop that drawdown. now the focus is whether 2.7 million keeps grinding lower as price holds $86,000. a fresh drop under the April low would tighten supply again. A rebuild toward 2.8 million would mean coins are coming back to exchanges. The low is real. It still needs a bid. #BTC Price Analysis# #Bitcoin Price Prediction: What is Bitcoins next move?# $BTC $XRP #Macro Insights#
$BTC reserves on exchanges are sitting near multi-year lows. CryptoQuant’s all-exchange series is about 2.7 million BTC, down from roughly 3.15 million in mid-2024. the drop has been steady. Reserves fell through the 2024 rally, kept falling into the 2025 high near $126,000, and made a low around 2.67 million in April 2026. They have barely rebuilt since. Price on the chart is about $83,400, so the supply on exchanges did not snap back with the Q3 bounce. less Bitcoin on exchanges means less inventory sitting where a market sell can hit immediately. Some of that coin moved to cold storage. Some of it sits with ETF custodians, which this series does not count as exchange inventory. A lower reserve is tighter spot supply. It is not a guarantee that holders will not sell. price already fell from $126,000 to the low $60,000s while this reserve was declining. Scarcity did not stop that drawdown. now the focus is whether 2.7 million keeps grinding lower as price holds $86,000. a fresh drop under the April low would tighten supply again. A rebuild toward 2.8 million would mean coins are coming back to exchanges. The low is real. It still needs a bid. #BTC Price Analysis# #Bitcoin Price Prediction: What is Bitcoins next move?# $BTC $XRP #Macro Insights#
·
--
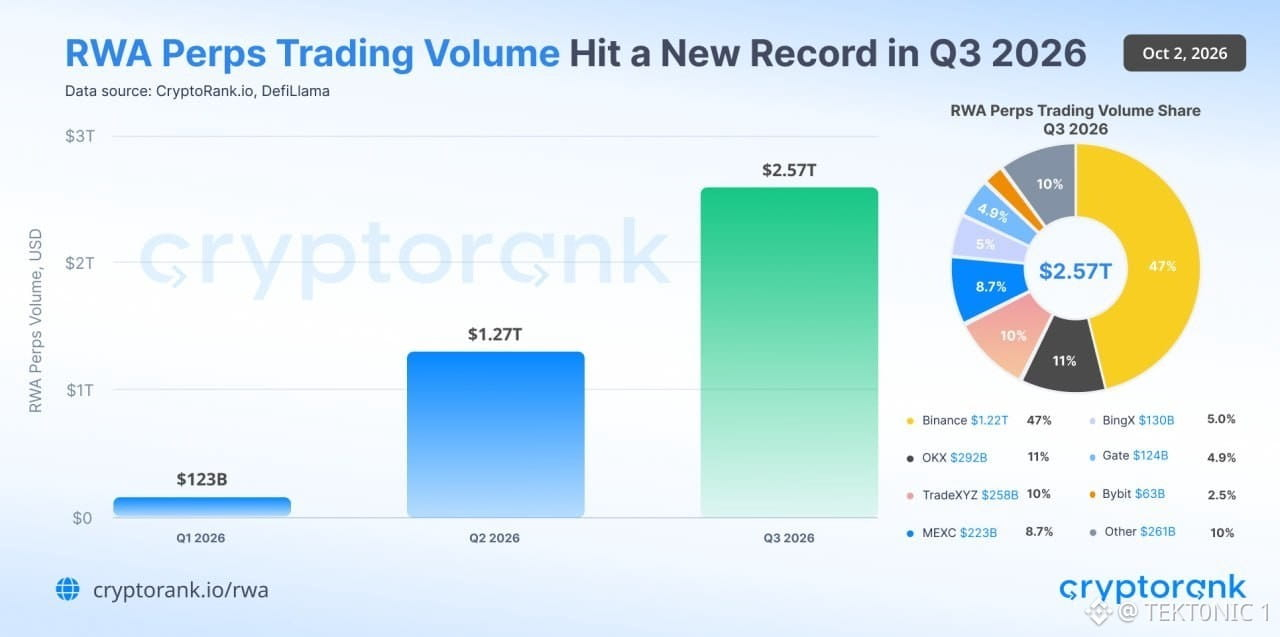
RWA perps just printed a record quarter. according to CryptoRank, trading volume reached $2.57 trillion in Q3 2026, more than double the $1.27 trillion in Q2. August alone was $957 billion. Binance led with $1.22 trillion, nearly half the market. Centralized exchanges took more than 80%. Perp DEXs did $365 billion, up 32% from the prior quarter. these are contracts on tokenized equities, commodities, and indices, not coins moving into custody. A perp can turn over the same exposure many times in a day. Weekend volume in the segment was already near $28 billion by mid-August, which is demand showing up when U.S. cash markets are closed. volume is not assets under management. Tokenized RWAs were about $34 billion in AUM by mid-September. The derivatives number is the larger one because traders are taking price exposure, not delivery. now the focus is whether Q4 holds the pace after an August spike that large. a second quarter above $2 trillion would show the market has settled at this size. One record quarter can still be a peak.
#BTC Price Analysis# #Bitcoin Price Prediction: What is Bitcoins next move?# $BTC $ETH #Bullish
RWA perps just printed a record quarter. according to CryptoRank, trading volume reached $2.57 trillion in Q3 2026, more than double the $1.27 trillion in Q2. August alone was $957 billion. Binance led with $1.22 trillion, nearly half the market. Centralized exchanges took more than 80%. Perp DEXs did $365 billion, up 32% from the prior quarter. these are contracts on tokenized equities, commodities, and indices, not coins moving into custody. A perp can turn over the same exposure many times in a day. Weekend volume in the segment was already near $28 billion by mid-August, which is demand showing up when U.S. cash markets are closed. volume is not assets under management. Tokenized RWAs were about $34 billion in AUM by mid-September. The derivatives number is the larger one because traders are taking price exposure, not delivery. now the focus is whether Q4 holds the pace after an August spike that large. a second quarter above $2 trillion would show the market has settled at this size. One record quarter can still be a peak.
#BTC Price Analysis# #Bitcoin Price Prediction: What is Bitcoins next move?# $BTC $ETH #Bullish
#BTC Price Analysis# #Bitcoin Price Prediction: What is Bitcoins next move?# $BTC $ETH #Bullish
·
--
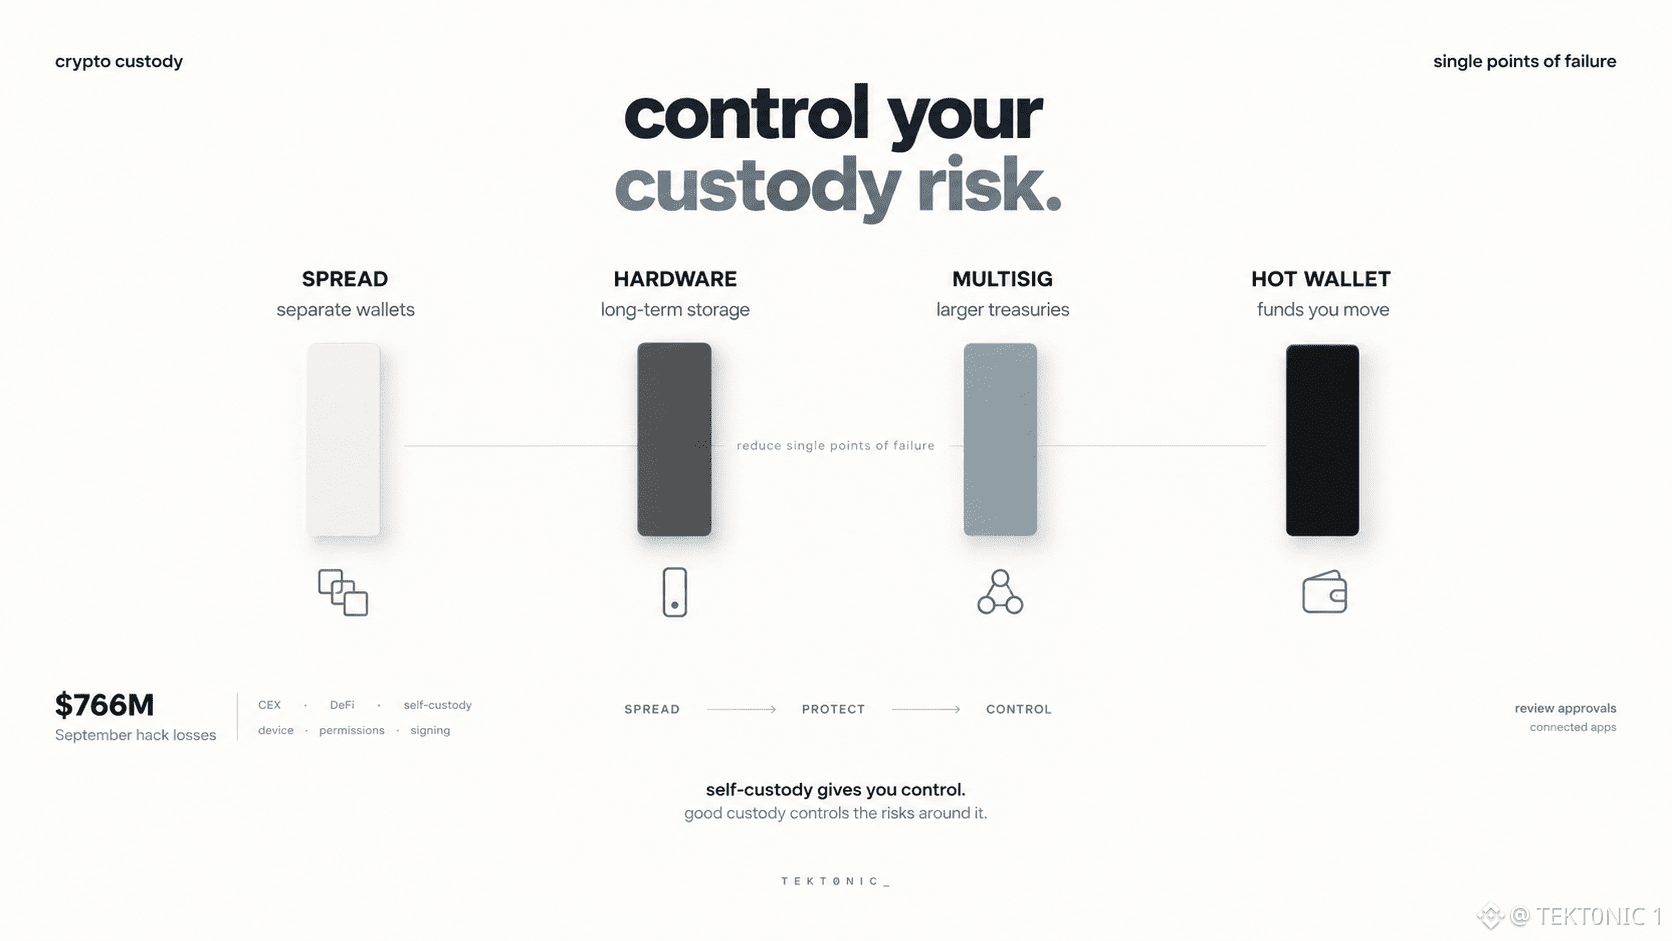
crypto custody is getting harder to think about as a simple “where do i keep my funds?” question. CEXs can be hacked. DeFi protocols can be exploited. even self-custody can introduce new risks if the device, permissions or signing setup is compromised. September alone saw around $766M in crypto hack losses, according to CertiK’s tracking. and the problem isn’t limited to one type of platform. the answer isn’t finding one “perfect” wallet. it’s reducing single points of failure. → spread larger holdings across separate wallets → use hardware wallets for long-term storage → use multisig for larger treasuries → keep hot wallets for funds you actually need to move → review approvals and connected apps regularly self-custody gives you control. but good custody is about controlling the risks around that control. #BTC Price Analysis# #Bitcoin Price Prediction: What is Bitcoins next move?# $BTC $XRP #Macro Insights#
crypto custody is getting harder to think about as a simple “where do i keep my funds?” question. CEXs can be hacked. DeFi protocols can be exploited. even self-custody can introduce new risks if the device, permissions or signing setup is compromised. September alone saw around $766M in crypto hack losses, according to CertiK’s tracking. and the problem isn’t limited to one type of platform. the answer isn’t finding one “perfect” wallet. it’s reducing single points of failure. → spread larger holdings across separate wallets → use hardware wallets for long-term storage → use multisig for larger treasuries → keep hot wallets for funds you actually need to move → review approvals and connected apps regularly self-custody gives you control. but good custody is about controlling the risks around that control. #BTC Price Analysis# #Bitcoin Price Prediction: What is Bitcoins next move?# $BTC $XRP #Macro Insights#
·
--
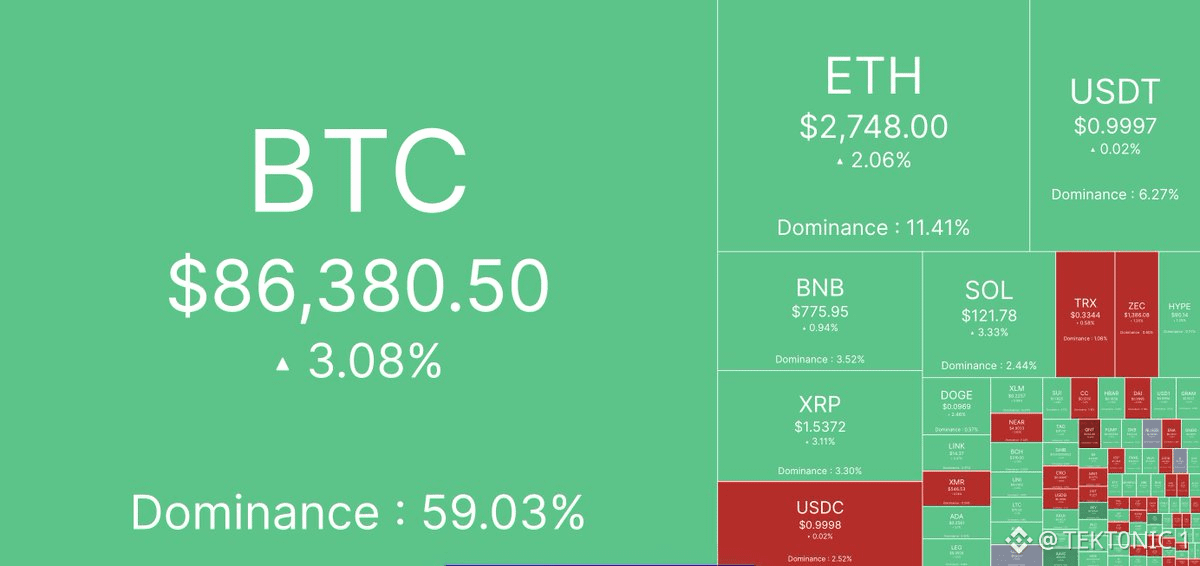
Bitcoin Is Back at $86,381 as About $244 Million of Shorts Were Closed in 24 Hours. $ETH is $2,748 and Solana is $121.78. $BTC still holds most of the board. According to the market map, Bitcoin is leading the bounce and dominance is still near 59%. The 24-hour short liquidations landed with that rebound, after the softer PCE reading and the move back through $85,000. Alts are green with it, not ahead of it. Key Details: > Bitcoin: $86,380.50, +3.08%, dominance 59.03%. > Ether: $2,748, +2.06%, dominance 11.41%. > Solana: $121.78, +3.33%, dominance 2.44%. > XRP: $1.5372, +3.31%. > 24-hour short liquidations: about $244 million. $87,000 is the recent high. Hold $85,000 and this rebound stays intact. Lose it and the short covering was only a one-day bid. $BTC $86,381, $ETH $2,748, SOL $122. $244M Shorts Closed in 24 Hours. Do you add on this $86,000 reclaim, or wait for a daily close above $87,000? #BTC Price Analysis# #Bitcoin Price Prediction: What is Bitcoins next move?# #Altcoin Season#
Bitcoin Is Back at $86,381 as About $244 Million of Shorts Were Closed in 24 Hours. $ETH is $2,748 and Solana is $121.78. $BTC still holds most of the board. According to the market map, Bitcoin is leading the bounce and dominance is still near 59%. The 24-hour short liquidations landed with that rebound, after the softer PCE reading and the move back through $85,000. Alts are green with it, not ahead of it. Key Details: > Bitcoin: $86,380.50, +3.08%, dominance 59.03%. > Ether: $2,748, +2.06%, dominance 11.41%. > Solana: $121.78, +3.33%, dominance 2.44%. > XRP: $1.5372, +3.31%. > 24-hour short liquidations: about $244 million. $87,000 is the recent high. Hold $85,000 and this rebound stays intact. Lose it and the short covering was only a one-day bid. $BTC $86,381, $ETH $2,748, SOL $122. $244M Shorts Closed in 24 Hours. Do you add on this $86,000 reclaim, or wait for a daily close above $87,000? #BTC Price Analysis# #Bitcoin Price Prediction: What is Bitcoins next move?# #Altcoin Season#
·
--
Strategy Just Passed Saudi National Bank to Rank 385th Among Public Companies. $BTC Treasuries put the Bitcoin treasury name ahead of the Saudi lender. According to that ranking, the jump follows the equity rebound that took market value from $39.3 billion on June 22 to $70.9 billion on September 21, while Bitcoin traded back through $85,000. Rank is market value, not earnings. It still puts a Bitcoin balance sheet next to a major bank. Key Details: > New rank: 385th-largest public company. > Passed: Saudi National Bank. > Source: BTC Treasuries. > Holdings: 845,100 BTC. Passing a national bank is a size milestone. It is still a Bitcoin mark. If $85,000 holds, the rank can stay. If Bitcoin loses $84,000, that place in the table can slip back. Strategy: 385th-Largest Public Company, Ahead of Saudi National Bank. Does a bank-sized rank change how you view Strategy, or do you still only watch the 845,100 $BTC stack? #BTC Price Analysis# #Bitcoin Price Prediction: What is Bitcoins next move?# $ETH #Macro Insights#
Strategy Just Passed Saudi National Bank to Rank 385th Among Public Companies. $BTC Treasuries put the Bitcoin treasury name ahead of the Saudi lender. According to that ranking, the jump follows the equity rebound that took market value from $39.3 billion on June 22 to $70.9 billion on September 21, while Bitcoin traded back through $85,000. Rank is market value, not earnings. It still puts a Bitcoin balance sheet next to a major bank. Key Details: > New rank: 385th-largest public company. > Passed: Saudi National Bank. > Source: BTC Treasuries. > Holdings: 845,100 BTC. Passing a national bank is a size milestone. It is still a Bitcoin mark. If $85,000 holds, the rank can stay. If Bitcoin loses $84,000, that place in the table can slip back. Strategy: 385th-Largest Public Company, Ahead of Saudi National Bank. Does a bank-sized rank change how you view Strategy, or do you still only watch the 845,100 $BTC stack? #BTC Price Analysis# #Bitcoin Price Prediction: What is Bitcoins next move?# $ETH #Macro Insights#

·
--
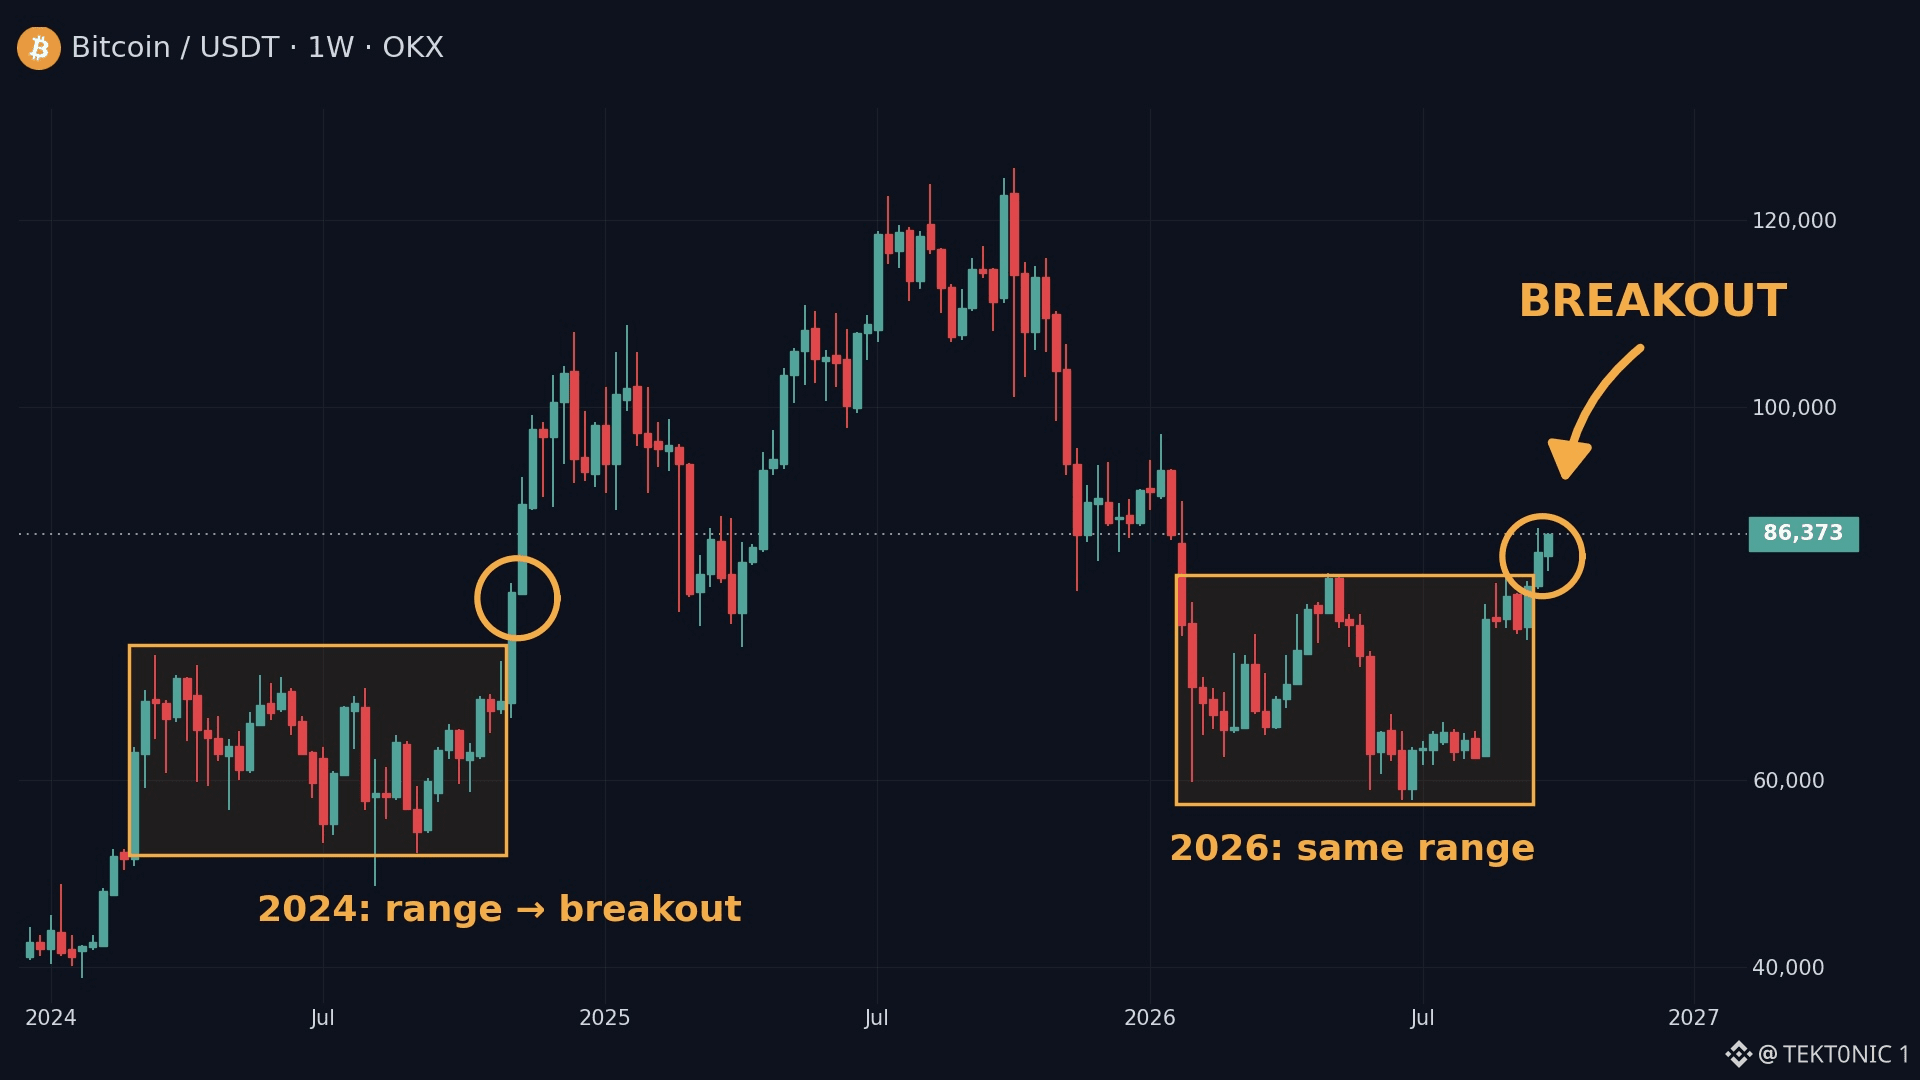
$BTC has broken out of the range that held it for about seven months. on the weekly chart, price is back through $86,373 after spending 2026 between the low-$60,000s and the mid-$80,000s. The same kind of range showed up in 2024. Once that one broke, Bitcoin reached $100,000 within about five weeks. That is the comparison the chart is drawing. this break is not the same market. In 2024 the range sat under a new high. This one sits under the 2025 peak near $126,000, after Q1 and Q2 losses and a 42.6% Q3. Spot ETFs took in about $6.3 billion last quarter. Kalshi still prices $100,000 by year-end near 40%. now the focus shifts to whether $86,000 holds. a clean retest of that former ceiling would give traders more confirmation that the range is actually broken. A slip back under it puts price inside the seven-month band again. breakout first. confirmation next on $BTC chart. #BTC Price Analysis# #Bitcoin Price Prediction: What is Bitcoins next move?# $ETH #Bullish
$BTC has broken out of the range that held it for about seven months. on the weekly chart, price is back through $86,373 after spending 2026 between the low-$60,000s and the mid-$80,000s. The same kind of range showed up in 2024. Once that one broke, Bitcoin reached $100,000 within about five weeks. That is the comparison the chart is drawing. this break is not the same market. In 2024 the range sat under a new high. This one sits under the 2025 peak near $126,000, after Q1 and Q2 losses and a 42.6% Q3. Spot ETFs took in about $6.3 billion last quarter. Kalshi still prices $100,000 by year-end near 40%. now the focus shifts to whether $86,000 holds. a clean retest of that former ceiling would give traders more confirmation that the range is actually broken. A slip back under it puts price inside the seven-month band again. breakout first. confirmation next on $BTC chart. #BTC Price Analysis# #Bitcoin Price Prediction: What is Bitcoins next move?# $ETH #Bullish
2
·
--
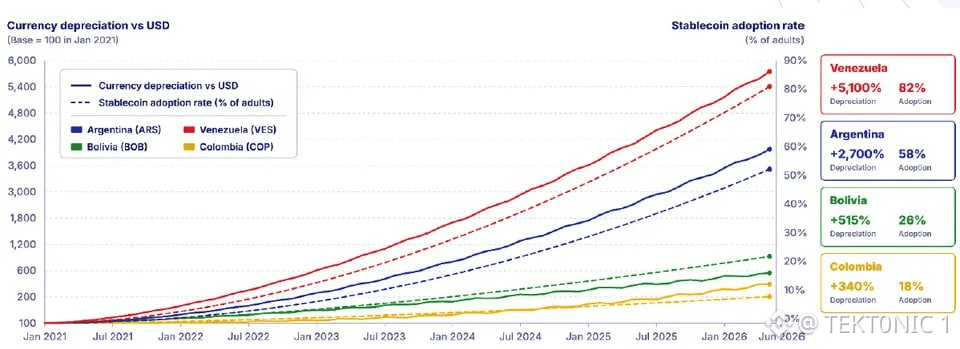
Stablecoin Use Is Highest Where Local Currencies Have Fallen the Hardest. Venezuela leads at 82% adult adoption. The on-ramp side is still small. According to the chart, adoption has risen in step with each currency’s drop versus the dollar since January 2021. The four countries with the steepest losses also have the highest stablecoin use. Demand is already there. Local liquidity is not: only 16 specialist providers sit across 494 companies in the region. Key Details: > Venezuela: +5,100% depreciation, 82% adoption. > Argentina: +2,700% depreciation, 58% adoption. > Bolivia: +515% depreciation, 28% adoption. > Colombia: +340% depreciation, 18% adoption. > Liquidity: 16 specialist providers across 494 companies. People are already using dollar stablecoins as a savings rail. The missing piece is local market makers and on-ramps, not more users. Sixteen providers is a narrow pipe for a region this large. LATAM Stablecoins: Venezuela 82%, Argentina 58%. Only 16 Specialist Providers. #BTC Price Analysis# #Bitcoin Price Prediction: What is Bitcoins next move?# #Stablecoins $BTC $XRP
Stablecoin Use Is Highest Where Local Currencies Have Fallen the Hardest. Venezuela leads at 82% adult adoption. The on-ramp side is still small. According to the chart, adoption has risen in step with each currency’s drop versus the dollar since January 2021. The four countries with the steepest losses also have the highest stablecoin use. Demand is already there. Local liquidity is not: only 16 specialist providers sit across 494 companies in the region. Key Details: > Venezuela: +5,100% depreciation, 82% adoption. > Argentina: +2,700% depreciation, 58% adoption. > Bolivia: +515% depreciation, 28% adoption. > Colombia: +340% depreciation, 18% adoption. > Liquidity: 16 specialist providers across 494 companies. People are already using dollar stablecoins as a savings rail. The missing piece is local market makers and on-ramps, not more users. Sixteen providers is a narrow pipe for a region this large. LATAM Stablecoins: Venezuela 82%, Argentina 58%. Only 16 Specialist Providers. #BTC Price Analysis# #Bitcoin Price Prediction: What is Bitcoins next move?# #Stablecoins $BTC $XRP
·
--
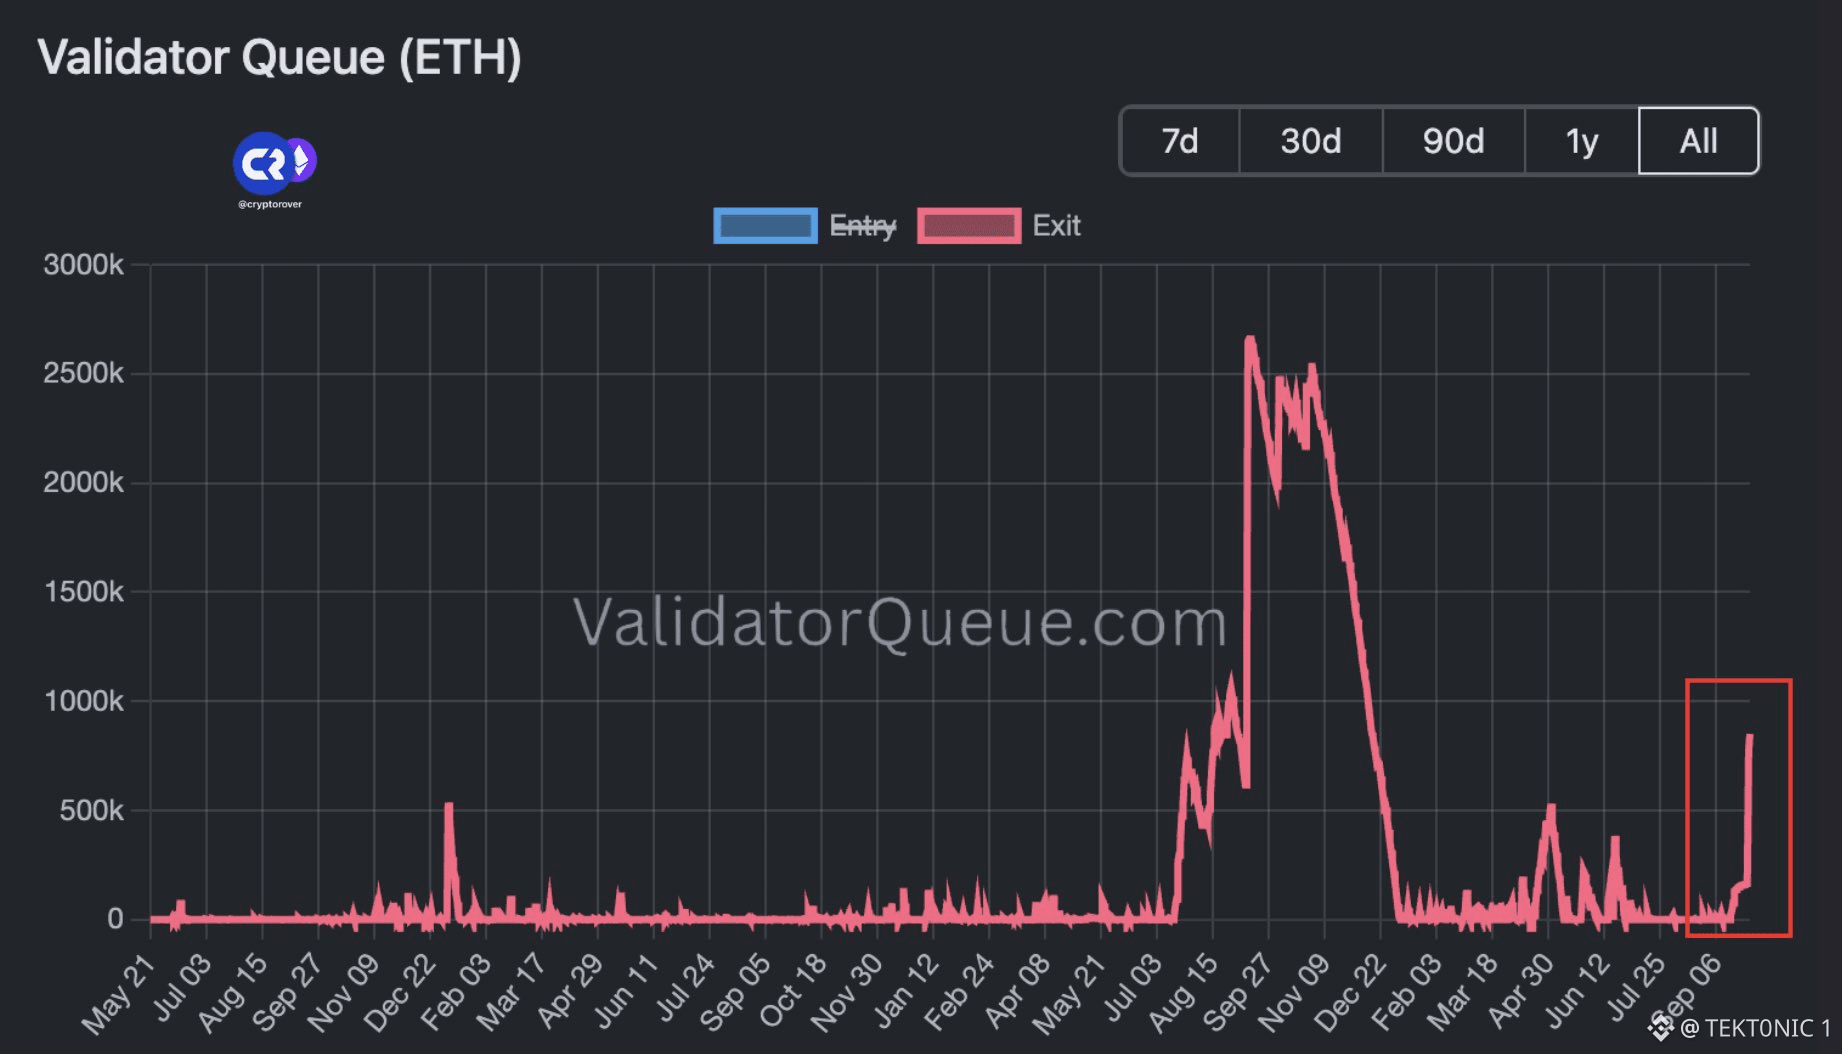
Validators are lining up to unstake $ETH again. the exit backlog just jumped from near zero to about 800,000 eth, the sharpest rise since the backlog cleared into year-end. The protocol only processes about 57,600 eth of exits a day, so this is roughly two weeks of withdrawals, not an instant sale. The August 2025 wave peaked near 2.6 million eth. This spike is about a third of that. an exit is a withdrawal request, not a market sell. Some of that ether gets restaked or moved to a custodian. Some of it can hit exchanges, and that is the short-term pressure while $ETH is still failing $2,750 to $2,800. the longer view is separate. A move toward $10,000 still needs the cycle, ETF demand, and the $ETH / $BTC monthly break to hold. This spike does not settle that. now the focus is whether the exit backlog keeps climbing past 1 million, or fades the way the smaller spikes did in the spring. a two-week withdrawal wait is pressure. It is not the cycle. #BTC Price Analysis# #Bitcoin Price Prediction: What is Bitcoins next move?# #Ethereum
Validators are lining up to unstake $ETH again. the exit backlog just jumped from near zero to about 800,000 eth, the sharpest rise since the backlog cleared into year-end. The protocol only processes about 57,600 eth of exits a day, so this is roughly two weeks of withdrawals, not an instant sale. The August 2025 wave peaked near 2.6 million eth. This spike is about a third of that. an exit is a withdrawal request, not a market sell. Some of that ether gets restaked or moved to a custodian. Some of it can hit exchanges, and that is the short-term pressure while $ETH is still failing $2,750 to $2,800. the longer view is separate. A move toward $10,000 still needs the cycle, ETF demand, and the $ETH / $BTC monthly break to hold. This spike does not settle that. now the focus is whether the exit backlog keeps climbing past 1 million, or fades the way the smaller spikes did in the spring. a two-week withdrawal wait is pressure. It is not the cycle. #BTC Price Analysis# #Bitcoin Price Prediction: What is Bitcoins next move?# #Ethereum
27
·
--
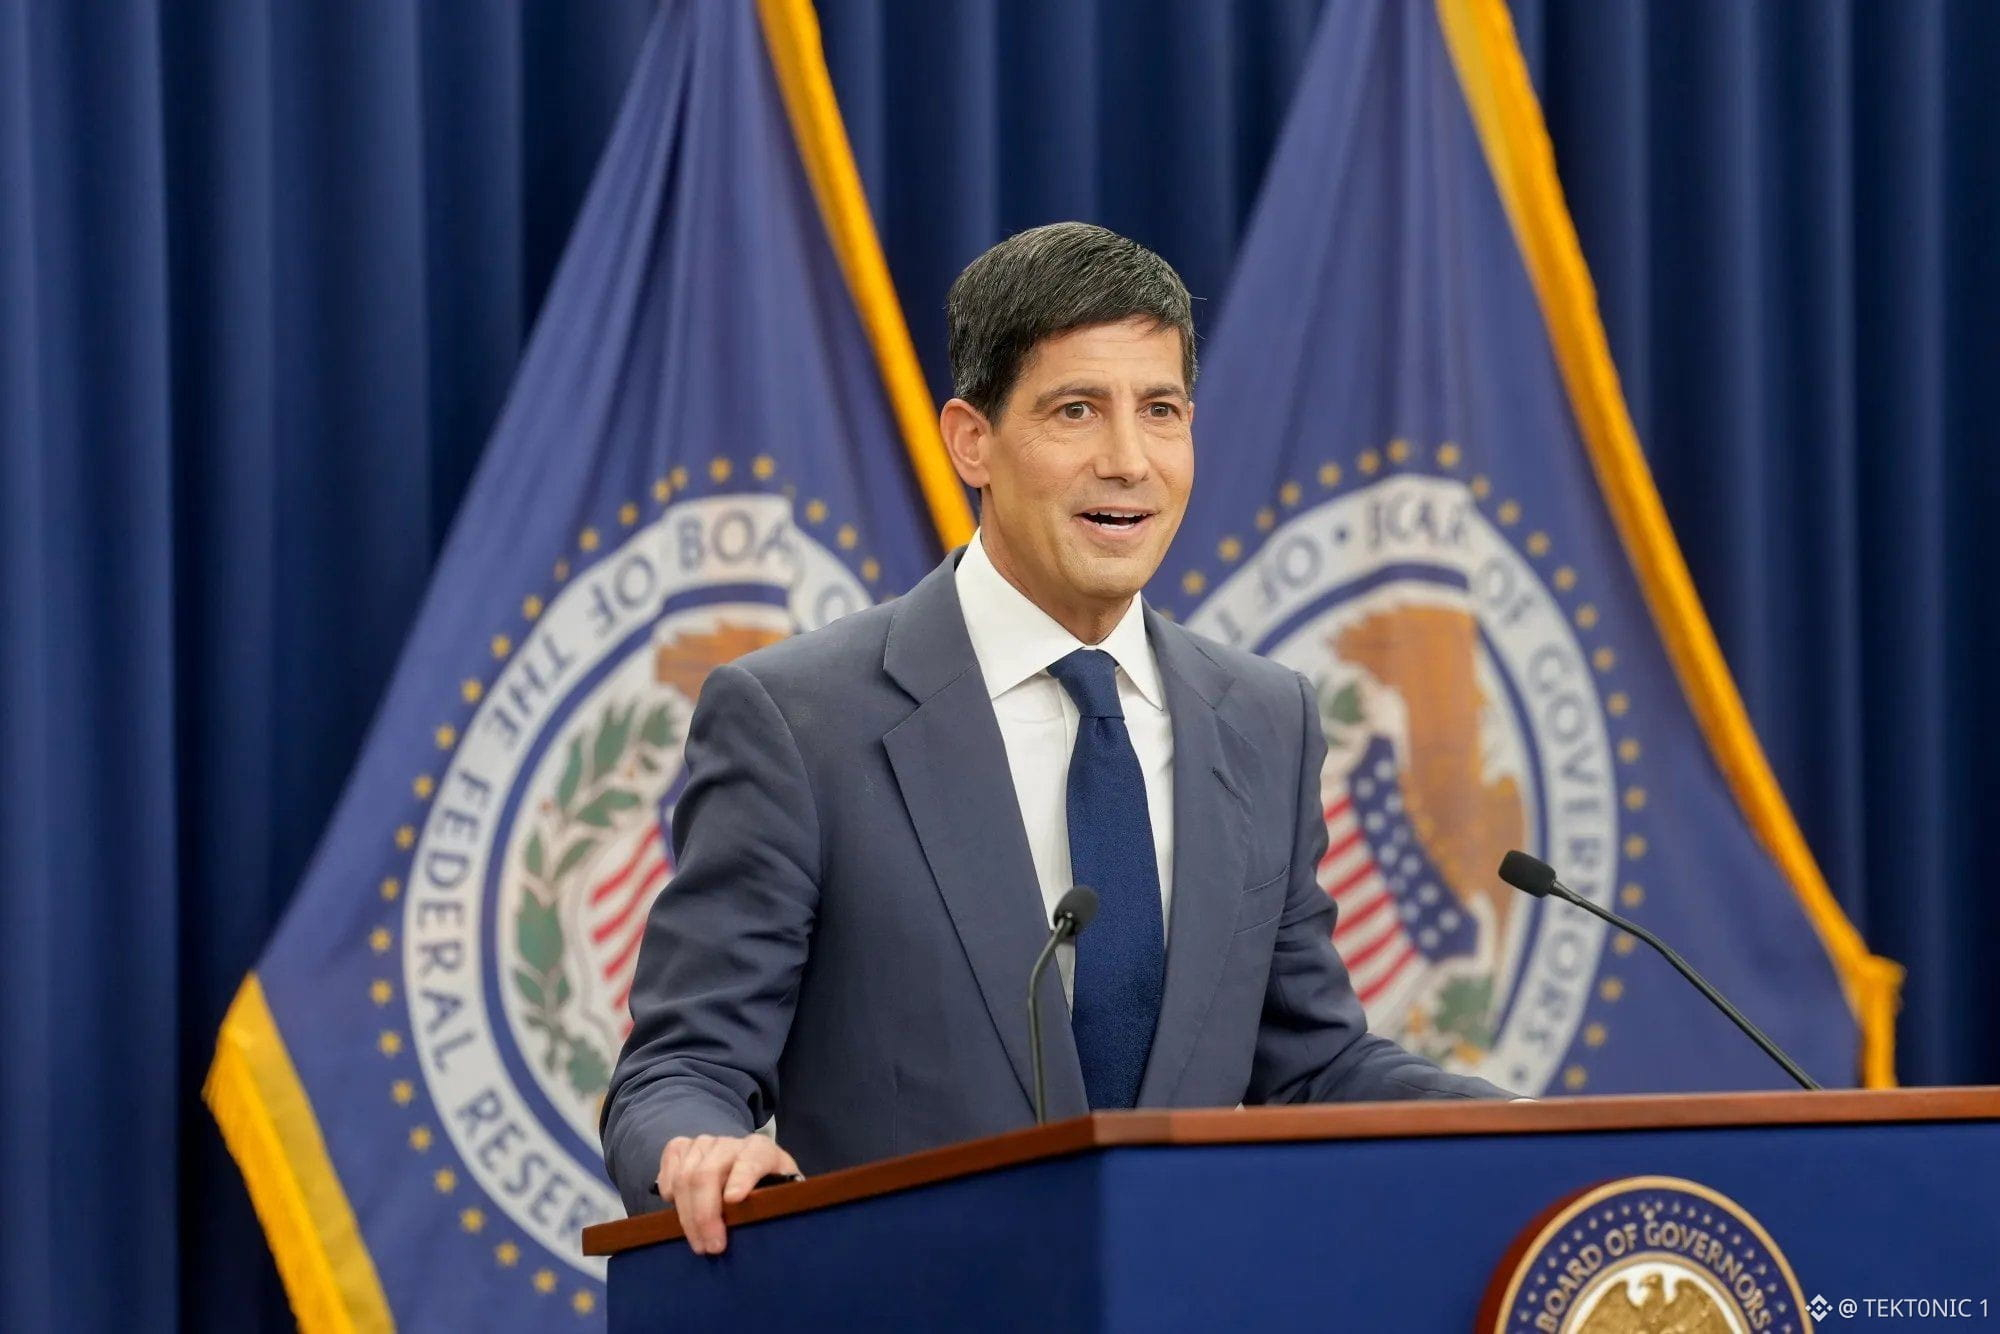
U.S. Unemployment Is Due at 8:30 a.m. ET. The Market Is Set on 4.1%. Last month was 4.1%. The forecast is 4.1% again. According to positioning into this morning’s release, a reading above 4.1% is the softer-labor outcome traders have been treating as a bid for risk, while a reading under 4.1% is the firmer-labor outcome that can lift yields and pressure Bitcoin and stocks. A repeat of 4.1% leaves the reaction mixed. $BTC is coming off a reclaim of $85,000 after the soft PCE reading, so this number is the next macro test of that bounce. Key Details: > Release: 8:30 a.m. ET today. > Previous: 4.1%. > Forecast: 4.1%. > Above 4.1%: the softer-labor case traders have been buying. > Below 4.1%: the firmer-labor case that can sell risk. > Equal to 4.1%: no clean signal. The number does not move $BTC by itself. It moves the rate path, and the rate path is what has been under $85,000. Hold that level through the release and October keeps the bid. Lose $84,000 after a firm labor reading and the PCE bounce is at risk. Unemployment at 8:30 a.m. ET. Previous 4.1%. Forecast 4.1%. Are you positioned for a softer reading above 4.1%, or sitting flat until the number is out? #BTC Price Analysis# #Bitcoin Price Prediction: What is Bitcoins next move?# #Macro Insights# $XRP
U.S. Unemployment Is Due at 8:30 a.m. ET. The Market Is Set on 4.1%. Last month was 4.1%. The forecast is 4.1% again. According to positioning into this morning’s release, a reading above 4.1% is the softer-labor outcome traders have been treating as a bid for risk, while a reading under 4.1% is the firmer-labor outcome that can lift yields and pressure Bitcoin and stocks. A repeat of 4.1% leaves the reaction mixed. $BTC is coming off a reclaim of $85,000 after the soft PCE reading, so this number is the next macro test of that bounce. Key Details: > Release: 8:30 a.m. ET today. > Previous: 4.1%. > Forecast: 4.1%. > Above 4.1%: the softer-labor case traders have been buying. > Below 4.1%: the firmer-labor case that can sell risk. > Equal to 4.1%: no clean signal. The number does not move $BTC by itself. It moves the rate path, and the rate path is what has been under $85,000. Hold that level through the release and October keeps the bid. Lose $84,000 after a firm labor reading and the PCE bounce is at risk. Unemployment at 8:30 a.m. ET. Previous 4.1%. Forecast 4.1%. Are you positioned for a softer reading above 4.1%, or sitting flat until the number is out? #BTC Price Analysis# #Bitcoin Price Prediction: What is Bitcoins next move?# #Macro Insights# $XRP
29
·
--
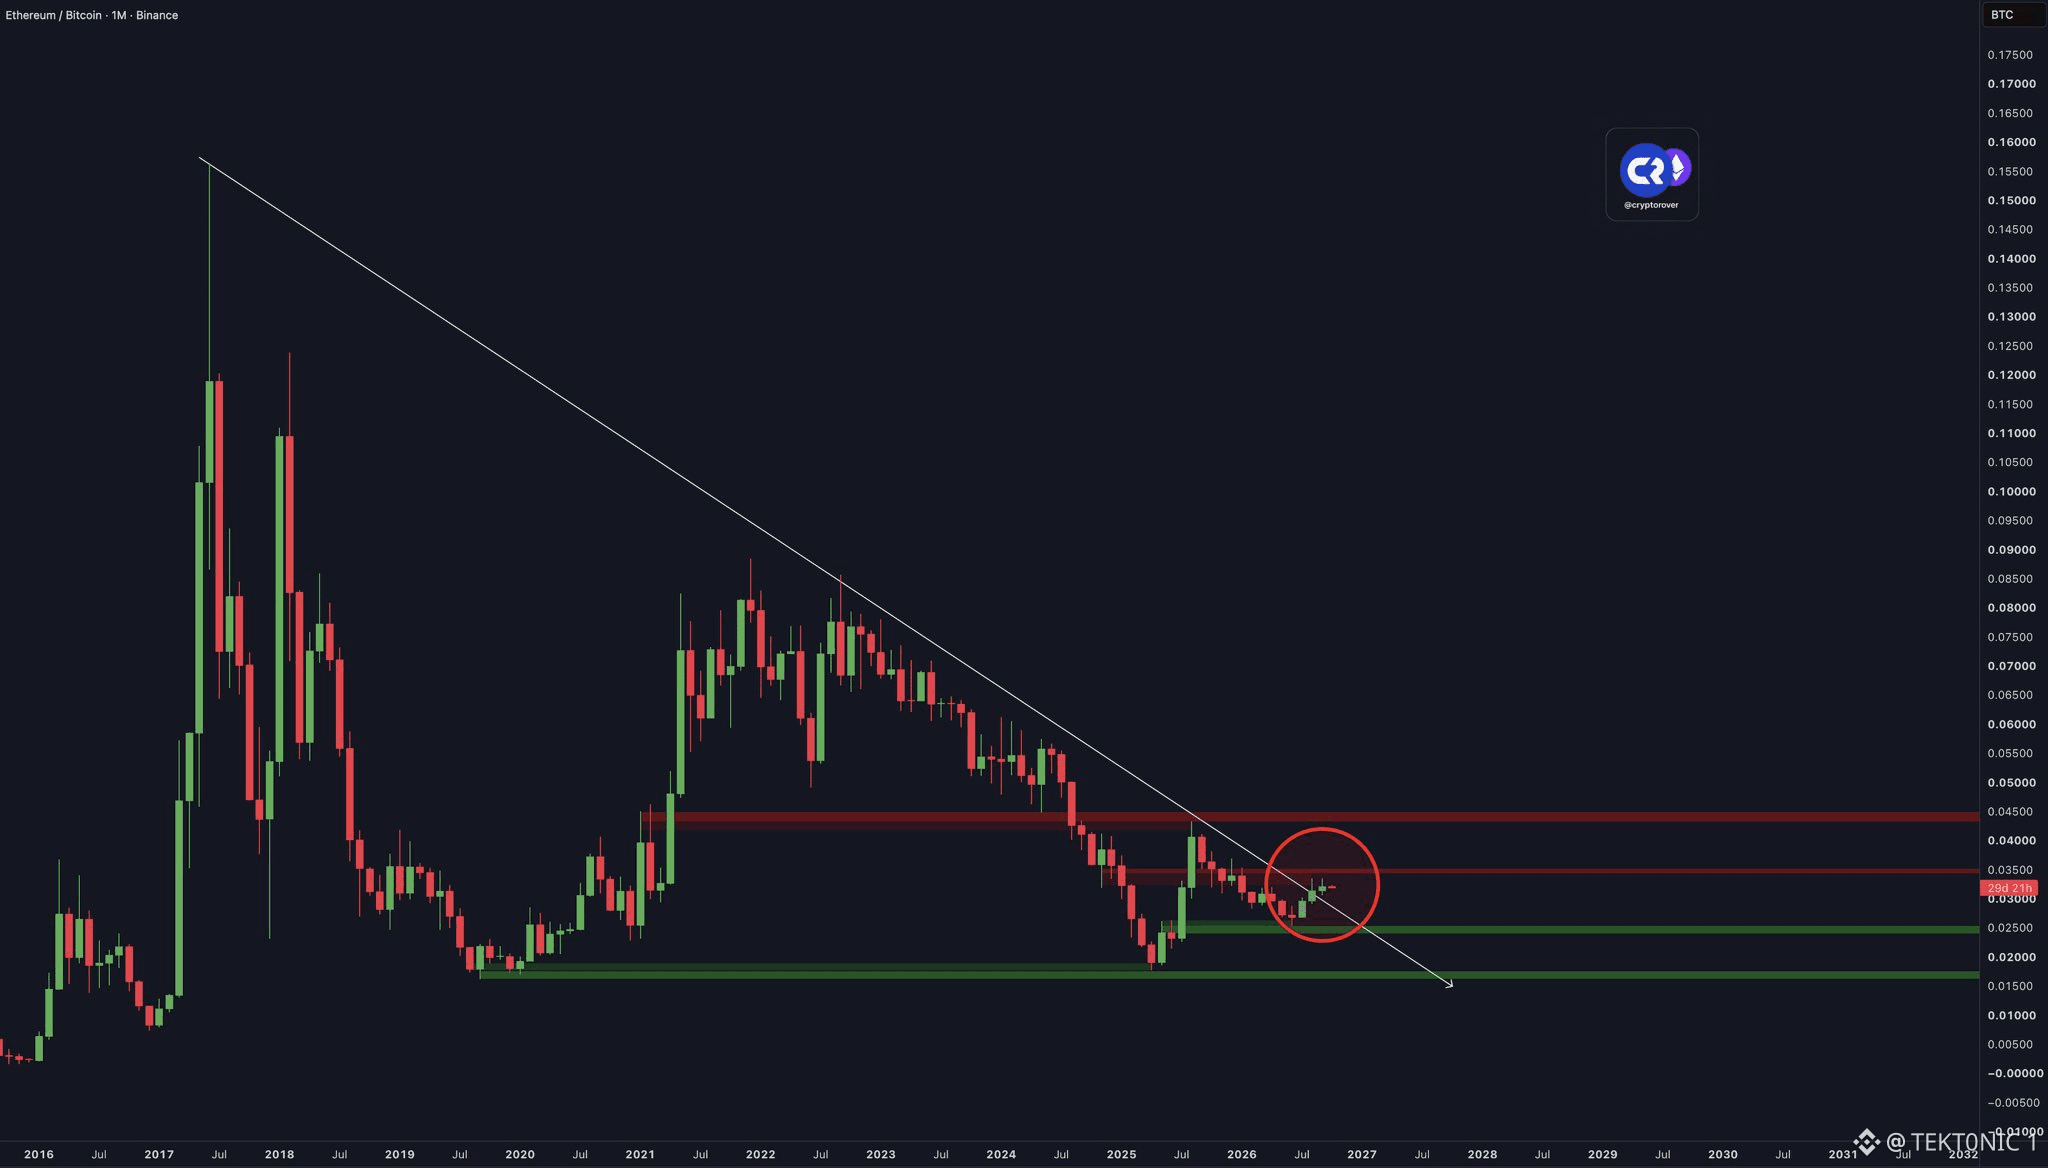
$ETH against $BTC just pushed through a descending trendline that has capped the pair since 2017. That is the nine-year monthly break traders have been waiting on. The pair is near 0.032, after failing at 0.0334 in August and again in mid-September. Q3 already showed the shift. Ether gained about 67% to 71%. Bitcoin gained 42.6%. Spot ether ETFs took in about $3 billion in the quarter after outflows in Q2. The ratio matters more than either dollar chart, because a higher $ETH /$BTC pair is how capital rotates out of Bitcoin and into Ether. the dollar price has not followed the chart. Ether is still near $2,700, and $2,750 to $2,800 has been the area it keeps failing. Bitcoin is near $86,000. A ratio break can extend while both assets stay range-bound if Bitcoin is the one giving ground. a monthly close above the 2017 trendline, and a hold over 0.0334, is what keeps this break alive. Lose that trendline and it was a wick. Hold it and the pair has space it has not had since the last cycle. That is the trade. The chart is already there.
$ETH against $BTC just pushed through a descending trendline that has capped the pair since 2017. That is the nine-year monthly break traders have been waiting on. The pair is near 0.032, after failing at 0.0334 in August and again in mid-September. Q3 already showed the shift. Ether gained about 67% to 71%. Bitcoin gained 42.6%. Spot ether ETFs took in about $3 billion in the quarter after outflows in Q2. The ratio matters more than either dollar chart, because a higher $ETH /$BTC pair is how capital rotates out of Bitcoin and into Ether. the dollar price has not followed the chart. Ether is still near $2,700, and $2,750 to $2,800 has been the area it keeps failing. Bitcoin is near $86,000. A ratio break can extend while both assets stay range-bound if Bitcoin is the one giving ground. a monthly close above the 2017 trendline, and a hold over 0.0334, is what keeps this break alive. Lose that trendline and it was a wick. Hold it and the pair has space it has not had since the last cycle. That is the trade. The chart is already there.
37
·
--
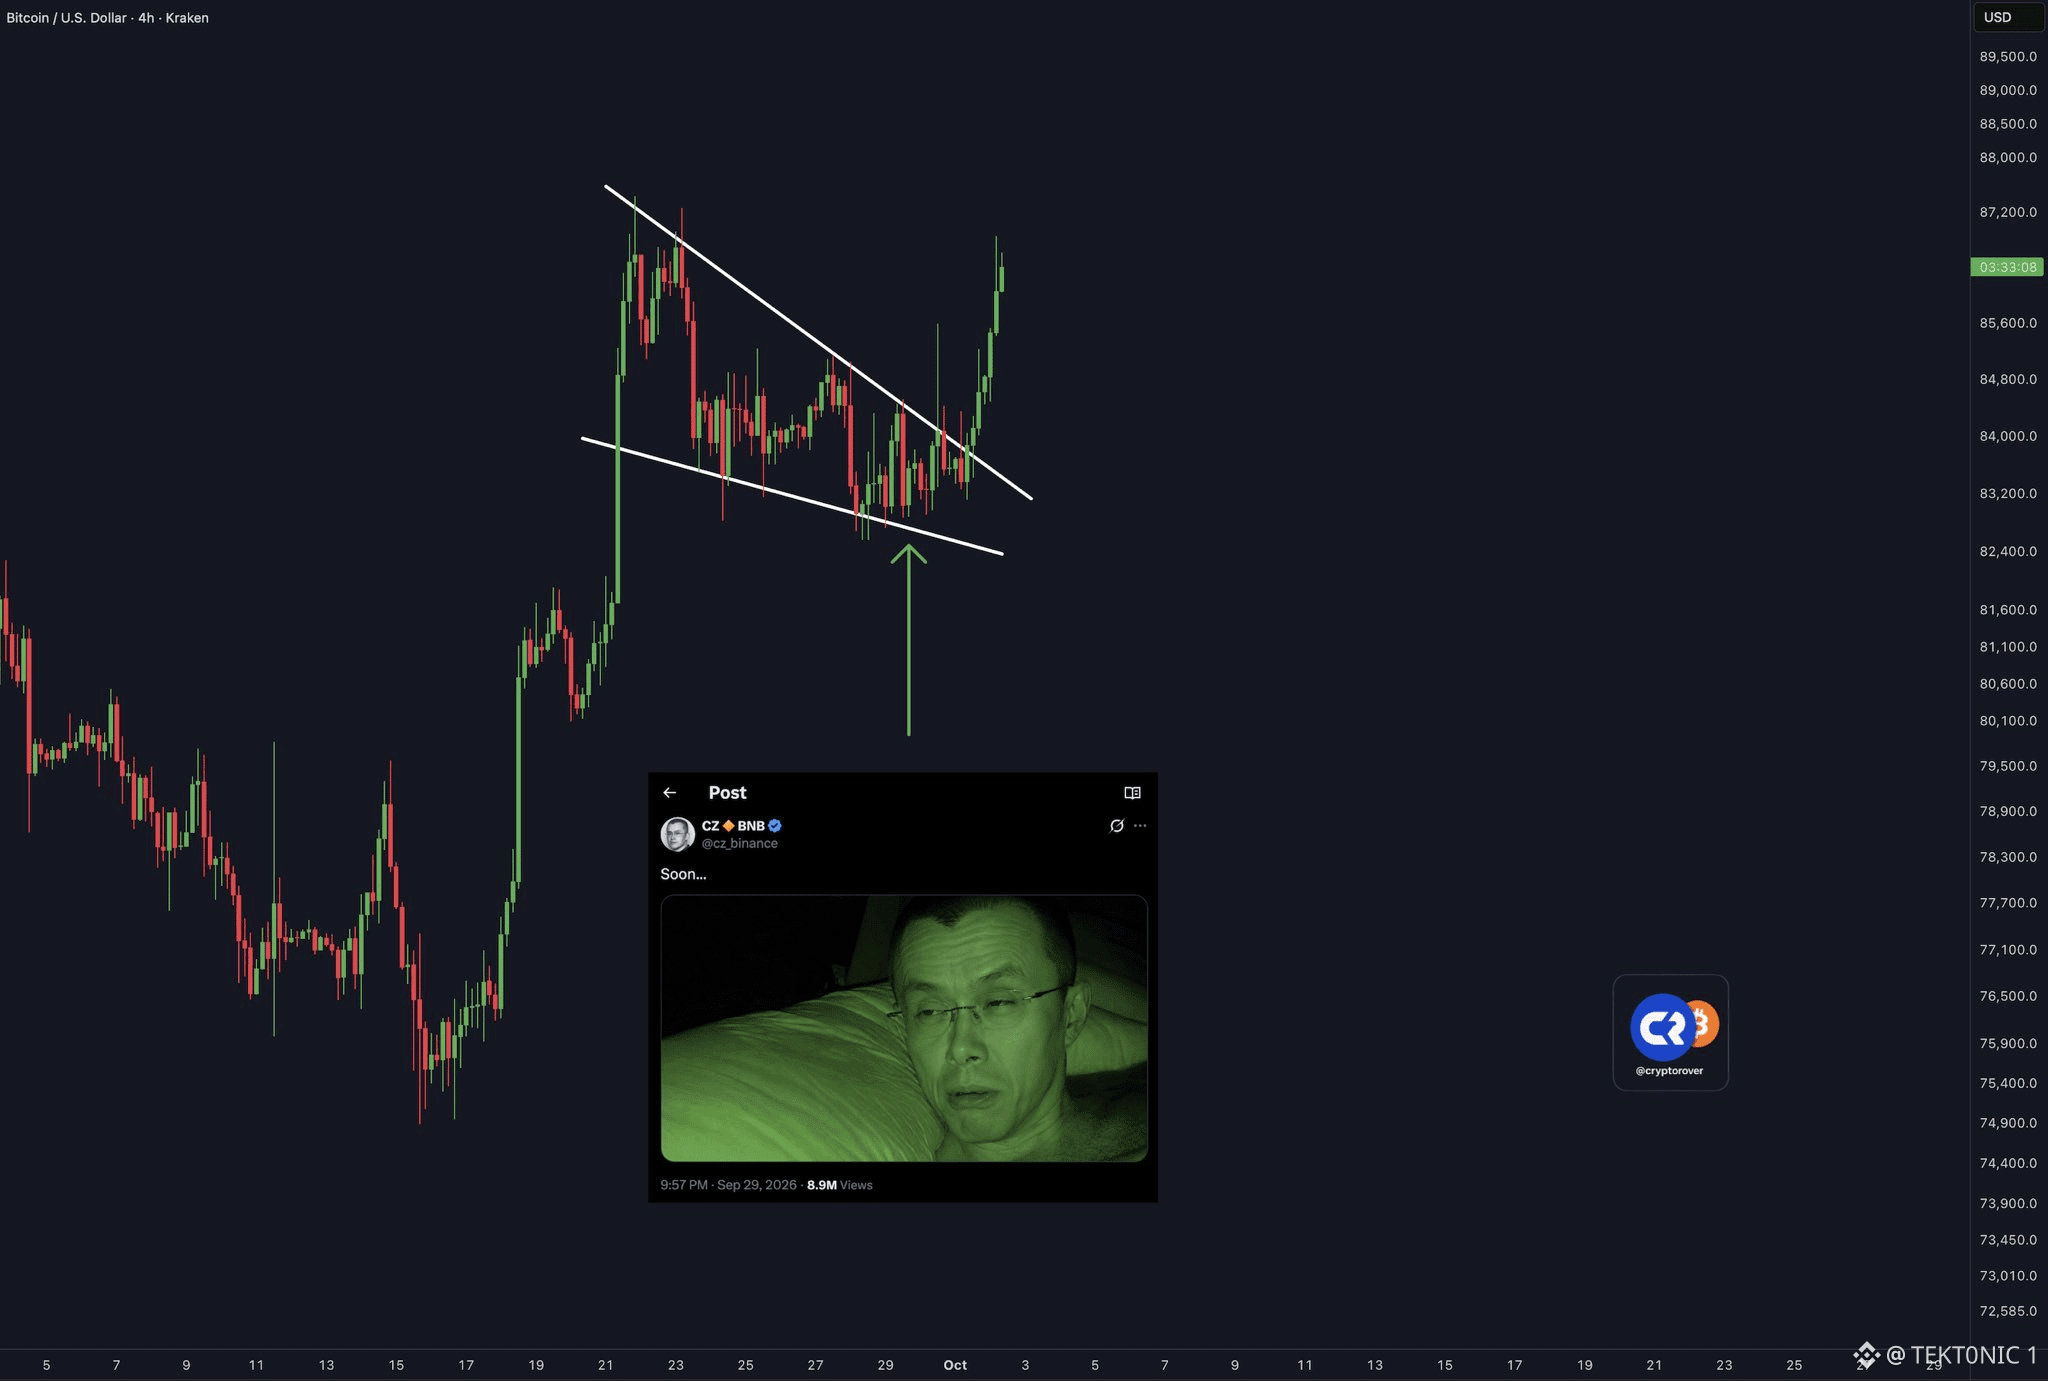
Bitcoin has finally broken out of the falling-wedge structure. $BTC briefly moved above $85K after entering October, although the move has not yet held firmly above that level. the falling wedge had been forming during the recent pullback, with traders watching the upper trendline for a confirmed breakout. CZ has also been calling for Bitcoin to break its traditional four-year cycle, arguing that stronger institutional adoption and broader crypto acceptance could change the historical pattern. now the key level is the breakout zone. a successful $BTC retest of former resistance would give traders stronger confirmation that the structure has actually shifted. breakout first. confirmation next. #BTC Price Analysis# #Bitcoin Price Prediction: What is Bitcoins next move?# $ETH #Bullish
Bitcoin has finally broken out of the falling-wedge structure. $BTC briefly moved above $85K after entering October, although the move has not yet held firmly above that level. the falling wedge had been forming during the recent pullback, with traders watching the upper trendline for a confirmed breakout. CZ has also been calling for Bitcoin to break its traditional four-year cycle, arguing that stronger institutional adoption and broader crypto acceptance could change the historical pattern. now the key level is the breakout zone. a successful $BTC retest of former resistance would give traders stronger confirmation that the structure has actually shifted. breakout first. confirmation next. #BTC Price Analysis# #Bitcoin Price Prediction: What is Bitcoins next move?# $ETH #Bullish
57
·
--
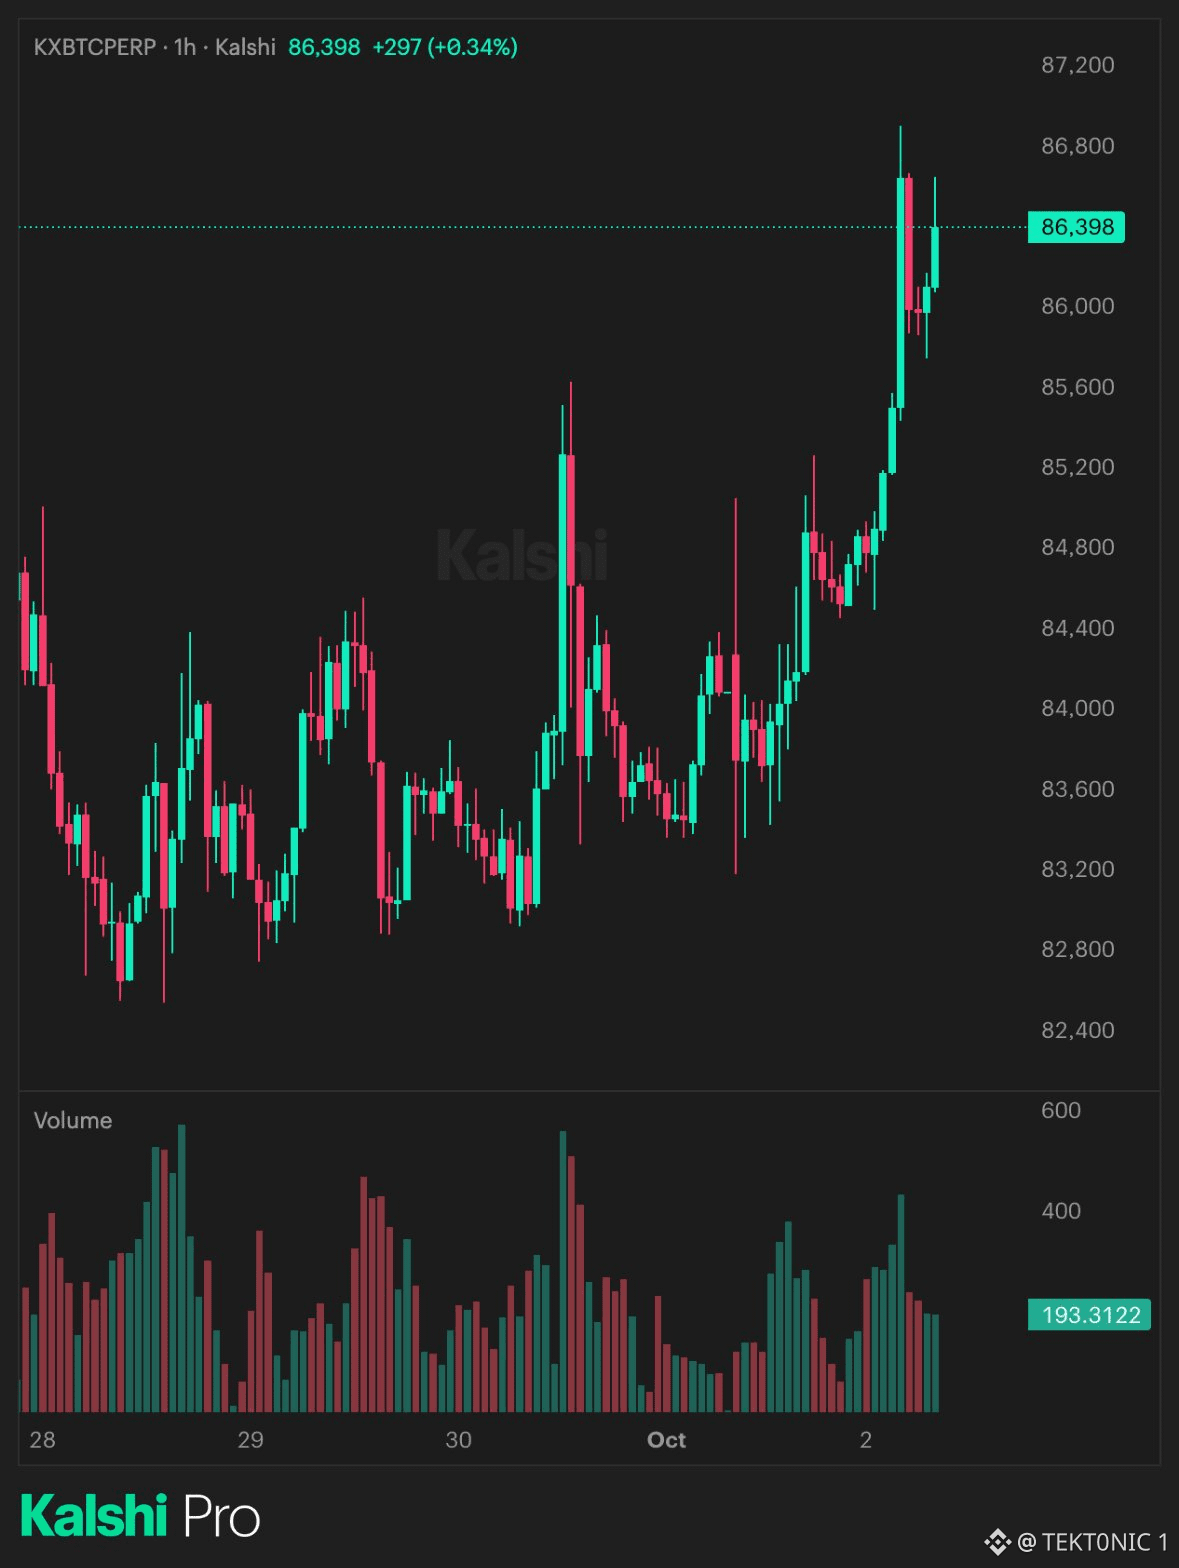
Bitcoin reclaimed $86,000 on the Kalshi perp chart, last near $86,398 after a push toward $86,800. That is the first clean break of this level since the late-September fade back under $84,000. Kalshi traders price about a 40% chance that $BTC trades above $100,000 before the end of 2026. That contract was near 17% on September 16, touched the mid-40s after the squeeze above $86,000, and settled back around 34% to 40% into the month turn. Polymarket is in the same range. A contract price is a crowd bet, not a forecast. from $86,400, $100,000 is about a 16% move. Q3 already delivered 42.6%, and spot ETFs took in about $6.3 billion in that quarter. The October 2025 high near $126,000 is still well above. The same market prices a move through $110,000 much lower, near 20%. $86,000 is a reclaim on a thin hourly chart. It is not a hold yet. Watch $BTC whether the daily close stays above it, and whether the $100,000 contract holds 40% if price slips back under $85,000. The odds moved with the rally. They can move back just as fast. #BTC Price Analysis# #Bitcoin Price Prediction: What is Bitcoins next move?# $XRP #Bullish
Bitcoin reclaimed $86,000 on the Kalshi perp chart, last near $86,398 after a push toward $86,800. That is the first clean break of this level since the late-September fade back under $84,000. Kalshi traders price about a 40% chance that $BTC trades above $100,000 before the end of 2026. That contract was near 17% on September 16, touched the mid-40s after the squeeze above $86,000, and settled back around 34% to 40% into the month turn. Polymarket is in the same range. A contract price is a crowd bet, not a forecast. from $86,400, $100,000 is about a 16% move. Q3 already delivered 42.6%, and spot ETFs took in about $6.3 billion in that quarter. The October 2025 high near $126,000 is still well above. The same market prices a move through $110,000 much lower, near 20%. $86,000 is a reclaim on a thin hourly chart. It is not a hold yet. Watch $BTC whether the daily close stays above it, and whether the $100,000 contract holds 40% if price slips back under $85,000. The odds moved with the rally. They can move back just as fast. #BTC Price Analysis# #Bitcoin Price Prediction: What is Bitcoins next move?# $XRP #Bullish
68
·
--
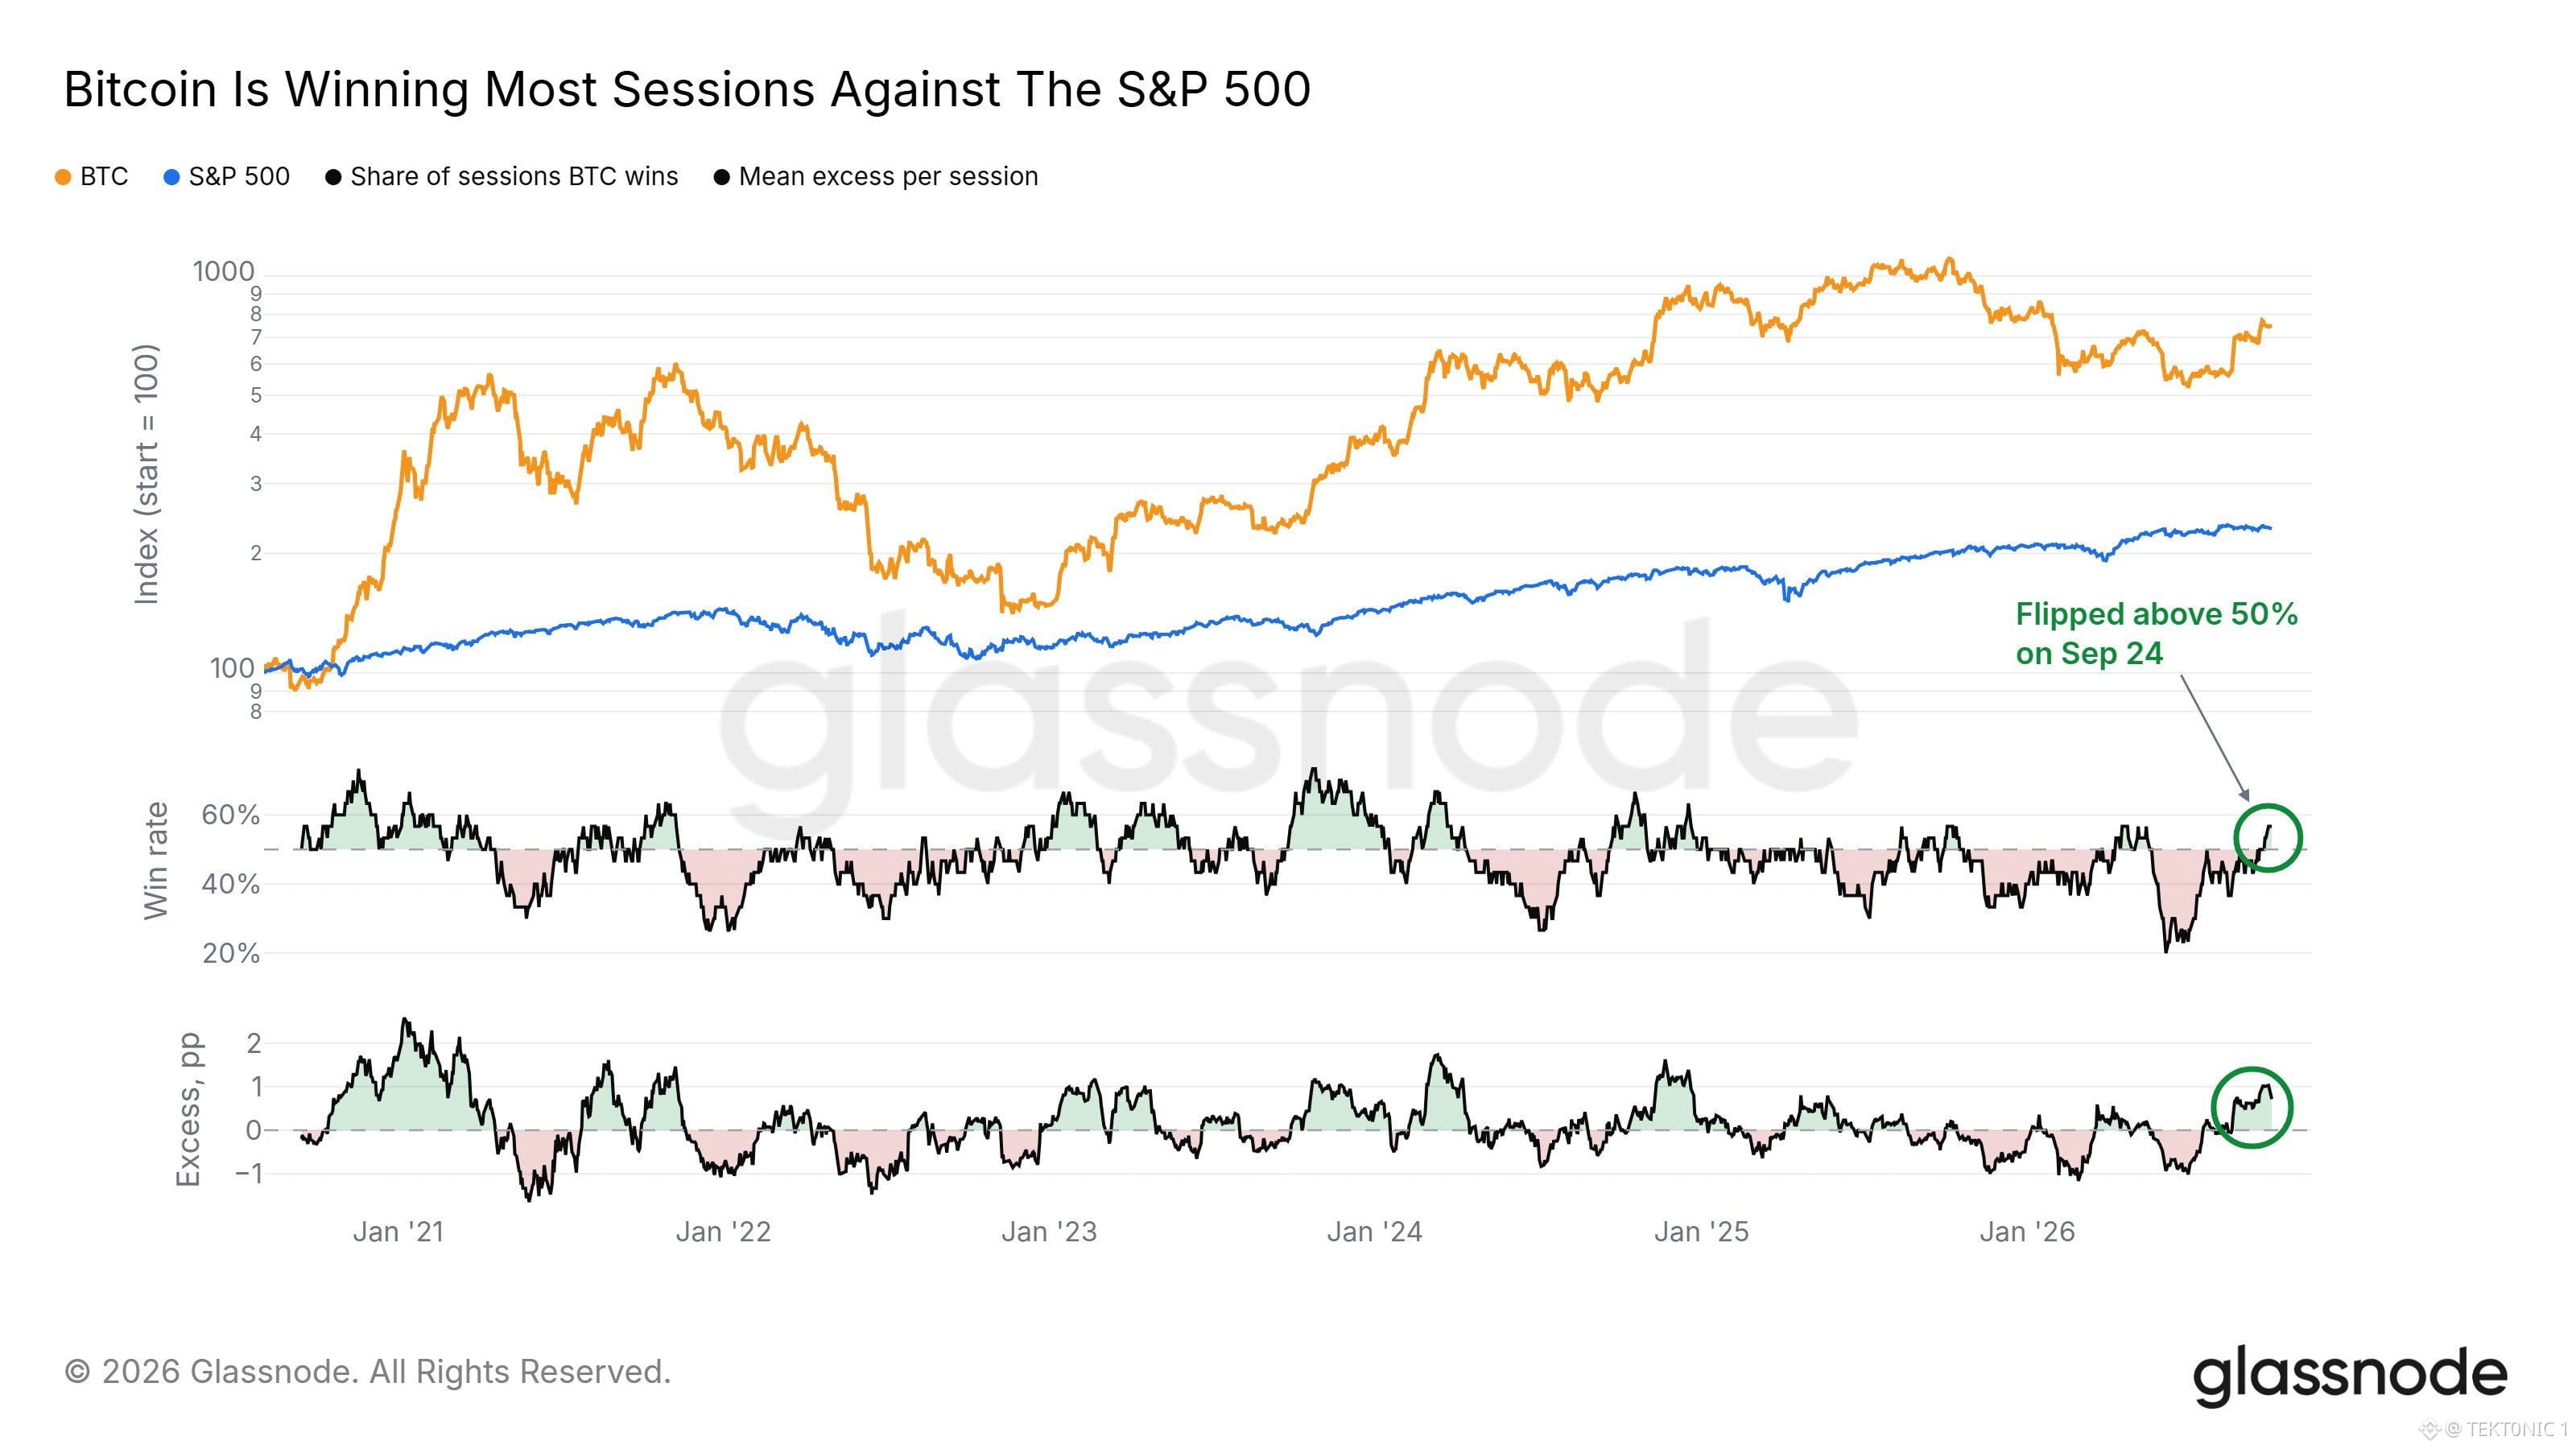
Bitcoin is winning most sessions against the S&P 500 again. On the Glassnode chart, the share of days Bitcoin beat the index flipped back above 50% on September 24. in June that share was about one in five sessions, the weakest reading on this chart in six years. The mean excess return per session was negative then. Both lines are green again. The win rate is back over 50%, and the average session is positive versus stocks. the top panel is the longer comparison. Bitcoin, indexed to 100, is still well ahead of the S&P 500 over the full series. The S&P has climbed in a steady path. Bitcoin gave back ground in the first half, then recovered in Q3. Equities barely moved while that win rate turned. one distinction: a win rate is how many days Bitcoin finished ahead, not how much it gained. A few large down days can still erase a string of small wins. September 24 is a turn in the count, not a new cycle by itself. watch whether the share stays above 50% through October, and whether the excess line holds green if the S&P starts to trend. An idiosyncratic bid shows up when Bitcoin keeps winning on days stocks do not. One week above the line is not that yet. #BTC Price Analysis# #Bitcoin Price Prediction: What is Bitcoins next move?# $BTC $XRP #Bullish
Bitcoin is winning most sessions against the S&P 500 again. On the Glassnode chart, the share of days Bitcoin beat the index flipped back above 50% on September 24. in June that share was about one in five sessions, the weakest reading on this chart in six years. The mean excess return per session was negative then. Both lines are green again. The win rate is back over 50%, and the average session is positive versus stocks. the top panel is the longer comparison. Bitcoin, indexed to 100, is still well ahead of the S&P 500 over the full series. The S&P has climbed in a steady path. Bitcoin gave back ground in the first half, then recovered in Q3. Equities barely moved while that win rate turned. one distinction: a win rate is how many days Bitcoin finished ahead, not how much it gained. A few large down days can still erase a string of small wins. September 24 is a turn in the count, not a new cycle by itself. watch whether the share stays above 50% through October, and whether the excess line holds green if the S&P starts to trend. An idiosyncratic bid shows up when Bitcoin keeps winning on days stocks do not. One week above the line is not that yet. #BTC Price Analysis# #Bitcoin Price Prediction: What is Bitcoins next move?# $BTC $XRP #Bullish
·
--
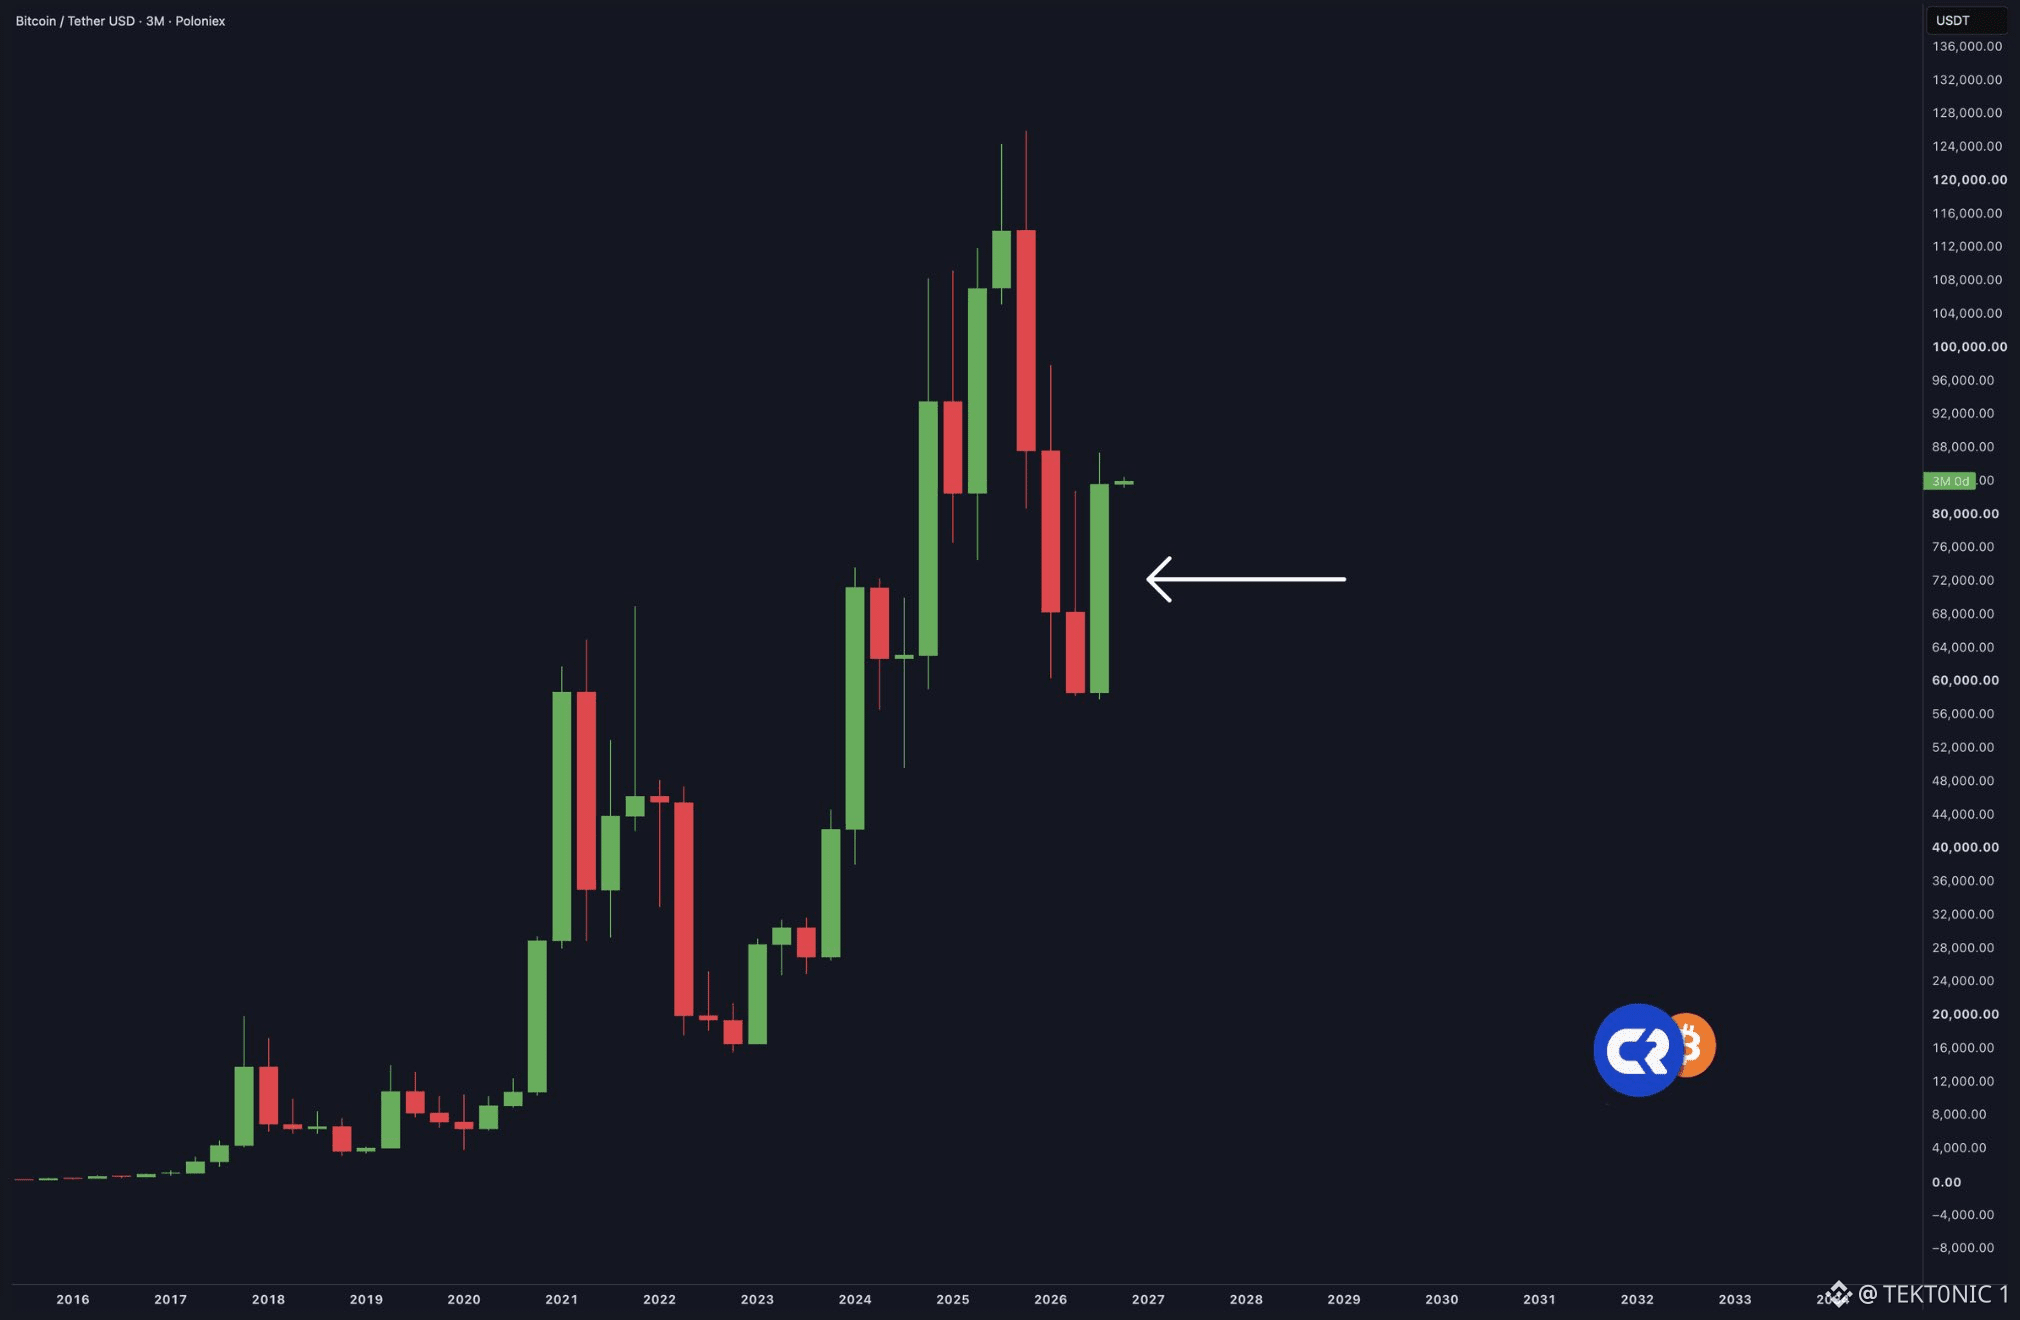
$BTC just closed a quarter that took back most of the prior six months. On the 3-month chart, the latest candle is green after two red ones. Q1 was −22.1%. Q2 was −14.1%. Together that was about a 33% hole from the start of the year to the end of June, with price near $58,600. Q3 then gained 42.6%, the best third quarter since 2017, and price finished near $84,000. That is the candle the arrow is pointing at. the recovery is real. It is not a full reset. A 33% drop needs about a 50% rebound to get back to the same price. 42.6% does not clear that. The year is still slightly red. The 2025 high near $126,000 is still well above this candle. a 3-month $BTC candle hides the path. August did most of the work. September only added about 6%. Spot ETFs took in about $6.3 billion in the quarter, then the nine-day inflow streak broke on the last session. a green quarter after two red ones is a repair, not a new high. Watch whether October holds $84,000 and whether the next 3-month candle builds on this one. The pain of the first half is mostly retraced. It is not erased. #BTC Price Analysis# #Bitcoin Price Prediction: What is Bitcoins next move?# $XRP #Bullish
$BTC just closed a quarter that took back most of the prior six months. On the 3-month chart, the latest candle is green after two red ones. Q1 was −22.1%. Q2 was −14.1%. Together that was about a 33% hole from the start of the year to the end of June, with price near $58,600. Q3 then gained 42.6%, the best third quarter since 2017, and price finished near $84,000. That is the candle the arrow is pointing at. the recovery is real. It is not a full reset. A 33% drop needs about a 50% rebound to get back to the same price. 42.6% does not clear that. The year is still slightly red. The 2025 high near $126,000 is still well above this candle. a 3-month $BTC candle hides the path. August did most of the work. September only added about 6%. Spot ETFs took in about $6.3 billion in the quarter, then the nine-day inflow streak broke on the last session. a green quarter after two red ones is a repair, not a new high. Watch whether October holds $84,000 and whether the next 3-month candle builds on this one. The pain of the first half is mostly retraced. It is not erased. #BTC Price Analysis# #Bitcoin Price Prediction: What is Bitcoins next move?# $XRP #Bullish
30
·
--
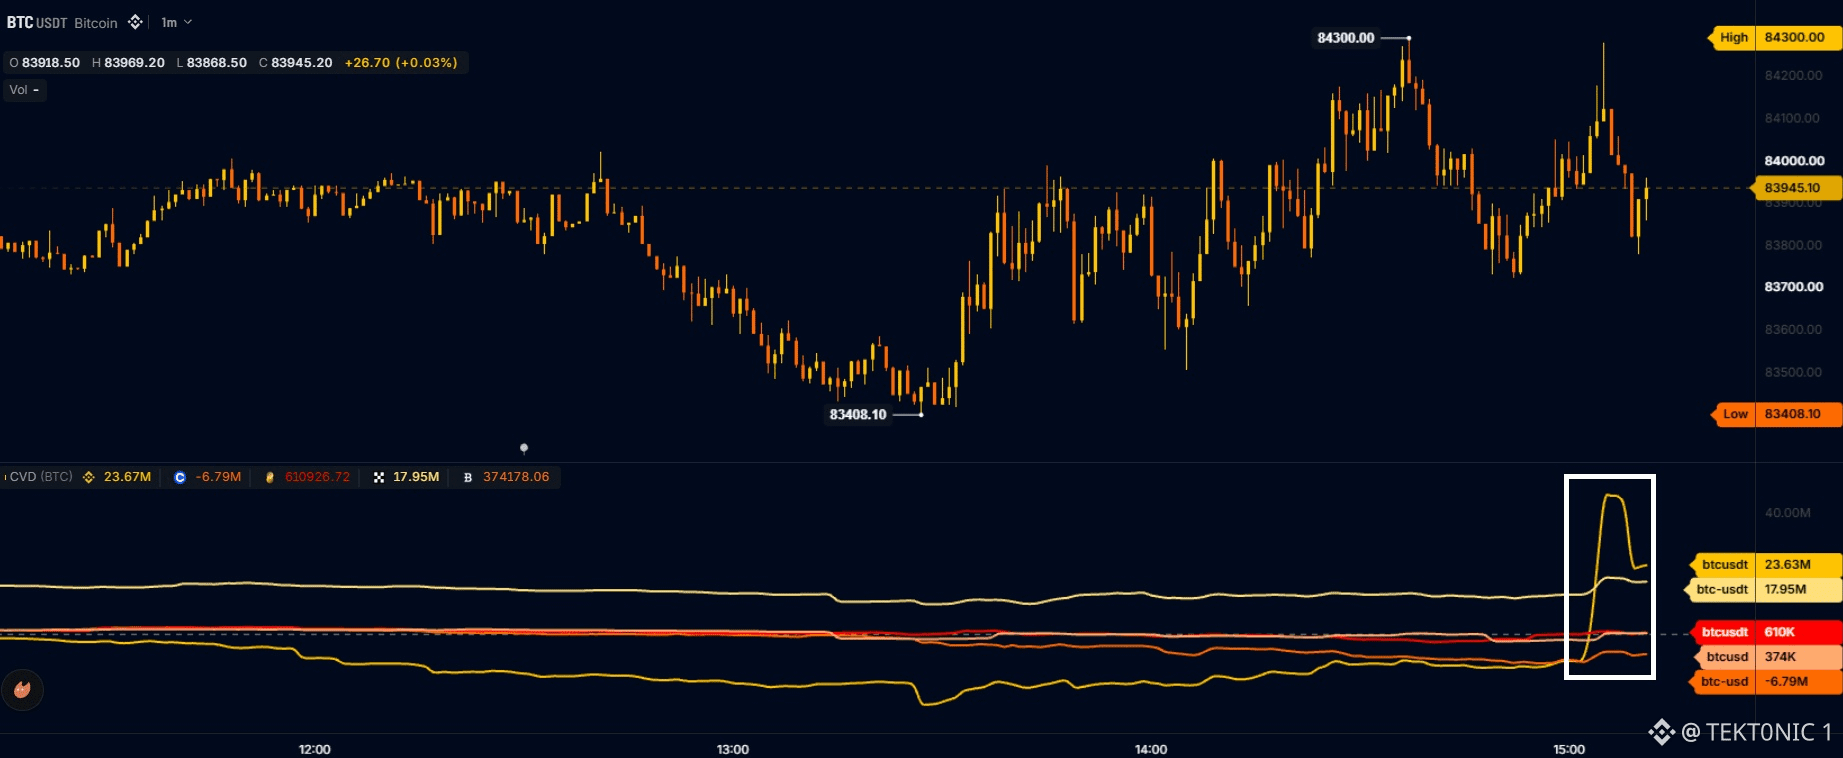
Bitcoin’s Binance CVD just spiked on the one-minute chart. The yellow $BTC line jumped toward $40 million around 15:00, then eased, while price tagged $84,300 and slipped back to about $83,945. CVD is cumulative volume delta, buy volume minus sell volume. A vertical jump means aggressive buyers lifted offers on that market. Traders are reading the spike as a large Binance buyer, the kind of flow a TWAP can leave when it hits the book in size. A one-minute burst is not proof of a scheduled program. It can also be one market order. the rest of the panel did not follow. Coinbase USD is still about −$6.8 million on the session. The other $BTC lines stayed flat. Price made a $84,300 high and gave most of it back. The buy showed up. It did not hold the high. one distinction: this is one venue’s delta, not net demand across every exchange. Watch whether the Binance line keeps stepping higher after 15:00, or whether this was a single clip that already faded. A real program leaves a series of steps. One spike does not. #Bitcoin Price Prediction: What is Bitcoins next move?# #BTC Price Analysis# $XRP
Bitcoin’s Binance CVD just spiked on the one-minute chart. The yellow $BTC line jumped toward $40 million around 15:00, then eased, while price tagged $84,300 and slipped back to about $83,945. CVD is cumulative volume delta, buy volume minus sell volume. A vertical jump means aggressive buyers lifted offers on that market. Traders are reading the spike as a large Binance buyer, the kind of flow a TWAP can leave when it hits the book in size. A one-minute burst is not proof of a scheduled program. It can also be one market order. the rest of the panel did not follow. Coinbase USD is still about −$6.8 million on the session. The other $BTC lines stayed flat. Price made a $84,300 high and gave most of it back. The buy showed up. It did not hold the high. one distinction: this is one venue’s delta, not net demand across every exchange. Watch whether the Binance line keeps stepping higher after 15:00, or whether this was a single clip that already faded. A real program leaves a series of steps. One spike does not. #Bitcoin Price Prediction: What is Bitcoins next move?# #BTC Price Analysis# $XRP
23
·
--
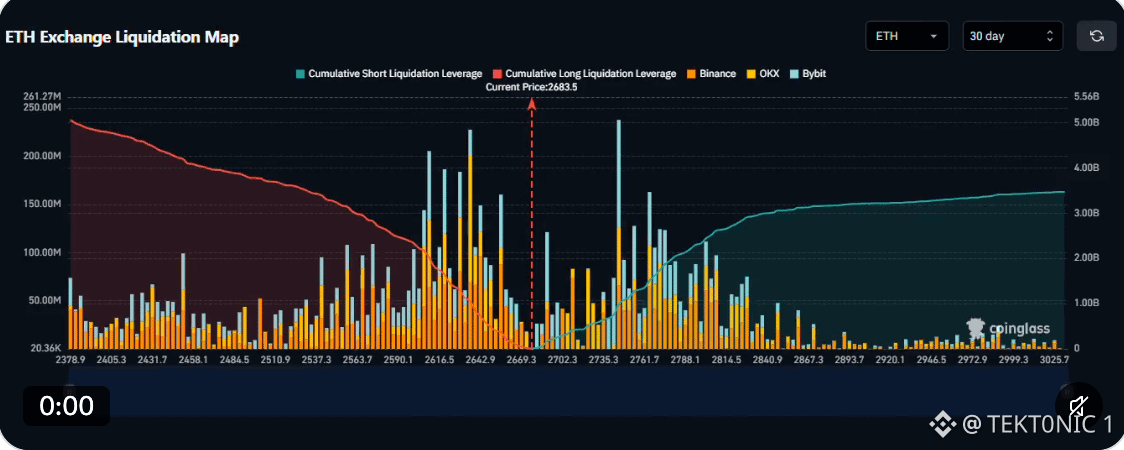
$ETH is trading between two liquidation clusters on the Coinglass map. The current price is about $2,683. Short liquidations stack up around $2,735 to $2,760, with the denser bars near $2,750. Long liquidations sit lower, with the heavier bars around $2,600 to $2,620. Binance, OKX, and Bybit account for most of the size. the cumulative lines match the bars. Short liquidation leverage builds as price moves higher. Long liquidation leverage is already large below the market and thins out into $2,683. one important distinction: these are estimated leveraged positions, not resting orders. Price does not have to tag either level, and it can clear one side and reverse before the other is touched. $2,750 and $2,600 are about 2.5% and 3% away. still, both clusters are close enough to matter. A push through $2,750 clears the nearby short side. A drop through $2,600 clears the nearby long side. Taking both in one move would need a wider range than this map shows yet. #BTC Price Analysis# #Altcoin Season# $BTC $ETH #Ethereum
$ETH is trading between two liquidation clusters on the Coinglass map. The current price is about $2,683. Short liquidations stack up around $2,735 to $2,760, with the denser bars near $2,750. Long liquidations sit lower, with the heavier bars around $2,600 to $2,620. Binance, OKX, and Bybit account for most of the size. the cumulative lines match the bars. Short liquidation leverage builds as price moves higher. Long liquidation leverage is already large below the market and thins out into $2,683. one important distinction: these are estimated leveraged positions, not resting orders. Price does not have to tag either level, and it can clear one side and reverse before the other is touched. $2,750 and $2,600 are about 2.5% and 3% away. still, both clusters are close enough to matter. A push through $2,750 clears the nearby short side. A drop through $2,600 clears the nearby long side. Taking both in one move would need a wider range than this map shows yet. #BTC Price Analysis# #Altcoin Season# $BTC $ETH #Ethereum
42
·
--
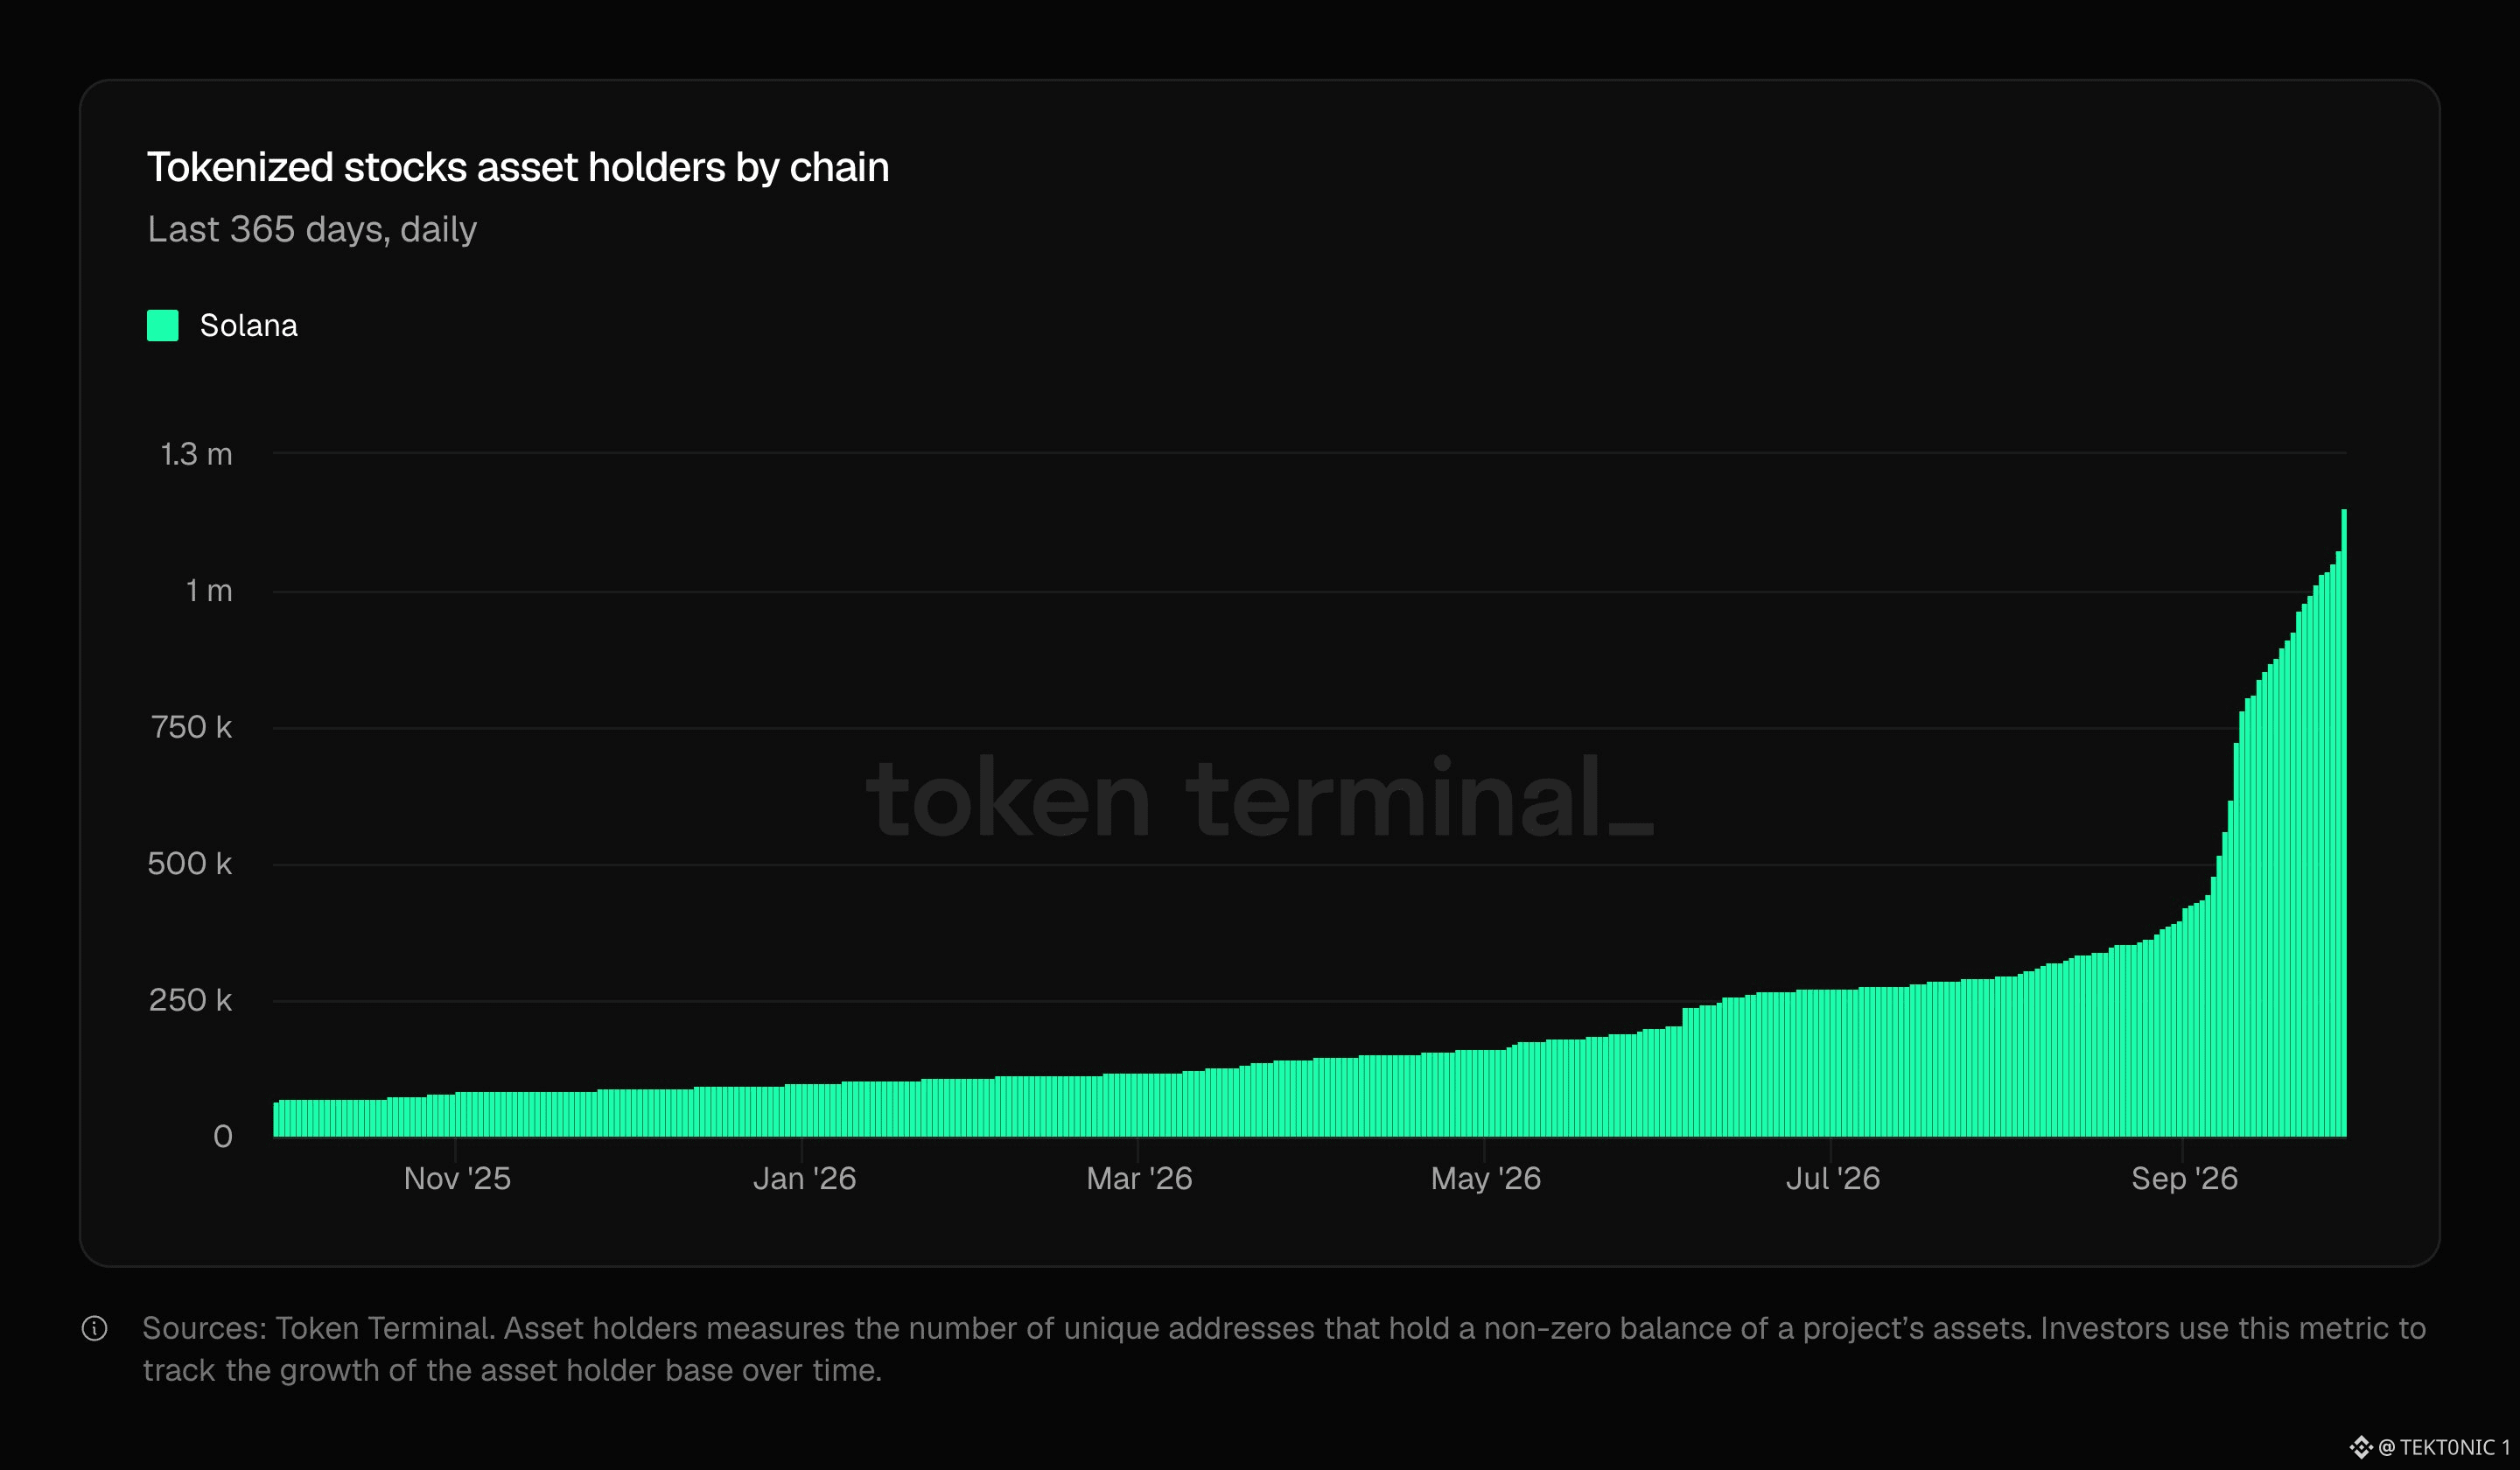
Solana is seeing rapid growth in tokenized equities. the latest data shows ~1.2M tokenized-stock holders on $SOL , as a new record. that is a major increase from 278,784 holders on July 1, putting holder growth at more than 4x in roughly three months. the growth is coming from multiple issuers. xStocks has more than 626K holders, while Backpack has grown to over 271K. PreStocks has also crossed 100K. at the same time, Solana’s tokenized-stock market cap climbed 43% in Q3 to $514.8M, while DEX volume reached $5.76B. tokenized equities are moving beyond a niche use case. 1.2M holders is a notable milestone for onchain equities on $SOL ecosystem. #BTC Price Analysis# #Macro Insights# #Altcoin Season# $BTC
Solana is seeing rapid growth in tokenized equities. the latest data shows ~1.2M tokenized-stock holders on $SOL , as a new record. that is a major increase from 278,784 holders on July 1, putting holder growth at more than 4x in roughly three months. the growth is coming from multiple issuers. xStocks has more than 626K holders, while Backpack has grown to over 271K. PreStocks has also crossed 100K. at the same time, Solana’s tokenized-stock market cap climbed 43% in Q3 to $514.8M, while DEX volume reached $5.76B. tokenized equities are moving beyond a niche use case. 1.2M holders is a notable milestone for onchain equities on $SOL ecosystem. #BTC Price Analysis# #Macro Insights# #Altcoin Season# $BTC
57
·
--
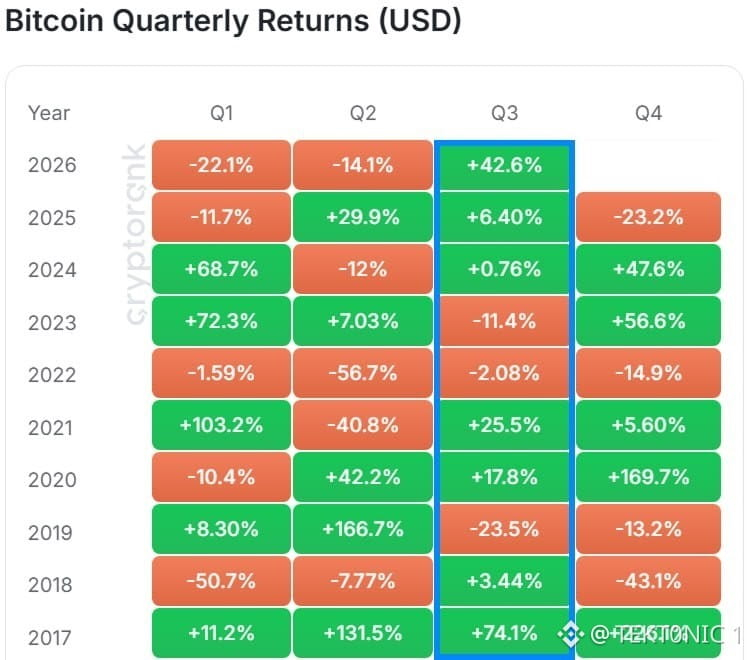
according to cryptorank, $BTC gained 42.6% in q3 2026. that is the strongest third quarter on this chart since 2017, when q3 was +74.1%. the next best recent q3 was 2021 at +25.5%. 2020 was +17.8%. 2025 was only +6.4%. a 42% quarter is the outlier. the first half is why the bounce looks so large. q1 was −22.1%. q2 was −14.1%. two red quarters, then one green quarter that recovered most of the hole. price went from about $58,600 at the start of july to about $84,000. the year is still slightly red. the october 2025 high near $126,000 is still well above. a hot q3 does not lock q4. on this same chart, 2024 q3 was flat at +0.76% and q4 was +47.6%. 2025 q3 was +6.4% and q4 was −23.2%. 2017 q3 was +74.1% and q4 was +226%. the next cell can go either way. spot etfs took in about $6.3 billion in the quarter. that demand helped. it does not price october. watch whether $BTC weekly closes hold the 50-week average near $79,000, and whether etf flows stay green after the nine-day streak broke on the last session of september. the quarter is closed. q4 is empty on this chart. #Bitcoin Price Prediction: What is Bitcoins next move?# #BTC Price Analysis# $XRP #Bullish
according to cryptorank, $BTC gained 42.6% in q3 2026. that is the strongest third quarter on this chart since 2017, when q3 was +74.1%. the next best recent q3 was 2021 at +25.5%. 2020 was +17.8%. 2025 was only +6.4%. a 42% quarter is the outlier. the first half is why the bounce looks so large. q1 was −22.1%. q2 was −14.1%. two red quarters, then one green quarter that recovered most of the hole. price went from about $58,600 at the start of july to about $84,000. the year is still slightly red. the october 2025 high near $126,000 is still well above. a hot q3 does not lock q4. on this same chart, 2024 q3 was flat at +0.76% and q4 was +47.6%. 2025 q3 was +6.4% and q4 was −23.2%. 2017 q3 was +74.1% and q4 was +226%. the next cell can go either way. spot etfs took in about $6.3 billion in the quarter. that demand helped. it does not price october. watch whether $BTC weekly closes hold the 50-week average near $79,000, and whether etf flows stay green after the nine-day streak broke on the last session of september. the quarter is closed. q4 is empty on this chart. #Bitcoin Price Prediction: What is Bitcoins next move?# #BTC Price Analysis# $XRP #Bullish
79
·
--
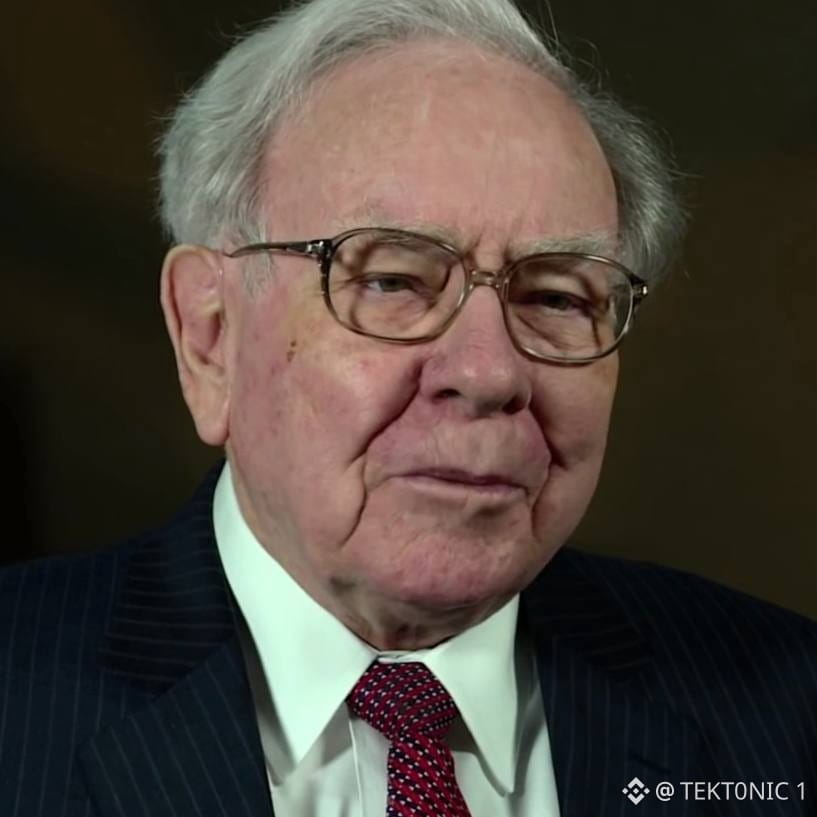
everyone wants to be the next Warren Buffett. meaning everyone wants to build the kind of wealth Buffett built. but almost nobody wants to copy the part that actually takes decades. Buffett bought Coca-Cola in 1988 and said his favorite holding period was forever. Berkshire still holds the position today. now imagine applying that mindset to $BTC . most traders struggle to hold through a 20–30% drawdown, let alone multiple market cycles. Buffett’s edge was not finding a trade every week. it was owning assets he understood, staying patient and letting compounding work. everyone wants to get rich fast. Buffett built wealth slowly, patiently and over decades. that part is much harder to replicate. #BTC Price Analysis# #Bitcoin Price Prediction: What is Bitcoins next move?# $BTC $XRP #Bullish
everyone wants to be the next Warren Buffett. meaning everyone wants to build the kind of wealth Buffett built. but almost nobody wants to copy the part that actually takes decades. Buffett bought Coca-Cola in 1988 and said his favorite holding period was forever. Berkshire still holds the position today. now imagine applying that mindset to $BTC . most traders struggle to hold through a 20–30% drawdown, let alone multiple market cycles. Buffett’s edge was not finding a trade every week. it was owning assets he understood, staying patient and letting compounding work. everyone wants to get rich fast. Buffett built wealth slowly, patiently and over decades. that part is much harder to replicate. #BTC Price Analysis# #Bitcoin Price Prediction: What is Bitcoins next move?# $BTC $XRP #Bullish

·
--
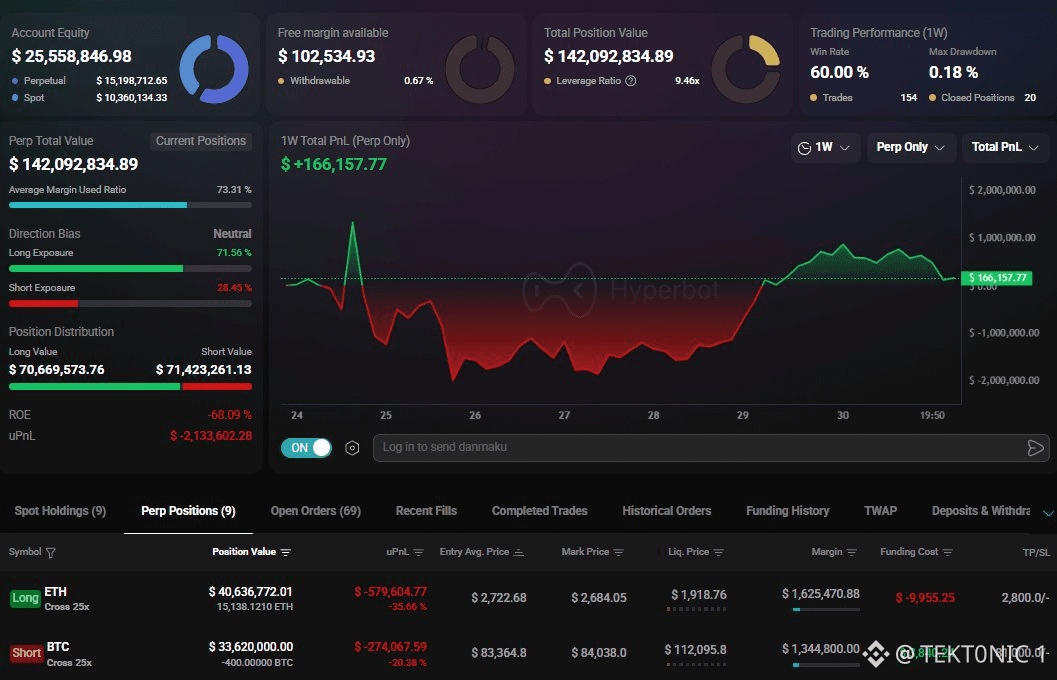
a whale is going long on $ETH and shorting $BTC at the same time. the ether position is $40.64 million, 15,138 ETH at 25x, entry $2,722.68. the bitcoin position is $33.62 million, 400 BTC short at 25x, entry $83,365. both sides are red. ether is about −$580,000. bitcoin is about −$274,000. equity behind the positions is $25.6 million. perp exposure is $142 million. leverage is 9.5 times. free margin is $102,500, or 0.67%. long value is $70.67 million. short value is $71.42 million. direction is tagged neutral. nine perps are open. we only see these two. ether did outperform bitcoin this quarter. ETH is up about 67–71% in q3. bitcoin is up about 43%. $ETH / $BTC sits near 0.032, still under the mid-september high near 0.0334. spot bitcoin etfs still took the larger bid. long ether versus short bitcoin is how you express that gap without a net dollar bet. it is not a lock that the gap keeps running. 25 times on both sides with almost no free margin means the next $1,000 move forces the issue. watch whether those two sizes stay on after funding, and whether the other seven perps stay balanced. the pair is only the part that is visible. #BTC Price Analysis# #Bitcoin Price Prediction: What is Bitcoins next move?# #Ethereum #Macro Insights#
a whale is going long on $ETH and shorting $BTC at the same time. the ether position is $40.64 million, 15,138 ETH at 25x, entry $2,722.68. the bitcoin position is $33.62 million, 400 BTC short at 25x, entry $83,365. both sides are red. ether is about −$580,000. bitcoin is about −$274,000. equity behind the positions is $25.6 million. perp exposure is $142 million. leverage is 9.5 times. free margin is $102,500, or 0.67%. long value is $70.67 million. short value is $71.42 million. direction is tagged neutral. nine perps are open. we only see these two. ether did outperform bitcoin this quarter. ETH is up about 67–71% in q3. bitcoin is up about 43%. $ETH / $BTC sits near 0.032, still under the mid-september high near 0.0334. spot bitcoin etfs still took the larger bid. long ether versus short bitcoin is how you express that gap without a net dollar bet. it is not a lock that the gap keeps running. 25 times on both sides with almost no free margin means the next $1,000 move forces the issue. watch whether those two sizes stay on after funding, and whether the other seven perps stay balanced. the pair is only the part that is visible. #BTC Price Analysis# #Bitcoin Price Prediction: What is Bitcoins next move?# #Ethereum #Macro Insights#
Log in to explore more content
Join global crypto users on Binance Square
⚡️ Get latest and useful information about crypto.
💬 Trusted by the world’s largest crypto exchange.
👍 Discover real insights from verified creators.
Email / Phone number