

Binance Brasil Official
1.3k Posts

Binance Brasil Official
 Binance Officially Verified Account
Report
Binance Brasil | Bitcoin, Cripto e MUITO mais.
Aprenda a investir em cripto com segurança 🇧🇷
Sua vida financeira na Binance.
9 Following
42.2K+ Followers
10.4K+ Liked
Posts
All
Quotes
Videos
Live
What is the first step in understanding where your money goes?
What is the first step in understanding where your money goes?
Investir 💰
Acompanhar os gastos 📝
Cortar todo lazer ❌
19 hr(s) left
142
Enable login alerts on your account. 🔔 You’ll receive an email whenever there’s a new sign-in.
Don’t recognize the sign-in? Change your password and review your devices right away.
Visibility is security.
Enable login alerts on your account. 🔔 You’ll receive an email whenever there’s a new sign-in.
Don’t recognize the sign-in? Change your password and review your devices right away.
Visibility is security.
Don’t recognize the sign-in? Change your password and review your devices right away.
Visibility is security.
2
7
225
GM to everyone who opened their eyes and remembered they have a bill due today. 🫥
GM to everyone who opened their eyes and remembered they have a bill due today. 🫥
1
144
Price is one of the things you can track in the crypto market.
But a lot happens on the blockchain that a price chart doesn’t show.
Here are 5 on-chain metrics to help you start understanding this data 👇
Let’s start with two acronyms you’ll see a lot: MVRV and SOPR.
MVRV compares market value with realized value.
SOPR helps you see whether the assets being moved are being sold at a profit or a loss.
Another one is Exchange Netflow.
It calculates the balance between what flows into and out of exchanges.
More inflows don’t automatically mean selling.
More outflows don’t automatically mean buying.
It’s a metric that needs context.
There are also active addresses.
This metric helps track network activity by looking at the addresses involved in transactions.
But there’s one important detail:
one address doesn’t equal one person. The same person can control several.
And what about NVT?
It compares the network’s value with transaction volume. The idea is to look at the relationship between the network’s value and the activity recorded on it.
MVRV. SOPR. Netflow. Active addresses. NVT.
You don’t need to memorize everything. And none of these metrics can predict the market on its own.
The first step is understanding what each one measures.
Which of these did you already know about?
Price is one of the things you can track in the crypto market.
But a lot happens on the blockchain that a price chart doesn’t show.
Here are 5 on-chain metrics to help you start understanding this data 👇
Let’s start with two acronyms you’ll see a lot: MVRV and SOPR.
MVRV compares market value with realized value.
SOPR helps you see whether the assets being moved are being sold at a profit or a loss.
Another one is Exchange Netflow.
It calculates the balance between what flows into and out of exchanges.
More inflows don’t automatically mean selling.
More outflows don’t automatically mean buying.
It’s a metric that needs context.
There are also active addresses.
This metric helps track network activity by looking at the addresses involved in transactions.
But there’s one important detail:
one address doesn’t equal one person. The same person can control several.
And what about NVT?
It compares the network’s value with transaction volume. The idea is to look at the relationship between the network’s value and the activity recorded on it.
MVRV. SOPR. Netflow. Active addresses. NVT.
You don’t need to memorize everything. And none of these metrics can predict the market on its own.
The first step is understanding what each one measures.
Which of these did you already know about?
But a lot happens on the blockchain that a price chart doesn’t show.
Here are 5 on-chain metrics to help you start understanding this data 👇
Let’s start with two acronyms you’ll see a lot: MVRV and SOPR.
MVRV compares market value with realized value.
SOPR helps you see whether the assets being moved are being sold at a profit or a loss.
Another one is Exchange Netflow.
It calculates the balance between what flows into and out of exchanges.
More inflows don’t automatically mean selling.
More outflows don’t automatically mean buying.
It’s a metric that needs context.
There are also active addresses.
This metric helps track network activity by looking at the addresses involved in transactions.
But there’s one important detail:
one address doesn’t equal one person. The same person can control several.
And what about NVT?
It compares the network’s value with transaction volume. The idea is to look at the relationship between the network’s value and the activity recorded on it.
MVRV. SOPR. Netflow. Active addresses. NVT.
You don’t need to memorize everything. And none of these metrics can predict the market on its own.
The first step is understanding what each one measures.
Which of these did you already know about?
1
4
542
Downtime is also part of the journey.
Disconnecting doesn't mean missing opportunities.
It's reclaiming your attention.
Downtime is also part of the journey.
Disconnecting doesn't mean missing opportunities.
It's reclaiming your attention.
Disconnecting doesn't mean missing opportunities.
It's reclaiming your attention.
4
207
Good morning to everyone who’s already worked, replied to a message, checked the market, and it’s not even 9 a.m. yet. ☕
Good morning to everyone who’s already worked, replied to a message, checked the market, and it’s not even 9 a.m. yet. ☕

2
340
If you didn’t request an authentication code but received one, don’t ignore it completely. 🧐
Someone may be trying to access your account.
If you didn’t request an authentication code but received one, don’t ignore it completely. 🧐
Someone may be trying to access your account.
Someone may be trying to access your account.
14
725
“I earned 20%” sounds simple until you ask: 20% on what amount and over what period? 🧮
ROI helps measure the return on invested capital, but it doesn’t show the timeframe, risk, or costs by itself.
Understand the calculation 👇
[https://academy.binance.com/pt-BR/articles/how-to-calculate-return-on-investment-roi](https://academy.binance.com/pt-BR/articles/how-to-calculate-return-on-investment-roi)
“I earned 20%” sounds simple until you ask: 20% on what amount and over what period? 🧮
ROI helps measure the return on invested capital, but it doesn’t show the timeframe, risk, or costs by itself.
Understand the calculation 👇
https://academy.binance.com/pt-BR/articles/how-to-calculate-return-on-investment-roi
ROI helps measure the return on invested capital, but it doesn’t show the timeframe, risk, or costs by itself.
Understand the calculation 👇
https://academy.binance.com/pt-BR/articles/how-to-calculate-return-on-investment-roi
3
211
Quick quiz: which one is a scam? 👀
Quick quiz: which one is a scam? 👀
“Pode dar prejuízo”
7%
“Lucro garantido”
93%
“O retorno varia”
0%
14 votes • Voting closed
220
Something that seems obvious to people already in crypto, but isn’t to newcomers:
you don’t need to buy 1 whole Bitcoin.
You can buy a small fraction.
On Binance, you can start with R$10.
Yes, R$10. 👀
Something that seems obvious to people already in crypto, but isn’t to newcomers:
you don’t need to buy 1 whole Bitcoin.
You can buy a small fraction.
On Binance, you can start with R$10.
Yes, R$10. 👀
you don’t need to buy 1 whole Bitcoin.
You can buy a small fraction.
On Binance, you can start with R$10.
Yes, R$10. 👀
1
6
1k
Morning. New week, important reminder:
“High, fast, guaranteed profits.”
Three words that, together, should set off alarm bells. 🚨
Morning. New week, important reminder:
“High, fast, guaranteed profits.”
Three words that, together, should set off alarm bells. 🚨
“High, fast, guaranteed profits.”
Three words that, together, should set off alarm bells. 🚨
3
366
“But he knew my name.”
Your name can be on X, Instagram, LinkedIn, and in countless databases.
Knowing something about you doesn’t prove that someone is who they claim to be.
“But he knew my name.”
Your name can be on X, Instagram, LinkedIn, and in countless databases.
Knowing something about you doesn’t prove that someone is who they claim to be.
Your name can be on X, Instagram, LinkedIn, and in countless databases.
Knowing something about you doesn’t prove that someone is who they claim to be.
1
8
814
The market never really closes.
That’s why you need to know when to close the app. 🌱
The market never really closes.
That’s why you need to know when to close the app. 🌱
That’s why you need to know when to close the app. 🌱
1
6
448

Be suspicious if:
🚩 they promised a guaranteed return
🚩 they rushed you to decide
🚩 they asked you to keep it secret
🚩 they sent you a strange link.
Scams love urgency. Security takes a deep breath.
Be suspicious if:
🚩 they promised a guaranteed return
🚩 they rushed you to decide
🚩 they asked you to keep it secret
🚩 they sent you a strange link.
Scams love urgency. Security takes a deep breath.
🚩 they promised a guaranteed return
🚩 they rushed you to decide
🚩 they asked you to keep it secret
🚩 they sent you a strange link.
Scams love urgency. Security takes a deep breath.
11
726
Good morning.
Not every movement needs to be followed.
Sometimes, the best trade is to step away from the screen. 🧘
Good morning.
Not every movement needs to be followed.
Sometimes, the best trade is to step away from the screen. 🧘
Not every movement needs to be followed.
Sometimes, the best trade is to step away from the screen. 🧘
1
2
9
519
Inflation, interest rates, the stock market, Bitcoin, and gold moved this week.
It may seem like a lot is happening at the same time, but most of this story starts in the same place: U.S. economic data.
Friday Market, in 2 minutes👇
1/ U.S. inflation came in milder than expected.
The PCE, one of the main inflation measures followed by the U.S. central bank, was 3.4%, with core at 3.0%.
And why does this matter for people who track the market?
2/ Because inflation and interest rates are directly linked.
With milder inflation and weaker employment generation data, the market scaled back expectations for another interest rate hike as early as October.
The decision, of course, remains in the hands of the U.S. central bank.
3/ The U.S. stock market felt this shift in expectations.
The S&P 500 regained some momentum at the end of the week and closed near 7,666 points.
It’s a good example of how an economic data point can quickly change investors’ outlook for different assets.
4/ In crypto, Bitcoin started October in the green. ₿
It rose about 2% to 3% over the week and ended the third quarter up nearly 42%, its best quarter since 2024.
One important detail: year-to-date, BTC is still down.
5/ Meanwhile, gold went the other way. 🥇
After months of gains, the metal fell during the week and was near US$ 4.180 per ounce.
Gold is often sought as a reserve in times of higher uncertainty, so it’s worth watching how it reacts when expectations change.
6/ In the end, tracking the market is a bit like putting together a jigsaw puzzle.
Inflation shapes interest-rate expectations. Interest rates feed into decisions about stocks, crypto, and other assets. And each market reacts differently.
Price shows the move. Context helps explain where it came from.
Risk notice: the prices of digital assets can be volatile and you may not get back the value you invested. This content is for educational and informational purposes only and does not constitute investment advice or financial guidance.
Inflation, interest rates, the stock market, Bitcoin, and gold moved this week.
It may seem like a lot is happening at the same time, but most of this story starts in the same place: U.S. economic data.
Friday Market, in 2 minutes👇
1/ U.S. inflation came in milder than expected.
The PCE, one of the main inflation measures followed by the U.S. central bank, was 3.4%, with core at 3.0%.
And why does this matter for people who track the market?
2/ Because inflation and interest rates are directly linked.
With milder inflation and weaker employment generation data, the market scaled back expectations for another interest rate hike as early as October.
The decision, of course, remains in the hands of the U.S. central bank.
3/ The U.S. stock market felt this shift in expectations.
The S&P 500 regained some momentum at the end of the week and closed near 7,666 points.
It’s a good example of how an economic data point can quickly change investors’ outlook for different assets.
4/ In crypto, Bitcoin started October in the green. ₿
It rose about 2% to 3% over the week and ended the third quarter up nearly 42%, its best quarter since 2024.
One important detail: year-to-date, BTC is still down.
5/ Meanwhile, gold went the other way. 🥇
After months of gains, the metal fell during the week and was near US$ 4.180 per ounce.
Gold is often sought as a reserve in times of higher uncertainty, so it’s worth watching how it reacts when expectations change.
6/ In the end, tracking the market is a bit like putting together a jigsaw puzzle.
Inflation shapes interest-rate expectations. Interest rates feed into decisions about stocks, crypto, and other assets. And each market reacts differently.
Price shows the move. Context helps explain where it came from.
Risk notice: the prices of digital assets can be volatile and you may not get back the value you invested. This content is for educational and informational purposes only and does not constitute investment advice or financial guidance.
It may seem like a lot is happening at the same time, but most of this story starts in the same place: U.S. economic data.
Friday Market, in 2 minutes👇
1/ U.S. inflation came in milder than expected.
The PCE, one of the main inflation measures followed by the U.S. central bank, was 3.4%, with core at 3.0%.
And why does this matter for people who track the market?
2/ Because inflation and interest rates are directly linked.
With milder inflation and weaker employment generation data, the market scaled back expectations for another interest rate hike as early as October.
The decision, of course, remains in the hands of the U.S. central bank.
3/ The U.S. stock market felt this shift in expectations.
The S&P 500 regained some momentum at the end of the week and closed near 7,666 points.
It’s a good example of how an economic data point can quickly change investors’ outlook for different assets.
4/ In crypto, Bitcoin started October in the green. ₿
It rose about 2% to 3% over the week and ended the third quarter up nearly 42%, its best quarter since 2024.
One important detail: year-to-date, BTC is still down.
5/ Meanwhile, gold went the other way. 🥇
After months of gains, the metal fell during the week and was near US$ 4.180 per ounce.
Gold is often sought as a reserve in times of higher uncertainty, so it’s worth watching how it reacts when expectations change.
6/ In the end, tracking the market is a bit like putting together a jigsaw puzzle.
Inflation shapes interest-rate expectations. Interest rates feed into decisions about stocks, crypto, and other assets. And each market reacts differently.
Price shows the move. Context helps explain where it came from.
Risk notice: the prices of digital assets can be volatile and you may not get back the value you invested. This content is for educational and informational purposes only and does not constitute investment advice or financial guidance.
2
1k
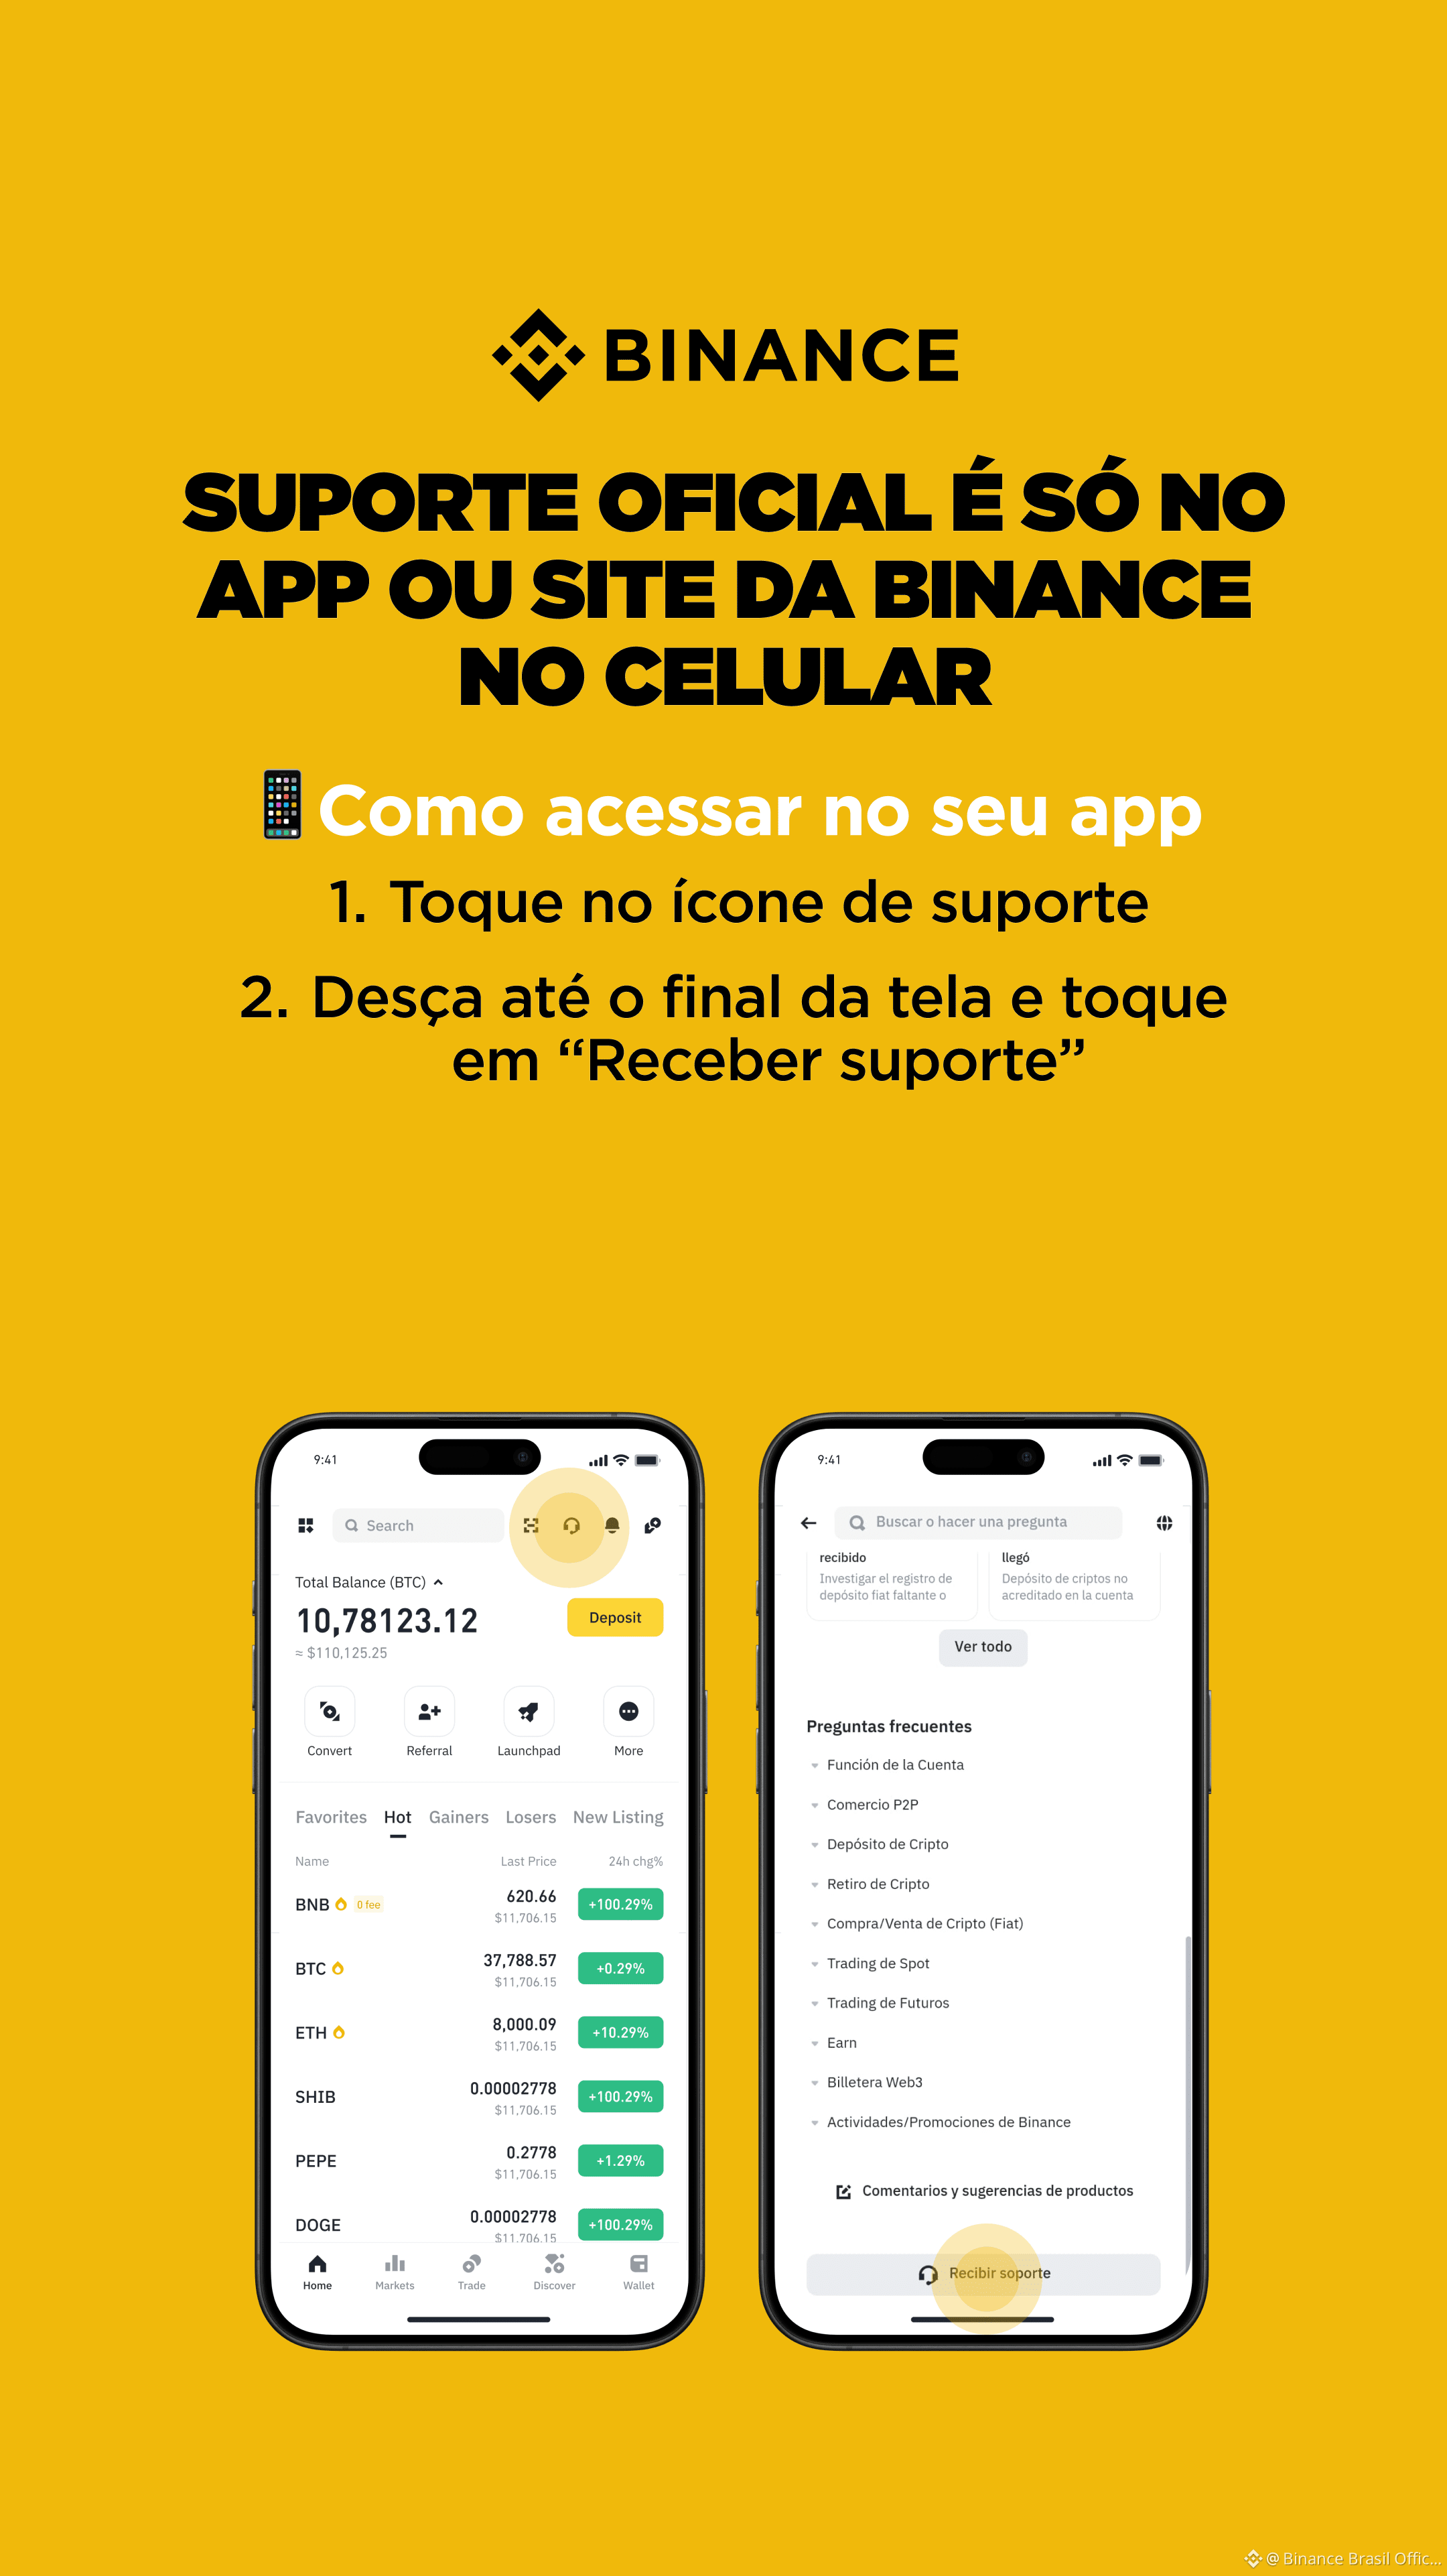
You just need to call. But through the right channel. 👇
[https://www.binance.com/pt-BR/chat](https://www.binance.com/pt-BR/chat)
Binance does not provide support via DM, unofficial WhatsApp, or any other channel.
Always check our official links here:
https://linktr.ee/binancebrasil
You just need to call. But through the right channel. 👇
https://www.binance.com/pt-BR/chat
Binance does not provide support via DM, unofficial WhatsApp, or any other channel.
Always check our official links here:
https://linktr.ee/binancebrasil
https://www.binance.com/pt-BR/chat
Binance does not provide support via DM, unofficial WhatsApp, or any other channel.
Always check our official links here:
https://linktr.ee/binancebrasil

1
205
The scam doesn’t always start with “you won.”
Sometimes it starts with:
“We detected an access.”
“Your account will be locked.”
“We need to confirm your details.”
Fear also makes people click.
The scam doesn’t always start with “you won.”
Sometimes it starts with:
“We detected an access.”
“Your account will be locked.”
“We need to confirm your details.”
Fear also makes people click.
Sometimes it starts with:
“We detected an access.”
“Your account will be locked.”
“We need to confirm your details.”
Fear also makes people click.
1
1
15
840
Café: ready.
Market: open.
Plans: subject to change.
GM.
Café: ready.
Market: open.
Plans: subject to change.
GM.
Market: open.
Plans: subject to change.
GM.
3
241
Log in to explore more content
Join global crypto users on Binance Square
⚡️ Get latest and useful information about crypto.
💬 Trusted by the world’s largest crypto exchange.
👍 Discover real insights from verified creators.
Email / Phone number
Trending Topics
FedMinutesFocusOnOctoberPause
102,463 views
1,046 Discussing
🚨 HIGH ALERT ‼️ PLEASE DON’T TRADE BLINDLY FOR THE NEXT HOUR 🚨
Guys, we have FOMC Minutes coming in less than 1 hour.
And after the kind of volatility we already saw today, I really don’t want anyone opening random high-leverage positions just before this release.
The biggest reaction I’m watching will be in Gold (XAU), Silver (XAG), BTC and ETH. Then coins like SOL and other highly leveraged mid/low-cap alts can exaggerate whatever move BTC makes.
Gold and Silver are especially sensitive tonight because the market is already reacting to the US dollar + Treasury yields, and both metals have been under heavy pressure ahead of the Fed minutes.
Briefly speaking
📉Hawkish Fed Minutes → Dollar/yields can push higher → pressure on BTC, crypto, Gold & silver
📈Dovish Fed Minutes → Dollar/yields can cool → BTC, Gold, Silver and risk assets can bounce hard.
And please remember the first candle can be a trap. We can get a pump, immediate dump, liquidations on both sides, and then the real direction.
So for now, protect your positions, reduce unnecessary leverage and don’t FOMO into the first move.
Tonight I’m watching $XAU , $XAG and $BTC first. These will tell us very quickly how the market is reading the Fed.
I will Update you guys on time
Follow @Panda Traders and Turn on Your notifications right now
#FedMinutesFocusOnOctoberPause
Panda Traders
·16 Likes
·3.1k views
BinanceLaunchesBinanceIntelligence
1.1M views
6,277 Discussing
EvernorthDelaysNasdaqDebutToOct12
6,348 views
199 Discussing