
無名先生
430 Posts

無名先生
 Square Verified
Cryptocurrency、金融分析師、信息搬運工 、合作DM 、主攻領域、#Airdrops
2 Following
1.1K+ Followers
337 Liked
Posts
All
Videos
#BTC #ETH #SOL #XRP
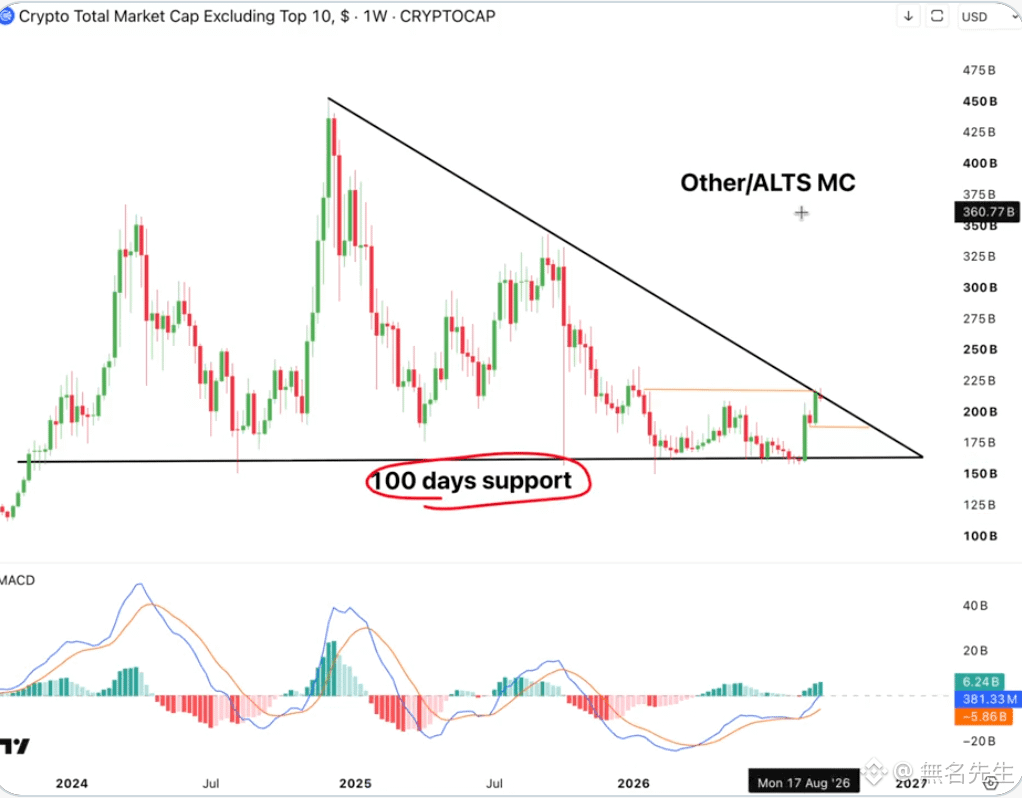
The counterfeit total market cap is currently testing a key resistance level.
After the past two weekly MACD crossovers bullish, each time it went through a not-insignificant stretch of行情.
Now the same signal is back. If it breaks through, there is plenty of upside room; if it gets rejected, there is also a clearly defined defensive zone.
The direction hasn’t been decided yet, but the time window is narrowing.
The counterfeit total market cap is currently testing a key resistance level.
After the past two weekly MACD crossovers bullish, each time it went through a not-insignificant stretch of行情.
Now the same signal is back. If it breaks through, there is plenty of upside room; if it gets rejected, there is also a clearly defined defensive zone.
The direction hasn’t been decided yet, but the time window is narrowing.
#BTC
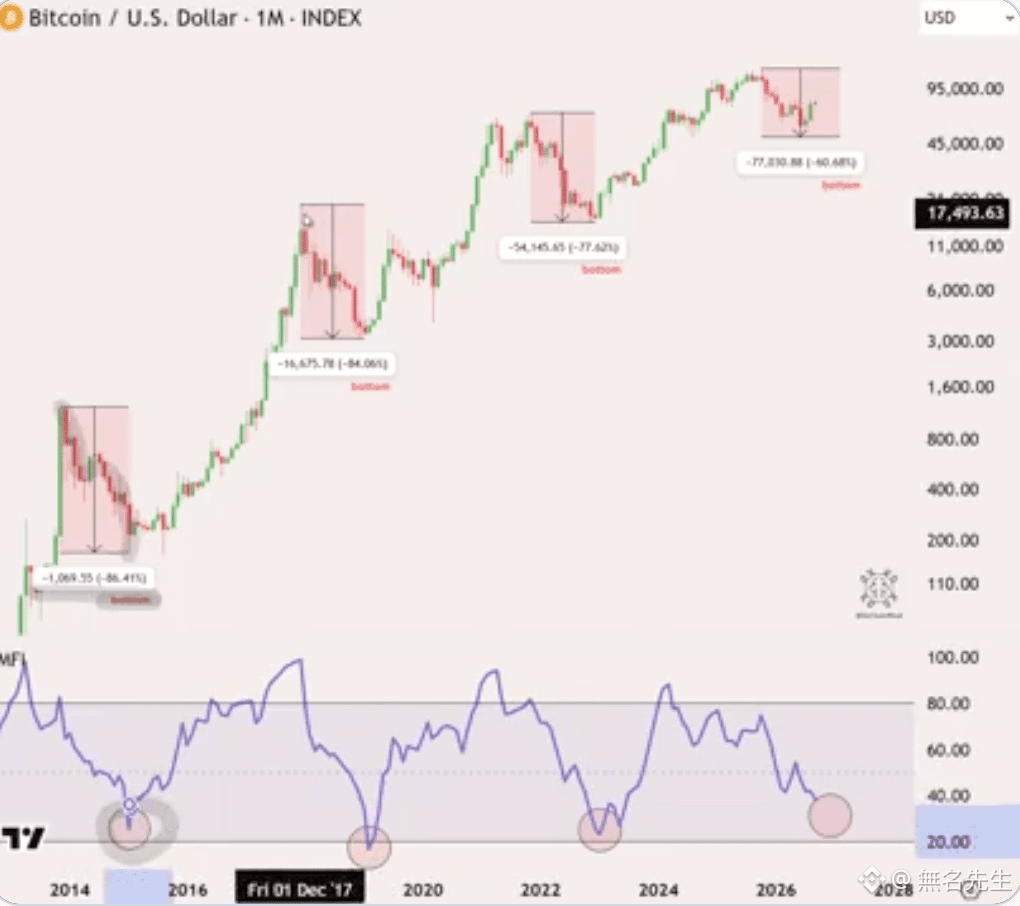
A few months ago, I also thought it was unlikely.
But now, it looks like every step is moving in that direction.
The structure is changing, the funds are moving, and the macro conditions are aligning.
Not a guarantee, but it’s becoming more reasonable than I imagined.
I’ll wait until it’s confirmed before acting, rather than guessing.
A few months ago, I also thought it was unlikely.
But now, it looks like every step is moving in that direction.
The structure is changing, the funds are moving, and the macro conditions are aligning.
Not a guarantee, but it’s becoming more reasonable than I imagined.
I’ll wait until it’s confirmed before acting, rather than guessing.
#DELL
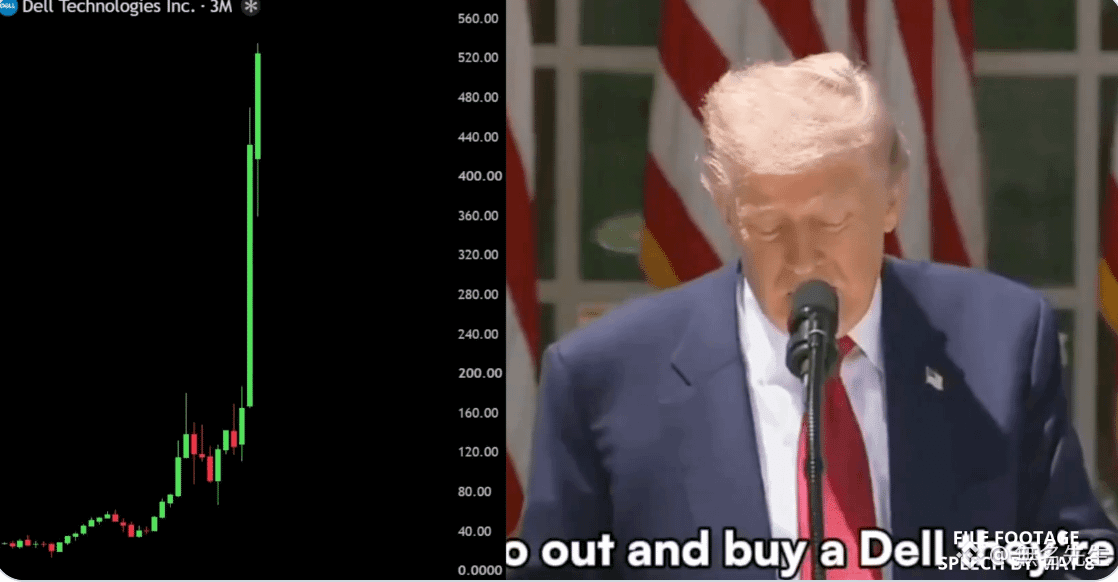
Before Trump even called for Dell, he had already bought it. Then the stock price has risen more than 340% since then.
It’s not the first time—posting, speaking, holding positions—every step came before the market did.
Actions matter more than shouting.
Before Trump even called for Dell, he had already bought it. Then the stock price has risen more than 340% since then.
It’s not the first time—posting, speaking, holding positions—every step came before the market did.
Actions matter more than shouting.
#BTC
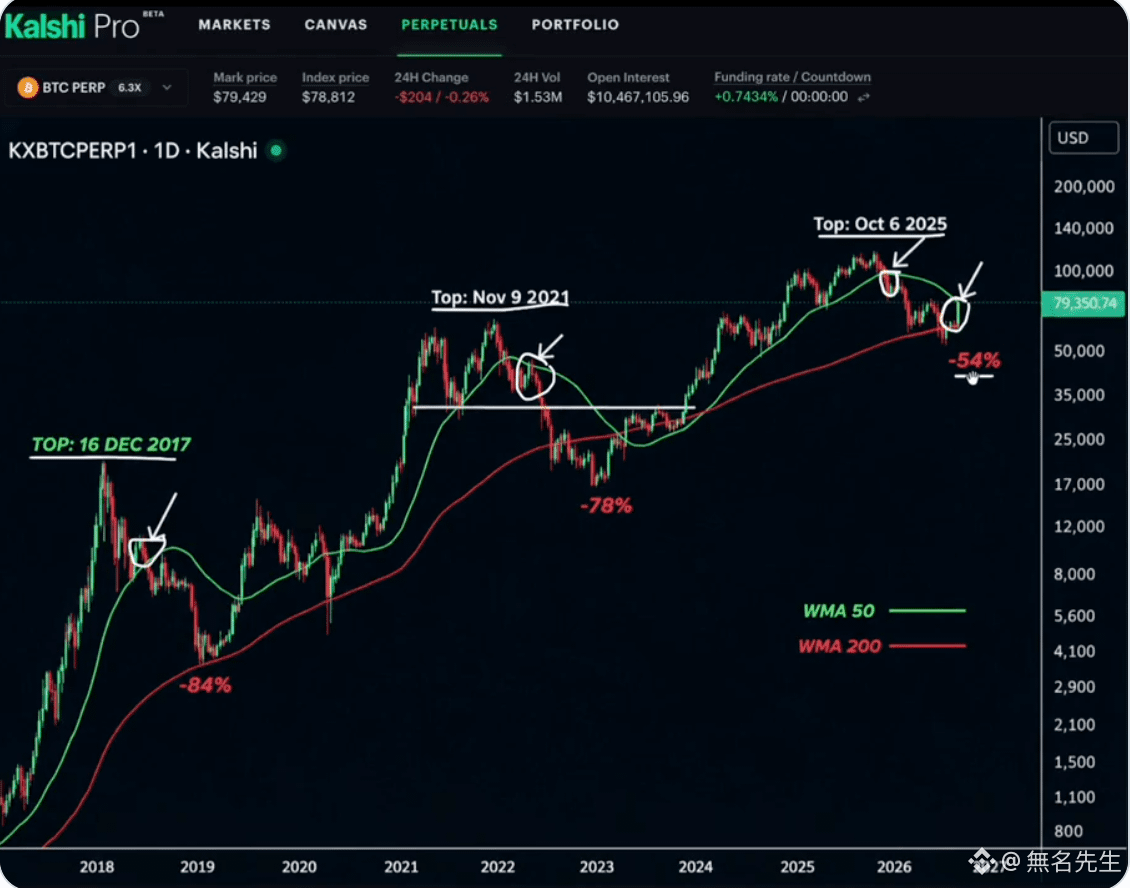
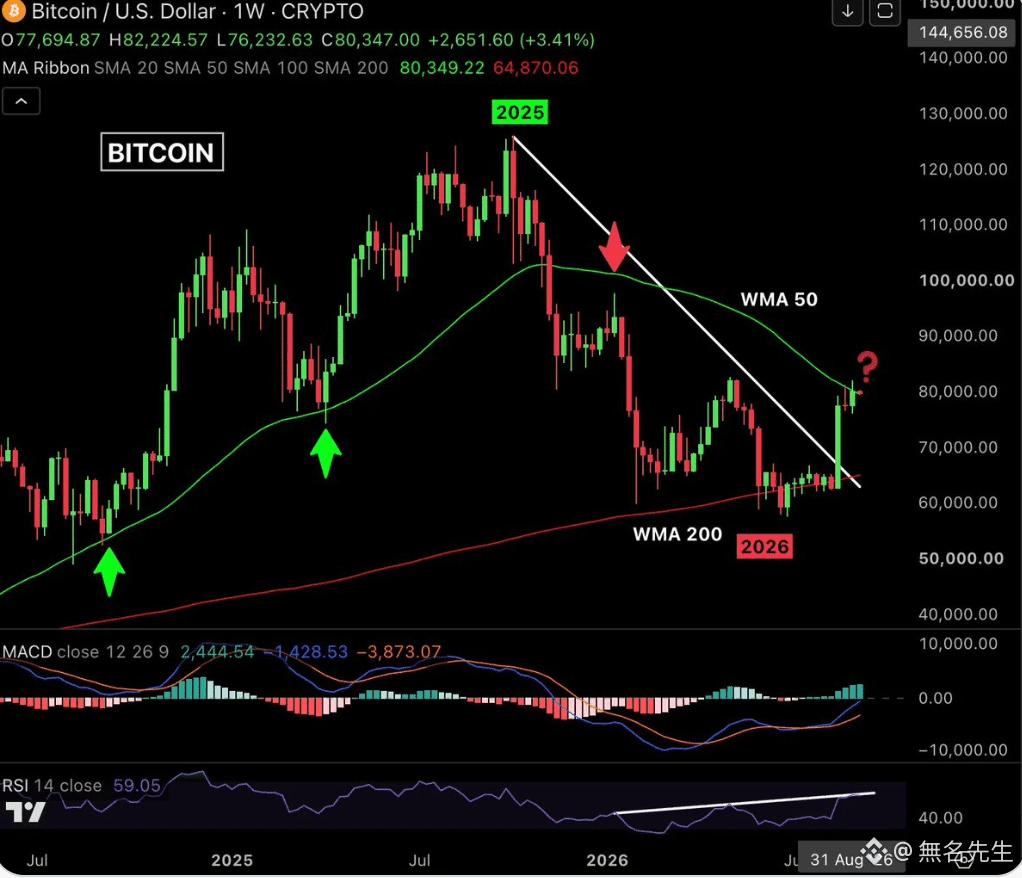
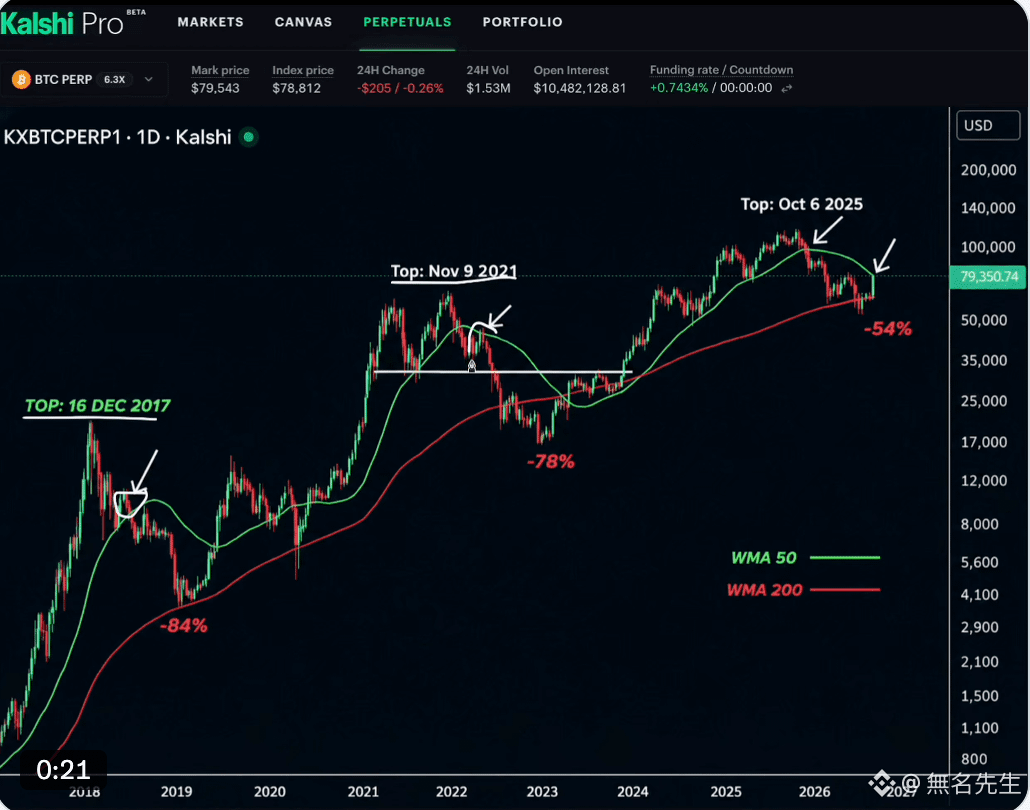
81K is the position that determines how this cycle will play out.
The 50-week moving average is pressing down here. The MACD and RSI have already turned upward, but indicators are only a forward-looking signal—if price doesn’t confirm, it’s all for nothing.
So far, there have already been several consecutive rejections at this level, and there truly is sell-side liquidity above.
If it still can’t break through this time, the long-side structure may be weakened further.
81K is the position that determines how this cycle will play out.
The 50-week moving average is pressing down here. The MACD and RSI have already turned upward, but indicators are only a forward-looking signal—if price doesn’t confirm, it’s all for nothing.
So far, there have already been several consecutive rejections at this level, and there truly is sell-side liquidity above.
If it still can’t break through this time, the long-side structure may be weakened further.
#BTC
The weekly chart has just closed near the 50-week moving average—80,349. This is a test, not a breakout. The direction hasn’t been decided yet; wait for the next candle to confirm.
If next week can hold above it and extend upward, then this level will become support.
If it gets rejected, it may need to pull back to a lower area.
There’s no conclusion right now—let the market choose.
The weekly chart has just closed near the 50-week moving average—80,349. This is a test, not a breakout. The direction hasn’t been decided yet; wait for the next candle to confirm.
If next week can hold above it and extend upward, then this level will become support.
If it gets rejected, it may need to pull back to a lower area.
There’s no conclusion right now—let the market choose.
#BTC
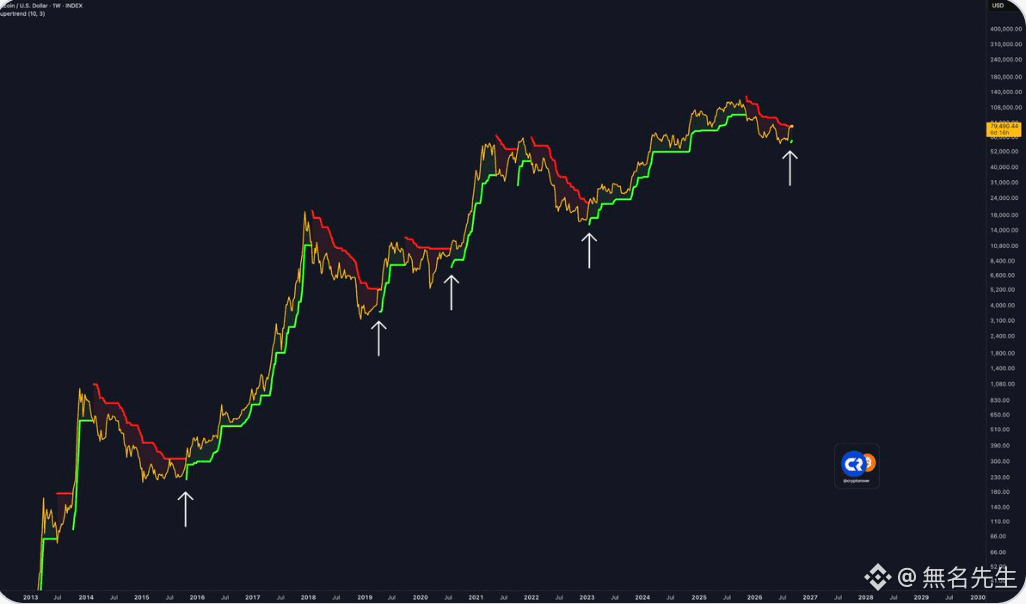
The weekly SuperTrend has just turned green—this is the first time since November 2025.
The last time this signal appeared was in January 2023, when BTC had just come out of the 15K bottom, and then it went on to rally all the way to 126K.
The instances of turning green in 2019 and 2020 also coincided with major trending market moves.
A clear fact is this: at the weekly timeframe, SuperTrend has never turned from red to green during a bear market—every time it turns green, it marks the start of a new trend cycle.
The weekly SuperTrend has just turned green—this is the first time since November 2025.
The last time this signal appeared was in January 2023, when BTC had just come out of the 15K bottom, and then it went on to rally all the way to 126K.
The instances of turning green in 2019 and 2020 also coincided with major trending market moves.
A clear fact is this: at the weekly timeframe, SuperTrend has never turned from red to green during a bear market—every time it turns green, it marks the start of a new trend cycle.
#BTC
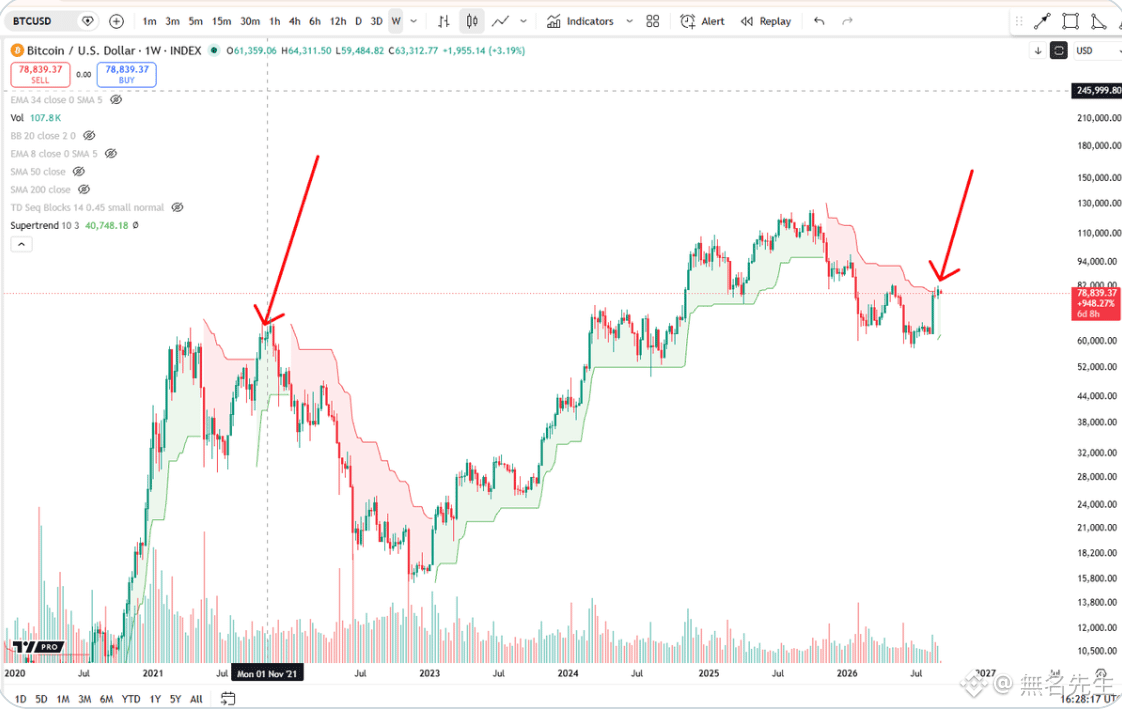
After SuperTrend flipped long in 2021, BTC indeed moved further—though it was the last leg within the top structure.
The current backdrop is similar to then: price has just rebounded from the bottom, and SuperTrend has confirmed the change in trend, but there is a clear resistance zone around the 82K area above.
Going long is a fact, but its significance depends on how price moves—not on the signal itself.
After SuperTrend flipped long in 2021, BTC indeed moved further—though it was the last leg within the top structure.
The current backdrop is similar to then: price has just rebounded from the bottom, and SuperTrend has confirmed the change in trend, but there is a clear resistance zone around the 82K area above.
Going long is a fact, but its significance depends on how price moves—not on the signal itself.
#LAPTOP
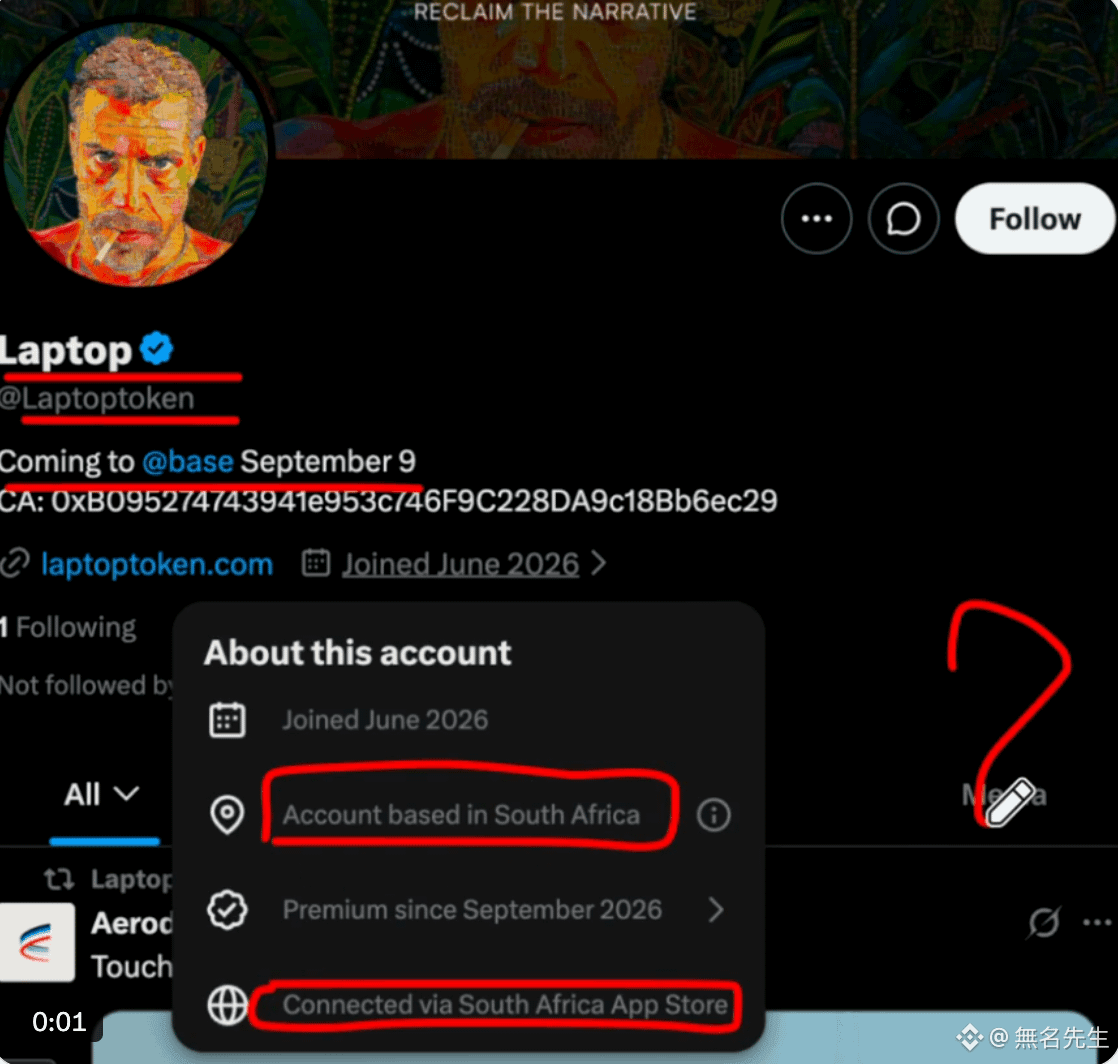
The official account is in South Africa—nothing really new there.
What’s key is that it’s truly tied to Hunter Biden—his own person is included in the founding team, and the official Twitter directly follows the project account.
30% of the tokens are held by the team; after a 6-month lockup, they are released over the following two years.
20% is a direct air drop to holders of $TRUMP, taking over the traffic pool from the previous political meme round.
The official account is in South Africa—nothing really new there.
What’s key is that it’s truly tied to Hunter Biden—his own person is included in the founding team, and the official Twitter directly follows the project account.
30% of the tokens are held by the team; after a 6-month lockup, they are released over the following two years.
20% is a direct air drop to holders of $TRUMP, taking over the traffic pool from the previous political meme round.
#BTC
At this position of 81K, it determines how the current cycle will play out.
The 50-week moving average is pressing down here. The MACD and RSI indicators have already turned up, but indicators are only leading signals—without price confirmation, it’s pointless.
So far, there have already been several consecutive rejections at this level, and sell-side orders above do exist.
If it still can’t break through this time, the long-biased structure may be weakened further.
At this position of 81K, it determines how the current cycle will play out.
The 50-week moving average is pressing down here. The MACD and RSI indicators have already turned up, but indicators are only leading signals—without price confirmation, it’s pointless.
So far, there have already been several consecutive rejections at this level, and sell-side orders above do exist.
If it still can’t break through this time, the long-biased structure may be weakened further.
#ETH
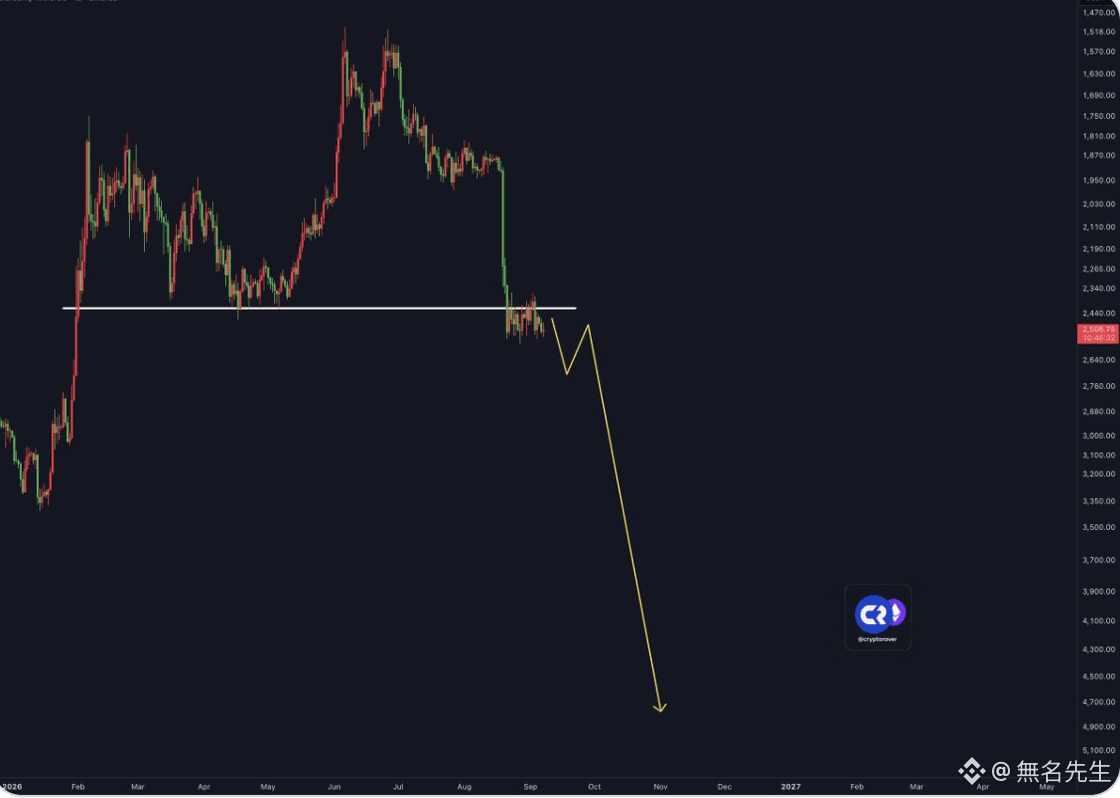
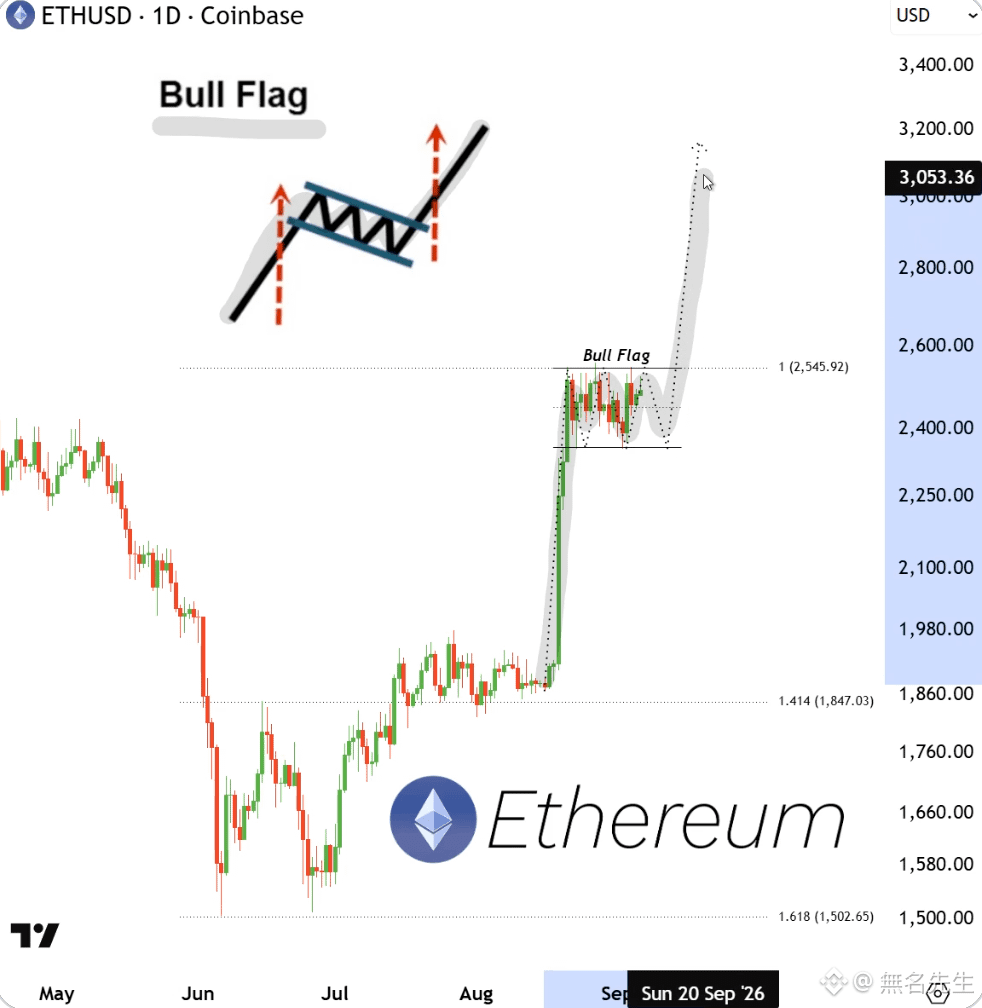
Saying that ETH is about to collapse—I think that’s a bit much.
Right now, the price is ranging between 2400 and 2600. There’s support below 2400 and resistance above 2600, which looks more like the market is digesting the previous upswing.
On-chain data also shows that the short-term holders’ cost basis is around 2430. Only if it breaks below 2300 would that be truly dangerous. But the market sentiment is still in the recovery phase, so saying “collapse” directly feels a bit deliberate.
Saying that ETH is about to collapse—I think that’s a bit much.
Right now, the price is ranging between 2400 and 2600. There’s support below 2400 and resistance above 2600, which looks more like the market is digesting the previous upswing.
On-chain data also shows that the short-term holders’ cost basis is around 2430. Only if it breaks below 2300 would that be truly dangerous. But the market sentiment is still in the recovery phase, so saying “collapse” directly feels a bit deliberate.
#BTC
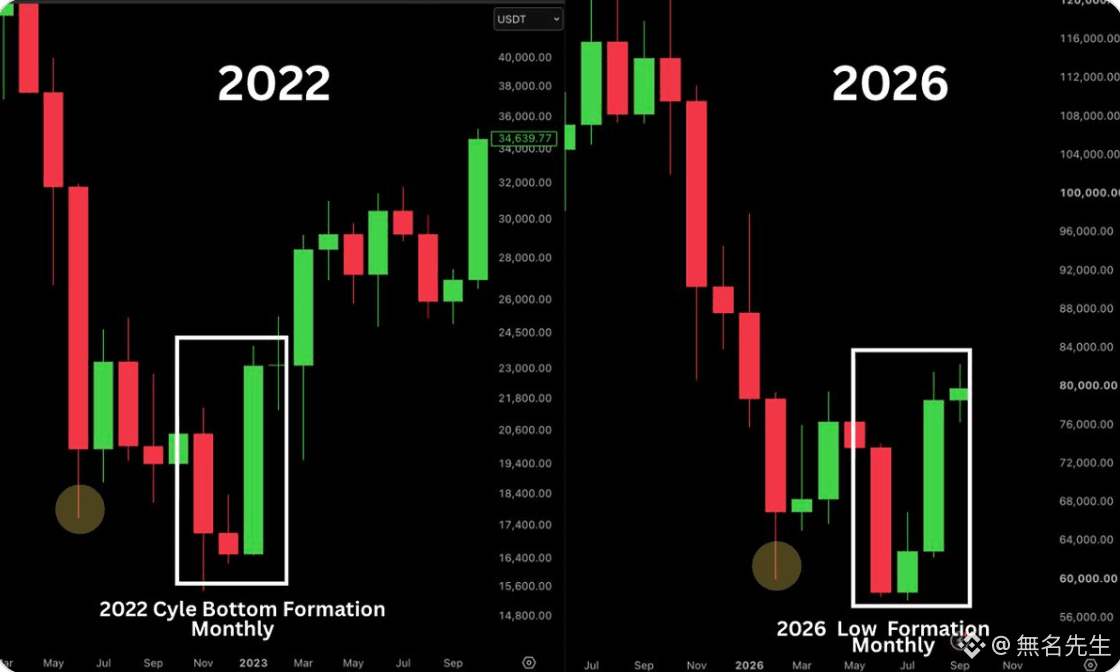
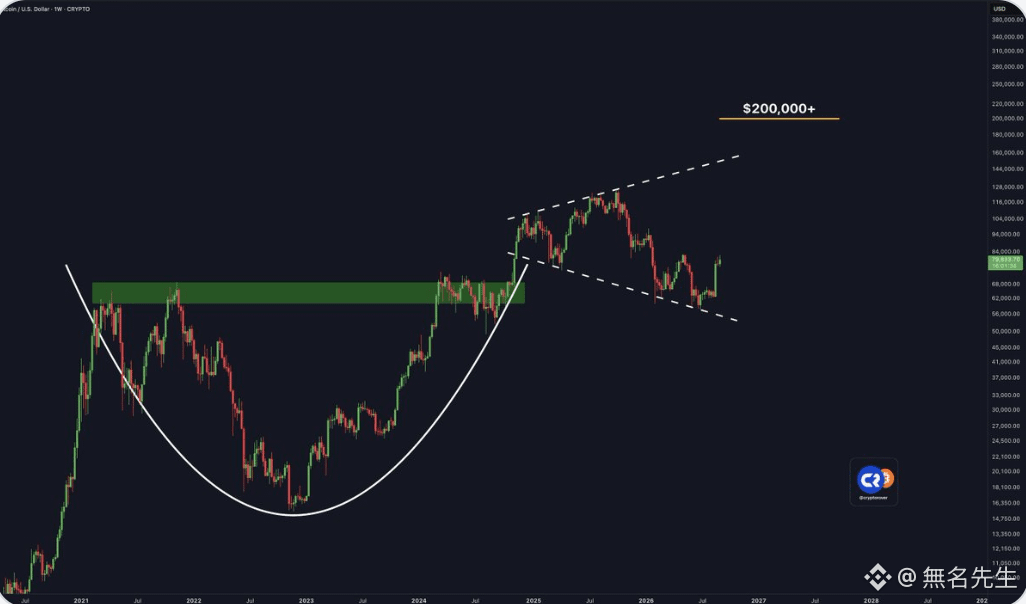
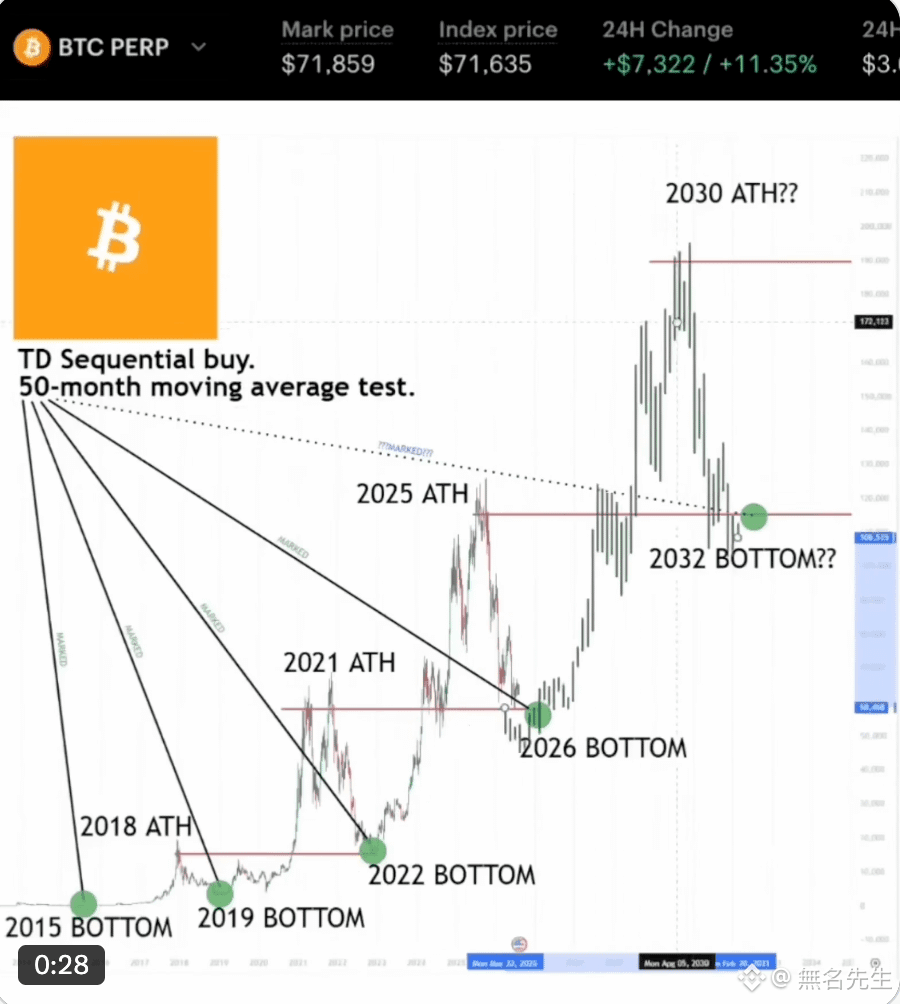
The monthly structure in 2026 looks very similar to the period near the bottom at the end of 2022.
Back then, the movement was also like this: consolidation, narrowing, and then a bullish candle to confirm the direction.
If it were to be fully replicated, the current position is roughly equivalent to that area at the end of 2022—just coming out of the bottom, but the market still does not fully believe it.
The monthly structure in 2026 looks very similar to the period near the bottom at the end of 2022.
Back then, the movement was also like this: consolidation, narrowing, and then a bullish candle to confirm the direction.
If it were to be fully replicated, the current position is roughly equivalent to that area at the end of 2022—just coming out of the bottom, but the market still does not fully believe it.
#BTC
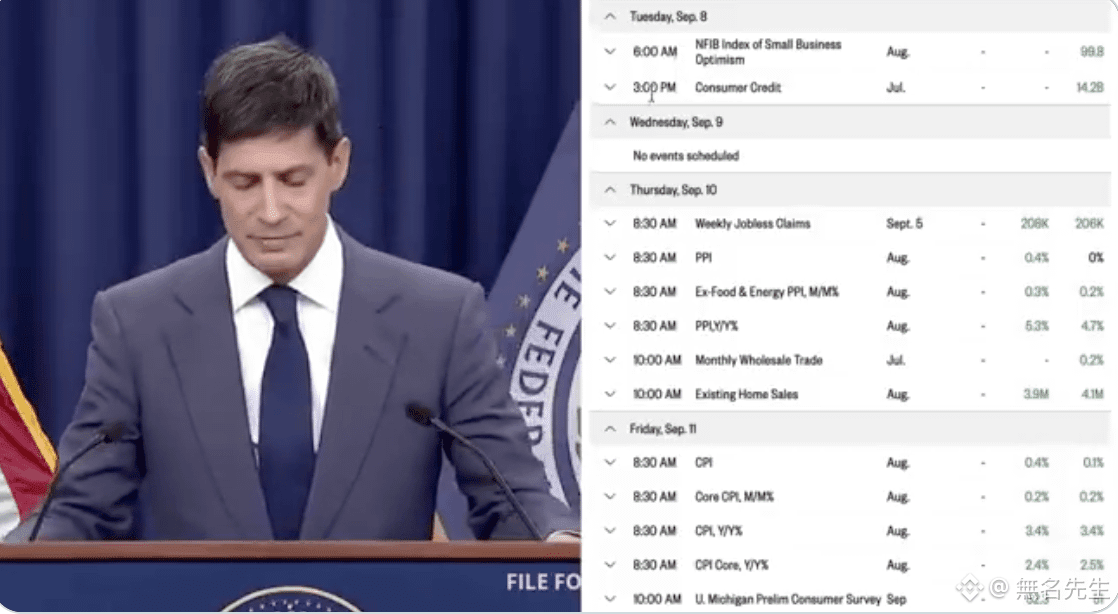
This week’s schedule is packed tight. 📅
On Tuesday, small business confidence and consumer credit; on Thursday, inflation and employment data; on Friday, the CPI that will decide market sentiment.
Several key data releases are concentrated in this week, with a long weekend in between.
Volatility on Thursday and Friday may be greater than usual.
This week’s schedule is packed tight. 📅
On Tuesday, small business confidence and consumer credit; on Thursday, inflation and employment data; on Friday, the CPI that will decide market sentiment.
Several key data releases are concentrated in this week, with a long weekend in between.
Volatility on Thursday and Friday may be greater than usual.
#BTC
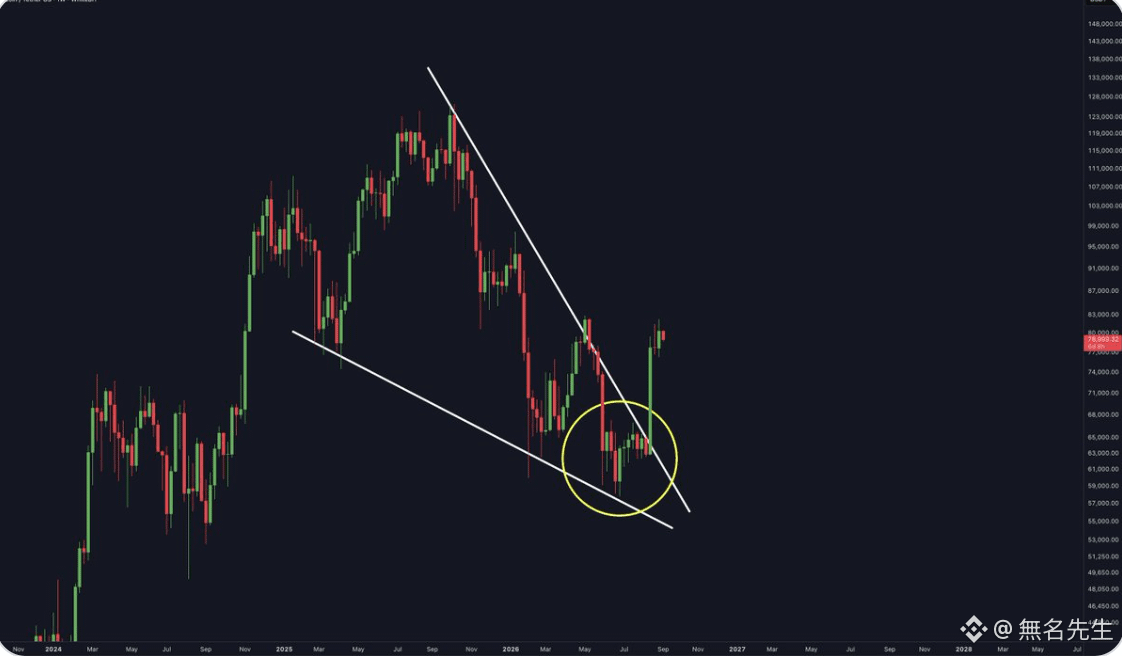
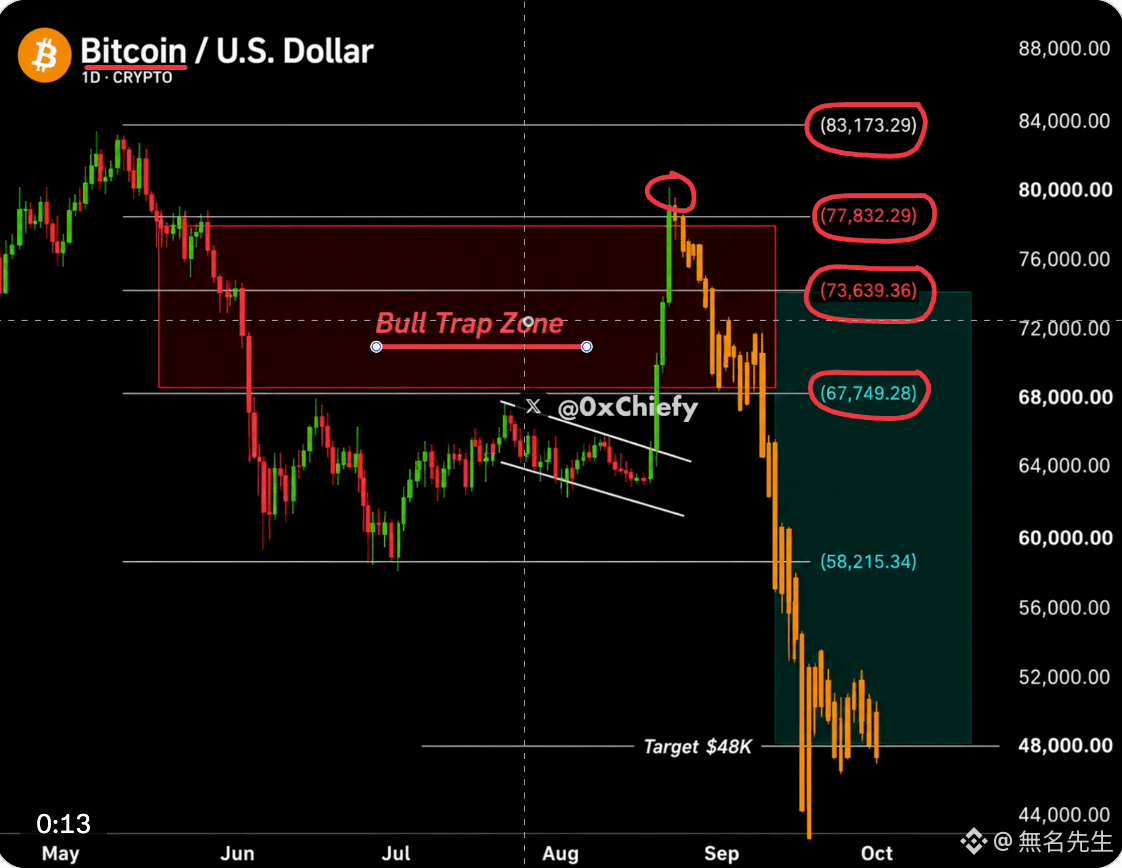
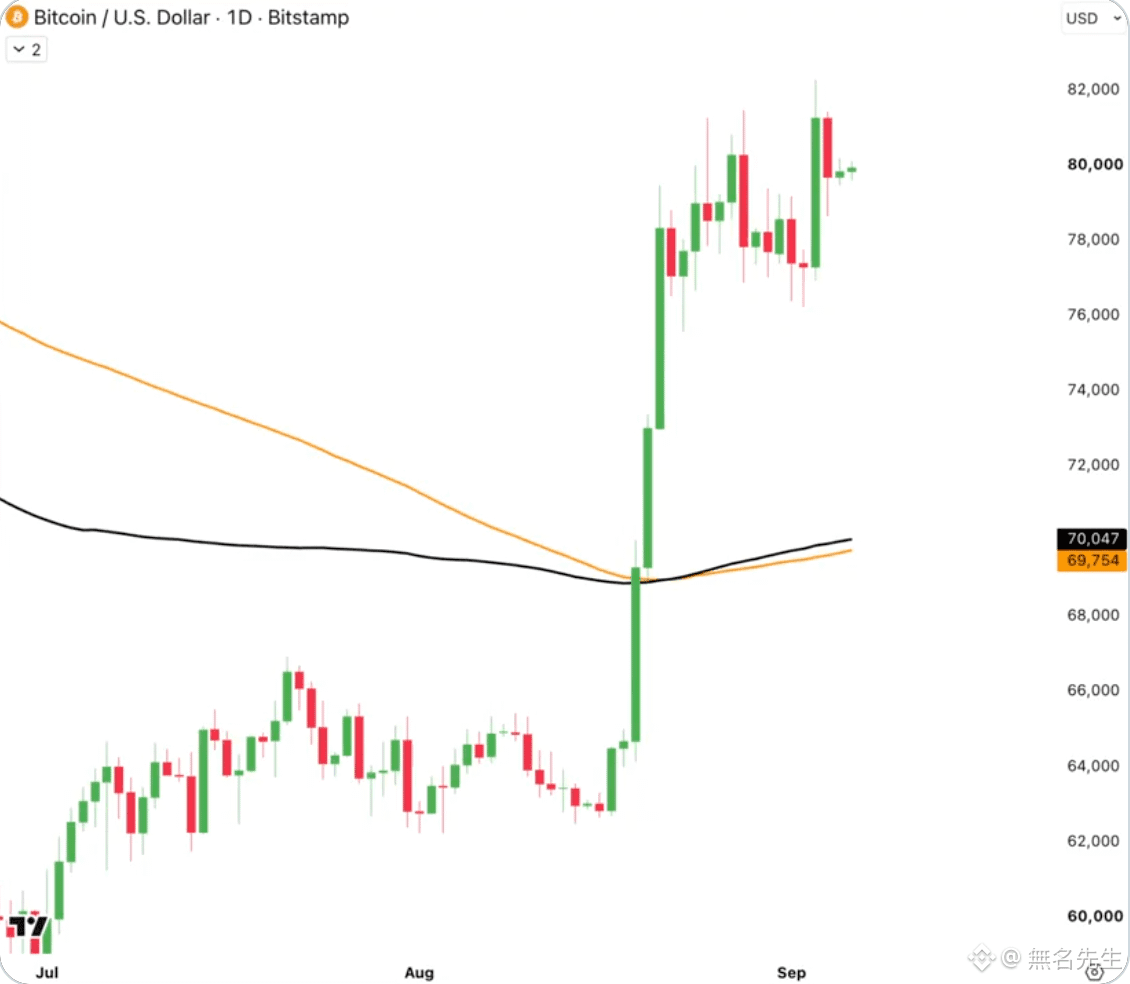
It failed to break through the area near 82K three times, and the structure has already changed.
Now it’s not about waiting for a breakout, but waiting for the pullback to complete.
79K is the first stop, and there is a deeper one after that.
The major turning points were all called out in advance before; this time will be no exception.
It failed to break through the area near 82K three times, and the structure has already changed.
Now it’s not about waiting for a breakout, but waiting for the pullback to complete.
79K is the first stop, and there is a deeper one after that.
The major turning points were all called out in advance before; this time will be no exception.
#BTC
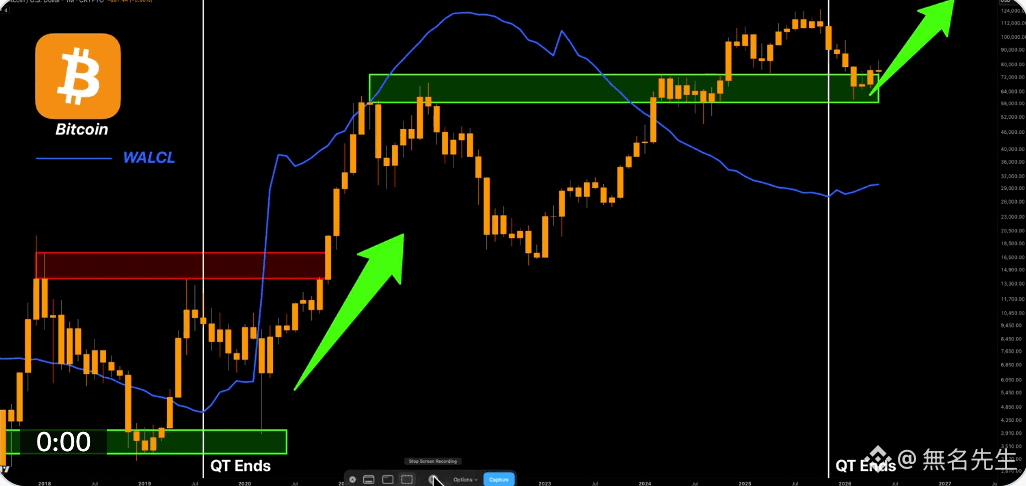
Many people are looking at the price, but what really determines the direction is this chart.
WALCL started in 2022 with QT, and kept shrinking to 6.6 trillion, pulling out 2.4 trillion in liquidity. BTC fell from 69K to 15K.
Now QT has officially ended, and the direction has reversed. The Fed has started expanding its balance sheet again, adding nearly 60 billion in a single week last week.
The same signal last appeared in 2020, and what happened after that needs no explanation.
Many people are looking at the price, but what really determines the direction is this chart.
WALCL started in 2022 with QT, and kept shrinking to 6.6 trillion, pulling out 2.4 trillion in liquidity. BTC fell from 69K to 15K.
Now QT has officially ended, and the direction has reversed. The Fed has started expanding its balance sheet again, adding nearly 60 billion in a single week last week.
The same signal last appeared in 2020, and what happened after that needs no explanation.
Log in to explore more content