
Bit_Rase
29k Posts

Bit_Rase
 Square Verified+
Report
Block User
Crypto Enthusiast | #BTC since 2017 | NFTs, Exchanges and Blockchain Analysis #Binance kol X.🇵🇰 @X_Girlz0
Open Trade
Frequent Trader
4.9 Years
353 Following
42.8K+ Followers
110.2K+ Liked
Posts
Portfolio
All
Quotes
Live
·
--
$BTC is back in a decision zone, and the interesting part is not the 1–2% pullback — it’s whether buyers can defend the recent breakout structure while macro pressure is building.
Bitcoin is around $78.1K, with today’s range roughly $77.85K–$79.61K. Price remains below the important $80K area, which has repeatedly acted as a psychological and technical barrier.
The bigger backdrop is mixed. Spot Bitcoin ETFs recorded about $987M of net inflows last week, with BlackRock’s IBIT contributing roughly $691.5M. That points to renewed institutional demand, but BTC is still reacting heavily to rates and liquidity expectations.
That macro risk matters even more today. Oil has moved above $100, U.S. Treasury yields are elevated, and markets are waiting for inflation data that could influence expectations for the Fed. Higher yields can keep pressure on risk assets even when the underlying Bitcoin demand picture looks healthier.
Technically, I’m watching $77.6K–$77.9K as the immediate defense zone. If buyers hold that area and reclaim $79.6K, BTC can make another attempt at $80K–$82K. A clean break and hold above $82K would be much stronger confirmation of continuation. On the downside, losing $77K would weaken the short-term structure and put the $74K–$75K region back into focus.
I would not chase BTC in the middle of this range. The cleaner setup is confirmation around the edges.
Entry: $79.7K–$80.1K after a confirmed reclaim
TP1: $82.0K
TP2: $84.0K
Stop Loss: $78.1K
Invalidation: sustained move back below $77.6K after the reclaim
There is a second scenario worth respecting: if $77.6K breaks with momentum, I would wait rather than immediately buy the dip. The market is sitting directly in front of important macro catalysts, so volatility can expand quickly.
Crypto remains volatile, so position size and risk should match your own strategy.
Do you think BTC gets the clean $80K breakout next, or does the market need another sweep below $78K first?
#BTC #Bitcoin #Crypto #Binance #TechnicalAnalysis
$BTC is back in a decision zone, and the interesting part is not the 1–2% pullback — it’s whether buyers can defend the recent breakout structure while macro pressure is building.
Bitcoin is around $78.1K, with today’s range roughly $77.85K–$79.61K. Price remains below the important $80K area, which has repeatedly acted as a psychological and technical barrier.
The bigger backdrop is mixed. Spot Bitcoin ETFs recorded about $987M of net inflows last week, with BlackRock’s IBIT contributing roughly $691.5M. That points to renewed institutional demand, but BTC is still reacting heavily to rates and liquidity expectations.
That macro risk matters even more today. Oil has moved above $100, U.S. Treasury yields are elevated, and markets are waiting for inflation data that could influence expectations for the Fed. Higher yields can keep pressure on risk assets even when the underlying Bitcoin demand picture looks healthier.
Technically, I’m watching $77.6K–$77.9K as the immediate defense zone. If buyers hold that area and reclaim $79.6K, BTC can make another attempt at $80K–$82K. A clean break and hold above $82K would be much stronger confirmation of continuation. On the downside, losing $77K would weaken the short-term structure and put the $74K–$75K region back into focus.
I would not chase BTC in the middle of this range. The cleaner setup is confirmation around the edges.
Entry: $79.7K–$80.1K after a confirmed reclaim
TP1: $82.0K
TP2: $84.0K
Stop Loss: $78.1K
Invalidation: sustained move back below $77.6K after the reclaim
There is a second scenario worth respecting: if $77.6K breaks with momentum, I would wait rather than immediately buy the dip. The market is sitting directly in front of important macro catalysts, so volatility can expand quickly.
Crypto remains volatile, so position size and risk should match your own strategy.
Do you think BTC gets the clean $80K breakout next, or does the market need another sweep below $78K first?
#BTC #Bitcoin #Crypto #Binance #TechnicalAnalysis
Bitcoin is around $78.1K, with today’s range roughly $77.85K–$79.61K. Price remains below the important $80K area, which has repeatedly acted as a psychological and technical barrier.
The bigger backdrop is mixed. Spot Bitcoin ETFs recorded about $987M of net inflows last week, with BlackRock’s IBIT contributing roughly $691.5M. That points to renewed institutional demand, but BTC is still reacting heavily to rates and liquidity expectations.
That macro risk matters even more today. Oil has moved above $100, U.S. Treasury yields are elevated, and markets are waiting for inflation data that could influence expectations for the Fed. Higher yields can keep pressure on risk assets even when the underlying Bitcoin demand picture looks healthier.
Technically, I’m watching $77.6K–$77.9K as the immediate defense zone. If buyers hold that area and reclaim $79.6K, BTC can make another attempt at $80K–$82K. A clean break and hold above $82K would be much stronger confirmation of continuation. On the downside, losing $77K would weaken the short-term structure and put the $74K–$75K region back into focus.
I would not chase BTC in the middle of this range. The cleaner setup is confirmation around the edges.
Entry: $79.7K–$80.1K after a confirmed reclaim
TP1: $82.0K
TP2: $84.0K
Stop Loss: $78.1K
Invalidation: sustained move back below $77.6K after the reclaim
There is a second scenario worth respecting: if $77.6K breaks with momentum, I would wait rather than immediately buy the dip. The market is sitting directly in front of important macro catalysts, so volatility can expand quickly.
Crypto remains volatile, so position size and risk should match your own strategy.
Do you think BTC gets the clean $80K breakout next, or does the market need another sweep below $78K first?
#BTC #Bitcoin #Crypto #Binance #TechnicalAnalysis
1
185
·
--
“Something feels different about $XAU here — price is approaching a level bulls really need to reclaim.”$4,400 area, but this recovery is arriving at a very important decision zone.
Spot gold was recently around $4,400–$4,415 after gaining more than 1% on Wednesday. The rebound has been helped by a softer US dollar and renewed safe-haven demand, while the surge in oil prices above $100 is adding another layer of inflation and geopolitical uncertainty.
Technically, the key question is whether buyers can actually reclaim the $4,400–$4,430 region rather than simply bounce into resistance. Recent analysis has identified the $4,400 area as an important pivot, while the deeper support zone sits around $4,300–$4,350. A sustained move above roughly $4,430 would improve the short-term structure; losing $4,350 would put sellers back in control and expose the $4,300 area.
I would not chase the middle of this range. My preferred setup is confirmation first: a clean breakout and retest above $4,430 could open the way toward the $4,500–$4,530 region. On the other side, rejection around $4,400–$4,430 followed by a break below $4,350 would make $4,300 the more interesting downside level.
The bigger catalyst is macro. US PPI is due today and CPI follows Friday, while markets are also reassessing the probability of a September Fed rate hike. Strong inflation could support the dollar and pressure non-yielding gold, while softer inflation could give gold another reason to push higher.
For now, I’m treating $4,430 as the confirmation area and $4,350 as the near-term line in the sand. I would rather wait for the market to show direction than force a trade inside the range.
Gold can move aggressively around economic data and geopolitical headlines, so position size and risk should match your own strategy.
Would you wait for a confirmed break above $4,430, or do you think gold rejects this zone again?
#XAU #TechnicalAnalysis #Binance #Crypto #Markets
“Something feels different about $XAU here — price is approaching a level bulls really need to reclaim.”$4,400 area, but this recovery is arriving at a very important decision zone.
Spot gold was recently around $4,400–$4,415 after gaining more than 1% on Wednesday. The rebound has been helped by a softer US dollar and renewed safe-haven demand, while the surge in oil prices above $100 is adding another layer of inflation and geopolitical uncertainty.
Technically, the key question is whether buyers can actually reclaim the $4,400–$4,430 region rather than simply bounce into resistance. Recent analysis has identified the $4,400 area as an important pivot, while the deeper support zone sits around $4,300–$4,350. A sustained move above roughly $4,430 would improve the short-term structure; losing $4,350 would put sellers back in control and expose the $4,300 area.
I would not chase the middle of this range. My preferred setup is confirmation first: a clean breakout and retest above $4,430 could open the way toward the $4,500–$4,530 region. On the other side, rejection around $4,400–$4,430 followed by a break below $4,350 would make $4,300 the more interesting downside level.
The bigger catalyst is macro. US PPI is due today and CPI follows Friday, while markets are also reassessing the probability of a September Fed rate hike. Strong inflation could support the dollar and pressure non-yielding gold, while softer inflation could give gold another reason to push higher.
For now, I’m treating $4,430 as the confirmation area and $4,350 as the near-term line in the sand. I would rather wait for the market to show direction than force a trade inside the range.
Gold can move aggressively around economic data and geopolitical headlines, so position size and risk should match your own strategy.
Would you wait for a confirmed break above $4,430, or do you think gold rejects this zone again?
#XAU #TechnicalAnalysis #Binance #Crypto #Markets
Spot gold was recently around $4,400–$4,415 after gaining more than 1% on Wednesday. The rebound has been helped by a softer US dollar and renewed safe-haven demand, while the surge in oil prices above $100 is adding another layer of inflation and geopolitical uncertainty.
Technically, the key question is whether buyers can actually reclaim the $4,400–$4,430 region rather than simply bounce into resistance. Recent analysis has identified the $4,400 area as an important pivot, while the deeper support zone sits around $4,300–$4,350. A sustained move above roughly $4,430 would improve the short-term structure; losing $4,350 would put sellers back in control and expose the $4,300 area.
I would not chase the middle of this range. My preferred setup is confirmation first: a clean breakout and retest above $4,430 could open the way toward the $4,500–$4,530 region. On the other side, rejection around $4,400–$4,430 followed by a break below $4,350 would make $4,300 the more interesting downside level.
The bigger catalyst is macro. US PPI is due today and CPI follows Friday, while markets are also reassessing the probability of a September Fed rate hike. Strong inflation could support the dollar and pressure non-yielding gold, while softer inflation could give gold another reason to push higher.
For now, I’m treating $4,430 as the confirmation area and $4,350 as the near-term line in the sand. I would rather wait for the market to show direction than force a trade inside the range.
Gold can move aggressively around economic data and geopolitical headlines, so position size and risk should match your own strategy.
Would you wait for a confirmed break above $4,430, or do you think gold rejects this zone again?
#XAU #TechnicalAnalysis #Binance #Crypto #Markets
230
·
--
I’ve been watching $AAPL closely, and this level is getting interesting… price is holding near the lower end of its recent intraday range while volume has picked up noticeably.
The latest available data puts AAPLX around $316.65, with a 24H high near $319.23 and low around $316.05, while reported 24H volume is roughly $4.75M.
What makes AAPLX different from a normal crypto token is that it represents tokenized Apple exposure. The xStock structure is designed to be backed 1:1 by underlying Apple shares held with a third-party custodian, although holding AAPLx does not give direct shareholder ownership rights.
On the chart, the immediate battle is fairly clear. $316.0–316.5 is the first area buyers need to defend, while $319.2–320.7 is the resistance zone that needs to break for stronger continuation. A clean move above $320.7 with sustained volume would improve the short-term structure; losing $316 would instead expose the setup to a deeper retracement.
I would not chase the middle of this range. My preferred approach is to wait for confirmation around the edges:
LONG idea: $316.0–317.0 only if support holds and buyers reclaim $319
TP1: $320.7
TP2: $324–325
SL: $313.8
Invalidation: sustained breakdown below $316 followed by failure to reclaim it
This is a conditional setup rather than a guaranteed trade. AAPLX can also diverge from traditional Apple pricing because it trades as a tokenized asset, so liquidity and execution conditions matter. Crypto and tokenized assets remain volatile, so position size and risk should match your own strategy.
Would you wait for a confirmed break above $320.7, or do you think this support zone is already attractive?
#AAPLX #Crypto #Binance #TokenizedStocks
I’ve been watching $AAPL closely, and this level is getting interesting… price is holding near the lower end of its recent intraday range while volume has picked up noticeably.
The latest available data puts AAPLX around $316.65, with a 24H high near $319.23 and low around $316.05, while reported 24H volume is roughly $4.75M.
What makes AAPLX different from a normal crypto token is that it represents tokenized Apple exposure. The xStock structure is designed to be backed 1:1 by underlying Apple shares held with a third-party custodian, although holding AAPLx does not give direct shareholder ownership rights.
On the chart, the immediate battle is fairly clear. $316.0–316.5 is the first area buyers need to defend, while $319.2–320.7 is the resistance zone that needs to break for stronger continuation. A clean move above $320.7 with sustained volume would improve the short-term structure; losing $316 would instead expose the setup to a deeper retracement.
I would not chase the middle of this range. My preferred approach is to wait for confirmation around the edges:
LONG idea: $316.0–317.0 only if support holds and buyers reclaim $319
TP1: $320.7
TP2: $324–325
SL: $313.8
Invalidation: sustained breakdown below $316 followed by failure to reclaim it
This is a conditional setup rather than a guaranteed trade. AAPLX can also diverge from traditional Apple pricing because it trades as a tokenized asset, so liquidity and execution conditions matter. Crypto and tokenized assets remain volatile, so position size and risk should match your own strategy.
Would you wait for a confirmed break above $320.7, or do you think this support zone is already attractive?
#AAPLX #Crypto #Binance #TokenizedStocks
The latest available data puts AAPLX around $316.65, with a 24H high near $319.23 and low around $316.05, while reported 24H volume is roughly $4.75M.
What makes AAPLX different from a normal crypto token is that it represents tokenized Apple exposure. The xStock structure is designed to be backed 1:1 by underlying Apple shares held with a third-party custodian, although holding AAPLx does not give direct shareholder ownership rights.
On the chart, the immediate battle is fairly clear. $316.0–316.5 is the first area buyers need to defend, while $319.2–320.7 is the resistance zone that needs to break for stronger continuation. A clean move above $320.7 with sustained volume would improve the short-term structure; losing $316 would instead expose the setup to a deeper retracement.
I would not chase the middle of this range. My preferred approach is to wait for confirmation around the edges:
LONG idea: $316.0–317.0 only if support holds and buyers reclaim $319
TP1: $320.7
TP2: $324–325
SL: $313.8
Invalidation: sustained breakdown below $316 followed by failure to reclaim it
This is a conditional setup rather than a guaranteed trade. AAPLX can also diverge from traditional Apple pricing because it trades as a tokenized asset, so liquidity and execution conditions matter. Crypto and tokenized assets remain volatile, so position size and risk should match your own strategy.
Would you wait for a confirmed break above $320.7, or do you think this support zone is already attractive?
#AAPLX #Crypto #Binance #TokenizedStocks
1
239
·
--
Something interesting is happening with $LTC right now — last week’s strong breakout is being tested, and the market is starting to show whether buyers can actually defend the move.
LTC is trading around $54.16 after pulling back from the recent spike that reached roughly $59.4. The bigger picture is still better than it was a week ago: price rallied from the $50 area, but the sharp rejection near $59 shows that sellers are still active above the mid-$50s.
The level I’m watching most closely is $53.70–$54.00. This zone has been tested repeatedly during the recent move and is now acting as the first important support. If buyers keep defending it, LTC could rebuild momentum toward $55.30, followed by the $56.20 resistance area.
A clean break above $56.20 would be more meaningful because it could signal that the current pullback was simply consolidation after the rally. On the other hand, losing $53.70 would weaken the short-term structure and could open the door toward the previous breakout area around $51.50–$52.00.
My approach here would be patience rather than chasing.
Possible setup: Entry: $53.80–$54.30 only if support holds and buyers show confirmation
TP1: $55.30
TP2: $56.20
Extended target: $59.00–$59.40
Stop Loss: Below $52.90
Invalidation: A sustained breakdown below the $53.70 support structure
Derivatives activity is also worth watching. LTC futures open interest remains significant at around $410M, meaning leverage is still present and sudden volatility can increase around key levels.
For me, this is not a market to blindly call bullish or bearish. The next real clue will come from the reaction around $53.70 support and whether LTC can reclaim $56.20 with momentum.
Crypto is volatile, so manage position size carefully and always follow your own risk strategy.
What do you think — is $LTC building a base for another move higher, or was the $59 rejection the beginning of a deeper pullback?
#LTC #Litecoin #Crypto #BinanceSquare #TechnicalAnalysis
Something interesting is happening with $LTC right now — last week’s strong breakout is being tested, and the market is starting to show whether buyers can actually defend the move.
LTC is trading around $54.16 after pulling back from the recent spike that reached roughly $59.4. The bigger picture is still better than it was a week ago: price rallied from the $50 area, but the sharp rejection near $59 shows that sellers are still active above the mid-$50s.
The level I’m watching most closely is $53.70–$54.00. This zone has been tested repeatedly during the recent move and is now acting as the first important support. If buyers keep defending it, LTC could rebuild momentum toward $55.30, followed by the $56.20 resistance area.
A clean break above $56.20 would be more meaningful because it could signal that the current pullback was simply consolidation after the rally. On the other hand, losing $53.70 would weaken the short-term structure and could open the door toward the previous breakout area around $51.50–$52.00.
My approach here would be patience rather than chasing.
Possible setup: Entry: $53.80–$54.30 only if support holds and buyers show confirmation
TP1: $55.30
TP2: $56.20
Extended target: $59.00–$59.40
Stop Loss: Below $52.90
Invalidation: A sustained breakdown below the $53.70 support structure
Derivatives activity is also worth watching. LTC futures open interest remains significant at around $410M, meaning leverage is still present and sudden volatility can increase around key levels.
For me, this is not a market to blindly call bullish or bearish. The next real clue will come from the reaction around $53.70 support and whether LTC can reclaim $56.20 with momentum.
Crypto is volatile, so manage position size carefully and always follow your own risk strategy.
What do you think — is $LTC building a base for another move higher, or was the $59 rejection the beginning of a deeper pullback?
#LTC #Litecoin #Crypto #BinanceSquare #TechnicalAnalysis
LTC is trading around $54.16 after pulling back from the recent spike that reached roughly $59.4. The bigger picture is still better than it was a week ago: price rallied from the $50 area, but the sharp rejection near $59 shows that sellers are still active above the mid-$50s.
The level I’m watching most closely is $53.70–$54.00. This zone has been tested repeatedly during the recent move and is now acting as the first important support. If buyers keep defending it, LTC could rebuild momentum toward $55.30, followed by the $56.20 resistance area.
A clean break above $56.20 would be more meaningful because it could signal that the current pullback was simply consolidation after the rally. On the other hand, losing $53.70 would weaken the short-term structure and could open the door toward the previous breakout area around $51.50–$52.00.
My approach here would be patience rather than chasing.
Possible setup: Entry: $53.80–$54.30 only if support holds and buyers show confirmation
TP1: $55.30
TP2: $56.20
Extended target: $59.00–$59.40
Stop Loss: Below $52.90
Invalidation: A sustained breakdown below the $53.70 support structure
Derivatives activity is also worth watching. LTC futures open interest remains significant at around $410M, meaning leverage is still present and sudden volatility can increase around key levels.
For me, this is not a market to blindly call bullish or bearish. The next real clue will come from the reaction around $53.70 support and whether LTC can reclaim $56.20 with momentum.
Crypto is volatile, so manage position size carefully and always follow your own risk strategy.
What do you think — is $LTC building a base for another move higher, or was the $59 rejection the beginning of a deeper pullback?
#LTC #Litecoin #Crypto #BinanceSquare #TechnicalAnalysis
2
227
·
--
Avalanche has 216.2M AVAX staked, equal to 46.3% of circulating supply, while the network reports $497.0M in DeFi TVL and $1.45B in on-chain stablecoins. Yet AVAX is around $8.03, still below the $8.20 seven-day high; the complication is C-Chain activity, where 30-day transactions fell 11.5% to 70.51M.
That divergence—the network has meaningful locked capital while recent C-Chain activity is softer—is the tell. This is a watch, not a confident long/short. The next scheduled catalyst is Avalanche’s Helicon upgrade on September 22, which adds auto-renewed staking, shorter minimum durations and Continuous Execution.
For AVAX/USDT, $8.20 is the confirmation line—a daily close above it would put demand back above this week’s range high. $7.76 is the first support, matching the September 7 low; below that, $7.38 becomes the next reference from September 4, with no stronger nearby structure visible.
Timeframe: next 1–2 weeks, mainly through the September 22 Helicon upgrade.
Invalidation: a confirmed close below $7.38 weakens the constructive read; conversely, a broad-market bounce could lift AVAX without improving Avalanche-specific demand.
$AVAX
{future}(AVAXUSDT)
#Binance #BTC
Avalanche has 216.2M AVAX staked, equal to 46.3% of circulating supply, while the network reports $497.0M in DeFi TVL and $1.45B in on-chain stablecoins. Yet AVAX is around $8.03, still below the $8.20 seven-day high; the complication is C-Chain activity, where 30-day transactions fell 11.5% to 70.51M.
That divergence—the network has meaningful locked capital while recent C-Chain activity is softer—is the tell. This is a watch, not a confident long/short. The next scheduled catalyst is Avalanche’s Helicon upgrade on September 22, which adds auto-renewed staking, shorter minimum durations and Continuous Execution.
For AVAX/USDT, $8.20 is the confirmation line—a daily close above it would put demand back above this week’s range high. $7.76 is the first support, matching the September 7 low; below that, $7.38 becomes the next reference from September 4, with no stronger nearby structure visible.
Timeframe: next 1–2 weeks, mainly through the September 22 Helicon upgrade.
Invalidation: a confirmed close below $7.38 weakens the constructive read; conversely, a broad-market bounce could lift AVAX without improving Avalanche-specific demand.
$AVAX
#Binance #BTC
That divergence—the network has meaningful locked capital while recent C-Chain activity is softer—is the tell. This is a watch, not a confident long/short. The next scheduled catalyst is Avalanche’s Helicon upgrade on September 22, which adds auto-renewed staking, shorter minimum durations and Continuous Execution.
For AVAX/USDT, $8.20 is the confirmation line—a daily close above it would put demand back above this week’s range high. $7.76 is the first support, matching the September 7 low; below that, $7.38 becomes the next reference from September 4, with no stronger nearby structure visible.
Timeframe: next 1–2 weeks, mainly through the September 22 Helicon upgrade.
Invalidation: a confirmed close below $7.38 weakens the constructive read; conversely, a broad-market bounce could lift AVAX without improving Avalanche-specific demand.
$AVAX
#Binance #BTC
1
87
·
--
$META is moving higher, but the interesting part is what happens around the recent breakout zone.
Meta xStock is currently trading around $649, with the latest Bybit data showing a 24H range of roughly $612–$648 and about $8.2M in 24H volume. That is a meaningful jump in activity for an asset with only around 15.6K METAX circulating.
The bigger picture is different from a normal altcoin: METAX is a tokenized representation of Meta Platforms stock, so its price is ultimately tied to the underlying equity rather than purely crypto market speculation. The token is issued through the xStock/Backed ecosystem and is available across multiple chains.
Technically, the recent structure has turned stronger. METAX moved from the $558–$580 area at the start of September toward the $620+ zone, with volume increasing during the advance.
For me, $620–$625 is now the key short-term area. If buyers defend that zone after the recent expansion, the next test is around $650, followed by $675–$690.
But I would not chase a large candle here. A rejection back below $620 would suggest the move needs more consolidation.
Fresh setup I’m watching:
Entry: $622–$630 on a confirmed retest
TP1: $650
TP2: $680
Stop Loss: $605
Invalidation: Daily close below $605
One important risk: METAX is a tokenized equity product, so liquidity, issuer/counterparty considerations and the underlying Meta share price matter alongside the crypto chart.
Crypto markets can move quickly, so manage position size and risk according to your own strategy.
Would you wait for a $620 retest, or do you think METAX can break $650 first?
#METAX #MetaXStock #Crypto #Binance #TokenizedAssets
$META is moving higher, but the interesting part is what happens around the recent breakout zone.
Meta xStock is currently trading around $649, with the latest Bybit data showing a 24H range of roughly $612–$648 and about $8.2M in 24H volume. That is a meaningful jump in activity for an asset with only around 15.6K METAX circulating.
The bigger picture is different from a normal altcoin: METAX is a tokenized representation of Meta Platforms stock, so its price is ultimately tied to the underlying equity rather than purely crypto market speculation. The token is issued through the xStock/Backed ecosystem and is available across multiple chains.
Technically, the recent structure has turned stronger. METAX moved from the $558–$580 area at the start of September toward the $620+ zone, with volume increasing during the advance.
For me, $620–$625 is now the key short-term area. If buyers defend that zone after the recent expansion, the next test is around $650, followed by $675–$690.
But I would not chase a large candle here. A rejection back below $620 would suggest the move needs more consolidation.
Fresh setup I’m watching:
Entry: $622–$630 on a confirmed retest
TP1: $650
TP2: $680
Stop Loss: $605
Invalidation: Daily close below $605
One important risk: METAX is a tokenized equity product, so liquidity, issuer/counterparty considerations and the underlying Meta share price matter alongside the crypto chart.
Crypto markets can move quickly, so manage position size and risk according to your own strategy.
Would you wait for a $620 retest, or do you think METAX can break $650 first?
#METAX #MetaXStock #Crypto #Binance #TokenizedAssets
Meta xStock is currently trading around $649, with the latest Bybit data showing a 24H range of roughly $612–$648 and about $8.2M in 24H volume. That is a meaningful jump in activity for an asset with only around 15.6K METAX circulating.
The bigger picture is different from a normal altcoin: METAX is a tokenized representation of Meta Platforms stock, so its price is ultimately tied to the underlying equity rather than purely crypto market speculation. The token is issued through the xStock/Backed ecosystem and is available across multiple chains.
Technically, the recent structure has turned stronger. METAX moved from the $558–$580 area at the start of September toward the $620+ zone, with volume increasing during the advance.
For me, $620–$625 is now the key short-term area. If buyers defend that zone after the recent expansion, the next test is around $650, followed by $675–$690.
But I would not chase a large candle here. A rejection back below $620 would suggest the move needs more consolidation.
Fresh setup I’m watching:
Entry: $622–$630 on a confirmed retest
TP1: $650
TP2: $680
Stop Loss: $605
Invalidation: Daily close below $605
One important risk: METAX is a tokenized equity product, so liquidity, issuer/counterparty considerations and the underlying Meta share price matter alongside the crypto chart.
Crypto markets can move quickly, so manage position size and risk according to your own strategy.
Would you wait for a $620 retest, or do you think METAX can break $650 first?
#METAX #MetaXStock #Crypto #Binance #TokenizedAssets
1
72
·
--
$LIT is testing the zone where momentum either turns into continuation — or gets rejected.
LIT is trading around $5.0, after a strong move from roughly $3.5 at the start of September. The recent daily structure shows higher highs and higher lows, with today’s range reaching about $5.32 before pulling back.
The fundamental backdrop is also interesting. Lighter recently passed $10B in cumulative perpetual trading volume, while August recorded around $3.95B in trading volume and more than $1B in open interest.
But there is one thing I would not ignore: leverage is getting expensive. Binance LITUSDT funding is currently around +0.005% per 4 hours, showing that longs are paying shorts. That isn't extreme by itself, but after a sharp rally, crowded longs can make pullbacks faster.
Technically, I’m watching $4.80–$4.90 as the first important demand area. Holding this zone keeps the short-term bullish structure intact.
A clean break and hold above $5.30 would be the stronger continuation signal.
Fresh setup I’m watching:
Entry: $4.82–$4.92 on a successful retest
TP1: $5.25
TP2: $5.65
Stop Loss: $4.55
Invalidation: Daily acceptance below $4.55
I would rather buy a confirmed retest than chase a vertical candle near resistance.
Also keep supply in mind: only about 25% of the 1B LIT maximum supply is currently circulating, with future unlocks creating a longer-term dilution risk.
Crypto is volatile, so manage your position size and risk according to your own strategy.
Would you wait for a $5.30 breakout, or look for the $4.80–$4.90 retest first?
#LIT #Lighter #Crypto #Binance #Trading
$LIT is testing the zone where momentum either turns into continuation — or gets rejected.
LIT is trading around $5.0, after a strong move from roughly $3.5 at the start of September. The recent daily structure shows higher highs and higher lows, with today’s range reaching about $5.32 before pulling back.
The fundamental backdrop is also interesting. Lighter recently passed $10B in cumulative perpetual trading volume, while August recorded around $3.95B in trading volume and more than $1B in open interest.
But there is one thing I would not ignore: leverage is getting expensive. Binance LITUSDT funding is currently around +0.005% per 4 hours, showing that longs are paying shorts. That isn't extreme by itself, but after a sharp rally, crowded longs can make pullbacks faster.
Technically, I’m watching $4.80–$4.90 as the first important demand area. Holding this zone keeps the short-term bullish structure intact.
A clean break and hold above $5.30 would be the stronger continuation signal.
Fresh setup I’m watching:
Entry: $4.82–$4.92 on a successful retest
TP1: $5.25
TP2: $5.65
Stop Loss: $4.55
Invalidation: Daily acceptance below $4.55
I would rather buy a confirmed retest than chase a vertical candle near resistance.
Also keep supply in mind: only about 25% of the 1B LIT maximum supply is currently circulating, with future unlocks creating a longer-term dilution risk.
Crypto is volatile, so manage your position size and risk according to your own strategy.
Would you wait for a $5.30 breakout, or look for the $4.80–$4.90 retest first?
#LIT #Lighter #Crypto #Binance #Trading
LIT is trading around $5.0, after a strong move from roughly $3.5 at the start of September. The recent daily structure shows higher highs and higher lows, with today’s range reaching about $5.32 before pulling back.
The fundamental backdrop is also interesting. Lighter recently passed $10B in cumulative perpetual trading volume, while August recorded around $3.95B in trading volume and more than $1B in open interest.
But there is one thing I would not ignore: leverage is getting expensive. Binance LITUSDT funding is currently around +0.005% per 4 hours, showing that longs are paying shorts. That isn't extreme by itself, but after a sharp rally, crowded longs can make pullbacks faster.
Technically, I’m watching $4.80–$4.90 as the first important demand area. Holding this zone keeps the short-term bullish structure intact.
A clean break and hold above $5.30 would be the stronger continuation signal.
Fresh setup I’m watching:
Entry: $4.82–$4.92 on a successful retest
TP1: $5.25
TP2: $5.65
Stop Loss: $4.55
Invalidation: Daily acceptance below $4.55
I would rather buy a confirmed retest than chase a vertical candle near resistance.
Also keep supply in mind: only about 25% of the 1B LIT maximum supply is currently circulating, with future unlocks creating a longer-term dilution risk.
Crypto is volatile, so manage your position size and risk according to your own strategy.
Would you wait for a $5.30 breakout, or look for the $4.80–$4.90 retest first?
#LIT #Lighter #Crypto #Binance #Trading
241
·
--
$AAVE is back at a decision zone — and the reaction here matters more than the headline price.
AAVE is around $129, with Binance showing a 24H range of $126.51–$133.03 and about 95.35K AAVE traded on spot. Price has also pulled back from the recent $140.19 high, so buyers now need to prove that this is a healthy retest rather than the start of another lower move.
What makes the setup interesting is that fundamentals haven't gone quiet.
Aave's governance is actively discussing V4 activation on Ethereum Mainnet, while recent V4 deposits across five hubs reached roughly $577M, up about 5% from the previous round. That's meaningful ecosystem activity, but price still needs to confirm the strength.
Technically, I’m watching $126–$127 as the first important demand area. If buyers defend it and reclaim $133, the structure can start looking stronger again, with $137–$140 becoming the next resistance zone.
But if $126 breaks decisively, I wouldn't rush into a long. The next downside area becomes more interesting around $123–$124, where the earlier September structure developed.
My fresh trading plan:
Entry: $127.50–$129.50
TP1: $133.00
TP2: $137.00
Stop Loss: $124.90
Invalidation: Sustained break below $126
I would prefer confirmation through a reclaim of $133 rather than chasing a bounce inside the range.
Crypto is volatile, so manage position size and risk according to your own strategy.
Would you wait for $133 to break, or do you think the $127–$129 zone is already attractive for a bounce?
#AAVE #Crypto #Binance #DeFi #TechnicalAnalysis
$AAVE is back at a decision zone — and the reaction here matters more than the headline price.
AAVE is around $129, with Binance showing a 24H range of $126.51–$133.03 and about 95.35K AAVE traded on spot. Price has also pulled back from the recent $140.19 high, so buyers now need to prove that this is a healthy retest rather than the start of another lower move.
What makes the setup interesting is that fundamentals haven't gone quiet.
Aave's governance is actively discussing V4 activation on Ethereum Mainnet, while recent V4 deposits across five hubs reached roughly $577M, up about 5% from the previous round. That's meaningful ecosystem activity, but price still needs to confirm the strength.
Technically, I’m watching $126–$127 as the first important demand area. If buyers defend it and reclaim $133, the structure can start looking stronger again, with $137–$140 becoming the next resistance zone.
But if $126 breaks decisively, I wouldn't rush into a long. The next downside area becomes more interesting around $123–$124, where the earlier September structure developed.
My fresh trading plan:
Entry: $127.50–$129.50
TP1: $133.00
TP2: $137.00
Stop Loss: $124.90
Invalidation: Sustained break below $126
I would prefer confirmation through a reclaim of $133 rather than chasing a bounce inside the range.
Crypto is volatile, so manage position size and risk according to your own strategy.
Would you wait for $133 to break, or do you think the $127–$129 zone is already attractive for a bounce?
#AAVE #Crypto #Binance #DeFi #TechnicalAnalysis
AAVE is around $129, with Binance showing a 24H range of $126.51–$133.03 and about 95.35K AAVE traded on spot. Price has also pulled back from the recent $140.19 high, so buyers now need to prove that this is a healthy retest rather than the start of another lower move.
What makes the setup interesting is that fundamentals haven't gone quiet.
Aave's governance is actively discussing V4 activation on Ethereum Mainnet, while recent V4 deposits across five hubs reached roughly $577M, up about 5% from the previous round. That's meaningful ecosystem activity, but price still needs to confirm the strength.
Technically, I’m watching $126–$127 as the first important demand area. If buyers defend it and reclaim $133, the structure can start looking stronger again, with $137–$140 becoming the next resistance zone.
But if $126 breaks decisively, I wouldn't rush into a long. The next downside area becomes more interesting around $123–$124, where the earlier September structure developed.
My fresh trading plan:
Entry: $127.50–$129.50
TP1: $133.00
TP2: $137.00
Stop Loss: $124.90
Invalidation: Sustained break below $126
I would prefer confirmation through a reclaim of $133 rather than chasing a bounce inside the range.
Crypto is volatile, so manage position size and risk according to your own strategy.
Would you wait for $133 to break, or do you think the $127–$129 zone is already attractive for a bounce?
#AAVE #Crypto #Binance #DeFi #TechnicalAnalysis
107
·
--
Something interesting is happening with $NVDA right now…
The token has pulled back sharply from the $233+ area and is currently around $226, with today’s range sitting roughly between $225.25 and $233.70. That makes the $225–226 zone important — buyers need to defend it if they want to avoid another leg lower.
The bigger picture is also worth watching. NVDAX is designed to track NVIDIA stock and is backed 1:1 by the underlying equity, while allowing the exposure to trade on-chain and integrate with DeFi. So this setup is closely tied to what happens with NVDA itself.
And NVDA just dropped 2.01% to $225.73 on September 8, while the broader Nasdaq also weakened. Today, Nvidia was still slightly lower in early trading.
Technically, I’m watching $225–226 as the immediate support zone. If that holds and NVDAX reclaims $228–229, the next test is around $231.5, followed by the $233–234 resistance area.
My fresh setup:
Entry: $226–228
TP1: $231.50
TP2: $233.50
Stop Loss: $223.80
Invalidation: Sustained break below $225 with weak recovery
I wouldn’t chase a bounce blindly here. The cleaner signal would be a reclaim of $228–229 with buyers actually defending the retest.
Crypto/tokenized assets can move fast, so manage position size and risk according to your own strategy.
Would you wait for the $228–229 reclaim, or do you think the $225 support is already attractive?
#NVDAX #NVDA #Crypto #TokenizedStocks #Binance
Something interesting is happening with $NVDA right now…
The token has pulled back sharply from the $233+ area and is currently around $226, with today’s range sitting roughly between $225.25 and $233.70. That makes the $225–226 zone important — buyers need to defend it if they want to avoid another leg lower.
The bigger picture is also worth watching. NVDAX is designed to track NVIDIA stock and is backed 1:1 by the underlying equity, while allowing the exposure to trade on-chain and integrate with DeFi. So this setup is closely tied to what happens with NVDA itself.
And NVDA just dropped 2.01% to $225.73 on September 8, while the broader Nasdaq also weakened. Today, Nvidia was still slightly lower in early trading.
Technically, I’m watching $225–226 as the immediate support zone. If that holds and NVDAX reclaims $228–229, the next test is around $231.5, followed by the $233–234 resistance area.
My fresh setup:
Entry: $226–228
TP1: $231.50
TP2: $233.50
Stop Loss: $223.80
Invalidation: Sustained break below $225 with weak recovery
I wouldn’t chase a bounce blindly here. The cleaner signal would be a reclaim of $228–229 with buyers actually defending the retest.
Crypto/tokenized assets can move fast, so manage position size and risk according to your own strategy.
Would you wait for the $228–229 reclaim, or do you think the $225 support is already attractive?
#NVDAX #NVDA #Crypto #TokenizedStocks #Binance
The token has pulled back sharply from the $233+ area and is currently around $226, with today’s range sitting roughly between $225.25 and $233.70. That makes the $225–226 zone important — buyers need to defend it if they want to avoid another leg lower.
The bigger picture is also worth watching. NVDAX is designed to track NVIDIA stock and is backed 1:1 by the underlying equity, while allowing the exposure to trade on-chain and integrate with DeFi. So this setup is closely tied to what happens with NVDA itself.
And NVDA just dropped 2.01% to $225.73 on September 8, while the broader Nasdaq also weakened. Today, Nvidia was still slightly lower in early trading.
Technically, I’m watching $225–226 as the immediate support zone. If that holds and NVDAX reclaims $228–229, the next test is around $231.5, followed by the $233–234 resistance area.
My fresh setup:
Entry: $226–228
TP1: $231.50
TP2: $233.50
Stop Loss: $223.80
Invalidation: Sustained break below $225 with weak recovery
I wouldn’t chase a bounce blindly here. The cleaner signal would be a reclaim of $228–229 with buyers actually defending the retest.
Crypto/tokenized assets can move fast, so manage position size and risk according to your own strategy.
Would you wait for the $228–229 reclaim, or do you think the $225 support is already attractive?
#NVDAX #NVDA #Crypto #TokenizedStocks #Binance
1
1
298
·
--
Ethereum spot ETFs have recorded $13.185B in cumulative net inflows, including $141.4M on September 3 and $25.9M on September 4 — yet ETH is still below its September 2026 peak of $2,564. The latest price is around $2,502, only about 2.4% below that peak, while September 8 ETF flows were $0.
That divergence — strong cumulative institutional flows versus a market still unable to reclaim $2,564 — is the gap to watch. This is a watch, not a confident long or short. Ethereum’s next major catalyst is also unfinished: Glamsterdam remains in devnet testing, with the Sepolia fork scheduled for September 28 and mainnet targeted for Q4 2026.
For ETH/USDT, $2,564 is the confirmation line — a daily close above it would show renewed demand. $2,442 is the immediate support, matching September 8’s low; below that, $2,370 becomes the next reference from September 3.
Timeframe: next 1–3 weeks, with the September 28 Sepolia milestone as the concrete catalyst.
A confirmed daily close below $2,442 invalidates this constructive divergence thesis. The line to watch remains $2,564.
$ETH
{future}(ETHUSDT)
Ethereum spot ETFs have recorded $13.185B in cumulative net inflows, including $141.4M on September 3 and $25.9M on September 4 — yet ETH is still below its September 2026 peak of $2,564. The latest price is around $2,502, only about 2.4% below that peak, while September 8 ETF flows were $0.
That divergence — strong cumulative institutional flows versus a market still unable to reclaim $2,564 — is the gap to watch. This is a watch, not a confident long or short. Ethereum’s next major catalyst is also unfinished: Glamsterdam remains in devnet testing, with the Sepolia fork scheduled for September 28 and mainnet targeted for Q4 2026.
For ETH/USDT, $2,564 is the confirmation line — a daily close above it would show renewed demand. $2,442 is the immediate support, matching September 8’s low; below that, $2,370 becomes the next reference from September 3.
Timeframe: next 1–3 weeks, with the September 28 Sepolia milestone as the concrete catalyst.
A confirmed daily close below $2,442 invalidates this constructive divergence thesis. The line to watch remains $2,564.
$ETH
That divergence — strong cumulative institutional flows versus a market still unable to reclaim $2,564 — is the gap to watch. This is a watch, not a confident long or short. Ethereum’s next major catalyst is also unfinished: Glamsterdam remains in devnet testing, with the Sepolia fork scheduled for September 28 and mainnet targeted for Q4 2026.
For ETH/USDT, $2,564 is the confirmation line — a daily close above it would show renewed demand. $2,442 is the immediate support, matching September 8’s low; below that, $2,370 becomes the next reference from September 3.
Timeframe: next 1–3 weeks, with the September 28 Sepolia milestone as the concrete catalyst.
A confirmed daily close below $2,442 invalidates this constructive divergence thesis. The line to watch remains $2,564.
$ETH
3
305
·
--
Something interesting is happening with $BTC right now: buyers have defended the recent flush, but Bitcoin still hasn’t convincingly reclaimed the $80K area.
BTC is trading around $79K, after dropping toward $77.6K and quickly recovering. That rebound matters because $77.6K is now a clear short-term demand zone, while $79.5K–$80K remains the main battle area.
The bigger picture is still constructive. Bitcoin remains above its 20-day and 50-day moving averages, while RSI is around the low-to-mid 60s — bullish momentum, but not yet an extreme overbought reading.
But there’s one thing I’m watching closely: leverage.
BTC open interest is elevated and long positioning is dominant, while funding remains positive. That means another rejection around $79.5K–$80K could trigger a quick long squeeze if support fails.
For me, the clean setup is confirmation rather than chasing:
Long idea:
Entry: $79,700–$80,000 after a confirmed breakout/retest
TP1: $81,400
TP2: $82,200–$82,800
SL: $78,900
Invalidation: Sustained move back below $78,700
If BTC gets rejected again and loses $77.6K, I would step aside and reassess rather than force a long.
The next major catalyst is also close: U.S. CPI is due September 11, while the Fed decision follows on September 16, so volatility could expand quickly.
Would you wait for BTC to reclaim $80K first, or do you think the $77.6K defense already gives bulls enough confirmation?
Crypto is volatile, so manage your position size and risk according to your own strategy.
#BTC #BTCUSDT #Bitcoin #Crypto #Binance
Something interesting is happening with $BTC right now: buyers have defended the recent flush, but Bitcoin still hasn’t convincingly reclaimed the $80K area.
BTC is trading around $79K, after dropping toward $77.6K and quickly recovering. That rebound matters because $77.6K is now a clear short-term demand zone, while $79.5K–$80K remains the main battle area.
The bigger picture is still constructive. Bitcoin remains above its 20-day and 50-day moving averages, while RSI is around the low-to-mid 60s — bullish momentum, but not yet an extreme overbought reading.
But there’s one thing I’m watching closely: leverage.
BTC open interest is elevated and long positioning is dominant, while funding remains positive. That means another rejection around $79.5K–$80K could trigger a quick long squeeze if support fails.
For me, the clean setup is confirmation rather than chasing:
Long idea:
Entry: $79,700–$80,000 after a confirmed breakout/retest
TP1: $81,400
TP2: $82,200–$82,800
SL: $78,900
Invalidation: Sustained move back below $78,700
If BTC gets rejected again and loses $77.6K, I would step aside and reassess rather than force a long.
The next major catalyst is also close: U.S. CPI is due September 11, while the Fed decision follows on September 16, so volatility could expand quickly.
Would you wait for BTC to reclaim $80K first, or do you think the $77.6K defense already gives bulls enough confirmation?
Crypto is volatile, so manage your position size and risk according to your own strategy.
#BTC #BTCUSDT #Bitcoin #Crypto #Binance
BTC is trading around $79K, after dropping toward $77.6K and quickly recovering. That rebound matters because $77.6K is now a clear short-term demand zone, while $79.5K–$80K remains the main battle area.
The bigger picture is still constructive. Bitcoin remains above its 20-day and 50-day moving averages, while RSI is around the low-to-mid 60s — bullish momentum, but not yet an extreme overbought reading.
But there’s one thing I’m watching closely: leverage.
BTC open interest is elevated and long positioning is dominant, while funding remains positive. That means another rejection around $79.5K–$80K could trigger a quick long squeeze if support fails.
For me, the clean setup is confirmation rather than chasing:
Long idea:
Entry: $79,700–$80,000 after a confirmed breakout/retest
TP1: $81,400
TP2: $82,200–$82,800
SL: $78,900
Invalidation: Sustained move back below $78,700
If BTC gets rejected again and loses $77.6K, I would step aside and reassess rather than force a long.
The next major catalyst is also close: U.S. CPI is due September 11, while the Fed decision follows on September 16, so volatility could expand quickly.
Would you wait for BTC to reclaim $80K first, or do you think the $77.6K defense already gives bulls enough confirmation?
Crypto is volatile, so manage your position size and risk according to your own strategy.
#BTC #BTCUSDT #Bitcoin #Crypto #Binance
1
2
1.2k
·
--
USD.AI’s CHIP has $284.86M in TVL against a $105.19M market cap, while circulating supply stands at 2B CHIP out of a 10B maximum. Yet price is not confirming that protocol footprint: CHIP trades near $0.05135, down 5.07% over 24 hours, after reaching $0.05549. The complication is that CHIP remains 62.23% below its April 23 all-time high of $0.1393, so the recent recovery is still inside a much larger drawdown.
That divergence—meaningful TVL versus weak price confirmation—is the tell. This is a watch, not a confident long/short. Binance itself applied a Seed Tag when CHIP was listed on April 21, citing higher volatility and risk for the relatively new token.
For CHIP/USDT, $0.05549 is the confirmation line—a close above it would show demand reclaiming the latest 24-hour high. $0.05030 is the immediate support, matching the current 24-hour low. A confirmed break below $0.05030 puts $0.04688 in focus, the September 2 high and nearby breakout reference.
Next 1–2 weeks: watch whether TVL strength translates into sustained price acceptance above $0.05549.
A confirmed close below $0.05030 invalidates the constructive read; a broad market bounce could also lift CHIP without improving token-specific demand.
$CHIP
{future}(CHIPUSDT)
USD.AI’s CHIP has $284.86M in TVL against a $105.19M market cap, while circulating supply stands at 2B CHIP out of a 10B maximum. Yet price is not confirming that protocol footprint: CHIP trades near $0.05135, down 5.07% over 24 hours, after reaching $0.05549. The complication is that CHIP remains 62.23% below its April 23 all-time high of $0.1393, so the recent recovery is still inside a much larger drawdown.
That divergence—meaningful TVL versus weak price confirmation—is the tell. This is a watch, not a confident long/short. Binance itself applied a Seed Tag when CHIP was listed on April 21, citing higher volatility and risk for the relatively new token.
For CHIP/USDT, $0.05549 is the confirmation line—a close above it would show demand reclaiming the latest 24-hour high. $0.05030 is the immediate support, matching the current 24-hour low. A confirmed break below $0.05030 puts $0.04688 in focus, the September 2 high and nearby breakout reference.
Next 1–2 weeks: watch whether TVL strength translates into sustained price acceptance above $0.05549.
A confirmed close below $0.05030 invalidates the constructive read; a broad market bounce could also lift CHIP without improving token-specific demand.
$CHIP
That divergence—meaningful TVL versus weak price confirmation—is the tell. This is a watch, not a confident long/short. Binance itself applied a Seed Tag when CHIP was listed on April 21, citing higher volatility and risk for the relatively new token.
For CHIP/USDT, $0.05549 is the confirmation line—a close above it would show demand reclaiming the latest 24-hour high. $0.05030 is the immediate support, matching the current 24-hour low. A confirmed break below $0.05030 puts $0.04688 in focus, the September 2 high and nearby breakout reference.
Next 1–2 weeks: watch whether TVL strength translates into sustained price acceptance above $0.05549.
A confirmed close below $0.05030 invalidates the constructive read; a broad market bounce could also lift CHIP without improving token-specific demand.
$CHIP
2
357
·
--
Something about tokenized stocks made me stop and look at the market a little differently.
The first instinct is to treat a familiar name like a familiar asset. But once traditional exposure enters crypto rails, that assumption starts getting blurry.
SPCXX is currently around $154.27, sitting close to its 24h high of $154.58 after trading as low as $145.32. The short-term structure is also interesting, with price above the MA7, MA14 and MA28.
What catches my attention isn't simply the move itself. It's the behavioral shift. Once traditional assets become tradable on crypto rails, traders may stop thinking in separate categories of “stocks” and “crypto” and start thinking mainly about liquidity, access and price discovery.
But that raises a bigger question for me: if tokenized equities become increasingly normal, will the ticker eventually matter less than the infrastructure underneath it?
$SPCX
{future}(SPCXUSDT)
Something about tokenized stocks made me stop and look at the market a little differently.
The first instinct is to treat a familiar name like a familiar asset. But once traditional exposure enters crypto rails, that assumption starts getting blurry.
SPCXX is currently around $154.27, sitting close to its 24h high of $154.58 after trading as low as $145.32. The short-term structure is also interesting, with price above the MA7, MA14 and MA28.
What catches my attention isn't simply the move itself. It's the behavioral shift. Once traditional assets become tradable on crypto rails, traders may stop thinking in separate categories of “stocks” and “crypto” and start thinking mainly about liquidity, access and price discovery.
But that raises a bigger question for me: if tokenized equities become increasingly normal, will the ticker eventually matter less than the infrastructure underneath it?
$SPCX
The first instinct is to treat a familiar name like a familiar asset. But once traditional exposure enters crypto rails, that assumption starts getting blurry.
SPCXX is currently around $154.27, sitting close to its 24h high of $154.58 after trading as low as $145.32. The short-term structure is also interesting, with price above the MA7, MA14 and MA28.
What catches my attention isn't simply the move itself. It's the behavioral shift. Once traditional assets become tradable on crypto rails, traders may stop thinking in separate categories of “stocks” and “crypto” and start thinking mainly about liquidity, access and price discovery.
But that raises a bigger question for me: if tokenized equities become increasingly normal, will the ticker eventually matter less than the infrastructure underneath it?
$SPCX
1
368
·
--
Sometimes the hardest part of a breakout isn’t spotting it — it’s deciding whether to trust it.
A strong move can make the chart look cleaner than it really is. Once traders start chasing candles, the same momentum that pushes price higher can also create a sharp pullback.
That’s what caught my attention with $DOT. The breakout looks interesting for a scalp long, but I’m treating it as a high-risk momentum setup rather than assuming continuation is guaranteed.
Entry: $1.18–$1.22
TP: $1.25 / $1.30 / $1.35 / $1.50
SL: $1.099
Now I’m watching whether DOT can hold the breakout area and build acceptance above it, or whether this move eventually turns into another liquidity hunt...?
$DOT
{future}(DOTUSDT)
Sometimes the hardest part of a breakout isn’t spotting it — it’s deciding whether to trust it.
A strong move can make the chart look cleaner than it really is. Once traders start chasing candles, the same momentum that pushes price higher can also create a sharp pullback.
That’s what caught my attention with $DOT . The breakout looks interesting for a scalp long, but I’m treating it as a high-risk momentum setup rather than assuming continuation is guaranteed.
Entry: $1.18–$1.22
TP: $1.25 / $1.30 / $1.35 / $1.50
SL: $1.099
Now I’m watching whether DOT can hold the breakout area and build acceptance above it, or whether this move eventually turns into another liquidity hunt...?
$DOT
A strong move can make the chart look cleaner than it really is. Once traders start chasing candles, the same momentum that pushes price higher can also create a sharp pullback.
That’s what caught my attention with $DOT . The breakout looks interesting for a scalp long, but I’m treating it as a high-risk momentum setup rather than assuming continuation is guaranteed.
Entry: $1.18–$1.22
TP: $1.25 / $1.30 / $1.35 / $1.50
SL: $1.099
Now I’m watching whether DOT can hold the breakout area and build acceptance above it, or whether this move eventually turns into another liquidity hunt...?
$DOT
1
420
·
--
#Polymarket I kept thinking about how prediction markets are usually treated as a completely different thing from trading.
But the more I look at @polymarket , the line feels less obvious.
Its move into crypto perpetuals is interesting because it puts two very different forms of conviction closer together. In a prediction market, you’re effectively trading the probability of an outcome. With perps, you’re trading where an asset might go next.
Polymarket expanding from 10 perp markets to 67 on day one makes that shift even more noticeable.
What I find more interesting isn’t the number of markets, though. It’s the behavior this could create. Information, expectations, and price speculation start meeting in the same place.
With $HYPE , $JUP , $DRIFT and others building around on-chain trading, the bigger question may be whether Polymarket becomes more than a place to forecast events.
Could it become a broader marketplace for conviction itself?
Not financial advice.
#Polymarket #BTC
#Polymarket I kept thinking about how prediction markets are usually treated as a completely different thing from trading.
But the more I look at @Polymarket , the line feels less obvious.
Its move into crypto perpetuals is interesting because it puts two very different forms of conviction closer together. In a prediction market, you’re effectively trading the probability of an outcome. With perps, you’re trading where an asset might go next.
Polymarket expanding from 10 perp markets to 67 on day one makes that shift even more noticeable.
What I find more interesting isn’t the number of markets, though. It’s the behavior this could create. Information, expectations, and price speculation start meeting in the same place.
With $HYPE , $JUP , $DRIFT and others building around on-chain trading, the bigger question may be whether Polymarket becomes more than a place to forecast events.
Could it become a broader marketplace for conviction itself?
Not financial advice.
#Polymarket #BTC
But the more I look at @Polymarket , the line feels less obvious.
Its move into crypto perpetuals is interesting because it puts two very different forms of conviction closer together. In a prediction market, you’re effectively trading the probability of an outcome. With perps, you’re trading where an asset might go next.
Polymarket expanding from 10 perp markets to 67 on day one makes that shift even more noticeable.
What I find more interesting isn’t the number of markets, though. It’s the behavior this could create. Information, expectations, and price speculation start meeting in the same place.
With $HYPE , $JUP , $DRIFT and others building around on-chain trading, the bigger question may be whether Polymarket becomes more than a place to forecast events.
Could it become a broader marketplace for conviction itself?
Not financial advice.
#Polymarket #BTC
219
·
--
$BEAT Short 10x | Clean risk zone reached.
BEAT finally stepped into the zone I mapped for seller defense. Live only while sellers keep absorbing the bid—no invalidation, no story.
Trade Plan:
- Entry: 0.12771 – 0.12858
- TP1: 0.12499 (R:R 1:0.8)
- TP2: 0.12290 (R:R 1:1.3)
- TP3: 0.11975 (R:R 1:2.0)
- SL: 0.13234
Why this setup?
- 4h structure still backs the short, and the 1D bias stays bearish as price grinds through 0.12771–0.12858 near 0.12814.
- 15m RSI sits at 50—neutral enough to allow downside room, not a green light to chase.
- Volume tells the real story: 0.79x pace, with 3.65M traded versus 4.60M expected—participation is thin, not confirming upside.
👈👇 Brothers join this tarde take profit 🫂 only. NFA manage risk and DYOR.💵🚗🧧📱
$BEAT
{future}(BEATUSDT)
$BEAT Short 10x | Clean risk zone reached.
BEAT finally stepped into the zone I mapped for seller defense. Live only while sellers keep absorbing the bid—no invalidation, no story.
Trade Plan:
- Entry: 0.12771 – 0.12858
- TP1: 0.12499 (R:R 1:0.8)
- TP2: 0.12290 (R:R 1:1.3)
- TP3: 0.11975 (R:R 1:2.0)
- SL: 0.13234
Why this setup?
- 4h structure still backs the short, and the 1D bias stays bearish as price grinds through 0.12771–0.12858 near 0.12814.
- 15m RSI sits at 50—neutral enough to allow downside room, not a green light to chase.
- Volume tells the real story: 0.79x pace, with 3.65M traded versus 4.60M expected—participation is thin, not confirming upside.
👈👇 Brothers join this tarde take profit 🫂 only. NFA manage risk and DYOR.💵🚗🧧📱
$BEAT
BEAT finally stepped into the zone I mapped for seller defense. Live only while sellers keep absorbing the bid—no invalidation, no story.
Trade Plan:
- Entry: 0.12771 – 0.12858
- TP1: 0.12499 (R:R 1:0.8)
- TP2: 0.12290 (R:R 1:1.3)
- TP3: 0.11975 (R:R 1:2.0)
- SL: 0.13234
Why this setup?
- 4h structure still backs the short, and the 1D bias stays bearish as price grinds through 0.12771–0.12858 near 0.12814.
- 15m RSI sits at 50—neutral enough to allow downside room, not a green light to chase.
- Volume tells the real story: 0.79x pace, with 3.65M traded versus 4.60M expected—participation is thin, not confirming upside.
👈👇 Brothers join this tarde take profit 🫂 only. NFA manage risk and DYOR.💵🚗🧧📱
$BEAT
2
216
·
--
🥇 XAUUSDT | GOLD MARKET WATCH
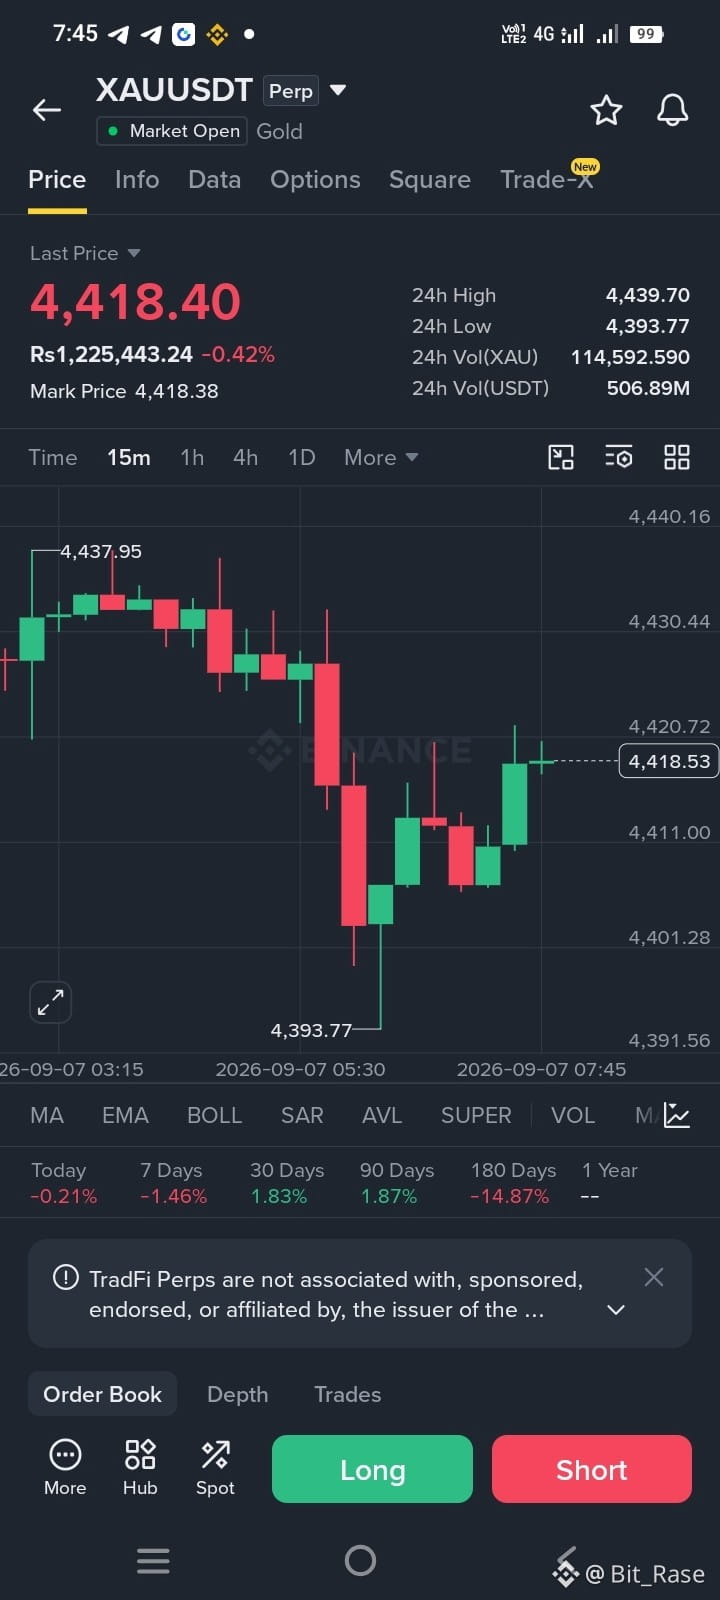
Gold is trading around $4,418.40, down 0.42% in 24H.
24H High: $4,439.70
24H Low: $4,393.77
24H Range: $45.93
24H Volume: 114.59K XAU
Turnover: $506.89M
Price is currently holding around the $4,418 area after rejecting the upper part of the daily range.
The key levels I’m watching:
🔹 Resistance: $4,430–$4,440
🔹 Immediate support: $4,411
🔹 Stronger support: $4,401–$4,394
If buyers reclaim $4,430 with strong volume, a retest of $4,440+ becomes interesting.
If price loses $4,411, the next downside test could be around $4,401, followed by the $4,394 low.
For me, chasing in the middle of this range isn’t attractive. I’d rather wait for a confirmed breakout or a clean support reaction.
⚠️ Gold can move sharply around macro/news events. Keep leverage controlled and let price confirm the direction.
Would you trade the breakout or wait for a pullback?
$XAU
{future}(XAUUSDT)
🥇 XAUUSDT | GOLD MARKET WATCH
Gold is trading around $4,418.40, down 0.42% in 24H.
24H High: $4,439.70
24H Low: $4,393.77
24H Range: $45.93
24H Volume: 114.59K XAU
Turnover: $506.89M
Price is currently holding around the $4,418 area after rejecting the upper part of the daily range.
The key levels I’m watching:
🔹 Resistance: $4,430–$4,440
🔹 Immediate support: $4,411
🔹 Stronger support: $4,401–$4,394
If buyers reclaim $4,430 with strong volume, a retest of $4,440+ becomes interesting.
If price loses $4,411, the next downside test could be around $4,401, followed by the $4,394 low.
For me, chasing in the middle of this range isn’t attractive. I’d rather wait for a confirmed breakout or a clean support reaction.
⚠️ Gold can move sharply around macro/news events. Keep leverage controlled and let price confirm the direction.
Would you trade the breakout or wait for a pullback?
$XAU
Gold is trading around $4,418.40, down 0.42% in 24H.
24H High: $4,439.70
24H Low: $4,393.77
24H Range: $45.93
24H Volume: 114.59K XAU
Turnover: $506.89M
Price is currently holding around the $4,418 area after rejecting the upper part of the daily range.
The key levels I’m watching:
🔹 Resistance: $4,430–$4,440
🔹 Immediate support: $4,411
🔹 Stronger support: $4,401–$4,394
If buyers reclaim $4,430 with strong volume, a retest of $4,440+ becomes interesting.
If price loses $4,411, the next downside test could be around $4,401, followed by the $4,394 low.
For me, chasing in the middle of this range isn’t attractive. I’d rather wait for a confirmed breakout or a clean support reaction.
⚠️ Gold can move sharply around macro/news events. Keep leverage controlled and let price confirm the direction.
Would you trade the breakout or wait for a pullback?
$XAU
1
463
·
--
$FILUSDT Perp | Market Update 📊
FIL is trading around $0.7885, up 1.04% in the last 24H.
24H High: $0.8399
24H Low: $0.7676
24H Range: 9.41%
24H Volume: 111.74M FIL
USDT Turnover: $89.44M
Price is trying to stabilize after the sharp move from the $0.8399 high. The immediate battle is around $0.79–$0.80.
If FIL reclaims and holds $0.8000, momentum could strengthen toward $0.8150 → $0.8300 → $0.8400.
On the downside, losing $0.7798 could expose $0.7729, with the main support sitting near $0.7676.
📌 Trade idea:
Entry: $0.783–$0.790
SL: $0.7660
TP1: $0.810
TP2: $0.830
TP3: $0.840
I’d rather see a clean reclaim of $0.80 than chase the current candle. Above $0.80 = stronger setup. Below $0.7798 = caution.
Trade with a plan, not emotion. DYOR.
$FIL
{future}(FILUSDT)
$FILUSDT Perp | Market Update 📊
FIL is trading around $0.7885, up 1.04% in the last 24H.
24H High: $0.8399
24H Low: $0.7676
24H Range: 9.41%
24H Volume: 111.74M FIL
USDT Turnover: $89.44M
Price is trying to stabilize after the sharp move from the $0.8399 high. The immediate battle is around $0.79–$0.80.
If FIL reclaims and holds $0.8000, momentum could strengthen toward $0.8150 → $0.8300 → $0.8400.
On the downside, losing $0.7798 could expose $0.7729, with the main support sitting near $0.7676.
📌 Trade idea:
Entry: $0.783–$0.790
SL: $0.7660
TP1: $0.810
TP2: $0.830
TP3: $0.840
I’d rather see a clean reclaim of $0.80 than chase the current candle. Above $0.80 = stronger setup. Below $0.7798 = caution.
Trade with a plan, not emotion. DYOR.
$FIL
FIL is trading around $0.7885, up 1.04% in the last 24H.
24H High: $0.8399
24H Low: $0.7676
24H Range: 9.41%
24H Volume: 111.74M FIL
USDT Turnover: $89.44M
Price is trying to stabilize after the sharp move from the $0.8399 high. The immediate battle is around $0.79–$0.80.
If FIL reclaims and holds $0.8000, momentum could strengthen toward $0.8150 → $0.8300 → $0.8400.
On the downside, losing $0.7798 could expose $0.7729, with the main support sitting near $0.7676.
📌 Trade idea:
Entry: $0.783–$0.790
SL: $0.7660
TP1: $0.810
TP2: $0.830
TP3: $0.840
I’d rather see a clean reclaim of $0.80 than chase the current candle. Above $0.80 = stronger setup. Below $0.7798 = caution.
Trade with a plan, not emotion. DYOR.
$FIL
1
392
·
--
$OP | Optimism is waking up 👀
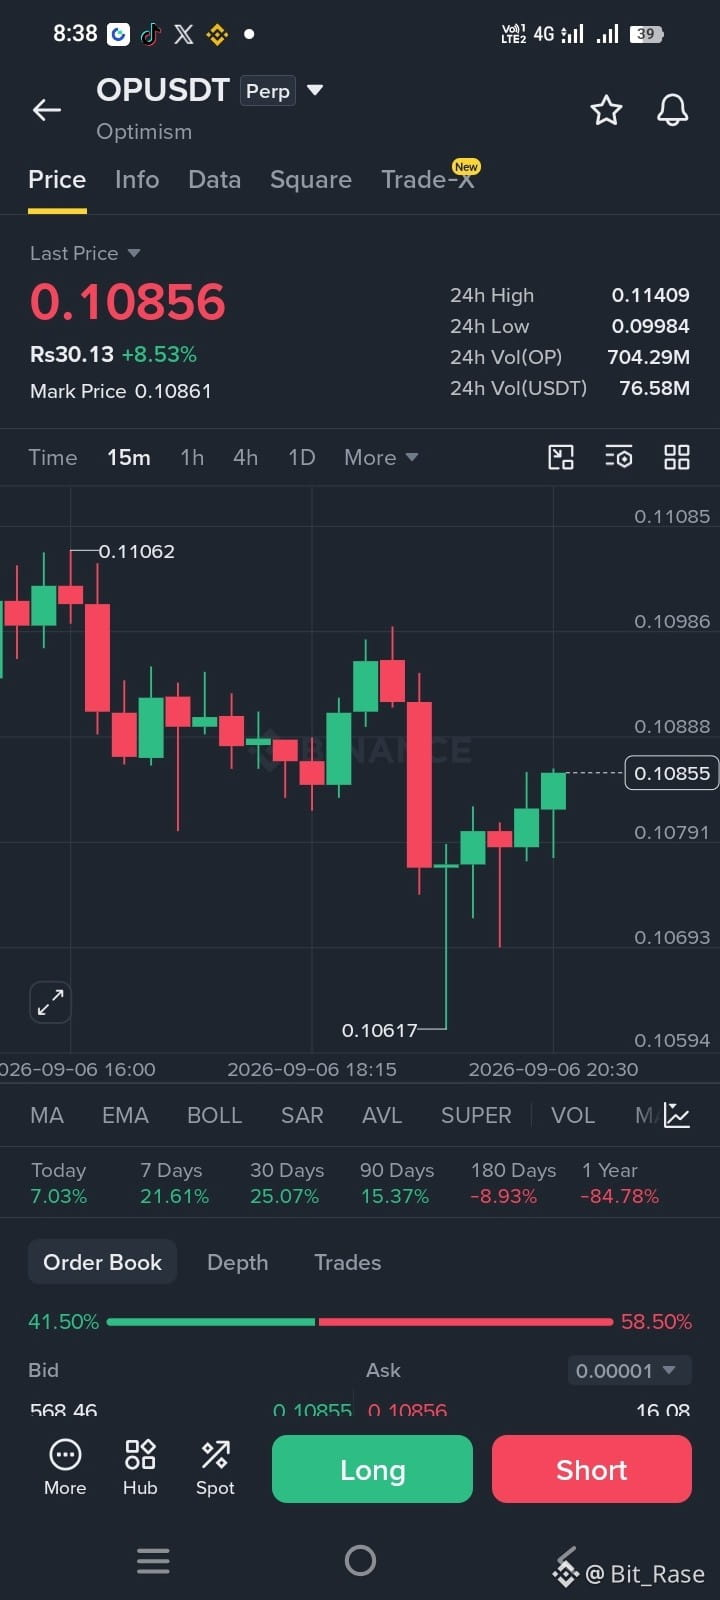
OP is trading around $0.10856, up 8.53% in 24H. The move is supported by strong activity, with 704.29M OP traded and around $76.58M USDT in turnover.
Today’s range:
High: $0.11409
Low: $0.09984
Range: $0.01425 / ~14.27%
Price has pushed sharply from the $0.10 area and is now holding above $0.1085, but the real test is ahead.
Key levels I’m watching:
Resistance: $0.1106 → $0.1141
Support: $0.1069 → $0.1059
Deeper support: $0.1030 → $0.0998
The order book currently shows roughly 58.5% Ask vs 41.5% Bid, so sellers are still active around the current zone. That makes chasing the green candle risky.
My approach:
🟢 Bullish continuation: reclaim and hold $0.1106, then a move toward $0.1140 becomes interesting.
🟡 Better entry: a controlled pullback toward $0.1069–$0.1059 with buyers stepping back in.
🔴 Invalidation: losing $0.1059 would weaken the immediate bullish structure and could send OP back toward $0.1030 / $0.0998.
OP has already moved hard today. I’d rather trade confirmation than chase momentum.
Levels first. Entry second. Risk always.
What are you watching here: breakout above $0.114 or pullback toward $0.106?
$OP
{future}(OPUSDT)
$OP | Optimism is waking up 👀
OP is trading around $0.10856, up 8.53% in 24H. The move is supported by strong activity, with 704.29M OP traded and around $76.58M USDT in turnover.
Today’s range:
High: $0.11409
Low: $0.09984
Range: $0.01425 / ~14.27%
Price has pushed sharply from the $0.10 area and is now holding above $0.1085, but the real test is ahead.
Key levels I’m watching:
Resistance: $0.1106 → $0.1141
Support: $0.1069 → $0.1059
Deeper support: $0.1030 → $0.0998
The order book currently shows roughly 58.5% Ask vs 41.5% Bid, so sellers are still active around the current zone. That makes chasing the green candle risky.
My approach:
🟢 Bullish continuation: reclaim and hold $0.1106, then a move toward $0.1140 becomes interesting.
🟡 Better entry: a controlled pullback toward $0.1069–$0.1059 with buyers stepping back in.
🔴 Invalidation: losing $0.1059 would weaken the immediate bullish structure and could send OP back toward $0.1030 / $0.0998.
OP has already moved hard today. I’d rather trade confirmation than chase momentum.
Levels first. Entry second. Risk always.
What are you watching here: breakout above $0.114 or pullback toward $0.106?
$OP
OP is trading around $0.10856, up 8.53% in 24H. The move is supported by strong activity, with 704.29M OP traded and around $76.58M USDT in turnover.
Today’s range:
High: $0.11409
Low: $0.09984
Range: $0.01425 / ~14.27%
Price has pushed sharply from the $0.10 area and is now holding above $0.1085, but the real test is ahead.
Key levels I’m watching:
Resistance: $0.1106 → $0.1141
Support: $0.1069 → $0.1059
Deeper support: $0.1030 → $0.0998
The order book currently shows roughly 58.5% Ask vs 41.5% Bid, so sellers are still active around the current zone. That makes chasing the green candle risky.
My approach:
🟢 Bullish continuation: reclaim and hold $0.1106, then a move toward $0.1140 becomes interesting.
🟡 Better entry: a controlled pullback toward $0.1069–$0.1059 with buyers stepping back in.
🔴 Invalidation: losing $0.1059 would weaken the immediate bullish structure and could send OP back toward $0.1030 / $0.0998.
OP has already moved hard today. I’d rather trade confirmation than chase momentum.
Levels first. Entry second. Risk always.
What are you watching here: breakout above $0.114 or pullback toward $0.106?
$OP
1
218
·
--
$ENA is moving with real momentum, but this is not a clean chase zone yet.
ENAUSDT is trading around $0.17135, up 5.46% today. Price bounced strongly from the $0.16124 low, but sellers are still defending the $0.176–$0.189 area.
📊 Market Snapshot
Price: $0.17135
24H Change: +5.46%
24H High: $0.18887
24H Low: $0.16124
24H Range: $0.02763
24H Volume: 2.16B ENA
Turnover: $376.06M
The interesting part is volume. More than 2.1B ENA changed hands in 24 hours, showing that this move has participation behind it. But the price is still below the major intraday resistance zone, so confirmation matters.
My levels:
🟢 Long idea: $0.1697–$0.1710 if support holds
🎯 TP1: $0.1753
🎯 TP2: $0.1767
🎯 TP3: $0.1888
🛑 SL: Below $0.1665
If ENA loses $0.1697 with strong selling volume, I would rather stay out than force the trade.
For me, the key question is simple: can ENA reclaim $0.1767 with volume? If yes, the structure gets much more interesting. If not, patience is the better trade.
Trade the confirmation, not the excitement. DYOR.
$ENA
{future}(ENAUSDT)
$ENA is moving with real momentum, but this is not a clean chase zone yet.
ENAUSDT is trading around $0.17135, up 5.46% today. Price bounced strongly from the $0.16124 low, but sellers are still defending the $0.176–$0.189 area.
📊 Market Snapshot
Price: $0.17135
24H Change: +5.46%
24H High: $0.18887
24H Low: $0.16124
24H Range: $0.02763
24H Volume: 2.16B ENA
Turnover: $376.06M
The interesting part is volume. More than 2.1B ENA changed hands in 24 hours, showing that this move has participation behind it. But the price is still below the major intraday resistance zone, so confirmation matters.
My levels:
🟢 Long idea: $0.1697–$0.1710 if support holds
🎯 TP1: $0.1753
🎯 TP2: $0.1767
🎯 TP3: $0.1888
🛑 SL: Below $0.1665
If ENA loses $0.1697 with strong selling volume, I would rather stay out than force the trade.
For me, the key question is simple: can ENA reclaim $0.1767 with volume? If yes, the structure gets much more interesting. If not, patience is the better trade.
Trade the confirmation, not the excitement. DYOR.
$ENA
ENAUSDT is trading around $0.17135, up 5.46% today. Price bounced strongly from the $0.16124 low, but sellers are still defending the $0.176–$0.189 area.
📊 Market Snapshot
Price: $0.17135
24H Change: +5.46%
24H High: $0.18887
24H Low: $0.16124
24H Range: $0.02763
24H Volume: 2.16B ENA
Turnover: $376.06M
The interesting part is volume. More than 2.1B ENA changed hands in 24 hours, showing that this move has participation behind it. But the price is still below the major intraday resistance zone, so confirmation matters.
My levels:
🟢 Long idea: $0.1697–$0.1710 if support holds
🎯 TP1: $0.1753
🎯 TP2: $0.1767
🎯 TP3: $0.1888
🛑 SL: Below $0.1665
If ENA loses $0.1697 with strong selling volume, I would rather stay out than force the trade.
For me, the key question is simple: can ENA reclaim $0.1767 with volume? If yes, the structure gets much more interesting. If not, patience is the better trade.
Trade the confirmation, not the excitement. DYOR.
$ENA
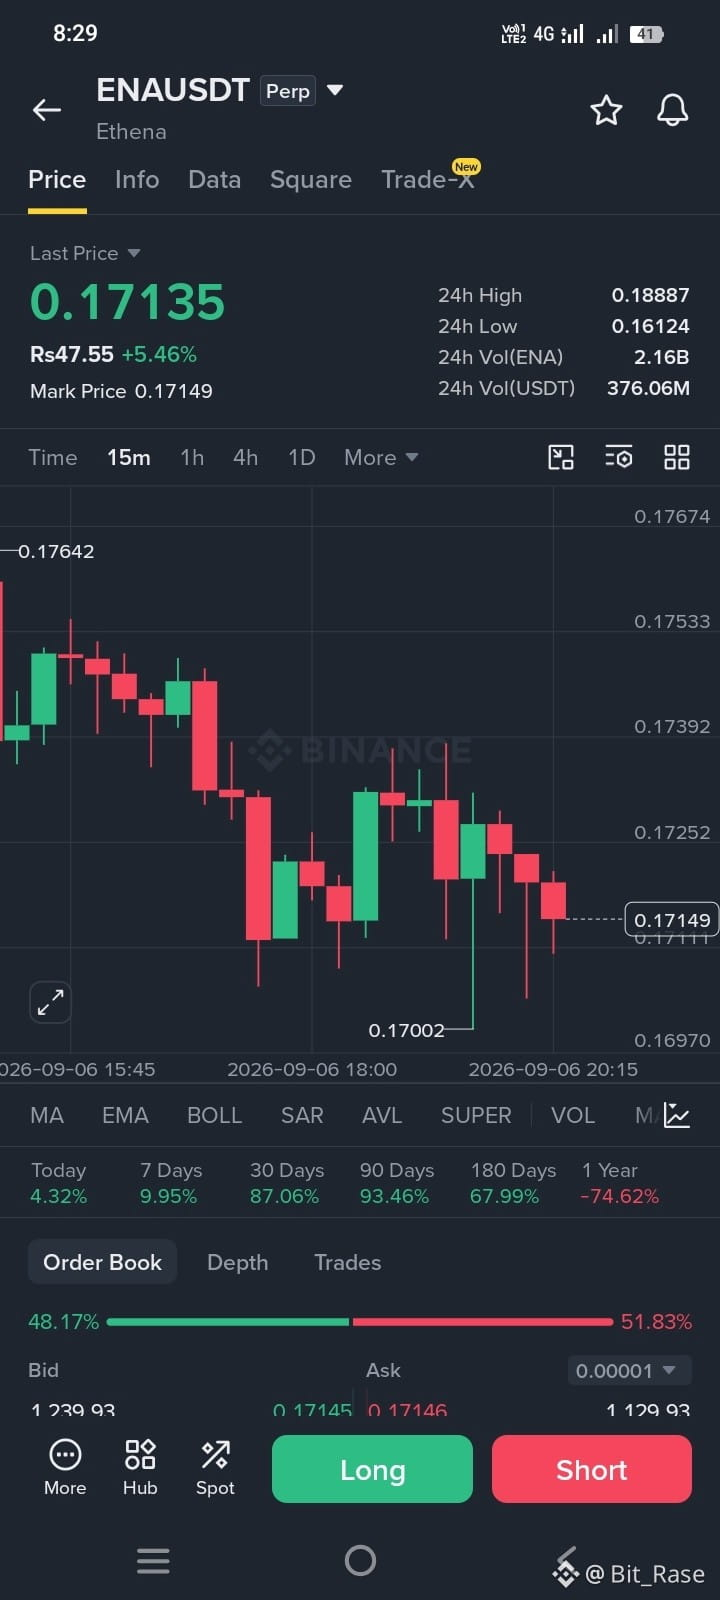
2
187
Log in to explore more content
Join global crypto users on Binance Square
⚡️ Get latest and useful information about crypto.
💬 Trusted by the world’s largest crypto exchange.
👍 Discover real insights from verified creators.
Email / Phone number
Trending Topics
AppleDebutsFoldablePhone
50,512 views
990 Discussing
Apple just dropped the foldable iPhone — and the market is paying attention. This isn't just another product cycle; it's a new product category, a new CEO on stage, and a $1,999 price tag that pushes $AAPL further into ultra-premium territory. Foldables are the narrative, and Apple is now the headline.
#appledebutsfoldablephone #EUExtendsCentralContactPointToCASPs #US10YTreasuryYieldHitsHighestSinceNov2023 #BrentCrudeTops$100 #USTreasuryToBuyBackUpTo$6BLongDatedDebt
KimHotbae
·2 Likes
·3k views
TSMCAugustRevenueUp53.3%YoY
12,563 views
356 Discussing
IranSaysReadyToEscalateWarWithUS
16,139 views
359 Discussing