📈 Is a New Bullish Move Coming on the BNB Chart?
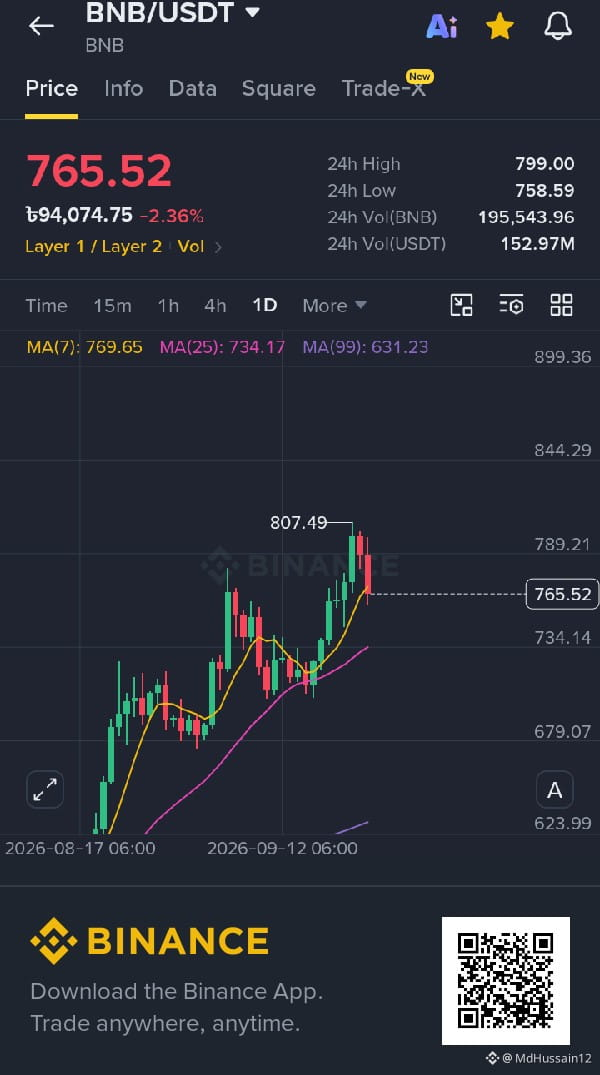
On the BNB/USDT Daily Chart, there has recently been a good uptrend. Currently, BNB is trading around $765. On the chart, MA(7) ≈ $769.65, MA(25) ≈ $734.17, and MA(99) ≈ $631.23—these are important levels for understanding short- to mid-term trends.
🔹 Resistance: $789–$807
🔹 Support: $758–$734
🔹 Next important level: $800 area
However, based on the chart alone, it cannot be confirmed that the price will definitely move upward. It’s important to make decisions by checking for breakout, volume, and candle confirmation. The crypto market is highly volatile—so trade while following your own risk management. ⚠️
In your opinion, will BNB go to $800+ or will there be another pullback first? 👇
#BNB_Market_Update #BNBUSDT #Crypto #BİNANCE #cryptotrading #TechnicalAnalysis #BNBAnalysis #Bullish #cryptocurrency
On the BNB/USDT Daily Chart, there has recently been a good uptrend. Currently, BNB is trading around $765. On the chart, MA(7) ≈ $769.65, MA(25) ≈ $734.17, and MA(99) ≈ $631.23—these are important levels for understanding short- to mid-term trends.
🔹 Resistance: $789–$807
🔹 Support: $758–$734
🔹 Next important level: $800 area
However, based on the chart alone, it cannot be confirmed that the price will definitely move upward. It’s important to make decisions by checking for breakout, volume, and candle confirmation. The crypto market is highly volatile—so trade while following your own risk management. ⚠️
In your opinion, will BNB go to $800+ or will there be another pullback first? 👇
#BNB_Market_Update #BNBUSDT #Crypto #BİNANCE #cryptotrading #TechnicalAnalysis #BNBAnalysis #Bullish #cryptocurrency