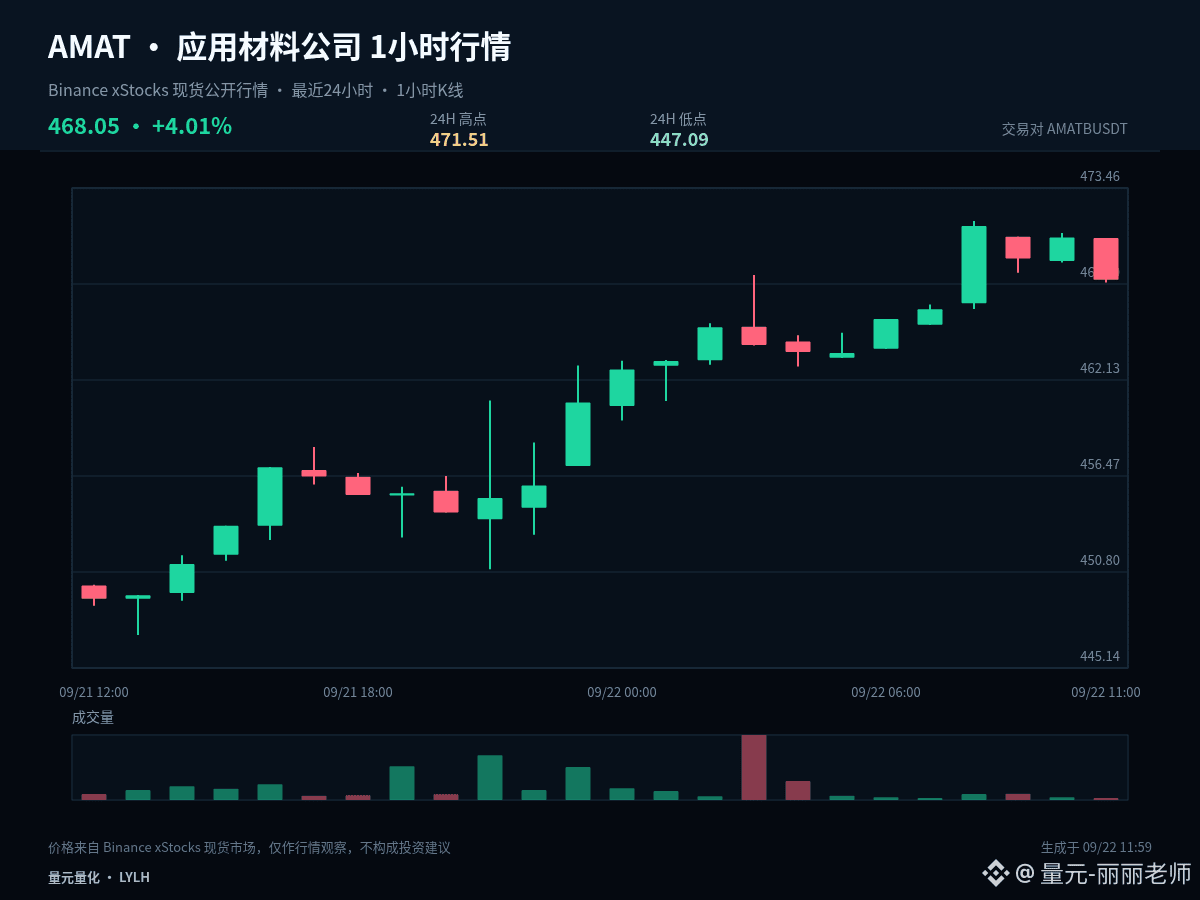
$AMATB #AMAT This time, we’ll break down the move from the position perspective. The same chart shows different key points depending on whether you’re already in a position or flat. Current price: 468.05; 1-hour: -0.53%, 24-hours: +4.01%.
Looking at how different timeframes align, 24-hours is still +4.01%, while 1-hour has rolled over to -0.53%—more like a cooling-off phase within an up-move structure. If the pullback doesn’t break key support, it’s normal turnover; if support is lost and the rebound lacks strength, near-term control will shift from the bulls to the bears.
For existing positions, pay attention to whether 447.09 is broken. If it breaks, reduce risk exposure first. For those currently flat, wait for the low to stop making lower lows and confirm that price has moved back above 459.3—don’t try to catch a still-falling structure early.
In execution, set clear conditions: after a breakout above 471.51, you need confirmation—not chase just because of a sudden spike. After dipping to 447.09, you need to see whether it can quickly reclaim—don’t buy just because it’s dropping. In the middle zone, if the odds aren’t favorable enough, waiting itself is part of the strategy.
Existing-position traders can handle it in stages based on key levels to avoid making all decisions at once; those flat should wait for either breakout confirmation or a pullback that stabilizes. For US stocks, also watch for volatility caused by trading-session transitions. Your plan should be based on price conditions, not on emotion replacing execution.
The focus of short-term positions isn’t predicting every single candlestick, but ensuring that entry, trimming, and exiting have a rationale. Do less until confirmed; if key levels fail, redo the plan—control single-trade risk first, then discuss the upside potential afterward.
#ECBStartsBlockchainEuroSettlement
Looking at how different timeframes align, 24-hours is still +4.01%, while 1-hour has rolled over to -0.53%—more like a cooling-off phase within an up-move structure. If the pullback doesn’t break key support, it’s normal turnover; if support is lost and the rebound lacks strength, near-term control will shift from the bulls to the bears.
For existing positions, pay attention to whether 447.09 is broken. If it breaks, reduce risk exposure first. For those currently flat, wait for the low to stop making lower lows and confirm that price has moved back above 459.3—don’t try to catch a still-falling structure early.
In execution, set clear conditions: after a breakout above 471.51, you need confirmation—not chase just because of a sudden spike. After dipping to 447.09, you need to see whether it can quickly reclaim—don’t buy just because it’s dropping. In the middle zone, if the odds aren’t favorable enough, waiting itself is part of the strategy.
Existing-position traders can handle it in stages based on key levels to avoid making all decisions at once; those flat should wait for either breakout confirmation or a pullback that stabilizes. For US stocks, also watch for volatility caused by trading-session transitions. Your plan should be based on price conditions, not on emotion replacing execution.
The focus of short-term positions isn’t predicting every single candlestick, but ensuring that entry, trimming, and exiting have a rationale. Do less until confirmed; if key levels fail, redo the plan—control single-trade risk first, then discuss the upside potential afterward.
#ECBStartsBlockchainEuroSettlement