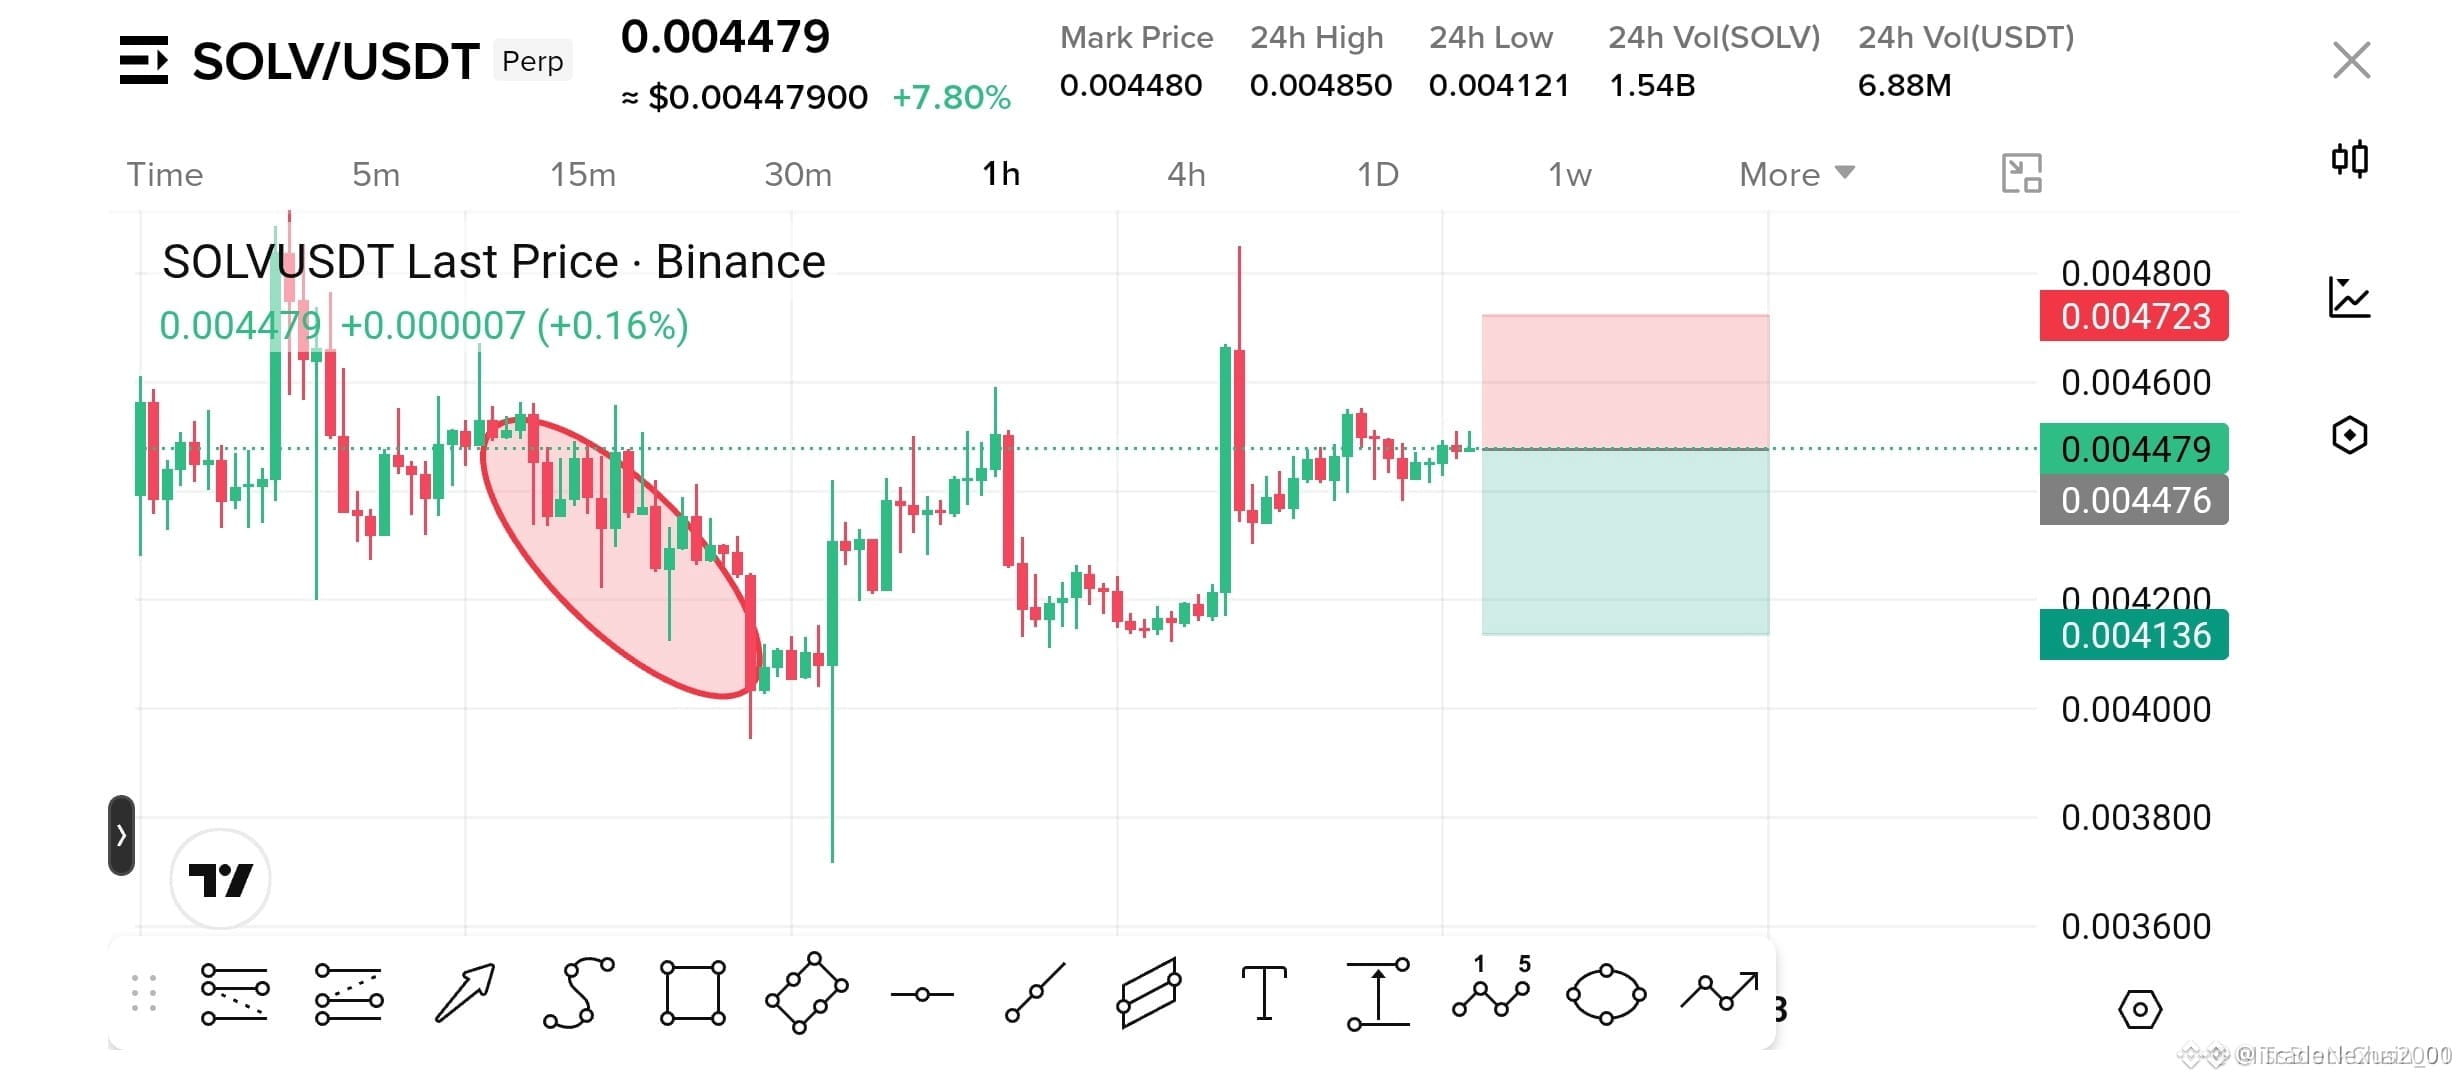
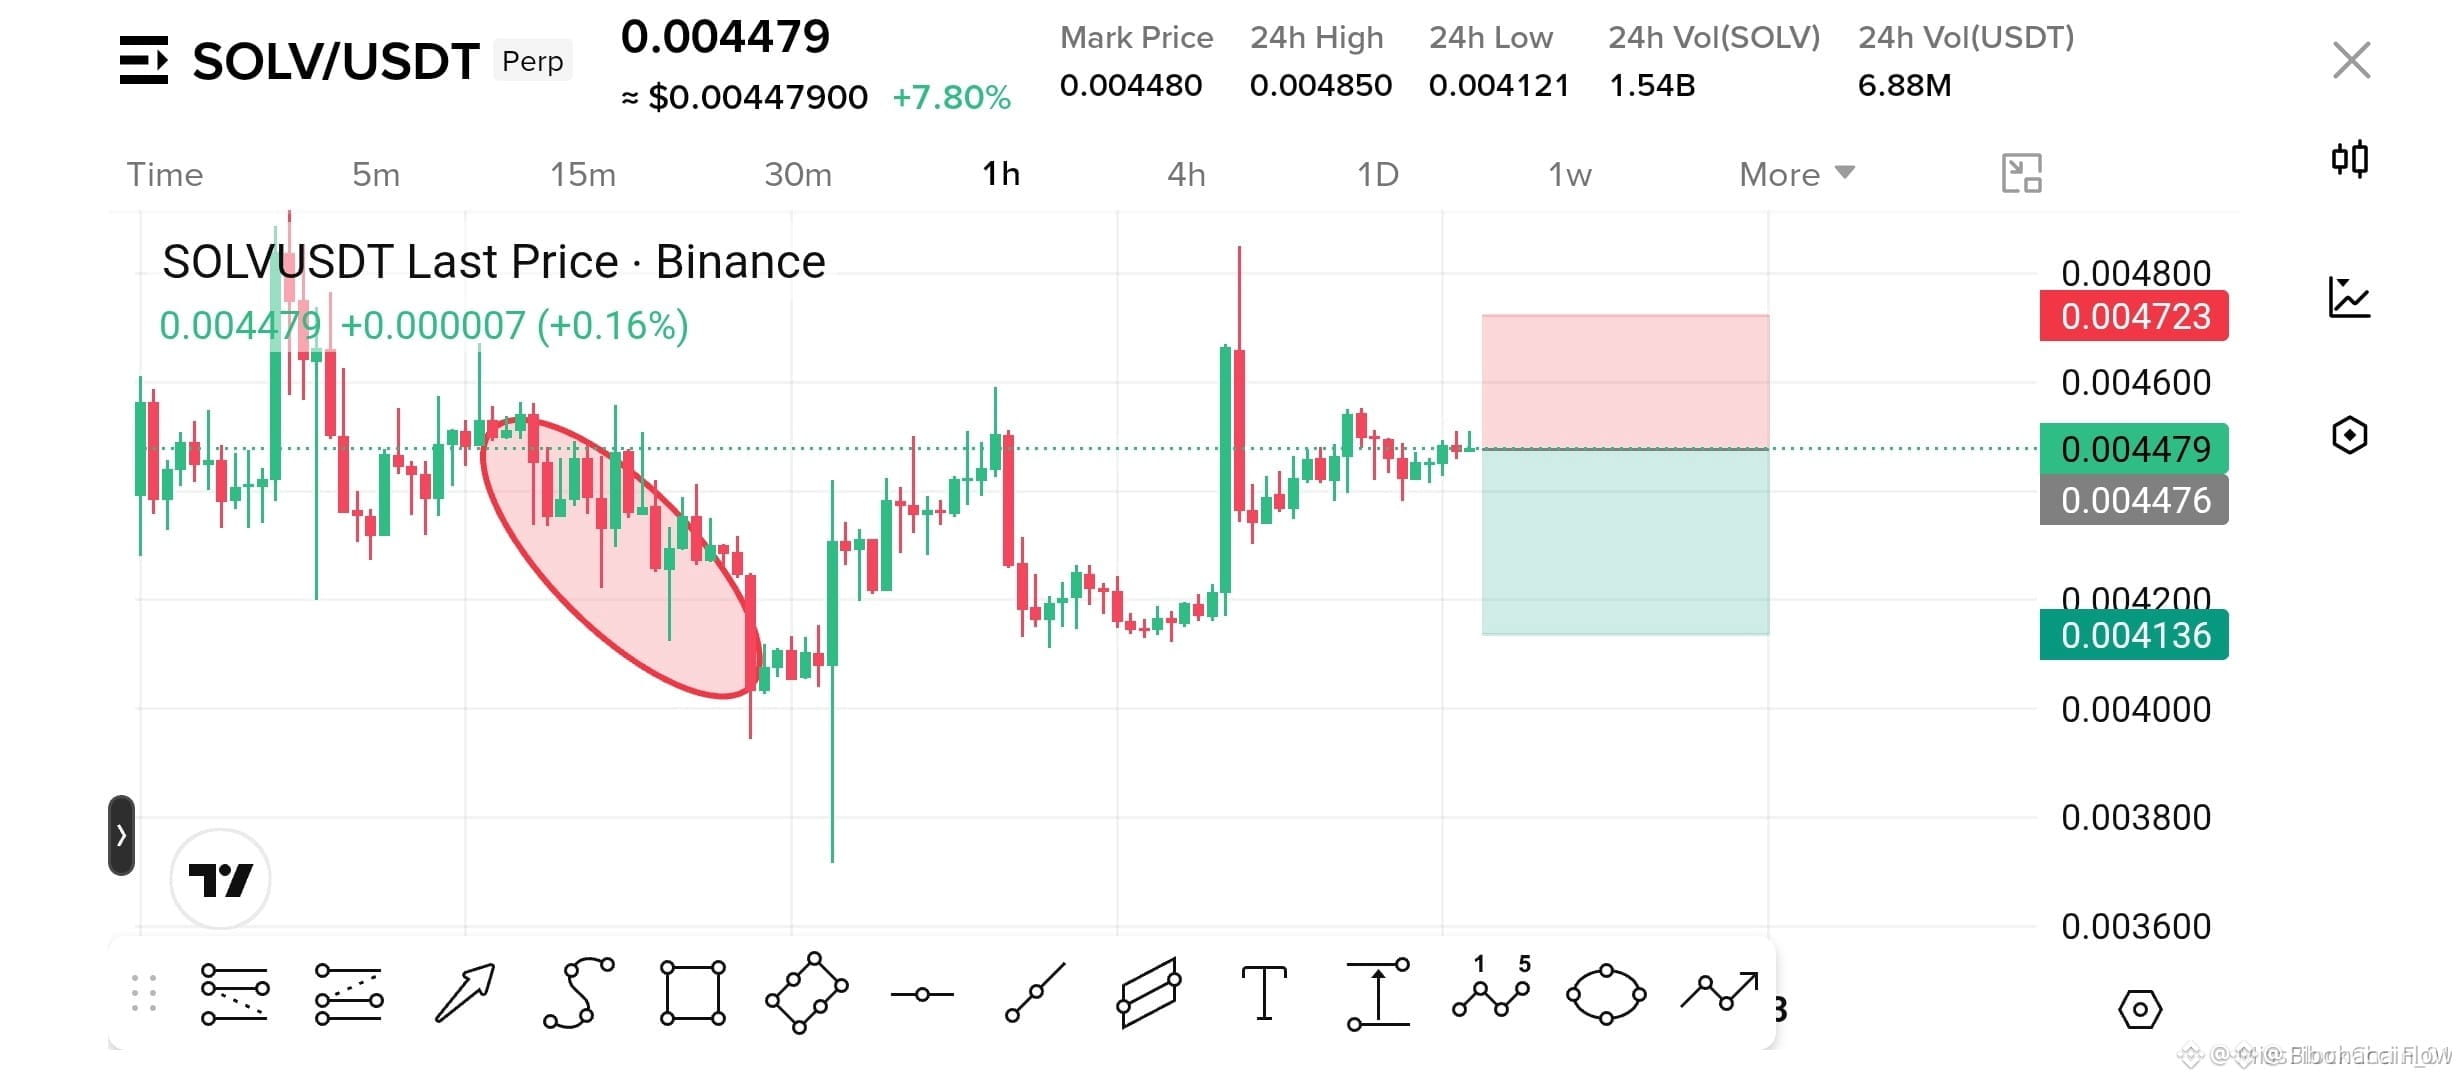
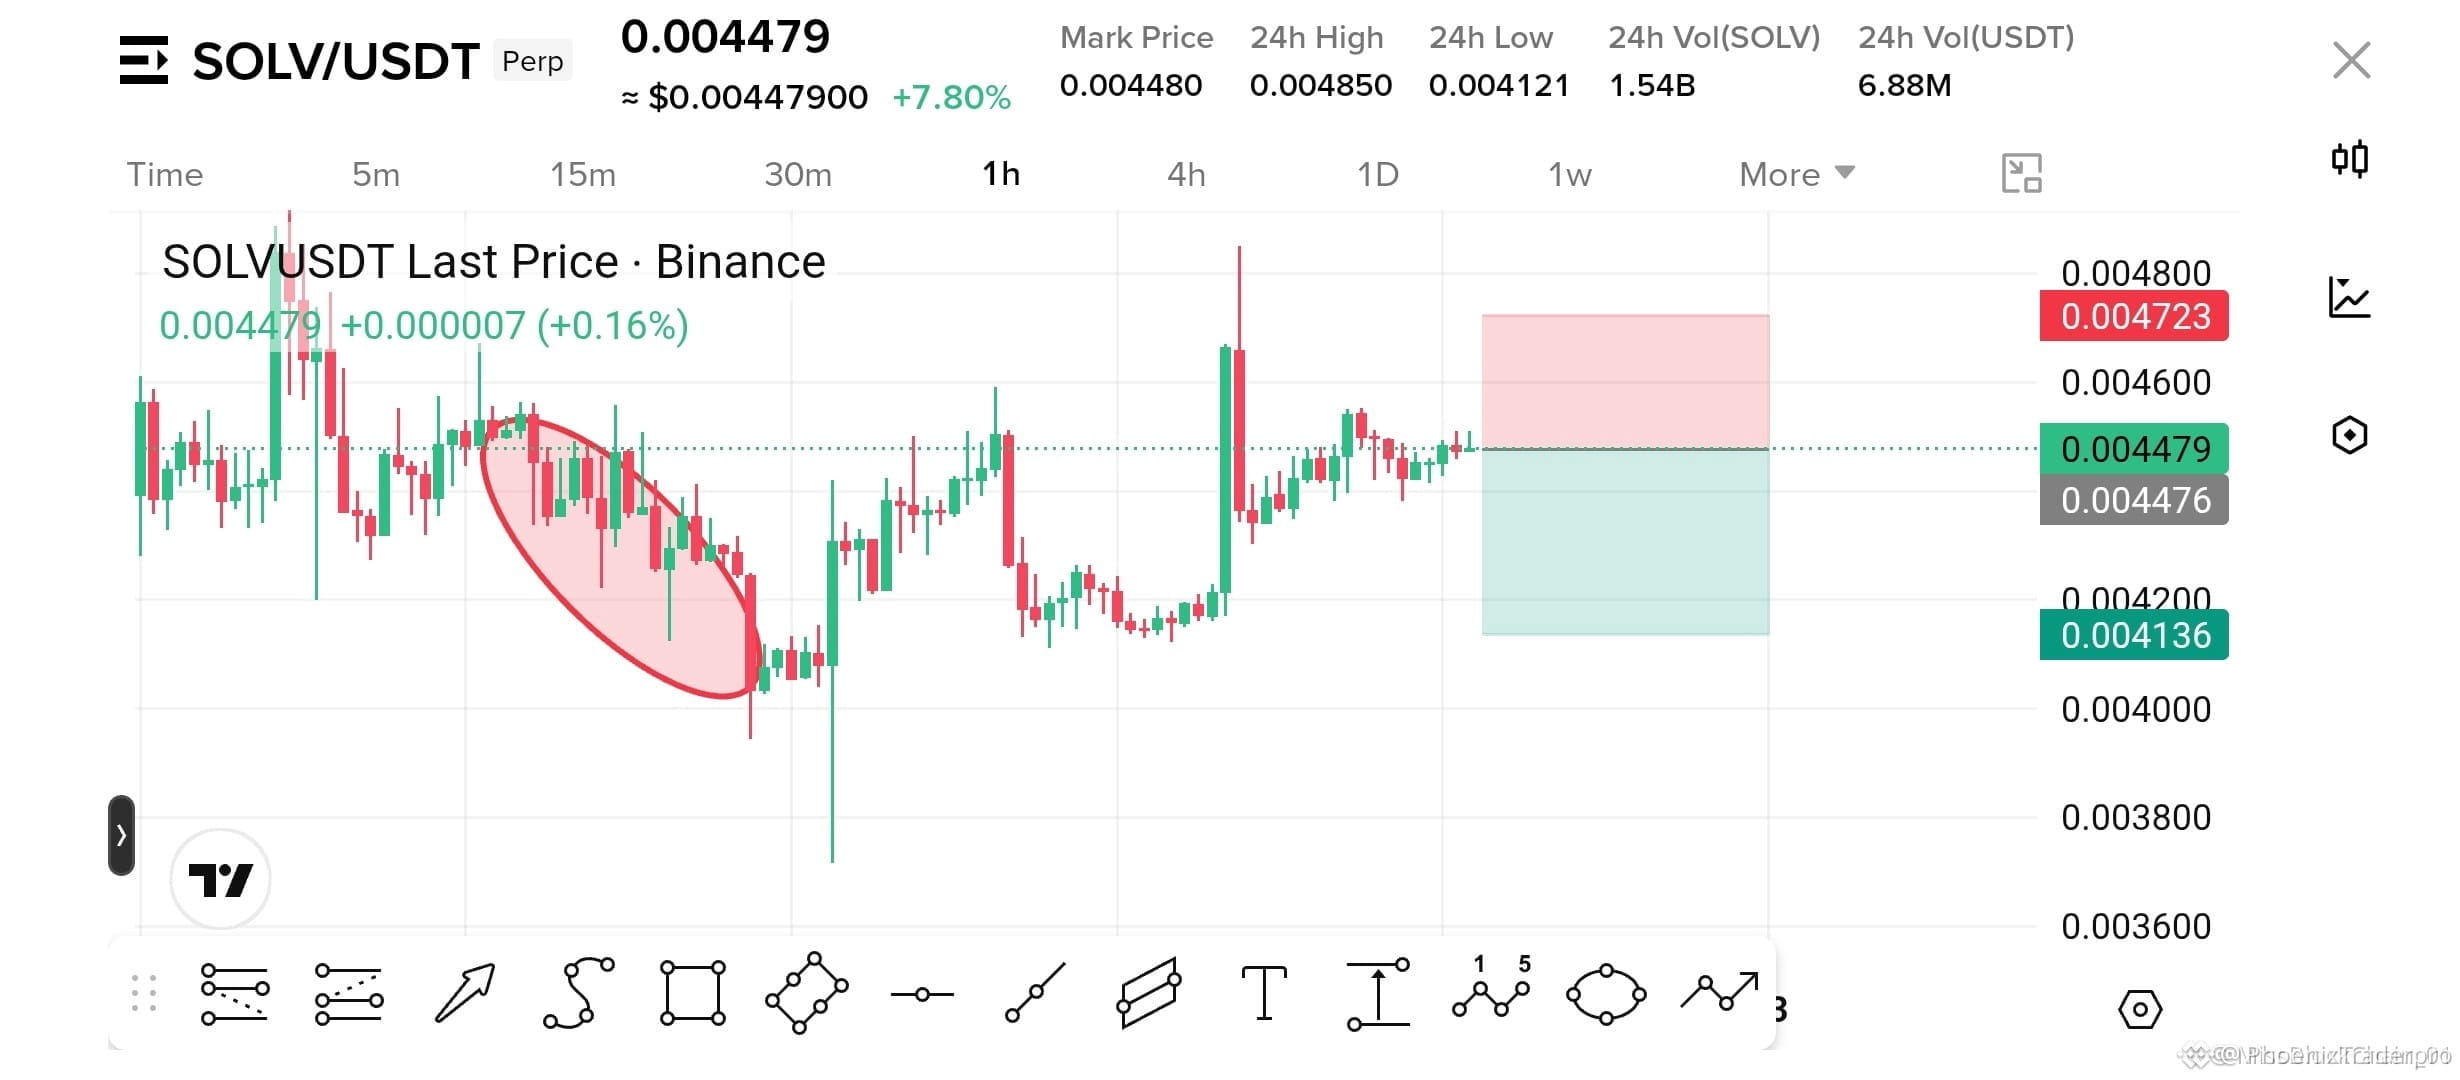
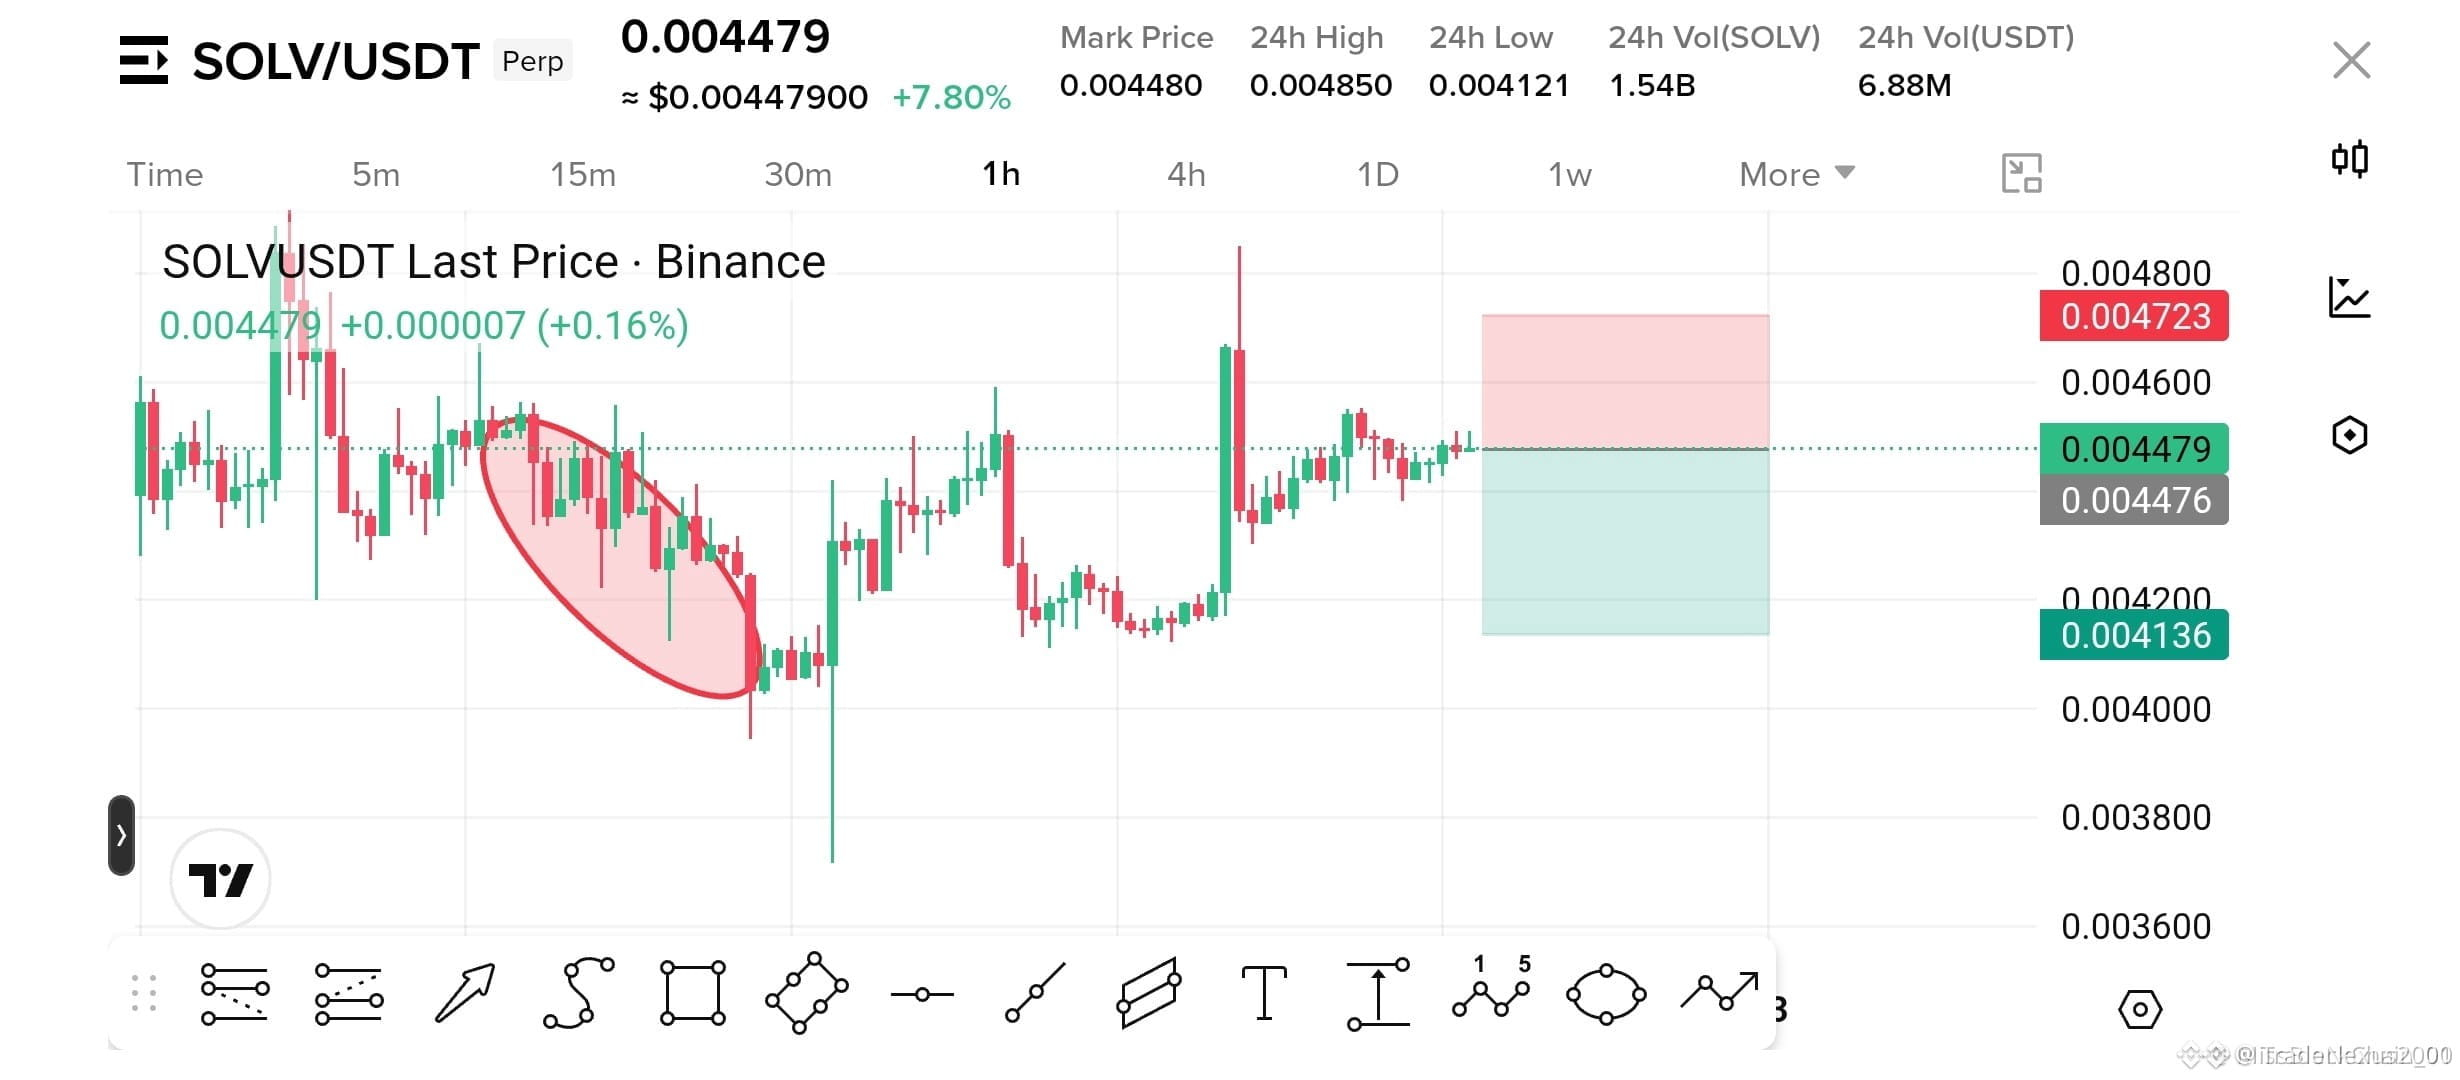
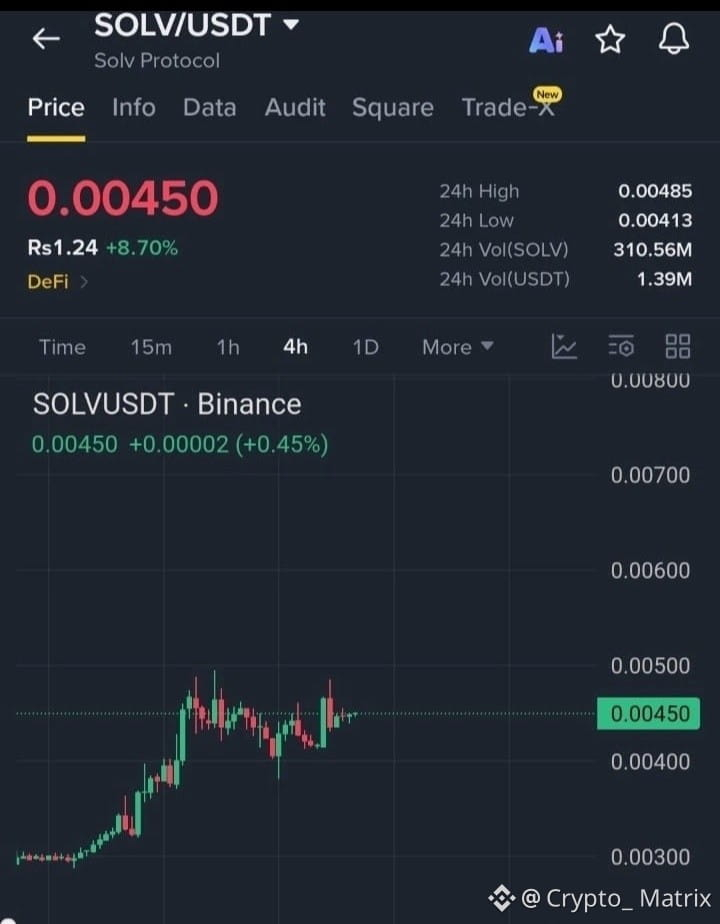
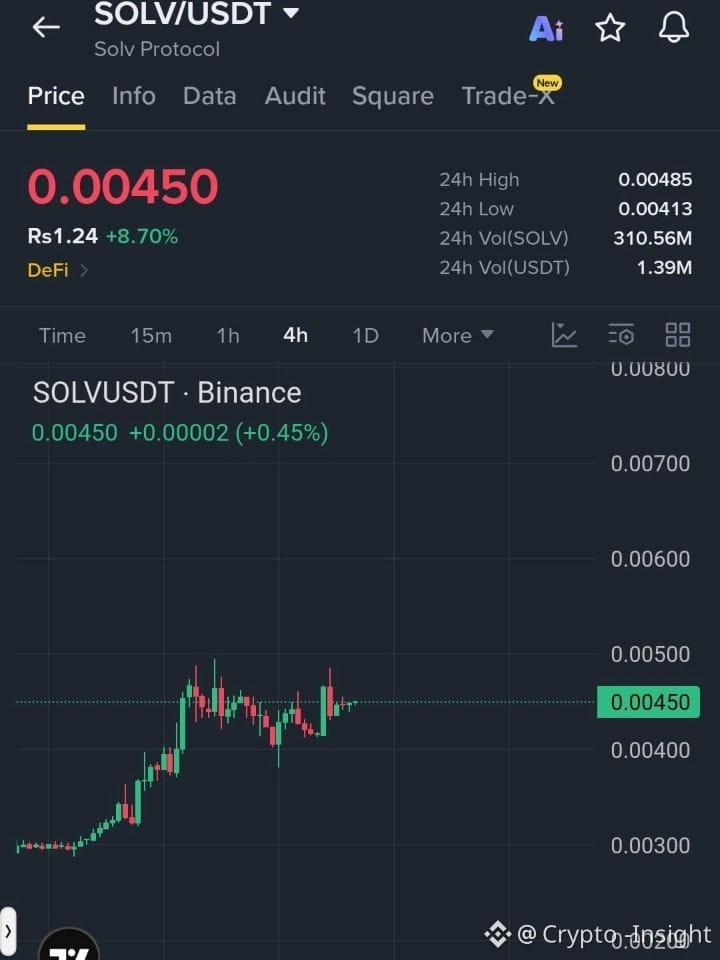
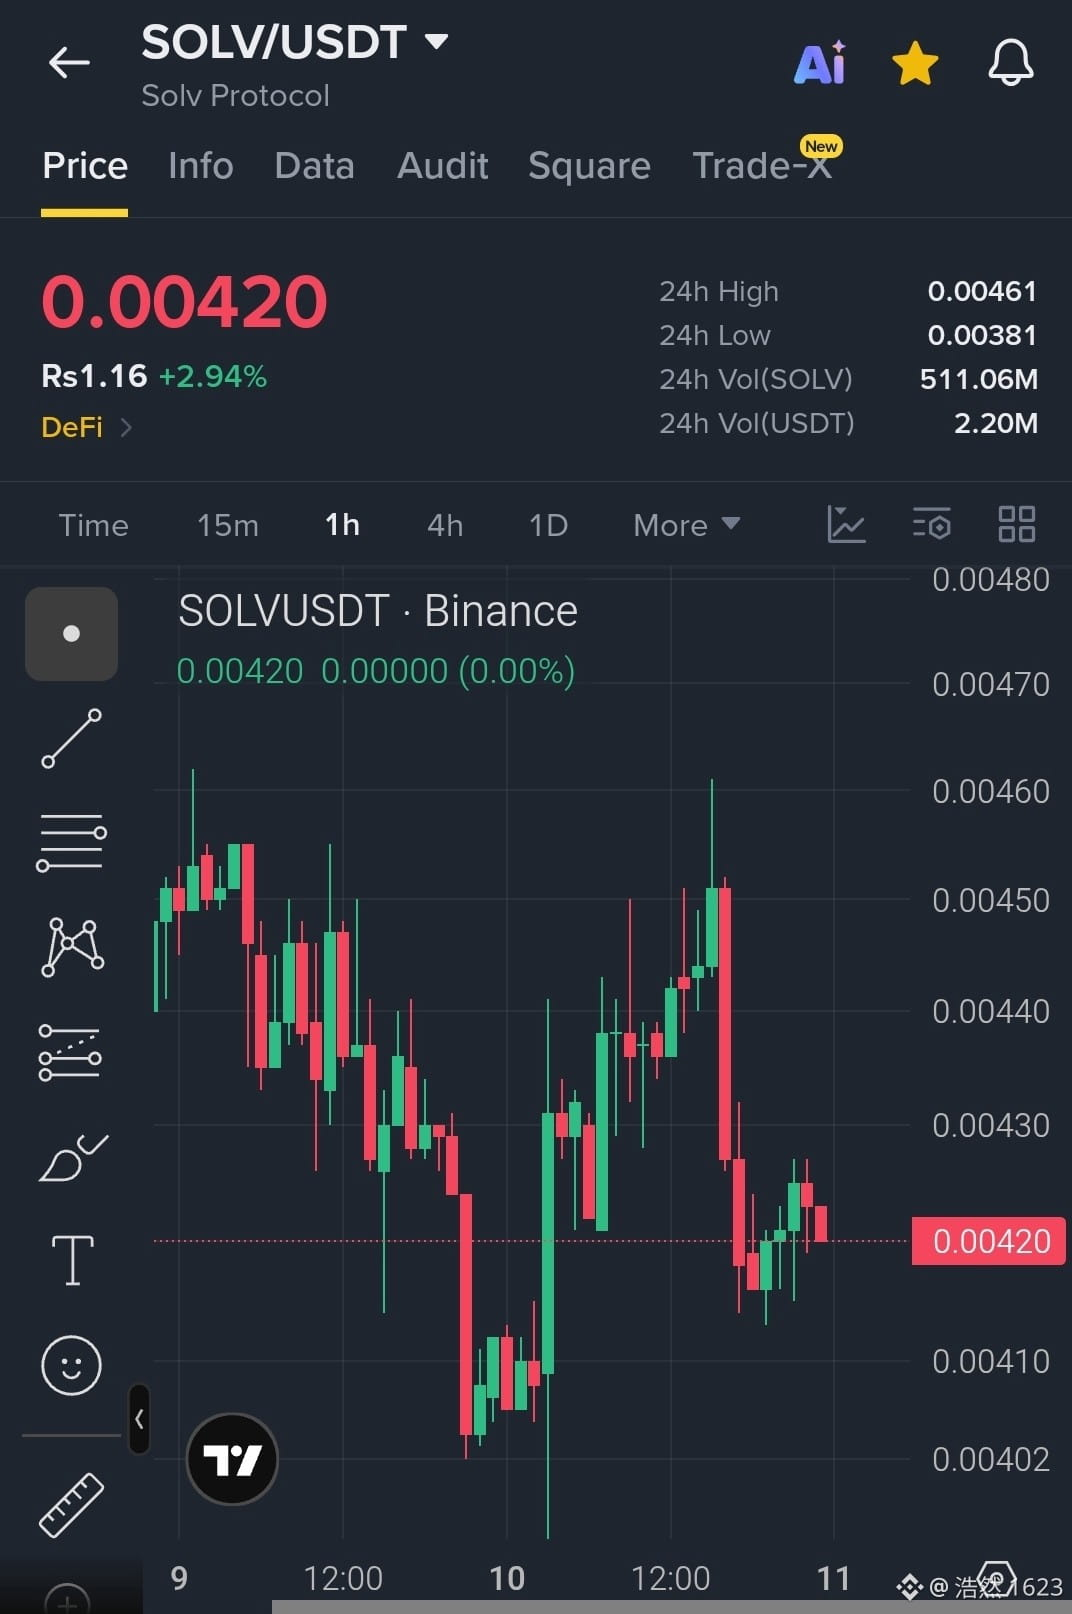
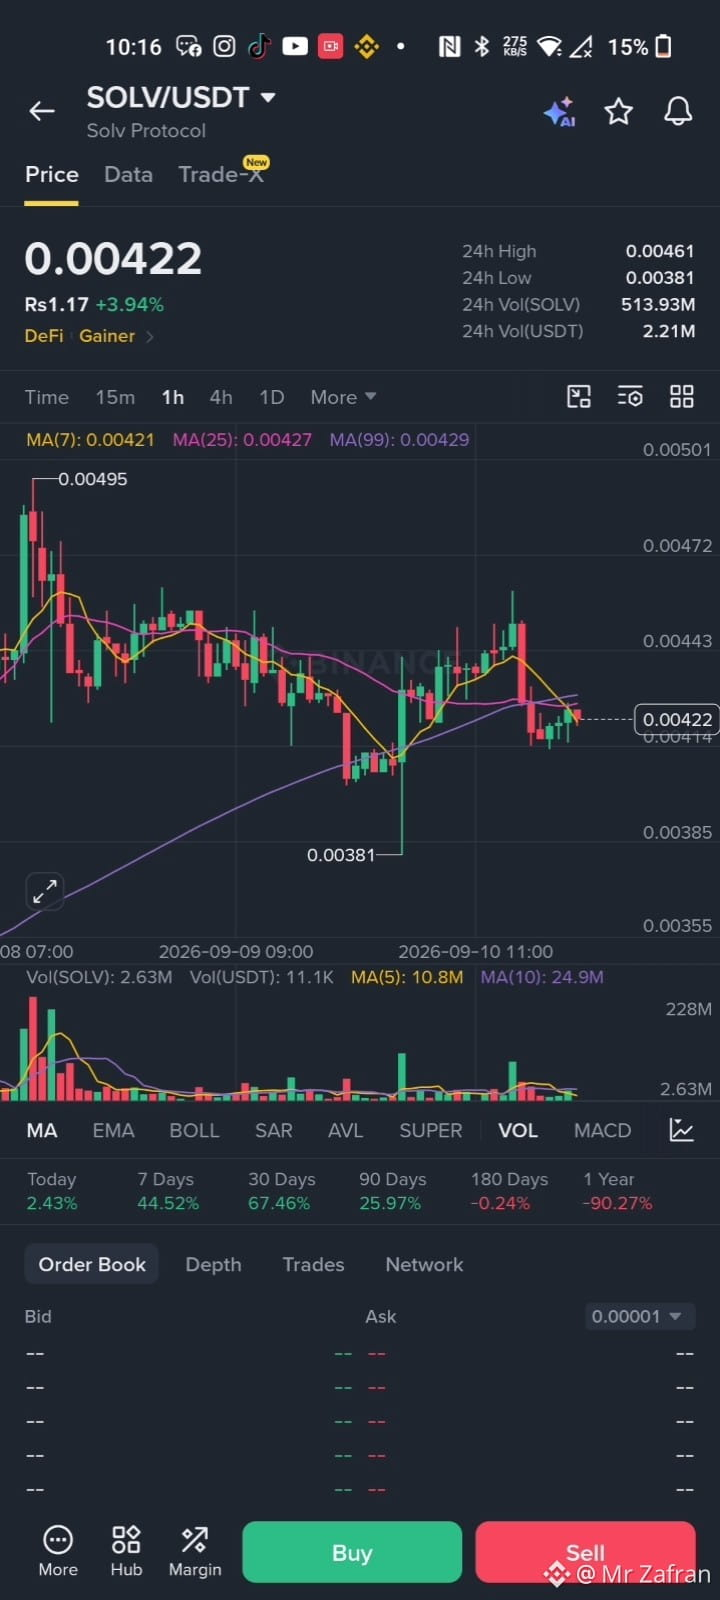
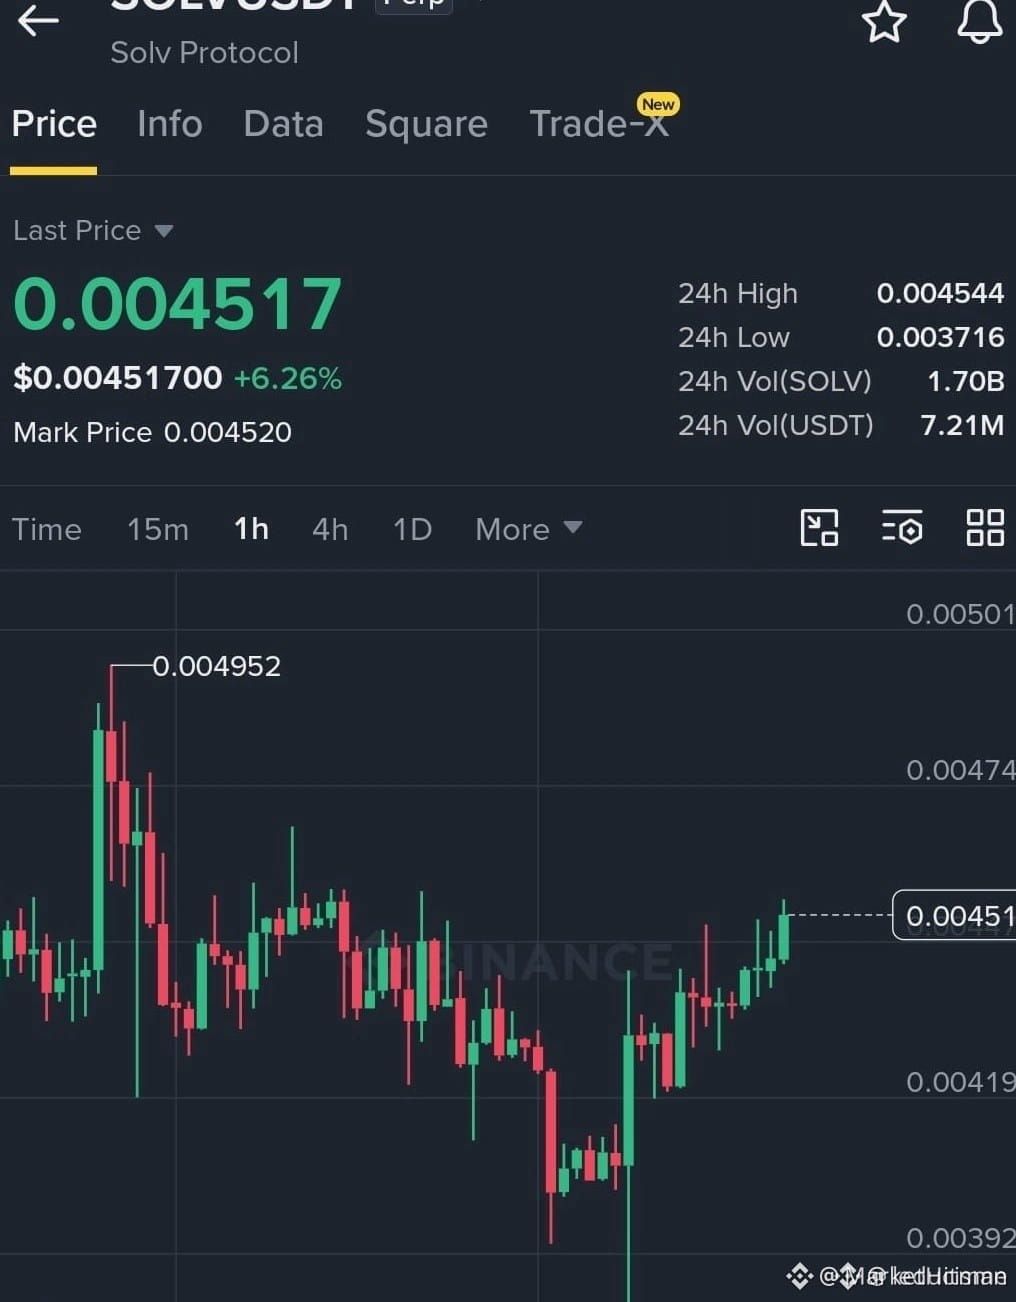
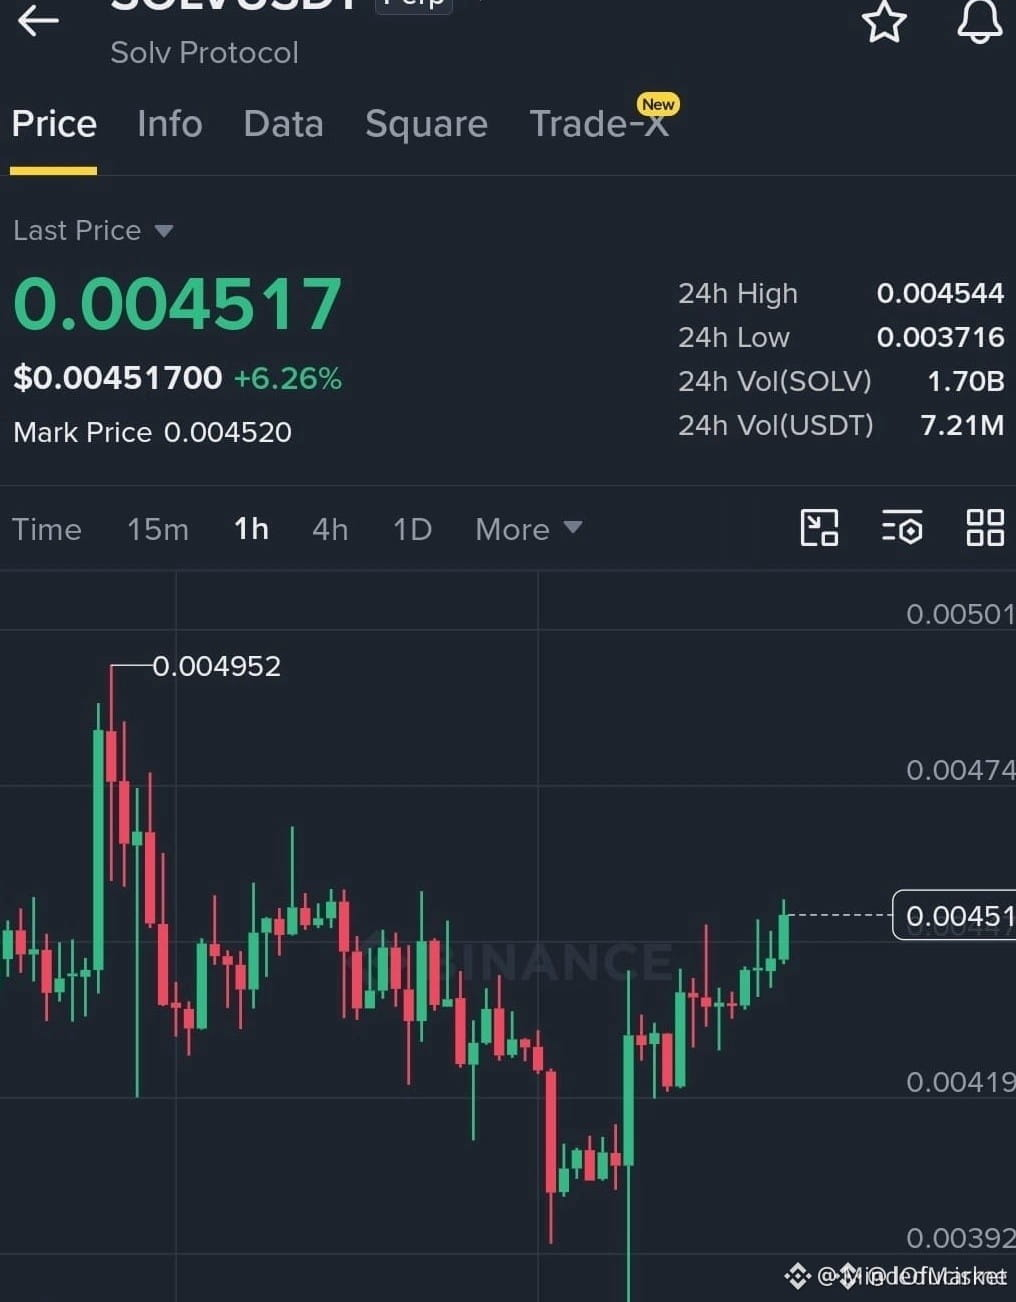
$Coin Type: 30 minutes and 4 hours are both in a long/bullish alignment. The two timeframes diverge together upward🔥
════════════════════
🔴
$SOLV 30 minutes Bullish signal
⚠️ Technical analysis: Both 30 minutes and 4 hours are bullish. There’s multi-timeframe resonance! The 30-minute MACD is above the zero axis with a bullish crossover—momentum is releasing. EMA5, 8, and 13 are aligned in a bullish arrangement diverging upward. KDJ is strong, with K above 80.2 pressing down D at 71.1. Trading volume expands by 2.3x, coordinating with price rising—volume and price both increase.
════════════════════
🔴
$THETA 30 minutes Bullish signal
⚠️ Technical analysis: 4 hours and 30 minutes have multi-timeframe resonance! The 30-minute MACD is above the zero axis with a bullish crossover; the red bars begin to expand. EMA5, 8, and 13 are aligned in a bullish arrangement diverging upward. KDJ is strong and hasn’t gone overbought. Trading volume expands by 1.9x, and the upside attack momentum is strong.
════════════════════
🔔 Watch for first-hand market movements 🔔
#多周期共振 #SOLV #THETA 📌 When trading, pay attention to whether the candlestick pattern matches