Binance Square
#msft

msft

65,718 views
696 Discussing
CyberFlow Trading
·
--
REBATE ROBOTS GOT SMASHED TRYING TO ARB $MSFT — THE CHART IS A BLOODBATH 📉 Those rebate clowns tried to scalp a 100 to 90 spread on $MSFT , only to get their teeth kicked in by the real order flow. 📉 They thought they were front-running the churn, but the market flipped the script and swept their entire thesis. The chart is officially nuked. Grabbing this falling knife with full leverage isn't conviction — it's a funeral plan. 📊 Smart money is sweeping the bids and cleaning up the trapped longs while the structure stays broken. 💭 Are you fading the breakdown, or are you the next one asking for a rebuild? 👇 ⚠️ Not financial advice. Always manage your risk. 🛡️ 🏷️ #MSFT #BearishSetup #Markets #TradingPsychology #Crypto 🩸 📉
REBATE ROBOTS GOT SMASHED TRYING TO ARB $MSFT — THE CHART IS A BLOODBATH 📉

Those rebate clowns tried to scalp a 100 to 90 spread on $MSFT , only to get their teeth kicked in by the real order flow. 📉 They thought they were front-running the churn, but the market flipped the script and swept their entire thesis.

The chart is officially nuked. Grabbing this falling knife with full leverage isn't conviction — it's a funeral plan. 📊 Smart money is sweeping the bids and cleaning up the trapped longs while the structure stays broken. 💭 Are you fading the breakdown, or are you the next one asking for a rebuild? 👇

⚠️ Not financial advice. Always manage your risk. 🛡️

🏷️ #MSFT #BearishSetup #Markets #TradingPsychology #Crypto

🩸 📉
By the time Crypto Twitter starts yelling about $MSFT the best entry may already be gone. Entry: 495.586–496.330 Breakout above: 499.122 Targets: 499.122 / 500.797 / 503.030 SL: 494.097 Early eyes win. Click Here to Trade $MSFT #MSFT #Long #BinanceSquare
By the time Crypto Twitter starts yelling about $MSFT the best entry may already be gone.

Entry: 495.586–496.330
Breakout above: 499.122
Targets: 499.122 / 500.797 / 503.030
SL: 494.097

Early eyes win.

Click Here to Trade $MSFT

#MSFT #Long #BinanceSquare
🦈 $MSFT ARBITRAGE PLAYERS JUST BECAME THE EXIT LIQUIDITY 📉 The "spread genius" who loaded 100 and dumped 90 to ride the rebate just found out the hard way — the market doesn't pay for cleverness, it pays for alignment with structure. 📉 That entire liquidity cluster got swept, and the sellers absorbed every bid with clinical precision. The chart is printing textbook distribution. Every rally is being faded, every dip is extending, and the crowd still clinging to the reclaim narrative is exactly the fuel institutions need on the sell side. 🦈 When the tape breaks like this, you don't argue with it — you respect the path of least resistance and let price confirm before pressing. 💬 Are you still waiting for the dead-cat bounce, or are you reading this distribution for what it is? 👇 ⚠️ Not financial advice. Always manage your risk. 🛡️ 🏷️ #MSFT #ShortSetup #Distribution #Bearish #Trading 📉 🦈
🦈 $MSFT ARBITRAGE PLAYERS JUST BECAME THE EXIT LIQUIDITY 📉

The "spread genius" who loaded 100 and dumped 90 to ride the rebate just found out the hard way — the market doesn't pay for cleverness, it pays for alignment with structure. 📉 That entire liquidity cluster got swept, and the sellers absorbed every bid with clinical precision.

The chart is printing textbook distribution. Every rally is being faded, every dip is extending, and the crowd still clinging to the reclaim narrative is exactly the fuel institutions need on the sell side. 🦈 When the tape breaks like this, you don't argue with it — you respect the path of least resistance and let price confirm before pressing.

💬 Are you still waiting for the dead-cat bounce, or are you reading this distribution for what it is? 👇

⚠️ Not financial advice. Always manage your risk. 🛡️

🏷️ #MSFT #ShortSetup #Distribution #Bearish #Trading

📉 🦈
🚨 $MSFT Short Setup 📉 Entry: $493.81–$498.77 🛑 Stop: $523.71 🎯 TP1: $448.62 🎯 TP2: $416.63 🎯 TP3: $376.26 RSI nearing overbought. Momentum is fading, and this trend flip could offer a solid short opportunity. Manage risk. Trade the setup—not the hype. 📊 #MSFT #Stocks #Trading #ShortSignal #Bilverse {future}(MSFTUSDT)
🚨 $MSFT Short Setup 📉

Entry: $493.81–$498.77
🛑 Stop: $523.71

🎯 TP1: $448.62
🎯 TP2: $416.63
🎯 TP3: $376.26

RSI nearing overbought. Momentum is fading, and this trend flip could offer a solid short opportunity.

Manage risk. Trade the setup—not the hype. 📊

#MSFT #Stocks #Trading #ShortSignal #Bilverse
🚨 $MSFT SHORT-TERM CAUTION Microsoft has been one of the strongest performers in the market recently, but that's exactly why I'm becoming cautious. 📈 Over the past month, $MSFT has surged roughly 42%. A significant portion of investor enthusiasm continues to be driven by Microsoft's close relationship with OpenAI and the AI growth narrative. But here's the reality: • Strong trends don't move up forever. • Parabolic rallies often attract late buyers. • Historical price action shows that sharp advances are frequently followed by healthy pullbacks. 📊 Why I'm Watching Closely: 🔹 Price is extended after a powerful multi-week rally. 🔹 Market expectations for AI growth are already extremely high. 🔹 Risk-reward becomes less attractive after a 40%+ move without meaningful correction. 🔹 Profit-taking pressure tends to increase as momentum slows. ⚠️ This doesn't necessarily mean the long-term trend is over. It simply means that after such a strong advance, a correction or consolidation phase becomes increasingly likely. 💭 Debate: Do you think Microsoft continues its AI-fueled rally, or is a pullback overdue after a 42% surge? 👇 Share your view below. #MSFT #Microsoft #OpenAI #USInitialJoblessClaimsStayBelow200K #SmartCryptoX Click here to Trade 👇️ {future}(MSFTUSDT)
🚨 $MSFT SHORT-TERM CAUTION
Microsoft has been one of the strongest performers in the market recently, but that's exactly why I'm becoming cautious.
📈 Over the past month, $MSFT has surged roughly 42%.
A significant portion of investor enthusiasm continues to be driven by Microsoft's close relationship with OpenAI and the AI growth narrative.
But here's the reality:
• Strong trends don't move up forever.
• Parabolic rallies often attract late buyers.
• Historical price action shows that sharp advances are frequently followed by healthy pullbacks.
📊 Why I'm Watching Closely:
🔹 Price is extended after a powerful multi-week rally.
🔹 Market expectations for AI growth are already extremely high.
🔹 Risk-reward becomes less attractive after a 40%+ move without meaningful correction.
🔹 Profit-taking pressure tends to increase as momentum slows.
⚠️ This doesn't necessarily mean the long-term trend is over.
It simply means that after such a strong advance, a correction or consolidation phase becomes increasingly likely.
💭 Debate:
Do you think Microsoft continues its AI-fueled rally, or is a pullback overdue after a 42% surge?
👇 Share your view below.
#MSFT #Microsoft #OpenAI #USInitialJoblessClaimsStayBelow200K #SmartCryptoX

Click here to Trade 👇️
Would you take this $MSFT short on the trend flip? Here's the plan $MSFT REVERSAL | 📉 SHORT 💰 Price: 496.45 📊 24H Range: 482.00 – 497.77 📦 Volume: $46.08M 📐 Technicals: RSI(14): 65.7 — Near Overbought EMA20: $488.41 | EMA50: $487.37 ⚠️ Above EMA50 📉 Entry: 493.81 – 498.77 🛑 Stop: 523.71 🎯 TP1: 448.62 🎯 TP2: 416.63 🎯 TP3: 376.26 The MSFT technical picture couldn't be clearer. The MSFT breakdown is accelerating — on track. Levels Are Holding 👉 $MSFT 👈 Go Long #MSFT #scalping #shortsignal
Would you take this $MSFT short on the trend flip? Here's the plan
$MSFT REVERSAL | 📉 SHORT

💰 Price: 496.45
📊 24H Range: 482.00 – 497.77
📦 Volume: $46.08M

📐 Technicals:
RSI(14): 65.7 — Near Overbought
EMA20: $488.41 | EMA50: $487.37 ⚠️ Above EMA50

📉 Entry: 493.81 – 498.77
🛑 Stop: 523.71
🎯 TP1: 448.62
🎯 TP2: 416.63
🎯 TP3: 376.26

The MSFT technical picture couldn't be clearer.

The MSFT breakdown is accelerating — on track.

Levels Are Holding 👉 $MSFT 👈 Go Long

#MSFT #scalping #shortsignal
🦈 $MSFT JUST CONFIRMED OPENAI IS ITS AI CASH COW — $24.1B AND THE CRYPTO AI NARRATIVE IS WAKING UP 🚀 The filing speaks volumes: OpenAI pumped $24.1 billion into Microsoft's fiscal year revenue, crushing half of its entire AI business and creeping toward 70%. 📊 This isn't a side bet anymore — it's the engine room. Nadella's whispering $37B annualized AI run-rate, and the market is starting to price that tsunami. 💡 When legacy tech validates AI demand at this scale, the spillover into AI-focused crypto tokens is historically explosive. Smart money watches these disclosures closely; they front-run the narrative rotation before the crowd catches the scent. 🦈 Deep liquidity is forming around AI narratives as institutional flow hunts for the next exponential leg. 💬 Is the AI narrative about to refuel the next crypto rotation, or is big tech siphoning all the upside? 👇 ⚠️ Not financial advice. Always manage your risk. 🛡️ 🏷️ #MSFT #ArtificialIntelligence #AI #CryptoNarrative #InstitutionalFlow 🔥 👁️
🦈 $MSFT JUST CONFIRMED OPENAI IS ITS AI CASH COW — $24.1B AND THE CRYPTO AI NARRATIVE IS WAKING UP 🚀

The filing speaks volumes: OpenAI pumped $24.1 billion into Microsoft's fiscal year revenue, crushing half of its entire AI business and creeping toward 70%. 📊 This isn't a side bet anymore — it's the engine room. Nadella's whispering $37B annualized AI run-rate, and the market is starting to price that tsunami.

💡 When legacy tech validates AI demand at this scale, the spillover into AI-focused crypto tokens is historically explosive. Smart money watches these disclosures closely; they front-run the narrative rotation before the crowd catches the scent. 🦈 Deep liquidity is forming around AI narratives as institutional flow hunts for the next exponential leg.

💬 Is the AI narrative about to refuel the next crypto rotation, or is big tech siphoning all the upside? 👇

⚠️ Not financial advice. Always manage your risk. 🛡️

🏷️ #MSFT #ArtificialIntelligence #AI #CryptoNarrative #InstitutionalFlow

🔥 👁️
🚨 $MSFT : 70% OF AI REVENUE FLOWS FROM ONE PARTNERSHIP 🦈 📊 The disclosure is a structural tell. Microsoft booked $24.1B in revenue from OpenAI in the fiscal year ending June — over half of its actual AI revenue, closer to 70% when you strip out the noise. Nadella projected $37B annualized AI revenue by March; this filing now confirms exactly where that engine lives. 🔍 This isn't just a headline — it's a concentration risk map. The entire AI thesis is laser-locked to one counterparty. If OpenAI scales, Microsoft's AI machine scales. If OpenAI's compute demand stalls, the narrative reprices fast. Institutions are recalibrating as we speak. 💬 Is this a moat or a monoculture? How should the market price a growth story that leans 70% on a single partner? 👇 ⚠️ Not financial advice. Always manage your risk. 🛡️ 🏷️ #MSFT #AIRevenue #OpenAI #TechAnalysis #InstitutionalInsight 📊 👁️
🚨 $MSFT : 70% OF AI REVENUE FLOWS FROM ONE PARTNERSHIP 🦈

📊 The disclosure is a structural tell. Microsoft booked $24.1B in revenue from OpenAI in the fiscal year ending June — over half of its actual AI revenue, closer to 70% when you strip out the noise. Nadella projected $37B annualized AI revenue by March; this filing now confirms exactly where that engine lives.

🔍 This isn't just a headline — it's a concentration risk map. The entire AI thesis is laser-locked to one counterparty. If OpenAI scales, Microsoft's AI machine scales. If OpenAI's compute demand stalls, the narrative reprices fast. Institutions are recalibrating as we speak.

💬 Is this a moat or a monoculture? How should the market price a growth story that leans 70% on a single partner? 👇

⚠️ Not financial advice. Always manage your risk. 🛡️

🏷️ #MSFT #AIRevenue #OpenAI #TechAnalysis #InstitutionalInsight

📊 👁️
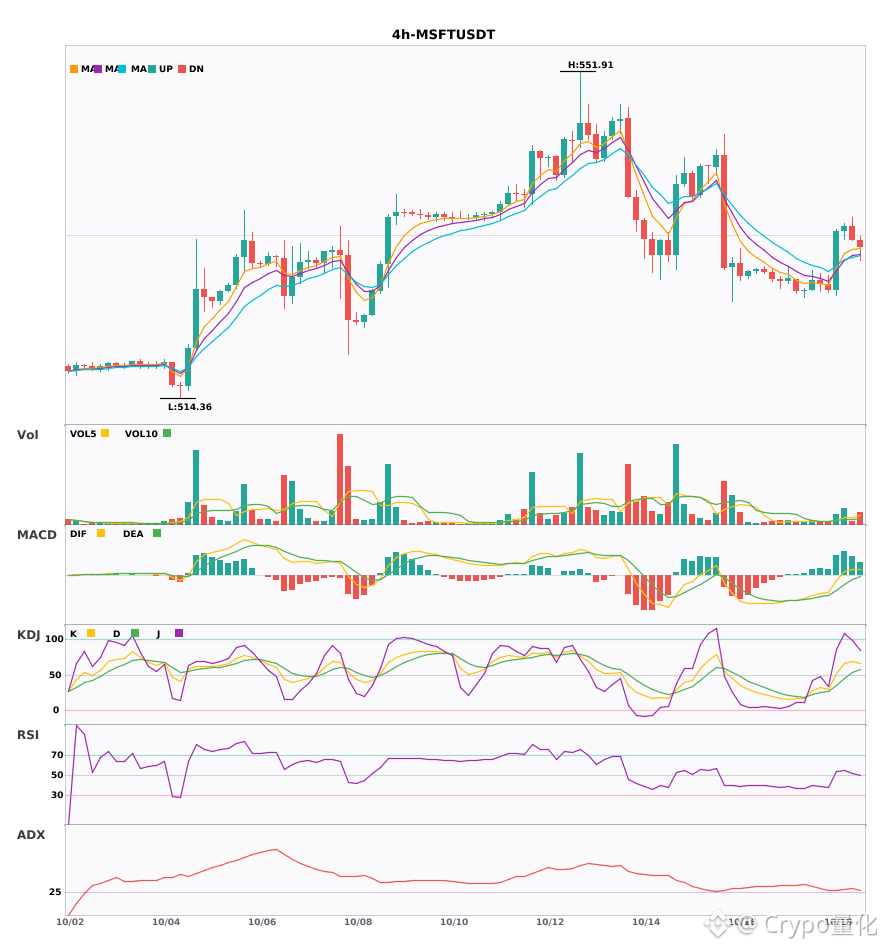
MSFT and ADA four-hour daily moving averages are in a bullish alignment. MACD golden cross with volume resonance turns bullish 🔥 ════════════════════ 🔴 $MSFT 4 four-hour bullish signals ⚠️ Technicals: The daily chart’s bullish trend has already been confirmed upward. The 4H EMA5 has just crossed above EMA8, meaning the short-term has turned bullish. KDJ has just formed a golden cross; K is at 41.7 and hasn’t entered the overbought zone yet. Volume has also expanded by 2.3x. Several cycles resonate together—worth watching. ════════════════════ 🔴 $ADA 4 four-hour bullish signals ⚠️ Technicals: The daily bullish structure is confirmed as support. On the 4H chart, the MACD has turned above the zero line with a golden cross, and the red histogram has extended as volume surges. The 5 and 8 moving averages are just now aligned bullishly. However, KDJ hasn’t caught up yet. Still, volume is up 3x as a base/support—this is a multi-cycle resonance entry signal. ════════════════════ 🔔 Get the first-hand market updates on anomalies 🔔 #多周期共振 #MSFT #ADA 📌 When trading, pay attention to whether the candlestick patterns match
MSFT and ADA four-hour daily moving averages are in a bullish alignment. MACD golden cross with volume resonance turns bullish 🔥

════════════════════
🔴 $MSFT 4 four-hour bullish signals
⚠️ Technicals: The daily chart’s bullish trend has already been confirmed upward. The 4H EMA5 has just crossed above EMA8, meaning the short-term has turned bullish. KDJ has just formed a golden cross; K is at 41.7 and hasn’t entered the overbought zone yet. Volume has also expanded by 2.3x. Several cycles resonate together—worth watching.
════════════════════

🔴 $ADA 4 four-hour bullish signals
⚠️ Technicals: The daily bullish structure is confirmed as support. On the 4H chart, the MACD has turned above the zero line with a golden cross, and the red histogram has extended as volume surges. The 5 and 8 moving averages are just now aligned bullishly. However, KDJ hasn’t caught up yet. Still, volume is up 3x as a base/support—this is a multi-cycle resonance entry signal.
════════════════════

🔔 Get the first-hand market updates on anomalies 🔔
#多周期共振 #MSFT #ADA
📌 When trading, pay attention to whether the candlestick patterns match
8.5 Days: Another Microsoft executive plans to sell 10,000 shares #MSFT stock, worth approximately $5 million. Specific details are as follows! Name: Judson Althoff Position: Executive Disposal Date: 2026-08-05 Report Date: 2026-08-05 Total Sold: 10,000 shares Total Sale Proceeds: $4.88 million Remaining Shares: Not disclosed Impact Level: Moderate bStocks:MSFTb $MSFT Summary You Must See: Microsoft (MSFT) executive Judson Althoff files Form 144, planning to sell 10,000 shares, with proceeds of approximately $4.88 million. Important Notice: 1: Watch for the scars—know immediately whether Microsoft (MSFT)’s executives and CEO are selling or increasing their holdings!
8.5 Days: Another Microsoft executive plans to sell 10,000 shares #MSFT stock, worth approximately $5 million. Specific details are as follows!

Name: Judson Althoff
Position: Executive
Disposal Date: 2026-08-05
Report Date: 2026-08-05
Total Sold: 10,000 shares
Total Sale Proceeds: $4.88 million
Remaining Shares: Not disclosed
Impact Level: Moderate
bStocks:MSFTb

$MSFT Summary You Must See:
Microsoft (MSFT) executive Judson Althoff files Form 144, planning to sell 10,000 shares, with proceeds of approximately $4.88 million.

Important Notice:
1: Watch for the scars—know immediately whether Microsoft (MSFT)’s executives and CEO are selling or increasing their holdings!
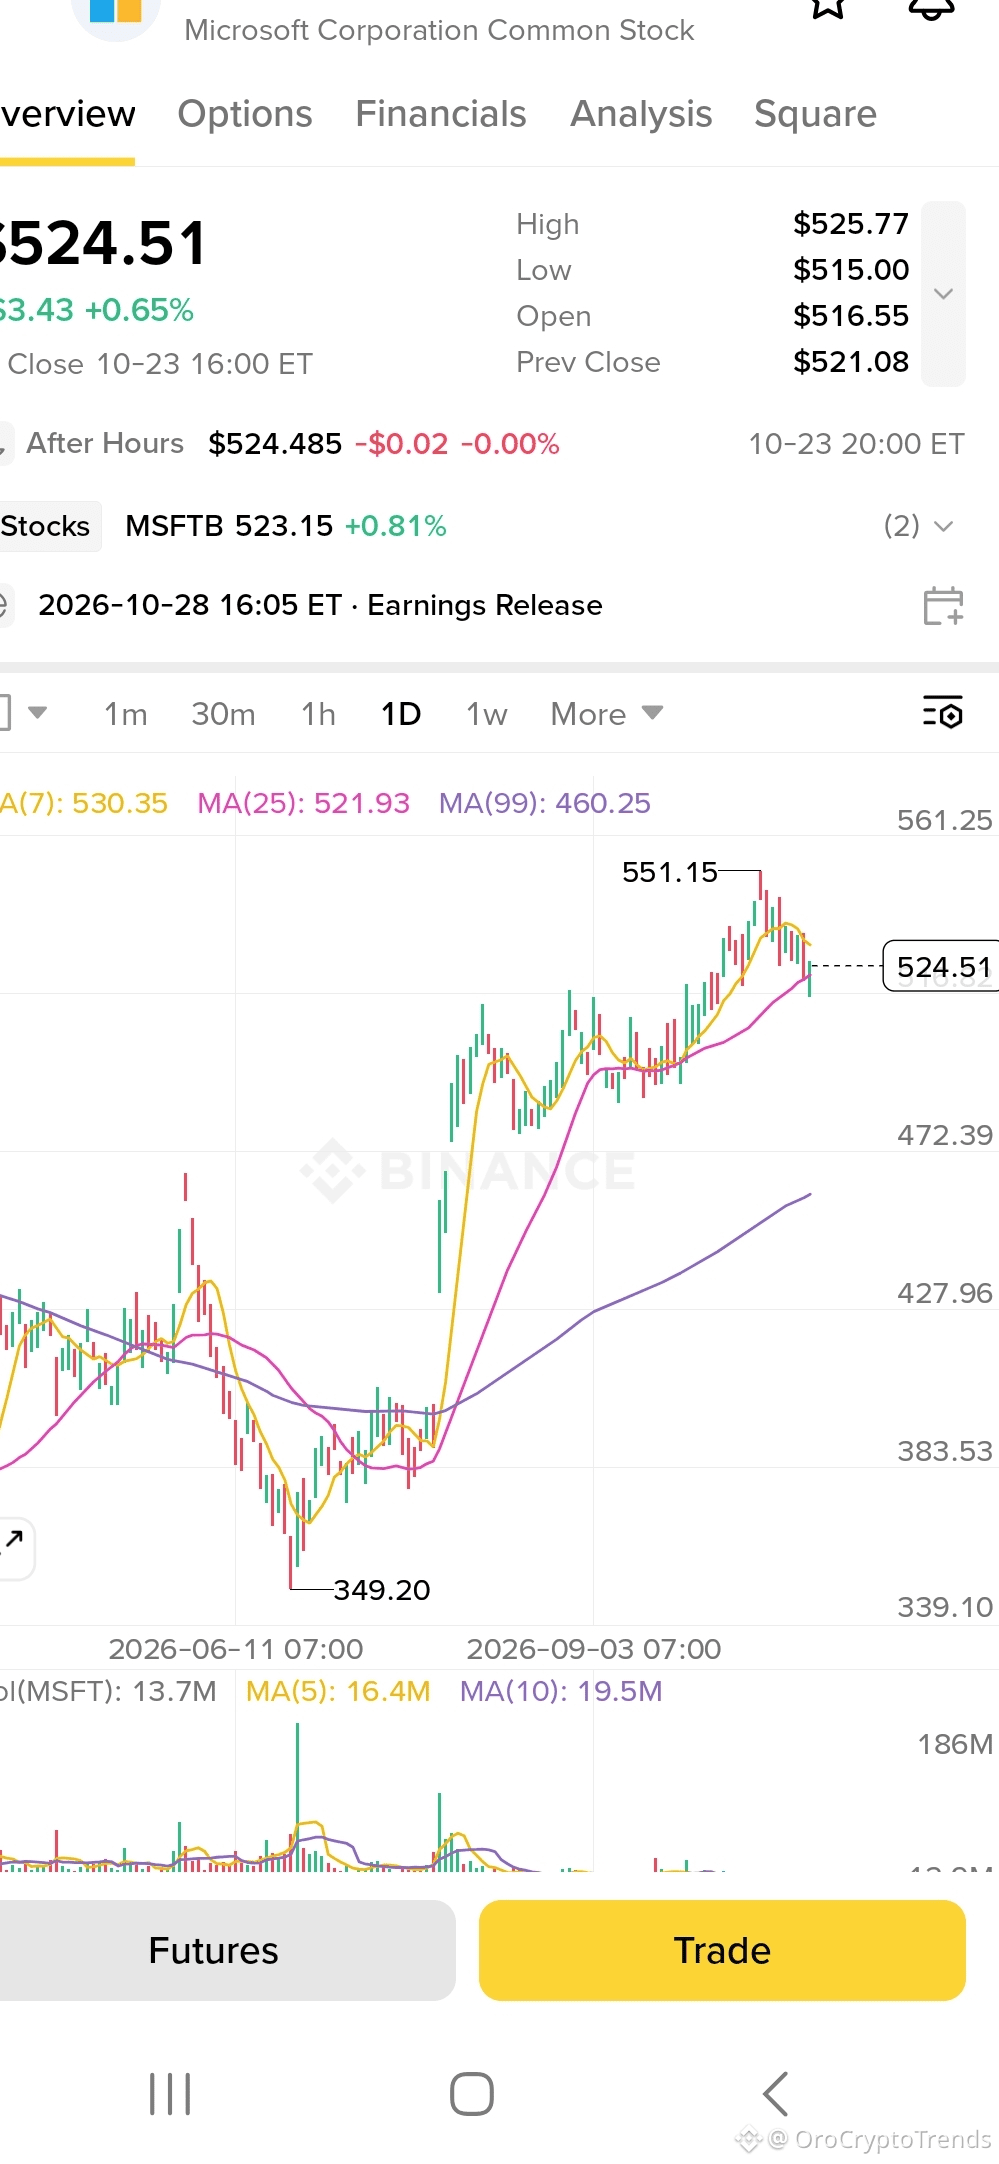
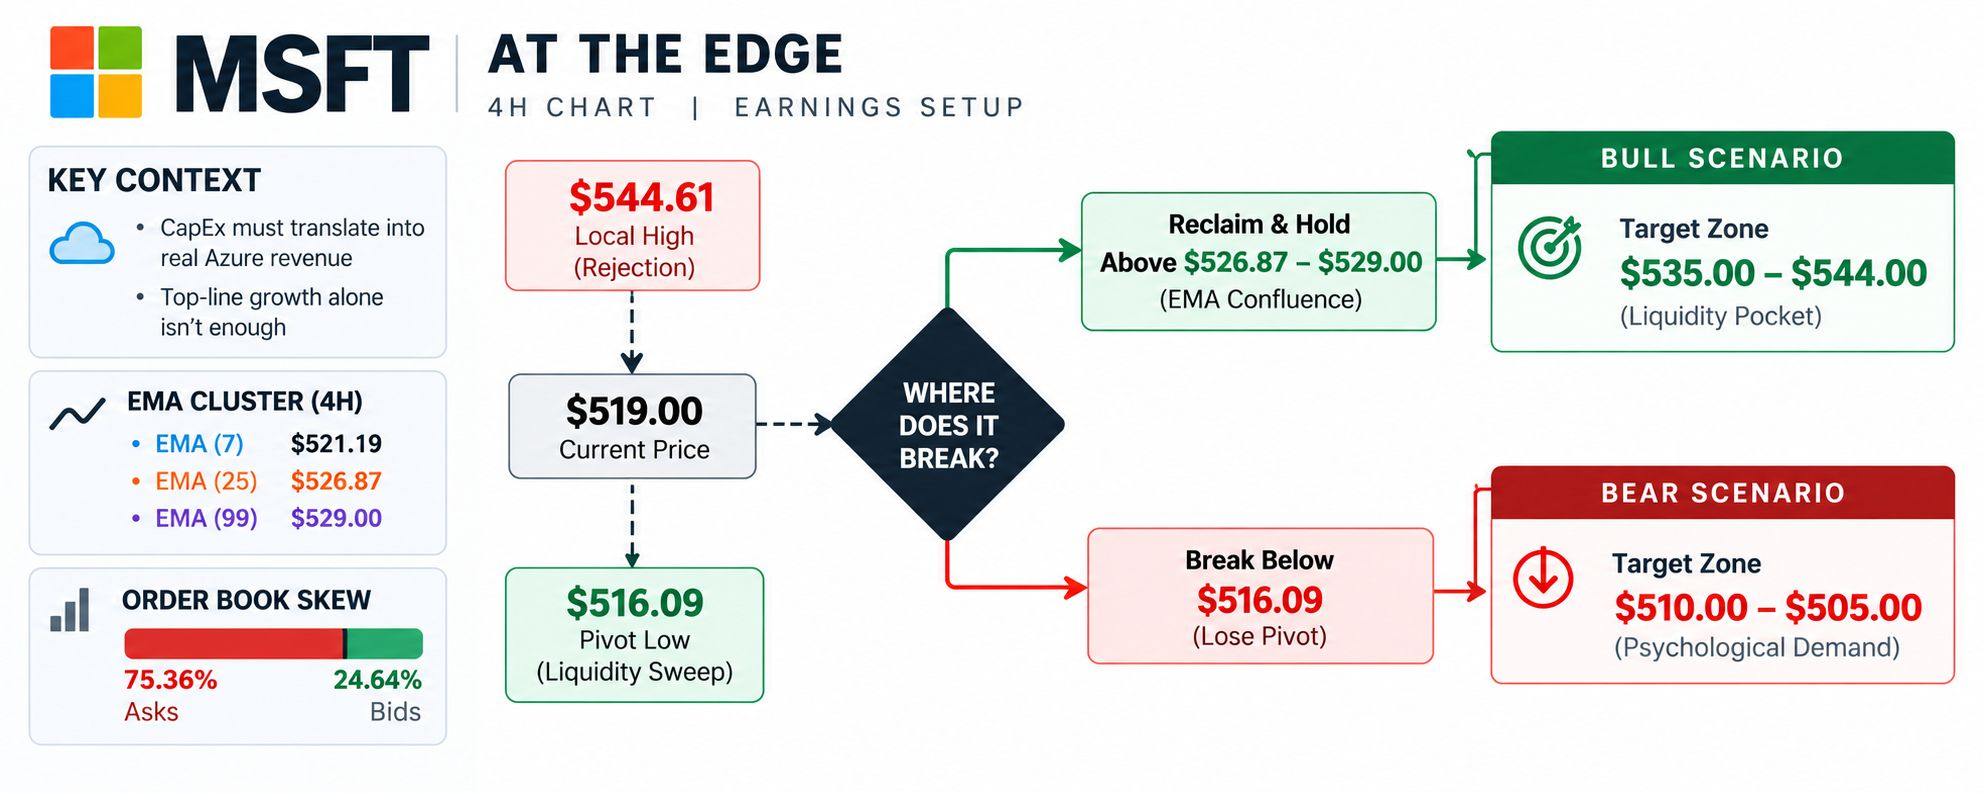
$MSFTB #MSFT has returned to the vicinity of the low from the past 24 hours. Next, we should observe whether the selling pressure weakens and the support is confirmed. Without a stop-the-fall structure, there’s no rush to predict a reversal. The current price is near the lower bound of the past 24-hour range: 1-hour +0.06%, 24-hour -0.92%. The key in analyzing the lows isn’t to bottom-fish early; it’s to watch whether, after a breakdown, the price can quickly reclaim. If it can reclaim, it suggests the selling pressure is being absorbed. If it continues to linger below the lower bound, it indicates that weakness hasn’t ended yet. I will treat 491.865 as the short-term long/short pivot: holding it means the pullback is still within a controllable range, and then there may be conditions to test 499.24 again. After an effective breakdown, don’t jump in—wait for a new stable structure to form around 484.49. In execution, set clear conditions: after breaking above 499.24, you need confirmation—not just a momentary spike and then chasing. After dipping to 484.49, check whether it can quickly reclaim—not simply catching every dip. When the mid-range doesn’t offer sufficient reward-to-risk, waiting itself is also part of the strategy. Position management should distinguish between swing (mid-term) and short-term trades. For existing swing positions, first assess whether the structure is broken; don’t be repeatedly influenced by a single 1-hour candlestick. For short-term positions, execute around support, resistance, and closing confirmation. Those currently in cash don’t need to chase the price in the middle of the range—waiting for a clearer location often has an advantage. For short-term positions, the focus isn’t to predict every candlestick. It’s to ensure there are reasons for entry, partial reduction, and exit. Do less without confirmation; if a key level fails, redo the plan. Control single-trade risk first, then discuss upside potential. #xrp I care more about how price reacts than guessing the answer in advance. Which signal do you most want to see here? Want to learn about a quantitative hedging arbitrage robot? Join the chat room
$MSFTB #MSFT has returned to the vicinity of the low from the past 24 hours. Next, we should observe whether the selling pressure weakens and the support is confirmed. Without a stop-the-fall structure, there’s no rush to predict a reversal.

The current price is near the lower bound of the past 24-hour range: 1-hour +0.06%, 24-hour -0.92%. The key in analyzing the lows isn’t to bottom-fish early; it’s to watch whether, after a breakdown, the price can quickly reclaim. If it can reclaim, it suggests the selling pressure is being absorbed. If it continues to linger below the lower bound, it indicates that weakness hasn’t ended yet.

I will treat 491.865 as the short-term long/short pivot: holding it means the pullback is still within a controllable range, and then there may be conditions to test 499.24 again. After an effective breakdown, don’t jump in—wait for a new stable structure to form around 484.49.

In execution, set clear conditions: after breaking above 499.24, you need confirmation—not just a momentary spike and then chasing. After dipping to 484.49, check whether it can quickly reclaim—not simply catching every dip. When the mid-range doesn’t offer sufficient reward-to-risk, waiting itself is also part of the strategy.

Position management should distinguish between swing (mid-term) and short-term trades. For existing swing positions, first assess whether the structure is broken; don’t be repeatedly influenced by a single 1-hour candlestick. For short-term positions, execute around support, resistance, and closing confirmation. Those currently in cash don’t need to chase the price in the middle of the range—waiting for a clearer location often has an advantage.

For short-term positions, the focus isn’t to predict every candlestick. It’s to ensure there are reasons for entry, partial reduction, and exit. Do less without confirmation; if a key level fails, redo the plan. Control single-trade risk first, then discuss upside potential.

#xrp

I care more about how price reacts than guessing the answer in advance. Which signal do you most want to see here? Want to learn about a quantitative hedging arbitrage robot? Join the chat room
Three signals. $MSFT daily RSI 94.9 is extremely overbought. $CYS daily RSI 94.8 is extremely overbought. $SQQQ 4 hourly RSI 8.8 is extremely oversold. $MSFT daily RSI 94.9: extremely overbought. Current price 496.03, up 3.70% in 24h. Support 483 476. Resistance 499.6 500. Funding rate 0. Long/short are balanced. This move was pulled up from 478 to near 500; volume isn’t small, and nobody is making an extreme directional bet. Current price 496.03. Slightly bearish. Lightly short in the 496 to 500 range, stop-loss at 505, targets 483 and 476. Risk/reward is about 1.7. I’ve seen daily RSI reach 94.9 in this position too many times. A fast rally doesn’t mean it will keep going forever. $CYS daily RSI 94.8: extremely overbought. Current price 0.6297, up 63% in 24h. Support 0.50 0.48. Resistance 0.68 0.70. Funding rate -0.1%. Shorts are paying. Someone is shorting against the trend betting on a pullback, but the price is still surging—shorts are getting beaten up. Current price 0.6297. Slightly bearish. Lightly short in the 0.63 to 0.65 range, stop-loss at 0.69, targets 0.50 and 0.48. Risk/reward is about 2.6. This kind of move either keeps going crazy or one foot stomps it down—I choose to stomp it down; keep the stop-loss. $SQQQ 4 hourly RSI 8.8: extremely oversold. Current price 37.17, down 8% in 24h. Support 36.88 36.96. Resistance 38.16 40.00. Funding rate +0.03%. Longs are paying. Someone is buying the dip; the positioning isn’t extremely aggressive. Current price 37.17. Slightly bullish. Lightly long in the 37.00 to 37.20 range, stop-loss at 36.50, targets 38.20 and 40.00. Risk/reward is about 2.5. RSI is in the single digits—shorting here doesn’t make much sense. Wait for the rebound. Extreme RSI doesn’t necessarily mean an immediate reversal, but the odds are in my favor. I’m watching. #MSFT #CYS #SQQQ
Three signals. $MSFT daily RSI 94.9 is extremely overbought. $CYS daily RSI 94.8 is extremely overbought. $SQQQ 4 hourly RSI 8.8 is extremely oversold.

$MSFT daily RSI 94.9: extremely overbought. Current price 496.03, up 3.70% in 24h.
Support 483 476. Resistance 499.6 500.
Funding rate 0. Long/short are balanced. This move was pulled up from 478 to near 500; volume isn’t small, and nobody is making an extreme directional bet.
Current price 496.03. Slightly bearish. Lightly short in the 496 to 500 range, stop-loss at 505, targets 483 and 476. Risk/reward is about 1.7. I’ve seen daily RSI reach 94.9 in this position too many times. A fast rally doesn’t mean it will keep going forever.

$CYS daily RSI 94.8: extremely overbought. Current price 0.6297, up 63% in 24h.
Support 0.50 0.48. Resistance 0.68 0.70.
Funding rate -0.1%. Shorts are paying. Someone is shorting against the trend betting on a pullback, but the price is still surging—shorts are getting beaten up.
Current price 0.6297. Slightly bearish. Lightly short in the 0.63 to 0.65 range, stop-loss at 0.69, targets 0.50 and 0.48. Risk/reward is about 2.6. This kind of move either keeps going crazy or one foot stomps it down—I choose to stomp it down; keep the stop-loss.

$SQQQ 4 hourly RSI 8.8: extremely oversold. Current price 37.17, down 8% in 24h.
Support 36.88 36.96. Resistance 38.16 40.00.
Funding rate +0.03%. Longs are paying. Someone is buying the dip; the positioning isn’t extremely aggressive.
Current price 37.17. Slightly bullish. Lightly long in the 37.00 to 37.20 range, stop-loss at 36.50, targets 38.20 and 40.00. Risk/reward is about 2.5. RSI is in the single digits—shorting here doesn’t make much sense. Wait for the rebound.

Extreme RSI doesn’t necessarily mean an immediate reversal, but the odds are in my favor. I’m watching.

#MSFT #CYS #SQQQ
·
--
Bullish
🚨 Fresh buying pressure is forcing more short sellers to exit! 💥 ⚡ Momentum remains positive as liquidity keeps getting swept! $MSFT {future}(MSFTUSDT) 🟢 LIQUIDITY ZONE HIT 🟢 Short liquidation spotted 🧨 $3.3179K cleared at $491.53727 Upside liquidity swept — react NOW or watch the market shift 👀 🎯 TP Targets: TP1: ~$495 TP2: ~$499 TP3: ~$504 #MSFT
🚨 Fresh buying pressure is forcing more short sellers to exit! 💥
⚡ Momentum remains positive as liquidity keeps getting swept!

$MSFT
🟢 LIQUIDITY ZONE HIT 🟢

Short liquidation spotted 🧨

$3.3179K cleared at $491.53727

Upside liquidity swept — react NOW or watch the market shift 👀

🎯 TP Targets:
TP1: ~$495
TP2: ~$499
TP3: ~$504

#MSFT
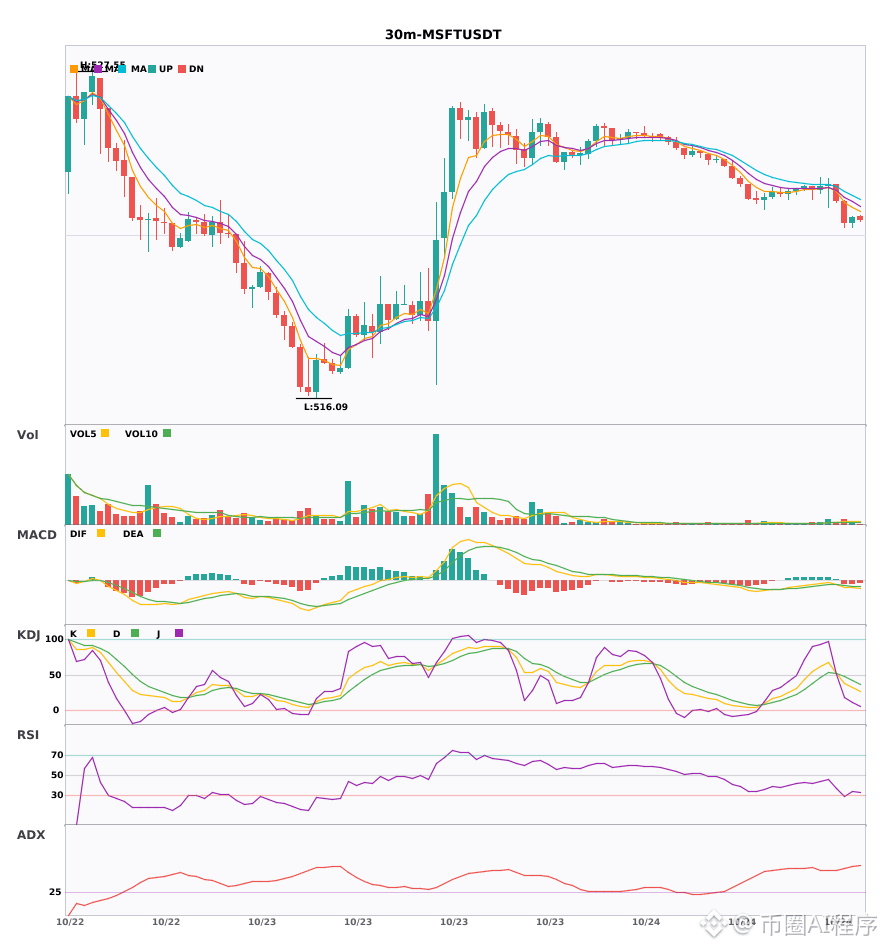
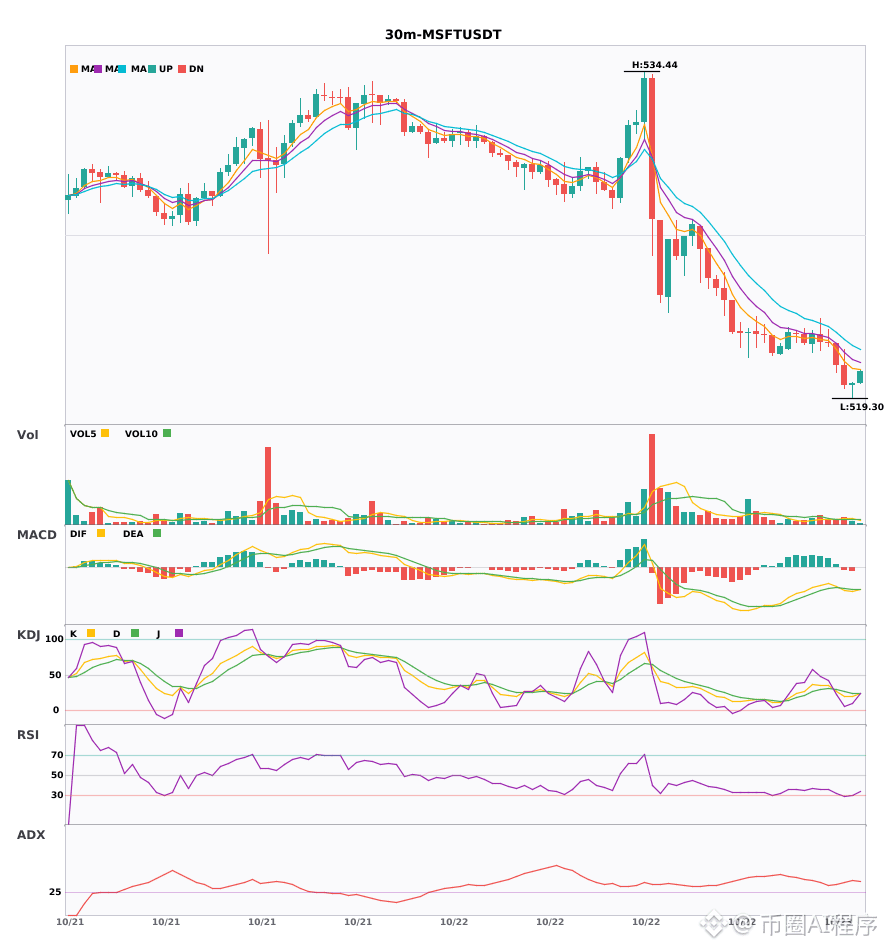
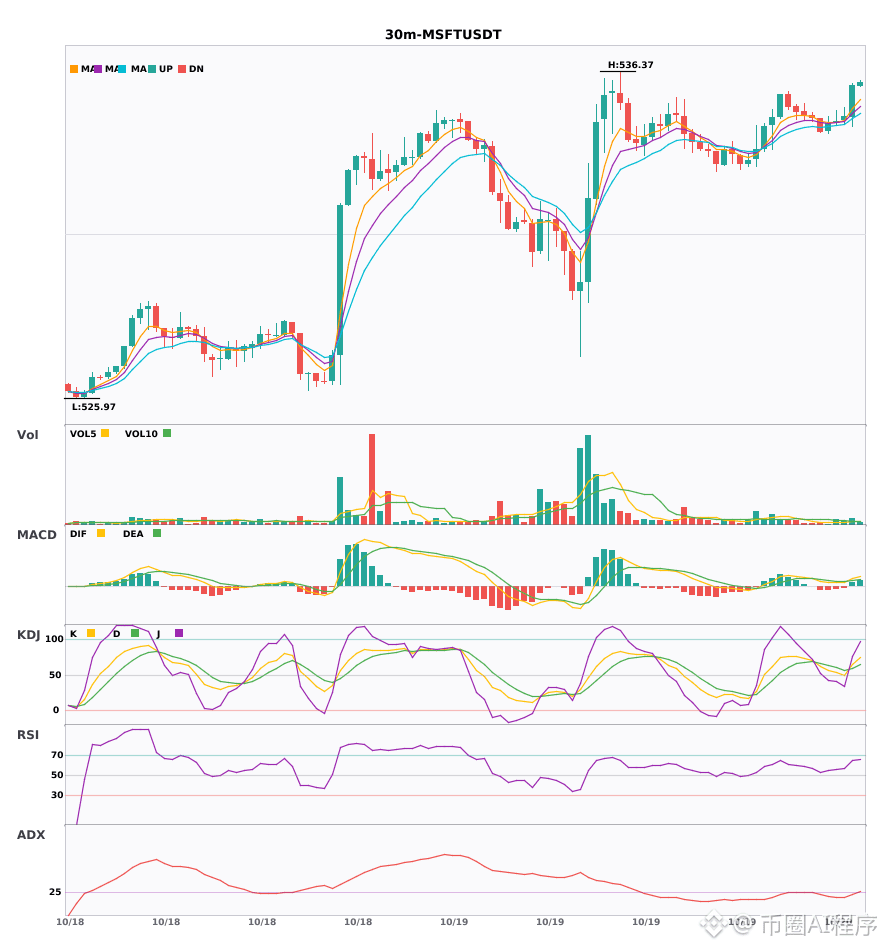
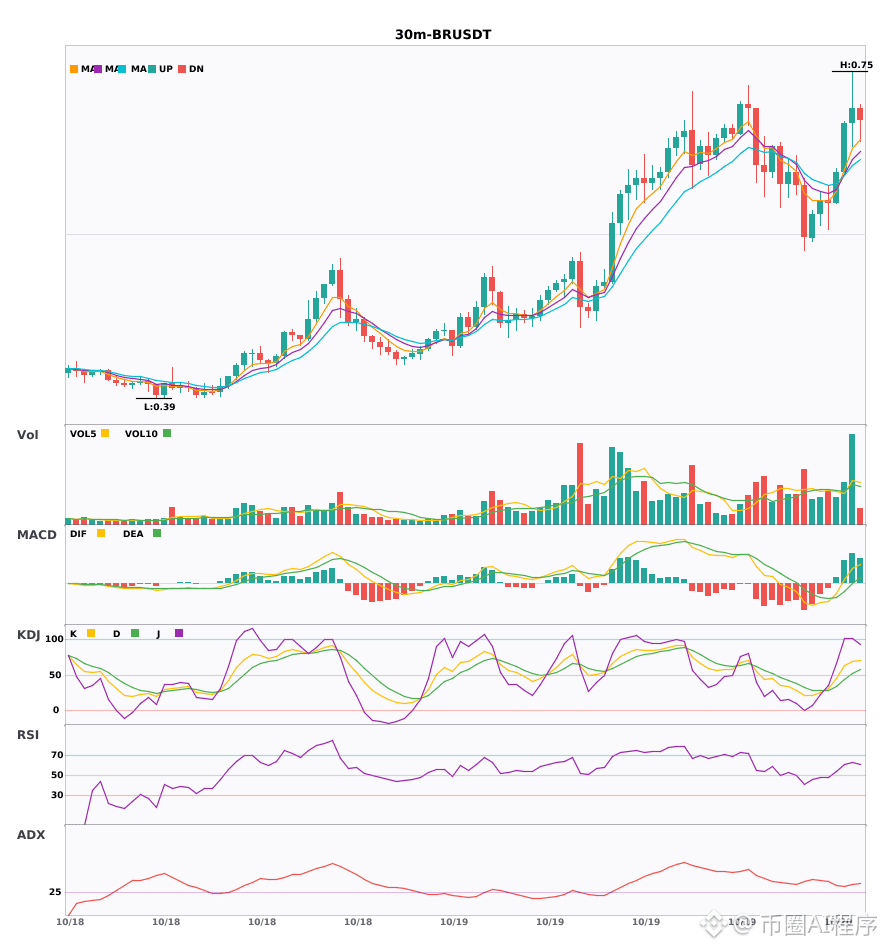
$ADA $MSFT 30 minutes golden cross resonance, bullish signals all lit up 🔥 ════════════════════ 🔴 $ADA 30 minutes bullish signal ⚠️ Technicals: ADX31 shows the trend market is very clear; MACD is above the zero line, and after the golden cross the red bars amplify; the moving averages 5, 8, 13 are bullishly aligned with divergence spreading upward; trading volume also increased by 1.7 times. ════════════════════ 🔴 $MSFT 30 minutes bullish signal ⚠️ Technicals: ADX28 indicates the trend is picking up, so you can follow it. MACD is still in a bullish trend; the red bars are getting longer, with stronger momentum. The 5-day, 8-day, and 13-day moving averages are diverging upward; KDJ’s K line at 57.5 just crossed above the D line at 51.3— not yet overbought— and volume has surged by 2.6 times. ════════════════════ 🔔 Follow to get real-time first-hand market fluctuations 🔔 #技术分析 #ADA #MSFT 📌 When trading, pay attention to whether the candlestick pattern fits
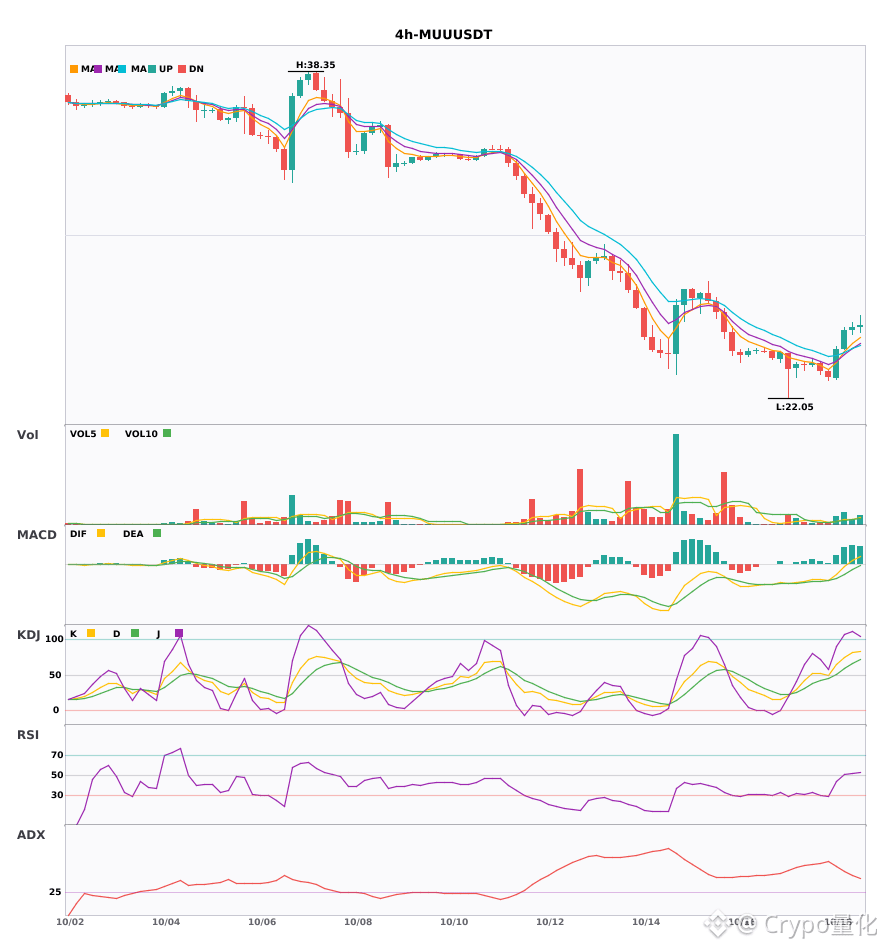

$ADA $MSFT 30 minutes golden cross resonance, bullish signals all lit up 🔥

════════════════════
🔴 $ADA 30 minutes bullish signal
⚠️ Technicals: ADX31 shows the trend market is very clear; MACD is above the zero line, and after the golden cross the red bars amplify; the moving averages 5, 8, 13 are bullishly aligned with divergence spreading upward; trading volume also increased by 1.7 times.
════════════════════

🔴 $MSFT 30 minutes bullish signal
⚠️ Technicals: ADX28 indicates the trend is picking up, so you can follow it. MACD is still in a bullish trend; the red bars are getting longer, with stronger momentum. The 5-day, 8-day, and 13-day moving averages are diverging upward; KDJ’s K line at 57.5 just crossed above the D line at 51.3— not yet overbought— and volume has surged by 2.6 times.
════════════════════

🔔 Follow to get real-time first-hand market fluctuations 🔔
#技术分析 #ADA #MSFT
📌 When trading, pay attention to whether the candlestick pattern fits
$ADA resonates with $MSFT 30-minute-level technical signals. Who has stronger bullish momentum? 📈 $ADA | 30-minute bullish signal ━━━━━━━━━━━━━━━━━━ Technical analysis: ADX hits 31, showing a significantly strengthened trend; MACD DIF crosses above the zero axis, confirming bullish momentum; EMA is in a bullish alignment of 5>8>13; volume has expanded 1.7 times quarter-over-quarter. Overall, bullish. Price change: 0.9900% 📈 $MSFT | 30-minute bullish signal ━━━━━━━━━━━━━━━━━━ Technical analysis: ADX (28) indicates the trend is established, and you may enter. Bullish momentum continues on MACD. EMA 5/8/13 shows a bullish arrangement. KDJ is strong (K57.5/D51.3). Volume expands to 2.6 times; overall remains tilted bullish. Price change: 0.0400% ━━━━━━━━━━━━━━━━━━ #技术分析 #ADA #MSFT 📌 The above content is for reference only and does not constitute investment advice
$ADA resonates with $MSFT 30-minute-level technical signals. Who has stronger bullish momentum?

📈 $ADA | 30-minute bullish signal
━━━━━━━━━━━━━━━━━━
Technical analysis: ADX hits 31, showing a significantly strengthened trend; MACD DIF crosses above the zero axis, confirming bullish momentum; EMA is in a bullish alignment of 5>8>13; volume has expanded 1.7 times quarter-over-quarter. Overall, bullish.
Price change: 0.9900%

📈 $MSFT | 30-minute bullish signal
━━━━━━━━━━━━━━━━━━
Technical analysis: ADX (28) indicates the trend is established, and you may enter. Bullish momentum continues on MACD. EMA 5/8/13 shows a bullish arrangement. KDJ is strong (K57.5/D51.3). Volume expands to 2.6 times; overall remains tilted bullish.
Price change: 0.0400%

━━━━━━━━━━━━━━━━━━
#技术分析 #ADA #MSFT
📌 The above content is for reference only and does not constitute investment advice
$MSFTB #MSFT Pre-market conclusions first: hold 487.88 to have conditions to continue testing 499.6. Current price: 492.31, +0.02% in the last 1 hour, +1.66% in the last 24 hours. Currently +0.02% over the last 1 hour and +1.66% over the last 24 hours—these two cycles have not formed sufficiently clear alignment in the same direction. In a range-bound market, the tolerance for chasing and selling is low. It’s more suitable to confirm direction using the upper boundary and confirm pullback/support using the lower boundary, while the midline is only used as a strength/weakness divider. I will treat 487.88 as the short-term pivot between long and short: as long as it holds, it means the retracement is still within a controllable range; then there will be conditions to retest 499.6. After a valid breakdown below it, don’t rush to enter—wait for a new stable structure to appear around 476.16. In execution, set clear conditions: after breaking above 499.6, you need confirmation—not just seeing a momentary surge and chasing. After dipping to 476.16, you need to see whether it can quickly reclaim—don’t buy just because you see the drop. When the middle zone doesn’t offer sufficient reward-to-risk, waiting itself is part of the strategy. Position management should distinguish between swing/medium-term and short-term. For existing medium-term positions, first check whether the structure is broken; don’t let repeated signals from a single 1-hour candlestick repeatedly sway you. For short-term positions, execute around support, resistance, and closing confirmations. If you’re currently in cash, you don’t need to chase prices in the middle of the range—waiting for a clearer location usually offers an advantage. Simplifying the conclusion doesn’t mean simplifying risk control. In real execution, you still need to wait for price confirmation and leave room to exit if your assessment is invalidated. The market will ultimately validate your thesis with price. Do you think the most critical right now is a breakout at 499.6, or the defense at 476.16? Let’s track the outcomes together. Right now, the most important thing isn’t guessing the target—it’s whether this level can be held. How do you think it will move? Want to learn about quant-hedging and arbitrage trading robots—come join the chat
$MSFTB #MSFT Pre-market conclusions first: hold 487.88 to have conditions to continue testing 499.6. Current price: 492.31, +0.02% in the last 1 hour, +1.66% in the last 24 hours.

Currently +0.02% over the last 1 hour and +1.66% over the last 24 hours—these two cycles have not formed sufficiently clear alignment in the same direction. In a range-bound market, the tolerance for chasing and selling is low. It’s more suitable to confirm direction using the upper boundary and confirm pullback/support using the lower boundary, while the midline is only used as a strength/weakness divider.

I will treat 487.88 as the short-term pivot between long and short: as long as it holds, it means the retracement is still within a controllable range; then there will be conditions to retest 499.6. After a valid breakdown below it, don’t rush to enter—wait for a new stable structure to appear around 476.16.

In execution, set clear conditions: after breaking above 499.6, you need confirmation—not just seeing a momentary surge and chasing. After dipping to 476.16, you need to see whether it can quickly reclaim—don’t buy just because you see the drop. When the middle zone doesn’t offer sufficient reward-to-risk, waiting itself is part of the strategy.

Position management should distinguish between swing/medium-term and short-term. For existing medium-term positions, first check whether the structure is broken; don’t let repeated signals from a single 1-hour candlestick repeatedly sway you. For short-term positions, execute around support, resistance, and closing confirmations. If you’re currently in cash, you don’t need to chase prices in the middle of the range—waiting for a clearer location usually offers an advantage.

Simplifying the conclusion doesn’t mean simplifying risk control. In real execution, you still need to wait for price confirmation and leave room to exit if your assessment is invalidated. The market will ultimately validate your thesis with price. Do you think the most critical right now is a breakout at 499.6, or the defense at 476.16? Let’s track the outcomes together.

Right now, the most important thing isn’t guessing the target—it’s whether this level can be held. How do you think it will move? Want to learn about quant-hedging and arbitrage trading robots—come join the chat
$MSFTB #MSFT From a layout perspective, the focus is not on chasing fluctuations that have already occurred, but on determining in advance where you are willing to wait. Current price 491.33, +0.02% in 1 hour, +1.01% in 24 hours. Currently, +0.02% in the past 1 hour and +1.01% in the past 24 hours—these two cycles have not formed sufficiently clear directional coordination. In a range-bound market, the tolerance for chasing or selling into volatility is lower. It’s more suitable to use the upper edge to confirm direction and the lower edge to confirm pullback support, with the midline only serving as a boundary between strength and weakness. The first observation zone is 487.88, used to judge whether a normal pullback has ended. The second observation zone is 476.16, used to judge whether a deeper retracement can form support. On the upside, watch 499.6; after a breakout, pullback confirmation is required to avoid mistaking a brief piercing move for a trend that has already opened. Existing positions can be handled in segments based on key levels to avoid making all decisions at once. Those without positions should wait for breakout confirmation or for pullback stabilization. For U.S. market instruments, also be mindful of volatility caused by trading session transitions. Your plan should be based on price conditions—not replace execution with emotion. The meaning of scaling in isn’t to constantly average down; it’s to control the pace while the structure remains valid. Once key support fails, you should stop the original layout plan and wait for a new price range to form. Risk control is still placed before the conclusion: execute only when the conditions appear, and re-evaluate promptly when price invalidates the setup. The greater the volatility, the more restrained you should be with each single position. The above is a forward-looking interpretation based on current 1-hour and 24-hour data; it does not constitute a promise of returns. If there’s a breakout on increased volume here, will you choose to follow, or wait for the pullback? Comment your thoughts in the section below. Want to learn about quant hedging arbitrage robots? Join the chat room.
$MSFTB #MSFT From a layout perspective, the focus is not on chasing fluctuations that have already occurred, but on determining in advance where you are willing to wait. Current price 491.33, +0.02% in 1 hour, +1.01% in 24 hours.

Currently, +0.02% in the past 1 hour and +1.01% in the past 24 hours—these two cycles have not formed sufficiently clear directional coordination. In a range-bound market, the tolerance for chasing or selling into volatility is lower. It’s more suitable to use the upper edge to confirm direction and the lower edge to confirm pullback support, with the midline only serving as a boundary between strength and weakness.

The first observation zone is 487.88, used to judge whether a normal pullback has ended. The second observation zone is 476.16, used to judge whether a deeper retracement can form support. On the upside, watch 499.6; after a breakout, pullback confirmation is required to avoid mistaking a brief piercing move for a trend that has already opened.

Existing positions can be handled in segments based on key levels to avoid making all decisions at once. Those without positions should wait for breakout confirmation or for pullback stabilization. For U.S. market instruments, also be mindful of volatility caused by trading session transitions. Your plan should be based on price conditions—not replace execution with emotion.

The meaning of scaling in isn’t to constantly average down; it’s to control the pace while the structure remains valid. Once key support fails, you should stop the original layout plan and wait for a new price range to form.

Risk control is still placed before the conclusion: execute only when the conditions appear, and re-evaluate promptly when price invalidates the setup. The greater the volatility, the more restrained you should be with each single position. The above is a forward-looking interpretation based on current 1-hour and 24-hour data; it does not constitute a promise of returns.

If there’s a breakout on increased volume here, will you choose to follow, or wait for the pullback? Comment your thoughts in the section below. Want to learn about quant hedging arbitrage robots? Join the chat room.
Multi-period resonance confirmation: 2 coins—both the 4-hour and the daily timeframe are in bullish alignment 🔥 ════════════════════ 🔴 $MSFT 4 hours Bullish signal ⚠️ Technicals: The daily timeframe confirms a bullish trend! 4-hour MACD is above the zero line with a golden cross; the red histogram is expanding. The 5, 8, and 13 moving averages are in bullish order. KDJ has a golden cross but isn’t overbought, and volume has also caught up—2.5x surge. With multi-period resonance, expect a bullish move! ════════════════════ 🔴 $PIEVERSE 4 hours Bullish signal ⚠️ Technicals: Both the daily and 4-hour are bullish—resonance confirmed! The 4-hour MACD just formed a golden cross above the zero line; the red histogram has expanded. The moving averages are in bullish order with 5>8>13. KDJ has a golden cross, with K at 56 and not overbought. Volume is up 1.5x to back it up—go with the trend to look for upside! ════════════════════ 🔔 Watch out for and get the first-hand market movement 🔔 #多周期共振 #MSFT #PIEVERSE 📌 When trading, make sure the candlestick patterns match
Multi-period resonance confirmation: 2 coins—both the 4-hour and the daily timeframe are in bullish alignment 🔥

════════════════════
🔴 $MSFT 4 hours Bullish signal
⚠️ Technicals: The daily timeframe confirms a bullish trend! 4-hour MACD is above the zero line with a golden cross; the red histogram is expanding. The 5, 8, and 13 moving averages are in bullish order. KDJ has a golden cross but isn’t overbought, and volume has also caught up—2.5x surge. With multi-period resonance, expect a bullish move!
════════════════════

🔴 $PIEVERSE 4 hours Bullish signal
⚠️ Technicals: Both the daily and 4-hour are bullish—resonance confirmed! The 4-hour MACD just formed a golden cross above the zero line; the red histogram has expanded. The moving averages are in bullish order with 5>8>13. KDJ has a golden cross, with K at 56 and not overbought. Volume is up 1.5x to back it up—go with the trend to look for upside!
════════════════════

🔔 Watch out for and get the first-hand market movement 🔔
#多周期共振 #MSFT #PIEVERSE
📌 When trading, make sure the candlestick patterns match
$IBM $MSFT 4H level bullish structure confirmed, short-term technical indicators resonance 📈 $IBM | 4-hour bullish signal ━━━━━━━━━━━━━━━━━━ Technical analysis: ADX(40) clearly shows the trend; MACD forms a bullish cross above zero, indicating bullish momentum release; EMA5 crosses above EMA8, bias is bullish in the short term; KDJ forms a bullish cross, with K58.5/D54.9; volume expands 2.6 times. Price change: 2.8200% 📈 $MSFT | 4-hour bullish signal ━━━━━━━━━━━━━━━━━━ Technical analysis: ADX reaches 66, with extremely high trend strength—be mindful of overheating and pullback risk; MACD forms a bullish cross above the zero axis, and bullish momentum continues to release; EMA5>EMA8>EMA13 forms a standard bullish arrangement; KDJ forms a bullish cross (K=76.9, D=75.3), bullish in the short term; trading volume is 2.5 times higher than the previous period. Price change: 3.9600% ━━━━━━━━━━━━━━━━━━ #技术分析 #IBM #MSFT 📌 The above content is for reference only and does not constitute investment advice
$IBM $MSFT 4H level bullish structure confirmed, short-term technical indicators resonance

📈 $IBM | 4-hour bullish signal
━━━━━━━━━━━━━━━━━━
Technical analysis: ADX(40) clearly shows the trend; MACD forms a bullish cross above zero, indicating bullish momentum release; EMA5 crosses above EMA8, bias is bullish in the short term; KDJ forms a bullish cross, with K58.5/D54.9; volume expands 2.6 times.
Price change: 2.8200%

📈 $MSFT | 4-hour bullish signal
━━━━━━━━━━━━━━━━━━
Technical analysis: ADX reaches 66, with extremely high trend strength—be mindful of overheating and pullback risk; MACD forms a bullish cross above the zero axis, and bullish momentum continues to release; EMA5>EMA8>EMA13 forms a standard bullish arrangement; KDJ forms a bullish cross (K=76.9, D=75.3), bullish in the short term; trading volume is 2.5 times higher than the previous period.
Price change: 3.9600%

━━━━━━━━━━━━━━━━━━
#技术分析 #IBM #MSFT
📌 The above content is for reference only and does not constitute investment advice
$MSFT 4 hour daily line dual moving averages long setup, ride the trend—don’t hesitate🔥 ════════════════════ 🔴 $MSFT 4 hour Long signal ⚠️ Technicals: The daily and 4-hour charts are both bullish—the direction is consistent! The 4-hour MACD has just formed a golden cross; the histogram bars are getting longer. The moving averages are arranged in a bullish formation and diverging. The KDJ golden cross hasn’t reached overbought yet, and volume has increased by 2.5x. Multi-timeframe resonance points bullish. ════════════════════ 🔔 Follow to get the first-hand market spikes 🔔 #多周期共振 #MSFT 📌 When trading, pay attention to whether the candlestick pattern matches
$MSFT 4 hour daily line dual moving averages long setup, ride the trend—don’t hesitate🔥

════════════════════
🔴 $MSFT 4 hour Long signal
⚠️ Technicals: The daily and 4-hour charts are both bullish—the direction is consistent! The 4-hour MACD has just formed a golden cross; the histogram bars are getting longer. The moving averages are arranged in a bullish formation and diverging. The KDJ golden cross hasn’t reached overbought yet, and volume has increased by 2.5x. Multi-timeframe resonance points bullish.
════════════════════

🔔 Follow to get the first-hand market spikes 🔔
#多周期共振 #MSFT
📌 When trading, pay attention to whether the candlestick pattern matches
Log in to explore more content
Join global crypto users on Binance Square
⚡️ Get latest and useful information about crypto.
💬 Trusted by the world’s largest crypto exchange.
👍 Discover real insights from verified creators.
Email / Phone number