Binance Square
#luis77

luis77

22,978 views
162 Discussing
Luis 77
·
--
Bullish
Aida Amal
·
--
HOW TO IDENTIFY LIQUIDITY IN TRADING?

Liquidity is usually found around areas where many traders place their orders and stop losses.

Above equal highs (EQH), when the price leaves several highs at practically the same level, there may be liquidity above.

Below equal lows (EQL), when the price respects the same low multiple times, liquidity can accumulate below.

But finding liquidity doesn’t mean you should enter immediately.

One way to use it is to wait:

Liquidity → sweep → confirmation → entry

For example, price may break a high to take liquidity and then quickly return below it. That’s where we wait for confirmation before looking for a trade.

Remember: liquidity is a tool for interpreting price, not an automatic entry signal. Always use a stop loss and appropriate risk management.
$BTC #TradingCommunity #BinanceAcademy
Aida Amal:
Exelente amigo éxitos
·
--
Bullish
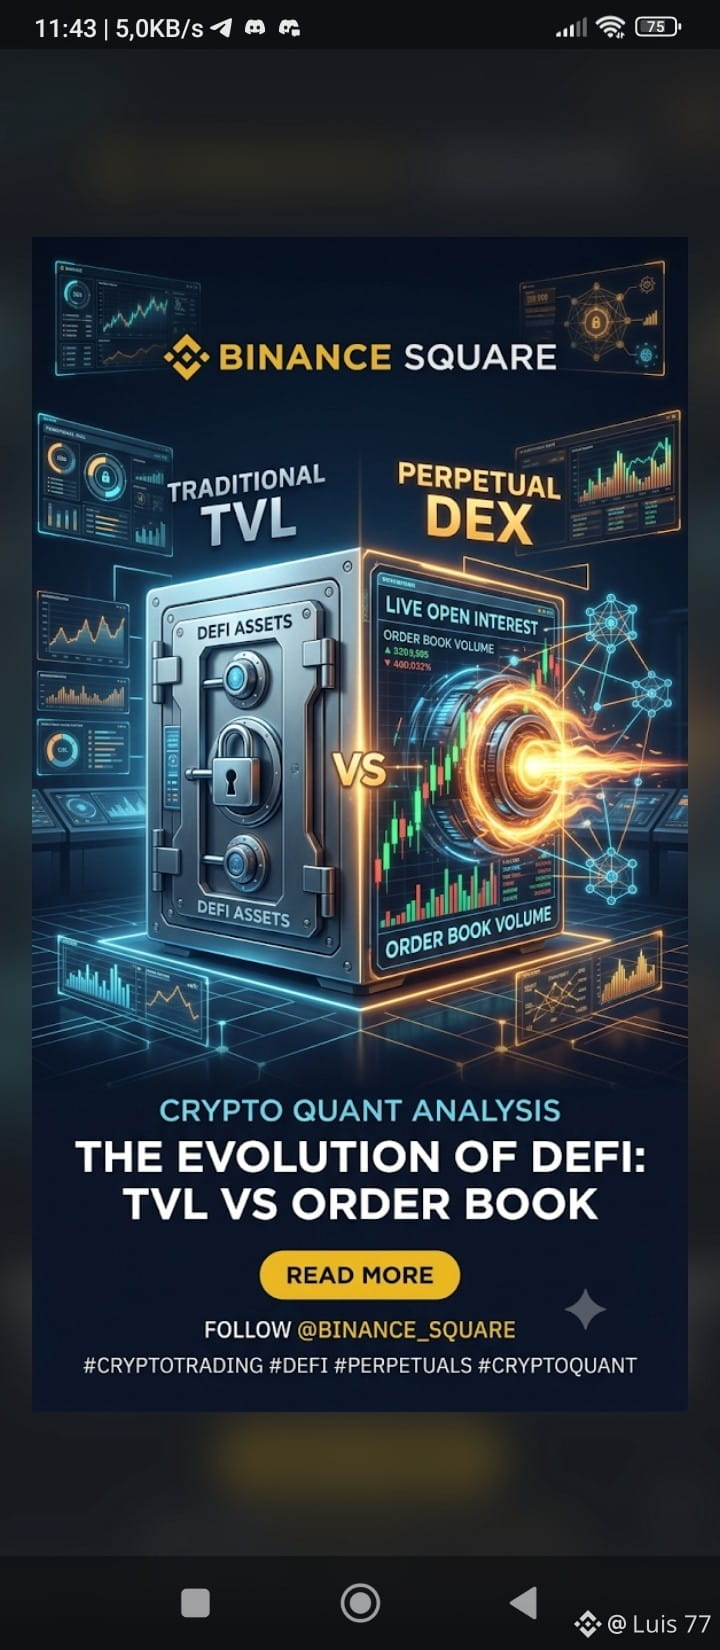
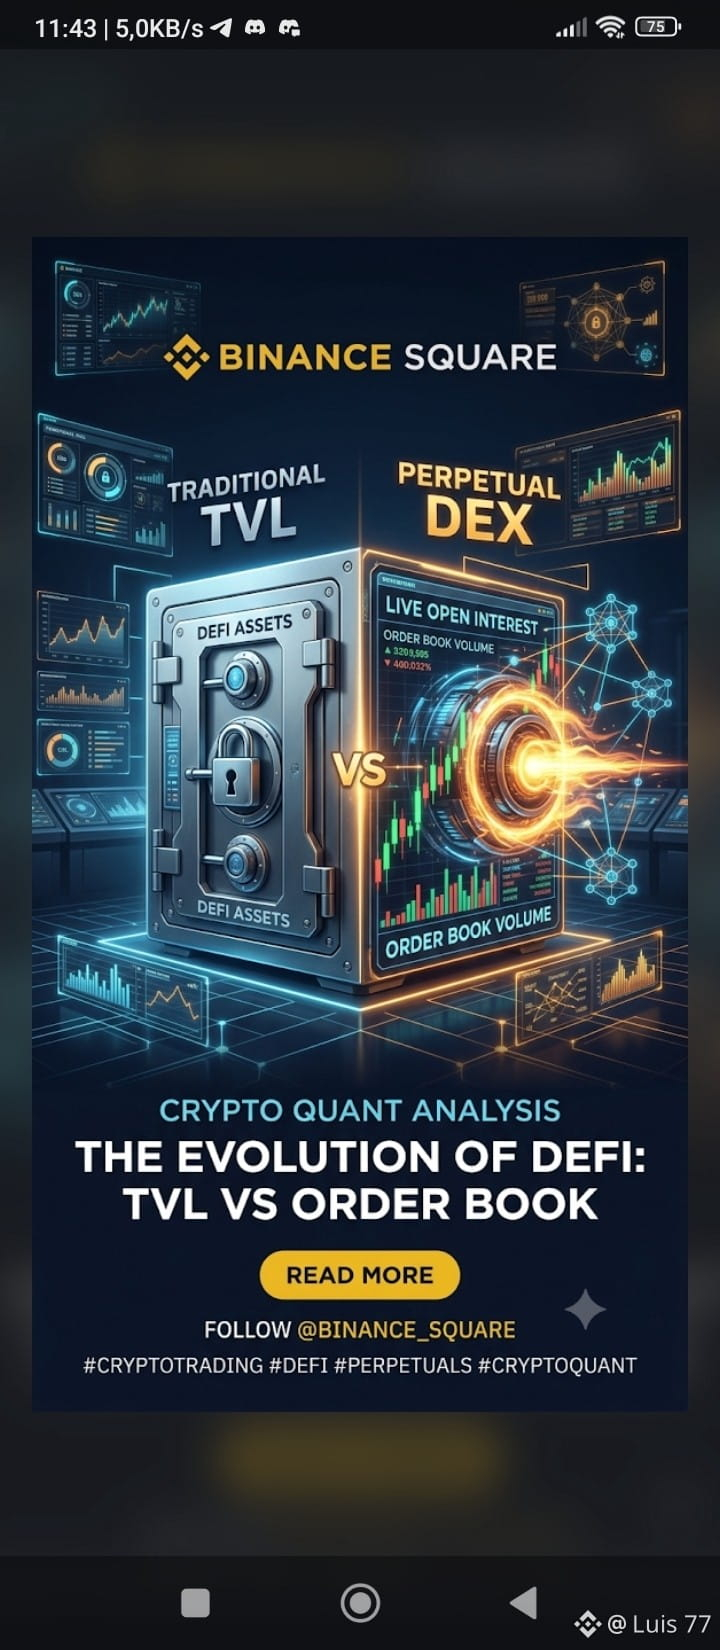
⚡ PERPETUAL DEX VS. TRADITIONAL DEFI: THE INFRASTRUCTURE THAT ABSORBS ON-CHAIN VOLUME DeFi is not a monolithic narrative; it’s a diverse financial architecture. While traditional DeFi (lending, yield, spot) depends on TVL and pool utilization rate. Perpetual DEXs shift quantitative analysis toward market efficiency: Organic Volume, Open Interest (OI), Funding Rates, and Execution Latency. 📊 THE EVOLUTION OF ON-CHAIN MARKET MICROSTRUCTURE Smart Money no longer seeks only passive yield; it looks for order-book depth and CEX-like execution without giving up custody of the private keys. Protocols like Hyperliquid, GMX, dYdX, Aster, Lighter, and edgeX tackle this with hybrid models, AMMs, and high-frequency CLOBs (Central Limit Order Books). However, for the AIPROSCAN-LCX77 evaluation matrix, an increase in trading volume doesn’t automatically mean a solid token. It’s mandatory to filter out the liquidity illusion using “cold” metrics: * Organic Volume vs. Incentives: Separate the real flow of liquidity from phantom liquidity driven by wash trading or airdrop farming. * Value Capture (Tokenomics): Assess whether net fees flow to the staker or if selling pressure from unlocks and emissions dilutes the price. * Liquidation oracles Risk: Map the protocol’s resilience against brutal volatility expansions and the accuracy of Mark Price. 🛡️ QUANT VERDICT Perps are the DeFi vertical with the highest beta and sensitivity to the speculative cycle. During volatility compression phases (low BBW), their metrics cool off; in squeeze phases, they absorb global liquidity. The true quantitative alpha isn’t chasing the ticker—it’s auditing real usage and the protocol’s net performance. 💬 Do you trade derivatives on Perp DEXs, or do you still prefer CEX execution? 👇 #BinanceSquare #DeFi #PerpetualDEX #LUIS77 #Bitcoin $BTC {future}(HYPEUSDT) {future}(ASTERUSDT) {future}(AAVEUSDT)
⚡ PERPETUAL DEX VS. TRADITIONAL DEFI:
THE INFRASTRUCTURE THAT ABSORBS ON-CHAIN VOLUME

DeFi is not a monolithic narrative; it’s a diverse financial architecture. While traditional DeFi (lending, yield, spot) depends on TVL and pool utilization rate.

Perpetual DEXs shift quantitative analysis toward market efficiency: Organic Volume, Open Interest (OI), Funding Rates, and Execution Latency.

📊 THE EVOLUTION OF ON-CHAIN MARKET MICROSTRUCTURE
Smart Money no longer seeks only passive yield; it looks for order-book depth and CEX-like execution without giving up custody of the private keys. Protocols like Hyperliquid, GMX, dYdX, Aster, Lighter, and edgeX tackle this with hybrid models, AMMs, and high-frequency CLOBs (Central Limit Order Books).

However, for the AIPROSCAN-LCX77 evaluation matrix, an increase in trading volume doesn’t automatically mean a solid token. It’s mandatory to filter out the liquidity illusion using “cold” metrics:

* Organic Volume vs. Incentives: Separate the real flow of liquidity from phantom liquidity driven by wash trading or airdrop farming.
* Value Capture (Tokenomics): Assess whether net fees flow to the staker or if selling pressure from unlocks and emissions dilutes the price.
* Liquidation oracles Risk: Map the protocol’s resilience against brutal volatility expansions and the accuracy of Mark Price.

🛡️ QUANT VERDICT
Perps are the DeFi vertical with the highest beta and sensitivity to the speculative cycle. During volatility compression phases (low BBW), their metrics cool off; in squeeze phases, they absorb global liquidity. The true quantitative alpha isn’t chasing the ticker—it’s auditing real usage and the protocol’s net performance.

💬 Do you trade derivatives on Perp DEXs, or do you still prefer CEX execution? 👇
#BinanceSquare #DeFi #PerpetualDEX #LUIS77 #Bitcoin $BTC
Bitcoin Up or Down on September 29?

Bitcoin Up or Down on September 29?

1%Up99%Down
Volume $135,342.23
·
--
Bullish
mdrinc
·
--
Bullish
🚨 $BTC is close to USD 84K.

But today something uncomfortable shows up:

🇺🇸 The US 10-year bond is around 5.27%.

Highest in 19 years.

If the money can earn ~5% with less risk…

…why would it keep looking for $BTC?

I want to read the people who are buying this pullback.
·
--
Bullish
Issa339
·
--
#NOSANA
🔥 DeAI Compute Marketplace: How Distributed GPUs are Solving the AI Compute Crisis
With the explosive growth of Artificial Intelligence (AI), the demand for massive compute power has skyrocketed. In contrast, developers and startups face exorbitant costs and strict monopolies from traditional cloud giants.
This is where Nosana comes in—one of the most promising projects on Solana, connecting distributed GPU power into an open Decentralized AI (DeAI) marketplace.
💡 How Nosana's Execution Pipeline Works
The mechanism builds a direct bridge between AI developers and compute suppliers (Node Operators):
* Job Submission: The developer submits an AI workload specification, including container requirements (Docker) and necessary GPU compute parameters.
* Smart Routing: The decentralized market matches the job requirements with an available node on the network.
* Execution & Verification: The host node pulls the data to execute the compute workload directly on bare metal hardware.
* On-Chain Reward: Upon verification, rewards are distributed directly on-chain via $NOS.
🛠️ From Single-Node Operations to Multi-GPU Scaling
Operating a node is more than a theoretical concept; it requires active infrastructure management to ensure high uptime and maximum performance:
* Infrastructure Tuning: Offloading heavy Docker directories and data logs to dedicated NVMe storage prevents OS drive saturation during massive AI model pulls.
* The Next Step (Multi-GPU): Scaling from a single GPU to a multi-GPU setup in parallel with next-gen GPU upgrades expands VRAM capacity and readiness for Large Language Models (LLMs).
🌐 Why DeAI is the Future of Infrastructure
Decentralized AI compute reshapes the infrastructure paradigm entirely. It transforms idle hardware globally into high-performance compute nodes, offering cost-effective solutions for developers and real operational yields for operators.
💬 Community Question:
Do you think Decentralized AI (DeAI) will be the dominant narrative driving the next crypto cycle? Share your thoughts in the comments below! 👇
#BinanceSquare #DeAI #Nosana #Solana #CryptoAI #GPUMining #Web3Tech
·
--
Bullish
HomeroSPredijoFuturosAislados
·
--
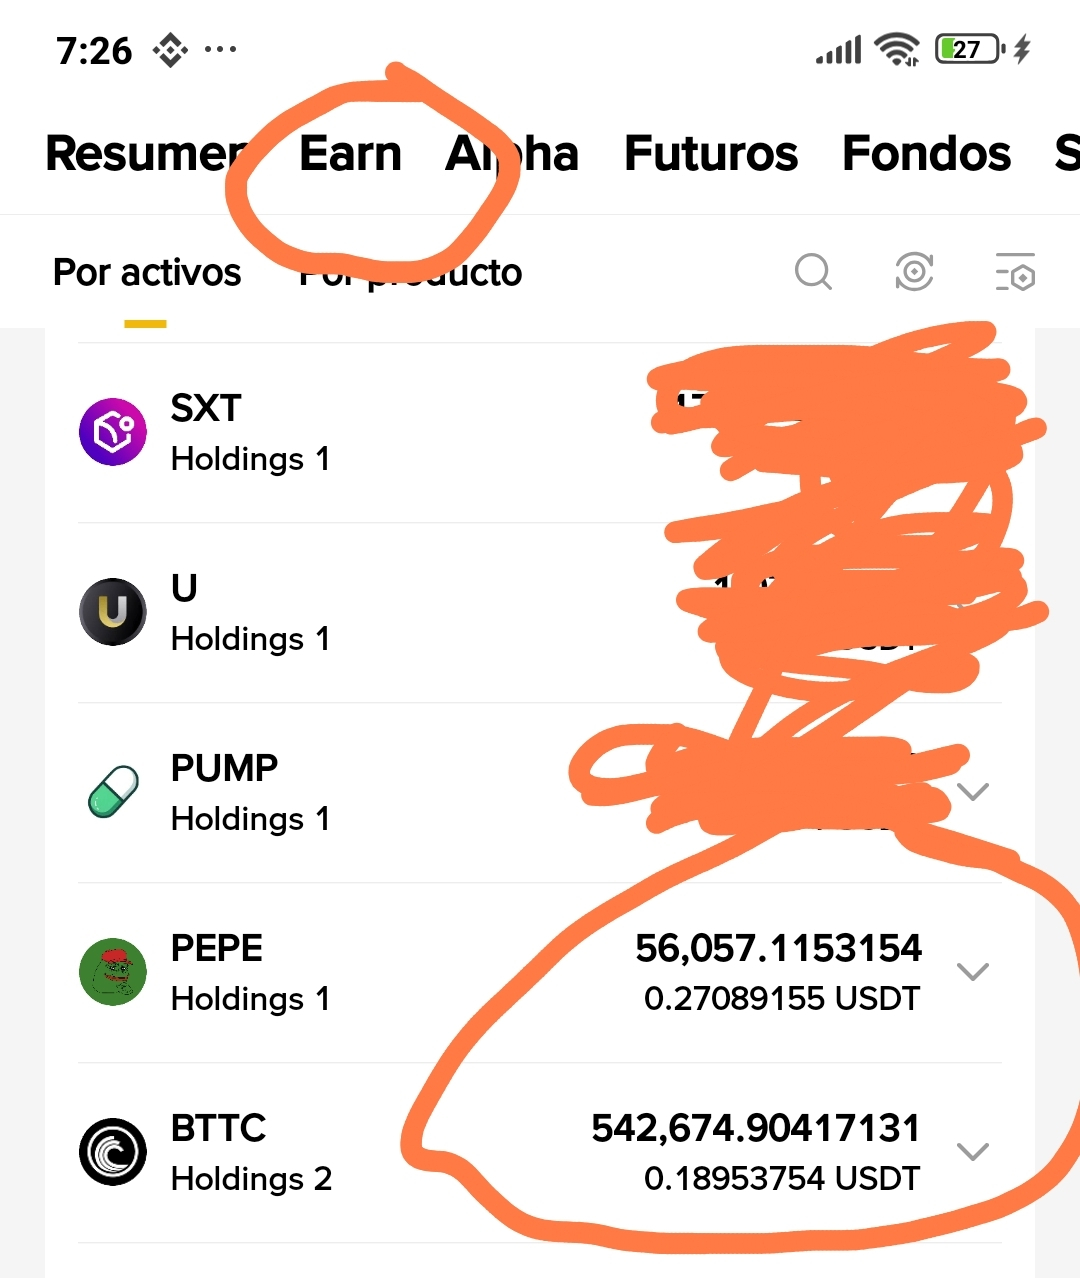
i have $BTTC and $PEPE en spot
i'm new, what do i do?
·
--
Bullish
Quoted content has been removed
·
--
Bullish
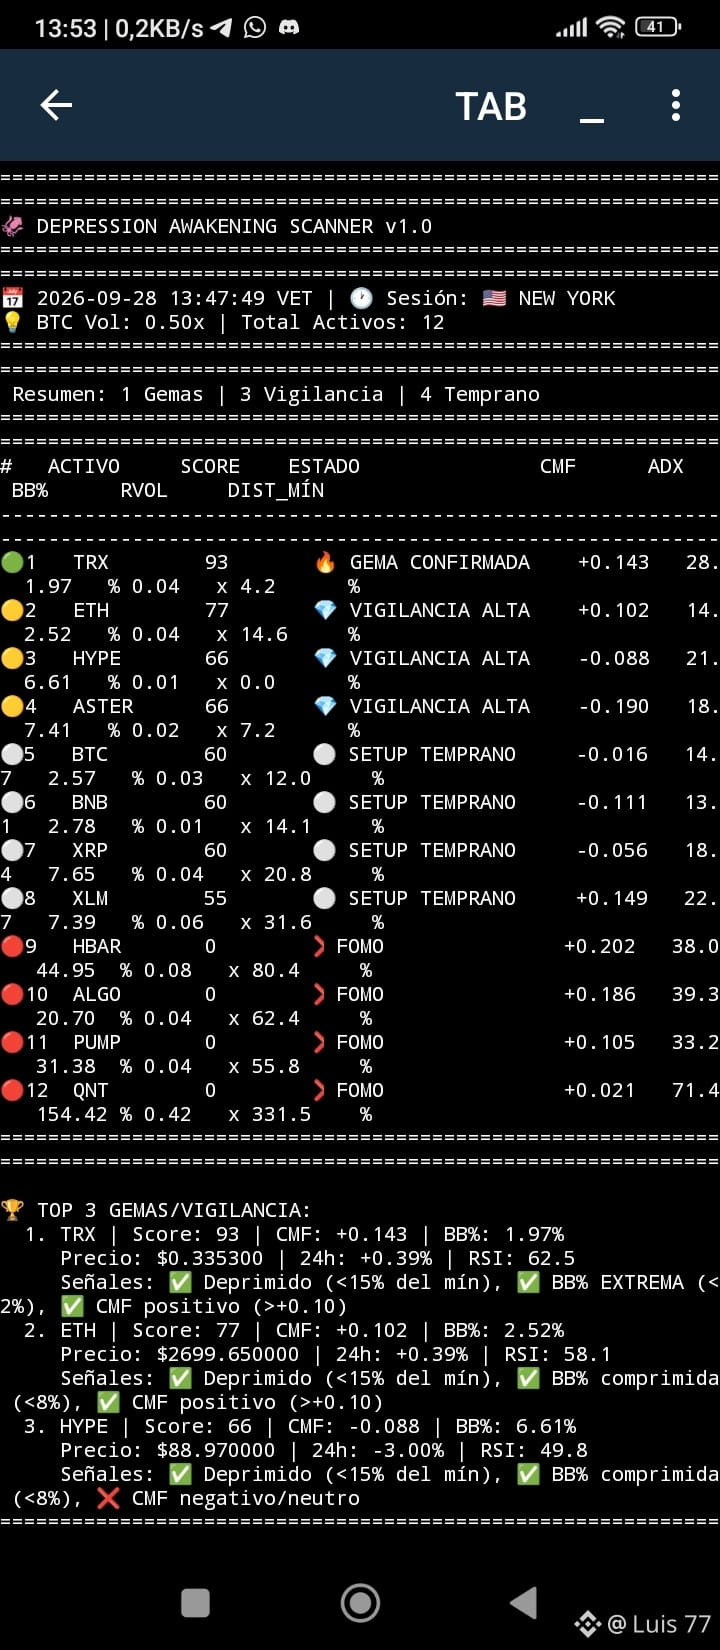
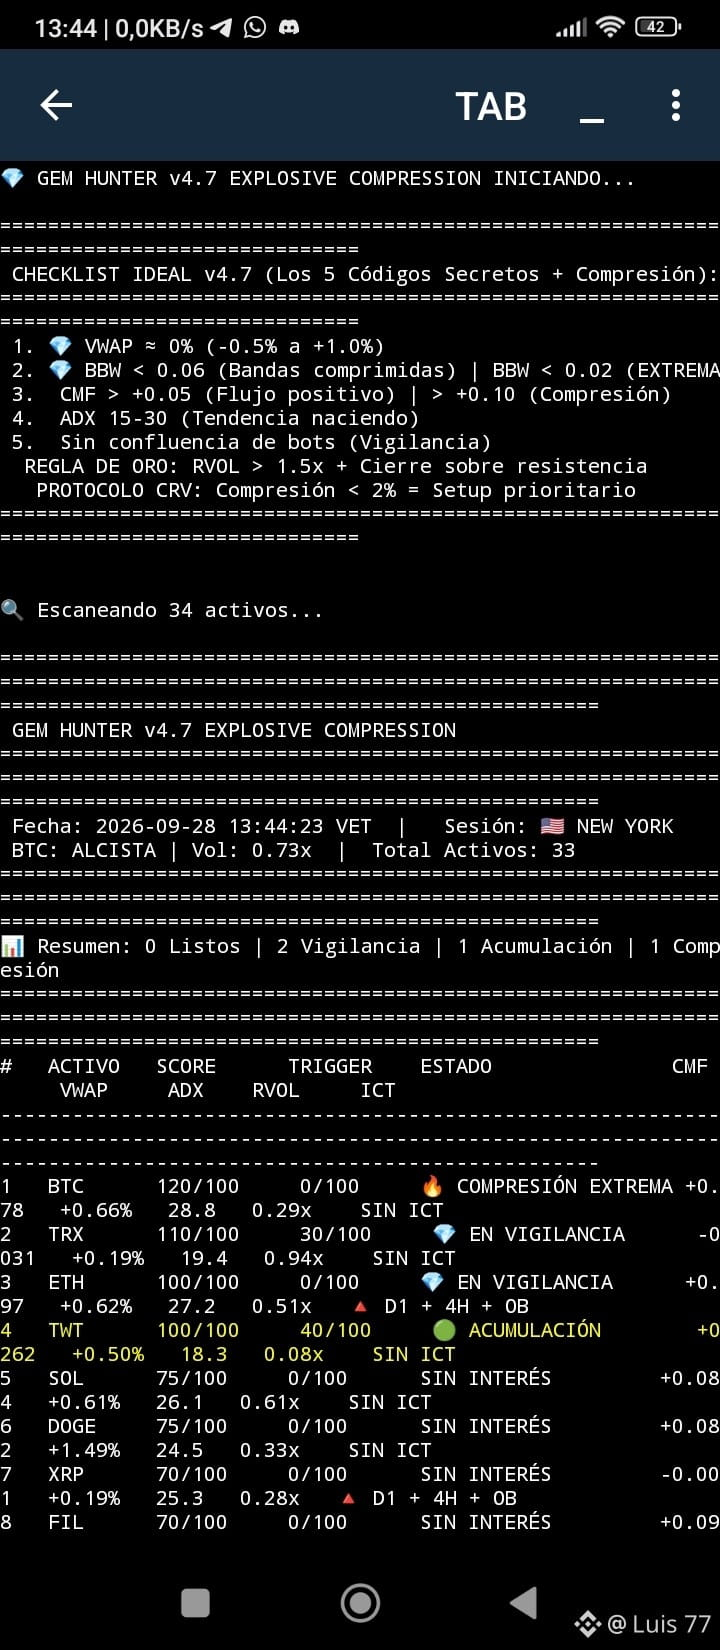
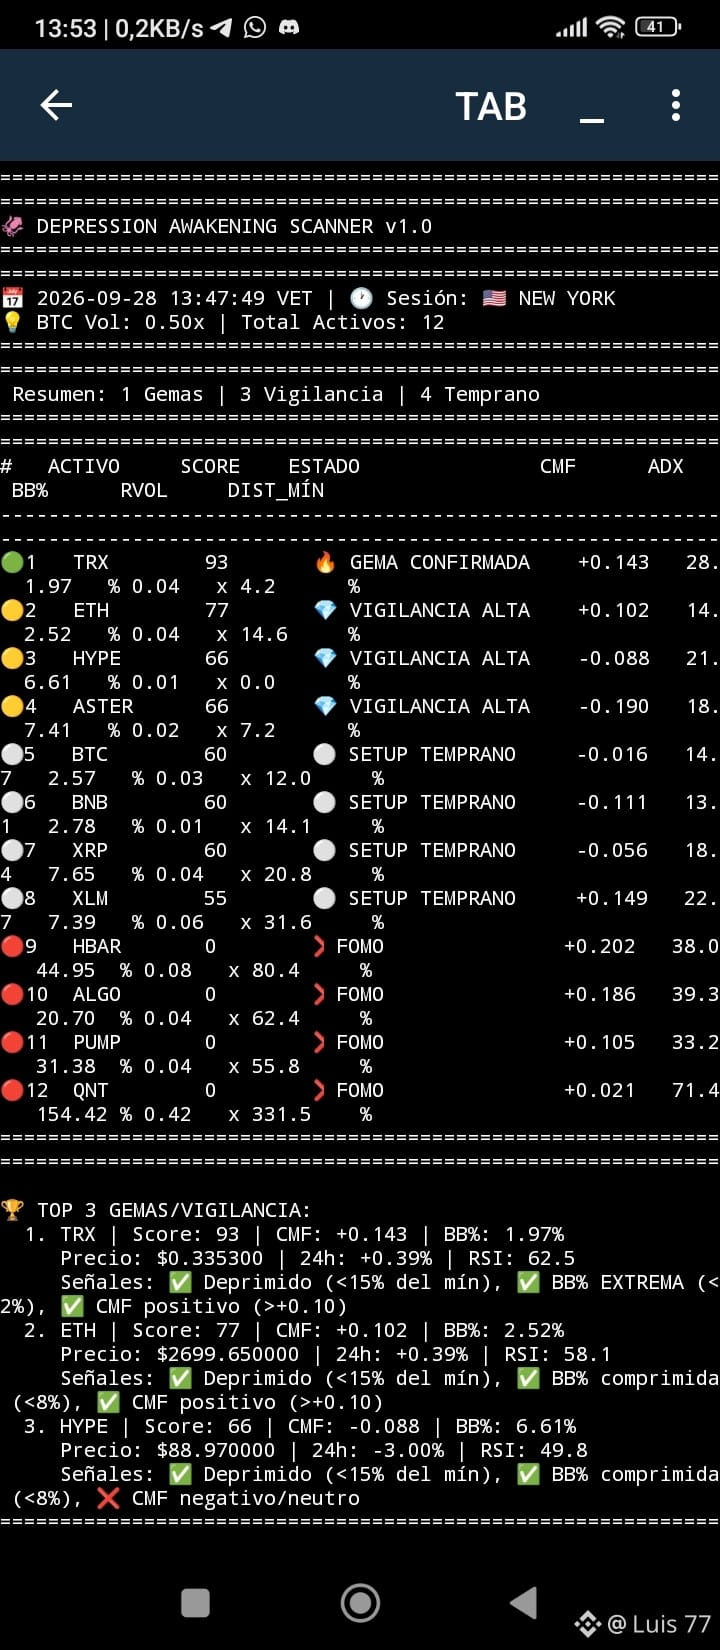
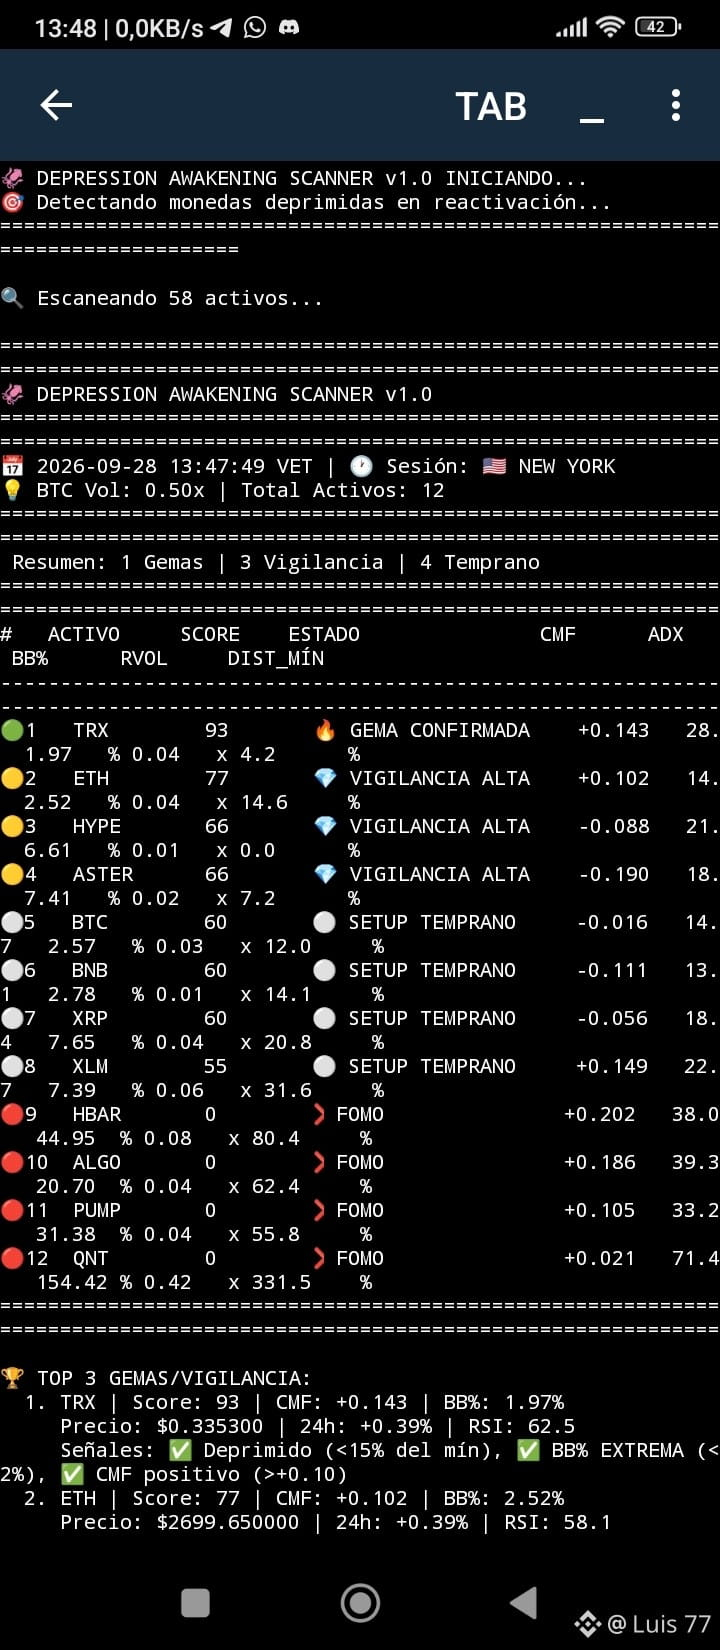
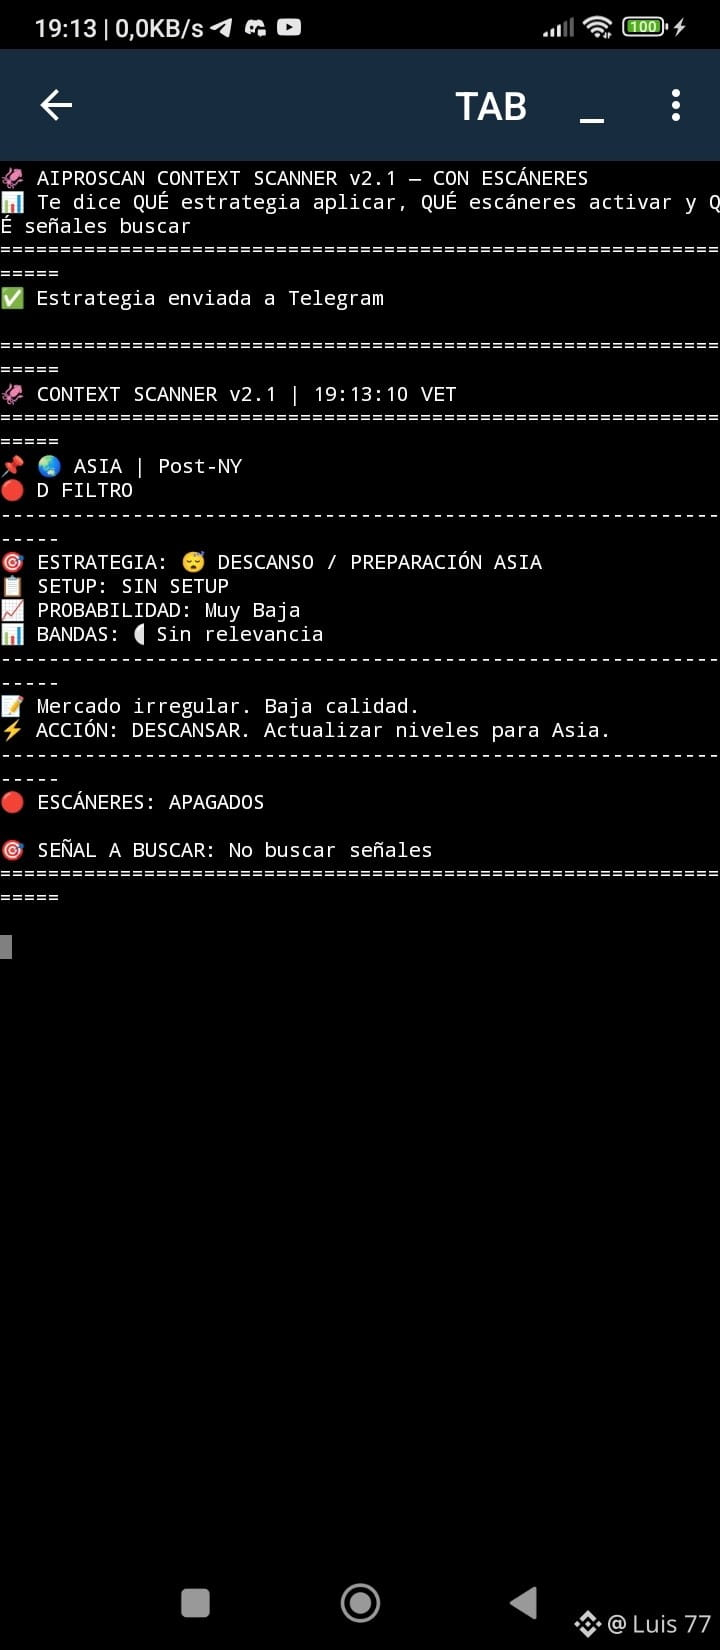
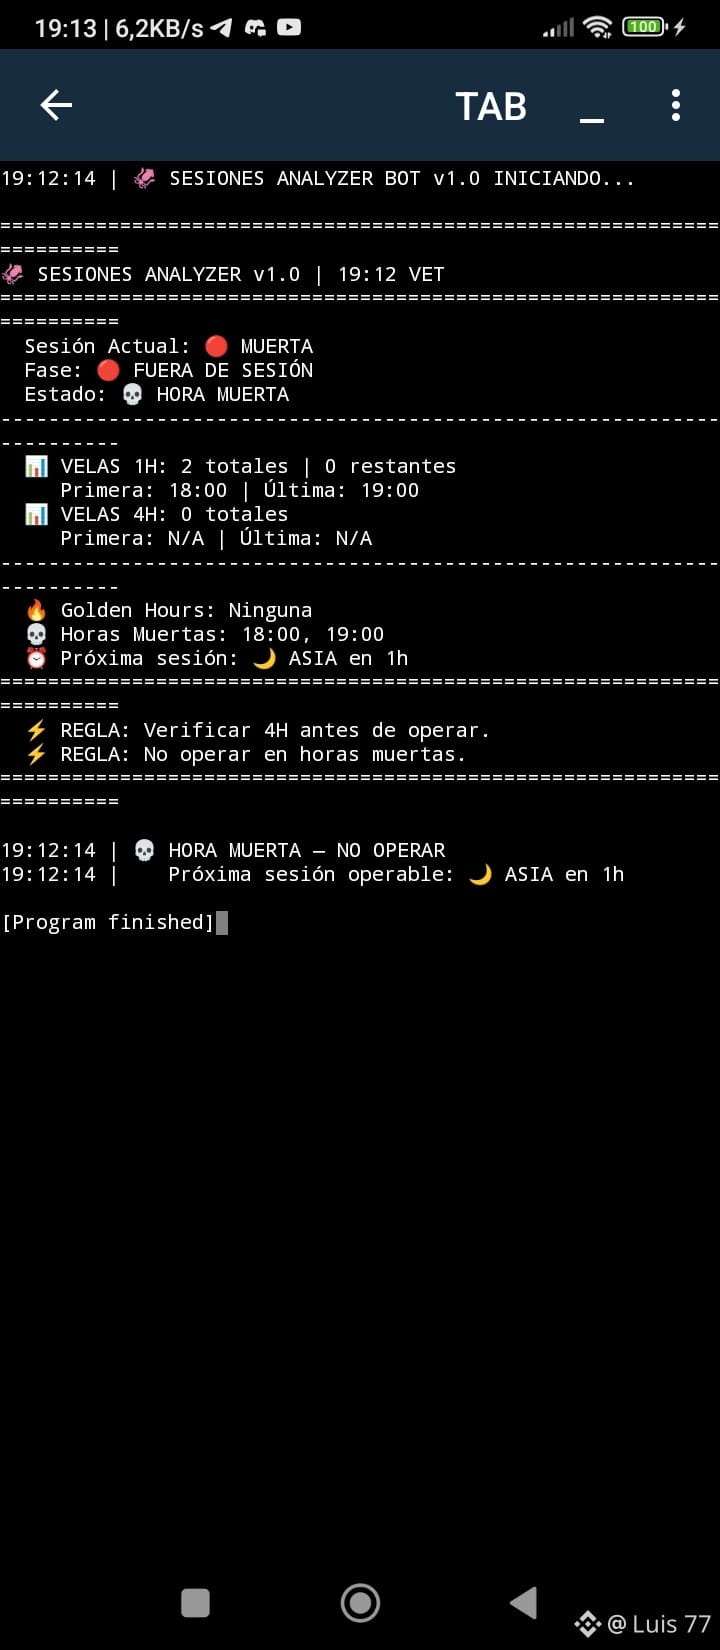
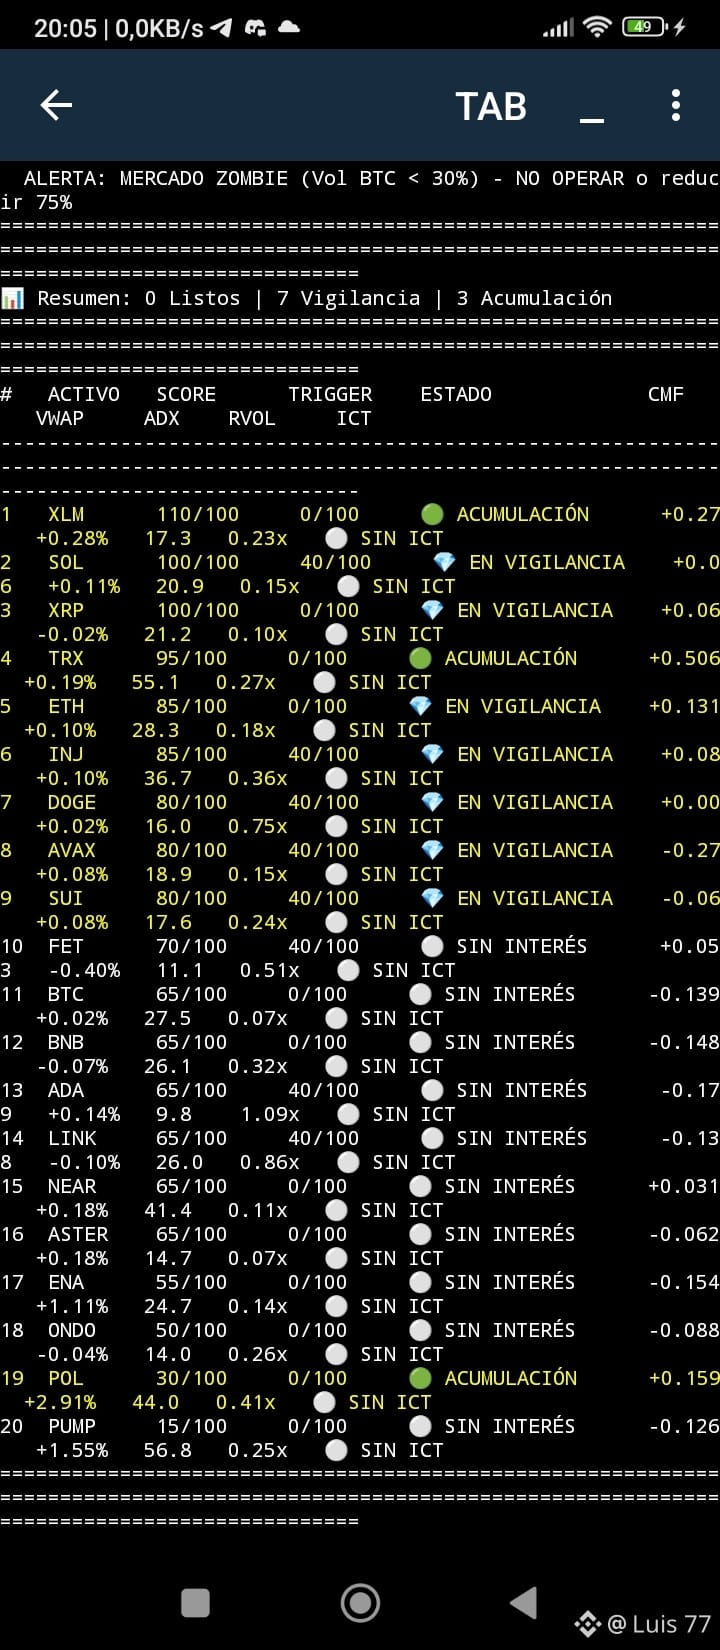
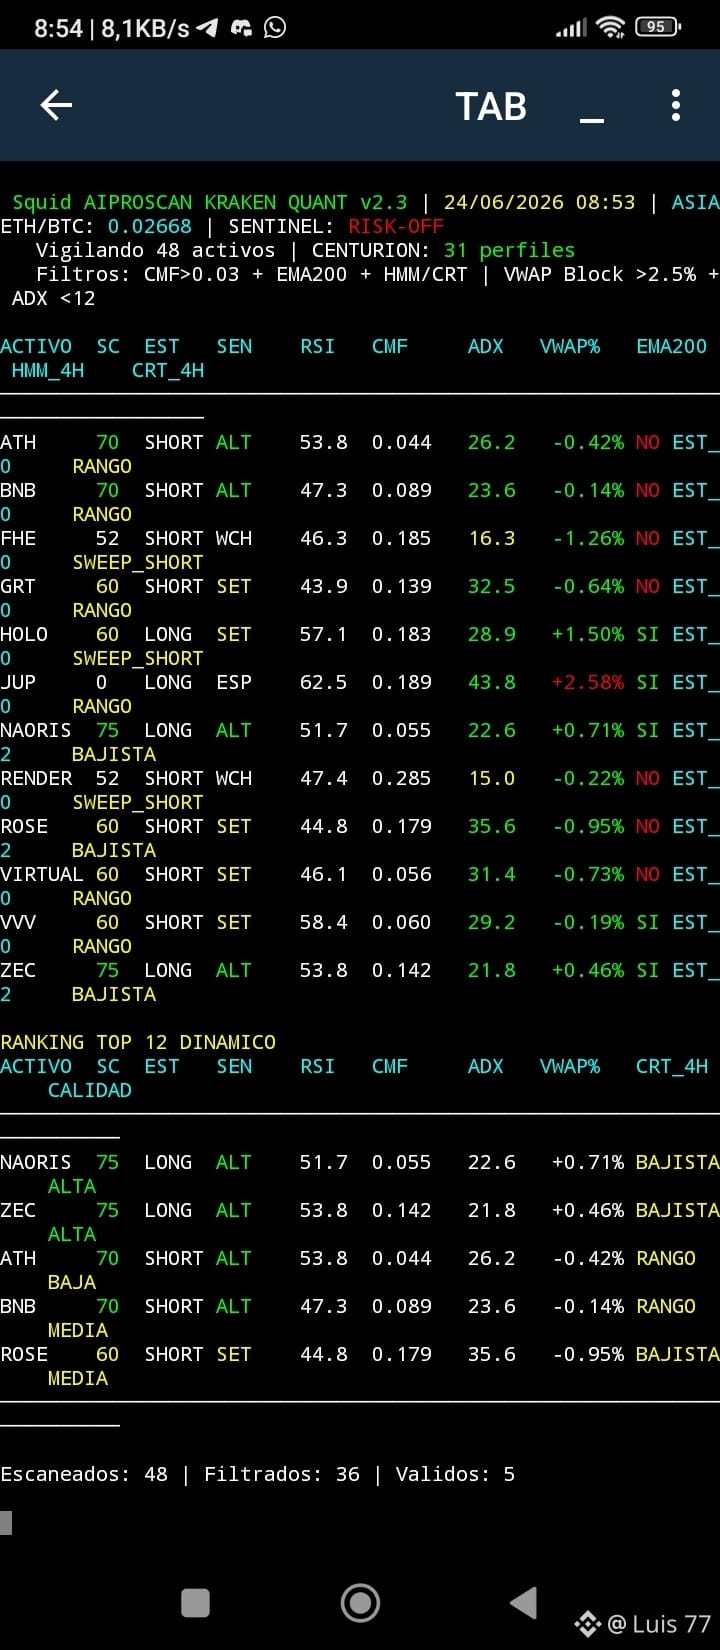
💀 DON’T BE A SCREEN SLAVE: THE POWER OF CONTEXT AND THE “DEAD HOURS” MY SCANNER REPORTS. Staring at the chart 24/7 doesn’t create an edge. In disciplined execution, not trading during low liquidity is a risk decision. 📊 Context reading — 19:12 VET Detected phase: dead time / out of session Volume: low or irregular Structure: tight ranges and unreliable movement Operational status: rest and preparation for Asia In these windows, three risks tend to increase: Wider spreads and worse execution. Breaks without volume confirmation, which quickly snap back into the range. Liquidity sweeps in narrow zones before real participation arrives. This isn’t about “being afraid” of the market. It’s about recognizing when the minimum conditions are missing for a technical read to have context. ⏳ Windows that deserve more attention: Pre-London and London open: volume usually grows, and the market decides whether it breaks or respects the Asian range. New York open: participation increases and can confirm, accelerate, or reverse the European move. London–New York overlap: normally concentrates a meaningful share of daily liquidity. 🔎 Practical filter before considering a setup ✅ Active session ✅ Relative volume increasing ✅ Clear structure on 15m, 1h, and 4h ✅ Flow and price without major negative divergences ✅ BTC without chaotic volatility that drags the market If the context says “REST,” it doesn’t mean the market won’t move; it means the signal quality may be lower and the risk of noise increases. The edge isn’t about predicting every candle. It’s about knowing when to wait, when to demand confirmation, and when to protect capital. #BinanceSquare #SolanaCutsTargetSlotTimeTo250ms #LUIS77 #Near #NEARRisesNearly80%InAWeek $BTC {future}(TRXUSDT) {future}(ZENUSDT) {future}(NEARUSDT)
💀 DON’T BE A SCREEN SLAVE: THE POWER OF CONTEXT AND THE “DEAD HOURS” MY SCANNER REPORTS.

Staring at the chart 24/7 doesn’t create an edge. In disciplined execution, not trading during low liquidity is a risk decision.

📊 Context reading — 19:12 VET
Detected phase: dead time / out of session
Volume: low or irregular
Structure: tight ranges and unreliable movement
Operational status: rest and preparation for Asia

In these windows, three risks tend to increase:
Wider spreads and worse execution.
Breaks without volume confirmation, which quickly snap back into the range.
Liquidity sweeps in narrow zones before real participation arrives.

This isn’t about “being afraid” of the market. It’s about recognizing when the minimum conditions are missing for a technical read to have context.

⏳ Windows that deserve more attention:

Pre-London and London open: volume usually grows, and the market decides whether it breaks or respects the Asian range.

New York open: participation increases and can confirm, accelerate, or reverse the European move.

London–New York overlap: normally concentrates a meaningful share of daily liquidity.

🔎 Practical filter before considering a setup
✅ Active session
✅ Relative volume increasing
✅ Clear structure on 15m, 1h, and 4h
✅ Flow and price without major negative divergences
✅ BTC without chaotic volatility that drags the market

If the context says “REST,” it doesn’t mean the market won’t move; it means the signal quality may be lower and the risk of noise increases.

The edge isn’t about predicting every candle. It’s about knowing when to wait, when to demand confirmation, and when to protect capital.

#BinanceSquare #SolanaCutsTargetSlotTimeTo250ms #LUIS77 #Near #NEARRisesNearly80%InAWeek $BTC
Ethereum Up or Down on September 22?

Ethereum Up or Down on September 22?

1%Up99%Down
Volume $29,135.69
·
--
Bullish
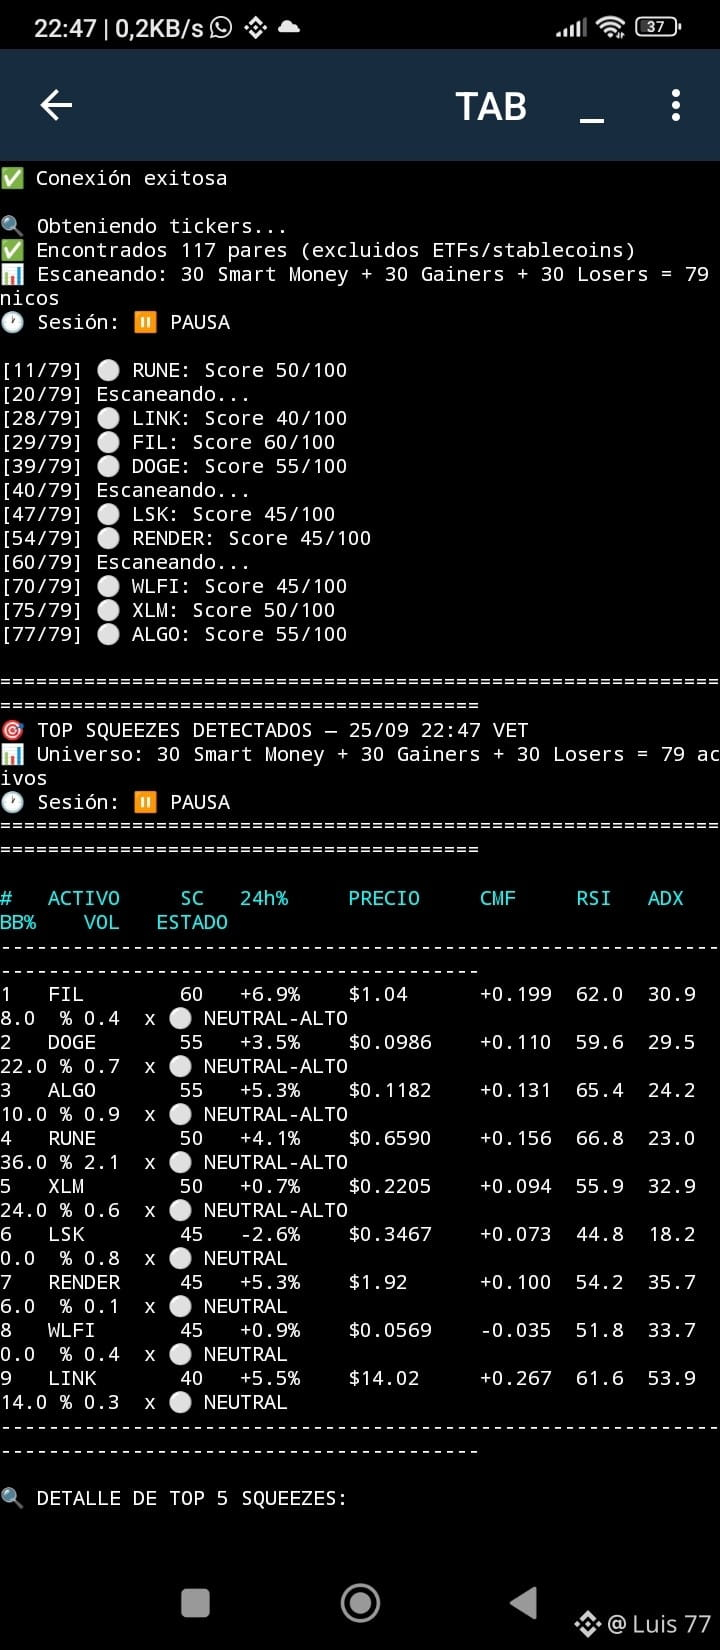
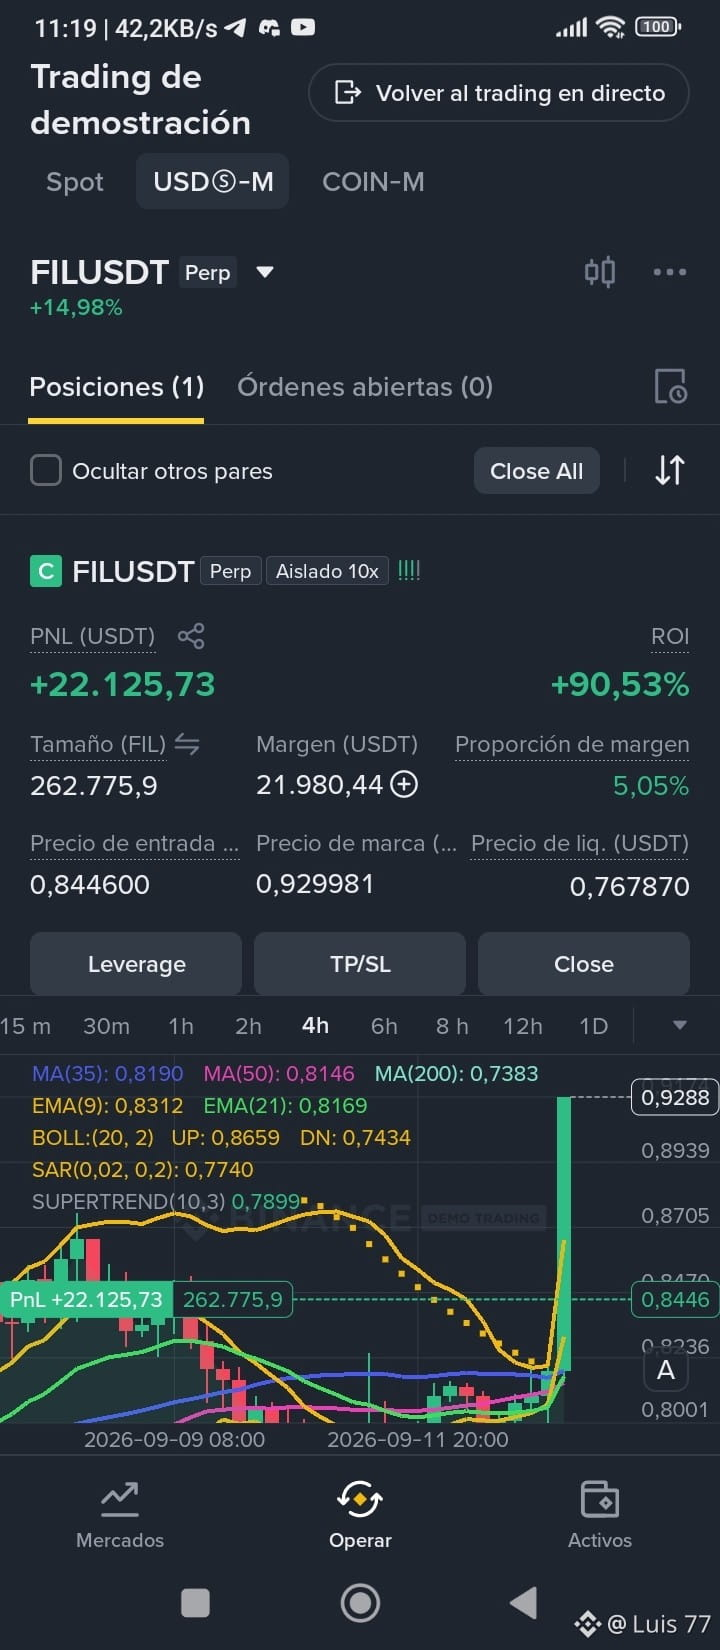
📊 FIL +90.53% ROI — THE GEM THE SYSTEM DETECTED BEFORE THE EXPLOSION Empirical validation of the AIPROSCAN-LCX77 system 🔍 THE SIGNAL (09/09 - 13/09) On 09/09, the system marked FIL with: INDICATOR VALUE SIGNAL BB% 2.0% 🔥 Extreme compression CMF -0.074 ⚠️ Negative ADX 11.3 ⚠️ Low ICT MAESTRO pattern v8.0/v9.1 ✅ Reversal confirmed Score 55/100 🟡 Watch What 90% of traders would have dismissed, our system marked as a POTENTIAL GEM thanks to the ICT Compensation Rule: "If BB% < 4% AND there is an ICT Pattern, the signal is valid even if CMF or ADX are weak." --- 📈 THE RESULT METRIC VALUE Entry price $0.8446 Current price $0.9300 Spot move +10.1% ROI with 10x +90.53% PNL +$22,125 USDT TP1/TP2/TP3 ✅ All hit --- 🧠 WHY DID IT WORK? 1. BB% 2.0% = Lit wick. Extreme compression always precedes expansion. 2. Confirmed ICT Pattern = Liquidity sweep + structural reversal. 3. MAESTRO v8.0/v9.1 = Cross-validation of 2 independent bots. 4. Context: Negative CMF did not invalidate the signal because the ICT pattern was solid. --- 📋 LESSONS FOR YOUR TRADING ✅ Don’t dismiss it based on a single negative indicator. ✅ BB% < 6% + ICT Pattern = minimum signal to trade. ✅ Leverage amplifies: 10% spot = 90% ROI with 10x. ✅ Patience pays: the signal took 4 days to break out. --- 🎯 THE SYSTEM IN NUMBERS · 8 validated assets (FIL, COTI, DOT, AERO, ZRO, RED, RE, SYN) · 100% win rate · Average ROI: +25% · Maximum ROI: +90.53% (FIL) --- ⚠️ WARNING This is not financial advice. Leverage amplifies losses too. Use strict risk management (mandatory SL). The system has a 40–50% win rate, but R:R of 1:3 makes up for it. --- 💬 WHAT DO YOU THINK? Have you used BB compression + ICT Pattern to detect gems before the explosion? Share your experience in the comments. 👇 #fil #SECReceivesGrayscaleLitecoinTrustETFFiling #LUIS77 #binancevenezuela🇻🇪 $BTC {future}(FILUSDT) {future}(ARUSDT) {future}(NEARUSDT)
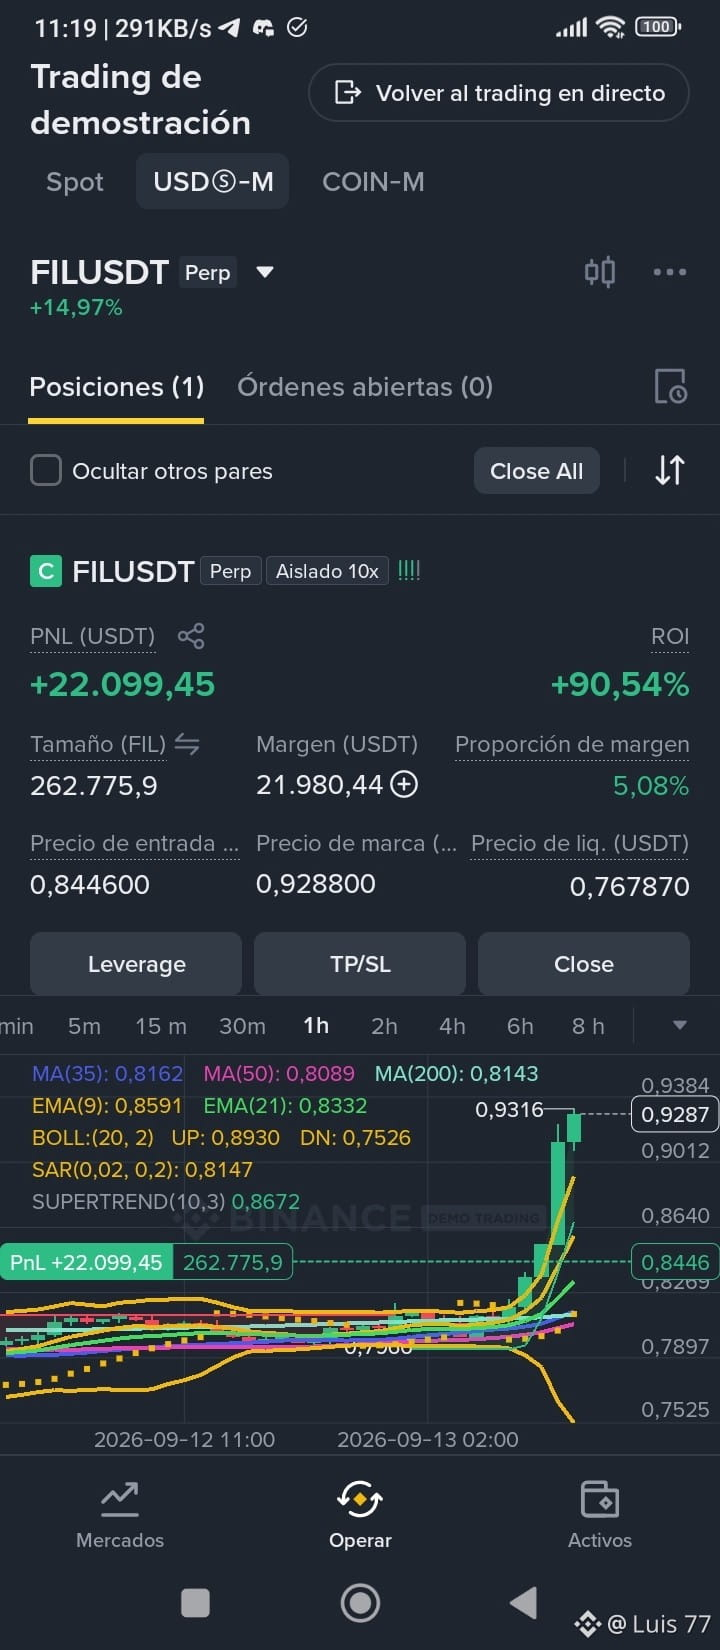
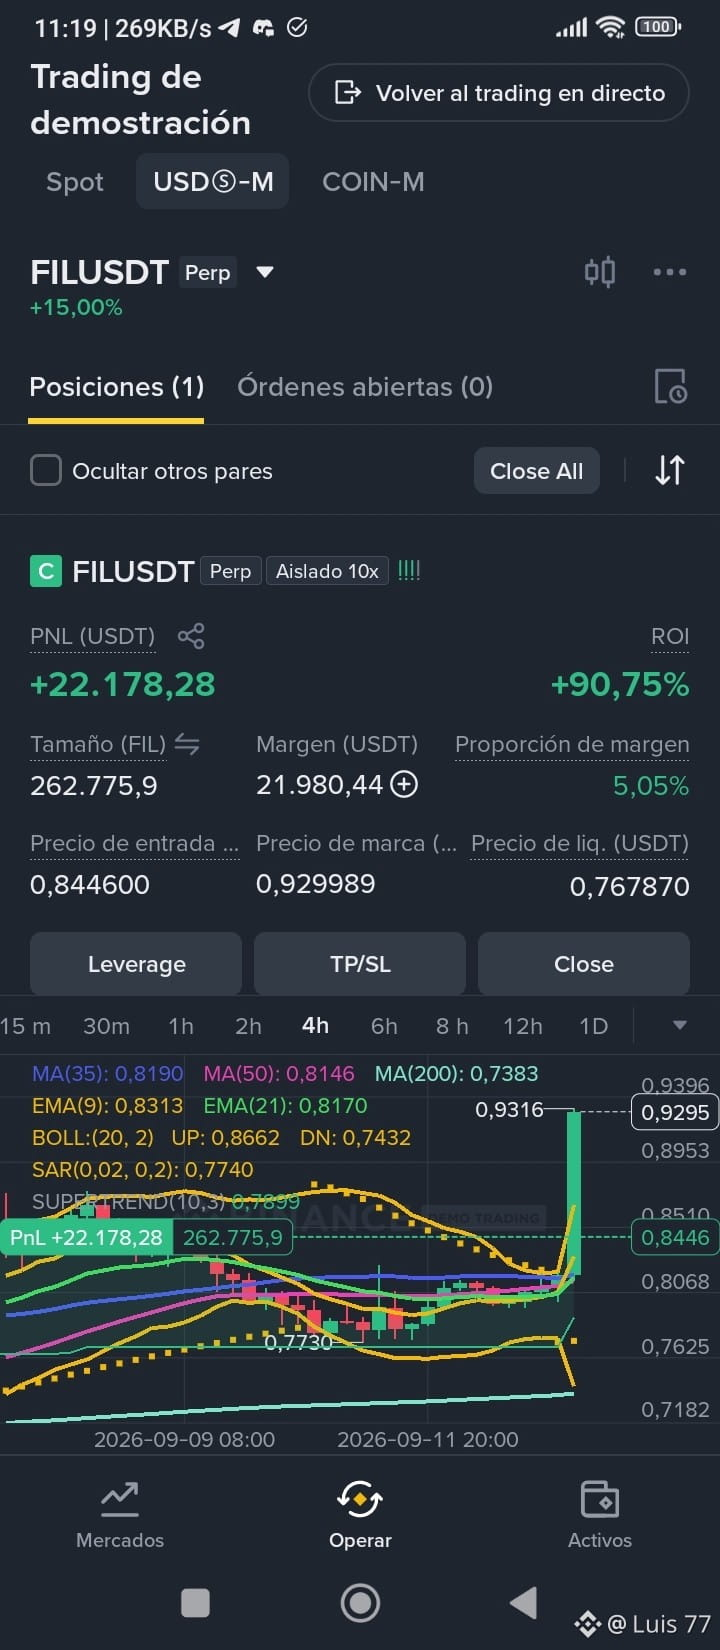
📊 FIL +90.53% ROI — THE GEM THE SYSTEM DETECTED BEFORE THE EXPLOSION
Empirical validation of the AIPROSCAN-LCX77 system

🔍 THE SIGNAL (09/09 - 13/09)

On 09/09, the system marked FIL with:

INDICATOR VALUE SIGNAL
BB% 2.0% 🔥 Extreme compression
CMF -0.074 ⚠️ Negative
ADX 11.3 ⚠️ Low
ICT MAESTRO pattern v8.0/v9.1 ✅ Reversal confirmed
Score 55/100 🟡 Watch

What 90% of traders would have dismissed, our system marked as a POTENTIAL GEM thanks to the ICT Compensation Rule:

"If BB% < 4% AND there is an ICT Pattern, the signal is valid even if CMF or ADX are weak."

---

📈 THE RESULT

METRIC VALUE
Entry price $0.8446
Current price $0.9300
Spot move +10.1%
ROI with 10x +90.53%
PNL +$22,125 USDT
TP1/TP2/TP3 ✅ All hit

---

🧠 WHY DID IT WORK?

1. BB% 2.0% = Lit wick. Extreme compression always precedes expansion.
2. Confirmed ICT Pattern = Liquidity sweep + structural reversal.
3. MAESTRO v8.0/v9.1 = Cross-validation of 2 independent bots.
4. Context: Negative CMF did not invalidate the signal because the ICT pattern was solid.

---

📋 LESSONS FOR YOUR TRADING

✅ Don’t dismiss it based on a single negative indicator.
✅ BB% < 6% + ICT Pattern = minimum signal to trade.
✅ Leverage amplifies: 10% spot = 90% ROI with 10x.
✅ Patience pays: the signal took 4 days to break out.

---

🎯 THE SYSTEM IN NUMBERS

· 8 validated assets (FIL, COTI, DOT, AERO, ZRO, RED, RE, SYN)
· 100% win rate
· Average ROI: +25%
· Maximum ROI: +90.53% (FIL)

---

⚠️ WARNING

This is not financial advice. Leverage amplifies losses too. Use strict risk management (mandatory SL). The system has a 40–50% win rate, but R:R of 1:3 makes up for it.

---

💬 WHAT DO YOU THINK?

Have you used BB compression + ICT Pattern to detect gems before the explosion? Share your experience in the comments. 👇

#fil #SECReceivesGrayscaleLitecoinTrustETFFiling #LUIS77 #binancevenezuela🇻🇪 $BTC
·
--
Bullish
traderrichard07
·
--
Why did $LSK go up so much? I have the answer for you:

1. Proposal to burn 100 million LSK
This is probably the most important catalyst.
The proposal is to burn 100 million LSK, reducing the total supply from approximately 400 million to 300 million.

In addition, Lisk is trying to position itself more as a financial infrastructure for businesses: payments, stablecoins, treasury, and financial operations.
That is to say:
Lisk no longer wants to compete simply as another blockchain/L2.
It’s looking to become a platform focused on business finance / enterprise payments.

Share it! $LSK
·
--
Bullish
kinglyon
·
--
#La viveza criolla del venezolano no trae nada bueno mira en estos moment la page of the banco provincial is down right now all buyers in this case if you want to sell are paying the provincial. .. Is it so you can't verify?
·
--
Bullish
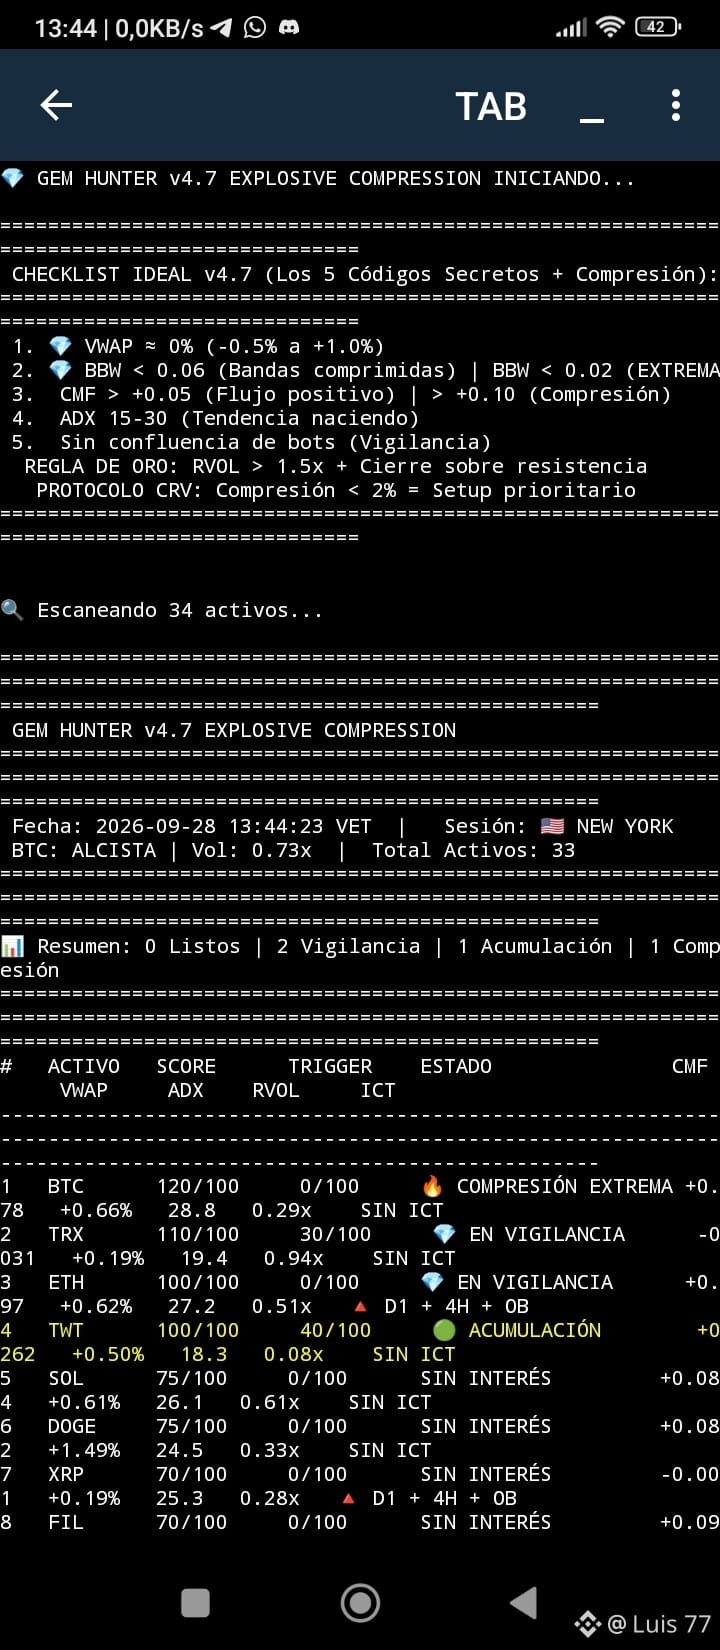
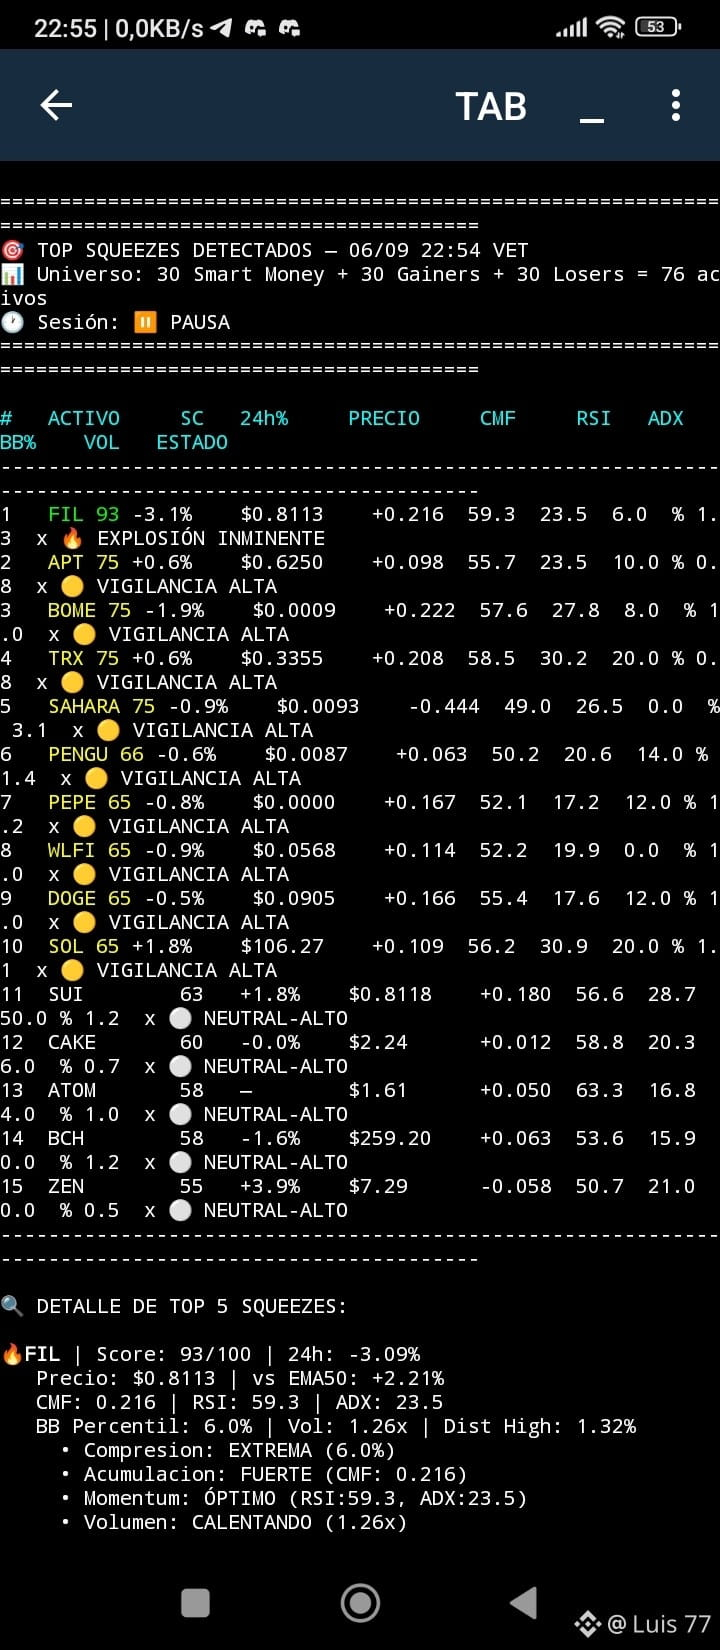
📊 TECHNICAL ANALYSIS — HIDDEN GEM DETECTED (PRE-ASIA) Based on AIPROSCAN-LCX77 Quantum System --- 💎 FIL — THE GEM NOBODY SAW DATA VALUE CMF +0.216 (strong institutional flow) ADX 23.5 (inflection, trend forming) VWAP -0.7% (value zone) BB% 6.0% (extreme compression) RVOL 1.26x (volume heating up) Score 93/100 (imminent explosion) Signal: Price falling (-3.09% 24h), BUT CMF positive → bullish divergence. Smart capital is accumulating silently. 📍 Entry: 0.8100 - 0.8150 🎯 TP1: 0.8300 / TP2: 0.8500 / TP3: 0.8700 🛑 SL: 0.7900 📊 R:R 1:2.8 --- 🧠 Why is it a GEM? 1. CMF > +0.10 while price is dropping → silent accumulation. 2. BBW < 6% → extreme compression, the fuse is lit. 3. ADX 23.5 → trend forming, perfect timing. 4. Confluence of 2 bots → Squeeze Hunter + Deep Whale. --- ⚠️ Context Zombie market (Vol 0.39x), BTC bearish. Use 50% position size. Patience and math win. Feeling bullish on FIL? Let me know in the comments. 👇 #FIL/USDT #CNPYAirdropOnBinanceAlpha #LUIS77 #venezuela #BTC $BTC {future}(FILUSDT) {future}(BTCUSDT) {future}(ASTERUSDT)
📊 TECHNICAL ANALYSIS — HIDDEN GEM DETECTED (PRE-ASIA)
Based on AIPROSCAN-LCX77 Quantum System

---

💎 FIL — THE GEM NOBODY SAW

DATA VALUE
CMF +0.216 (strong institutional flow)
ADX 23.5 (inflection, trend forming)
VWAP -0.7% (value zone)
BB% 6.0% (extreme compression)
RVOL 1.26x (volume heating up)
Score 93/100 (imminent explosion)

Signal: Price falling (-3.09% 24h), BUT CMF positive → bullish divergence. Smart capital is accumulating silently.

📍 Entry: 0.8100 - 0.8150
🎯 TP1: 0.8300 / TP2: 0.8500 / TP3: 0.8700
🛑 SL: 0.7900
📊 R:R 1:2.8

---

🧠 Why is it a GEM?

1. CMF > +0.10 while price is dropping → silent accumulation.
2. BBW < 6% → extreme compression, the fuse is lit.
3. ADX 23.5 → trend forming, perfect timing.
4. Confluence of 2 bots → Squeeze Hunter + Deep Whale.

---

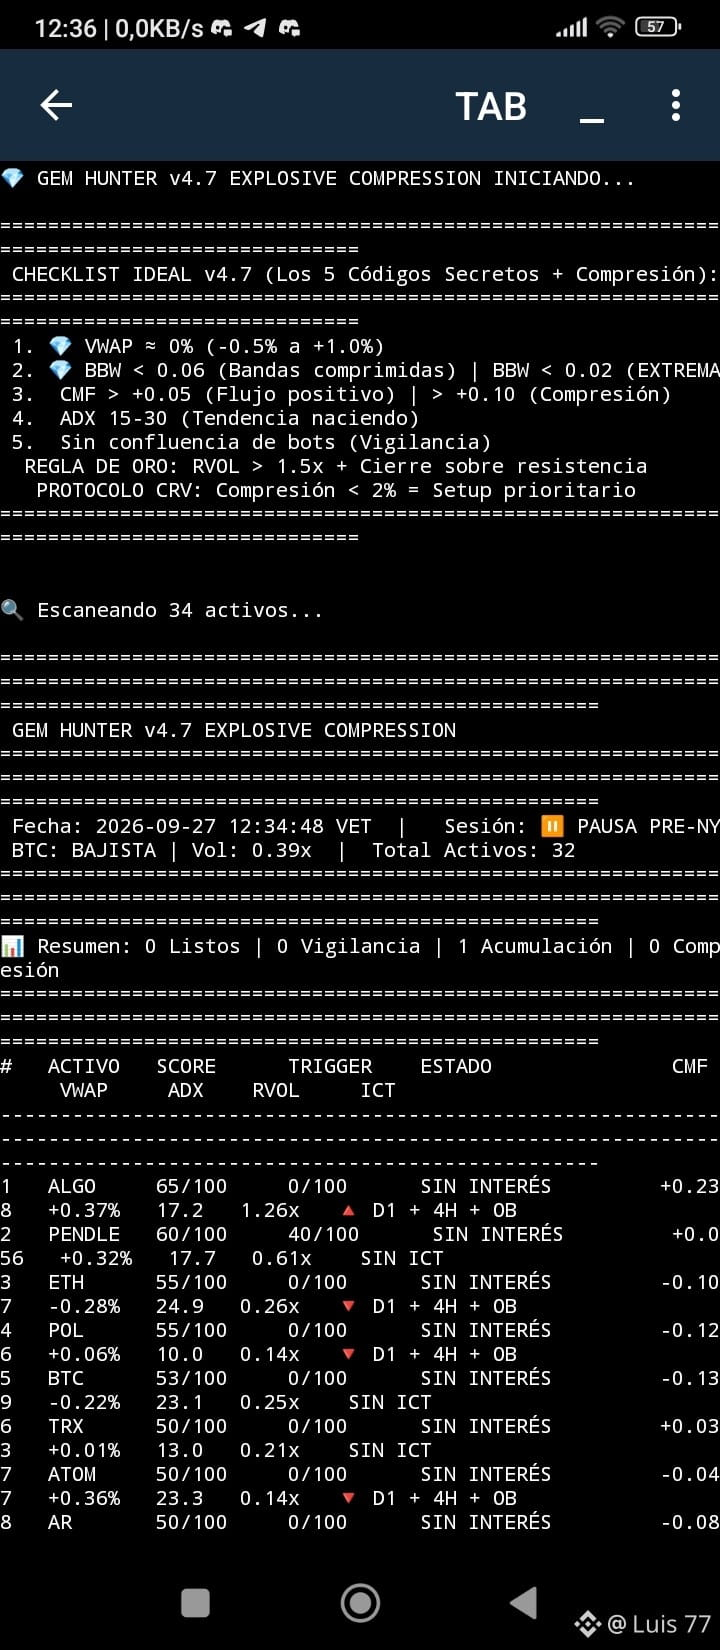
⚠️ Context

Zombie market (Vol 0.39x), BTC bearish. Use 50% position size.
Patience and math win.

Feeling bullish on FIL? Let me know in the comments. 👇

#FIL/USDT #CNPYAirdropOnBinanceAlpha #LUIS77 #venezuela #BTC $BTC
·
--
Bullish
J_Anton
·
--
The magic here isn’t that they give you a huge sum out of nowhere, but that you get immediate liquidity in USDT without having to sell your crypto and miss out on a market rally, while paying a ridiculous 5% annual interest. It’s basically using what you already have to move without touching your main long-term position.
·
--
Bullish
📊 QUANTUM ANALYSIS: 2 HIDDEN GEMS IN LONDON Based on AIPROSCAN-LCX77 + GEM HUNTER PRO --- 💎 FIL — THE MAIN GEM DATA VALUE CMF +0.207 (strong institutional flow) VWAP -0.08% (almost perfect) ADX 15.8 (potential upward inflection) Score 100/100 (maximum in the universe) 📍 Entry: 0.6950 - 0.7000 🎯 TP1: 0.7150 / TP2: 0.7300 / TP3: 0.7500 🛑 SL: 0.6800 📊 R:R 1:2.8 --- 💎 DOT — THE SECOND GEM DATA VALUE CMF +0.202 (strong institutional flow) QS 100/100 (AIPROSCAN) MTF LONG on 4H/1H/15m (total confluence) 📍 Entry: 0.8700 - 0.8800 🎯 TP1: 0.9000 / TP2: 0.9200 / TP3: 0.9500 🛑 SL: 0.8500 📊 R:R 1:3.2 --- 🧠 Why these gems? The GES (Gem Edge Score) system prioritizes: 1. CMF > +0.10: Institutional capital is quietly entering. 2. VWAP near 0%: Price is at fair value. 3. ADX at inflection: The trend is waking up. --- ⚠️ Context BULLISH BTC (+2.4%), Vol 0.72-0.97x, LONDON session. Reduce size by 50%. Risk management is key. --- What do you think? Are you going with FIL or DOT? 👇 🔔 AIPROSCAN v7.9.2 📊 GOLDEN | 09:42:45 🟢 TOP 3 LONG 1. DOT | QS:100 | 4H:LONG 1H:LONG 15m:LONG Entry:$0.8770 SL:$0.8159 TP:$0.9992 2. JUP | QS:100 | 4H:LONG 1H:LONG 15m:LONG Entry:$0.2278 SL:$0.2053 TP:$0.2728 3. LTC | QS:90 | 4H:LONG 1H:LONG 15m:LONG Entry:$50.9300 SL:$47.8695 TP:$57.051 🔴 TOP 3 SHORT 1. VANRY | QS:75 | 4H:SHORT 1H:SHORT 15m:SHORT Entry:$0.0007 SL:$0.0021 TP:$0.0007 2. ACE | QS:74 | 4H:SHORT 1H:SHORT 15m:LONG Entry:$0.1854 SL:$0.23 TP:$0.0962 🚀 BEST: 🟢 DOT | QS:100 Entry:$0.8770 SL:$0.8159 TP:$0.9992 #FIL #DOT #LUIS77 #OilSteadiesAfterThreeDayRally #BinanceSquare #TechnicalAnalysis #Crypto #Trading #Binance #GEMS #BTC #Altcoins #AIPROSCAN$BTC {future}(DOTUSDT) {future}(FILUSDT) {future}(NEARUSDT)
📊 QUANTUM ANALYSIS: 2 HIDDEN GEMS IN LONDON
Based on AIPROSCAN-LCX77 + GEM HUNTER PRO

---

💎 FIL — THE MAIN GEM

DATA VALUE
CMF +0.207 (strong institutional flow)
VWAP -0.08% (almost perfect)
ADX 15.8 (potential upward inflection)
Score 100/100 (maximum in the universe)

📍 Entry: 0.6950 - 0.7000
🎯 TP1: 0.7150 / TP2: 0.7300 / TP3: 0.7500
🛑 SL: 0.6800
📊 R:R 1:2.8

---

💎 DOT — THE SECOND GEM

DATA VALUE
CMF +0.202 (strong institutional flow)
QS 100/100 (AIPROSCAN)
MTF LONG on 4H/1H/15m (total confluence)

📍 Entry: 0.8700 - 0.8800
🎯 TP1: 0.9000 / TP2: 0.9200 / TP3: 0.9500
🛑 SL: 0.8500
📊 R:R 1:3.2

---

🧠 Why these gems?

The GES (Gem Edge Score) system prioritizes:

1. CMF > +0.10: Institutional capital is quietly entering.
2. VWAP near 0%: Price is at fair value.
3. ADX at inflection: The trend is waking up.

---

⚠️ Context

BULLISH BTC (+2.4%), Vol 0.72-0.97x, LONDON session.
Reduce size by 50%. Risk management is key.

---

What do you think? Are you going with FIL or DOT? 👇

🔔 AIPROSCAN v7.9.2
📊 GOLDEN | 09:42:45

🟢 TOP 3 LONG
1. DOT | QS:100 | 4H:LONG 1H:LONG 15m:LONG
Entry:$0.8770 SL:$0.8159 TP:$0.9992
2. JUP | QS:100 | 4H:LONG 1H:LONG 15m:LONG
Entry:$0.2278 SL:$0.2053 TP:$0.2728
3. LTC | QS:90 | 4H:LONG 1H:LONG 15m:LONG
Entry:$50.9300 SL:$47.8695 TP:$57.051
🔴 TOP 3 SHORT
1. VANRY | QS:75 | 4H:SHORT 1H:SHORT 15m:SHORT
Entry:$0.0007 SL:$0.0021 TP:$0.0007
2. ACE | QS:74 | 4H:SHORT 1H:SHORT 15m:LONG
Entry:$0.1854 SL:$0.23 TP:$0.0962

🚀 BEST: 🟢 DOT | QS:100
Entry:$0.8770 SL:$0.8159 TP:$0.9992

#FIL #DOT #LUIS77 #OilSteadiesAfterThreeDayRally #BinanceSquare #TechnicalAnalysis #Crypto #Trading #Binance #GEMS #BTC #Altcoins #AIPROSCAN$BTC
·
--
Bullish
📊 BINANCE LOANS: LIQUIDITY TOOL OR A RISK TRAP? A loan with BTC as collateral can give you liquidity without selling your assets. But there’s a question that almost nobody asks before taking it: What happens if the price of your collateral drops while you’re still owing? Educational example: you deposit BTC as collateral and receive USDT. The key thing to watch isn’t just the rate: it’s the LTV. 🔹 LTV = loan value ÷ collateral value If the BTC used as collateral falls, your LTV rises. If it reaches the product’s liquidation threshold, the platform may automatically sell part or all of the collateral to cover the loan and interest. ⚠️ That’s the difference between using a loan responsibly and turning it into an unnecessary risk. What you should check before using Binance Loans: ✅ Borrowed asset and collateral asset ✅ Interest rate and how it’s calculated ✅ Initial LTV, margin alert, and liquidation LTV ✅ Term, early repayment rules, and product conditions ✅ Ability to add collateral or repay (amortize) if the market moves against you Binance offers flexible loans, fixed-rate loans, and VIP loans; each option has different conditions. Flexible loans are over-collateralized and let you request or repay funds at any time, but they require constant monitoring of the health of your LTV. 🎯 Quant reading: A crypto loan isn’t “free capital.” It’s a liquidity management tool backed by a volatile asset. It can be useful if you have a clear plan, enough margin of safety, and you understand the liquidation mechanism. It can be costly if you ignore the LTV, rely on a single market scenario, or use debt to increase your exposure without a defined risk limit. Don’t take a loan on emotion. First study the risk you’re putting up as collateral. #BinanceSquare #BTC #LTV #BitcoinETFBuyersReturn #LUIS77 $BTC {future}(BTCUSDT) {future}(AAVEUSDT) {future}(BNBUSDT)
📊 BINANCE LOANS: LIQUIDITY TOOL OR A RISK TRAP?

A loan with BTC as collateral can give you liquidity without selling your assets. But there’s a question that almost nobody asks before taking it:

What happens if the price of your collateral drops while you’re still owing?

Educational example: you deposit BTC as collateral and receive USDT. The key thing to watch isn’t just the rate: it’s the LTV.

🔹 LTV = loan value ÷ collateral value

If the BTC used as collateral falls, your LTV rises. If it reaches the product’s liquidation threshold, the platform may automatically sell part or all of the collateral to cover the loan and interest.

⚠️ That’s the difference between using a loan responsibly and turning it into an unnecessary risk.

What you should check before using Binance Loans:
✅ Borrowed asset and collateral asset
✅ Interest rate and how it’s calculated
✅ Initial LTV, margin alert, and liquidation LTV
✅ Term, early repayment rules, and product conditions
✅ Ability to add collateral or repay (amortize) if the market moves against you

Binance offers flexible loans, fixed-rate loans, and VIP loans; each option has different conditions. Flexible loans are over-collateralized and let you request or repay funds at any time, but they require constant monitoring of the health of your LTV.

🎯 Quant reading:
A crypto loan isn’t “free capital.” It’s a liquidity management tool backed by a volatile asset.

It can be useful if you have a clear plan, enough margin of safety, and you understand the liquidation mechanism. It can be costly if you ignore the LTV, rely on a single market scenario, or use debt to increase your exposure without a defined risk limit.

Don’t take a loan on emotion. First study the risk you’re putting up as collateral.

#BinanceSquare #BTC #LTV #BitcoinETFBuyersReturn #LUIS77 $BTC
·
--
Bullish
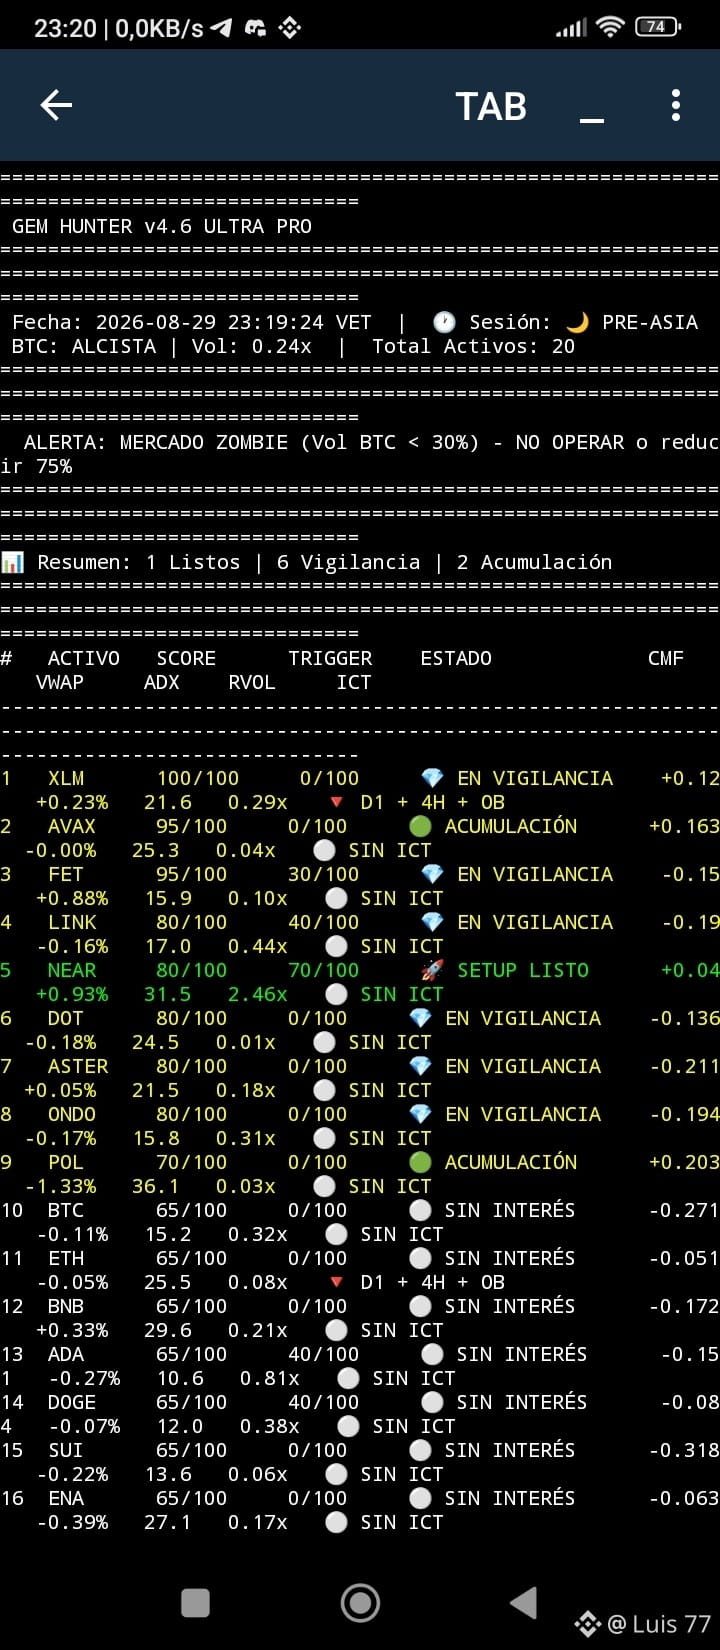
📊 TECHNICAL ANALYSIS — THE 4 GEMS NOBODY SAW for Today BULLISH BTC • LOW VOLUME • PRE-ASIA 🚀 DOT — THE REVELATION DOT broke above MA(35/50) at 0.8614. Resistance at MA(200): 0.885. If it breaks, move to 0.92-0.95. LONG setup: 📍 Entry: 0.855-0.865 🎯 TP1: 0.890 / TP2: 0.920 🛑 SL: 0.835 📊 R:R 1:3.2 --- ⚪ AVAX — CONSOLIDATION Stuck to MA(50) at 7.427. Silent accumulation (CMF +0.16). Needs to break 7.50 to activate. 📍 Watch: 7.35-7.45 🎯 TP: 7.65-7.90 🛑 SL: 7.20 --- 🟡 NEAR — FRAGILE RECOVERY Supported by EMA(21): 1.852. Current price: 1.888. If BTC holds, target 1.96-2.05. 📍 Watch: 1.87-1.90 🎯 TP: 1.96-2.05 🛑 SL: 1.82 --- 🟡 XLM — STEADY, NO MOMENTUM Above EMA(21): 0.179. Price: 0.1816. Needs volume to break 0.185. 📍 Watch: 0.180-0.182 🎯 TP: 0.188-0.195 🛑 SL: 0.176 --- 🎯 VERDICT ✅ EXECUTE DOT (50%) — The gem nobody saw. 🟡 WATCH AVAX, NEAR, XLM — Wait for confirmation. --- ⚠️ Zombie market = 50% size. Risk management is key. Which one do you like most? Let me know in the comments 👇ACTIVT? EXECUTE? REASON DOT ✅ EXECUTE NOW (50%) Broke MA(35/50), resistance at 0.885, confirms trend change AVAX 🟡 WATCH Consolidating, but not breaking. Wait for 7.50+ NEAR 🟡 WATCH Supported by EMA(21), but needs a catalyst XLM 🟡 WATCH Stable but no momentum. Wait for volume >RVOL 1.0x #dot #AVAX #NEAR #XLM #LUIS77 #VenezuelaUSSign25YearOilDeal #TechnicalAnalysis #Crypto #Trading #Binance #GEMS #BTC #Altcoins {future}(DOTUSDT) {future}(XLMUSDT) {future}(NEARUSDT)
📊 TECHNICAL ANALYSIS — THE 4 GEMS NOBODY SAW for Today
BULLISH BTC • LOW VOLUME • PRE-ASIA

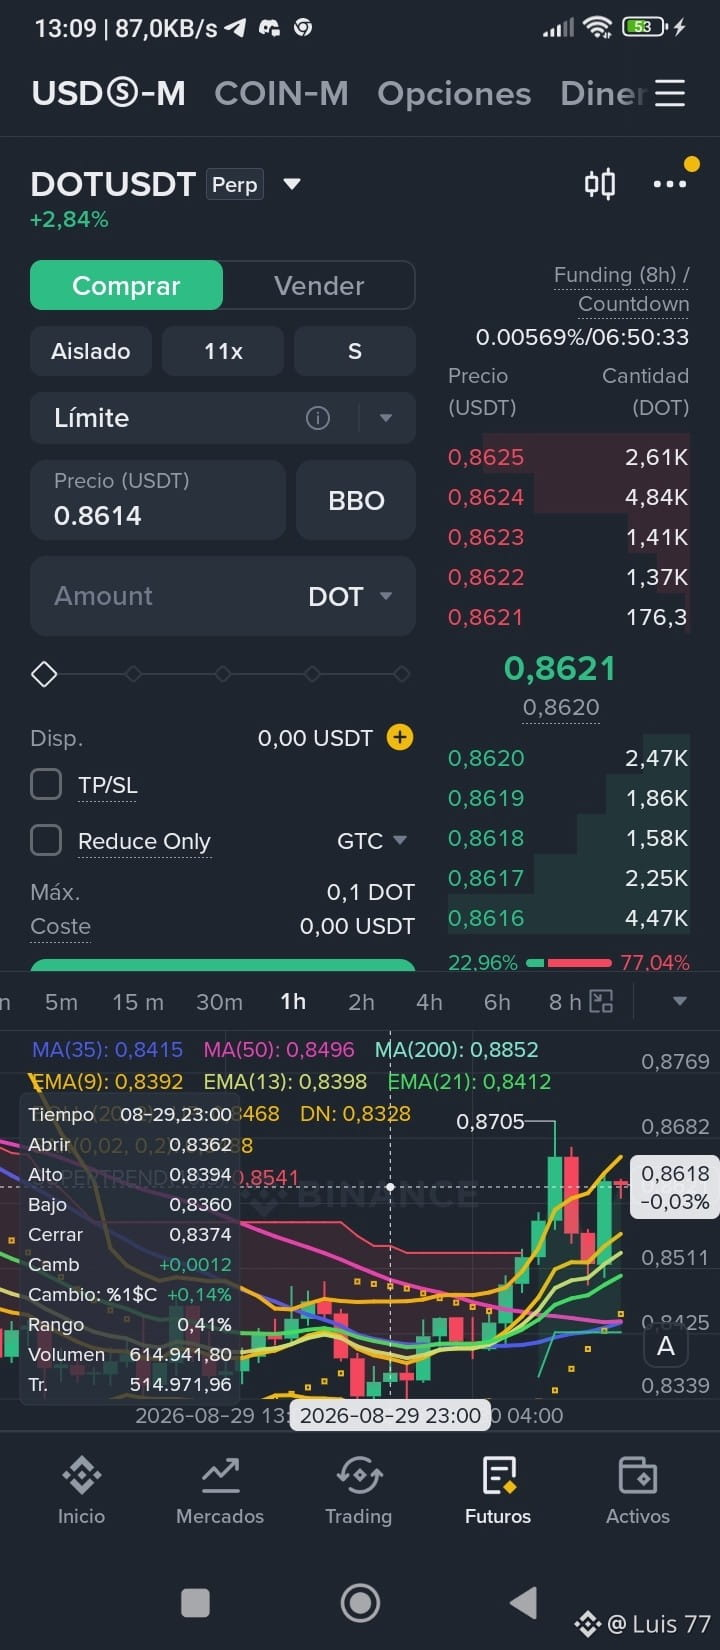
🚀 DOT — THE REVELATION

DOT broke above MA(35/50) at 0.8614. Resistance at MA(200): 0.885. If it breaks, move to 0.92-0.95. LONG setup:

📍 Entry: 0.855-0.865
🎯 TP1: 0.890 / TP2: 0.920
🛑 SL: 0.835
📊 R:R 1:3.2

---

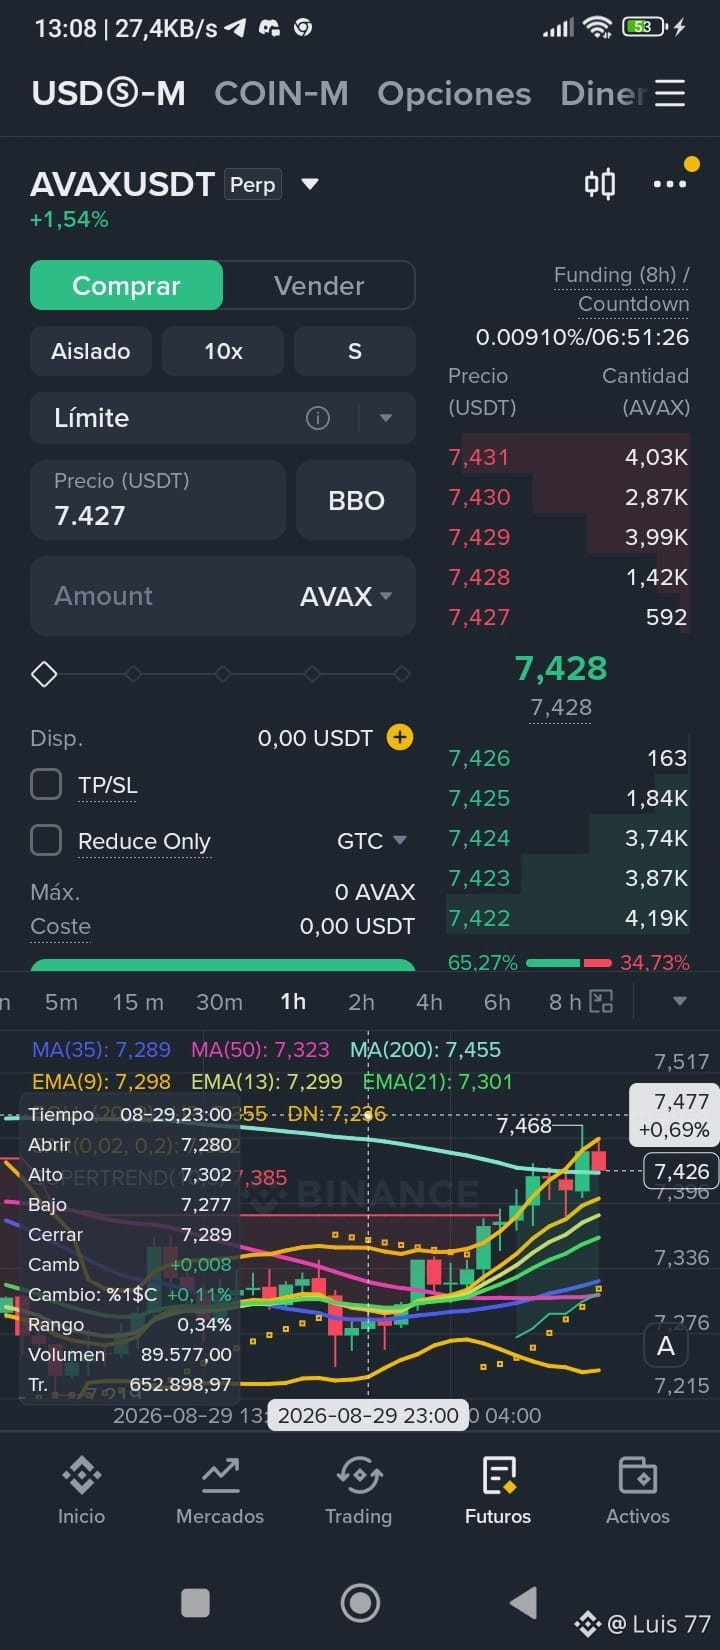
⚪ AVAX — CONSOLIDATION

Stuck to MA(50) at 7.427. Silent accumulation (CMF +0.16). Needs to break 7.50 to activate.

📍 Watch: 7.35-7.45
🎯 TP: 7.65-7.90
🛑 SL: 7.20

---

🟡 NEAR — FRAGILE RECOVERY

Supported by EMA(21): 1.852. Current price: 1.888. If BTC holds, target 1.96-2.05.

📍 Watch: 1.87-1.90
🎯 TP: 1.96-2.05
🛑 SL: 1.82

---

🟡 XLM — STEADY, NO MOMENTUM

Above EMA(21): 0.179. Price: 0.1816. Needs volume to break 0.185.

📍 Watch: 0.180-0.182
🎯 TP: 0.188-0.195
🛑 SL: 0.176

---

🎯 VERDICT

✅ EXECUTE DOT (50%) — The gem nobody saw.
🟡 WATCH AVAX, NEAR, XLM — Wait for confirmation.

---

⚠️ Zombie market = 50% size. Risk management is key.

Which one do you like most? Let me know in the comments 👇ACTIVT? EXECUTE? REASON

DOT ✅ EXECUTE NOW (50%) Broke MA(35/50), resistance at 0.885, confirms trend change
AVAX 🟡 WATCH Consolidating, but not breaking. Wait for 7.50+
NEAR 🟡 WATCH Supported by EMA(21), but needs a catalyst
XLM 🟡 WATCH Stable but no momentum. Wait for volume >RVOL 1.0x

#dot #AVAX #NEAR #XLM #LUIS77 #VenezuelaUSSign25YearOilDeal #TechnicalAnalysis #Crypto #Trading #Binance #GEMS #BTC #Altcoins
Best Chinese AI Company end of August?

Best Chinese AI Company end of August?

Alibaba64%Z.ai29%Tencent7%
Volume $172,766.59
Article
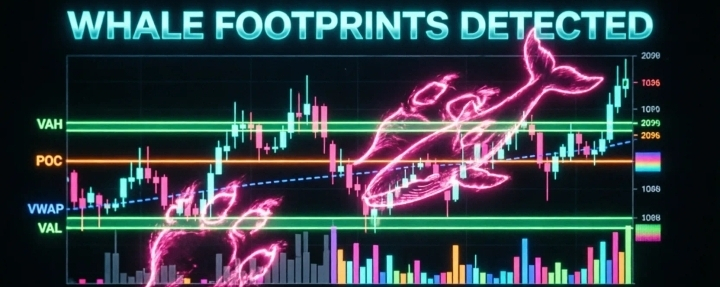
FOLLOWING THE WHALE TRACK 🫆🐋.🐋 Detecting Institutional Footprints: The Secret 95% Ignore Why does the price bounce at an invisible level? Why does it whip around just as you were about to enter? The answer is simple: the whales left their tracks and you didn’t see them. Institutions move billions and can’t hide their volume. The professional trader doesn’t guess direction with basic RSI; learn to read the footprints (tracks) of smart money. 🎯 The 4 Tracks of Institutional Value POC (Point of Control): The exact price where the most capital changed hands.

FOLLOWING THE WHALE TRACK 🫆🐋.

🐋 Detecting Institutional Footprints: The Secret 95% Ignore
Why does the price bounce at an invisible level? Why does it whip around just as you were about to enter? The answer is simple: the whales left their tracks and you didn’t see them.
Institutions move billions and can’t hide their volume. The professional trader doesn’t guess direction with basic RSI; learn to read the footprints (tracks) of smart money.
🎯 The 4 Tracks of Institutional Value
POC (Point of Control): The exact price where the most capital changed hands.
·
--
Bullish
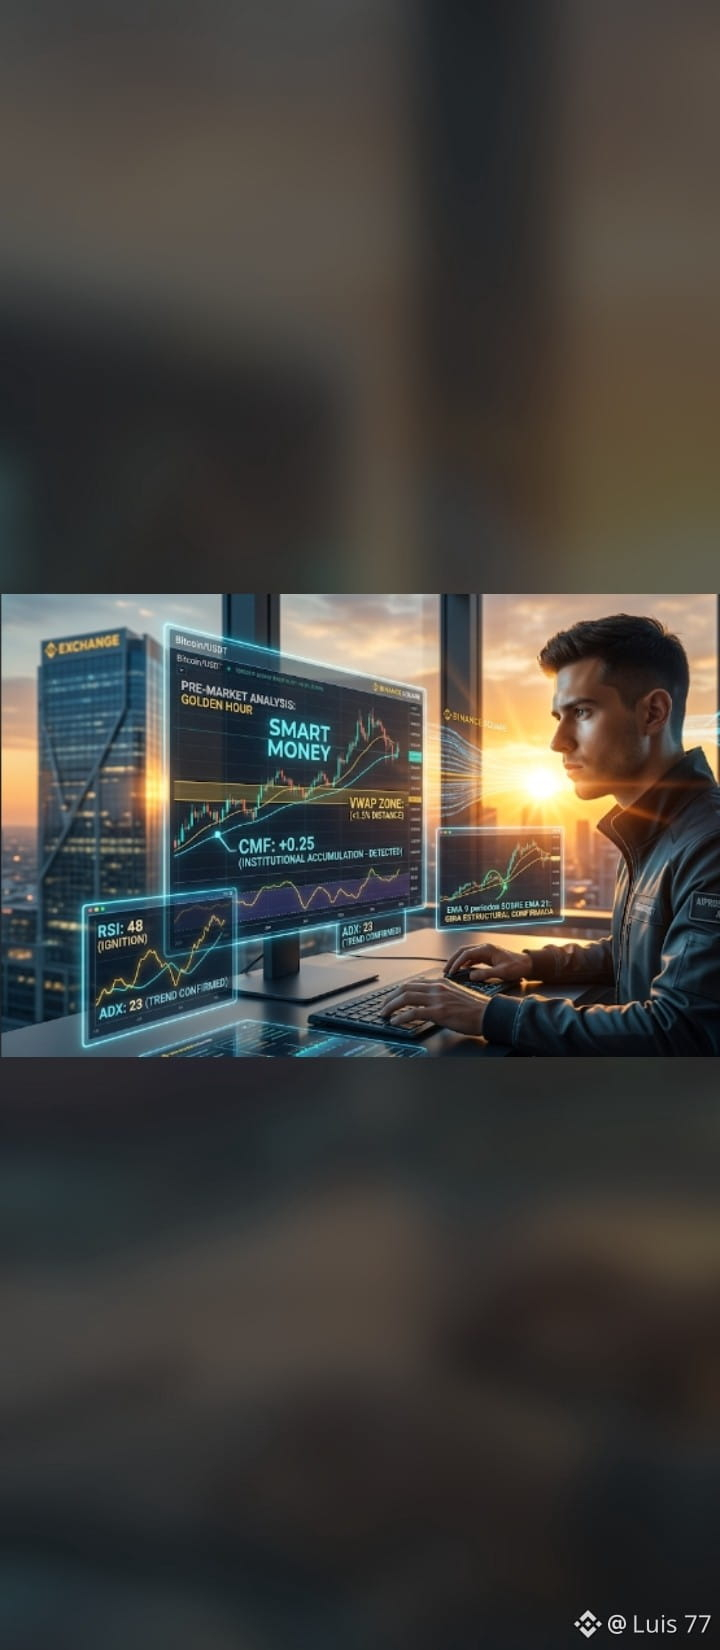
Are you losing money during the 'Golden Hour'? The secret of pre-opening analysis 🔥 Many traders make the same mistake: jumping in at the start of the heavy sessions —especially during the overlap with Wall Street— without a market read beforehand. Result: They get trapped in volatility, chase candlesticks, and end up trading with emotions. The Golden Hour isn't for guessing. It's for arriving with a plan. 1) Track institutional footprints 🐋 Before the open, volume usually leaves clues. A CMF greater than 0 suggests active accumulation, while the VWAP helps you detect whether the price is reasonably positioned or overly extended. A practical rule: if the asset is within 1.5% of the VWAP, the context tends to be cleaner. This reduces the risk of entering right into an inflated wick or a liquidity trap. 2) Identify the ignition zone 🎯 You don't want a tired asset; you want one ready to expand. That's why a useful RSI zone between 40 and 55 offers balance between momentum and room to run. If the ADX also exceeds 20, there's evidence of directional strength and not just market noise. 3) Wait for structural confirmation 🔄 This is where many fail due to impatience. Don't jump the gun. Let the structure confirm. A 9 EMA above the 21 EMA can act as a technical trigger to validate that the reversal has real intent. ADX measures trend strength. 4) Apply the macro filter 🌍 Before executing, check the overall context. For instance, observing ETH's relative strength against BTC can give you a key reading of risk appetite. Conclusion: the opening rewards preparation, not improvisation. If you do this analysis before volume explodes, you trade with much more clarity. 💬 Do you want me to post Part 2 with an exact entry, stop, and take profit template? #SpaceXPremarketFalls4.6% #BinanceSquare #LUIS77 #cryptotrading #VWAP $BTC {future}(SOLUSDT) {future}(BTCUSDT) {future}(PYTHUSDT)
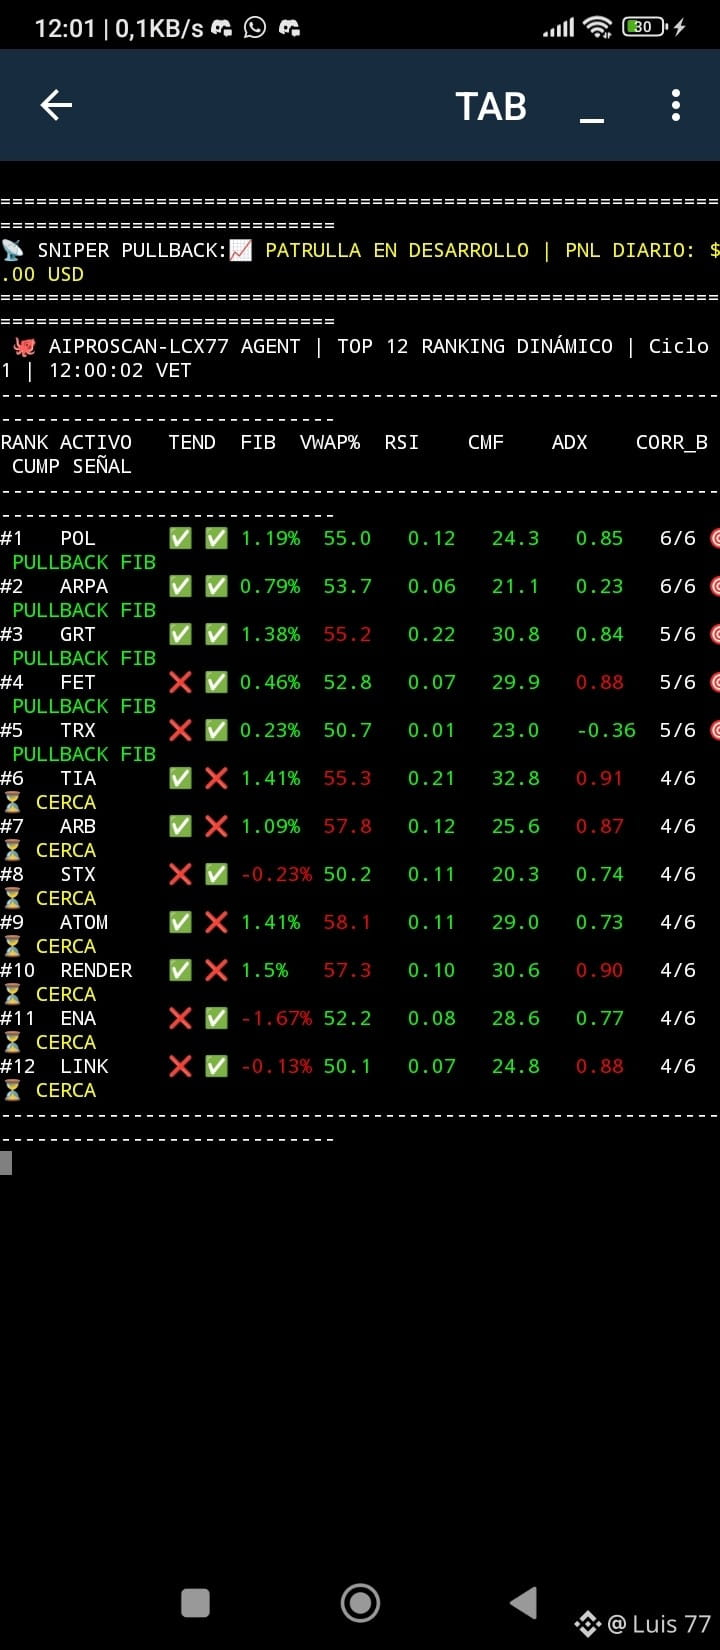
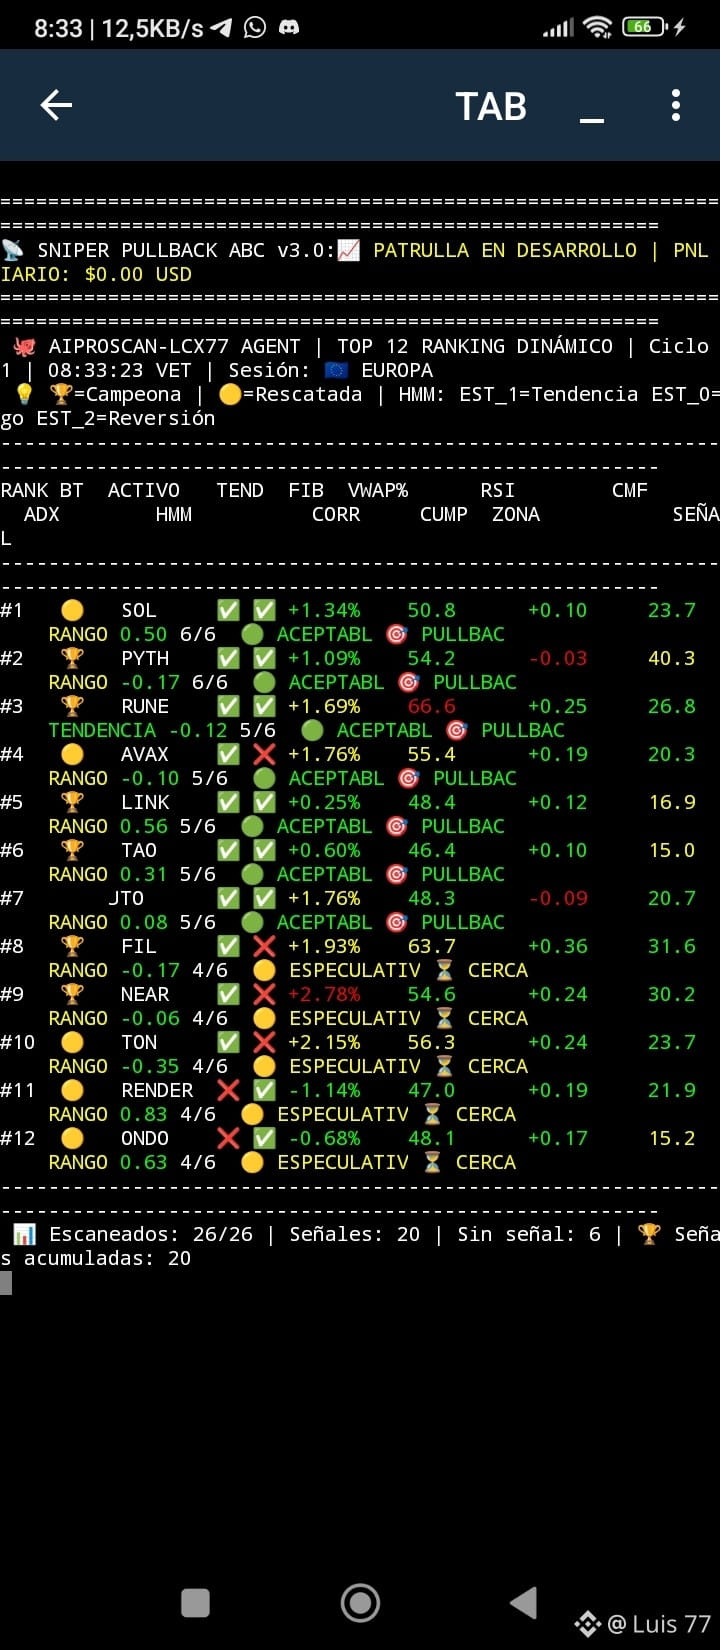
Are you losing money during the 'Golden Hour'? The secret of pre-opening analysis 🔥

Many traders make the same mistake: jumping in at the start of the heavy sessions —especially during the overlap with Wall Street— without a market read beforehand.

Result:
They get trapped in volatility, chase candlesticks, and end up trading with emotions.

The Golden Hour isn't for guessing. It's for arriving with a plan.

1) Track institutional footprints 🐋
Before the open, volume usually leaves clues.
A CMF greater than 0 suggests active accumulation, while the VWAP helps you detect whether the price is reasonably positioned or overly extended.

A practical rule:
if the asset is within 1.5% of the VWAP, the context tends to be cleaner. This reduces the risk of entering right into an inflated wick or a liquidity trap.

2) Identify the ignition zone 🎯
You don't want a tired asset; you want one ready to expand.
That's why a useful RSI zone between 40 and 55 offers balance between momentum and room to run.
If the ADX also exceeds 20, there's evidence of directional strength and not just market noise.

3) Wait for structural confirmation 🔄
This is where many fail due to impatience.
Don't jump the gun. Let the structure confirm.
A 9 EMA above the 21 EMA can act as a technical trigger to validate that the reversal has real intent. ADX measures trend strength.

4) Apply the macro filter 🌍
Before executing, check the overall context.
For instance, observing ETH's relative strength against BTC can give you a key reading of risk appetite.

Conclusion: the opening rewards preparation, not improvisation.
If you do this analysis before volume explodes, you trade with much more clarity.

💬 Do you want me to post Part 2 with an exact entry, stop, and take profit template?

#SpaceXPremarketFalls4.6% #BinanceSquare #LUIS77 #cryptotrading #VWAP $BTC
·
--
Bullish
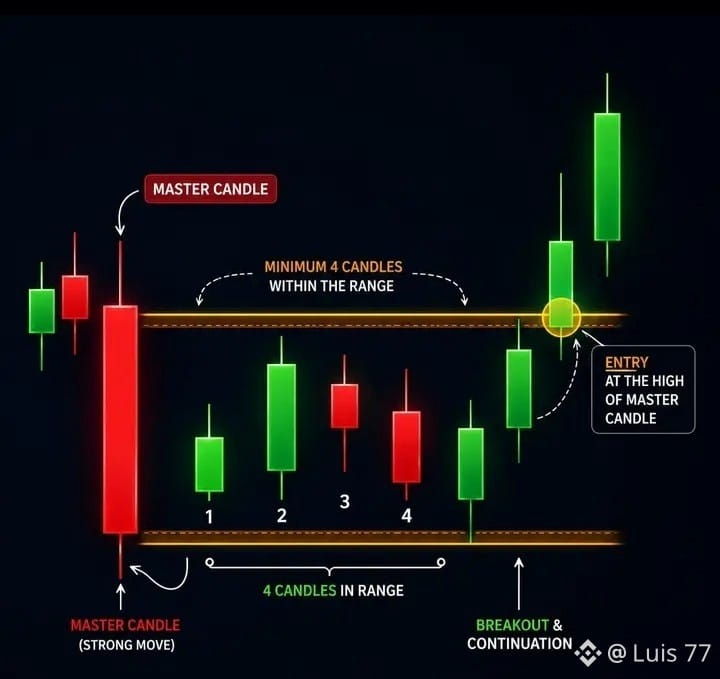
The trap that extracts the most money from retail: chasing breakouts without context 🚨   A breakout doesn’t always mean opportunity. Many times it means liquidity for someone else.   One of the most expensive mistakes in trading is buying a breakout just because price broke above resistance. Without context, that can be a perfect trap.   What filter do I use before trusting a breakout?   Strong ADX   Price holding above VWAP   Volume backing it up   Real close, not just a wick   Healthy prior structure, not overextended   If that’s missing, the breakout may just be a liquidity grab.   Warning sign:   If price breaks, but quickly comes back below VWAP and leaves a wick with rejection, be careful. That’s often a clue of distribution or a false expansion.   My rule: I don’t buy the breakout. I buy the validated breakout.   💬 If you want, tomorrow I’ll close this series with a complete framework for thinking like an institutional trader.   #Liquidity #Breakout #VWAP #TradebStocks #LUIS77 #AppleFalls6.1% {future}(BTCUSDT) {future}(OPUSDT) {future}(TAOUSDT)  
The trap that extracts the most money from retail: chasing breakouts without context 🚨

A breakout doesn’t always mean opportunity.
Many times it means liquidity for someone else.

One of the most expensive mistakes in trading is buying a breakout just because price broke above resistance.
Without context, that can be a perfect trap.

What filter do I use before trusting a breakout?

Strong ADX

Price holding above VWAP

Volume backing it up

Real close, not just a wick

Healthy prior structure, not overextended

If that’s missing, the breakout may just be a liquidity grab.

Warning sign:

If price breaks, but quickly comes back below VWAP and leaves a wick with rejection, be careful.
That’s often a clue of distribution or a false expansion.

My rule:
I don’t buy the breakout.
I buy the validated breakout.

💬 If you want, tomorrow I’ll close this series with a complete framework for thinking like an institutional trader.

#Liquidity #Breakout #VWAP #TradebStocks #LUIS77 #AppleFalls6.1%


·
--
Bullish
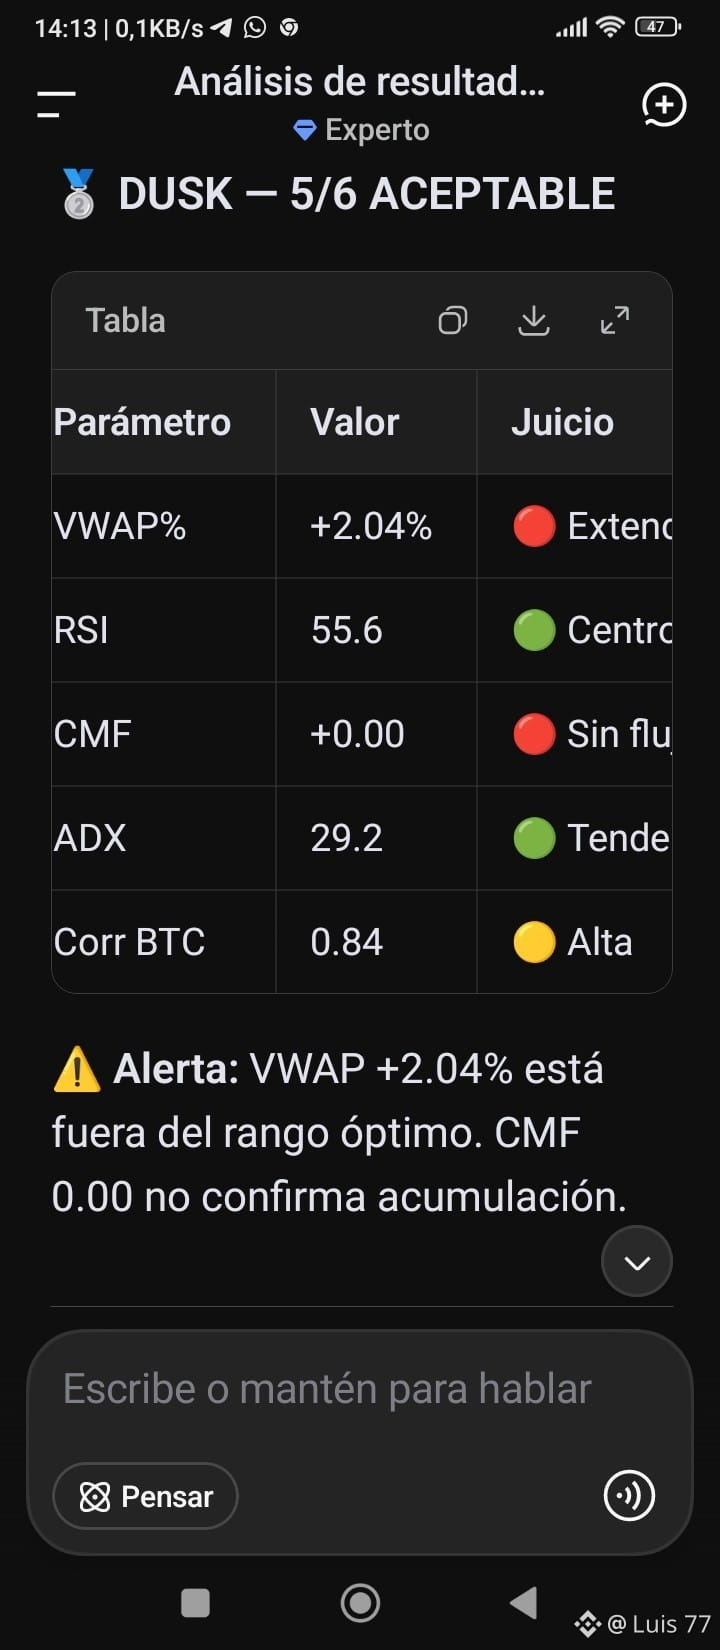
It's not enough to just see a moving average cross: here's how to validate a trade with VWAP and ADX 🔥: Many traders make a basic mistake: they see a moving average cross and jump in immediately, as if that alone confirms a trend. But in fast markets, a cross without validation can just be noise. If you want to trade with logic that's closer to institutional reading, you need confirmation of context, strength, and price position. This is where three key tools come into play: moving averages, VWAP, and ADX. 1) Moving Averages: the structure The averages don't predict; they organize price. When the EMA 9 crosses above the EMA 21, an early momentum signal appears. If the price also stays above the EMA 50, the structure gains strength. This helps distinguish between a weak bounce and a move with intention. 2) VWAP: the execution validator VWAP is a highly watched reference because it shows the volume-weighted average price. In simple terms: It helps know if the price is trading in an efficient zone or if it's too stretched out. For longs, the reading improves when: the price is above VWAP the asset is not excessively far from the VWAP there's a clean reaction near that reference This prevents entering late, chasing an inflated candlestick. 3) ADX: the strength filter The ADX doesn't tell you direction; it tells you if the trend has strength. An ADX above 20 already suggests directional intent. If it exceeds 25, the structure usually becomes more reliable. Conclusion A higher quality trade doesn't just come from a cross. It comes when the averages align the structure, the VWAP validates the price location, and the ADX confirms the strength of the move. That's transitioning from trading isolated signals to trading with context. 💬 If you want, in the next post I'll give you an exact entry template, stop loss, and confirmation on 1H. #VWAP #SpaceXPremarketFalls4.6% #BinanceSquare #BinanceToOpenXLMSpotTrading #LUIS77 $BTC {future}(TONUSDT) {future}(DUSKUSDT) {future}(BTCUSDT)
It's not enough to just see a moving average cross: here's how to validate a trade with VWAP and ADX 🔥:

Many traders make a basic mistake: they see a moving average cross and jump in immediately, as if that alone confirms a trend.
But in fast markets, a cross without validation can just be noise.

If you want to trade with logic that's closer to institutional reading, you need confirmation of context, strength, and price position. This is where three key tools come into play: moving averages, VWAP, and ADX.

1) Moving Averages: the structure

The averages don't predict; they organize price.
When the EMA 9 crosses above the EMA 21, an early momentum signal appears.
If the price also stays above the EMA 50, the structure gains strength. This helps distinguish between a weak bounce and a move with intention.

2) VWAP: the execution validator

VWAP is a highly watched reference because it shows the volume-weighted average price.

In simple terms:
It helps know if the price is trading in an efficient zone or if it's too stretched out.

For longs, the reading improves when:

the price is above VWAP

the asset is not excessively far from the VWAP

there's a clean reaction near that reference

This prevents entering late, chasing an inflated candlestick.

3) ADX: the strength filter

The ADX doesn't tell you direction; it tells you if the trend has strength.
An ADX above 20 already suggests directional intent.
If it exceeds 25, the structure usually becomes more reliable.

Conclusion

A higher quality trade doesn't just come from a cross.
It comes when the averages align the structure, the VWAP validates the price location, and the ADX confirms the strength of the move.

That's transitioning from trading isolated signals to trading with context.

💬 If you want, in the next post I'll give you an exact entry template, stop loss, and confirmation on 1H.

#VWAP #SpaceXPremarketFalls4.6% #BinanceSquare #BinanceToOpenXLMSpotTrading #LUIS77 $BTC


Article
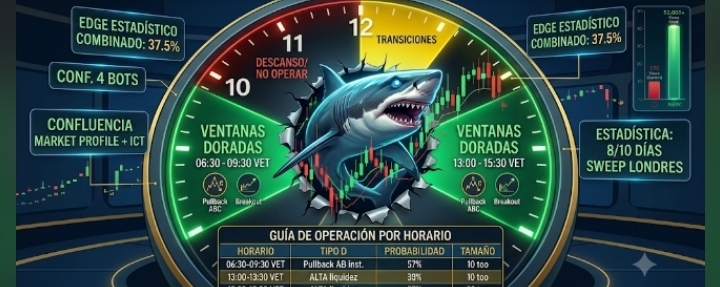
YOU’RE STILL A SLAVE TO THE CHART 📈 ???🔥 Golden Windows: When to Trade According to Statistics Do you feel like the market turns right after you enter? It’s not bad luck: it’s conditional probability. After analyzing +10,000 cycles on Binance (2023-2026), the IAS AIPROSCAN-LCX77 Multi-Agent Desk validated that 73% of high-edge opportunities happen in just 25% of the day. Trading outside these "Golden Windows" has an edge @ 2.6%. 🥇 Window 1: London Breaks Asia (06:30–09:30 VET) Edge: 29.4% Statistics: In 7/10 days, the Asia range is swept (03:00-06:00 VET). Reliability of 68% on envelopes after the sweep.

YOU’RE STILL A SLAVE TO THE CHART 📈 ???

🔥 Golden Windows: When to Trade According to Statistics
Do you feel like the market turns right after you enter? It’s not bad luck: it’s conditional probability. After analyzing +10,000 cycles on Binance (2023-2026), the IAS AIPROSCAN-LCX77 Multi-Agent Desk validated that 73% of high-edge opportunities happen in just 25% of the day. Trading outside these "Golden Windows" has an edge @ 2.6%.
🥇 Window 1: London Breaks Asia (06:30–09:30 VET)
Edge: 29.4%
Statistics: In 7/10 days, the Asia range is swept (03:00-06:00 VET). Reliability of 68% on envelopes after the sweep.
Log in to explore more content
Join global crypto users on Binance Square
⚡️ Get latest and useful information about crypto.
💬 Trusted by the world’s largest crypto exchange.
👍 Discover real insights from verified creators.
Email / Phone number