

#fvg
fvg
296,506 views
799 Discussing
Hot
Latest
·
--
Bullish
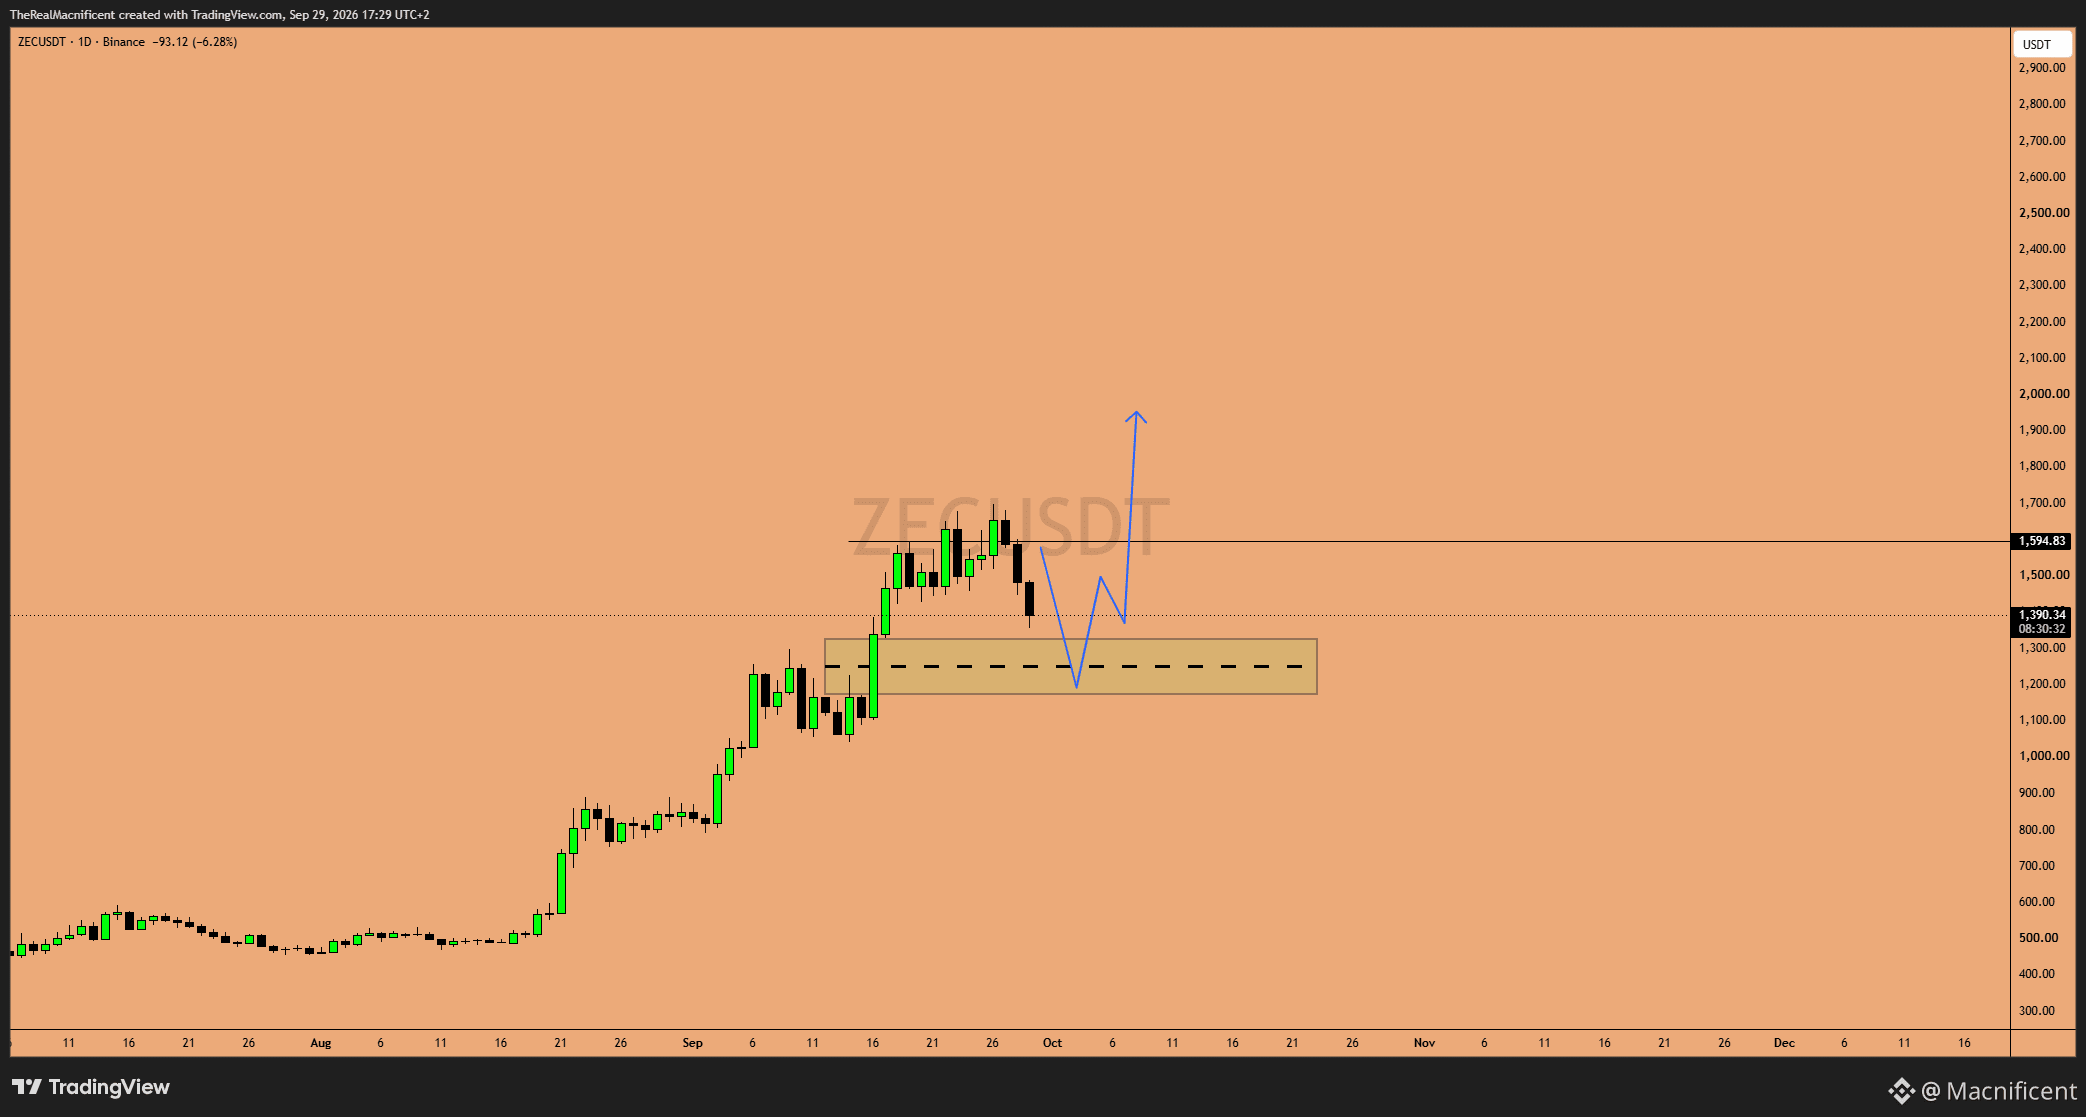
Everyone sleeping on $ZEC 👀
D1 FVG right here. –9% today.
This is exactly where I want to be long on the FVG equilibrium. Target: $1,700 Invalidation: lose $1,150
#DYOR. Not financial advice. #ZEC #Zcash #SmartMoney #FVG
{spot}(ZECUSDT)
Everyone sleeping on $ZEC 👀
D1 FVG right here. –9% today.
This is exactly where I want to be long on the FVG equilibrium. Target: $1,700 Invalidation: lose $1,150
#DYOR. Not financial advice. #ZEC #Zcash #SmartMoney #FVG
D1 FVG right here. –9% today.
This is exactly where I want to be long on the FVG equilibrium. Target: $1,700 Invalidation: lose $1,150
#DYOR. Not financial advice. #ZEC #Zcash #SmartMoney #FVG
253

·
--
Article
🚨 The Secret "Smart Money" Strategy Banks Don't Want You to Know! (FVG Explained) 🐋💰{stock_us}(GOOGL.US)
Are you tired of getting stopped out just before the market goes in your direction? That happens because retail traders look at trendlines, while algorithms and Smart Money look for Liquidity and Imbalances.
If you want to trade like the institutions, you need to master the Fair Value Gap (FVG). Consider this your ultimate smart forex and crypto blueprint! 🧠📈
🔍 What is a Fair Value Gap (FVG)?
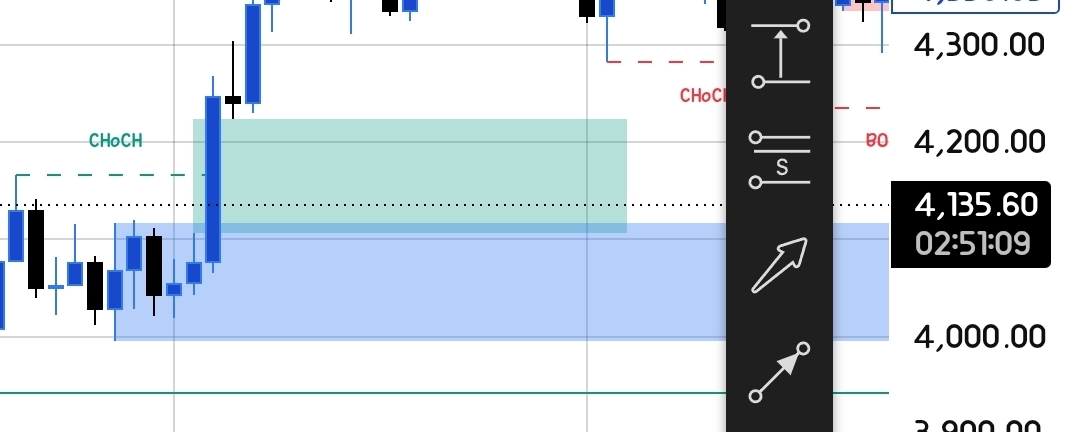
An FVG occurs when the market moves so fast in one direction that it creates an "imbalance" or a gap in the price delivery. The algorithms hate inefficiency, so price is almost always magnetically pulled back to "fill" this gap before continuing its true trend.
How to spot a Bullish FVG (The 3-Candle Rule):
Candle 1: A normal candle.
Candle 2: A massive, explosive bullish candle (Smart Money entering).
Candle 3: Another normal candle.
🎯 The FVG Zone: The empty space between the high wick of Candle 1 and the low wick of Candle 3.
(For a Bearish FVG, it is the gap between the low wick of Candle 1 and the high wick of Candle 3).
⚙️ How to Trade the FVG Strategy Like a Pro
If you trade highly volatile assets like Gold (XAU/USD) or major crypto pairs, you will see this setup happen every single day.
Step 1: Wait for a major Liquidity Sweep or a Change of Character (CHoCH).
Step 2: Identify the massive momentum candle that creates the FVG. Draw your zone precisely between the wicks.
Step 3: Do NOT chase the price! Place a limit order at the beginning of the FVG zone or an aligned Order Block.
Step 4: Put your Stop Loss just outside the FVG or below the Order Block. Target the next area of liquidity (previous high/low).
💡 Pro Tip: Not all FVGs are meant to be traded! Always look for FVGs that align with the higher timeframe trend and occur during high-volume sessions (like New York or London open).
👇 Do you use SMC and FVGs in your trading, or are you still trading retail patterns? Let me know below!
💬 Comment "CHEAT SHEET" and I will share my personal technical analysis PDF guide with you!
❤️ Like | 🔄 Share | 📑 Save this post to level up your charts!
#Write2Earn #FVG #SmartMoneyConcepts #ICT #CryptoTrading #ForexTrading #Bitcoin #TradingStrategy $GOOGL.US
🚨 The Secret "Smart Money" Strategy Banks Don't Want You to Know! (FVG Explained) 🐋💰
Are you tired of getting stopped out just before the market goes in your direction? That happens because retail traders look at trendlines, while algorithms and Smart Money look for Liquidity and Imbalances.
If you want to trade like the institutions, you need to master the Fair Value Gap (FVG). Consider this your ultimate smart forex and crypto blueprint! 🧠📈
🔍 What is a Fair Value Gap (FVG)?
An FVG occurs when the market moves so fast in one direction that it creates an "imbalance" or a gap in the price delivery. The algorithms hate inefficiency, so price is almost always magnetically pulled back to "fill" this gap before continuing its true trend.
How to spot a Bullish FVG (The 3-Candle Rule):
Candle 1: A normal candle.
Candle 2: A massive, explosive bullish candle (Smart Money entering).
Candle 3: Another normal candle.
🎯 The FVG Zone: The empty space between the high wick of Candle 1 and the low wick of Candle 3.
(For a Bearish FVG, it is the gap between the low wick of Candle 1 and the high wick of Candle 3).
⚙️ How to Trade the FVG Strategy Like a Pro
If you trade highly volatile assets like Gold (XAU/USD) or major crypto pairs, you will see this setup happen every single day.
Step 1: Wait for a major Liquidity Sweep or a Change of Character (CHoCH).
Step 2: Identify the massive momentum candle that creates the FVG. Draw your zone precisely between the wicks.
Step 3: Do NOT chase the price! Place a limit order at the beginning of the FVG zone or an aligned Order Block.
Step 4: Put your Stop Loss just outside the FVG or below the Order Block. Target the next area of liquidity (previous high/low).
💡 Pro Tip: Not all FVGs are meant to be traded! Always look for FVGs that align with the higher timeframe trend and occur during high-volume sessions (like New York or London open).
👇 Do you use SMC and FVGs in your trading, or are you still trading retail patterns? Let me know below!
💬 Comment "CHEAT SHEET" and I will share my personal technical analysis PDF guide with you!
❤️ Like | 🔄 Share | 📑 Save this post to level up your charts!
#Write2Earn #FVG #SmartMoneyConcepts #ICT #CryptoTrading #ForexTrading #Bitcoin #TradingStrategy $GOOGL.US
If you want to trade like the institutions, you need to master the Fair Value Gap (FVG). Consider this your ultimate smart forex and crypto blueprint! 🧠📈
🔍 What is a Fair Value Gap (FVG)?
An FVG occurs when the market moves so fast in one direction that it creates an "imbalance" or a gap in the price delivery. The algorithms hate inefficiency, so price is almost always magnetically pulled back to "fill" this gap before continuing its true trend.
How to spot a Bullish FVG (The 3-Candle Rule):
Candle 1: A normal candle.
Candle 2: A massive, explosive bullish candle (Smart Money entering).
Candle 3: Another normal candle.
🎯 The FVG Zone: The empty space between the high wick of Candle 1 and the low wick of Candle 3.
(For a Bearish FVG, it is the gap between the low wick of Candle 1 and the high wick of Candle 3).
⚙️ How to Trade the FVG Strategy Like a Pro
If you trade highly volatile assets like Gold (XAU/USD) or major crypto pairs, you will see this setup happen every single day.
Step 1: Wait for a major Liquidity Sweep or a Change of Character (CHoCH).
Step 2: Identify the massive momentum candle that creates the FVG. Draw your zone precisely between the wicks.
Step 3: Do NOT chase the price! Place a limit order at the beginning of the FVG zone or an aligned Order Block.
Step 4: Put your Stop Loss just outside the FVG or below the Order Block. Target the next area of liquidity (previous high/low).
💡 Pro Tip: Not all FVGs are meant to be traded! Always look for FVGs that align with the higher timeframe trend and occur during high-volume sessions (like New York or London open).
👇 Do you use SMC and FVGs in your trading, or are you still trading retail patterns? Let me know below!
💬 Comment "CHEAT SHEET" and I will share my personal technical analysis PDF guide with you!
❤️ Like | 🔄 Share | 📑 Save this post to level up your charts!
#Write2Earn #FVG #SmartMoneyConcepts #ICT #CryptoTrading #ForexTrading #Bitcoin #TradingStrategy $GOOGL.US
XAU-0.02%
GOOGLUS+1.33%
181
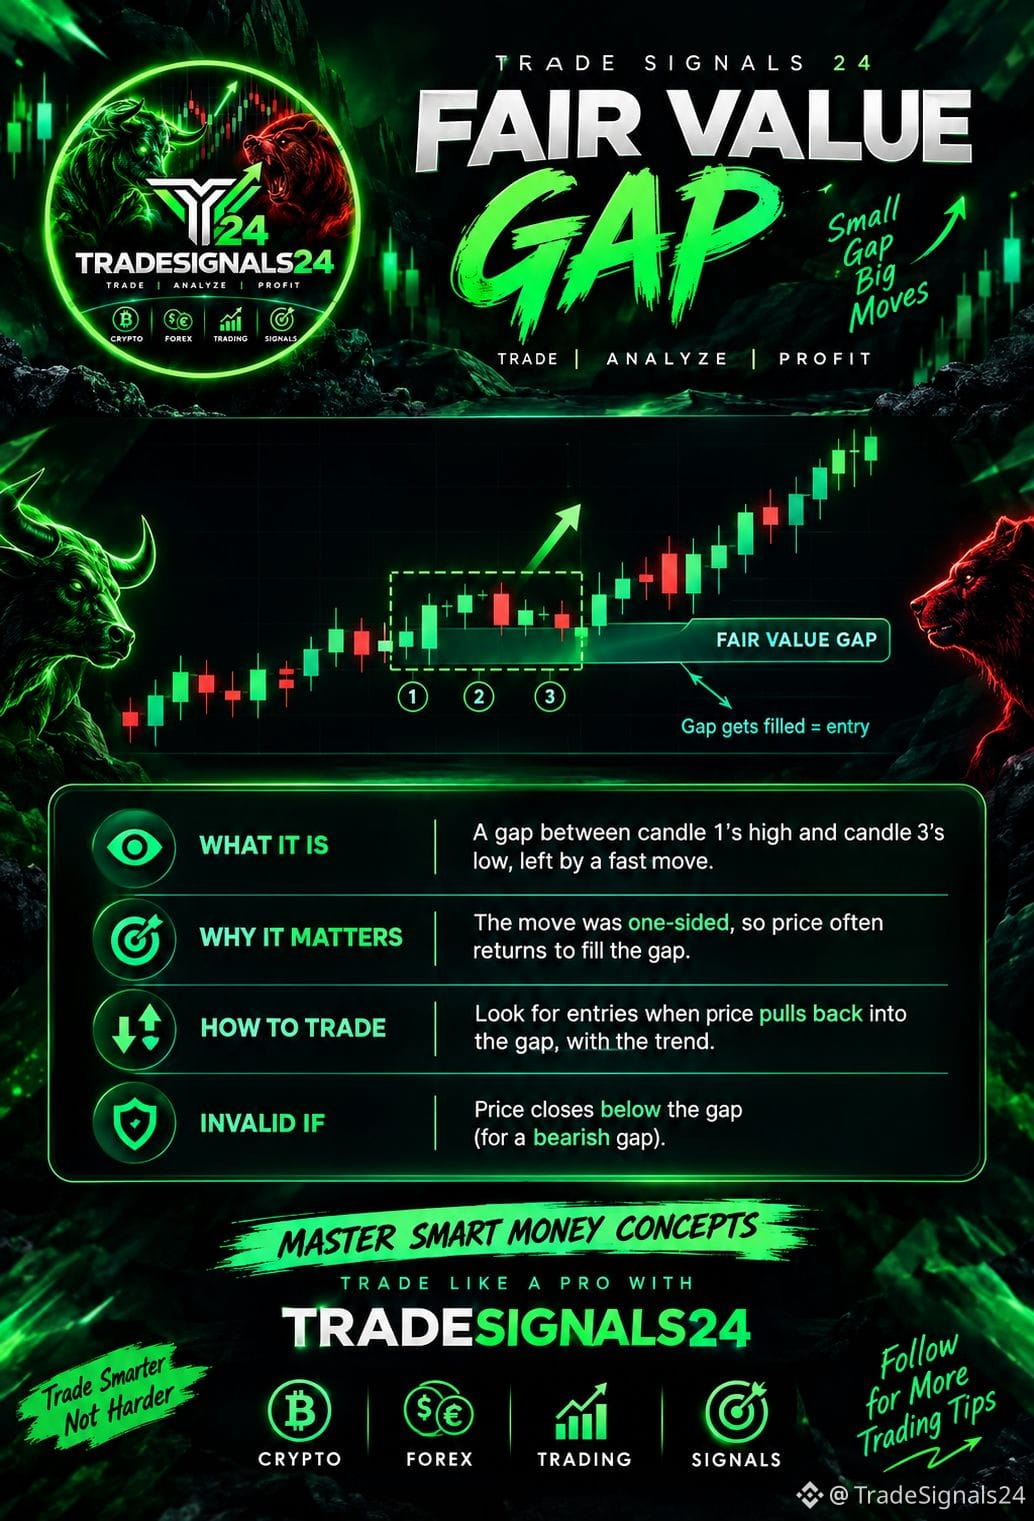
⚡ FAIR VALUE GAP (FVG) — SMART MONEY CONCEPT
Ever noticed price leaving a gap between 3 candles? 👀
That imbalance is called a Fair Value Gap (FVG) — often created when price moves aggressively in one direction.
🧠 Why it matters: Price may revisit this zone before continuing the move.
📈 Bullish FVG: Look for a pullback into the gap during an uptrend.
❌ Invalidation: A strong close below the bullish FVG can invalidate the setup.
📌 Save this post — you’ll want it when analyzing your next chart.
Trade • Analyze • Profit | TradeSignals24
#FVG #SmartMoneyConcepts #SMC #
⚡ FAIR VALUE GAP (FVG) — SMART MONEY CONCEPT
Ever noticed price leaving a gap between 3 candles? 👀
That imbalance is called a Fair Value Gap (FVG) — often created when price moves aggressively in one direction.
🧠 Why it matters: Price may revisit this zone before continuing the move.
📈 Bullish FVG: Look for a pullback into the gap during an uptrend.
❌ Invalidation: A strong close below the bullish FVG can invalidate the setup.
📌 Save this post — you’ll want it when analyzing your next chart.
Trade • Analyze • Profit | TradeSignals24
#FVG #SmartMoneyConcepts #SMC #
Ever noticed price leaving a gap between 3 candles? 👀
That imbalance is called a Fair Value Gap (FVG) — often created when price moves aggressively in one direction.
🧠 Why it matters: Price may revisit this zone before continuing the move.
📈 Bullish FVG: Look for a pullback into the gap during an uptrend.
❌ Invalidation: A strong close below the bullish FVG can invalidate the setup.
📌 Save this post — you’ll want it when analyzing your next chart.
Trade • Analyze • Profit | TradeSignals24
#FVG #SmartMoneyConcepts #SMC #
47


·
--
ETH rubbed $2,680 all day—it's not that it has no direction, it’s that the price is paying off debts.
Paying off what debt? Paying off the debt of the FVG.
Teaching point: FVG (fair value gap) is within three candlesticks—where the middle candle overreaches, leaving a genuine vacuum region with no trades between the high of the first candle and the low of the third candle. The market hates vacuum—gaps are very likely to be filled. This isn’t mysticism; it’s liquidity instinct: the ones who missed the move are waiting in the gap for a pullback to board the trade, while the ones who got trapped are waiting for the gap to give them a chance to get out. The agreed execution price between both sides sits right in that vacuum zone.
Look at today’s chart—textbook perfect: ETH daily FVG $2,650~$2,714, midpoint $2,682—current price $2,680, only $2 away from the “magnet.” Price stayed stuck to the magnet all day. BTC is even more classic: daily FVG $81,473~$85,080, midpoint $83,276, current price $84,165 about 1% above the midpoint. Every step above the midpoint, the magnet’s pull grows stronger.
Where do most people go wrong? Retail longs chase above the gap, afraid of missing out; the big players lay in wait below the midpoint, waiting for the magnet to bring price back. In the same area—one side is receiving orders, the other is preparing to distribute.
Trading takeaway—say it clearly: Don’t chase longs above $84k on BTC. The lower-long position is on the pullback $83,110~$83,443 (the FVG midpoint + the 1H order-block resonance zone). Accept the loss if there’s an effective break below $82,471. The overhead $85,837 short-squeeze stop-wall is not something to touch—that’s where the big players hunt.
ETH is the same: $2,667~$2,678 is stacking with a fresh 1H bullish order block. Magnet + order-block resonance—that’s the spot worth looking at, not “wherever it pumps, chase it.”
One sentence: FVG isn’t line-drawing art; it’s a liquidity coordinate. Above the midpoint, wait; below the midpoint, receive.
The trade you’re holding—are you buying into the vacuum zone, or chasing above the vacuum zone? Let’s talk in the comments.
Follow me for a live stream + SMC teaching every night at 21:00
🌿 Zhao surname, no disclosure | Not investment advice
#FVG #SMC #BTC
ETH rubbed $2,680 all day—it's not that it has no direction, it’s that the price is paying off debts.
Paying off what debt? Paying off the debt of the FVG.
Teaching point: FVG (fair value gap) is within three candlesticks—where the middle candle overreaches, leaving a genuine vacuum region with no trades between the high of the first candle and the low of the third candle. The market hates vacuum—gaps are very likely to be filled. This isn’t mysticism; it’s liquidity instinct: the ones who missed the move are waiting in the gap for a pullback to board the trade, while the ones who got trapped are waiting for the gap to give them a chance to get out. The agreed execution price between both sides sits right in that vacuum zone.
Look at today’s chart—textbook perfect: ETH daily FVG $2,650~$2,714, midpoint $2,682—current price $2,680, only $2 away from the “magnet.” Price stayed stuck to the magnet all day. BTC is even more classic: daily FVG $81,473~$85,080, midpoint $83,276, current price $84,165 about 1% above the midpoint. Every step above the midpoint, the magnet’s pull grows stronger.
Where do most people go wrong? Retail longs chase above the gap, afraid of missing out; the big players lay in wait below the midpoint, waiting for the magnet to bring price back. In the same area—one side is receiving orders, the other is preparing to distribute.
Trading takeaway—say it clearly: Don’t chase longs above $84k on BTC. The lower-long position is on the pullback $83,110~$83,443 (the FVG midpoint + the 1H order-block resonance zone). Accept the loss if there’s an effective break below $82,471. The overhead $85,837 short-squeeze stop-wall is not something to touch—that’s where the big players hunt.
ETH is the same: $2,667~$2,678 is stacking with a fresh 1H bullish order block. Magnet + order-block resonance—that’s the spot worth looking at, not “wherever it pumps, chase it.”
One sentence: FVG isn’t line-drawing art; it’s a liquidity coordinate. Above the midpoint, wait; below the midpoint, receive.
The trade you’re holding—are you buying into the vacuum zone, or chasing above the vacuum zone? Let’s talk in the comments.
Follow me for a live stream + SMC teaching every night at 21:00
🌿 Zhao surname, no disclosure | Not investment advice
#FVG #SMC #BTC
Paying off what debt? Paying off the debt of the FVG.
Teaching point: FVG (fair value gap) is within three candlesticks—where the middle candle overreaches, leaving a genuine vacuum region with no trades between the high of the first candle and the low of the third candle. The market hates vacuum—gaps are very likely to be filled. This isn’t mysticism; it’s liquidity instinct: the ones who missed the move are waiting in the gap for a pullback to board the trade, while the ones who got trapped are waiting for the gap to give them a chance to get out. The agreed execution price between both sides sits right in that vacuum zone.
Look at today’s chart—textbook perfect: ETH daily FVG $2,650~$2,714, midpoint $2,682—current price $2,680, only $2 away from the “magnet.” Price stayed stuck to the magnet all day. BTC is even more classic: daily FVG $81,473~$85,080, midpoint $83,276, current price $84,165 about 1% above the midpoint. Every step above the midpoint, the magnet’s pull grows stronger.
Where do most people go wrong? Retail longs chase above the gap, afraid of missing out; the big players lay in wait below the midpoint, waiting for the magnet to bring price back. In the same area—one side is receiving orders, the other is preparing to distribute.
Trading takeaway—say it clearly: Don’t chase longs above $84k on BTC. The lower-long position is on the pullback $83,110~$83,443 (the FVG midpoint + the 1H order-block resonance zone). Accept the loss if there’s an effective break below $82,471. The overhead $85,837 short-squeeze stop-wall is not something to touch—that’s where the big players hunt.
ETH is the same: $2,667~$2,678 is stacking with a fresh 1H bullish order block. Magnet + order-block resonance—that’s the spot worth looking at, not “wherever it pumps, chase it.”
One sentence: FVG isn’t line-drawing art; it’s a liquidity coordinate. Above the midpoint, wait; below the midpoint, receive.
The trade you’re holding—are you buying into the vacuum zone, or chasing above the vacuum zone? Let’s talk in the comments.
Follow me for a live stream + SMC teaching every night at 21:00
🌿 Zhao surname, no disclosure | Not investment advice
#FVG #SMC #BTC
1
1.3k
·
--
FVG fair value gap—most people misuse this indicator
I’ve seen too many people use FVG as support/resistance. Open the chart, spot a gap, draw a line—when price reaches it, go long. What happens then? You get swept with an intraday spike and stop-out, the gap never gets filled, and the trade is gone.
The problem isn’t FVG. The problem is that you only saw its shape—you didn’t understand its behavior.
━━━ The three most common misconceptions ━━━
Mistake 1: All gaps get filled
This is a beginner-level misunderstanding. The essence of an FVG is a liquidity vacuum—within a certain price range, there aren’t enough buy/sell matching orders, leaving a void. But the market is under no obligation to come back and fill that void. Some FVGs get filled in the next liquidity cycle, while others stay pinned there until the structure fully reverses.
If you trade with “the gap must be filled,” you’ve probably already lost most of your money.
Mistake 2: The midpoint of the FVG is the support level
This is a more common error. An FVG has three lines: the upper bound, the midpoint, and the lower bound. Most people only look at the midpoint and treat it as the support or resistance.
But in reality, the midpoint is the weakest position within that range—it’s the thinnest place for liquidity. When price reaches the midpoint, it’s not “getting supported.” It pauses temporarily due to a lack of opposing orders. Once new liquidity is injected, price will punch straight through.
Mistake 3: Using the FVG by itself
FVG is a dimension, not a complete system. It needs to be read together with Order Blocks, the liquidation map, and GEX. Trading by only looking at FVG is like playing only one card in poker.
━━━ Data reveals the truth ━━━
We ran systematic backtests on 6.5 years of historical data. The conclusion is straightforward:
The probability of an FVG being filled is negatively correlated with its age. Of the FVGs that were filled within the first 20 candles after forming, 68% were filled. For FVGs that went more than 50 candles without being filled, the fill probability drops to 23%. In other words, “fresh” FVGs are the real magnets; older FVGs are likely already invalid.
Each of the three FVG lines has its own job:
• Upper bound: the invalidation boundary. A break above the upper bound = the FVG structure is void
• Midpoint: the strongest magnet zone. Market makers tend to pull price to the midpoint to complete hedging
• Lower bound: the support/resistance flip zone. After the gap is filled, the lower bound becomes the anchor of the new structure
━━━ The correct approach ━━━
Step 1: Determine the direction of the FVG. Bull FVG (upward gap) has its magnet pointing upward; Bear FVG (downward gap) has its magnet pointing downward. This isn’t the concept of “support and resistance”—it’s the magnet’s direction.
Step 2: Validate effectiveness. Only FVGs that have not been traversed within 50 candles after formation are valid. If price already pierced through the FVG, that FVG is invalid and shouldn’t be used as a trade basis.
Step 3: Find confluence. One FVG alone isn’t enough. You need overlap of: the FVG midpoint + an effective Order Block + a liquidation-dense area. That’s what we call the “confluence point.” Only when 7 dimensions point to the same direction is the signal worth acting on.
Step 4: Place your stop loss outside the structure. For shorts, put the stop loss above the FVG upper bound; for longs, put it below the lower bound. Not because of some “technical level,” but because when those positions are broken, it means the FVG structure has already been invalidated—your trading rationale no longer exists.
━━━ Real-world example ━━━
Let’s use the most recent BTC move as an example. Around 85,500, price formed a Bull FVG. The lower bound of the range was 83,800; the midpoint was 84,600; and the upper bound was 85,400. Most people saw the “gap” at 84,600 and placed longs there. The result? Price first stabbed down to 83,800 to sweep the stop losses from the support pool, then rebounded.
That’s the market maker’s standard operation: pull price to the FVG magnet zone to complete hedging—but before that, hunt for liquidity below.
The correct approach would be: place longs near the support pool at 83,800, with a stop loss at 81,400 (below the FVG lower bound), and wait for price to get pulled back by the magnet. The short “stop-loss wall” at 87,200 follows the same logic—right-side GEX wall provides the safety net, and market makers will help hold it.
Remember this: an FVG doesn’t tell you where price will go—it tells you where market makers want to pull price. You should stand on the same side as the market maker, not fight against them.
#FVG #SMC #交易思维
FVG fair value gap—most people misuse this indicator
I’ve seen too many people use FVG as support/resistance. Open the chart, spot a gap, draw a line—when price reaches it, go long. What happens then? You get swept with an intraday spike and stop-out, the gap never gets filled, and the trade is gone.
The problem isn’t FVG. The problem is that you only saw its shape—you didn’t understand its behavior.
━━━ The three most common misconceptions ━━━
Mistake 1: All gaps get filled
This is a beginner-level misunderstanding. The essence of an FVG is a liquidity vacuum—within a certain price range, there aren’t enough buy/sell matching orders, leaving a void. But the market is under no obligation to come back and fill that void. Some FVGs get filled in the next liquidity cycle, while others stay pinned there until the structure fully reverses.
If you trade with “the gap must be filled,” you’ve probably already lost most of your money.
Mistake 2: The midpoint of the FVG is the support level
This is a more common error. An FVG has three lines: the upper bound, the midpoint, and the lower bound. Most people only look at the midpoint and treat it as the support or resistance.
But in reality, the midpoint is the weakest position within that range—it’s the thinnest place for liquidity. When price reaches the midpoint, it’s not “getting supported.” It pauses temporarily due to a lack of opposing orders. Once new liquidity is injected, price will punch straight through.
Mistake 3: Using the FVG by itself
FVG is a dimension, not a complete system. It needs to be read together with Order Blocks, the liquidation map, and GEX. Trading by only looking at FVG is like playing only one card in poker.
━━━ Data reveals the truth ━━━
We ran systematic backtests on 6.5 years of historical data. The conclusion is straightforward:
The probability of an FVG being filled is negatively correlated with its age. Of the FVGs that were filled within the first 20 candles after forming, 68% were filled. For FVGs that went more than 50 candles without being filled, the fill probability drops to 23%. In other words, “fresh” FVGs are the real magnets; older FVGs are likely already invalid.
Each of the three FVG lines has its own job:
• Upper bound: the invalidation boundary. A break above the upper bound = the FVG structure is void
• Midpoint: the strongest magnet zone. Market makers tend to pull price to the midpoint to complete hedging
• Lower bound: the support/resistance flip zone. After the gap is filled, the lower bound becomes the anchor of the new structure
━━━ The correct approach ━━━
Step 1: Determine the direction of the FVG. Bull FVG (upward gap) has its magnet pointing upward; Bear FVG (downward gap) has its magnet pointing downward. This isn’t the concept of “support and resistance”—it’s the magnet’s direction.
Step 2: Validate effectiveness. Only FVGs that have not been traversed within 50 candles after formation are valid. If price already pierced through the FVG, that FVG is invalid and shouldn’t be used as a trade basis.
Step 3: Find confluence. One FVG alone isn’t enough. You need overlap of: the FVG midpoint + an effective Order Block + a liquidation-dense area. That’s what we call the “confluence point.” Only when 7 dimensions point to the same direction is the signal worth acting on.
Step 4: Place your stop loss outside the structure. For shorts, put the stop loss above the FVG upper bound; for longs, put it below the lower bound. Not because of some “technical level,” but because when those positions are broken, it means the FVG structure has already been invalidated—your trading rationale no longer exists.
━━━ Real-world example ━━━
Let’s use the most recent BTC move as an example. Around 85,500, price formed a Bull FVG. The lower bound of the range was 83,800; the midpoint was 84,600; and the upper bound was 85,400. Most people saw the “gap” at 84,600 and placed longs there. The result? Price first stabbed down to 83,800 to sweep the stop losses from the support pool, then rebounded.
That’s the market maker’s standard operation: pull price to the FVG magnet zone to complete hedging—but before that, hunt for liquidity below.
The correct approach would be: place longs near the support pool at 83,800, with a stop loss at 81,400 (below the FVG lower bound), and wait for price to get pulled back by the magnet. The short “stop-loss wall” at 87,200 follows the same logic—right-side GEX wall provides the safety net, and market makers will help hold it.
Remember this: an FVG doesn’t tell you where price will go—it tells you where market makers want to pull price. You should stand on the same side as the market maker, not fight against them.
#FVG #SMC #交易思维
I’ve seen too many people use FVG as support/resistance. Open the chart, spot a gap, draw a line—when price reaches it, go long. What happens then? You get swept with an intraday spike and stop-out, the gap never gets filled, and the trade is gone.
The problem isn’t FVG. The problem is that you only saw its shape—you didn’t understand its behavior.
━━━ The three most common misconceptions ━━━
Mistake 1: All gaps get filled
This is a beginner-level misunderstanding. The essence of an FVG is a liquidity vacuum—within a certain price range, there aren’t enough buy/sell matching orders, leaving a void. But the market is under no obligation to come back and fill that void. Some FVGs get filled in the next liquidity cycle, while others stay pinned there until the structure fully reverses.
If you trade with “the gap must be filled,” you’ve probably already lost most of your money.
Mistake 2: The midpoint of the FVG is the support level
This is a more common error. An FVG has three lines: the upper bound, the midpoint, and the lower bound. Most people only look at the midpoint and treat it as the support or resistance.
But in reality, the midpoint is the weakest position within that range—it’s the thinnest place for liquidity. When price reaches the midpoint, it’s not “getting supported.” It pauses temporarily due to a lack of opposing orders. Once new liquidity is injected, price will punch straight through.
Mistake 3: Using the FVG by itself
FVG is a dimension, not a complete system. It needs to be read together with Order Blocks, the liquidation map, and GEX. Trading by only looking at FVG is like playing only one card in poker.
━━━ Data reveals the truth ━━━
We ran systematic backtests on 6.5 years of historical data. The conclusion is straightforward:
The probability of an FVG being filled is negatively correlated with its age. Of the FVGs that were filled within the first 20 candles after forming, 68% were filled. For FVGs that went more than 50 candles without being filled, the fill probability drops to 23%. In other words, “fresh” FVGs are the real magnets; older FVGs are likely already invalid.
Each of the three FVG lines has its own job:
• Upper bound: the invalidation boundary. A break above the upper bound = the FVG structure is void
• Midpoint: the strongest magnet zone. Market makers tend to pull price to the midpoint to complete hedging
• Lower bound: the support/resistance flip zone. After the gap is filled, the lower bound becomes the anchor of the new structure
━━━ The correct approach ━━━
Step 1: Determine the direction of the FVG. Bull FVG (upward gap) has its magnet pointing upward; Bear FVG (downward gap) has its magnet pointing downward. This isn’t the concept of “support and resistance”—it’s the magnet’s direction.
Step 2: Validate effectiveness. Only FVGs that have not been traversed within 50 candles after formation are valid. If price already pierced through the FVG, that FVG is invalid and shouldn’t be used as a trade basis.
Step 3: Find confluence. One FVG alone isn’t enough. You need overlap of: the FVG midpoint + an effective Order Block + a liquidation-dense area. That’s what we call the “confluence point.” Only when 7 dimensions point to the same direction is the signal worth acting on.
Step 4: Place your stop loss outside the structure. For shorts, put the stop loss above the FVG upper bound; for longs, put it below the lower bound. Not because of some “technical level,” but because when those positions are broken, it means the FVG structure has already been invalidated—your trading rationale no longer exists.
━━━ Real-world example ━━━
Let’s use the most recent BTC move as an example. Around 85,500, price formed a Bull FVG. The lower bound of the range was 83,800; the midpoint was 84,600; and the upper bound was 85,400. Most people saw the “gap” at 84,600 and placed longs there. The result? Price first stabbed down to 83,800 to sweep the stop losses from the support pool, then rebounded.
That’s the market maker’s standard operation: pull price to the FVG magnet zone to complete hedging—but before that, hunt for liquidity below.
The correct approach would be: place longs near the support pool at 83,800, with a stop loss at 81,400 (below the FVG lower bound), and wait for price to get pulled back by the magnet. The short “stop-loss wall” at 87,200 follows the same logic—right-side GEX wall provides the safety net, and market makers will help hold it.
Remember this: an FVG doesn’t tell you where price will go—it tells you where market makers want to pull price. You should stand on the same side as the market maker, not fight against them.
#FVG #SMC #交易思维
2
587

·
--
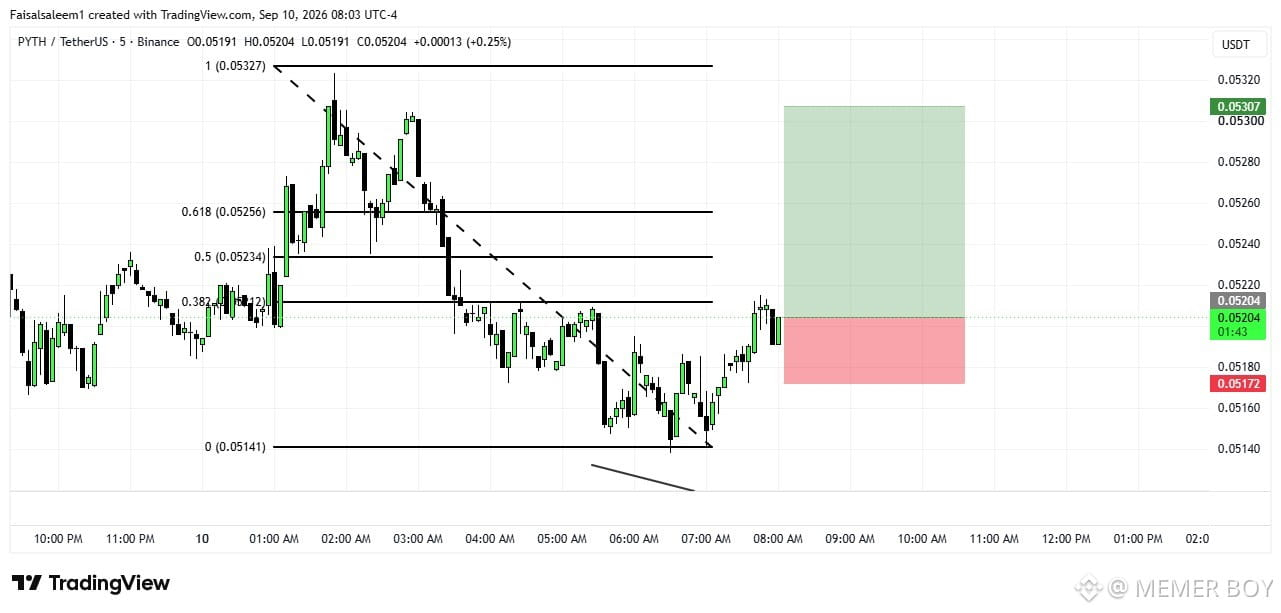
📉 **PYTHUSDT —
Price is showing **bullish divergence** 👀
If the setup plays out, I’m watching the **bearish FVG** as the potential target 🎯
Divergence is there… now we need confirmation.
**Let’s see if price comes back to fill the FVG. 👀**
What do you guys think — **reversal or continuation?** 🤔
#PYTH #PYTHUSDT #Crypto #Trading #TechnicalAnalysis #Divergence #FVG
📉 **PYTHUSDT —
Price is showing **bullish divergence** 👀
If the setup plays out, I’m watching the **bearish FVG** as the potential target 🎯
Divergence is there… now we need confirmation.
**Let’s see if price comes back to fill the FVG. 👀**
What do you guys think — **reversal or continuation?** 🤔
#PYTH #PYTHUSDT #Crypto #Trading #TechnicalAnalysis #Divergence #FVG
Price is showing **bullish divergence** 👀
If the setup plays out, I’m watching the **bearish FVG** as the potential target 🎯
Divergence is there… now we need confirmation.
**Let’s see if price comes back to fill the FVG. 👀**
What do you guys think — **reversal or continuation?** 🤔
#PYTH #PYTHUSDT #Crypto #Trading #TechnicalAnalysis #Divergence #FVG
158

·
--
Bullish
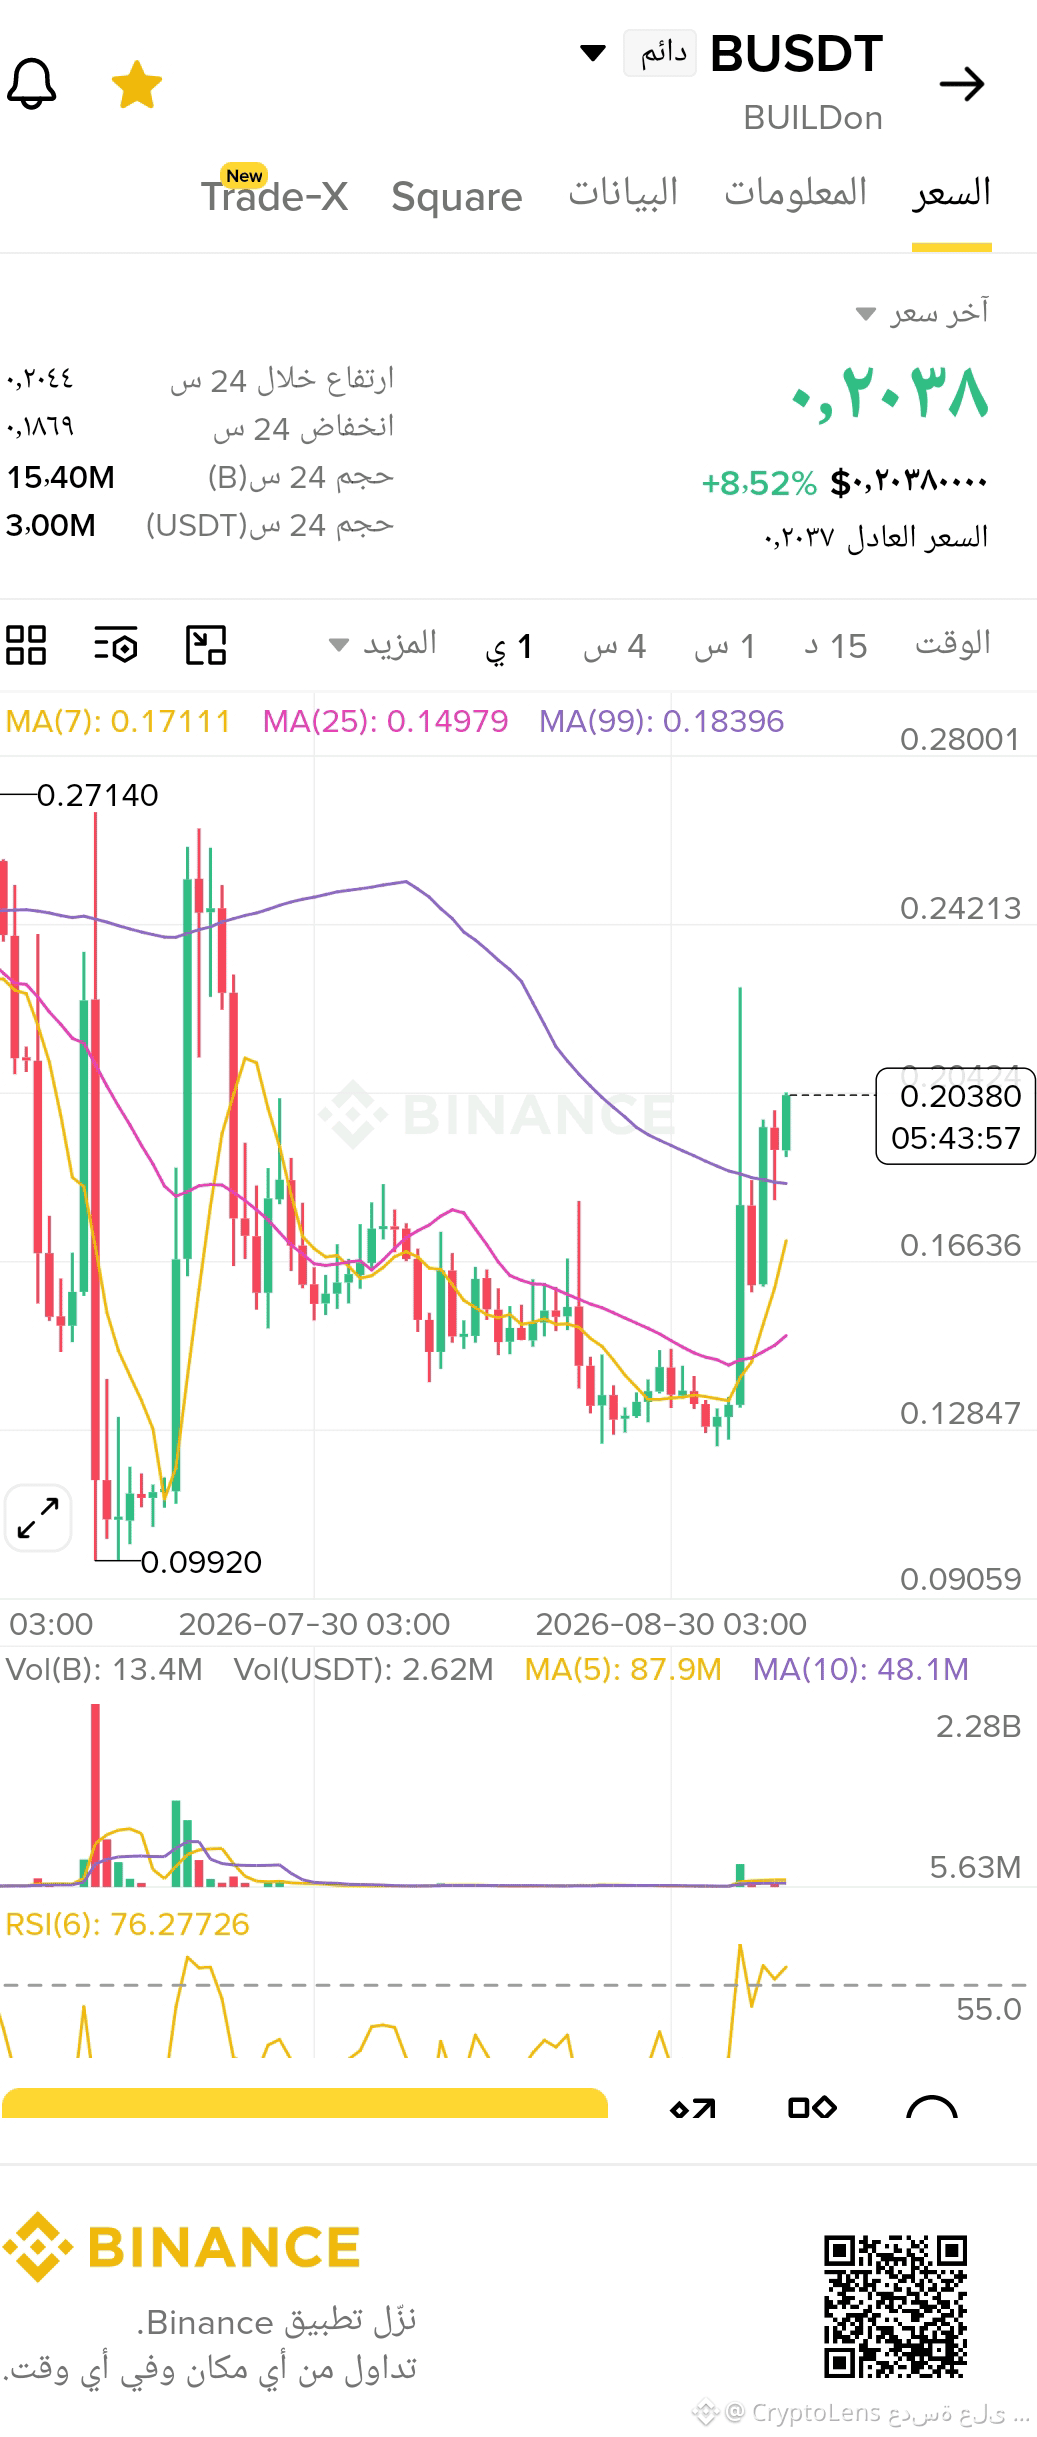
📌 $B | The Upside Scenario💵💸🔥🔥
The $0.15–$0.17 zone is an important FVG area and could be an attractive buy zone.
As long as $0.095 remains intact and has not been broken by a clear closing, the larger bullish scenario remains valid.
🚀 Key levels:
- Entry: $0.15–$0.20
- TP1: $0.26
- TP2: $0.35
- TP3: $0.50
- SL: $0.095
Reclaiming the $0.22–$0.26 zone could be a sign of a strong return of momentum.
🎯 Main target: $0.50
Based on the entry price, this could represent a significant move exceeding +140%.
Risk management is important — use a stop-loss and don’t risk more than you can afford.
#B #Crypto #Trading #FVG #OilRisesToHighestSinceJuly
{alpha}(560x6bdcce4a559076e37755a78ce0c06214e59e4444)
📌 $B | The Upside Scenario💵💸🔥🔥
The $0.15–$0.17 zone is an important FVG area and could be an attractive buy zone.
As long as $0.095 remains intact and has not been broken by a clear closing, the larger bullish scenario remains valid.
🚀 Key levels:
- Entry: $0.15–$0.20
- TP1: $0.26
- TP2: $0.35
- TP3: $0.50
- SL: $0.095
Reclaiming the $0.22–$0.26 zone could be a sign of a strong return of momentum.
🎯 Main target: $0.50
Based on the entry price, this could represent a significant move exceeding +140%.
Risk management is important — use a stop-loss and don’t risk more than you can afford.
#B #Crypto #Trading #FVG #OilRisesToHighestSinceJuly
The $0.15–$0.17 zone is an important FVG area and could be an attractive buy zone.
As long as $0.095 remains intact and has not been broken by a clear closing, the larger bullish scenario remains valid.
🚀 Key levels:
- Entry: $0.15–$0.20
- TP1: $0.26
- TP2: $0.35
- TP3: $0.50
- SL: $0.095
Reclaiming the $0.22–$0.26 zone could be a sign of a strong return of momentum.
🎯 Main target: $0.50
Based on the entry price, this could represent a significant move exceeding +140%.
Risk management is important — use a stop-loss and don’t risk more than you can afford.
#B #Crypto #Trading #FVG #OilRisesToHighestSinceJuly
1
39

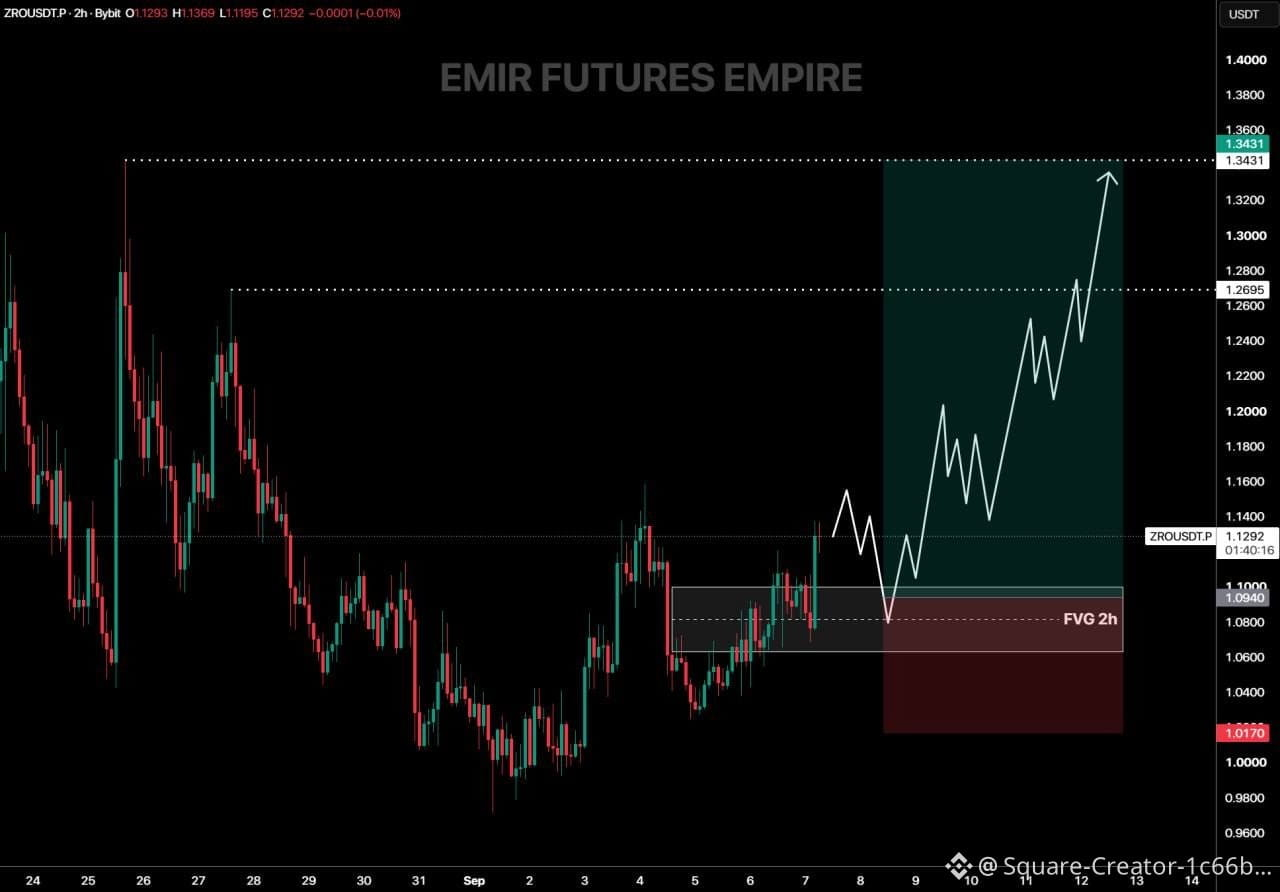
📈 LayerZero (ZRO) — Technical Overview
ZRO breaks through the Fair Value Gap (FVG) value gap zone on the 2-hour chart, located between $1.0630 and $1.1000, in line with the bullish trend.
If the price maintains trading above this zone during any upcoming pullback, the positive momentum may remain intact. However, if it falls back below it, the chances of choppiness or weakening of the upward move increase.
The area the market is watching above is the liquidity accumulated above previous highs near $1.3400. 👀
$ZRO
{future}(ZROUSDT)
#LayerZero #ZRO #CryptoAnalysis #TechnicalAnalysis #FVG #Liquidity #Altcoins #CryptoMarket #Layer_Zero #Technical_Analysis #Crypto #Liquidity
📈 LayerZero (ZRO) — Technical Overview
ZRO breaks through the Fair Value Gap (FVG) value gap zone on the 2-hour chart, located between $1.0630 and $1.1000, in line with the bullish trend.
If the price maintains trading above this zone during any upcoming pullback, the positive momentum may remain intact. However, if it falls back below it, the chances of choppiness or weakening of the upward move increase.
The area the market is watching above is the liquidity accumulated above previous highs near $1.3400. 👀
$ZRO
#LayerZero #ZRO #CryptoAnalysis #TechnicalAnalysis #FVG #Liquidity #Altcoins #CryptoMarket #Layer_Zero #Technical_Analysis #Crypto #Liquidity
ZRO breaks through the Fair Value Gap (FVG) value gap zone on the 2-hour chart, located between $1.0630 and $1.1000, in line with the bullish trend.
If the price maintains trading above this zone during any upcoming pullback, the positive momentum may remain intact. However, if it falls back below it, the chances of choppiness or weakening of the upward move increase.
The area the market is watching above is the liquidity accumulated above previous highs near $1.3400. 👀
$ZRO
#LayerZero #ZRO #CryptoAnalysis #TechnicalAnalysis #FVG #Liquidity #Altcoins #CryptoMarket #Layer_Zero #Technical_Analysis #Crypto #Liquidity
88

·
--
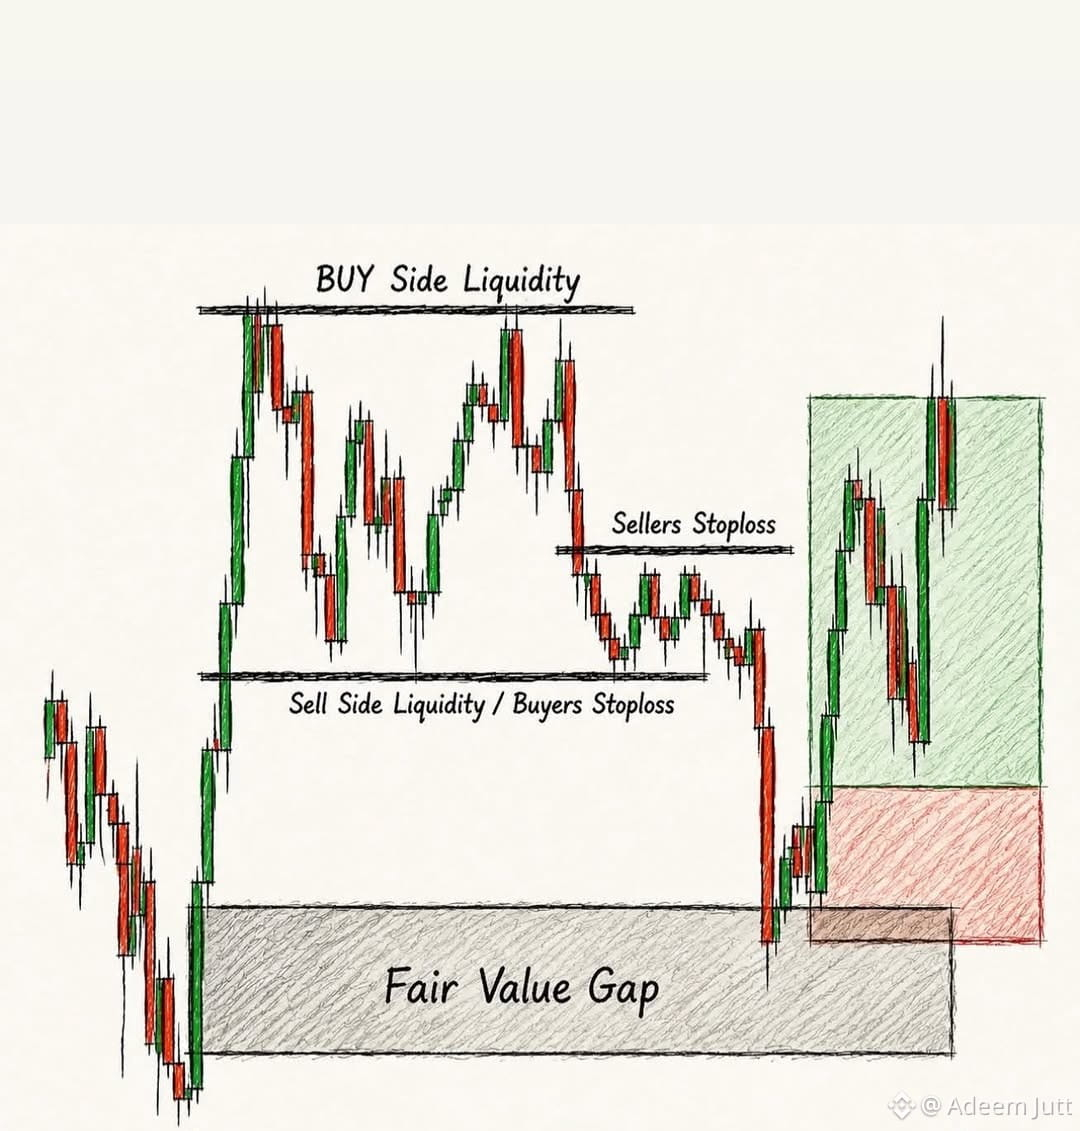
📊 LIQUIDITY & FVG Explained
🟢 Buy-side liquidity = where sellers place their stop losses
🔴 Sell-side liquidity = where buyers place their stop losses
📉 Fair Value Gap (FVG) = price inefficiency left behind by fast market moves
Smart money targets liquidity first…
then price returns to fill FVG zones. 👀
$XLM $ALLO $MANTA
{spot}(ALLOUSDT)
{spot}(XLMUSDT)
{spot}(MANTAUSDT)
#FVG #liquidity #TradingCommunity
📊 LIQUIDITY & FVG Explained
🟢 Buy-side liquidity = where sellers place their stop losses
🔴 Sell-side liquidity = where buyers place their stop losses
📉 Fair Value Gap (FVG) = price inefficiency left behind by fast market moves
Smart money targets liquidity first…
then price returns to fill FVG zones. 👀
$XLM $ALLO $MANTA
#FVG #liquidity #TradingCommunity
🟢 Buy-side liquidity = where sellers place their stop losses
🔴 Sell-side liquidity = where buyers place their stop losses
📉 Fair Value Gap (FVG) = price inefficiency left behind by fast market moves
Smart money targets liquidity first…
then price returns to fill FVG zones. 👀
$XLM $ALLO $MANTA
#FVG #liquidity #TradingCommunity
1
2
244

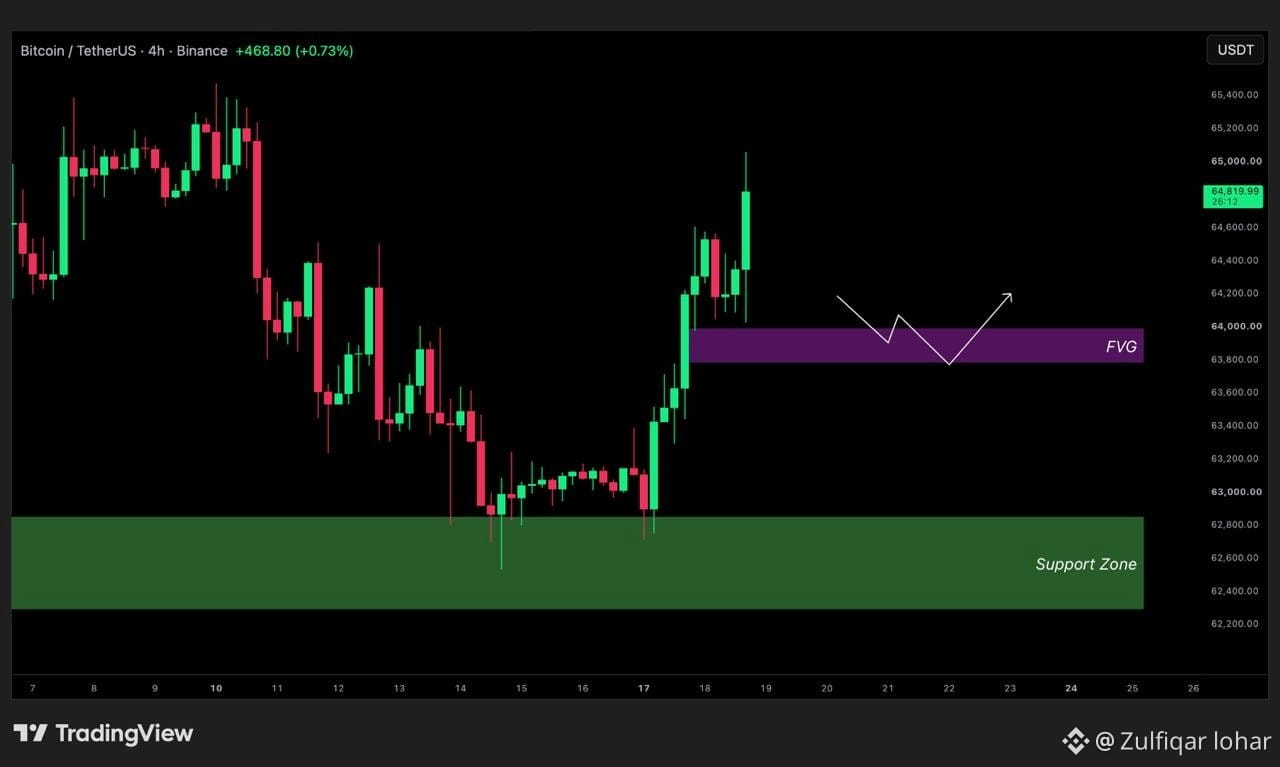
📌 - #Bitcoin Analysis
4H Timeframe
As Bitcoin is climbing further, here's a new look into the price action.
There is a #bullish #FVG left untouched just below the previous minor low.
There's a high probability that price will fill that FVG before continuing on higher.
#Binance #BinanceSquareFamily
📌 - #Bitcoin Analysis
4H Timeframe
As Bitcoin is climbing further, here's a new look into the price action.
There is a #bullish #FVG left untouched just below the previous minor low.
There's a high probability that price will fill that FVG before continuing on higher.
#Binance #BinanceSquareFamily
4H Timeframe
As Bitcoin is climbing further, here's a new look into the price action.
There is a #bullish #FVG left untouched just below the previous minor low.
There's a high probability that price will fill that FVG before continuing on higher.
#Binance #BinanceSquareFamily
27
1
27

·
--
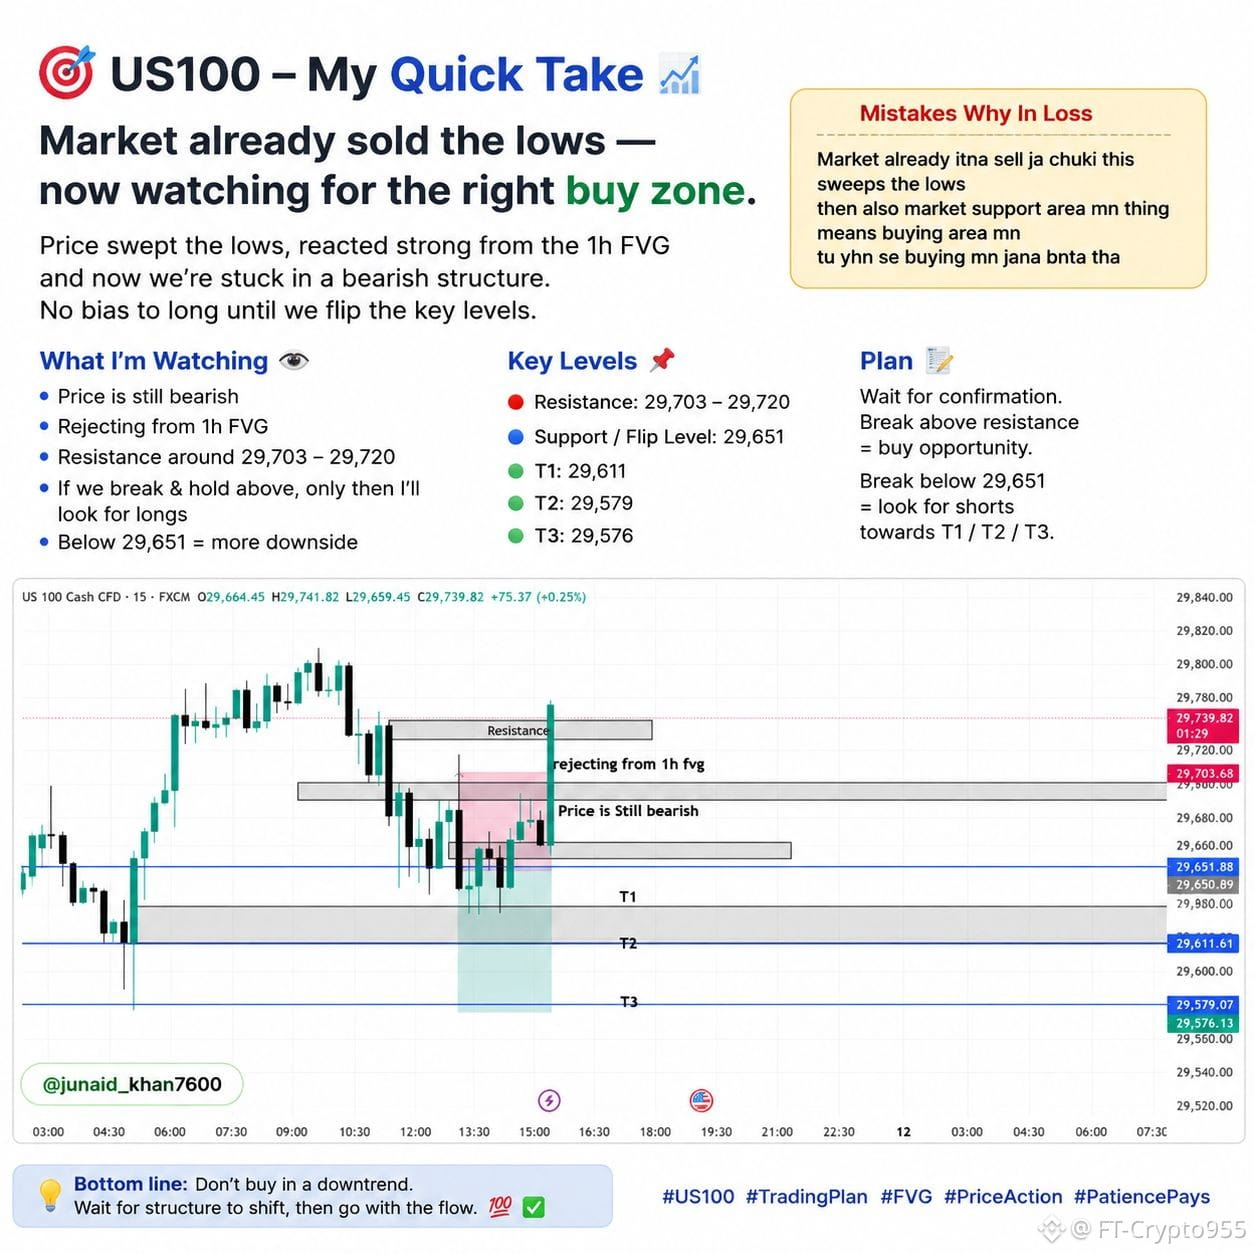
US100 is a good reminder that not every support zone is a buy zone.
Price already swept the lows and reacted from the 1H FVG, but the bigger structure is still looking bearish.
Right now, I’m watching the key levels:
📌 29,703–29,720 → major resistance
📌 29,651 → important level to hold
📌 29,611 / 29,579 → downside targets
For me, the mistake is simple: seeing price reach support and immediately jumping into a buy.
I’d rather wait for confirmation than force a trade.
No FOMO. No revenge trading. Just patience + proper risk management.
What do you see here bullish reversal or another move down?
#US100 #PriceAction #FVG #CryptoTrading #DYOR
US100 is a good reminder that not every support zone is a buy zone.
Price already swept the lows and reacted from the 1H FVG, but the bigger structure is still looking bearish.
Right now, I’m watching the key levels:
📌 29,703–29,720 → major resistance
📌 29,651 → important level to hold
📌 29,611 / 29,579 → downside targets
For me, the mistake is simple: seeing price reach support and immediately jumping into a buy.
I’d rather wait for confirmation than force a trade.
No FOMO. No revenge trading. Just patience + proper risk management.
What do you see here bullish reversal or another move down?
#US100 #PriceAction #FVG #CryptoTrading #DYOR
Price already swept the lows and reacted from the 1H FVG, but the bigger structure is still looking bearish.
Right now, I’m watching the key levels:
📌 29,703–29,720 → major resistance
📌 29,651 → important level to hold
📌 29,611 / 29,579 → downside targets
For me, the mistake is simple: seeing price reach support and immediately jumping into a buy.
I’d rather wait for confirmation than force a trade.
No FOMO. No revenge trading. Just patience + proper risk management.
What do you see here bullish reversal or another move down?
#US100 #PriceAction #FVG #CryptoTrading #DYOR
76

·
--
FVG
Fair Value Gap strategy is one of the best strategies in the world of trading. Here I'm giving you a free pro tip if you trade #FVG . As you know we wait for rejection and then for momentum candle, remember, that momentum candle must have lower volume than the previous candle. It increases your winning chance to 90%.
#educational_post #SkillPays
FVG
Fair Value Gap strategy is one of the best strategies in the world of trading. Here I'm giving you a free pro tip if you trade #FVG . As you know we wait for rejection and then for momentum candle, remember, that momentum candle must have lower volume than the previous candle. It increases your winning chance to 90%.
#educational_post #SkillPays
Fair Value Gap strategy is one of the best strategies in the world of trading. Here I'm giving you a free pro tip if you trade #FVG . As you know we wait for rejection and then for momentum candle, remember, that momentum candle must have lower volume than the previous candle. It increases your winning chance to 90%.
#educational_post #SkillPays
196


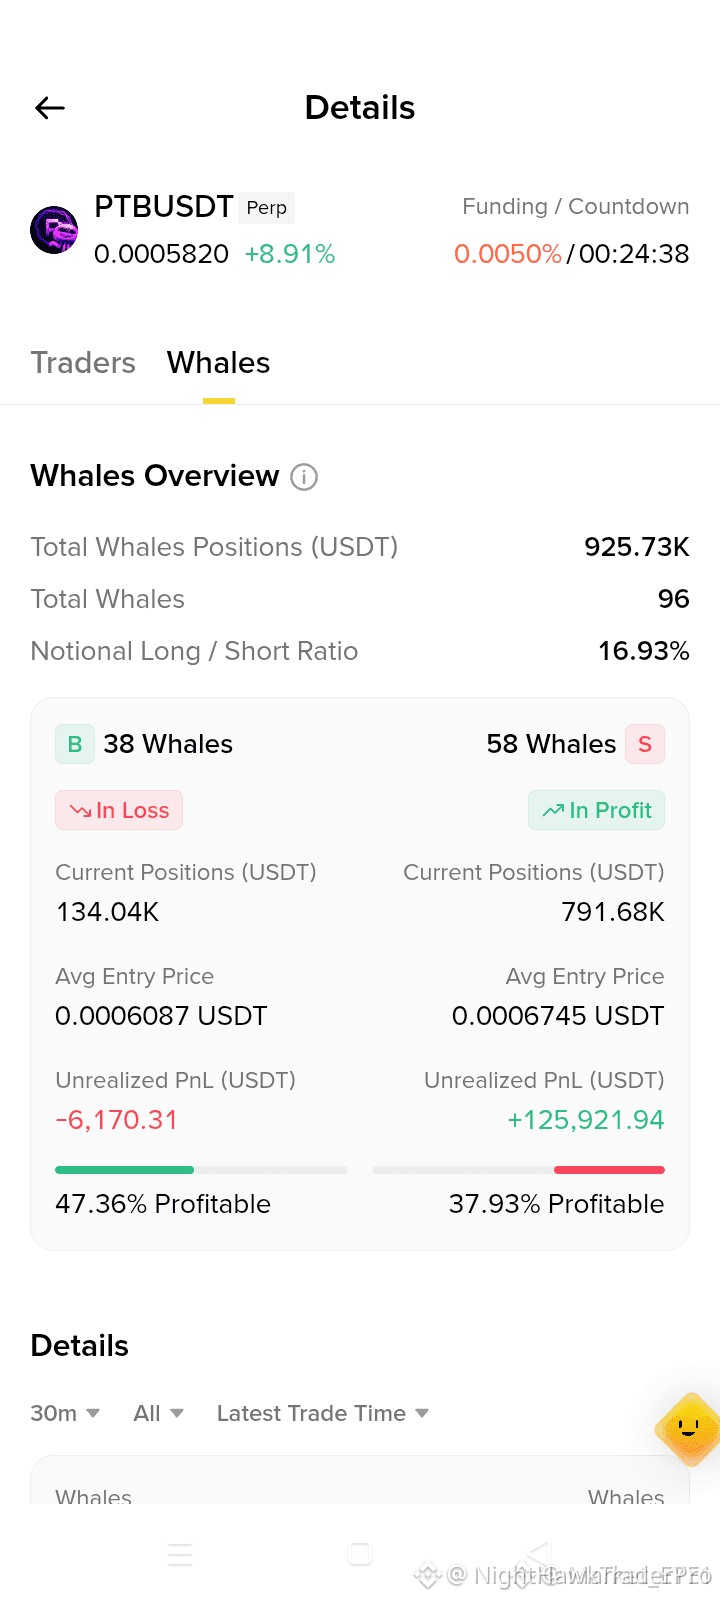
$PTB SHORT AS WHALES LOAD UP AGAINST RETAIL FOMO 📉
Entry: 0.0005850 - 0.0006000 🔥
Target: 0.0005500 🚀
Stop Loss: 0.0006200 ⚠️
This liquidity sweep into the recent highs is exactly what I was waiting for. Retail is chasing momentum but whale data shows they're stacking shorts from these levels. There's an unfilled FVG sitting below that usually gets tagged before any real move down.
Clear entry with a tight stop and 1:2 risk-to-reward on the first target alone. The bigger institutions are leaning bearish here — are you following the smart money or the crowd?
Not financial advice. Always manage your risk.
#PTB #ShortSetup #FVG #LiquiditySweep
⚡
$PTB SHORT AS WHALES LOAD UP AGAINST RETAIL FOMO 📉
Entry: 0.0005850 - 0.0006000 🔥
Target: 0.0005500 🚀
Stop Loss: 0.0006200 ⚠️
This liquidity sweep into the recent highs is exactly what I was waiting for. Retail is chasing momentum but whale data shows they're stacking shorts from these levels. There's an unfilled FVG sitting below that usually gets tagged before any real move down.
Clear entry with a tight stop and 1:2 risk-to-reward on the first target alone. The bigger institutions are leaning bearish here — are you following the smart money or the crowd?
Not financial advice. Always manage your risk.
#PTB #ShortSetup #FVG #LiquiditySweep
⚡
Entry: 0.0005850 - 0.0006000 🔥
Target: 0.0005500 🚀
Stop Loss: 0.0006200 ⚠️
This liquidity sweep into the recent highs is exactly what I was waiting for. Retail is chasing momentum but whale data shows they're stacking shorts from these levels. There's an unfilled FVG sitting below that usually gets tagged before any real move down.
Clear entry with a tight stop and 1:2 risk-to-reward on the first target alone. The bigger institutions are leaning bearish here — are you following the smart money or the crowd?
Not financial advice. Always manage your risk.
#PTB #ShortSetup #FVG #LiquiditySweep
⚡
169

·
--
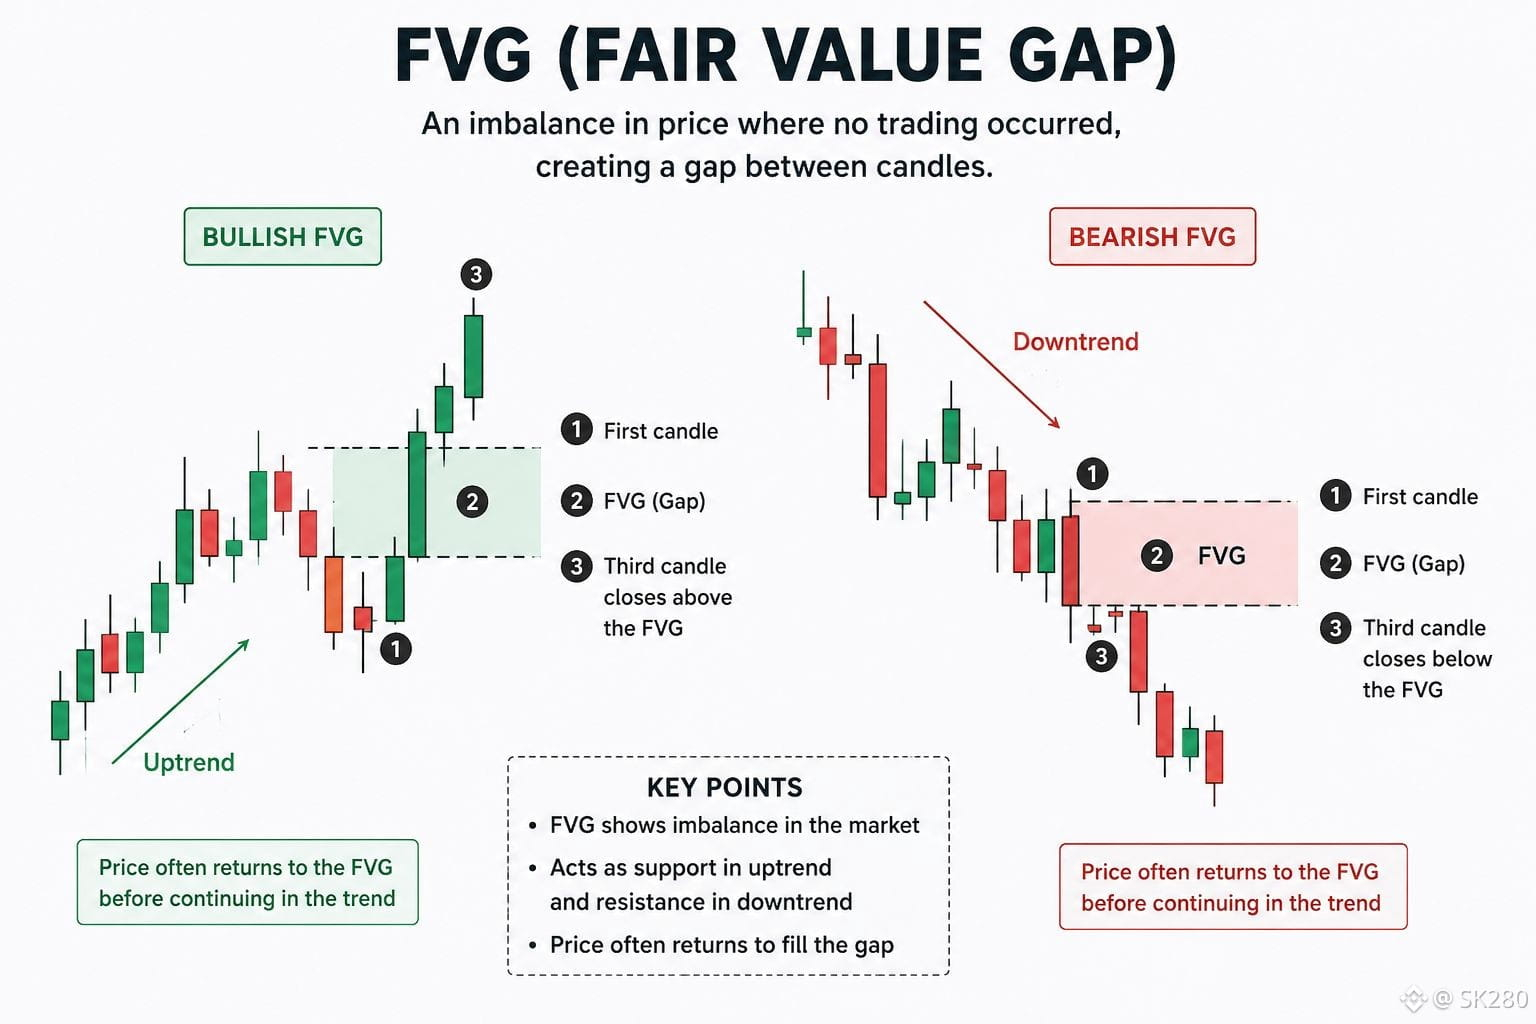
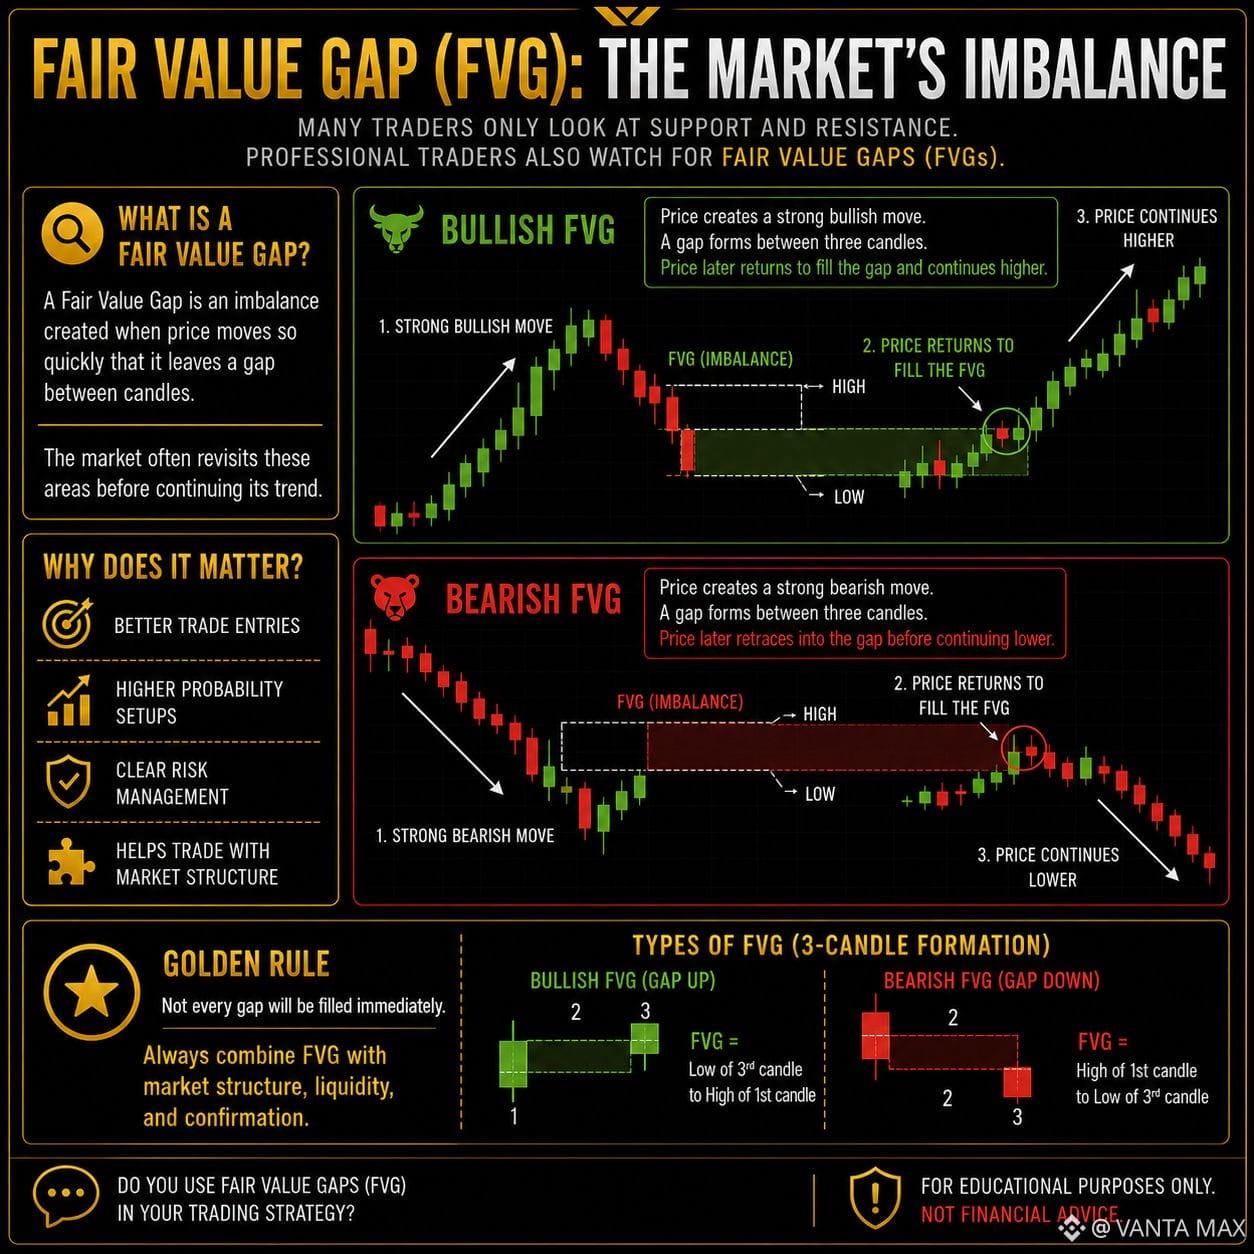
What is a Fair Value Gap?
A Fair Value Gap is an imbalance created when price moves so quickly that it leaves a gap between candles.
The market often revisits these areas before continuing its trend.
Bullish FVG
📈 Price creates a strong bullish move.
A gap forms between three candles.
Price later returns to fill the gap and continues higher.
Bearish FVG
📉 Price creates a strong bearish move.
A gap forms between three candles.
Price later retraces into the gap before continuing lower.
Why does it matter?
✅ Better trade entries
✅ Higher probability setups
✅ Clear risk management
✅ Helps trade with market structure
Golden Rule
Not every gap will be filled immediately.
Always combine FVG with market structure, liquidity, and confirmation.
For educational purposes only. Not financial advice.
#Crypto #FairValueGap #FVG #SmartMoney
What is a Fair Value Gap?
A Fair Value Gap is an imbalance created when price moves so quickly that it leaves a gap between candles.
The market often revisits these areas before continuing its trend.
Bullish FVG
📈 Price creates a strong bullish move.
A gap forms between three candles.
Price later returns to fill the gap and continues higher.
Bearish FVG
📉 Price creates a strong bearish move.
A gap forms between three candles.
Price later retraces into the gap before continuing lower.
Why does it matter?
✅ Better trade entries
✅ Higher probability setups
✅ Clear risk management
✅ Helps trade with market structure
Golden Rule
Not every gap will be filled immediately.
Always combine FVG with market structure, liquidity, and confirmation.
For educational purposes only. Not financial advice.
#Crypto #FairValueGap #FVG #SmartMoney
A Fair Value Gap is an imbalance created when price moves so quickly that it leaves a gap between candles.
The market often revisits these areas before continuing its trend.
Bullish FVG
📈 Price creates a strong bullish move.
A gap forms between three candles.
Price later returns to fill the gap and continues higher.
Bearish FVG
📉 Price creates a strong bearish move.
A gap forms between three candles.
Price later retraces into the gap before continuing lower.
Why does it matter?
✅ Better trade entries
✅ Higher probability setups
✅ Clear risk management
✅ Helps trade with market structure
Golden Rule
Not every gap will be filled immediately.
Always combine FVG with market structure, liquidity, and confirmation.
For educational purposes only. Not financial advice.
#Crypto #FairValueGap #FVG #SmartMoney
100

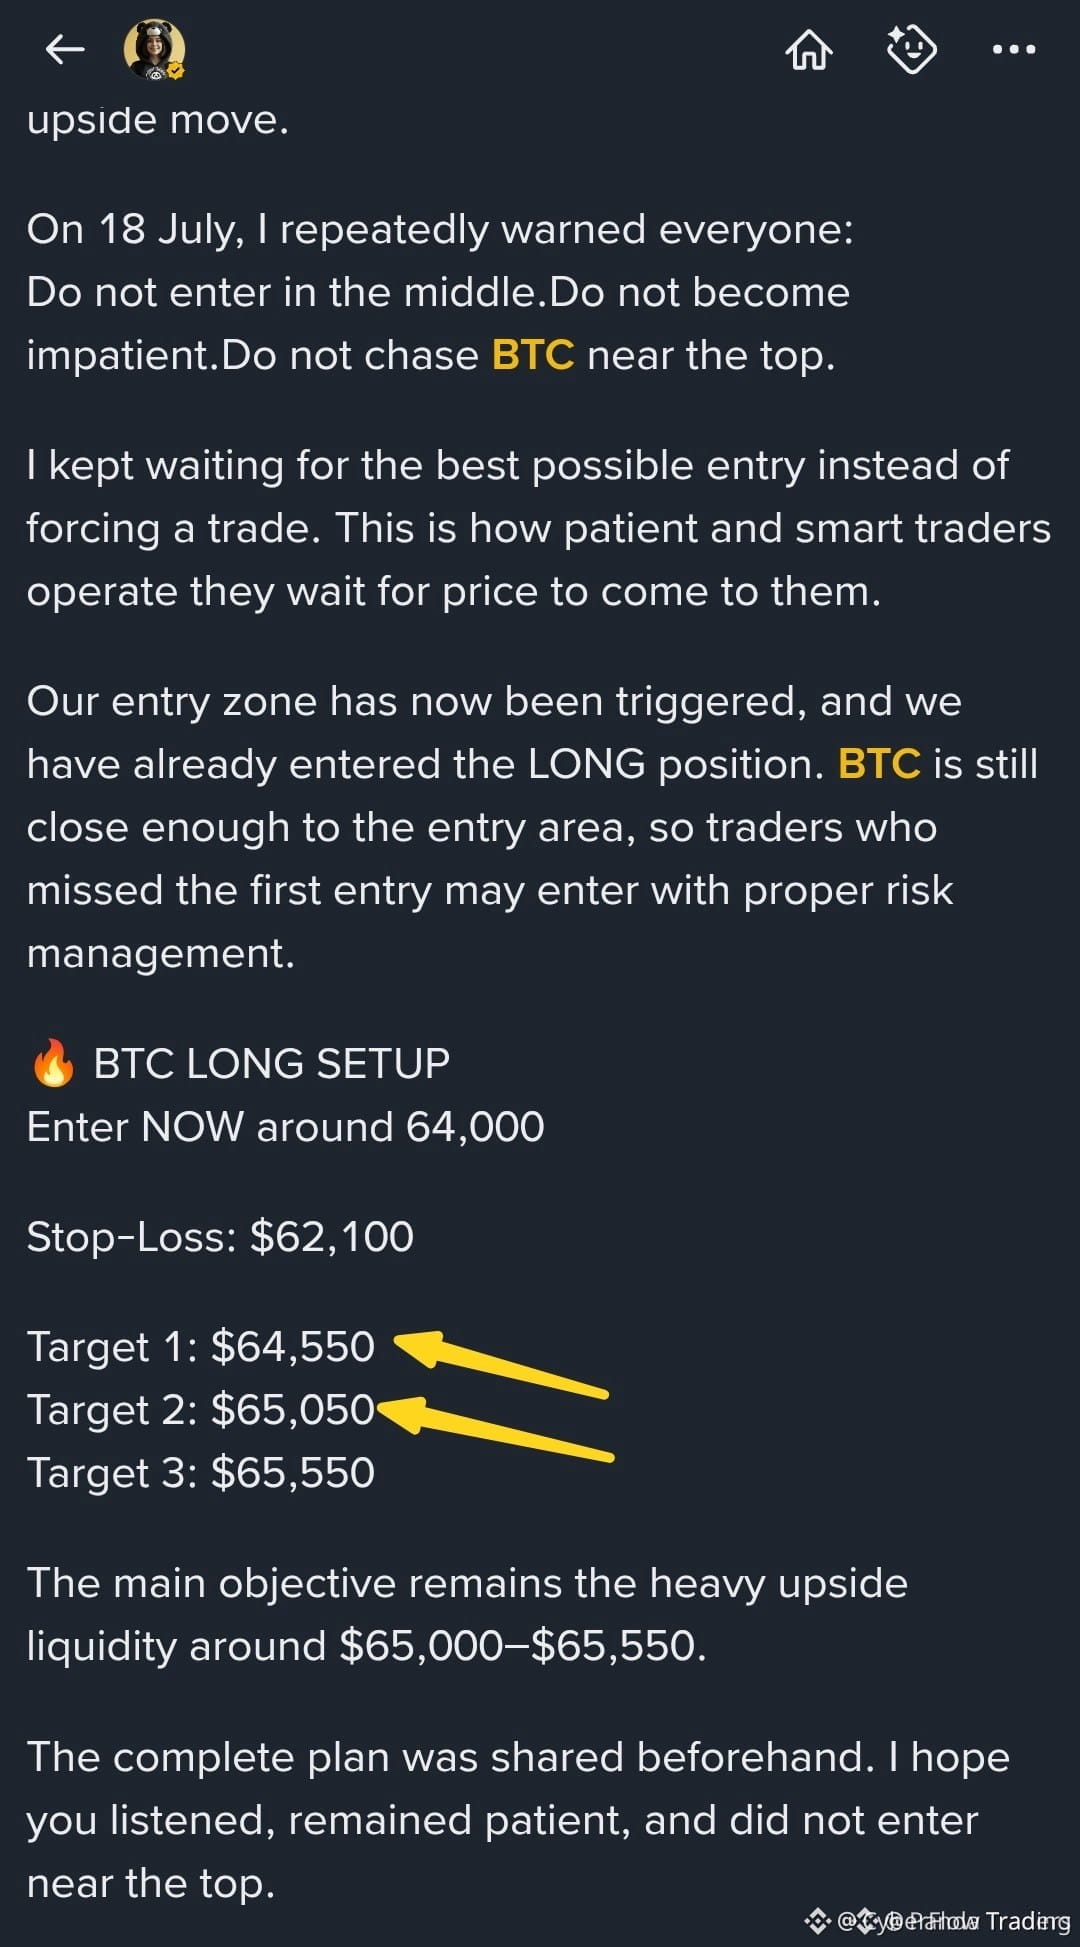
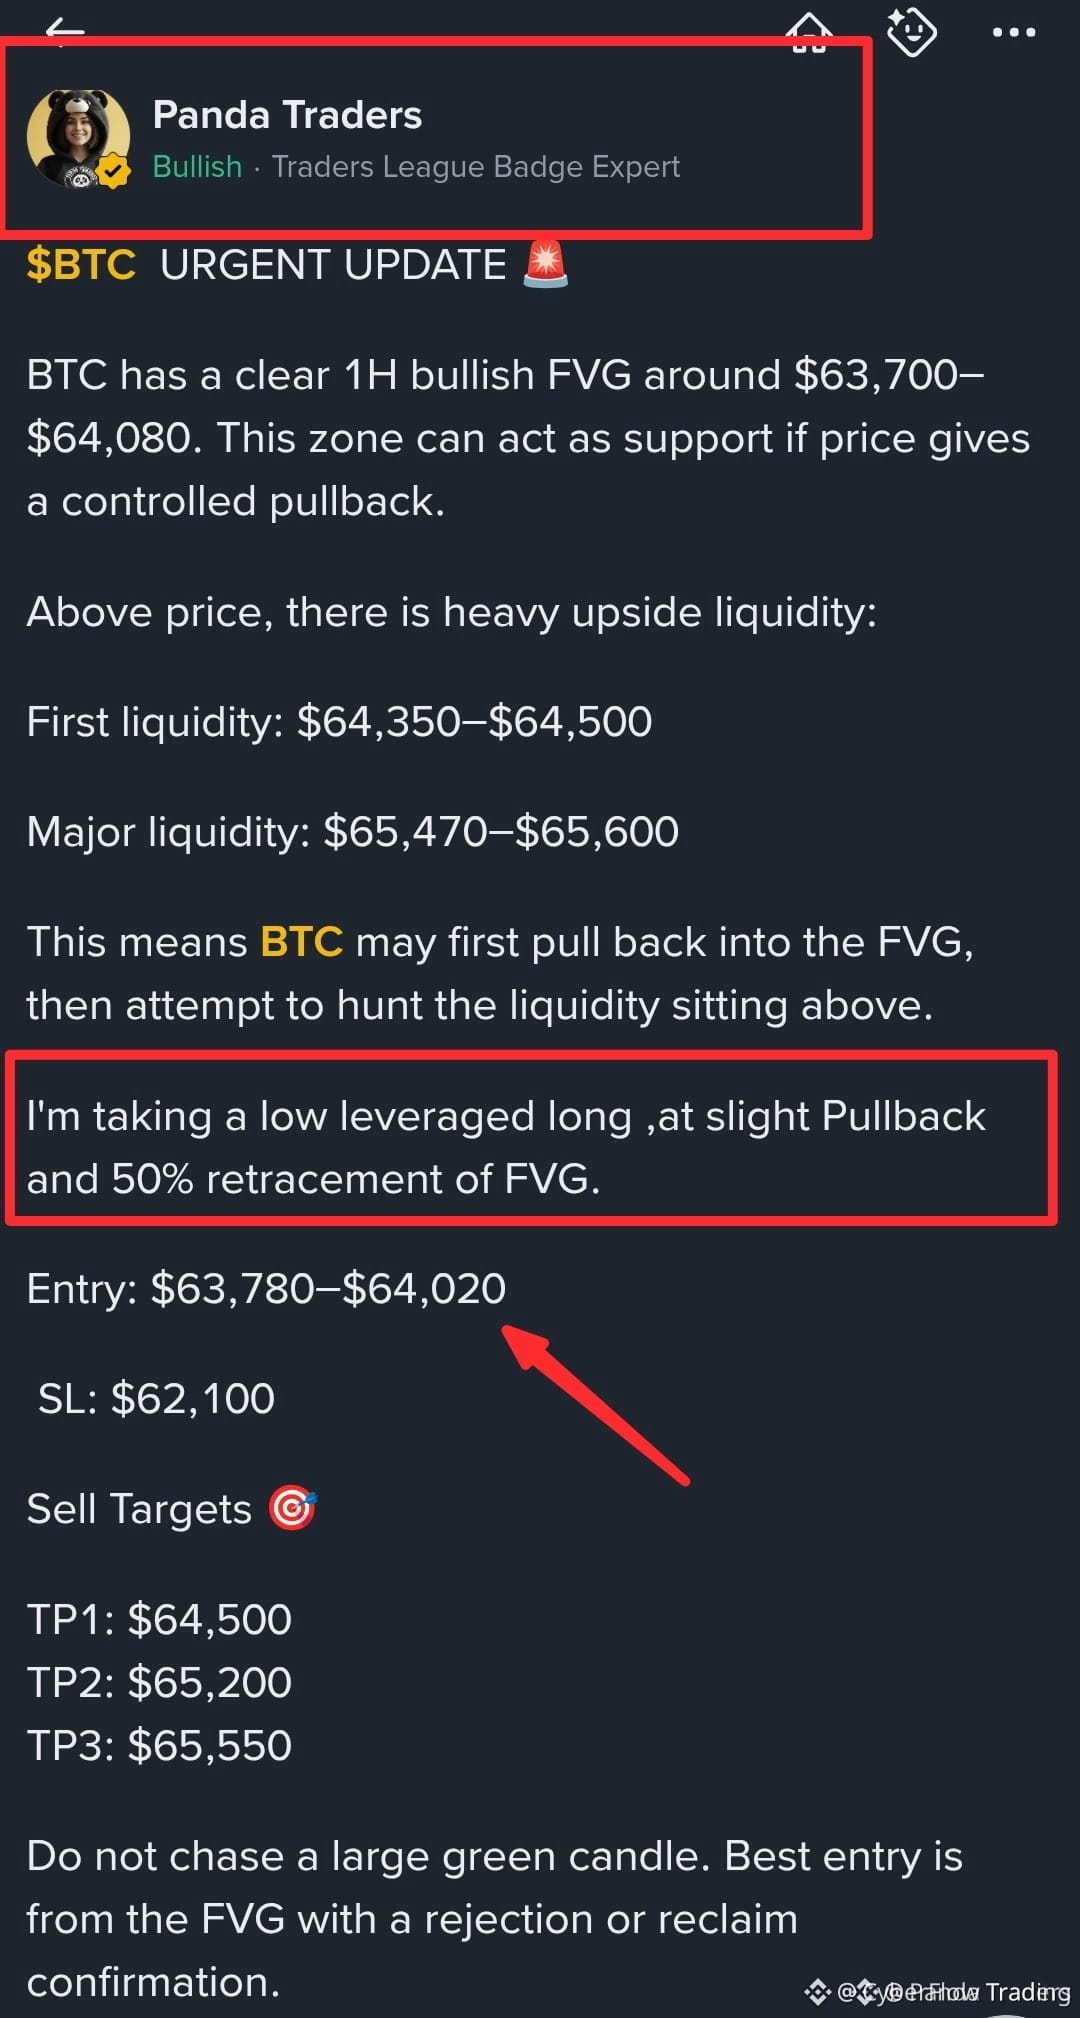
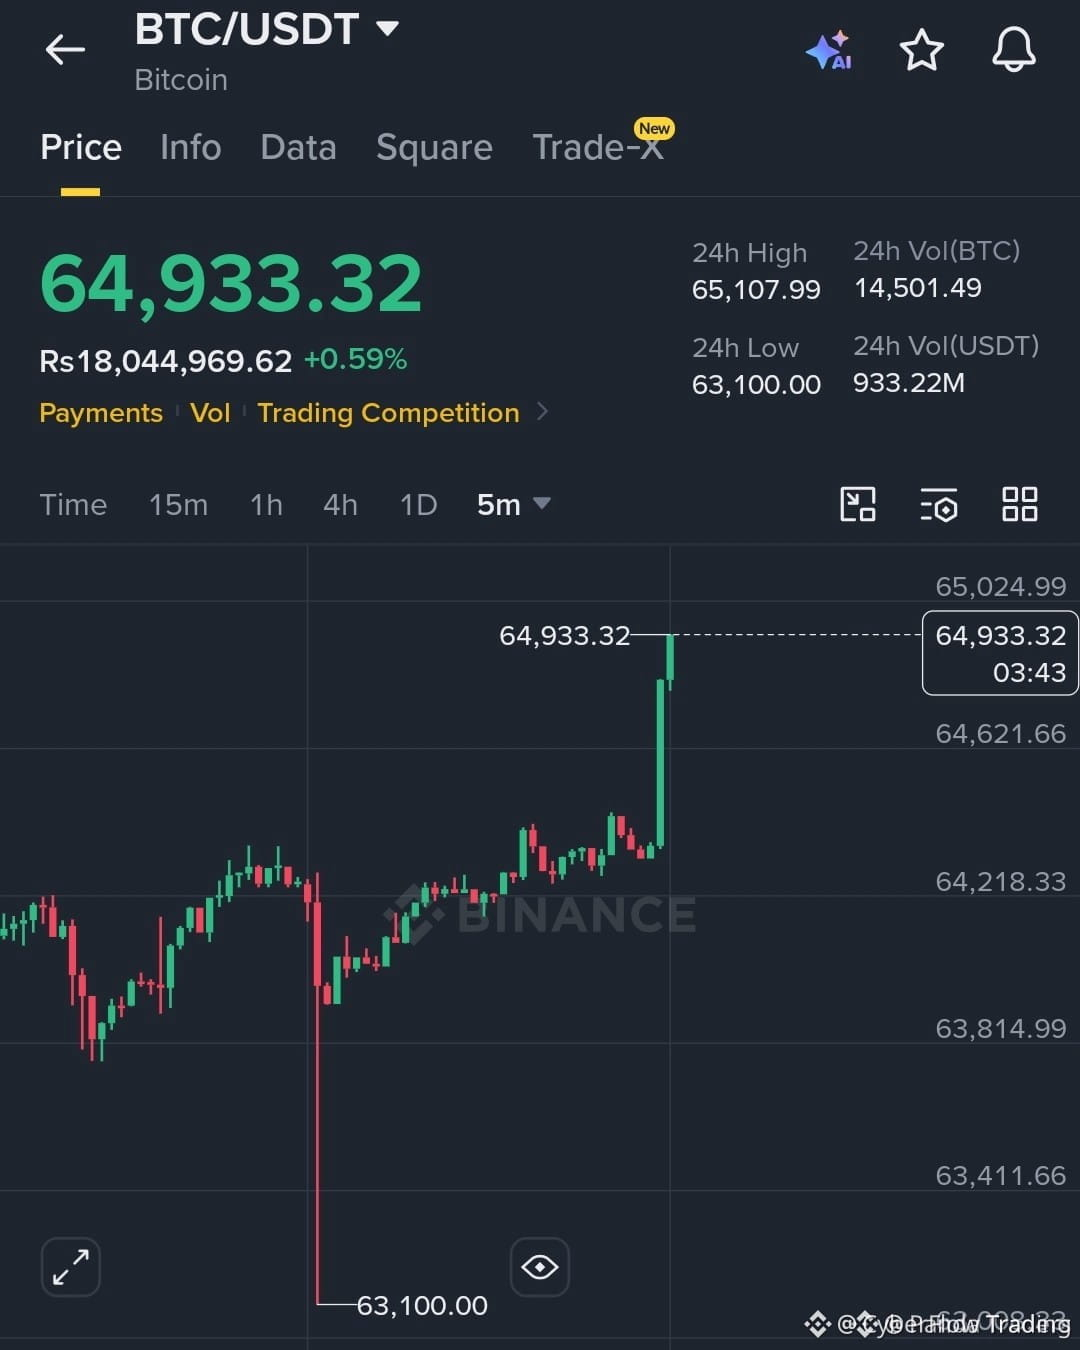
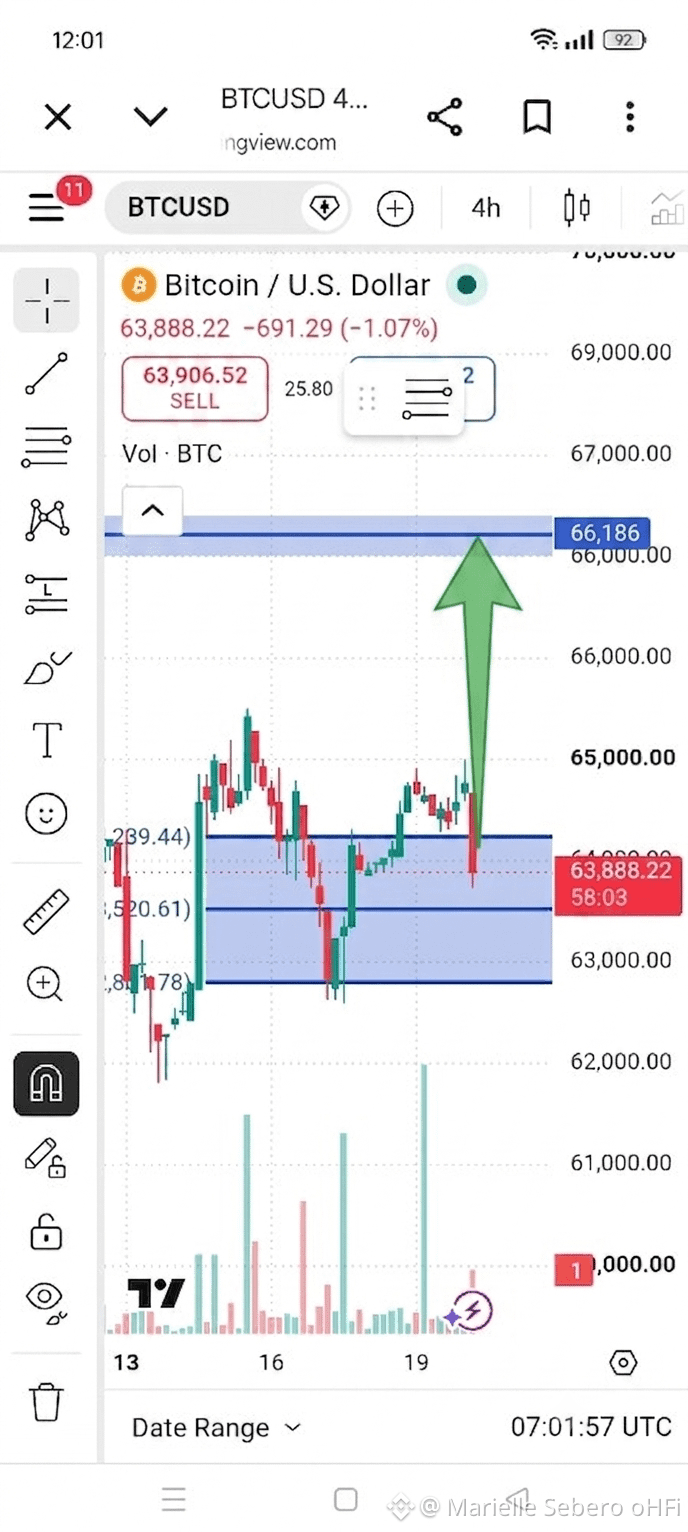
$BTC FVG FILL COMPLETE — PUMP IN PLAY 🔥
The liquidity sweep to 65k was textbook — filled the FVG from July 18, shook out late longs, and reversed hard. I pointed out this exact scenario days ago: wait for the retracement, don't chase.
Volume spiked on the bounce and the move is already climbing toward the next target. The ones who shorted the breakdown are getting squeezed right now. Did you stay patient or get caught in the noise?
Not financial advice. Always manage your risk.
#BTC #FVG #Reversal #LiquidityGrab
🔥
$BTC FVG FILL COMPLETE — PUMP IN PLAY 🔥
The liquidity sweep to 65k was textbook — filled the FVG from July 18, shook out late longs, and reversed hard. I pointed out this exact scenario days ago: wait for the retracement, don't chase.
Volume spiked on the bounce and the move is already climbing toward the next target. The ones who shorted the breakdown are getting squeezed right now. Did you stay patient or get caught in the noise?
Not financial advice. Always manage your risk.
#BTC #FVG #Reversal #LiquidityGrab
🔥
The liquidity sweep to 65k was textbook — filled the FVG from July 18, shook out late longs, and reversed hard. I pointed out this exact scenario days ago: wait for the retracement, don't chase.
Volume spiked on the bounce and the move is already climbing toward the next target. The ones who shorted the breakdown are getting squeezed right now. Did you stay patient or get caught in the noise?
Not financial advice. Always manage your risk.
#BTC #FVG #Reversal #LiquidityGrab
🔥
98

·
--
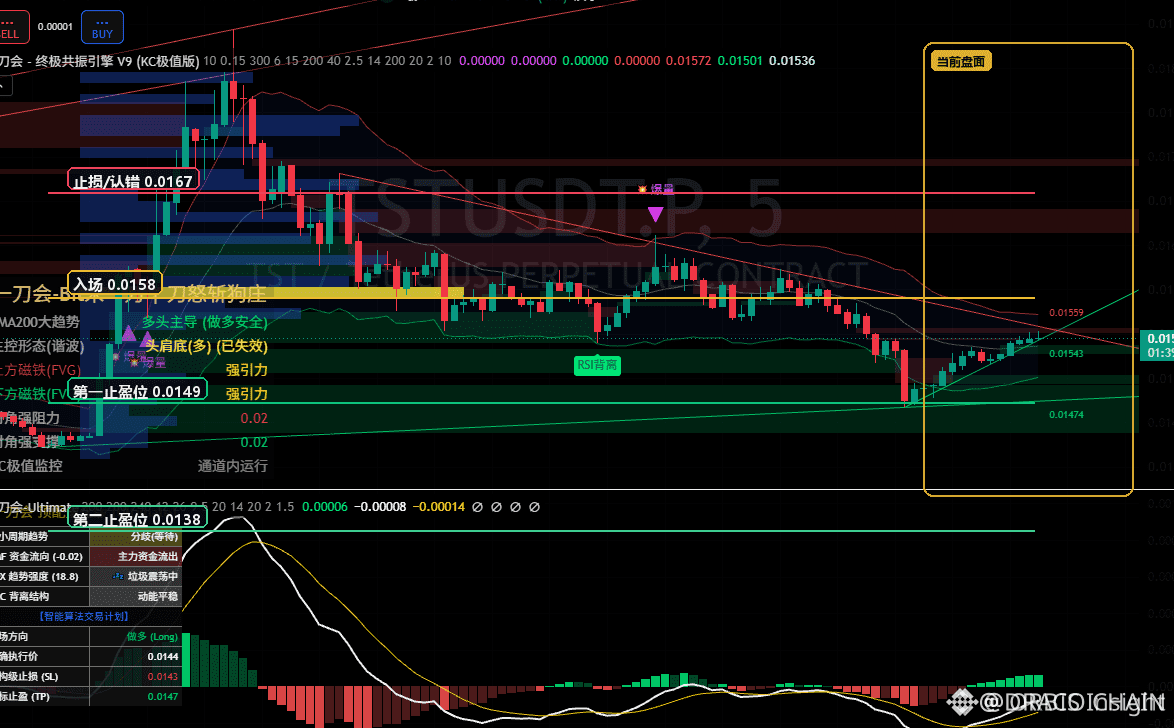
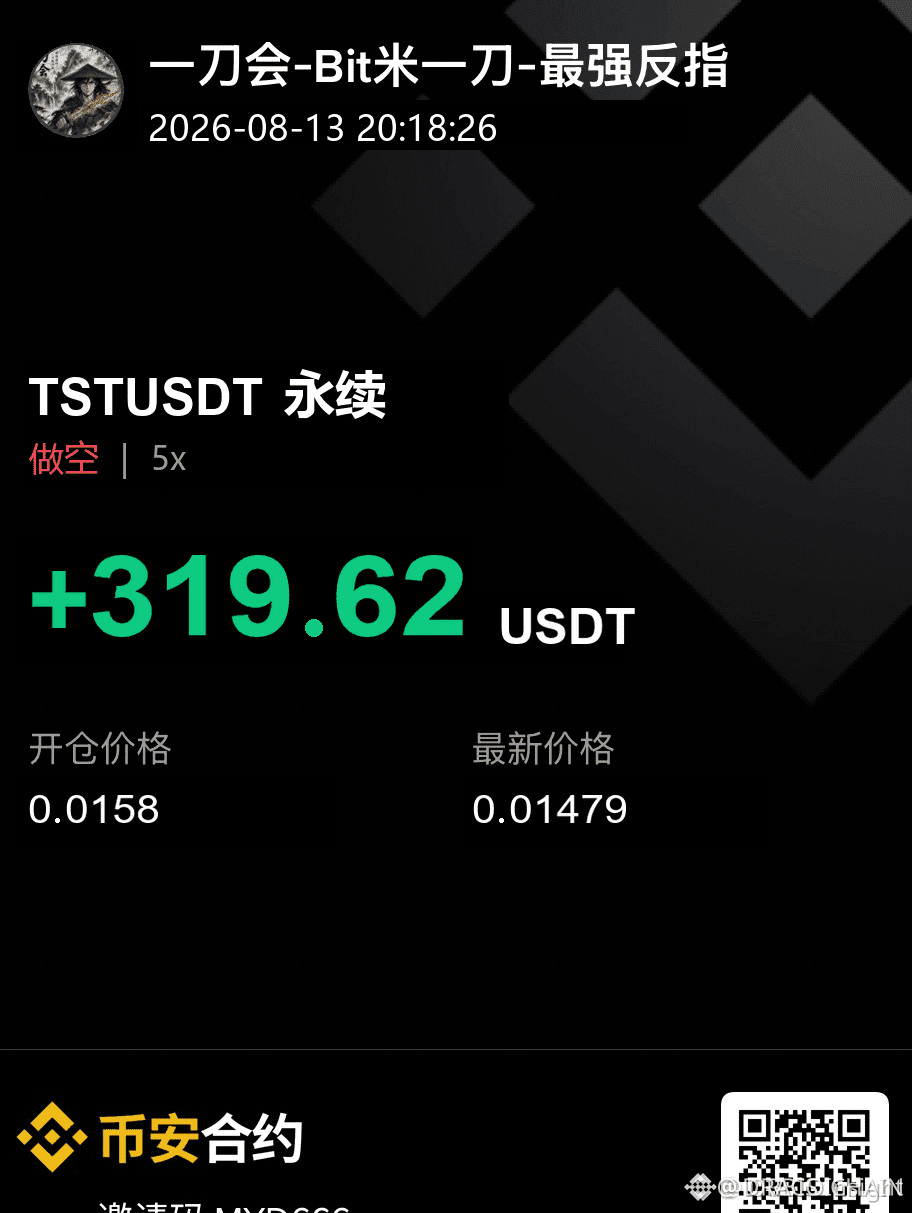
SHORT $TST : LIQUIDITY SWEPT, TP1 BANKED — 0.0138 NEXT 🎯📉
Entry: 0.0158 📉
Target: 0.01479 - 0.0138 🎯
Stop Loss: 0.0167 🛑
Price action just confirmed the liquidity sweep we were tracking. $TST tapped the institutional sell-side pool and TP1 filled cleanly at 0.01479 — the market maker's order block gave way exactly where the footprint suggested. First tranche is banked, and now the real question is whether 0.0138 holds as the next inefficiency zone. 📉
The structure remains weighted to the downside while we stay below the 0.0158 entry zone. What matters now is discipline — protect the runner, keep the stop at 0.0167, and let the remaining position track the FVG toward the lower target. No reason to chase when the path is already mapped. 🔍
Where do you see $TST catching support first — 0.01479 or the deeper 0.0138 zone?
⚠️ Not financial advice. Always manage your risk. 🛡️
🏷️ $TST #Short #LiquiditySweep #SMC #FVG
🔥📊
SHORT $TST : LIQUIDITY SWEPT, TP1 BANKED — 0.0138 NEXT 🎯📉
Entry: 0.0158 📉
Target: 0.01479 - 0.0138 🎯
Stop Loss: 0.0167 🛑
Price action just confirmed the liquidity sweep we were tracking. $TST tapped the institutional sell-side pool and TP1 filled cleanly at 0.01479 — the market maker's order block gave way exactly where the footprint suggested. First tranche is banked, and now the real question is whether 0.0138 holds as the next inefficiency zone. 📉
The structure remains weighted to the downside while we stay below the 0.0158 entry zone. What matters now is discipline — protect the runner, keep the stop at 0.0167, and let the remaining position track the FVG toward the lower target. No reason to chase when the path is already mapped. 🔍
Where do you see $TST catching support first — 0.01479 or the deeper 0.0138 zone?
⚠️ Not financial advice. Always manage your risk. 🛡️
🏷️ $TST #Short #LiquiditySweep #SMC #FVG
🔥📊
Entry: 0.0158 📉
Target: 0.01479 - 0.0138 🎯
Stop Loss: 0.0167 🛑
Price action just confirmed the liquidity sweep we were tracking. $TST tapped the institutional sell-side pool and TP1 filled cleanly at 0.01479 — the market maker's order block gave way exactly where the footprint suggested. First tranche is banked, and now the real question is whether 0.0138 holds as the next inefficiency zone. 📉
The structure remains weighted to the downside while we stay below the 0.0158 entry zone. What matters now is discipline — protect the runner, keep the stop at 0.0167, and let the remaining position track the FVG toward the lower target. No reason to chase when the path is already mapped. 🔍
Where do you see $TST catching support first — 0.01479 or the deeper 0.0138 zone?
⚠️ Not financial advice. Always manage your risk. 🛡️
🏷️ $TST #Short #LiquiditySweep #SMC #FVG
🔥📊
122

🔥 NEWBIE MISTAKES: Why Blindly Trading FVG on Bitcoin Drains Your Deposit?
Many think that Imbalance (FVG) is a magnet that the price must close right now. We'll break down why that's not the case using #BTC as an example.
❌ MISTAKE:
Bitcoin's price $BTC sharply drops, leaving a huge bearish FVG. A newbie immediately goes long against the trend, expecting a closure, and gets liquidated.
🛡 REALITY:
If the overall trend (Order Flow) is bearish, big capital will ignore the bullish FVG and continue to scoop liquidity below. FVG is NOT a magnet for an instant reversal.
💡 HOW TO TRADE CORRECTLY?
1. Context: trade FVG only in the direction of the higher time frame (HTF) trend.
2. Wait for a reaction not at the boundary touch but at the 0.5 level (midpoint of FVG).
3. Look for confirmation (break of CHoCH) on a lower time frame within the zone.
🧠 RM: Never average down a loss against the trend. Stop — behind a valid high/low.
---
Liked the post? Smash that like button, bro, and subscribe! Comment below, do you often catch stops on imbalances? 👇
#Crypto #SmartMoneySignal #Bitcoin❗ #CryptoFREEMEN
{spot}(BTCUSDT)
$BTC #FVG
🔥 NEWBIE MISTAKES: Why Blindly Trading FVG on Bitcoin Drains Your Deposit?
Many think that Imbalance (FVG) is a magnet that the price must close right now. We'll break down why that's not the case using #BTC as an example.
❌ MISTAKE:
Bitcoin's price $BTC sharply drops, leaving a huge bearish FVG. A newbie immediately goes long against the trend, expecting a closure, and gets liquidated.
🛡 REALITY:
If the overall trend (Order Flow) is bearish, big capital will ignore the bullish FVG and continue to scoop liquidity below. FVG is NOT a magnet for an instant reversal.
💡 HOW TO TRADE CORRECTLY?
1. Context: trade FVG only in the direction of the higher time frame (HTF) trend.
2. Wait for a reaction not at the boundary touch but at the 0.5 level (midpoint of FVG).
3. Look for confirmation (break of CHoCH) on a lower time frame within the zone.
🧠 RM: Never average down a loss against the trend. Stop — behind a valid high/low.
---
Liked the post? Smash that like button, bro, and subscribe! Comment below, do you often catch stops on imbalances? 👇
#Crypto #SmartMoneySignal #Bitcoin❗ #CryptoFREEMEN
$BTC #FVG
Many think that Imbalance (FVG) is a magnet that the price must close right now. We'll break down why that's not the case using #BTC as an example.
❌ MISTAKE:
Bitcoin's price $BTC sharply drops, leaving a huge bearish FVG. A newbie immediately goes long against the trend, expecting a closure, and gets liquidated.
🛡 REALITY:
If the overall trend (Order Flow) is bearish, big capital will ignore the bullish FVG and continue to scoop liquidity below. FVG is NOT a magnet for an instant reversal.
💡 HOW TO TRADE CORRECTLY?
1. Context: trade FVG only in the direction of the higher time frame (HTF) trend.
2. Wait for a reaction not at the boundary touch but at the 0.5 level (midpoint of FVG).
3. Look for confirmation (break of CHoCH) on a lower time frame within the zone.
🧠 RM: Never average down a loss against the trend. Stop — behind a valid high/low.
---
Liked the post? Smash that like button, bro, and subscribe! Comment below, do you often catch stops on imbalances? 👇
#Crypto #SmartMoneySignal #Bitcoin❗ #CryptoFREEMEN
$BTC #FVG
195


·
--
Bearish
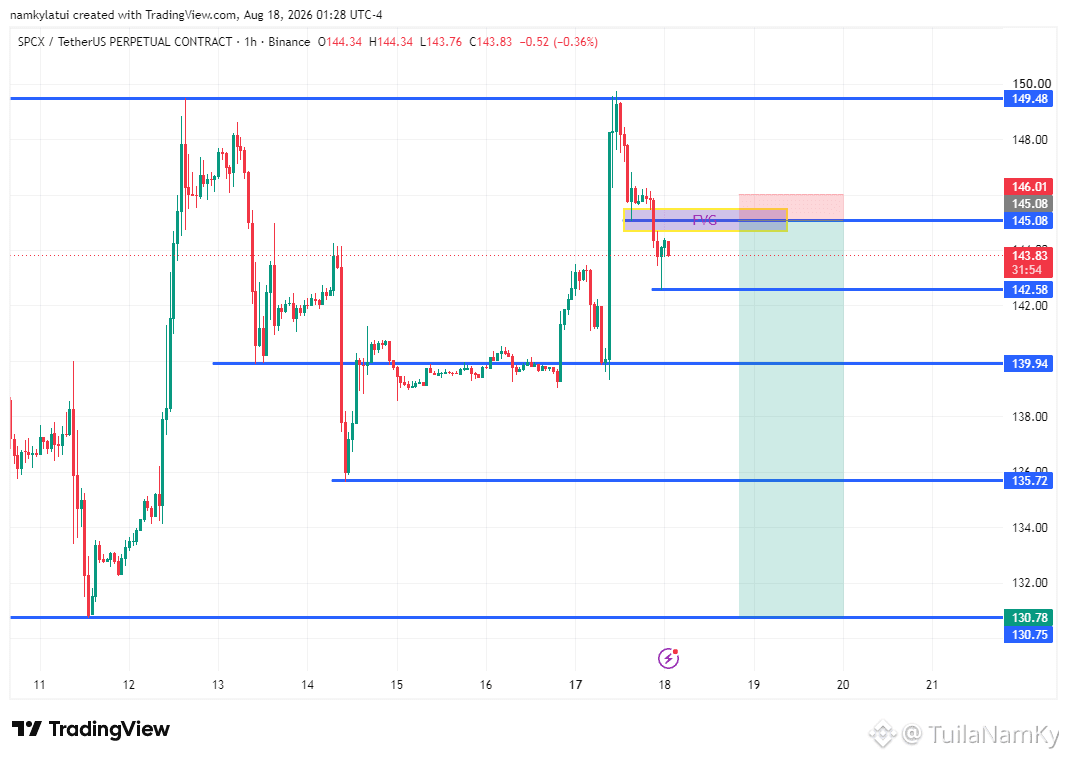
📊 SPCX/USDT — Retesting supply after sharp pump
SPCX pumped from 143 to 149.48 then got sold off fast — looks like a climax move, not a real breakout. Weekly trend is still bearish long-term (high 220 → low 104), and the 144-150 zone overlaps old June resistance, so this rally is likely just a bounce.
Volume during the rally > volume in the sideways move after → buyers losing steam, market consolidating.
Confirmed H1 FVG: 145.08-146.01
🔹 Resistance: 145.08-146.01 → 149.48
🔹 Support: 142.58 → 139.94 → 135.72
Watch for reaction at the FVG or a break below 139.94 with volume to confirm next direction.
⚠️ Personal analysis, not financial advice.
$SPCX
{future}(SPCXUSDT)
#SPCXUSDT #SMC #FVG #CryptoAnalysis
📊 SPCX/USDT — Retesting supply after sharp pump
SPCX pumped from 143 to 149.48 then got sold off fast — looks like a climax move, not a real breakout. Weekly trend is still bearish long-term (high 220 → low 104), and the 144-150 zone overlaps old June resistance, so this rally is likely just a bounce.
Volume during the rally > volume in the sideways move after → buyers losing steam, market consolidating.
Confirmed H1 FVG: 145.08-146.01
🔹 Resistance: 145.08-146.01 → 149.48
🔹 Support: 142.58 → 139.94 → 135.72
Watch for reaction at the FVG or a break below 139.94 with volume to confirm next direction.
⚠️ Personal analysis, not financial advice.
$SPCX
#SPCXUSDT #SMC #FVG #CryptoAnalysis
SPCX pumped from 143 to 149.48 then got sold off fast — looks like a climax move, not a real breakout. Weekly trend is still bearish long-term (high 220 → low 104), and the 144-150 zone overlaps old June resistance, so this rally is likely just a bounce.
Volume during the rally > volume in the sideways move after → buyers losing steam, market consolidating.
Confirmed H1 FVG: 145.08-146.01
🔹 Resistance: 145.08-146.01 → 149.48
🔹 Support: 142.58 → 139.94 → 135.72
Watch for reaction at the FVG or a break below 139.94 with volume to confirm next direction.
⚠️ Personal analysis, not financial advice.
$SPCX
#SPCXUSDT #SMC #FVG #CryptoAnalysis
87
Log in to explore more content
Join global crypto users on Binance Square
⚡️ Get latest and useful information about crypto.
💬 Trusted by the world’s largest crypto exchange.
👍 Discover real insights from verified creators.
Email / Phone number
Trending Topics
1
#BNBSurpasses$790
4,041 views
61 Discussing
2
#ZamaRises15.99%ToIntradayHigh$0.09
1,569 views
57 Discussing
3
#BitcoinSpotETFsDraw$6.34BInflowsInQ3
2,289 views
47 Discussing
4
#EthereumValidatorExitQueueJumps392%
37,459 views
464 Discussing
5
#IMFApprovesElSalvador$138MWithBitcoinWaiver
4,374 views
34 Discussing
6
#SECHaltsCryptoETFReviewsAmidFundingLapse
180,584 views
1,381 Discussing
7
#ZcashETFPostsFirstWeeklyOutflow$93.6M
83,039 views
239 Discussing
8
#GreekPoliceBustCryptoScamRingArrest17
311,539 views
2,068 Discussing
9
#BitcoinRejectedAt$87K
196,555 views
294 Discussing
10
#FedOctoberRateHikeOddsFallTo17%
310,426 views
2,218 Discussing