

#cryptocycles
cryptocycles
1.4M views
1,374 Discussing
Hot
Latest

·
--
Bullish
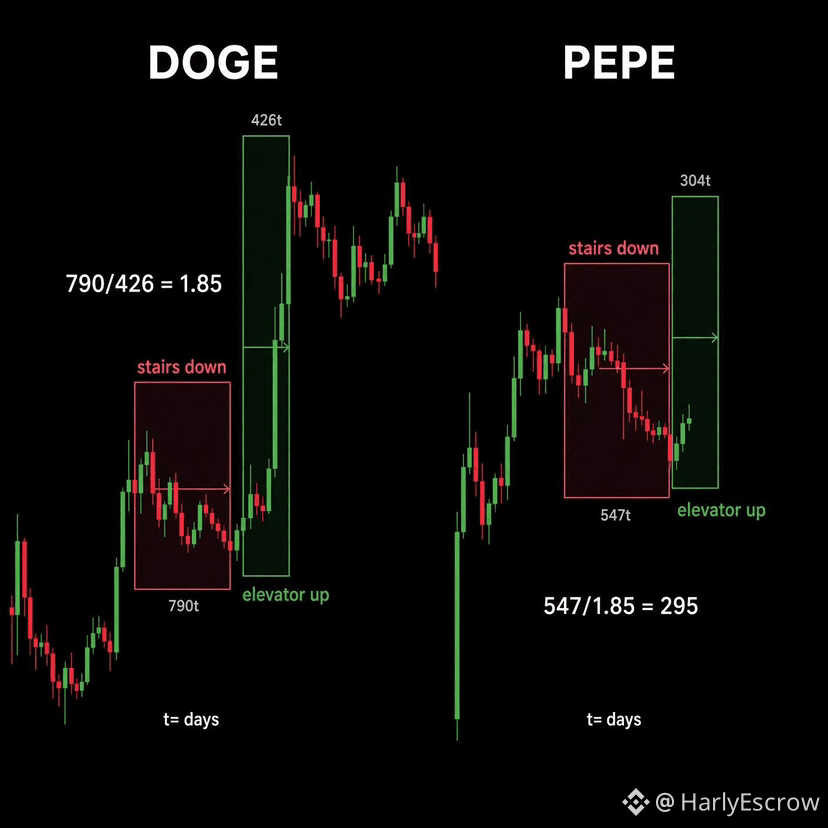
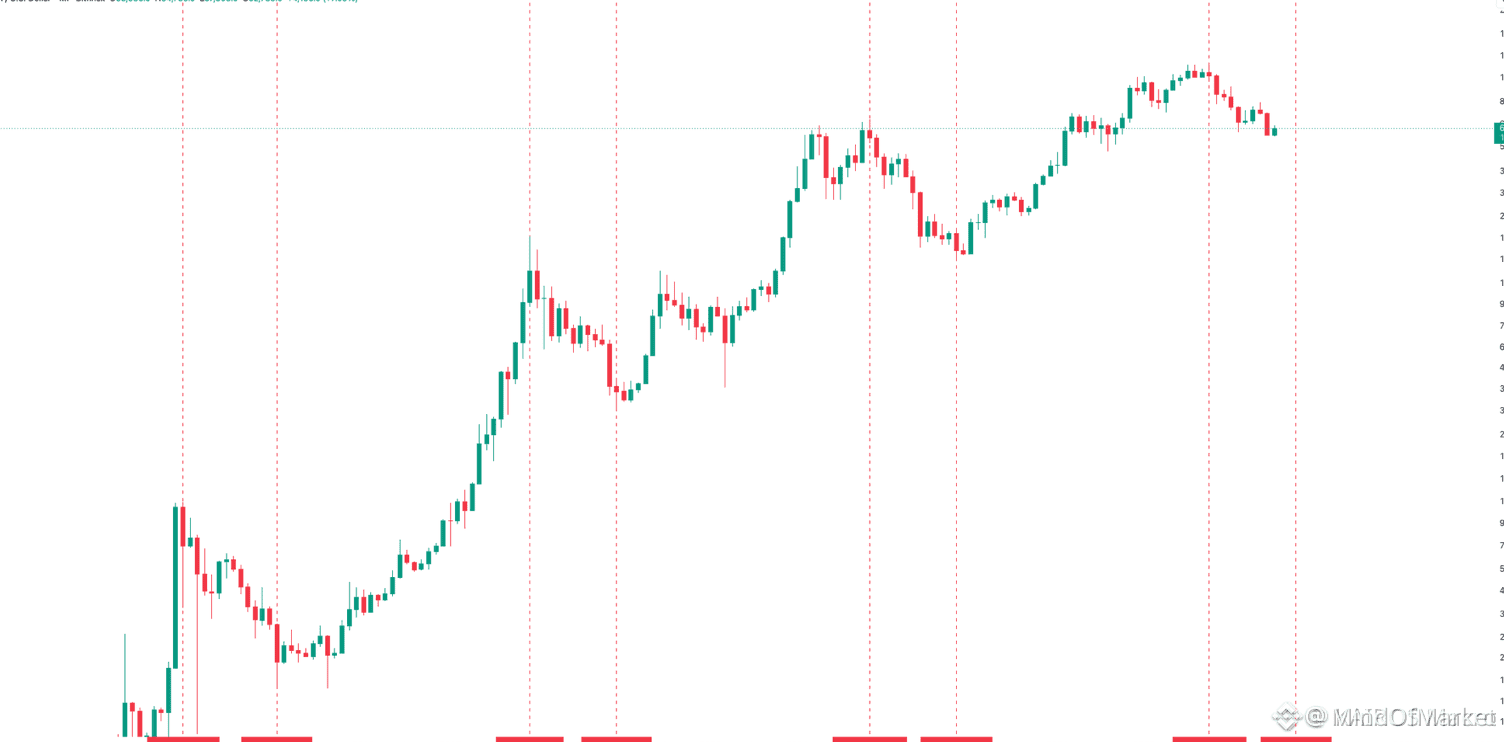
Mathematical fractal on the way?
The time mirror between DOGE and PEPE
Cycle analysts are observing a fascinating time pattern that compares the macro structure of $DOGE with the current price action of $PEPE . The math behind this fractal is exact, but will it hold true in the real market? 👇🏻👇🏻
#pepe #Dogecoin #memecoins #TechnicalAnalysis #CryptoCycles
{spot}(DOGEUSDT)
{spot}(PEPEUSDT)
Mathematical fractal on the way?
The time mirror between DOGE and PEPE
Cycle analysts are observing a fascinating time pattern that compares the macro structure of $DOGE with the current price action of $PEPE . The math behind this fractal is exact, but will it hold true in the real market? 👇🏻👇🏻
#pepe #Dogecoin #memecoins #TechnicalAnalysis #CryptoCycles
The time mirror between DOGE and PEPE
Cycle analysts are observing a fascinating time pattern that compares the macro structure of $DOGE with the current price action of $PEPE . The math behind this fractal is exact, but will it hold true in the real market? 👇🏻👇🏻
#pepe #Dogecoin #memecoins #TechnicalAnalysis #CryptoCycles
1
1.7k

Have you noticed that every crypto cycle gets sold as this time is different while the stages underneath stay identical?
Most traders lose money because they cannot tell accumulation from distribution. They buy the story, FOMO the top, and then sit through the drawdown wondering why their timing is always off.
The four stages have not changed. Accumulation, markup, distribution, markdown. They just evolve in speed and costume. 2017 ran on ICOs. 2021 ran on DeFi and NFTs. This cycle is running on ETFs, AI, and institutional flow. $BTC still leads the structure, $ETH still lags then catches up, and $BNB still tracks broader risk appetite on its own timeline. Same skeleton, new skin.
If you want an actual edge, map the stage before you size the trade. In accumulation, scale in with a hard invalidation. In markup, trail stops and take partials into strength. In distribution, stop adding and tighten risk. In markdown, wait for real capitulation instead of catching every knife.
Where do you think we actually are in this cycle right now?
#CryptoCycles #Bitcoin #Trading
Have you noticed that every crypto cycle gets sold as this time is different while the stages underneath stay identical?
Most traders lose money because they cannot tell accumulation from distribution. They buy the story, FOMO the top, and then sit through the drawdown wondering why their timing is always off.
The four stages have not changed. Accumulation, markup, distribution, markdown. They just evolve in speed and costume. 2017 ran on ICOs. 2021 ran on DeFi and NFTs. This cycle is running on ETFs, AI, and institutional flow. $BTC still leads the structure, $ETH still lags then catches up, and $BNB still tracks broader risk appetite on its own timeline. Same skeleton, new skin.
If you want an actual edge, map the stage before you size the trade. In accumulation, scale in with a hard invalidation. In markup, trail stops and take partials into strength. In distribution, stop adding and tighten risk. In markdown, wait for real capitulation instead of catching every knife.
Where do you think we actually are in this cycle right now?
#CryptoCycles #Bitcoin #Trading
Most traders lose money because they cannot tell accumulation from distribution. They buy the story, FOMO the top, and then sit through the drawdown wondering why their timing is always off.
The four stages have not changed. Accumulation, markup, distribution, markdown. They just evolve in speed and costume. 2017 ran on ICOs. 2021 ran on DeFi and NFTs. This cycle is running on ETFs, AI, and institutional flow. $BTC still leads the structure, $ETH still lags then catches up, and $BNB still tracks broader risk appetite on its own timeline. Same skeleton, new skin.
If you want an actual edge, map the stage before you size the trade. In accumulation, scale in with a hard invalidation. In markup, trail stops and take partials into strength. In distribution, stop adding and tighten risk. In markdown, wait for real capitulation instead of catching every knife.
Where do you think we actually are in this cycle right now?
#CryptoCycles #Bitcoin #Trading
12

·
--
If you're still FOMO buying every green candle without checking which cycle stage we're in, stop now.
This is the exact mistake that wiped out millions in paper gains last cycle when the music stopped. Nobody enjoys holding bags through an 80 percent drawdown because they couldn't tell markup from distribution.
These stages are all the same, just evolving with each cycle. The 2017 ICO mania sent $ETH soaring from $8 to $1,400 as everyone piled in.
Then 2021 flipped the script to DeFi and NFTs, with $SOL exploding from $1.50 to $260. Different narrative, identical greed.
$BTC played the same game, topping at $20k before the crash then $69k to $15k. Institutions and ETFs might be stretching this one out, but the human psychology underneath hasn't evolved one bit.
Where do you think this cycle goes from here compared to the last two?
#Bitcoin #CryptoCycles #MarketStages
If you're still FOMO buying every green candle without checking which cycle stage we're in, stop now.
This is the exact mistake that wiped out millions in paper gains last cycle when the music stopped. Nobody enjoys holding bags through an 80 percent drawdown because they couldn't tell markup from distribution.
These stages are all the same, just evolving with each cycle. The 2017 ICO mania sent $ETH soaring from $8 to $1,400 as everyone piled in.
Then 2021 flipped the script to DeFi and NFTs, with $SOL exploding from $1.50 to $260. Different narrative, identical greed.
$BTC played the same game, topping at $20k before the crash then $69k to $15k. Institutions and ETFs might be stretching this one out, but the human psychology underneath hasn't evolved one bit.
Where do you think this cycle goes from here compared to the last two?
#Bitcoin #CryptoCycles #MarketStages
This is the exact mistake that wiped out millions in paper gains last cycle when the music stopped. Nobody enjoys holding bags through an 80 percent drawdown because they couldn't tell markup from distribution.
These stages are all the same, just evolving with each cycle. The 2017 ICO mania sent $ETH soaring from $8 to $1,400 as everyone piled in.
Then 2021 flipped the script to DeFi and NFTs, with $SOL exploding from $1.50 to $260. Different narrative, identical greed.
$BTC played the same game, topping at $20k before the crash then $69k to $15k. Institutions and ETFs might be stretching this one out, but the human psychology underneath hasn't evolved one bit.
Where do you think this cycle goes from here compared to the last two?
#Bitcoin #CryptoCycles #MarketStages

18
Picture this: another Bitcoin cycle repeating the same stages as 2017 and 2021 while traders convince themselves the old risks no longer apply.
Getting chopped on false breakouts or holding through a deeper dump than expected is how most people lose money here. FOMO at the highs just compounds it.
These stages have always been the same on paper: accumulation, the grind higher, mania, then the dump. They just keep evolving with new capital and new players. $BTC still leads, but $ETH and $SOL correlations aren't what they used to be.
The last major drawdown was 77 percent from the peak. The cycle before that hit 84 percent. People positioning for a carbon copy keep getting surprised by how macro or ETF flows alter the timing.
Longing every dip works in theory. In practice the markdown phase can last longer than your patience, especially when everyone is watching the same historical patterns. That's the part most missed until it was too late.
Where do you think this cycle actually starts to diverge?
#Bitcoin #CryptoCycles #MarketRisks
Picture this: another Bitcoin cycle repeating the same stages as 2017 and 2021 while traders convince themselves the old risks no longer apply.
Getting chopped on false breakouts or holding through a deeper dump than expected is how most people lose money here. FOMO at the highs just compounds it.
These stages have always been the same on paper: accumulation, the grind higher, mania, then the dump. They just keep evolving with new capital and new players. $BTC still leads, but $ETH and $SOL correlations aren't what they used to be.
The last major drawdown was 77 percent from the peak. The cycle before that hit 84 percent. People positioning for a carbon copy keep getting surprised by how macro or ETF flows alter the timing.
Longing every dip works in theory. In practice the markdown phase can last longer than your patience, especially when everyone is watching the same historical patterns. That's the part most missed until it was too late.
Where do you think this cycle actually starts to diverge?
#Bitcoin #CryptoCycles #MarketRisks
Getting chopped on false breakouts or holding through a deeper dump than expected is how most people lose money here. FOMO at the highs just compounds it.
These stages have always been the same on paper: accumulation, the grind higher, mania, then the dump. They just keep evolving with new capital and new players. $BTC still leads, but $ETH and $SOL correlations aren't what they used to be.
The last major drawdown was 77 percent from the peak. The cycle before that hit 84 percent. People positioning for a carbon copy keep getting surprised by how macro or ETF flows alter the timing.
Longing every dip works in theory. In practice the markdown phase can last longer than your patience, especially when everyone is watching the same historical patterns. That's the part most missed until it was too late.
Where do you think this cycle actually starts to diverge?
#Bitcoin #CryptoCycles #MarketRisks

44

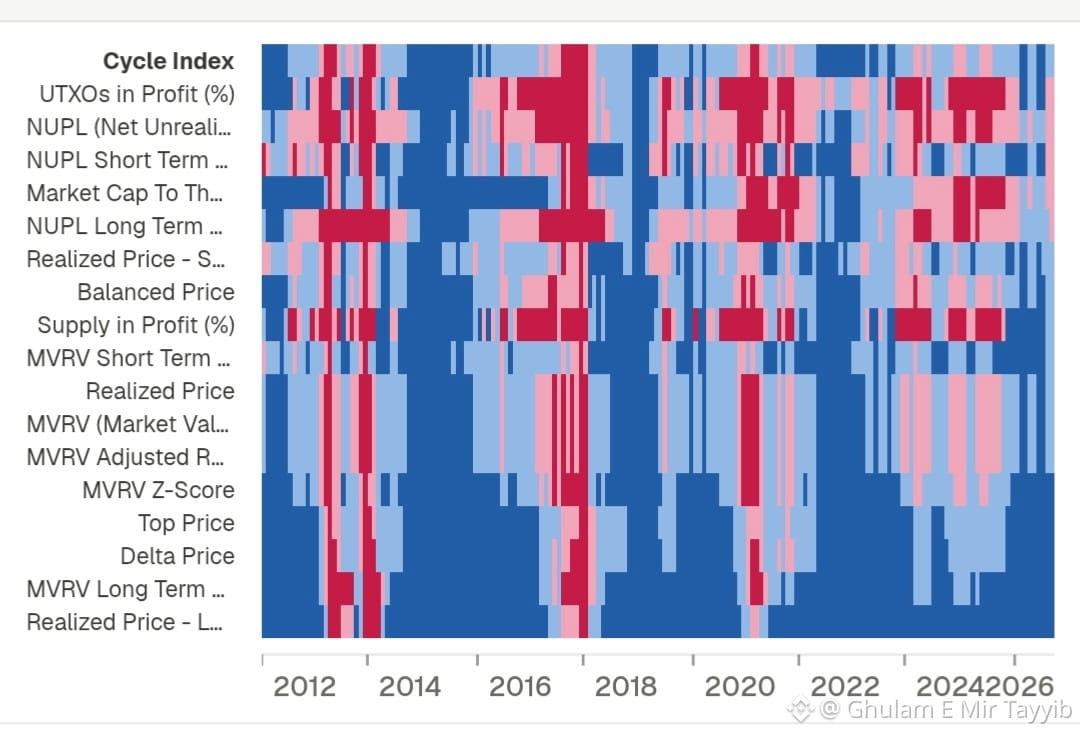
$BTC Cycle Index — a composite of NUPL, MVRV, Supply in Profit, and Realized Price — is a powerful way to spot where we stand in the market cycle.
The heatmap shows clear patterns: red zones mark historical tops (2013, 2017, 2021), while dark blue zones mark deep bottoms where smart money accumulated. Right now, signals are shifting from neutral toward the warmer end of the spectrum, suggesting the market may be entering a more mature phase.
On-chain data doesn't predict the future, but it shows where sentiment has extremes historically formed.
Where do you think we are in this cycle? 👇
#bitcoin #BTC #onchaindata a #CryptoCycles
{future}(BTCUSDT)
$BTC Cycle Index — a composite of NUPL, MVRV, Supply in Profit, and Realized Price — is a powerful way to spot where we stand in the market cycle.
The heatmap shows clear patterns: red zones mark historical tops (2013, 2017, 2021), while dark blue zones mark deep bottoms where smart money accumulated. Right now, signals are shifting from neutral toward the warmer end of the spectrum, suggesting the market may be entering a more mature phase.
On-chain data doesn't predict the future, but it shows where sentiment has extremes historically formed.
Where do you think we are in this cycle? 👇
#bitcoin #BTC #onchaindata a #CryptoCycles
The heatmap shows clear patterns: red zones mark historical tops (2013, 2017, 2021), while dark blue zones mark deep bottoms where smart money accumulated. Right now, signals are shifting from neutral toward the warmer end of the spectrum, suggesting the market may be entering a more mature phase.
On-chain data doesn't predict the future, but it shows where sentiment has extremes historically formed.
Where do you think we are in this cycle? 👇
#bitcoin #BTC #onchaindata a #CryptoCycles
2
39

·
--
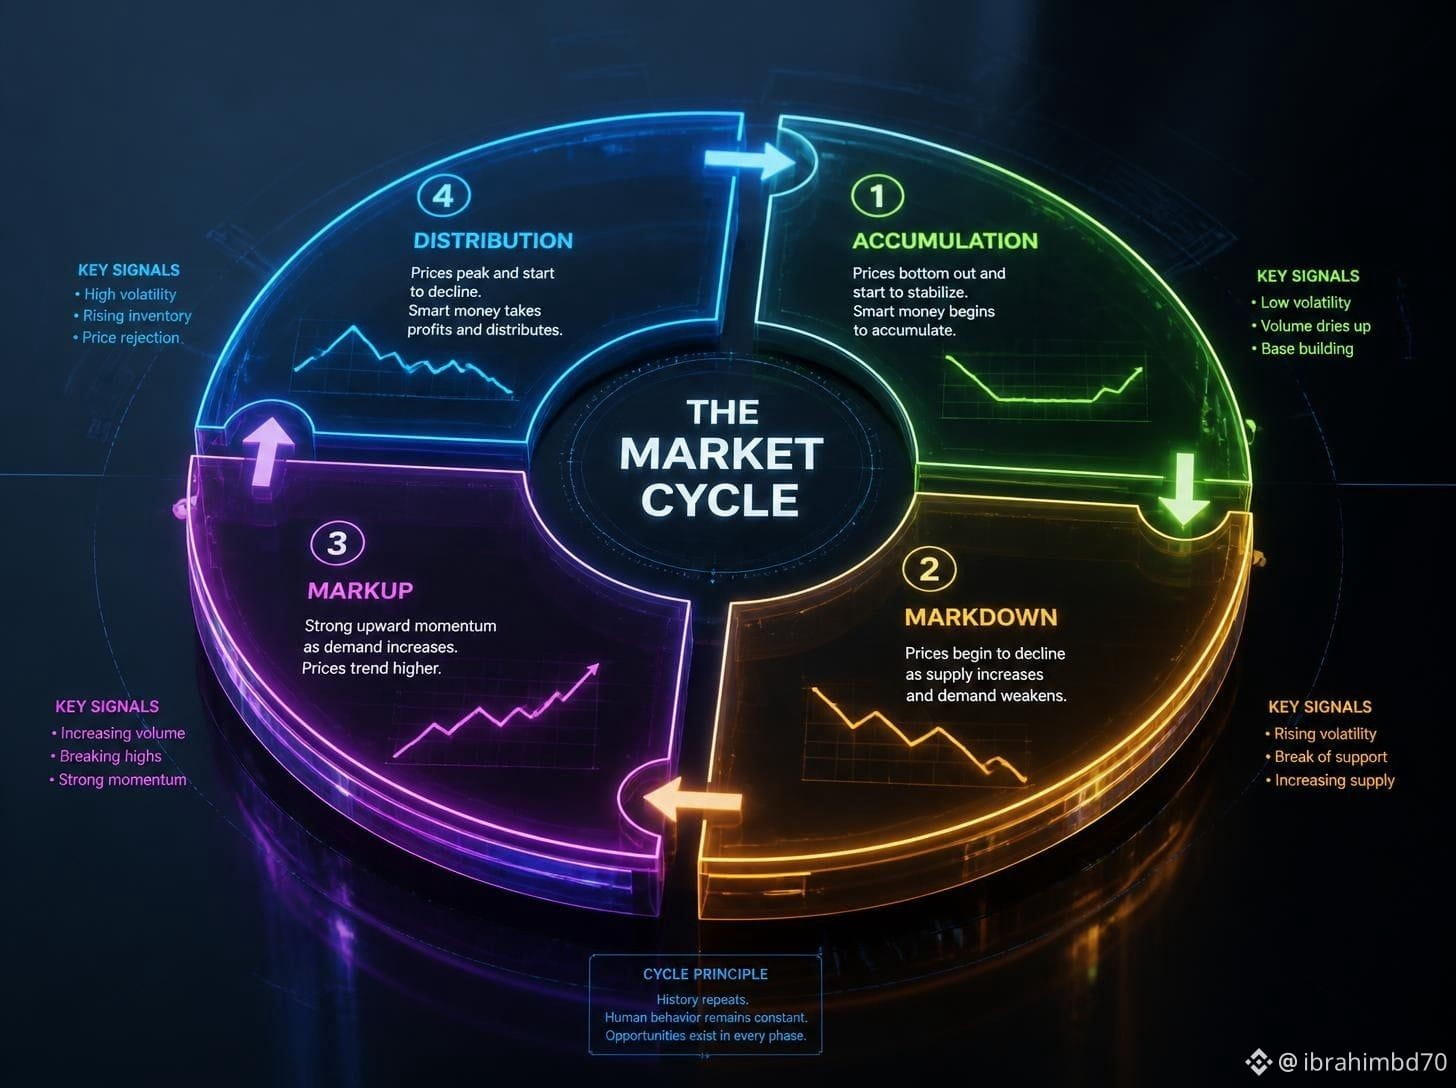
The crypto market operates on four primary phases: Accumulation, Markup, Distribution, and Markdown. Smart money accumulates when the crowd is silent and sells when the hype reaches maximum euphoria. Where do you think we currently sit in this 4-year cycle? 🔄
#CryptoCycles #MarketAnalysis #SmartMoney #Altcoins
The crypto market operates on four primary phases: Accumulation, Markup, Distribution, and Markdown. Smart money accumulates when the crowd is silent and sells when the hype reaches maximum euphoria. Where do you think we currently sit in this 4-year cycle? 🔄
#CryptoCycles #MarketAnalysis #SmartMoney #Altcoins
#CryptoCycles #MarketAnalysis #SmartMoney #Altcoins
72

·
--
The Crypto Cycle Playbook Is Being Rewritten in Real Time
Every cycle, someone declares "this time is different." It's almost always wrong. But the framework for timing crypto cycles is genuinely breaking down — not because of sentiment, but because of structural changes in who holds the supply.
The old four-year model worked when the market was small enough that halving shocks, retail FOMO, and leverage flushes explained most price action. That world is fading.
Three forces are dissolving the old framework:
Supply absorption has gone institutional. Spot ETFs, corporate treasuries, and sovereign vehicles don't sell during drawdowns — they add. This creates a structural floor that didn't exist before. The 80% wash-outs that reset sentiment can't happen the same way when patient capital sits underneath.
Leverage migrated off-exchange. OTC desks and structured products absorbed risk that used to cascade through visible order books. Liquidation cascades are shallower. The volatility that signaled cycle tops is now dampened.
The float is shrinking. Staking locks, long-term holder dormancy, and institutional buy-and-hold are removing marginal supply. When the marginal seller disappears, cycle timing becomes less about picking peaks and more about whether you're positioned at all.
Crypto will still have drawdowns. But the old strategy — wait for 80% off, buy the halving, sell the pump — was built for a market that no longer exists.
The question isn't whether cycles are over. It's whether your framework accounts for the fact that the participants have fundamentally changed.
$BTC $ETH $BNB
#CryptoCycles #MarketStructure #InstitutionalAdoption #Bitcoin #CryptoStrategy
The Crypto Cycle Playbook Is Being Rewritten in Real Time
Every cycle, someone declares "this time is different." It's almost always wrong. But the framework for timing crypto cycles is genuinely breaking down — not because of sentiment, but because of structural changes in who holds the supply.
The old four-year model worked when the market was small enough that halving shocks, retail FOMO, and leverage flushes explained most price action. That world is fading.
Three forces are dissolving the old framework:
Supply absorption has gone institutional. Spot ETFs, corporate treasuries, and sovereign vehicles don't sell during drawdowns — they add. This creates a structural floor that didn't exist before. The 80% wash-outs that reset sentiment can't happen the same way when patient capital sits underneath.
Leverage migrated off-exchange. OTC desks and structured products absorbed risk that used to cascade through visible order books. Liquidation cascades are shallower. The volatility that signaled cycle tops is now dampened.
The float is shrinking. Staking locks, long-term holder dormancy, and institutional buy-and-hold are removing marginal supply. When the marginal seller disappears, cycle timing becomes less about picking peaks and more about whether you're positioned at all.
Crypto will still have drawdowns. But the old strategy — wait for 80% off, buy the halving, sell the pump — was built for a market that no longer exists.
The question isn't whether cycles are over. It's whether your framework accounts for the fact that the participants have fundamentally changed.
$BTC $ETH $BNB
#CryptoCycles #MarketStructure #InstitutionalAdoption #Bitcoin #CryptoStrategy
Every cycle, someone declares "this time is different." It's almost always wrong. But the framework for timing crypto cycles is genuinely breaking down — not because of sentiment, but because of structural changes in who holds the supply.
The old four-year model worked when the market was small enough that halving shocks, retail FOMO, and leverage flushes explained most price action. That world is fading.
Three forces are dissolving the old framework:
Supply absorption has gone institutional. Spot ETFs, corporate treasuries, and sovereign vehicles don't sell during drawdowns — they add. This creates a structural floor that didn't exist before. The 80% wash-outs that reset sentiment can't happen the same way when patient capital sits underneath.
Leverage migrated off-exchange. OTC desks and structured products absorbed risk that used to cascade through visible order books. Liquidation cascades are shallower. The volatility that signaled cycle tops is now dampened.
The float is shrinking. Staking locks, long-term holder dormancy, and institutional buy-and-hold are removing marginal supply. When the marginal seller disappears, cycle timing becomes less about picking peaks and more about whether you're positioned at all.
Crypto will still have drawdowns. But the old strategy — wait for 80% off, buy the halving, sell the pump — was built for a market that no longer exists.
The question isn't whether cycles are over. It's whether your framework accounts for the fact that the participants have fundamentally changed.
$BTC $ETH $BNB
#CryptoCycles #MarketStructure #InstitutionalAdoption #Bitcoin #CryptoStrategy
38

·
--

Article
One Year Ago (BTC)1 year ago today, $BTC was trading at ~$107,300. 📅
Bitcoin Technical Analysis for June 28, 2025: trading around $107,331, with the Fear & Greed Index at 65 (Greed) — indicating optimism but not extreme euphoria. 25 bullish signals vs 5 bearish signals.
Today? BTC sits at $63,450 — down 40.2% over the past 12 months. (BanklessTimes)
From euphoria to extreme fear in 12 months.
This is the cycle. This is what it always looks like.
The people buying at $107K thought it was just the beginning.
The people buying at $63K think it's the end.
History says... neither group is fully right. 🔄
Where do you think we'll be exactly 1 year from today? Drop your guess below 👇
$BTC #OnThisDay #CryptoCycles
One Year Ago (BTC)
1 year ago today, $BTC was trading at ~$107,300. 📅
Bitcoin Technical Analysis for June 28, 2025: trading around $107,331, with the Fear & Greed Index at 65 (Greed) — indicating optimism but not extreme euphoria. 25 bullish signals vs 5 bearish signals.
Today? BTC sits at $63,450 — down 40.2% over the past 12 months. (BanklessTimes)
From euphoria to extreme fear in 12 months.
This is the cycle. This is what it always looks like.
The people buying at $107K thought it was just the beginning.
The people buying at $63K think it's the end.
History says... neither group is fully right. 🔄
Where do you think we'll be exactly 1 year from today? Drop your guess below 👇
$BTC #OnThisDay #CryptoCycles
Bitcoin Technical Analysis for June 28, 2025: trading around $107,331, with the Fear & Greed Index at 65 (Greed) — indicating optimism but not extreme euphoria. 25 bullish signals vs 5 bearish signals.
Today? BTC sits at $63,450 — down 40.2% over the past 12 months. (BanklessTimes)
From euphoria to extreme fear in 12 months.
This is the cycle. This is what it always looks like.
The people buying at $107K thought it was just the beginning.
The people buying at $63K think it's the end.
History says... neither group is fully right. 🔄
Where do you think we'll be exactly 1 year from today? Drop your guess below 👇
$BTC #OnThisDay #CryptoCycles
1
1
52

📚 Understanding Market Cycles: Why Crypto Moves in 4-Year Patterns
On July 2, 2026, Bitcoin $BTC at $60,728 is following the familiar pattern of crypto's 4-year halving cycle.
The cycle: bull run → peak → bear market → accumulation → halving → new bull run. Each phase lasts roughly 1-2 years.
Based on historical patterns, we're likely in the accumulation phase. Each cycle's lows are higher — $2.18T market cap even in a bearish phase confirms long-term adoption and growth.
📌 Key Takeaway:
Crypto's 4-year cycle suggests we're in the late accumulation phase — historically the best risk-reward window for long-term positioning.
#MarketCycles #CryptoCycles
#BinanceAlphaAlert
📚 Understanding Market Cycles: Why Crypto Moves in 4-Year Patterns
On July 2, 2026, Bitcoin $BTC at $60,728 is following the familiar pattern of crypto's 4-year halving cycle.
The cycle: bull run → peak → bear market → accumulation → halving → new bull run. Each phase lasts roughly 1-2 years.
Based on historical patterns, we're likely in the accumulation phase. Each cycle's lows are higher — $2.18T market cap even in a bearish phase confirms long-term adoption and growth.
📌 Key Takeaway:
Crypto's 4-year cycle suggests we're in the late accumulation phase — historically the best risk-reward window for long-term positioning.
#MarketCycles #CryptoCycles
#BinanceAlphaAlert
On July 2, 2026, Bitcoin $BTC at $60,728 is following the familiar pattern of crypto's 4-year halving cycle.
The cycle: bull run → peak → bear market → accumulation → halving → new bull run. Each phase lasts roughly 1-2 years.
Based on historical patterns, we're likely in the accumulation phase. Each cycle's lows are higher — $2.18T market cap even in a bearish phase confirms long-term adoption and growth.
📌 Key Takeaway:
Crypto's 4-year cycle suggests we're in the late accumulation phase — historically the best risk-reward window for long-term positioning.
#MarketCycles #CryptoCycles
#BinanceAlphaAlert
28
🐻 What Is a Bear Market: Understanding Crypto Cycles and Why They Matter
On July 12, 2026 with Bitcoin at $63,928 and analysts discussing parallels to 2022, it's worth understanding what bear markets actually are. A bear market is defined as a >20% decline from recent highs.
Bear markets in crypto typically last 12-18 months and are characterized by low volume, range-bound trading, and gradual accumulation by informed investors.
The total market cap of $2.28T is well below its all-time high, but the presence of 17513 active projects shows that building continues through the downturn.
📌 Key Takeaway:
Bear markets are natural phases of crypto cycles — they separate sustainable projects from speculation and set the stage for the next bull run.
#BearMarket #CryptoCycles #CryptoEducation
#BinanceAlphaAlert
🐻 What Is a Bear Market: Understanding Crypto Cycles and Why They Matter
On July 12, 2026 with Bitcoin at $63,928 and analysts discussing parallels to 2022, it's worth understanding what bear markets actually are. A bear market is defined as a >20% decline from recent highs.
Bear markets in crypto typically last 12-18 months and are characterized by low volume, range-bound trading, and gradual accumulation by informed investors.
The total market cap of $2.28T is well below its all-time high, but the presence of 17513 active projects shows that building continues through the downturn.
📌 Key Takeaway:
Bear markets are natural phases of crypto cycles — they separate sustainable projects from speculation and set the stage for the next bull run.
#BearMarket #CryptoCycles #CryptoEducation
#BinanceAlphaAlert
On July 12, 2026 with Bitcoin at $63,928 and analysts discussing parallels to 2022, it's worth understanding what bear markets actually are. A bear market is defined as a >20% decline from recent highs.
Bear markets in crypto typically last 12-18 months and are characterized by low volume, range-bound trading, and gradual accumulation by informed investors.
The total market cap of $2.28T is well below its all-time high, but the presence of 17513 active projects shows that building continues through the downturn.
📌 Key Takeaway:
Bear markets are natural phases of crypto cycles — they separate sustainable projects from speculation and set the stage for the next bull run.
#BearMarket #CryptoCycles #CryptoEducation
#BinanceAlphaAlert
30

·
--
$BTC BEAR MARKET CYCLES AVERAGE 12 MONTHS — WE ARE 9 MONTHS IN 📉
Historical data shows BTC bear phases typically last around one year. With nine months already behind us, the remaining window is narrowing. This is the accumulation zone that precedes the next expansion phase.
Volume is compressing on the weekly chart and funding rates have flattened — classic signs of capitulation exhaustion. The next three months could define the entry of the cycle.
Are you positioning here or waiting for the final flush?
Not financial advice. Always manage your risk.
#BTC #BearMarket #Accumulation #CryptoCycles
📉
$BTC BEAR MARKET CYCLES AVERAGE 12 MONTHS — WE ARE 9 MONTHS IN 📉
Historical data shows BTC bear phases typically last around one year. With nine months already behind us, the remaining window is narrowing. This is the accumulation zone that precedes the next expansion phase.
Volume is compressing on the weekly chart and funding rates have flattened — classic signs of capitulation exhaustion. The next three months could define the entry of the cycle.
Are you positioning here or waiting for the final flush?
Not financial advice. Always manage your risk.
#BTC #BearMarket #Accumulation #CryptoCycles
📉
Historical data shows BTC bear phases typically last around one year. With nine months already behind us, the remaining window is narrowing. This is the accumulation zone that precedes the next expansion phase.
Volume is compressing on the weekly chart and funding rates have flattened — classic signs of capitulation exhaustion. The next three months could define the entry of the cycle.
Are you positioning here or waiting for the final flush?
Not financial advice. Always manage your risk.
#BTC #BearMarket #Accumulation #CryptoCycles
📉
50

·
--
Bullish
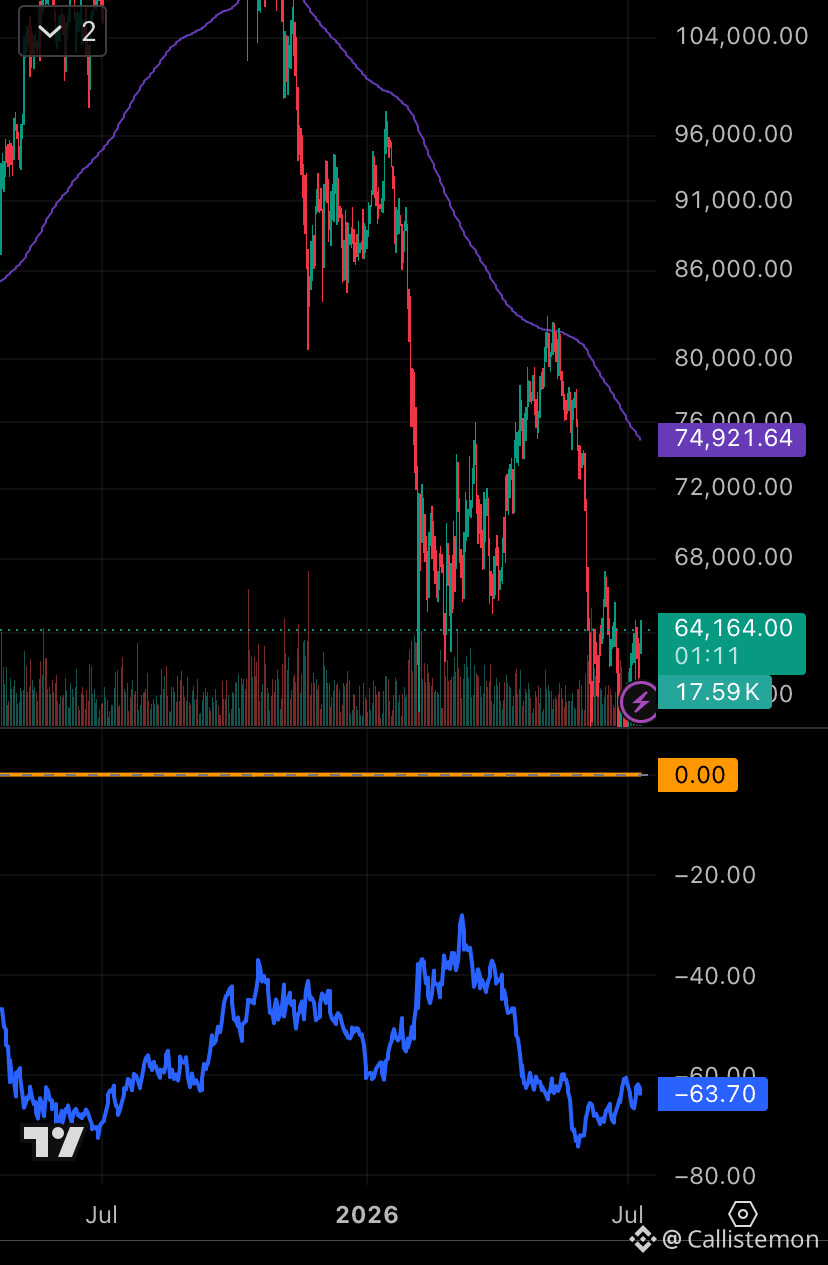
26 months after the halving, and BTC is sitting almost exactly where it started.
(Quick note on the chart: the flat orange line isn't a bug, that's literally the finding. It tracks this cycle's % return since the April 2024 halving, and right now it's hovering right around zero.)
That sounds bearish until you check what happened last cycle at the same point: the blue line shows 26 months after the 2020 halving, BTC was down 63.7% from its halving-day price deep in the 2022 bear market.
This cycle? Roughly flat. Not up massively, but nowhere near the drawdown the last cycle saw at this same stage.
Two ways to read that:
This cycle matured faster and already had its correction, or
The next leg (up or down) hasn't happened yet, and "flat" is just where we are before it does
Either way, comparing cycles at the same point in time — not just today's price — tells a very different story than the daily headlines do.
Charted this myself against the 2020 cycle, halving-day aligned. Curious what others make of it 👇
#BTC #bitcoin #CryptoCycles
26 months after the halving, and BTC is sitting almost exactly where it started.
(Quick note on the chart: the flat orange line isn't a bug, that's literally the finding. It tracks this cycle's % return since the April 2024 halving, and right now it's hovering right around zero.)
That sounds bearish until you check what happened last cycle at the same point: the blue line shows 26 months after the 2020 halving, BTC was down 63.7% from its halving-day price deep in the 2022 bear market.
This cycle? Roughly flat. Not up massively, but nowhere near the drawdown the last cycle saw at this same stage.
Two ways to read that:
This cycle matured faster and already had its correction, or
The next leg (up or down) hasn't happened yet, and "flat" is just where we are before it does
Either way, comparing cycles at the same point in time — not just today's price — tells a very different story than the daily headlines do.
Charted this myself against the 2020 cycle, halving-day aligned. Curious what others make of it 👇
#BTC #bitcoin #CryptoCycles
(Quick note on the chart: the flat orange line isn't a bug, that's literally the finding. It tracks this cycle's % return since the April 2024 halving, and right now it's hovering right around zero.)
That sounds bearish until you check what happened last cycle at the same point: the blue line shows 26 months after the 2020 halving, BTC was down 63.7% from its halving-day price deep in the 2022 bear market.
This cycle? Roughly flat. Not up massively, but nowhere near the drawdown the last cycle saw at this same stage.
Two ways to read that:
This cycle matured faster and already had its correction, or
The next leg (up or down) hasn't happened yet, and "flat" is just where we are before it does
Either way, comparing cycles at the same point in time — not just today's price — tells a very different story than the daily headlines do.
Charted this myself against the 2020 cycle, halving-day aligned. Curious what others make of it 👇
#BTC #bitcoin #CryptoCycles
582

·
--
People still thinking “this coin is different” after getting wrecked 5 times. Impressive. Every cycle has its special narrative. Most of them end the same way — distribution, lower highs, and quiet timelines. Pattern recognition is free.
#CryptoCycles #Narratives $SOL L $ETH
People still thinking “this coin is different” after getting wrecked 5 times. Impressive. Every cycle has its special narrative. Most of them end the same way — distribution, lower highs, and quiet timelines. Pattern recognition is free.
#CryptoCycles #Narratives $SOL L $ETH
#CryptoCycles #Narratives $SOL L $ETH
26

·
--
Did you know Bitcoin's recent price dip is actually a sign of something *normal* for the crypto market, not a doomsday scenario?
Many people see Bitcoin falling below $60,000 and think "disaster!" But what's really happening is a natural market cycle, often referred to as a "bear market" or a correction. Think of it like a popular stock that's had a huge run-up; sometimes it needs to pull back to find a healthier footing before its next climb. This current situation, where both Bitcoin and Ether are ending a quarter down, and heading for a losing first half of the year, goes against the typical historical pattern, which can be unsettling but is part of the larger market's ebb and flow.
#CryptoCycles #MarketCorrections
Imagine a rollercoaster. It goes up, it goes down, but the overall trend can still be upwards over time. Bitcoin's price movements, even the dips, are part of this dynamic ride. The fact that it's a "back-to-back quarterly loss" is unusual, yes, but it doesn't erase the long-term potential. It's a chance for longer-term investors to potentially buy at lower prices.
The takeaway here is to focus on the long game. Don't let short-term price swings derail your strategy. Understand that crypto markets are volatile and corrections are normal. Use these times for research and to reinforce your understanding of the projects you believe in. #LongTermInvesting
What are your thoughts on these market corrections? Do they make you more cautious or more optimistic?
Did you know Bitcoin's recent price dip is actually a sign of something *normal* for the crypto market, not a doomsday scenario?
Many people see Bitcoin falling below $60,000 and think "disaster!" But what's really happening is a natural market cycle, often referred to as a "bear market" or a correction. Think of it like a popular stock that's had a huge run-up; sometimes it needs to pull back to find a healthier footing before its next climb. This current situation, where both Bitcoin and Ether are ending a quarter down, and heading for a losing first half of the year, goes against the typical historical pattern, which can be unsettling but is part of the larger market's ebb and flow.
#CryptoCycles #MarketCorrections
Imagine a rollercoaster. It goes up, it goes down, but the overall trend can still be upwards over time. Bitcoin's price movements, even the dips, are part of this dynamic ride. The fact that it's a "back-to-back quarterly loss" is unusual, yes, but it doesn't erase the long-term potential. It's a chance for longer-term investors to potentially buy at lower prices.
The takeaway here is to focus on the long game. Don't let short-term price swings derail your strategy. Understand that crypto markets are volatile and corrections are normal. Use these times for research and to reinforce your understanding of the projects you believe in. #LongTermInvesting
What are your thoughts on these market corrections? Do they make you more cautious or more optimistic?
Many people see Bitcoin falling below $60,000 and think "disaster!" But what's really happening is a natural market cycle, often referred to as a "bear market" or a correction. Think of it like a popular stock that's had a huge run-up; sometimes it needs to pull back to find a healthier footing before its next climb. This current situation, where both Bitcoin and Ether are ending a quarter down, and heading for a losing first half of the year, goes against the typical historical pattern, which can be unsettling but is part of the larger market's ebb and flow.
#CryptoCycles #MarketCorrections
Imagine a rollercoaster. It goes up, it goes down, but the overall trend can still be upwards over time. Bitcoin's price movements, even the dips, are part of this dynamic ride. The fact that it's a "back-to-back quarterly loss" is unusual, yes, but it doesn't erase the long-term potential. It's a chance for longer-term investors to potentially buy at lower prices.
The takeaway here is to focus on the long game. Don't let short-term price swings derail your strategy. Understand that crypto markets are volatile and corrections are normal. Use these times for research and to reinforce your understanding of the projects you believe in. #LongTermInvesting
What are your thoughts on these market corrections? Do they make you more cautious or more optimistic?
89

·
--
Bearish
Stop Trading 2021. The Market Has Changed. 🛑
We all learned the same cycle: $BTC pumps ➡️ $ETH follows ➡️ Altseason ensues.
But let’s be real... it’s not working like that anymore. Why are we still trying to force a 2021 strategy into a 2026 reality? 🧠
Here’s why your old playbook is failing:
BTC is a Black Hole 🕳️: Institutional ETFs are absorbing billions. This capital is parked in BTC and stays there. It doesn’t rotate downstream like retail money used to.
Liquidity is Fragmented 🧩: Back then, the tide lifted all boats. Today? Liquidity is trapped in isolated silos (Solana, Base, etc.). Everything isn't pumping at once.
The "Wait and See" Trap ⏳: We see major players accumulating in the shadows, while most of us are waiting for that "perfect confirmation." That’s when we miss the move.
My take? 🎯 We’re playing a totally different game now.
Instead of waiting for the "old" cycle, we need to:
👉 Stop chasing everything.
👉 Focus on where the institutional inflows are actually landing.
👉 Accept that the "Altseason" isn't a guarantee anymore—it's a choice.
⚠️ Disclaimer & DYOR:
This post is for educational and informational purposes only and does not constitute financial advice. Never invest money you cannot afford to lose.
#Bitcoin #TradingPsychology #CryptoCycles #BTC #MarketUpdate #BinanceSquare
Stop Trading 2021. The Market Has Changed. 🛑
We all learned the same cycle: $BTC pumps ➡️ $ETH follows ➡️ Altseason ensues.
But let’s be real... it’s not working like that anymore. Why are we still trying to force a 2021 strategy into a 2026 reality? 🧠
Here’s why your old playbook is failing:
BTC is a Black Hole 🕳️: Institutional ETFs are absorbing billions. This capital is parked in BTC and stays there. It doesn’t rotate downstream like retail money used to.
Liquidity is Fragmented 🧩: Back then, the tide lifted all boats. Today? Liquidity is trapped in isolated silos (Solana, Base, etc.). Everything isn't pumping at once.
The "Wait and See" Trap ⏳: We see major players accumulating in the shadows, while most of us are waiting for that "perfect confirmation." That’s when we miss the move.
My take? 🎯 We’re playing a totally different game now.
Instead of waiting for the "old" cycle, we need to:
👉 Stop chasing everything.
👉 Focus on where the institutional inflows are actually landing.
👉 Accept that the "Altseason" isn't a guarantee anymore—it's a choice.
⚠️ Disclaimer & DYOR:
This post is for educational and informational purposes only and does not constitute financial advice. Never invest money you cannot afford to lose.
#Bitcoin #TradingPsychology #CryptoCycles #BTC #MarketUpdate #BinanceSquare
We all learned the same cycle: $BTC pumps ➡️ $ETH follows ➡️ Altseason ensues.
But let’s be real... it’s not working like that anymore. Why are we still trying to force a 2021 strategy into a 2026 reality? 🧠
Here’s why your old playbook is failing:
BTC is a Black Hole 🕳️: Institutional ETFs are absorbing billions. This capital is parked in BTC and stays there. It doesn’t rotate downstream like retail money used to.
Liquidity is Fragmented 🧩: Back then, the tide lifted all boats. Today? Liquidity is trapped in isolated silos (Solana, Base, etc.). Everything isn't pumping at once.
The "Wait and See" Trap ⏳: We see major players accumulating in the shadows, while most of us are waiting for that "perfect confirmation." That’s when we miss the move.
My take? 🎯 We’re playing a totally different game now.
Instead of waiting for the "old" cycle, we need to:
👉 Stop chasing everything.
👉 Focus on where the institutional inflows are actually landing.
👉 Accept that the "Altseason" isn't a guarantee anymore—it's a choice.
⚠️ Disclaimer & DYOR:
This post is for educational and informational purposes only and does not constitute financial advice. Never invest money you cannot afford to lose.
#Bitcoin #TradingPsychology #CryptoCycles #BTC #MarketUpdate #BinanceSquare

1
4
319
📚 Crypto Cycles: What Triggers an Altcoin Season?
On June 26, 2026, Bitcoin $BTC dominance is 55.94% and Ethereum $ETH dominance is 8.71%. Altcoin season happens when investors rotate profits from BTC into smaller cryptocurrencies, driving their prices higher.
For altseason to begin, BTC needs to stabilize first (stopping at $58K), then BTC dominance must decline below 50%. When dominance falls, capital flows from BTC into Ethereum $ETH, Solana $SOL, and smaller altcoins.
📌 Key Takeaway:
Altcoin season requires BTC dominance below 50% — at 55.94%, we're still firmly in Bitcoin season.
#Altcoins #Bitcoin #CryptoCycles
#BinanceAlphaAlert
📚 Crypto Cycles: What Triggers an Altcoin Season?
On June 26, 2026, Bitcoin $BTC dominance is 55.94% and Ethereum $ETH dominance is 8.71%. Altcoin season happens when investors rotate profits from BTC into smaller cryptocurrencies, driving their prices higher.
For altseason to begin, BTC needs to stabilize first (stopping at $58K), then BTC dominance must decline below 50%. When dominance falls, capital flows from BTC into Ethereum $ETH , Solana $SOL , and smaller altcoins.
📌 Key Takeaway:
Altcoin season requires BTC dominance below 50% — at 55.94%, we're still firmly in Bitcoin season.
#Altcoins #Bitcoin #CryptoCycles
#BinanceAlphaAlert
On June 26, 2026, Bitcoin $BTC dominance is 55.94% and Ethereum $ETH dominance is 8.71%. Altcoin season happens when investors rotate profits from BTC into smaller cryptocurrencies, driving their prices higher.
For altseason to begin, BTC needs to stabilize first (stopping at $58K), then BTC dominance must decline below 50%. When dominance falls, capital flows from BTC into Ethereum $ETH , Solana $SOL , and smaller altcoins.
📌 Key Takeaway:
Altcoin season requires BTC dominance below 50% — at 55.94%, we're still firmly in Bitcoin season.
#Altcoins #Bitcoin #CryptoCycles
#BinanceAlphaAlert
13
·
--
Market Cycle Psychology: Why the Crowd Is Always Late
Crypto markets move in predictable emotional cycles, yet the majority still buy at euphoria and sell at despair. Understanding where we are in the cycle matters more than predicting the next price move.
The most powerful signal is not price — it is the gap between sentiment and fundamentals. When fear dominates headlines but on-chain activity stays elevated, whales are accumulating quietly. When retail euphoria peaks and social volume explodes, smart money is distributing into the crowd.
Key cycle markers to track:
• Exchange reserves declining while open interest rises = conviction positioning
• Funding rates flipping positive for weeks straight = late-cycle leverage buildup
• Stablecoin supply growing on-chain = dry powder waiting for better entry
• Social dominance of altcoins spiking above 60% = late-rotation warning
$BTC remains the cycle anchor. Its dominance chart tells the story before altcoins move. $ETH beta historically compresses at cycle peaks and expands early in recoveries. $BNB tends to outperform in mid-cycle when fee revenue is growing.
The edge is not speed — it is patience. Position before the narrative, not after the headlines.
#CryptoCycles #MarketPsychology #BTC #CryptoStrategy #OnChainAlpha
Market Cycle Psychology: Why the Crowd Is Always Late
Crypto markets move in predictable emotional cycles, yet the majority still buy at euphoria and sell at despair. Understanding where we are in the cycle matters more than predicting the next price move.
The most powerful signal is not price — it is the gap between sentiment and fundamentals. When fear dominates headlines but on-chain activity stays elevated, whales are accumulating quietly. When retail euphoria peaks and social volume explodes, smart money is distributing into the crowd.
Key cycle markers to track:
• Exchange reserves declining while open interest rises = conviction positioning
• Funding rates flipping positive for weeks straight = late-cycle leverage buildup
• Stablecoin supply growing on-chain = dry powder waiting for better entry
• Social dominance of altcoins spiking above 60% = late-rotation warning
$BTC remains the cycle anchor. Its dominance chart tells the story before altcoins move. $ETH beta historically compresses at cycle peaks and expands early in recoveries. $BNB tends to outperform in mid-cycle when fee revenue is growing.
The edge is not speed — it is patience. Position before the narrative, not after the headlines.
#CryptoCycles #MarketPsychology #BTC #CryptoStrategy #OnChainAlpha
Crypto markets move in predictable emotional cycles, yet the majority still buy at euphoria and sell at despair. Understanding where we are in the cycle matters more than predicting the next price move.
The most powerful signal is not price — it is the gap between sentiment and fundamentals. When fear dominates headlines but on-chain activity stays elevated, whales are accumulating quietly. When retail euphoria peaks and social volume explodes, smart money is distributing into the crowd.
Key cycle markers to track:
• Exchange reserves declining while open interest rises = conviction positioning
• Funding rates flipping positive for weeks straight = late-cycle leverage buildup
• Stablecoin supply growing on-chain = dry powder waiting for better entry
• Social dominance of altcoins spiking above 60% = late-rotation warning
$BTC remains the cycle anchor. Its dominance chart tells the story before altcoins move. $ETH beta historically compresses at cycle peaks and expands early in recoveries. $BNB tends to outperform in mid-cycle when fee revenue is growing.
The edge is not speed — it is patience. Position before the narrative, not after the headlines.
#CryptoCycles #MarketPsychology #BTC #CryptoStrategy #OnChainAlpha
70

Verified
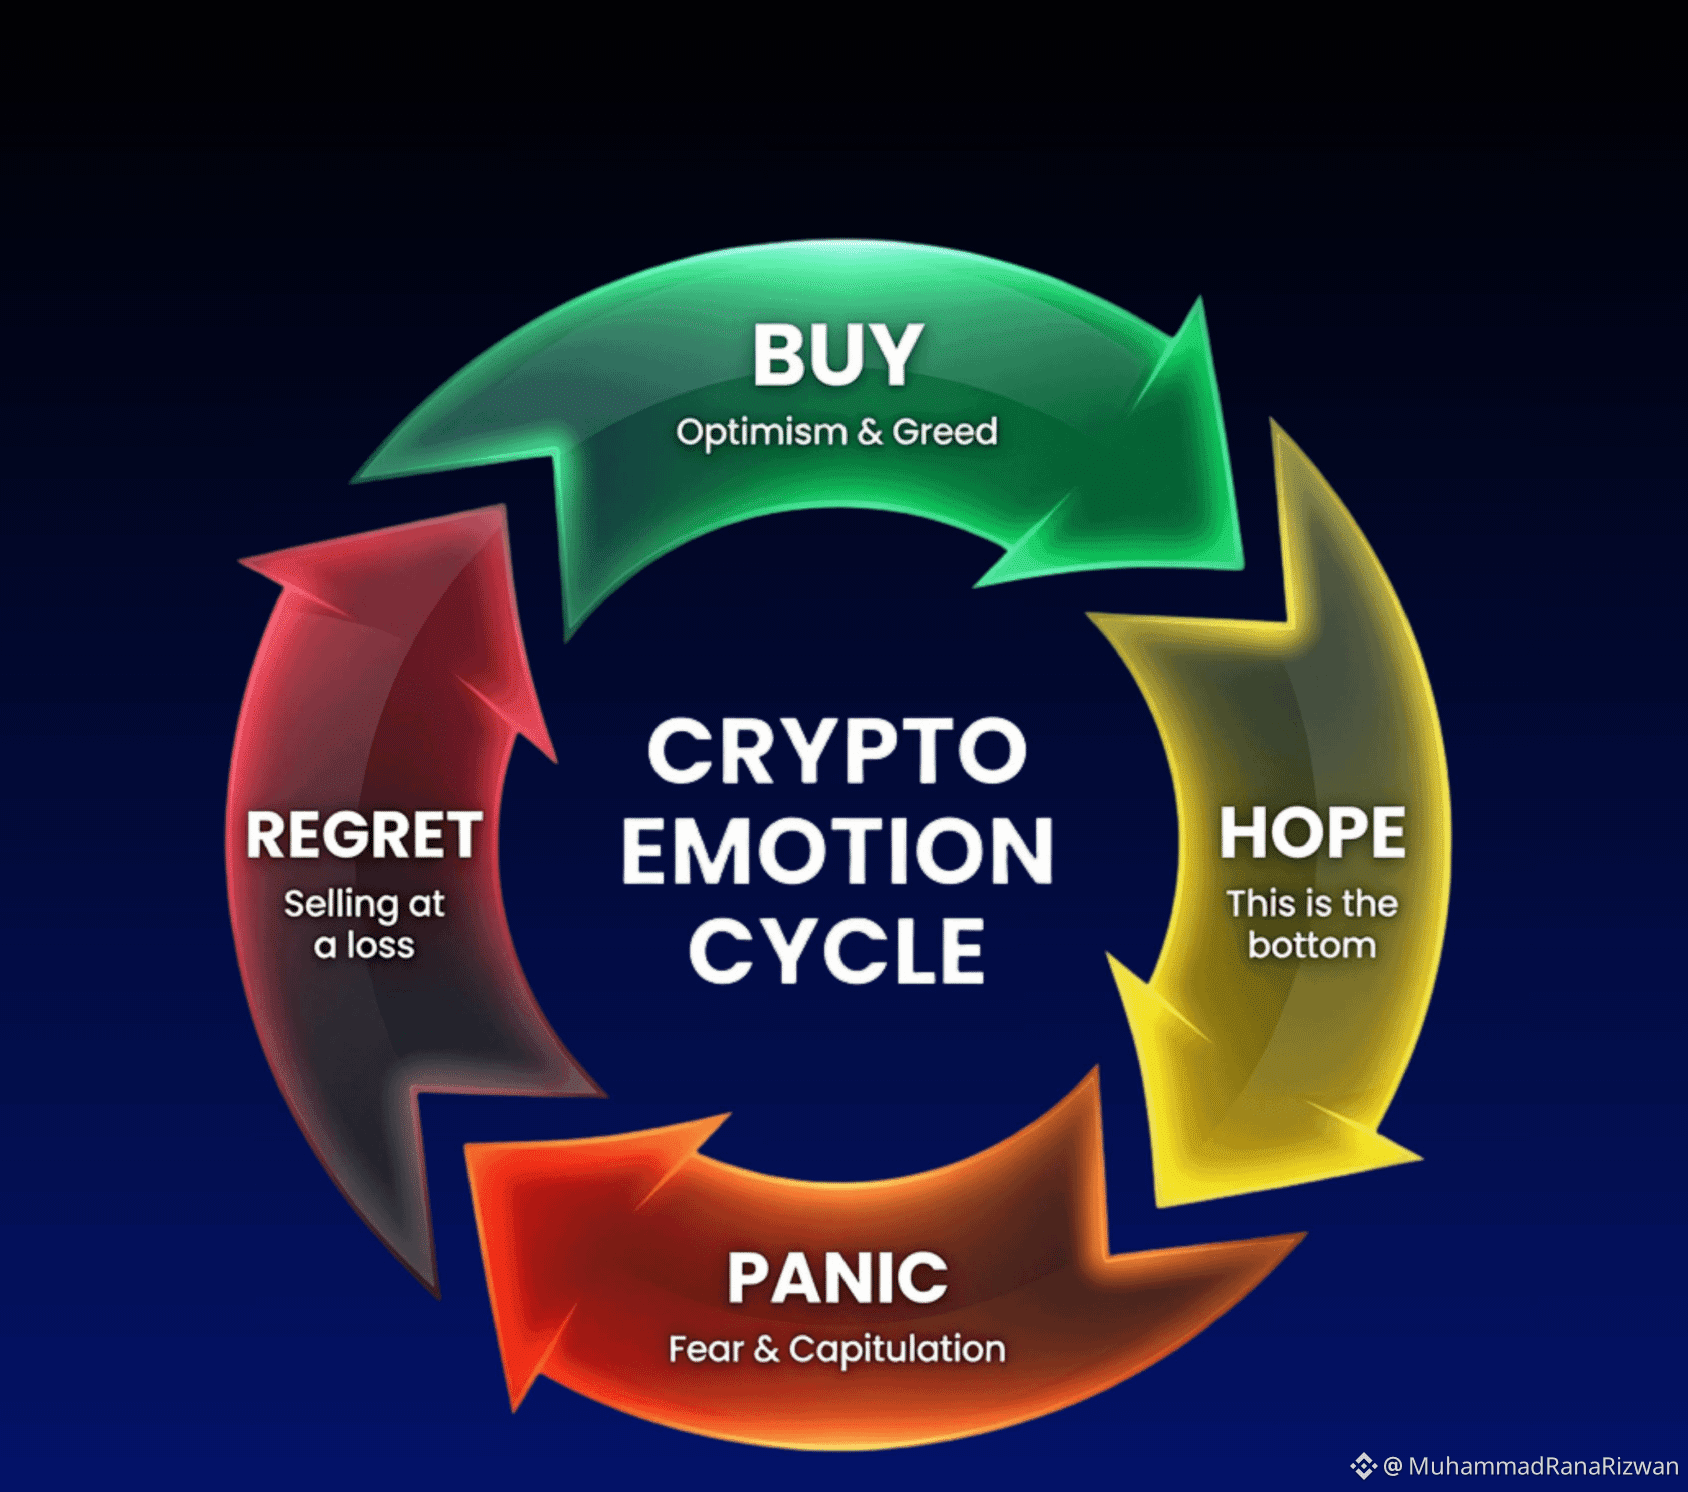
🚨 The Crypto Emotion Cycle is real, and it repeats every bull run.
From Optimism & Greed → Hope → Panic & Capitulation → Regret… and back to BUY again.
Most traders lose money because they let emotions control their decisions.
The winners? They stay disciplined and buy when others are fearful.
Master the cycle. Trade smarter.🤝
#crypto #CryptoCycles #MarketSentimentToday
🚨 The Crypto Emotion Cycle is real, and it repeats every bull run.
From Optimism & Greed → Hope → Panic & Capitulation → Regret… and back to BUY again.
Most traders lose money because they let emotions control their decisions.
The winners? They stay disciplined and buy when others are fearful.
Master the cycle. Trade smarter.🤝
#crypto #CryptoCycles #MarketSentimentToday
From Optimism & Greed → Hope → Panic & Capitulation → Regret… and back to BUY again.
Most traders lose money because they let emotions control their decisions.
The winners? They stay disciplined and buy when others are fearful.
Master the cycle. Trade smarter.🤝
#crypto #CryptoCycles #MarketSentimentToday
4
1
885


·
--
🌊 XRP Eyes $8-$27 After 2026 Bottom? Analyst Says Bear Was “Milder” 📉
Analyst ChartNerd: XRP’s 70% drop from $3.65 ATH is way shallower than past 85-90% bear crashes. Cycle bottom may hit before end of 2026, then rocket to Fibonacci targets 🚀
📊 Historical Cycle Breakdown 🔍
▶️ Milder drawdown Past XRP bears = 400-790 days + 85-90% crashes. Current: ∼350 days + 70% drop from July 2025 $3.65 ATH 📊 “Lessening severity” = meaningful pattern
▶️ Bottom zone near ChartNerd: “Historical bottom between now and EOY is fast approaching”. $ 1.05 = 19-month low, then bounce to $ 1.20 🧊
▶️ 2014 exception That cycle dropped 96% in 210 days + took 1,200 days to break ATH. Not the norm
🎯 XRP Roadmap to $27 🗺️
▶️ Next steps More downside possible first to form true cycle low → accumulation phase → breakout 🐋
▶️ Fibonacci targets If bottom holds: $8 → $ 13 → $27 on extensions 📈 Long-term bull case
▶️ Current price ∼$ 1.15 as of Jun 8. Down 12% weekly, 19% monthly. Still holding above $ 1 support
Bottom Line ⚡
This bear is shorter + shallower vs history. $ 1.05- $ 1.15 = watch zone for cycle bottom. Break it = more pain. Hold it = setup for $8-$27 bull run. Patience key till accumulation completes
#CryptoCycles #Fibonacci #XRPBottom #AltcoinTargets #XRPtoTheMoon🔥
$XRP
{future}(XRPUSDT)
🌊 XRP Eyes $8-$27 After 2026 Bottom? Analyst Says Bear Was “Milder” 📉
Analyst ChartNerd: XRP’s 70% drop from $3.65 ATH is way shallower than past 85-90% bear crashes. Cycle bottom may hit before end of 2026, then rocket to Fibonacci targets 🚀
📊 Historical Cycle Breakdown 🔍
▶️ Milder drawdown Past XRP bears = 400-790 days + 85-90% crashes. Current: ∼350 days + 70% drop from July 2025 $3.65 ATH 📊 “Lessening severity” = meaningful pattern
▶️ Bottom zone near ChartNerd: “Historical bottom between now and EOY is fast approaching”. $ 1.05 = 19-month low, then bounce to $ 1.20 🧊
▶️ 2014 exception That cycle dropped 96% in 210 days + took 1,200 days to break ATH. Not the norm
🎯 XRP Roadmap to $27 🗺️
▶️ Next steps More downside possible first to form true cycle low → accumulation phase → breakout 🐋
▶️ Fibonacci targets If bottom holds: $8 → $ 13 → $27 on extensions 📈 Long-term bull case
▶️ Current price ∼$ 1.15 as of Jun 8. Down 12% weekly, 19% monthly. Still holding above $ 1 support
Bottom Line ⚡
This bear is shorter + shallower vs history. $ 1.05- $ 1.15 = watch zone for cycle bottom. Break it = more pain. Hold it = setup for $8-$27 bull run. Patience key till accumulation completes
#CryptoCycles #Fibonacci #XRPBottom #AltcoinTargets #XRPtoTheMoon🔥
$XRP
Analyst ChartNerd: XRP’s 70% drop from $3.65 ATH is way shallower than past 85-90% bear crashes. Cycle bottom may hit before end of 2026, then rocket to Fibonacci targets 🚀
📊 Historical Cycle Breakdown 🔍
▶️ Milder drawdown Past XRP bears = 400-790 days + 85-90% crashes. Current: ∼350 days + 70% drop from July 2025 $3.65 ATH 📊 “Lessening severity” = meaningful pattern
▶️ Bottom zone near ChartNerd: “Historical bottom between now and EOY is fast approaching”. $ 1.05 = 19-month low, then bounce to $ 1.20 🧊
▶️ 2014 exception That cycle dropped 96% in 210 days + took 1,200 days to break ATH. Not the norm
🎯 XRP Roadmap to $27 🗺️
▶️ Next steps More downside possible first to form true cycle low → accumulation phase → breakout 🐋
▶️ Fibonacci targets If bottom holds: $8 → $ 13 → $27 on extensions 📈 Long-term bull case
▶️ Current price ∼$ 1.15 as of Jun 8. Down 12% weekly, 19% monthly. Still holding above $ 1 support
Bottom Line ⚡
This bear is shorter + shallower vs history. $ 1.05- $ 1.15 = watch zone for cycle bottom. Break it = more pain. Hold it = setup for $8-$27 bull run. Patience key till accumulation completes
#CryptoCycles #Fibonacci #XRPBottom #AltcoinTargets #XRPtoTheMoon🔥
$XRP

1
10
681

Has the new 91-day Bitcoin cycle started? | Guide to your next move ⏳“The 91-Day Course” (or the quarterly calendar cycle) is considered one of the most time-based tools that whales and professional investors monitor to identify market bottoms and tops. Bitcoin entering a new 91-day phase or cycle usually means liquidity is shifting from a dull accumulation phase to a price-explosion phase—or vice versa!
Has the new 91-day Bitcoin cycle started? | Guide to your next move ⏳
“The 91-Day Course” (or the quarterly calendar cycle) is considered one of the most time-based tools that whales and professional investors monitor to identify market bottoms and tops. Bitcoin entering a new 91-day phase or cycle usually means liquidity is shifting from a dull accumulation phase to a price-explosion phase—or vice versa!
69
Log in to explore more content
Join global crypto users on Binance Square
⚡️ Get latest and useful information about crypto.
💬 Trusted by the world’s largest crypto exchange.
👍 Discover real insights from verified creators.
Email / Phone number
Trending Topics
1
#ADAGains10%Above$0.27
1,060 views
50 Discussing
2
#ETHUp70%InQ3ButLiquidityFalls
13,805 views
257 Discussing
3
#EthStakingExitQueueHits2026High
5,157 views
271 Discussing
4
#FedOctoberHoldOdds82.3%
7,969 views
257 Discussing
5
#Nikkei225Jumps2.5%ToThreeMonthHigh
42,728 views
678 Discussing
6
#CircleMints$2.75BUSDCOnSolanaIn7Days
352 views
17 Discussing
7
#DriftHackVictimsBeginClaims
121,441 views
1,333 Discussing
8
#SolanaTokenizedStockVolumeTops$4.4BInSeptember
10,637 views
124 Discussing
9
#BitcoinSpotETFsDraw$6.34BInflowsInQ3
39,045 views
238 Discussing
10
#EthereumValidatorExitQueueJumps392%
254,463 views
2,259 Discussing