

#app
app
71,442 views
444 Discussing
Hot
Latest


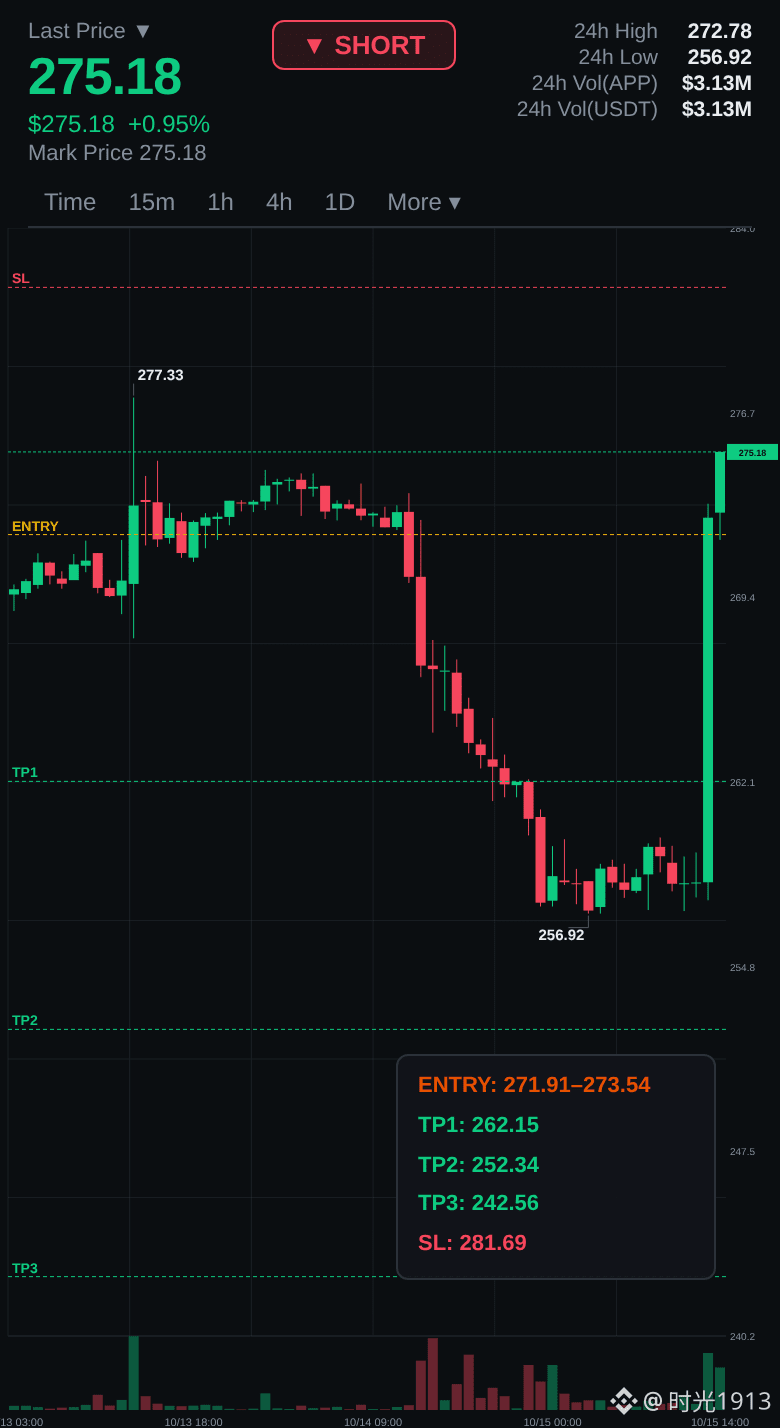

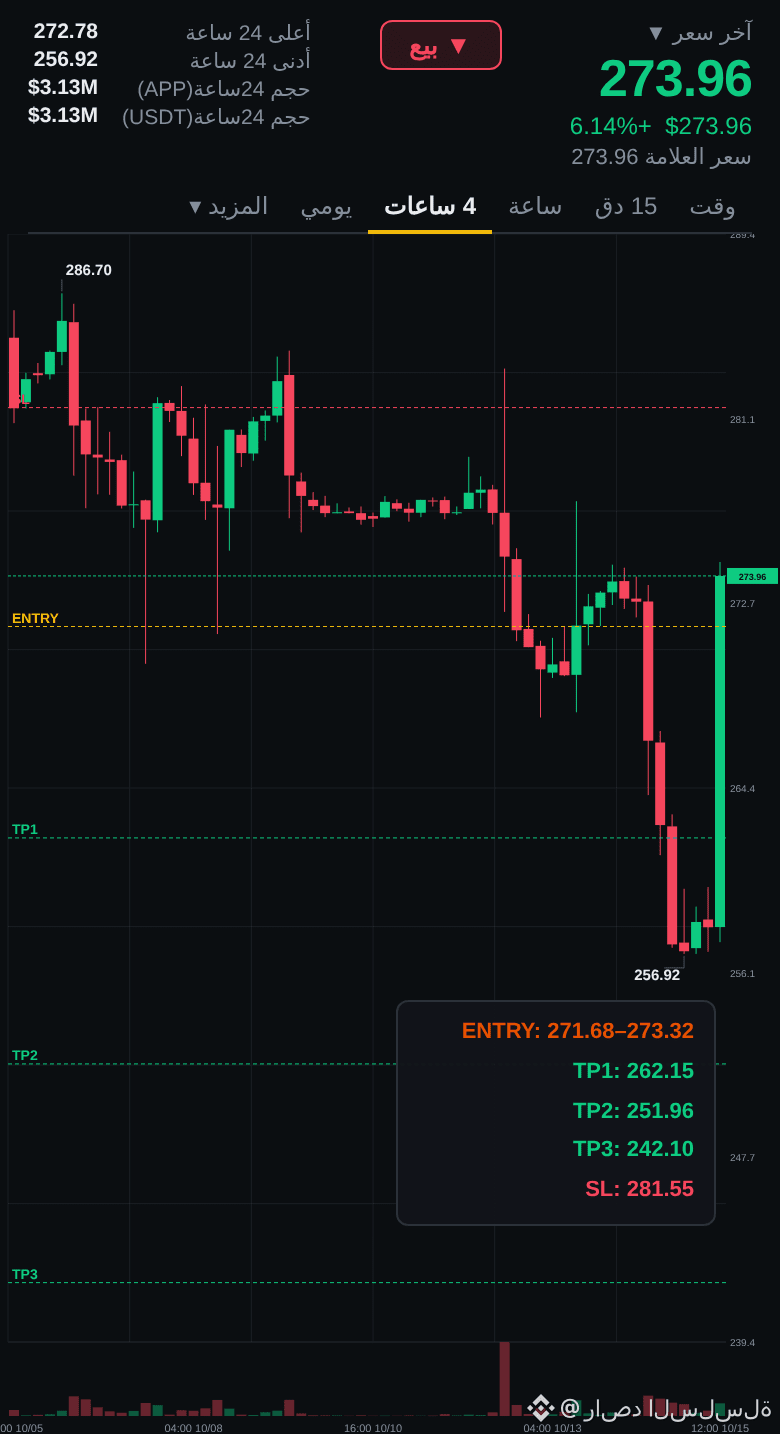

$APP 4H Technical indicators weaken, downside risk warning
📉 $APP | 4-hour short signal
━━━━━━━━━━━━━━━━━━
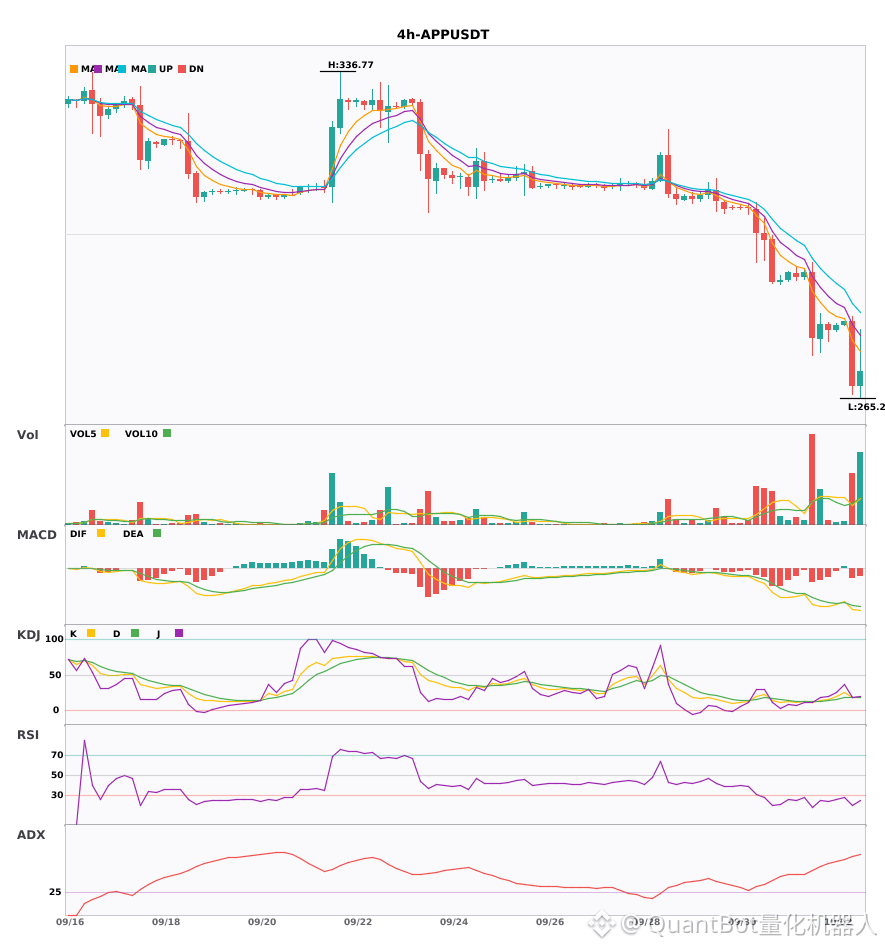
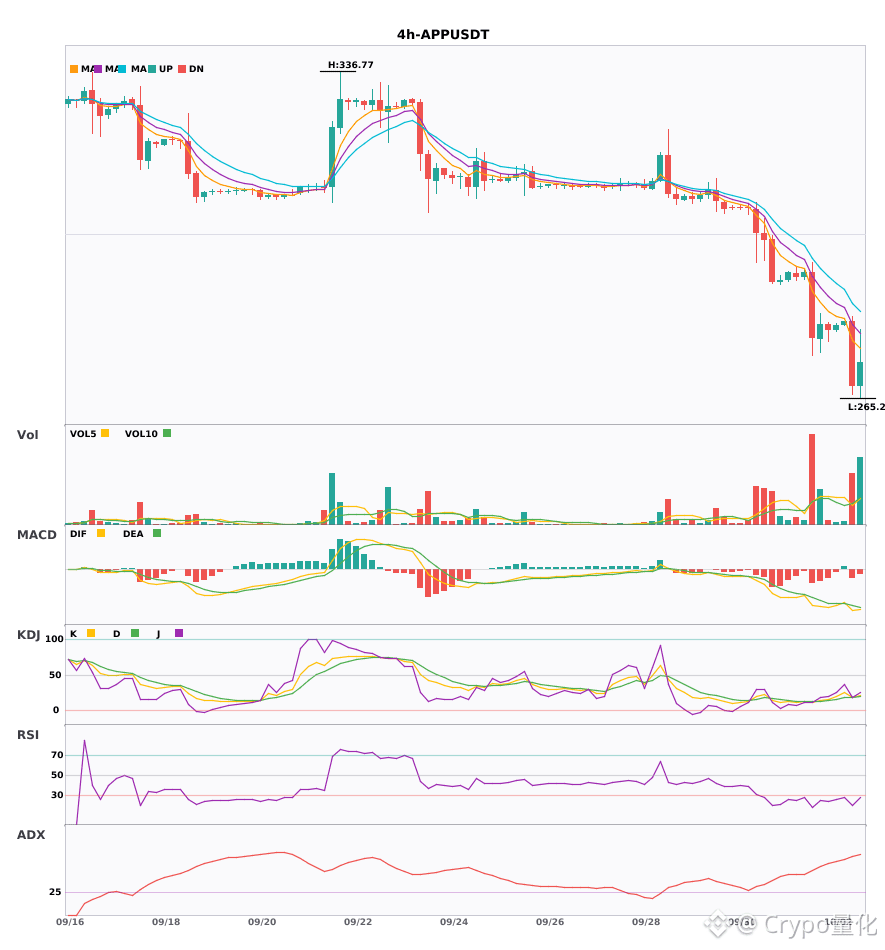
Technical analysis: ADX (69) indicates an extremely strong trend—watch out for an overheated pullback; MACD forms a bearish dead cross below zero, and bearish momentum is strengthening; EMA5/8/13 are arranged in a bearish order; KDJ dead cross (K18.8/D18.9) suggests near-term bearish bias; trading volume has surged 2.4x.
Price change: -5.0300%
━━━━━━━━━━━━━━━━━━
#技术分析 #APP
📌 The information above is for reference only and does not constitute investment advice
20

·
--
$APP 4 hours MACD dead cross, green bars expand, moving averages remain bearish and suppress; short-term still needs to fall 🔥
════════════════════
🟢 $APP 4 hours Bearish signal
⚠️ Technical view: The trend is very strong, but don’t chase. MACD dead cross accelerates bearish momentum; moving averages are arranged bearishly. KDJ dead cross is slightly bearish (K18.8 D18.9). Volume expands to 2.4x
════════════════════
🔔 Watch for first-hand market moves 🔔
#技术分析 #APP
📌 When trading, pay attention to whether the candlestick pattern matches
════════════════════
🟢 $APP 4 hours Bearish signal
⚠️ Technical view: The trend is very strong, but don’t chase. MACD dead cross accelerates bearish momentum; moving averages are arranged bearishly. KDJ dead cross is slightly bearish (K18.8 D18.9). Volume expands to 2.4x
════════════════════
🔔 Watch for first-hand market moves 🔔
#技术分析 #APP
📌 When trading, pay attention to whether the candlestick pattern matches
23

·
--
Bearish
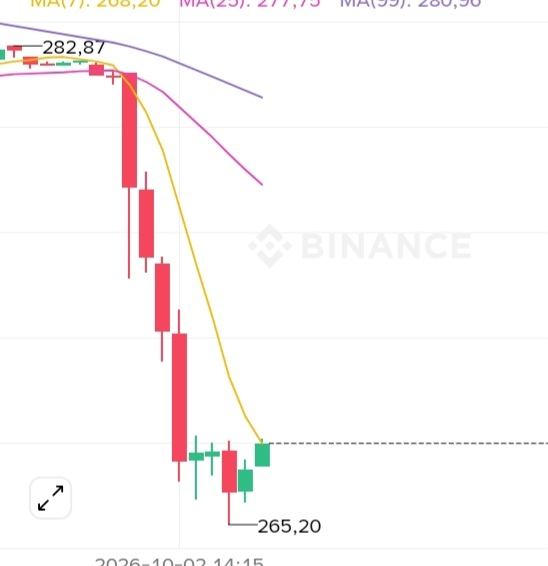
A $4.1019K long was cleared at $275.47754.
APP just swept a meaningful downside liquidity pocket.
$APP
{future}(APPUSDT)
$SAND
{future}(SANDUSDT)
$US
{future}(USUSDT)
🔴 LIQUIDITY ZONE HIT 🔴
Long liquidation spotted 🧨
$4.1019K cleared at $275.47754
Downside liquidity swept — watch reaction 👀
🎯 TP Targets:
TP1: ~$272.72
TP2: ~$269.97
TP3: ~$267.21
#App
A $4.1019K long was cleared at $275.47754.
APP just swept a meaningful downside liquidity pocket.
$APP
$SAND
$US
🔴 LIQUIDITY ZONE HIT 🔴
Long liquidation spotted 🧨
$4.1019K cleared at $275.47754
Downside liquidity swept — watch reaction 👀
🎯 TP Targets:
TP1: ~$272.72
TP2: ~$269.97
TP3: ~$267.21
#App
APP just swept a meaningful downside liquidity pocket.
$APP
$SAND
$US
🔴 LIQUIDITY ZONE HIT 🔴
Long liquidation spotted 🧨
$4.1019K cleared at $275.47754
Downside liquidity swept — watch reaction 👀
🎯 TP Targets:
TP1: ~$272.72
TP2: ~$269.97
TP3: ~$267.21
#App
29

·
--
$APP daily line and 4-hour moving averages are all in bearish alignment. Multi-period resonance confirms the downtrend—go short with momentum 🔥
════════════════════
🟢 $APP 4-hour Bearish Signal
⚠️ Technicals: Enter on a high-volume 4-hour dead cross. The daily chart’s bearish resonance is confirmed. The moving averages are bearish and diverging downward; the MACD green histogram is expanding. The KDJ dead cross has not oversold, and volume has increased by 2.4x—continue to look for downside.
════════════════════
🔔 Watch for real-time first-hand market moves 🔔
#多周期共振 #APP
📌 When trading, pay attention to whether the candlestick patterns match
════════════════════
🟢 $APP 4-hour Bearish Signal
⚠️ Technicals: Enter on a high-volume 4-hour dead cross. The daily chart’s bearish resonance is confirmed. The moving averages are bearish and diverging downward; the MACD green histogram is expanding. The KDJ dead cross has not oversold, and volume has increased by 2.4x—continue to look for downside.
════════════════════
🔔 Watch for real-time first-hand market moves 🔔
#多周期共振 #APP
📌 When trading, pay attention to whether the candlestick patterns match
24

·
--
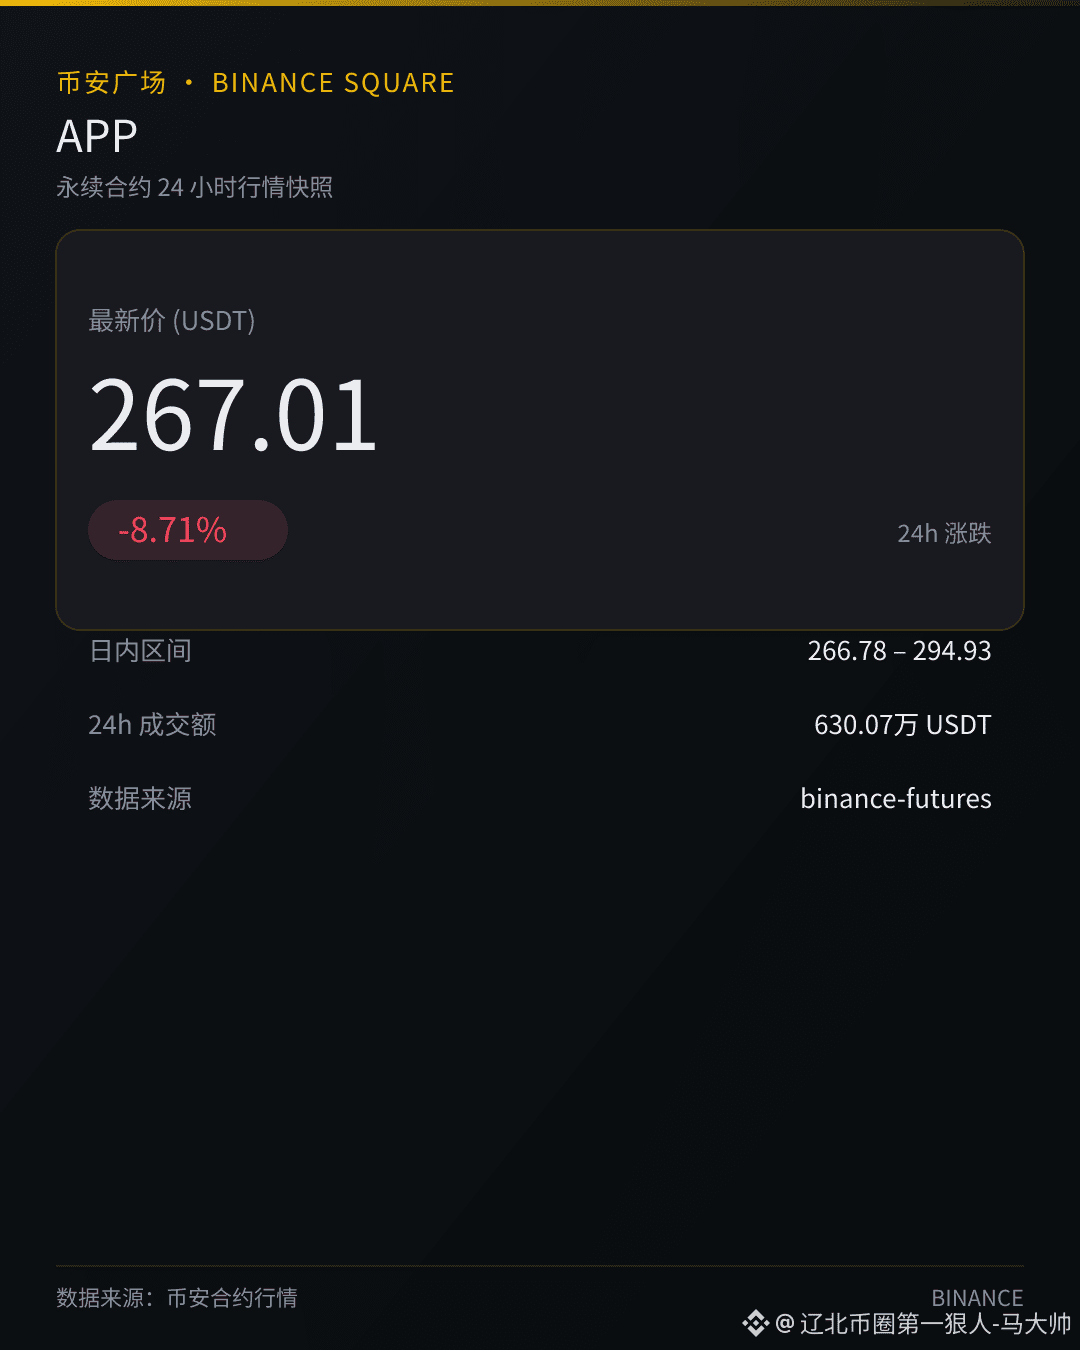
$APP Turnover in one hour was 3.5 times the 24h average, yet the price was smashed from 278.47 to 267.01—almost sitting on the 24h low of 266.78. Volume surged while price fell: the hands catching the falling knife are clearly not enough!
The buy/sell dominance ratio is 0.609; sellers have the upper hand in order-flow (selling lots). The open-position value is 3.8768 million, and in one hour it only decreased by 0.57%. No big new shorts have been pressing in; it feels more like longs are cutting (selling).
The funding rate is 0, and neither side is crowded.
Even though the sell-off came with higher volume, positions didn’t really come down, which suggests the selling pressure is still being absorbed inside the market. Regaining 278.47 from one hour ago would be required for stabilization; if it breaks below 266.78, the weakness should continue.
#APP
24
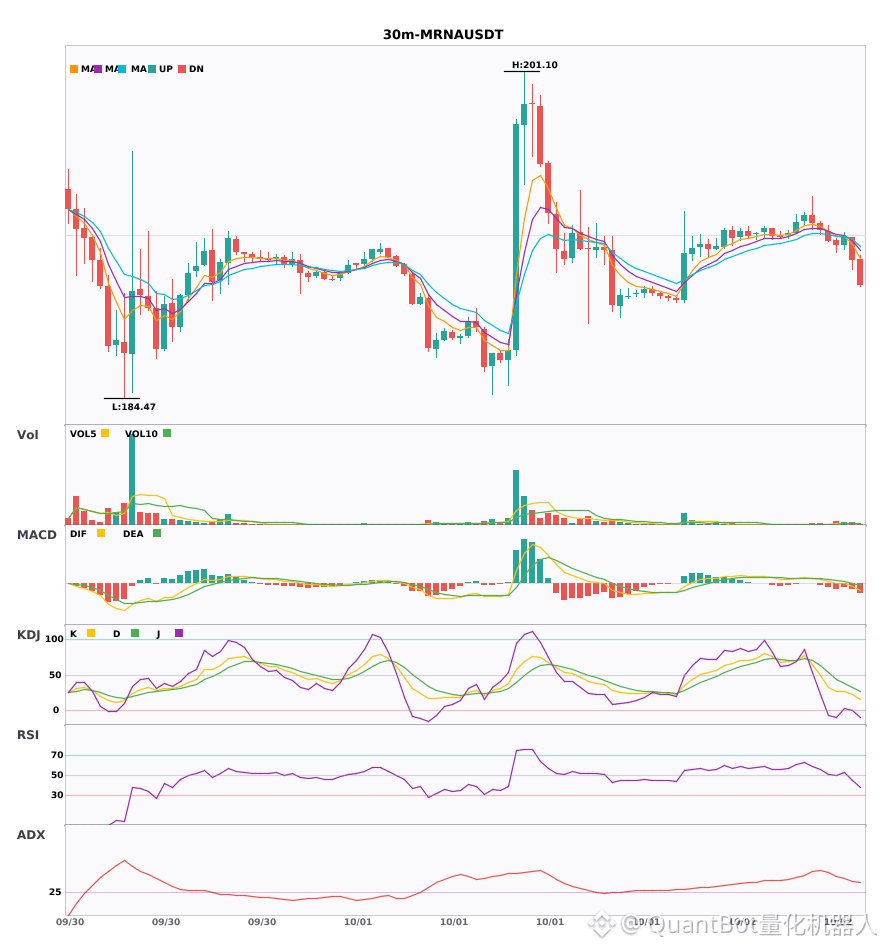
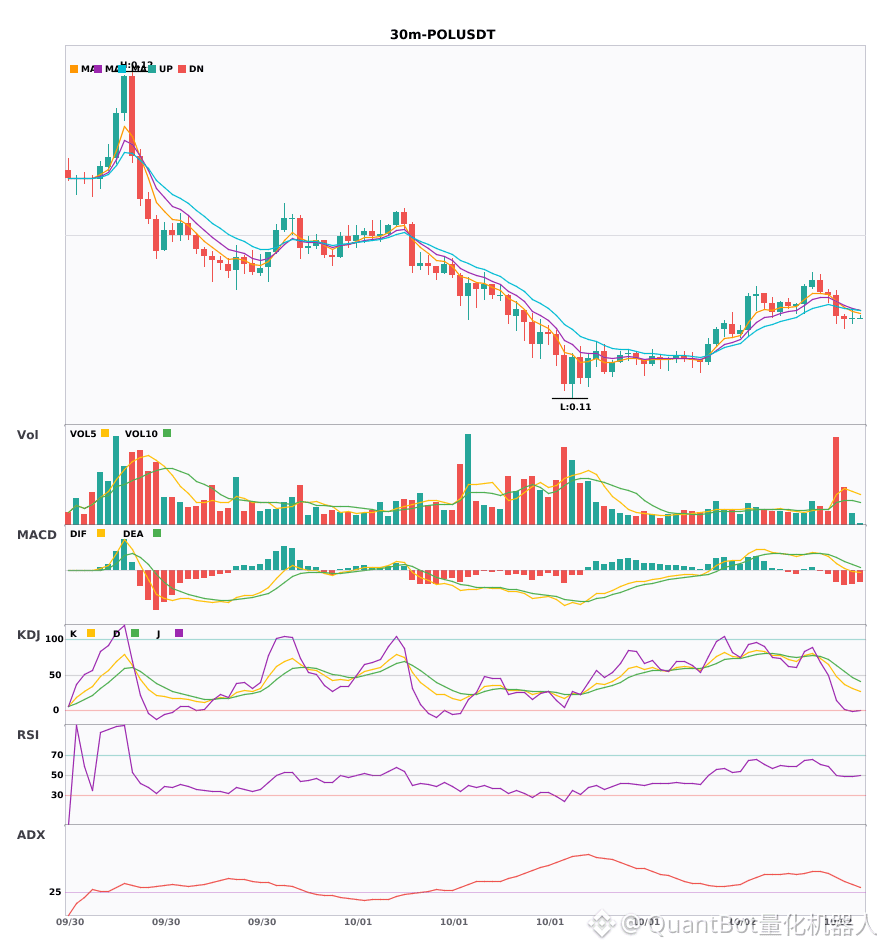
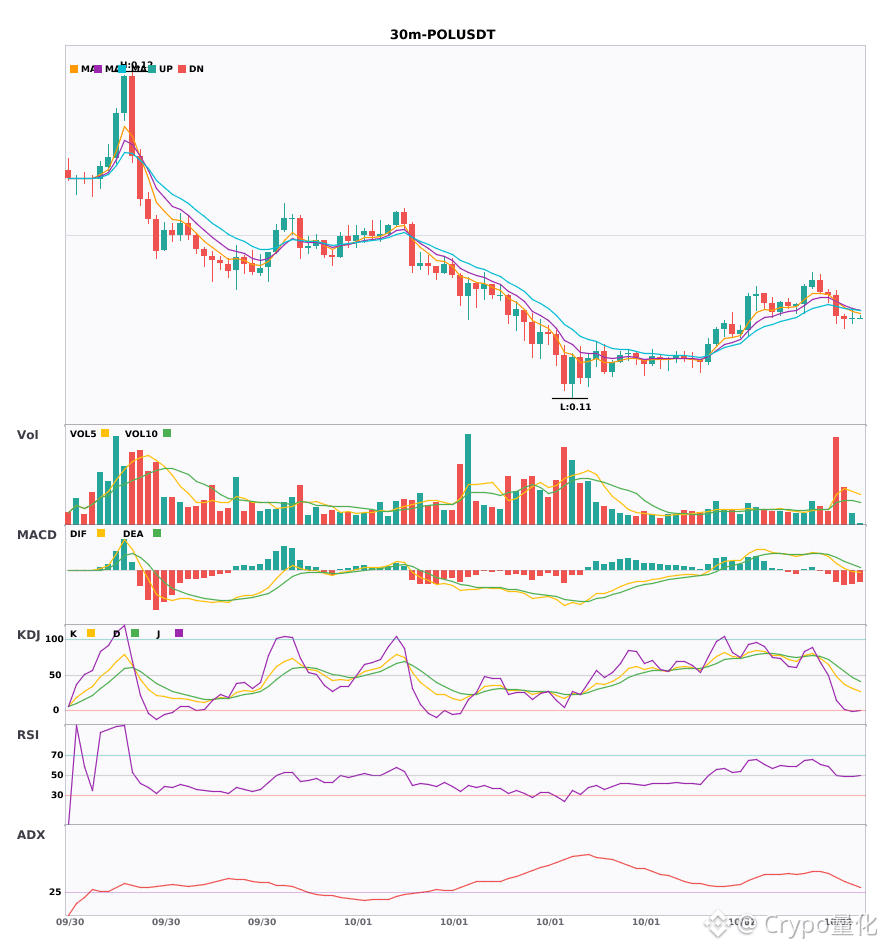
30-Minute Bearish Warning Based on the “Three Standards”: $MRNA/$APP/$POL
📉 $MRNA | 30-Minute Bearish Signal
━━━━━━━━━━━━━━━━━━
Technical Analysis: ADX(39) shows a clear trend characteristic; MACD DIF crosses below the zero axis, shifting momentum to bearish; EMA5<EMA8<EMA13 forms a bearish alignment; KDJ is operating in a low range (K:22.1, D:32.9), with bears dominating; trading volume has expanded by 2.0x.
Price Change: -0.6200%
📉 $APP | 30-Minute Bearish Signal
━━━━━━━━━━━━━━━━━━
Technical Analysis: ADX(30) reaches 30, establishing the trend and indicating it is worth considering for participation; MACD DIF breaks below the zero axis, turning bearish in the medium term; EMA5 falls below EMA8, making the short term bearish; trading volume expands by 8.1x.
Price Change: -2.3700%
📉 $POL | 30-Minute Bearish Signal
━━━━━━━━━━━━━━━━━━
Technical Analysis: ADX(35) indicates a clearly trending market; MACD DIF crosses below the zero axis, with the trend turning bearish; the moving average system is converging and building momentum, suggesting an upcoming directional breakout; the KDJ indicator is operating weakly, favoring the bears (K:30.9, D:46.9); trading volume expands by 1.5x.
Price Change: 0.0300%
━━━━━━━━━━━━━━━━━━
#技术分析 #MRNA #APP #POL
📌 The content above is for reference only and does not constitute investment advice
30-Minute Bearish Warning Based on the “Three Standards”: $MRNA /$APP /$POL
📉 $MRNA | 30-Minute Bearish Signal
━━━━━━━━━━━━━━━━━━
Technical Analysis: ADX(39) shows a clear trend characteristic; MACD DIF crosses below the zero axis, shifting momentum to bearish; EMA5<EMA8<EMA13 forms a bearish alignment; KDJ is operating in a low range (K:22.1, D:32.9), with bears dominating; trading volume has expanded by 2.0x.
Price Change: -0.6200%
📉 $APP | 30-Minute Bearish Signal
━━━━━━━━━━━━━━━━━━
Technical Analysis: ADX(30) reaches 30, establishing the trend and indicating it is worth considering for participation; MACD DIF breaks below the zero axis, turning bearish in the medium term; EMA5 falls below EMA8, making the short term bearish; trading volume expands by 8.1x.
Price Change: -2.3700%
📉 $POL | 30-Minute Bearish Signal
━━━━━━━━━━━━━━━━━━
Technical Analysis: ADX(35) indicates a clearly trending market; MACD DIF crosses below the zero axis, with the trend turning bearish; the moving average system is converging and building momentum, suggesting an upcoming directional breakout; the KDJ indicator is operating weakly, favoring the bears (K:30.9, D:46.9); trading volume expands by 1.5x.
Price Change: 0.0300%
━━━━━━━━━━━━━━━━━━
#技术分析 #MRNA #APP #POL
📌 The content above is for reference only and does not constitute investment advice
50
·
--
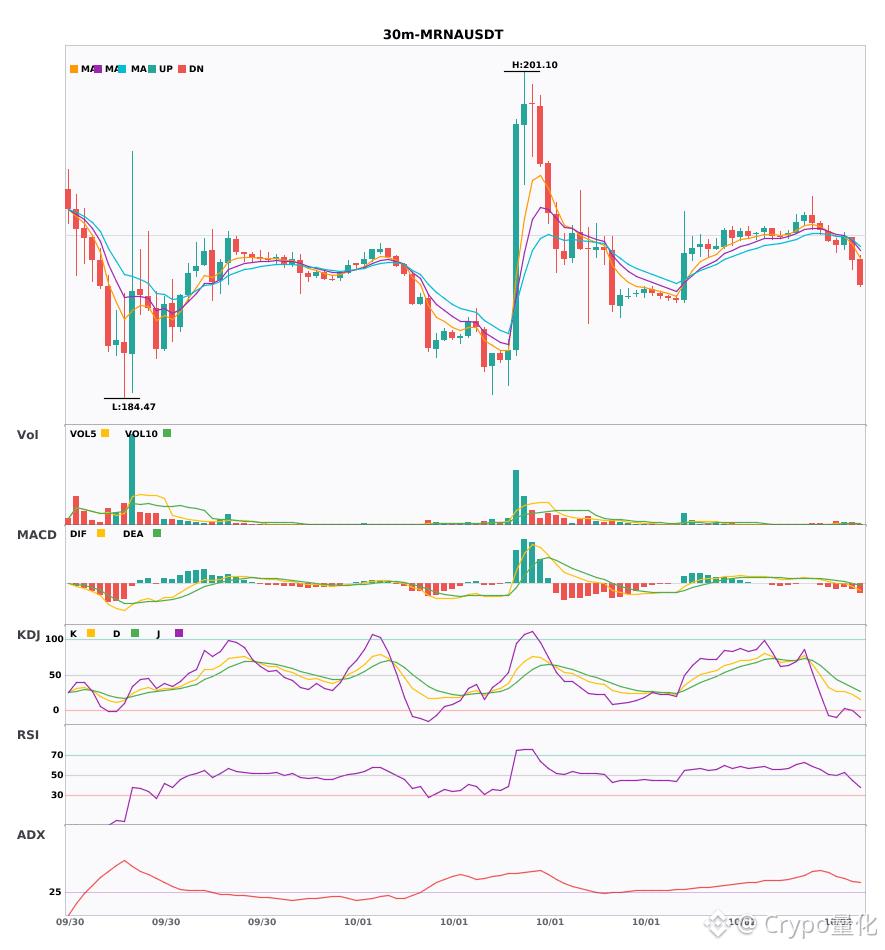
$MRNA $APP $POL 30 minutes: the sell trend turns from “flat” to “empty,” and the short signal is here 🔥
════════════════════
🟢 $MRNA 30 minutes Short signal
⚠️ Technicals: The trend is quite strong. MACD breaks below the zero axis and turns bearish; moving averages are in a bearish alignment and dispersing downward. KDJ is still weak and hasn’t reached oversold yet. Volume is amplified by 2x.
════════════════════
🟢 $APP 30 minutes Short signal
⚠️ Technicals: ADX has reached 30—trend is formed and can be followed. MACD forms a death cross and breaks below the zero axis to turn bearish. Moving averages are aligned bearishly and pointing down; trading volume is up more than 8x.
════════════════════
🟢 $POL 30 minutes Short signal
⚠️ Technicals: ADX 35—trend is clear. MACD breaks through the zero axis and is bearish. Moving averages are stuck together—choose direction. KDJ: K below D favors shorts (30.9/46.9). Volume increased by 1.5x.
════════════════════
🔔 Follow to get the first-hand market moves and anomalies 🔔
#技术分析 #MRNA #APP #POL
📌 When trading, pay attention to whether the candlestick patterns match
════════════════════
🟢 $MRNA 30 minutes Short signal
⚠️ Technicals: The trend is quite strong. MACD breaks below the zero axis and turns bearish; moving averages are in a bearish alignment and dispersing downward. KDJ is still weak and hasn’t reached oversold yet. Volume is amplified by 2x.
════════════════════
🟢 $APP 30 minutes Short signal
⚠️ Technicals: ADX has reached 30—trend is formed and can be followed. MACD forms a death cross and breaks below the zero axis to turn bearish. Moving averages are aligned bearishly and pointing down; trading volume is up more than 8x.
════════════════════
🟢 $POL 30 minutes Short signal
⚠️ Technicals: ADX 35—trend is clear. MACD breaks through the zero axis and is bearish. Moving averages are stuck together—choose direction. KDJ: K below D favors shorts (30.9/46.9). Volume increased by 1.5x.
════════════════════
🔔 Follow to get the first-hand market moves and anomalies 🔔
#技术分析 #MRNA #APP #POL
📌 When trading, pay attention to whether the candlestick patterns match
37
·
--
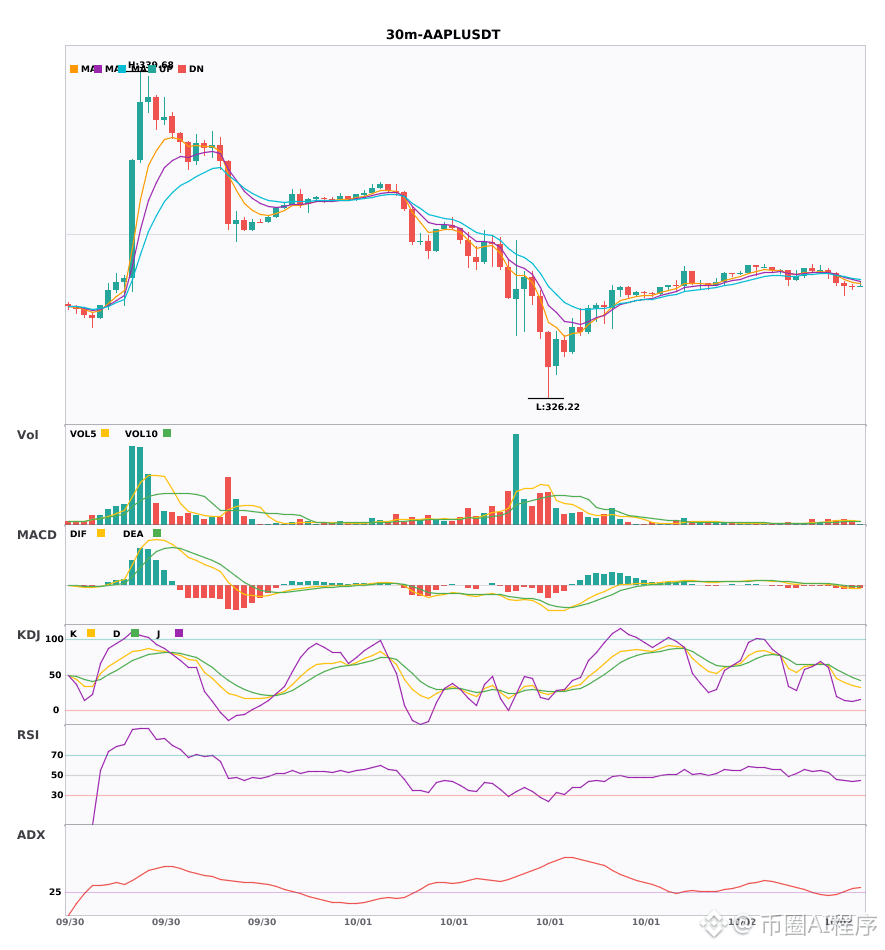
$APP / $AAPL 30 minutes 4 hours resonance to turn short, multi-cycle synchronized shorting signal🔥
════════════════════
🟢 $APP 30 minutes Short signal
⚠️ Technicals: 4-hour short + 30-minute resonance confirmation. MACD forms a dead cross and breaks below the zero axis with a volume expansion, turning short. EMA5 crosses below EMA8; short-term bias turns bearish. Trading volume surges to 8.1x.
════════════════════
🟢 $AAPL 30 minutes Short signal
⚠️ Technicals: 4-hour short + 30-minute short resonance confirmation. The 30-minute MACD green bars keep expanding. Moving averages are bearish and spread out downward. Volume increases by 1.8x, and the trend is weak with strengthening momentum to the downside.
════════════════════
🔔 Watch for firsthand market moves 🔔
#多周期共振 #APP #AAPL
📌 When trading, pay attention to whether the candlestick pattern matches
════════════════════
🟢 $APP 30 minutes Short signal
⚠️ Technicals: 4-hour short + 30-minute resonance confirmation. MACD forms a dead cross and breaks below the zero axis with a volume expansion, turning short. EMA5 crosses below EMA8; short-term bias turns bearish. Trading volume surges to 8.1x.
════════════════════
🟢 $AAPL 30 minutes Short signal
⚠️ Technicals: 4-hour short + 30-minute short resonance confirmation. The 30-minute MACD green bars keep expanding. Moving averages are bearish and spread out downward. Volume increases by 1.8x, and the trend is weak with strengthening momentum to the downside.
════════════════════
🔔 Watch for firsthand market moves 🔔
#多周期共振 #APP #AAPL
📌 When trading, pay attention to whether the candlestick pattern matches
42

·
--
Bearish
$281.79277 saw a much larger APP long liquidation.
That size makes this downside level worth monitoring.
$APP
{future}(APPUSDT)
$MOVR
{future}(MOVRUSDT)
$龙虾
{future}(龙虾USDT)
🔴 LIQUIDITY ZONE HIT 🔴
Long liquidation spotted 🧨
$32.043K cleared at $281.79277
Downside liquidity swept — watch reaction 👀
🎯 TP Targets:
TP1: ~$267.70
TP2: ~$253.61
TP3: ~$239.52
#App
$281.79277 saw a much larger APP long liquidation.
That size makes this downside level worth monitoring.
$APP
$MOVR
$龙虾
🔴 LIQUIDITY ZONE HIT 🔴
Long liquidation spotted 🧨
$32.043K cleared at $281.79277
Downside liquidity swept — watch reaction 👀
🎯 TP Targets:
TP1: ~$267.70
TP2: ~$253.61
TP3: ~$239.52
#App
That size makes this downside level worth monitoring.
$APP
$MOVR
$龙虾
🔴 LIQUIDITY ZONE HIT 🔴
Long liquidation spotted 🧨
$32.043K cleared at $281.79277
Downside liquidity swept — watch reaction 👀
🎯 TP Targets:
TP1: ~$267.70
TP2: ~$253.61
TP3: ~$239.52
#App
48
·
--
Bearish
$283.02142 just cleared an APP long.
I’d watch for more downside if this level fails to recover.
$APP
{future}(APPUSDT)
$MOVR
{future}(MOVRUSDT)
$龙虾
{future}(龙虾USDT)
🔴 LIQUIDITY ZONE HIT 🔴
Long liquidation spotted 🧨
$3.9793K cleared at $283.02142
Downside liquidity swept — watch reaction 👀
🎯 TP Targets:
TP1: ~$268.87
TP2: ~$254.72
TP3: ~$240.57
#App
$283.02142 just cleared an APP long.
I’d watch for more downside if this level fails to recover.
$APP
$MOVR
$龙虾
🔴 LIQUIDITY ZONE HIT 🔴
Long liquidation spotted 🧨
$3.9793K cleared at $283.02142
Downside liquidity swept — watch reaction 👀
🎯 TP Targets:
TP1: ~$268.87
TP2: ~$254.72
TP3: ~$240.57
#App
I’d watch for more downside if this level fails to recover.
$APP
$MOVR
$龙虾
🔴 LIQUIDITY ZONE HIT 🔴
Long liquidation spotted 🧨
$3.9793K cleared at $283.02142
Downside liquidity swept — watch reaction 👀
🎯 TP Targets:
TP1: ~$268.87
TP2: ~$254.72
TP3: ~$240.57
#App
167

·
--
🚀 $APP / USDT — Trend Continuation Long Setup 🟢
📥 Entry: 506.00 – 512.00
🎯 TP1: 522.00
🎯 TP2: 536.00
🎯 TP3: 552.00
🛑 SL: 495.00
🚀 Immediately Open LONG 🟢 Position on #APP
👇👇 Keep Holding Long $APP
{future}(APPUSDT)
🚀 $APP / USDT — Trend Continuation Long Setup 🟢
📥 Entry: 506.00 – 512.00
🎯 TP1: 522.00
🎯 TP2: 536.00
🎯 TP3: 552.00
🛑 SL: 495.00
🚀 Immediately Open LONG 🟢 Position on #APP
👇👇 Keep Holding Long $APP
📥 Entry: 506.00 – 512.00
🎯 TP1: 522.00
🎯 TP2: 536.00
🎯 TP3: 552.00
🛑 SL: 495.00
🚀 Immediately Open LONG 🟢 Position on #APP
👇👇 Keep Holding Long $APP

7

·
--
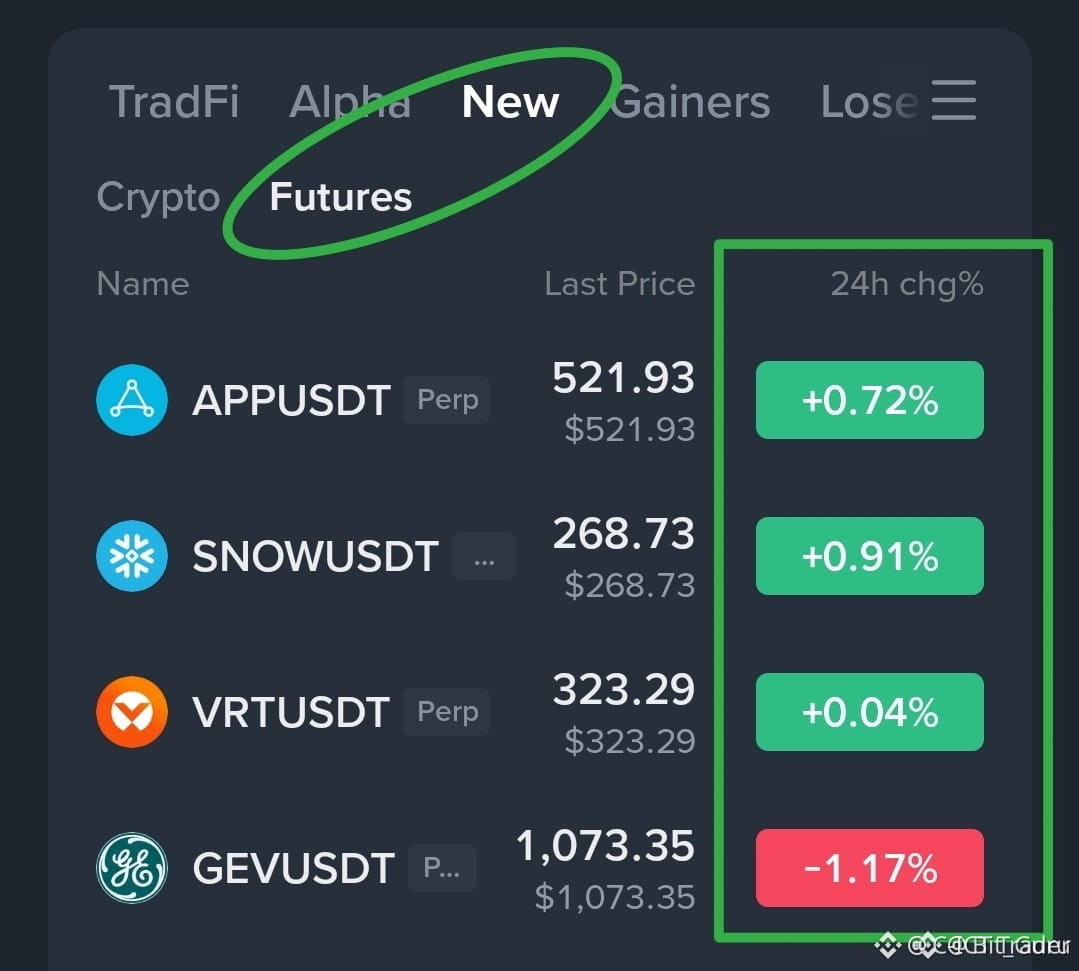
NEW FUTURES CONTRACTS ARE LIVE ON A TOP-TIER EXCHANGE WITH $APP AND MORE 🔥
A fresh batch of futures contracts including $APP , $SNOW , $VRT , and $GEV has just launched. New listings often bring high volatility and fast price movements as liquidity flows in. The first few hours are critical for identifying structural shifts.
History shows that these pairs can see 15% moves within the first trading session, so patience and confirmation are key. Waiting for a clear liquidity sweep or order block entry can turn these volatile events into high-probability trades. Are you watching $APP for a break of structure or waiting for a retest?
Not financial advice. Always manage your risk.
#APP #Futures #NewListing #Volatility #Crypto
⚡
162

·
--
Currency $APP Trading Alert 💹
Choppy market — suggestion
Entry range: 426.0750-430.1850
Stop loss: 424.0200
Targets: 432.4113, 435.8363, 440.1176
Technical analysis: Trend unclear; EMA (428.80/430.27) crossover is not obvious; RSI (52.2). Operate with caution
Suggested stop loss: 424.019952. Please adjust your position size according to your own risk preference
#APP
46
·
--
Market Quick Report: $APP 📊
Suggested Direction: Choppy
Entry: 424.0945-428.1855
Stop Loss Reference: 417.3600
Target Price: 430.4014/433.8105/438.0719
Analysis: The trend is unclear; EMA (423.88/422.38) crossover is not obvious; RSI (79.4). Operate with caution
Tip: Suggested stop-loss level: 417.360000; please adjust your position size according to your own risk preference
#APP
APPUS-10.13%
4

·
--
$APP current price 346.21, down 18.403% in the past 24 hours, yet the funding rate is still at 0.00318388—longs are still paying. With prices sharply falling and the funding rate positive, it indicates that the trapped long positions haven’t been fully unwound; they’re still adding to the position betting on a dead-cat bounce, while the liquidation wall is constantly pressing lower.
If the military conflict escalates, funding will first flow to energy and safe-haven trades, then cut positions with high-volatility risk. Some people are treating the brutal selloff as a mispricing opportunity; I disagree. Under geopolitical pressure, on-chain US stock futures contracts will be the first to be deleveraged. A positive funding rate only makes long holders’ costs even more uncomfortable. The open interest at 5356.56 isn’t a “storm has passed” signal; right now, chasing a rebound risks getting hit by the falling knife.
My move is very direct: if the rebound can’t reclaim 346.21, I’ll short with a minimal leverage. As soon as 346.21 is effectively recovered, take profit/loss immediately by stopping out. If it breaks below the previous low, take partial profits in batches, and have the remaining position trail with the stop-loss as it moves down. If the longs want to turn things around, they need to wash out the positive funding and the trapped positions first.
Trading tag: #TradFi #链上美股 #APP
Under a risk-averse sentiment, how will APP move?
39
Log in to explore more content
Join global crypto users on Binance Square
⚡️ Get latest and useful information about crypto.
💬 Trusted by the world’s largest crypto exchange.
👍 Discover real insights from verified creators.
Email / Phone number
Trending Topics
1
#TRMCambodianCasinosReceived$1.07BInCrypto
20 views
9 Discussing
2
#IolePlansToSellAll151.21Bitcoin
585 views
50 Discussing
3
#SuspectedNorthKoreaAttacksAccountForNearly89%OfCryptoHackLosses
2,704 views
48 Discussing
4
#OpenAICutsFundraisingTargetBy$10B
722 views
48 Discussing
5
#ASICHasReceivedNoPredictionMarketApplications
10,094 views
341 Discussing
6
#RecallAnnouncesLiquidationPlansToBurn35.86%OfSupply
460 views
20 Discussing
7
#TetherReports$191.5BInQ3Reserves
164 views
17 Discussing
8
#UniswapA16zSeekDeFiExemptionFromIllinoisCryptoTax
68,469 views
1,275 Discussing
9
#HKDollarStablecoinHKDAPToLaunchOnSolana
51,285 views
848 Discussing
10
#$1.5BInLeveragedCryptoBetsLiquidated
86,233 views
296 Discussing