
#73
73
23,401 views
41 Discussing
Hot
Latest

·
--
73% increase, yet only 43% of people are going long? This divergence is kind of interesting.
Today, MARSCOIN moved from 0.058 to 0.123, with volume of 418 million U. On the surface, it looks like a strong breakout. But if you look closely, the funding rate is only 0.058%, not exactly manic. More importantly, the long/short ratio shows that 57% of people are going short.
So what does this mean? A large number of traders believe this rally isn’t sustainable and chose to short at higher levels. The 8-hour K-line charts also reflect overall weakness, with a drop from the high of 0.123 down to around 0.103.
This situation—prices rising but bearish sentiment increasing—is often a signal of intense long-vs-short battles. If you’re chasing longs, be cautious; wait until the direction becomes clear before acting.
$MARSCOIN #多空背离 #73%
Click the small card below to quickly check the行情👇
73% increase, yet only 43% of people are going long? This divergence is kind of interesting.
Today, MARSCOIN moved from 0.058 to 0.123, with volume of 418 million U. On the surface, it looks like a strong breakout. But if you look closely, the funding rate is only 0.058%, not exactly manic. More importantly, the long/short ratio shows that 57% of people are going short.
So what does this mean? A large number of traders believe this rally isn’t sustainable and chose to short at higher levels. The 8-hour K-line charts also reflect overall weakness, with a drop from the high of 0.123 down to around 0.103.
This situation—prices rising but bearish sentiment increasing—is often a signal of intense long-vs-short battles. If you’re chasing longs, be cautious; wait until the direction becomes clear before acting.
$MARSCOIN #多空背离 #73%
Click the small card below to quickly check the行情👇
Today, MARSCOIN moved from 0.058 to 0.123, with volume of 418 million U. On the surface, it looks like a strong breakout. But if you look closely, the funding rate is only 0.058%, not exactly manic. More importantly, the long/short ratio shows that 57% of people are going short.
So what does this mean? A large number of traders believe this rally isn’t sustainable and chose to short at higher levels. The 8-hour K-line charts also reflect overall weakness, with a drop from the high of 0.123 down to around 0.103.
This situation—prices rising but bearish sentiment increasing—is often a signal of intense long-vs-short battles. If you’re chasing longs, be cautious; wait until the direction becomes clear before acting.
$MARSCOIN #多空背离 #73%
Click the small card below to quickly check the行情👇

66

·
--
$Q This 15m drop has a certain feel to it. A 2.35% decline isn’t huge, but volume surged to 2.23x. The close also broke below the lower bound of the last 20 5m candles. The active trade delta was -13.1%, and the buy/sell ratio was 0.77, so selling pressure was clearly in control.
What’s interesting is the OI: 15m contract OI was up 0.30%, but notional change was -158K. For 1h, it was -0.09% and -206K. Price falling while OI ticks up looks more like new leveraged shorts entering than longs getting liquidated. The anomaly percentile is 60.1%, ranked #73 across the entire pool, with notional change ranked #25—so it’s on the radar, but hasn’t reached an extreme.
For a pool with 160M in 24h trading volume, this kind of volume accompanying a range breakdown is worth watching closely in the short term. I’ll be keeping an eye on whether price can reclaim the lower bound on a pullback. If it can’t, the bears still have room to play.
$Q This 15m drop has a certain feel to it. A 2.35% decline isn’t huge, but volume surged to 2.23x. The close also broke below the lower bound of the last 20 5m candles. The active trade delta was -13.1%, and the buy/sell ratio was 0.77, so selling pressure was clearly in control.
What’s interesting is the OI: 15m contract OI was up 0.30%, but notional change was -158K. For 1h, it was -0.09% and -206K. Price falling while OI ticks up looks more like new leveraged shorts entering than longs getting liquidated. The anomaly percentile is 60.1%, ranked #73 across the entire pool, with notional change ranked #25—so it’s on the radar, but hasn’t reached an extreme.
For a pool with 160M in 24h trading volume, this kind of volume accompanying a range breakdown is worth watching closely in the short term. I’ll be keeping an eye on whether price can reclaim the lower bound on a pullback. If it can’t, the bears still have room to play.
What’s interesting is the OI: 15m contract OI was up 0.30%, but notional change was -158K. For 1h, it was -0.09% and -206K. Price falling while OI ticks up looks more like new leveraged shorts entering than longs getting liquidated. The anomaly percentile is 60.1%, ranked #73 across the entire pool, with notional change ranked #25—so it’s on the radar, but hasn’t reached an extreme.
For a pool with 160M in 24h trading volume, this kind of volume accompanying a range breakdown is worth watching closely in the short term. I’ll be keeping an eye on whether price can reclaim the lower bound on a pullback. If it can’t, the bears still have room to play.
41

·
--
💎 BINANCE GEMS | SPOT MOMENTUM WATCH
Signal #73 · $BTC
Score: 55/100 | CONFIRMED MOMENTUM
$BTC is showing a more developed momentum setup. I'm watching to see whether buyers can keep the pressure up and hold the breakout area.
Volume activity is one of the main things supporting this watch.
Price reference: $81696
24h change: -0.3% · 24h volume: $1.21B
Risk reference — SL: $81287.52
Potential TP1: $82104.48
Potential TP2: $82308.72
Potential TP3: $82512.96
My plan: no chasing. I want the setup to hold, volume to stay healthy, and resistance to clear cleanly. If those conditions fail, I skip it.
This is a spot-market watchlist idea, not a guaranteed result. Manage risk and confirm the live chart before acting.
#BinanceGems #SpotTrading $BTC
💎 BINANCE GEMS | SPOT MOMENTUM WATCH
Signal #73 · $BTC
Score: 55/100 | CONFIRMED MOMENTUM
$BTC is showing a more developed momentum setup. I'm watching to see whether buyers can keep the pressure up and hold the breakout area.
Volume activity is one of the main things supporting this watch.
Price reference: $81696
24h change: -0.3% · 24h volume: $1.21B
Risk reference — SL: $81287.52
Potential TP1: $82104.48
Potential TP2: $82308.72
Potential TP3: $82512.96
My plan: no chasing. I want the setup to hold, volume to stay healthy, and resistance to clear cleanly. If those conditions fail, I skip it.
This is a spot-market watchlist idea, not a guaranteed result. Manage risk and confirm the live chart before acting.
#BinanceGems #SpotTrading $BTC
Signal #73 · $BTC
Score: 55/100 | CONFIRMED MOMENTUM
$BTC is showing a more developed momentum setup. I'm watching to see whether buyers can keep the pressure up and hold the breakout area.
Volume activity is one of the main things supporting this watch.
Price reference: $81696
24h change: -0.3% · 24h volume: $1.21B
Risk reference — SL: $81287.52
Potential TP1: $82104.48
Potential TP2: $82308.72
Potential TP3: $82512.96
My plan: no chasing. I want the setup to hold, volume to stay healthy, and resistance to clear cleanly. If those conditions fail, I skip it.
This is a spot-market watchlist idea, not a guaranteed result. Manage risk and confirm the live chart before acting.
#BinanceGems #SpotTrading $BTC
22
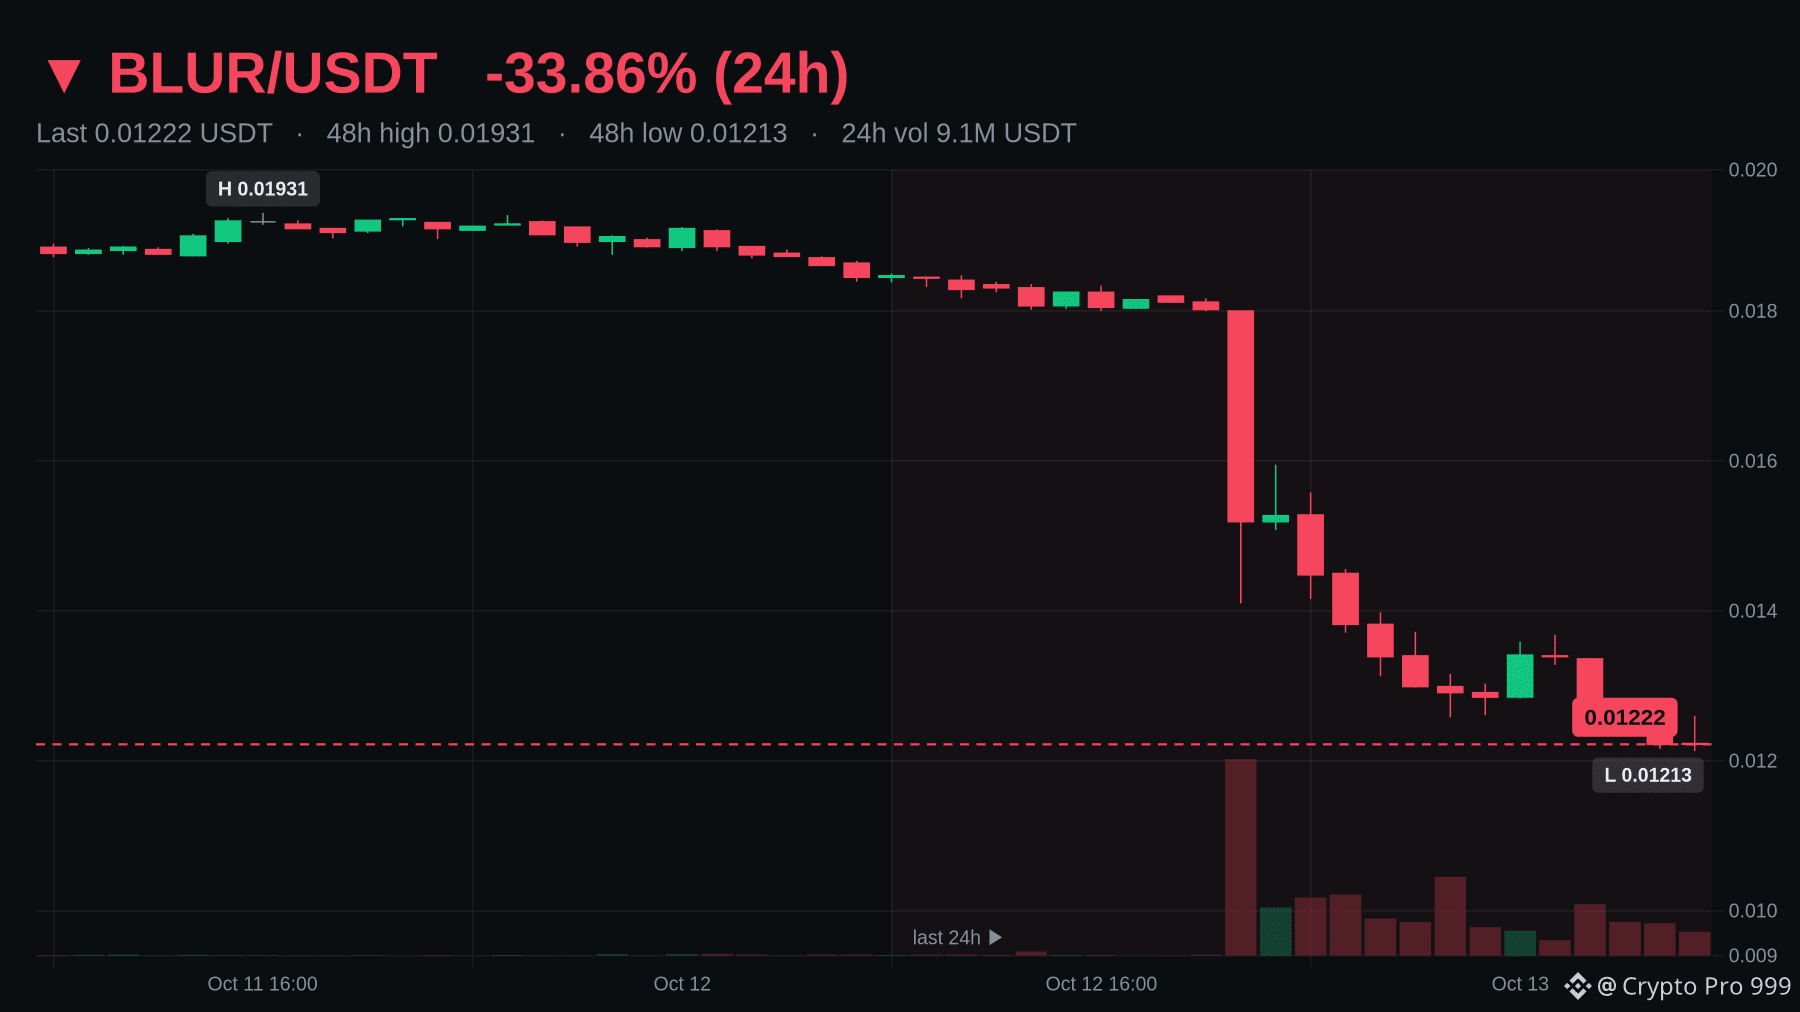
Sharp drop: $BLUR -33.86% in 24h, last at 0.01223 USDT.
• 24h range: 0.01213 – 0.0185 USDT, trading near its 24h low
• 24h volume: 9,090,277 USDT (#73 of 104 liquid USDT pairs)
• Underperforming BTC (+0.31%)
Underperforming bitcoin.
Data: Binance spot, 2026-10-13 09:40 UTC. Educational content, not financial advice.
Sharp drop: $BLUR -33.86% in 24h, last at 0.01223 USDT.
• 24h range: 0.01213 – 0.0185 USDT, trading near its 24h low
• 24h volume: 9,090,277 USDT (#73 of 104 liquid USDT pairs)
• Underperforming BTC (+0.31%)
Underperforming bitcoin.
Data: Binance spot, 2026-10-13 09:40 UTC. Educational content, not financial advice.
• 24h range: 0.01213 – 0.0185 USDT, trading near its 24h low
• 24h volume: 9,090,277 USDT (#73 of 104 liquid USDT pairs)
• Underperforming BTC (+0.31%)
Underperforming bitcoin.
Data: Binance spot, 2026-10-13 09:40 UTC. Educational content, not financial advice.
1
199

·
--
CFX Suddenly Plunges 4.0% in 5 Minutes! Panic or Opportunity? A Quick Look at Support Levels23:50 (just now): CFX fell 4.0% within 5 minutes (5-minute window: 23:45→23:50). As of 23:50:08, the current price is 0.06784, up 15.2% over 24h. METIS and APT also made notable moves around the same time.
📅 Data as of 23:50:08 (event trigger times are noted individually; prices are real-time snapshots at the time of writing)
📌 In a nutshell: Short-term momentum is concentrated, and pullbacks can come fast—placing staggered limit orders is steadier than chasing highs
Market overview: BTC 83,404.80 (+0.45%) · ETH 2,527.05 (+0.69%); across the market, 301 gainers / 184 decliners over 24h; top 24h gainer: STRK +32.39%, top loser: JCT -37.24%.
CFX Suddenly Plunges 4.0% in 5 Minutes! Panic or Opportunity? A Quick Look at Support Levels
23:50 (just now): CFX fell 4.0% within 5 minutes (5-minute window: 23:45→23:50). As of 23:50:08, the current price is 0.06784, up 15.2% over 24h. METIS and APT also made notable moves around the same time.
📅 Data as of 23:50:08 (event trigger times are noted individually; prices are real-time snapshots at the time of writing)
📌 In a nutshell: Short-term momentum is concentrated, and pullbacks can come fast—placing staggered limit orders is steadier than chasing highs
Market overview: BTC 83,404.80 (+0.45%) · ETH 2,527.05 (+0.69%); across the market, 301 gainers / 184 decliners over 24h; top 24h gainer: STRK +32.39%, top loser: JCT -37.24%.
📅 Data as of 23:50:08 (event trigger times are noted individually; prices are real-time snapshots at the time of writing)
📌 In a nutshell: Short-term momentum is concentrated, and pullbacks can come fast—placing staggered limit orders is steadier than chasing highs
Market overview: BTC 83,404.80 (+0.45%) · ETH 2,527.05 (+0.69%); across the market, 301 gainers / 184 decliners over 24h; top 24h gainer: STRK +32.39%, top loser: JCT -37.24%.
6
·
--
SENT surges 1.4% at a key time! What happened? Key levels to watch19:51 (9 minutes ago): SENT surged 1.4% at a key time (5-minute window 19:46→19:51). As of 20:01:08, the current price is 0.02377, up 21.3% in 24h. Other tokens showing similar moves include STRK and GRASS.
📅 Data as of 20:01:08 (event trigger times are noted for each item; prices are live snapshots at the time of writing)
📌 One-line takeaway: Moves around key times (candle closes/U.S. market opens and closes) often involve institutional participation, making the signals more credible.
Market overview: BTC 83,150.00 (+0.38%) · ETH 2,506.00 (+0.40%); across the market, 196 gainers / 292 decliners in 24h; top gainer: STRK +60.35%, top loser: US -43.52%.
SENT surges 1.4% at a key time! What happened? Key levels to watch
19:51 (9 minutes ago): SENT surged 1.4% at a key time (5-minute window 19:46→19:51). As of 20:01:08, the current price is 0.02377, up 21.3% in 24h. Other tokens showing similar moves include STRK and GRASS.
📅 Data as of 20:01:08 (event trigger times are noted for each item; prices are live snapshots at the time of writing)
📌 One-line takeaway: Moves around key times (candle closes/U.S. market opens and closes) often involve institutional participation, making the signals more credible.
Market overview: BTC 83,150.00 (+0.38%) · ETH 2,506.00 (+0.40%); across the market, 196 gainers / 292 decliners in 24h; top gainer: STRK +60.35%, top loser: US -43.52%.
📅 Data as of 20:01:08 (event trigger times are noted for each item; prices are live snapshots at the time of writing)
📌 One-line takeaway: Moves around key times (candle closes/U.S. market opens and closes) often involve institutional participation, making the signals more credible.
Market overview: BTC 83,150.00 (+0.38%) · ETH 2,506.00 (+0.40%); across the market, 196 gainers / 292 decliners in 24h; top gainer: STRK +60.35%, top loser: US -43.52%.
4
·
--
MUBARAK suddenly plunges 4.9% in 5 minutes! Panic or opportunity? Quick look at support levelsAt 17:44 (7 minutes ago), MUBARAK dropped 4.9% within 5 minutes (5-minute window: 17:39→17:44). As of 17:52:33, its current price is 0.07188, down 5.5% over 24h. FLOW and ZRO also made notable moves during the same period.
📅 Data as of 17:52:33 (event trigger times are shown alongside each item; prices are real-time snapshots taken when this was written)
📌 In a nutshell: Short-term momentum is concentrated, and pullbacks can come quickly—placing orders in batches is steadier than chasing a rally.
Market overview: BTC 82,961.20(+0.20%) · ETH 2,499.17(+0.16%); across the market, 166 assets rose and 188 fell over 24h; top 24h gainer: STRK +54.34%; top loser: RVN -8.13%.
MUBARAK suddenly plunges 4.9% in 5 minutes! Panic or opportunity? Quick look at support levels
At 17:44 (7 minutes ago), MUBARAK dropped 4.9% within 5 minutes (5-minute window: 17:39→17:44). As of 17:52:33, its current price is 0.07188, down 5.5% over 24h. FLOW and ZRO also made notable moves during the same period.
📅 Data as of 17:52:33 (event trigger times are shown alongside each item; prices are real-time snapshots taken when this was written)
📌 In a nutshell: Short-term momentum is concentrated, and pullbacks can come quickly—placing orders in batches is steadier than chasing a rally.
Market overview: BTC 82,961.20(+0.20%) · ETH 2,499.17(+0.16%); across the market, 166 assets rose and 188 fell over 24h; top 24h gainer: STRK +54.34%; top loser: RVN -8.13%.
📅 Data as of 17:52:33 (event trigger times are shown alongside each item; prices are real-time snapshots taken when this was written)
📌 In a nutshell: Short-term momentum is concentrated, and pullbacks can come quickly—placing orders in batches is steadier than chasing a rally.
Market overview: BTC 82,961.20(+0.20%) · ETH 2,499.17(+0.16%); across the market, 166 assets rose and 188 fell over 24h; top 24h gainer: STRK +54.34%; top loser: RVN -8.13%.
6
·
--
JCT Surges 11% in 15 Minutes! What Happened? Key Levels Here14:00 (just now): JCT surged 11% in 15 minutes (15-minute window: 13:45→14:00). As of 14:02:08, the price is 0.00204, down 30.6% over 24h. STRK and XAI also saw unusual moves around the same time.
📅 Data as of 14:02:08 (event trigger times are indicated in each item; prices are real-time snapshots taken at the time of writing)
📌 In a nutshell: The 15-minute trend has been amplified. Before following it, decide where to place your stop-loss.
Market overview: BTC 83,026.50 (+0.26%) · ETH 2,503.76 (+0.23%); across the market, 184 assets rose and 302 fell over 24h; top gainer: LUMIA +105.91%, top loser: US -33.90%.
JCT Surges 11% in 15 Minutes! What Happened? Key Levels Here
14:00 (just now): JCT surged 11% in 15 minutes (15-minute window: 13:45→14:00). As of 14:02:08, the price is 0.00204, down 30.6% over 24h. STRK and XAI also saw unusual moves around the same time.
📅 Data as of 14:02:08 (event trigger times are indicated in each item; prices are real-time snapshots taken at the time of writing)
📌 In a nutshell: The 15-minute trend has been amplified. Before following it, decide where to place your stop-loss.
Market overview: BTC 83,026.50 (+0.26%) · ETH 2,503.76 (+0.23%); across the market, 184 assets rose and 302 fell over 24h; top gainer: LUMIA +105.91%, top loser: US -33.90%.
📅 Data as of 14:02:08 (event trigger times are indicated in each item; prices are real-time snapshots taken at the time of writing)
📌 In a nutshell: The 15-minute trend has been amplified. Before following it, decide where to place your stop-loss.
Market overview: BTC 83,026.50 (+0.26%) · ETH 2,503.76 (+0.23%); across the market, 184 assets rose and 302 fell over 24h; top gainer: LUMIA +105.91%, top loser: US -33.90%.
·
--
BULLA Suddenly Plunges 2.9% at a Key Time! Panic or Opportunity? A Quick Look at Support LevelsAt 10:05 (5 minutes ago), BULLA dropped 2.9% at a key time (5-minute window: 10:00→10:05). As of 10:11:56, the current price is 0.08218, up 5.6% over 24h. NIGHT and PIXEL also saw unusual moves around the same time.
📅 Data as of 10:11:56 (event trigger times are noted for each item; prices are live snapshots at the time of writing)
📌 In a nutshell: Unusual moves during key periods (candle closes / U.S. market open and close) often involve institutional participation, making these signals more credible
Market overview: BTC 82,683.40(+0.78%) · ETH 2,495.26(+0.51%); 415 assets up / 77 down across the market in 24h; 24h top gainer: US +104.93%, top loser: SENT -13.97%.
BULLA Suddenly Plunges 2.9% at a Key Time! Panic or Opportunity? A Quick Look at Support Levels
At 10:05 (5 minutes ago), BULLA dropped 2.9% at a key time (5-minute window: 10:00→10:05). As of 10:11:56, the current price is 0.08218, up 5.6% over 24h. NIGHT and PIXEL also saw unusual moves around the same time.
📅 Data as of 10:11:56 (event trigger times are noted for each item; prices are live snapshots at the time of writing)
📌 In a nutshell: Unusual moves during key periods (candle closes / U.S. market open and close) often involve institutional participation, making these signals more credible
Market overview: BTC 82,683.40(+0.78%) · ETH 2,495.26(+0.51%); 415 assets up / 77 down across the market in 24h; 24h top gainer: US +104.93%, top loser: SENT -13.97%.
📅 Data as of 10:11:56 (event trigger times are noted for each item; prices are live snapshots at the time of writing)
📌 In a nutshell: Unusual moves during key periods (candle closes / U.S. market open and close) often involve institutional participation, making these signals more credible
Market overview: BTC 82,683.40(+0.78%) · ETH 2,495.26(+0.51%); 415 assets up / 77 down across the market in 24h; 24h top gainer: US +104.93%, top loser: SENT -13.97%.
25

·
--
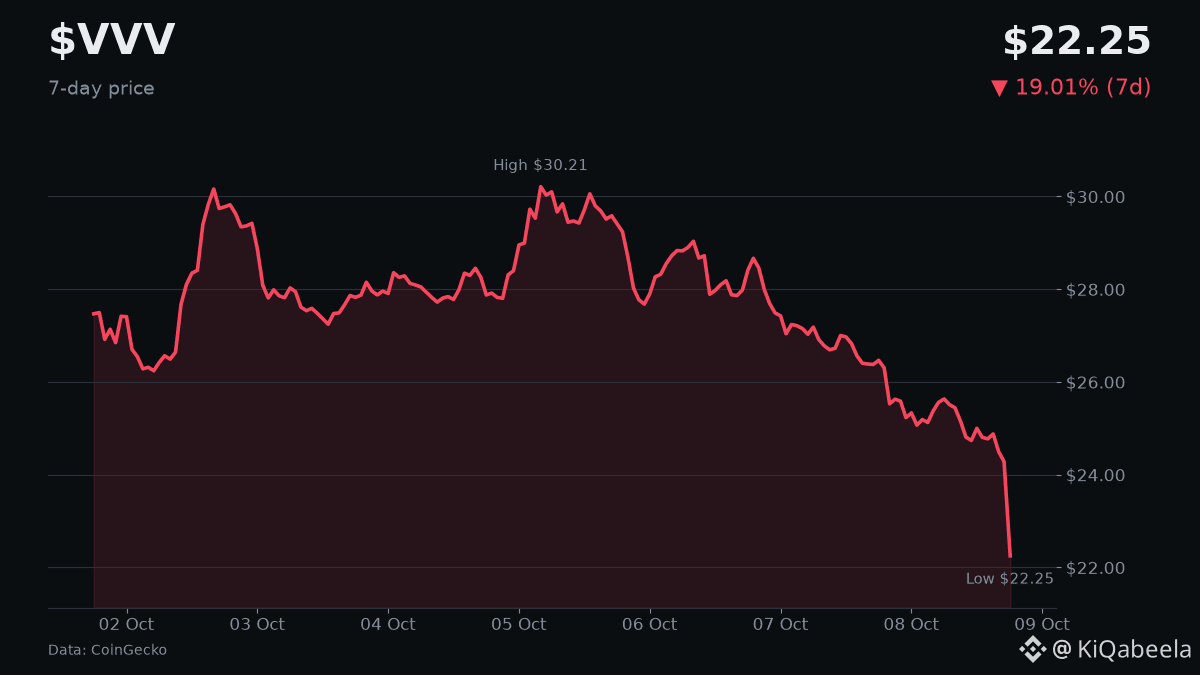
Venice Token slipped nearly 11% in the last 24 hours, pulling back to $23.51.
📊 By the numbers
• 24‑hour change: -10.85%
• High / low: $26.48 / $24.27
• Trading volume: $33.8 M
• Market‑cap rank: #73
🎯 Levels to watch
If $VVV rebounds above $26, it could test the recent high and spark a modest bounce; a break below $24 may signal further downside toward the $22 zone.
Will the next move be a quick recovery or a deeper dip?
Venice Token slipped nearly 11% in the last 24 hours, pulling back to $23.51.
📊 By the numbers
• 24‑hour change: -10.85%
• High / low: $26.48 / $24.27
• Trading volume: $33.8 M
• Market‑cap rank: #73
🎯 Levels to watch
If $VVV rebounds above $26, it could test the recent high and spark a modest bounce; a break below $24 may signal further downside toward the $22 zone.
Will the next move be a quick recovery or a deeper dip?
📊 By the numbers
• 24‑hour change: -10.85%
• High / low: $26.48 / $24.27
• Trading volume: $33.8 M
• Market‑cap rank: #73
🎯 Levels to watch
If $VVV rebounds above $26, it could test the recent high and spark a modest bounce; a break below $24 may signal further downside toward the $22 zone.
Will the next move be a quick recovery or a deeper dip?
27

·
--
Contract Quant Report #73 | Don't FOMO today, wait for a cleaner pullback
Market Status: Watching, with clear structural divergence. Today isn't a day to mindlessly chase the pumps; it's more about waiting for pullbacks and confirming breakouts.
Top Picks:
1) CLOUSDT
- After a 40.04% pump, it still shows strength, continuing to rise in the 6h timeframe
- Funding rate is slightly positive, and 1h positions are increasing
- Current price is 0.17104, quite a distance from the 20/50 reference levels; let's see if it can hold the pullback
2) ZESTUSDT
- Strong performance on the 6h chart, decent volume, and noticeable increase in 1h positions
- Current price is 0.2651; the structure is still strengthening, but short-term it's at a position that needs consolidation
- If it can hold and push higher, the continuation will be better
3) VELVETUSDT
- After a 24% pump, there’s still capital flowing in
- However, the current price of 0.15343 has clearly deviated from short to mid-term reference levels, making chasing it less favorable
- Better suited for waiting on a pullback to see if it can regain strength
4) Lobster USDT
- Strong on the 6h chart, high trading volume, but showing some pullback on the 1h
- Current price is 0.012274; let's see if it can hold the pullback area in the short term
- If it doesn't break the pullback, we can look for a second wave of strength
5) VVVUSDT
- Enough of a rise on the 6h, with increased trading volume
- However, 1h positions haven't changed much, indicating it’s more of a high-level consolidation
- Better suited for waiting on confirmation of a breakout, not for chasing at emotional peaks
Watch Levels / Trigger Conditions / Invalid Conditions:
- Watch Levels: Near their current prices, focusing on the strength of support after pullbacks
- Trigger Conditions: Re-accumulation after a pullback holds, or effective breakout after consolidation of local highs
- Invalid Conditions: Breaking below pullback lows, or a rapid drop after a high with lost support
Risk Warning:
- Most assets today have already seen some increase, chasing highs can easily lead to getting caught in a pullback
- Overall funding rates are slightly positive, indicating the mood isn't cold; the hotter it gets, the more you need confirmation
- Only take opportunities after confirmation, avoid hard entries at emotional peaks
In a nutshell:
Today, I’ll wait for a pullback and won’t chase in places that have already pumped; what’s really worth watching are those that can show a second wave of strength.
Contract Quant Report #73 | Don't FOMO today, wait for a cleaner pullback
Market Status: Watching, with clear structural divergence. Today isn't a day to mindlessly chase the pumps; it's more about waiting for pullbacks and confirming breakouts.
Top Picks:
1) CLOUSDT
- After a 40.04% pump, it still shows strength, continuing to rise in the 6h timeframe
- Funding rate is slightly positive, and 1h positions are increasing
- Current price is 0.17104, quite a distance from the 20/50 reference levels; let's see if it can hold the pullback
2) ZESTUSDT
- Strong performance on the 6h chart, decent volume, and noticeable increase in 1h positions
- Current price is 0.2651; the structure is still strengthening, but short-term it's at a position that needs consolidation
- If it can hold and push higher, the continuation will be better
3) VELVETUSDT
- After a 24% pump, there’s still capital flowing in
- However, the current price of 0.15343 has clearly deviated from short to mid-term reference levels, making chasing it less favorable
- Better suited for waiting on a pullback to see if it can regain strength
4) Lobster USDT
- Strong on the 6h chart, high trading volume, but showing some pullback on the 1h
- Current price is 0.012274; let's see if it can hold the pullback area in the short term
- If it doesn't break the pullback, we can look for a second wave of strength
5) VVVUSDT
- Enough of a rise on the 6h, with increased trading volume
- However, 1h positions haven't changed much, indicating it’s more of a high-level consolidation
- Better suited for waiting on confirmation of a breakout, not for chasing at emotional peaks
Watch Levels / Trigger Conditions / Invalid Conditions:
- Watch Levels: Near their current prices, focusing on the strength of support after pullbacks
- Trigger Conditions: Re-accumulation after a pullback holds, or effective breakout after consolidation of local highs
- Invalid Conditions: Breaking below pullback lows, or a rapid drop after a high with lost support
Risk Warning:
- Most assets today have already seen some increase, chasing highs can easily lead to getting caught in a pullback
- Overall funding rates are slightly positive, indicating the mood isn't cold; the hotter it gets, the more you need confirmation
- Only take opportunities after confirmation, avoid hard entries at emotional peaks
In a nutshell:
Today, I’ll wait for a pullback and won’t chase in places that have already pumped; what’s really worth watching are those that can show a second wave of strength.
Market Status: Watching, with clear structural divergence. Today isn't a day to mindlessly chase the pumps; it's more about waiting for pullbacks and confirming breakouts.
Top Picks:
1) CLOUSDT
- After a 40.04% pump, it still shows strength, continuing to rise in the 6h timeframe
- Funding rate is slightly positive, and 1h positions are increasing
- Current price is 0.17104, quite a distance from the 20/50 reference levels; let's see if it can hold the pullback
2) ZESTUSDT
- Strong performance on the 6h chart, decent volume, and noticeable increase in 1h positions
- Current price is 0.2651; the structure is still strengthening, but short-term it's at a position that needs consolidation
- If it can hold and push higher, the continuation will be better
3) VELVETUSDT
- After a 24% pump, there’s still capital flowing in
- However, the current price of 0.15343 has clearly deviated from short to mid-term reference levels, making chasing it less favorable
- Better suited for waiting on a pullback to see if it can regain strength
4) Lobster USDT
- Strong on the 6h chart, high trading volume, but showing some pullback on the 1h
- Current price is 0.012274; let's see if it can hold the pullback area in the short term
- If it doesn't break the pullback, we can look for a second wave of strength
5) VVVUSDT
- Enough of a rise on the 6h, with increased trading volume
- However, 1h positions haven't changed much, indicating it’s more of a high-level consolidation
- Better suited for waiting on confirmation of a breakout, not for chasing at emotional peaks
Watch Levels / Trigger Conditions / Invalid Conditions:
- Watch Levels: Near their current prices, focusing on the strength of support after pullbacks
- Trigger Conditions: Re-accumulation after a pullback holds, or effective breakout after consolidation of local highs
- Invalid Conditions: Breaking below pullback lows, or a rapid drop after a high with lost support
Risk Warning:
- Most assets today have already seen some increase, chasing highs can easily lead to getting caught in a pullback
- Overall funding rates are slightly positive, indicating the mood isn't cold; the hotter it gets, the more you need confirmation
- Only take opportunities after confirmation, avoid hard entries at emotional peaks
In a nutshell:
Today, I’ll wait for a pullback and won’t chase in places that have already pumped; what’s really worth watching are those that can show a second wave of strength.
1.4k


$WLD is getting serious attention - and not just from the crypto crowd.
The World Foundation, backed by Sam Altman, has secured new funding to scale its "Proof of Human" identity system. That’s a big deal. World ID isn’t just another layer on top of crypto - it’s a full-scale rethink of how trust is built online, and it’s already drawing interest from far beyond the blockchain space.
WLD is at the center of this. It’s the token powering the World ID infrastructure, and with the latest funding round, the team is clearly scaling up. This isn’t just hype - it’s a real product with a clear mission.
What’s next for WLD? That’s the question. But one thing’s clear: the project is gaining traction, and it’s not just in the crypto world anymore.
—
For educational purposes only. Not financial advice.
📌 Crypto 101 · #73 · #CryptoEducation #CryptoSighted $WLD
$WLD is getting serious attention - and not just from the crypto crowd.
The World Foundation, backed by Sam Altman, has secured new funding to scale its "Proof of Human" identity system. That’s a big deal. World ID isn’t just another layer on top of crypto - it’s a full-scale rethink of how trust is built online, and it’s already drawing interest from far beyond the blockchain space.
WLD is at the center of this. It’s the token powering the World ID infrastructure, and with the latest funding round, the team is clearly scaling up. This isn’t just hype - it’s a real product with a clear mission.
What’s next for WLD? That’s the question. But one thing’s clear: the project is gaining traction, and it’s not just in the crypto world anymore.
—
For educational purposes only. Not financial advice.
📌 Crypto 101 · #73 · #CryptoEducation #CryptoSighted $WLD
The World Foundation, backed by Sam Altman, has secured new funding to scale its "Proof of Human" identity system. That’s a big deal. World ID isn’t just another layer on top of crypto - it’s a full-scale rethink of how trust is built online, and it’s already drawing interest from far beyond the blockchain space.
WLD is at the center of this. It’s the token powering the World ID infrastructure, and with the latest funding round, the team is clearly scaling up. This isn’t just hype - it’s a real product with a clear mission.
What’s next for WLD? That’s the question. But one thing’s clear: the project is gaining traction, and it’s not just in the crypto world anymore.
—
For educational purposes only. Not financial advice.
📌 Crypto 101 · #73 · #CryptoEducation #CryptoSighted $WLD

157
·
--
Contract Quantitative Brief #73 | Don't chase blindly today, I'm only watching these 3
Market Status:
Continuity is still there, and the funding rate overall is manageable. Today isn't about mindless FOMO; it's more about whether the trend can keep pushing up along the 20-day MA.
I'm focused on these 3:
1) UBUSDT
Selection Reason: Strong price movement, solid trading volume, and 6h intensity are all on point, with OI also increasing, making it a bullish asset with no broken trend.
Watch Area: Near the 20-day MA
Trigger Condition: Bounce back without breaking, then volume should pick up again
Invalidation Condition: Drops back below the 20-day MA, and the rebound can't keep up
2) SAGAUSDT
Selection Reason: Clear 1h rebound, strong 24h price increase, neutral funding rate, good for watching a secondary strength reversal.
Watch Area: Near-term highs and around the 20-day MA
Trigger Condition: After consolidating, continues to rise, OI expands again
Invalidation Condition: Quick pullback after spiking, 6h strength gets engulfed
3) DRIFTUSDT
Selection Reason: Most aggressive price increase, OI surging in 1h, likely to accelerate directly, but it requires careful following.
Watch Area: Pullback support zone after a rise
Trigger Condition: Quick recovery after a dip and continues to make new highs
Invalidation Condition: High volume with no price increase, uncontrollable pullback
Keep an eye on:
INUSDT: Has price increase, but OI is declining; let's see if it can regroup funds.
DEXEUSDT: More stable, close to the 20-day MA, better to wait for confirmation, not suitable for jumping the gun.
Risk Warning:
This phase is a continuation market, but high OI doesn't mean it can keep surging. The biggest risks are pullbacks after spikes and false breakouts, so don’t chase too aggressively without confirmation; it's more important to stay light and wait for signals.
In summary:
Today, I'm more inclined to focus on UBUSDT and SAGAUSDT, while DRIFT is only for those who confirm first—don't chase without confirmation.
Contract Quantitative Brief #73 | Don't chase blindly today, I'm only watching these 3
Market Status:
Continuity is still there, and the funding rate overall is manageable. Today isn't about mindless FOMO; it's more about whether the trend can keep pushing up along the 20-day MA.
I'm focused on these 3:
1) UBUSDT
Selection Reason: Strong price movement, solid trading volume, and 6h intensity are all on point, with OI also increasing, making it a bullish asset with no broken trend.
Watch Area: Near the 20-day MA
Trigger Condition: Bounce back without breaking, then volume should pick up again
Invalidation Condition: Drops back below the 20-day MA, and the rebound can't keep up
2) SAGAUSDT
Selection Reason: Clear 1h rebound, strong 24h price increase, neutral funding rate, good for watching a secondary strength reversal.
Watch Area: Near-term highs and around the 20-day MA
Trigger Condition: After consolidating, continues to rise, OI expands again
Invalidation Condition: Quick pullback after spiking, 6h strength gets engulfed
3) DRIFTUSDT
Selection Reason: Most aggressive price increase, OI surging in 1h, likely to accelerate directly, but it requires careful following.
Watch Area: Pullback support zone after a rise
Trigger Condition: Quick recovery after a dip and continues to make new highs
Invalidation Condition: High volume with no price increase, uncontrollable pullback
Keep an eye on:
INUSDT: Has price increase, but OI is declining; let's see if it can regroup funds.
DEXEUSDT: More stable, close to the 20-day MA, better to wait for confirmation, not suitable for jumping the gun.
Risk Warning:
This phase is a continuation market, but high OI doesn't mean it can keep surging. The biggest risks are pullbacks after spikes and false breakouts, so don’t chase too aggressively without confirmation; it's more important to stay light and wait for signals.
In summary:
Today, I'm more inclined to focus on UBUSDT and SAGAUSDT, while DRIFT is only for those who confirm first—don't chase without confirmation.
Market Status:
Continuity is still there, and the funding rate overall is manageable. Today isn't about mindless FOMO; it's more about whether the trend can keep pushing up along the 20-day MA.
I'm focused on these 3:
1) UBUSDT
Selection Reason: Strong price movement, solid trading volume, and 6h intensity are all on point, with OI also increasing, making it a bullish asset with no broken trend.
Watch Area: Near the 20-day MA
Trigger Condition: Bounce back without breaking, then volume should pick up again
Invalidation Condition: Drops back below the 20-day MA, and the rebound can't keep up
2) SAGAUSDT
Selection Reason: Clear 1h rebound, strong 24h price increase, neutral funding rate, good for watching a secondary strength reversal.
Watch Area: Near-term highs and around the 20-day MA
Trigger Condition: After consolidating, continues to rise, OI expands again
Invalidation Condition: Quick pullback after spiking, 6h strength gets engulfed
3) DRIFTUSDT
Selection Reason: Most aggressive price increase, OI surging in 1h, likely to accelerate directly, but it requires careful following.
Watch Area: Pullback support zone after a rise
Trigger Condition: Quick recovery after a dip and continues to make new highs
Invalidation Condition: High volume with no price increase, uncontrollable pullback
Keep an eye on:
INUSDT: Has price increase, but OI is declining; let's see if it can regroup funds.
DEXEUSDT: More stable, close to the 20-day MA, better to wait for confirmation, not suitable for jumping the gun.
Risk Warning:
This phase is a continuation market, but high OI doesn't mean it can keep surging. The biggest risks are pullbacks after spikes and false breakouts, so don’t chase too aggressively without confirmation; it's more important to stay light and wait for signals.
In summary:
Today, I'm more inclined to focus on UBUSDT and SAGAUSDT, while DRIFT is only for those who confirm first—don't chase without confirmation.
1.3k

·
--
The funds haven’t arrived, yet trading volume has gone up first. In transaction volume $ENA 24h is close to 150M. For a token ranked #73 by market cap, still down 94% from its ATH, this level of volume suggests that someone is willing to exchange chips here rather than panic and exit. Over the past 30 days, the price has mostly traded sideways between 0.072 and 0.09. In the last 7 days it’s up 8.6%, but over 30 days it’s down 0.12%. The order book looks more like repeatedly testing support and resistance within a range.
What I care about more is whether this volume reflects that the market is underpricing “ethena’s stablecoin narrative.” A product that fell from 1.5 to 0.09—if capital continues to step in within the 0.07–0.09 range—usually isn’t because of FOMO chasing; it’s often because someone is setting up expectations for the next leg of the move. But what truly needs confirmation is whether the trading volume can be sustained, not just a one-day rebound.
The risk is hidden in plain sight: a 24h gain of 3% makes it easy to ignore that it’s down 82% over the past year. If trading volume can’t be kept above 100M, this current rebound might just be a market-maker’s lure at the top edge of the range. Have you recently noticed any changes in ENA’s on-chain liquidity or funding rates? Which direction is accumulating?
The funds haven’t arrived, yet trading volume has gone up first. In transaction volume $ENA 24h is close to 150M. For a token ranked #73 by market cap, still down 94% from its ATH, this level of volume suggests that someone is willing to exchange chips here rather than panic and exit. Over the past 30 days, the price has mostly traded sideways between 0.072 and 0.09. In the last 7 days it’s up 8.6%, but over 30 days it’s down 0.12%. The order book looks more like repeatedly testing support and resistance within a range.
What I care about more is whether this volume reflects that the market is underpricing “ethena’s stablecoin narrative.” A product that fell from 1.5 to 0.09—if capital continues to step in within the 0.07–0.09 range—usually isn’t because of FOMO chasing; it’s often because someone is setting up expectations for the next leg of the move. But what truly needs confirmation is whether the trading volume can be sustained, not just a one-day rebound.
The risk is hidden in plain sight: a 24h gain of 3% makes it easy to ignore that it’s down 82% over the past year. If trading volume can’t be kept above 100M, this current rebound might just be a market-maker’s lure at the top edge of the range. Have you recently noticed any changes in ENA’s on-chain liquidity or funding rates? Which direction is accumulating?
What I care about more is whether this volume reflects that the market is underpricing “ethena’s stablecoin narrative.” A product that fell from 1.5 to 0.09—if capital continues to step in within the 0.07–0.09 range—usually isn’t because of FOMO chasing; it’s often because someone is setting up expectations for the next leg of the move. But what truly needs confirmation is whether the trading volume can be sustained, not just a one-day rebound.
The risk is hidden in plain sight: a 24h gain of 3% makes it easy to ignore that it’s down 82% over the past year. If trading volume can’t be kept above 100M, this current rebound might just be a market-maker’s lure at the top edge of the range. Have you recently noticed any changes in ENA’s on-chain liquidity or funding rates? Which direction is accumulating?
147

·
--
We're excited to share the latest trending tokens with our community 🚀. According to CoinGecko, some of the notable tokens include Catecoin, GRVT Token, and Cash Cat.
We're seeing significant market cap rankings, with Shiba Inu at #31 and Pump.fun at #73, while Hyperliquid takes the #10 spot. Other tokens like Cap and HYPE are also making waves, with market cap ranks #436 and #10 respectively.
As we continue to monitor the market, we notice changes in token values, with some experiencing percentage changes. We're looking forward to seeing how these tokens perform in the future 💡. Our community is eager to stay up-to-date on the latest trends, and we're happy to provide the latest information 📊.
$HOME, $EPIC, $UAI
We're excited to share the latest trending tokens with our community 🚀. According to CoinGecko, some of the notable tokens include Catecoin, GRVT Token, and Cash Cat.
We're seeing significant market cap rankings, with Shiba Inu at #31 and Pump.fun at #73, while Hyperliquid takes the #10 spot. Other tokens like Cap and HYPE are also making waves, with market cap ranks #436 and #10 respectively.
As we continue to monitor the market, we notice changes in token values, with some experiencing percentage changes. We're looking forward to seeing how these tokens perform in the future 💡. Our community is eager to stay up-to-date on the latest trends, and we're happy to provide the latest information 📊.
$HOME , $EPIC, $UAI
We're seeing significant market cap rankings, with Shiba Inu at #31 and Pump.fun at #73, while Hyperliquid takes the #10 spot. Other tokens like Cap and HYPE are also making waves, with market cap ranks #436 and #10 respectively.
As we continue to monitor the market, we notice changes in token values, with some experiencing percentage changes. We're looking forward to seeing how these tokens perform in the future 💡. Our community is eager to stay up-to-date on the latest trends, and we're happy to provide the latest information 📊.
$HOME , $EPIC, $UAI
2
3k
·
--
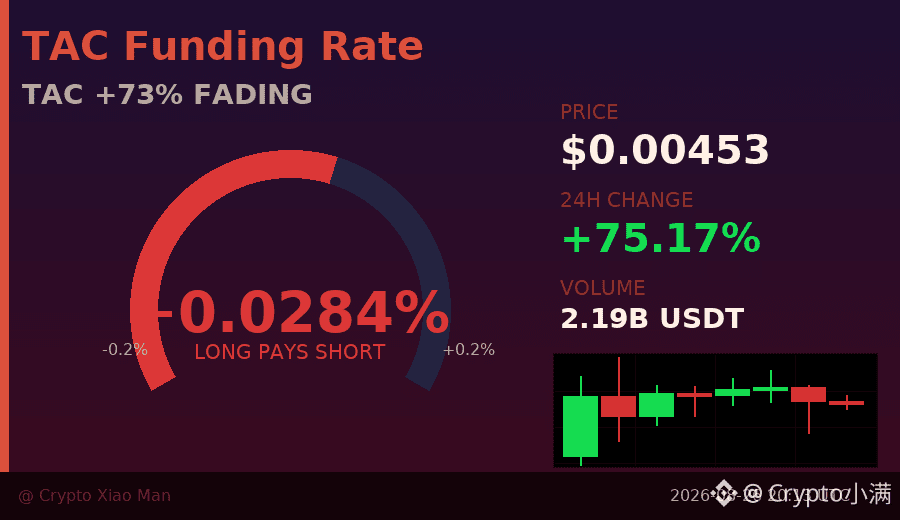
In 24 hours it surged 73%, but now we’re seeing three consecutive bearish candles—what story is TAC telling?
Today it touched a high of 0.00512. From the low point of 0.00242, that’s more than double—over 100% gain.
The first two hourly K-lines had trading volumes nearing 5 billion each. The volume and momentum are huge—typical of a main force pushing higher.
But starting with the third K-line, the volume drops straight to about half. The fourth K-line then cuts another 40%. And the most recent candles have even shrunk to less than 300 million.
Price follows the same pattern: consecutive bearish closes, sliding from around 0.00487 all the way back to about 0.00465.
The volume-price divergence signal is very clear: when price is still elevated but trading volume rapidly fades, it means the buying momentum isn’t being carried forward.
The long/short ratio is currently 51% longs versus 48.75% shorts—basically a near 50/50 split. The market’s disagreement on the next direction is very large.
The funding rate is 0.028%, still in the positive zone. That means the longs are still paying the shorts—implying leveraged long positions are still being held down, with no large-scale exit yet.
In short: this surge is real. But whether it can hold the gains depends on whether volume can re-expand within the current price range.
If volume keeps shrinking and the price breaks below the 0.0044 support, the probability of a short-term pullback will rise significantly.
$TAC #量价背离 #73% signal after the blow-off rally
Click the small card below to quickly check the chart 👇
In 24 hours it surged 73%, but now we’re seeing three consecutive bearish candles—what story is TAC telling?
Today it touched a high of 0.00512. From the low point of 0.00242, that’s more than double—over 100% gain.
The first two hourly K-lines had trading volumes nearing 5 billion each. The volume and momentum are huge—typical of a main force pushing higher.
But starting with the third K-line, the volume drops straight to about half. The fourth K-line then cuts another 40%. And the most recent candles have even shrunk to less than 300 million.
Price follows the same pattern: consecutive bearish closes, sliding from around 0.00487 all the way back to about 0.00465.
The volume-price divergence signal is very clear: when price is still elevated but trading volume rapidly fades, it means the buying momentum isn’t being carried forward.
The long/short ratio is currently 51% longs versus 48.75% shorts—basically a near 50/50 split. The market’s disagreement on the next direction is very large.
The funding rate is 0.028%, still in the positive zone. That means the longs are still paying the shorts—implying leveraged long positions are still being held down, with no large-scale exit yet.
In short: this surge is real. But whether it can hold the gains depends on whether volume can re-expand within the current price range.
If volume keeps shrinking and the price breaks below the 0.0044 support, the probability of a short-term pullback will rise significantly.
$TAC #量价背离 #73% signal after the blow-off rally
Click the small card below to quickly check the chart 👇
Today it touched a high of 0.00512. From the low point of 0.00242, that’s more than double—over 100% gain.
The first two hourly K-lines had trading volumes nearing 5 billion each. The volume and momentum are huge—typical of a main force pushing higher.
But starting with the third K-line, the volume drops straight to about half. The fourth K-line then cuts another 40%. And the most recent candles have even shrunk to less than 300 million.
Price follows the same pattern: consecutive bearish closes, sliding from around 0.00487 all the way back to about 0.00465.
The volume-price divergence signal is very clear: when price is still elevated but trading volume rapidly fades, it means the buying momentum isn’t being carried forward.
The long/short ratio is currently 51% longs versus 48.75% shorts—basically a near 50/50 split. The market’s disagreement on the next direction is very large.
The funding rate is 0.028%, still in the positive zone. That means the longs are still paying the shorts—implying leveraged long positions are still being held down, with no large-scale exit yet.
In short: this surge is real. But whether it can hold the gains depends on whether volume can re-expand within the current price range.
If volume keeps shrinking and the price breaks below the 0.0044 support, the probability of a short-term pullback will rise significantly.
$TAC #量价背离 #73% signal after the blow-off rally
Click the small card below to quickly check the chart 👇
39
What if the next big inflow isn’t in crypto - but in tokenized stocks, trading at volumes five times higher than before?
Ethereum ETFs ended their five-day inflow streak, closing the week in red, while tokenized stocks - like those from Robinhood Chain - saw real-world assets jump fivefold as trading volumes grew.
—
Not financial advice. DYOR.
📌 News Take · #73 · #CryptoNews #CryptoSighted
What if the next big inflow isn’t in crypto - but in tokenized stocks, trading at volumes five times higher than before?
Ethereum ETFs ended their five-day inflow streak, closing the week in red, while tokenized stocks - like those from Robinhood Chain - saw real-world assets jump fivefold as trading volumes grew.
—
Not financial advice. DYOR.
📌 News Take · #73 · #CryptoNews #CryptoSighted
Ethereum ETFs ended their five-day inflow streak, closing the week in red, while tokenized stocks - like those from Robinhood Chain - saw real-world assets jump fivefold as trading volumes grew.
—
Not financial advice. DYOR.
📌 News Take · #73 · #CryptoNews #CryptoSighted
122

·
--
Trending: Lighter (LITUSDT)Lighter (LITUSDT) is trending on CoinGecko!
Rank: #73
On September 1, 2026, the crypto market displayed a mixed but generally bullish tone, with Bitcoin (BTC) holding firm above the 8 k mark and Ethereum (ETH) posting a modest gain. According to Binance data captured at 00:56 UTC, BTC traded at **8,648.02**, up **0.85%** over the past 24 hours on robust volume of roughly **1.18 billion USDT**. ETH followed suit at **,470.82**, rising **1.61%** with a 24‑hour quote volume of **~615 million USDT**, indicating sustained trader interest in the leading smart‑contract platform.
The day’s top performers among the listed altcoins were led by **NEARUSDT**, which surged **4.06%** to .948, supported by a quote volume of **~25.75 million USDT**. Polkadot (DOT) and Cardano (ADA) also posted notable gains, climbing **2.79%** to /bin/sh.848 and **2.62%** to /bin/sh.1995, respectively. Both assets saw healthy trading activity, with DOT’s quote volume at **~4.06 million USDT** and ADA’s at **~18.16 million USDT**.
Other notable movers included Uniswap (UNI) (+1.56%), Chainlink (LINK) (+1.53%), and Avalanche (AVAX) (+1.47%), each posting gains above 1% while maintaining solid liquidity. XRP, BNB, and the major pairs BTCUSDT and ETHUSDT rounded out the top‑10 list with more modest but positive changes, reflecting a broadly risk‑on sentiment across the ecosystem.
Volume analysis reveals that while BTC and ETH dominate absolute quote volume, several mid‑cap tokens are experiencing disproportionate inflows relative to their market caps. NEAR’s 4% rise, for instance, occurred on a quote volume that is roughly **1.5%** of ETH’s daily volume, suggesting concentrated buying interest possibly driven by recent ecosystem updates or developer activity. Similarly, DOT and ADA’s gains coincided with elevated on‑chain metrics reported by their respective communities, hinting at fundamental catalysts rather than purely speculative flows.
Overall, the data points to a market where the leading assets are stabilizing, while select altcoins are carving out short‑term momentum. Traders observing these patterns may consider monitoring news flows, network upgrades, and on‑chain indicators to gauge whether the current moves are part of a broader trend or isolated reactions. As always, staying informed and employing sound risk management remains essential in navigating the ever‑evolving crypto landscape.
#lit #crypto #trending #CoinGecko
Trending: Lighter (LITUSDT)
Lighter (LITUSDT) is trending on CoinGecko!
Rank: #73
On September 1, 2026, the crypto market displayed a mixed but generally bullish tone, with Bitcoin (BTC) holding firm above the 8 k mark and Ethereum (ETH) posting a modest gain. According to Binance data captured at 00:56 UTC, BTC traded at **8,648.02**, up **0.85%** over the past 24 hours on robust volume of roughly **1.18 billion USDT**. ETH followed suit at **,470.82**, rising **1.61%** with a 24‑hour quote volume of **~615 million USDT**, indicating sustained trader interest in the leading smart‑contract platform.
The day’s top performers among the listed altcoins were led by **NEARUSDT**, which surged **4.06%** to .948, supported by a quote volume of **~25.75 million USDT**. Polkadot (DOT) and Cardano (ADA) also posted notable gains, climbing **2.79%** to /bin/sh.848 and **2.62%** to /bin/sh.1995, respectively. Both assets saw healthy trading activity, with DOT’s quote volume at **~4.06 million USDT** and ADA’s at **~18.16 million USDT**.
Other notable movers included Uniswap (UNI) (+1.56%), Chainlink (LINK) (+1.53%), and Avalanche (AVAX) (+1.47%), each posting gains above 1% while maintaining solid liquidity. XRP, BNB, and the major pairs BTCUSDT and ETHUSDT rounded out the top‑10 list with more modest but positive changes, reflecting a broadly risk‑on sentiment across the ecosystem.
Volume analysis reveals that while BTC and ETH dominate absolute quote volume, several mid‑cap tokens are experiencing disproportionate inflows relative to their market caps. NEAR’s 4% rise, for instance, occurred on a quote volume that is roughly **1.5%** of ETH’s daily volume, suggesting concentrated buying interest possibly driven by recent ecosystem updates or developer activity. Similarly, DOT and ADA’s gains coincided with elevated on‑chain metrics reported by their respective communities, hinting at fundamental catalysts rather than purely speculative flows.
Overall, the data points to a market where the leading assets are stabilizing, while select altcoins are carving out short‑term momentum. Traders observing these patterns may consider monitoring news flows, network upgrades, and on‑chain indicators to gauge whether the current moves are part of a broader trend or isolated reactions. As always, staying informed and employing sound risk management remains essential in navigating the ever‑evolving crypto landscape.
#lit #crypto #trending #CoinGecko
Rank: #73
On September 1, 2026, the crypto market displayed a mixed but generally bullish tone, with Bitcoin (BTC) holding firm above the 8 k mark and Ethereum (ETH) posting a modest gain. According to Binance data captured at 00:56 UTC, BTC traded at **8,648.02**, up **0.85%** over the past 24 hours on robust volume of roughly **1.18 billion USDT**. ETH followed suit at **,470.82**, rising **1.61%** with a 24‑hour quote volume of **~615 million USDT**, indicating sustained trader interest in the leading smart‑contract platform.
The day’s top performers among the listed altcoins were led by **NEARUSDT**, which surged **4.06%** to .948, supported by a quote volume of **~25.75 million USDT**. Polkadot (DOT) and Cardano (ADA) also posted notable gains, climbing **2.79%** to /bin/sh.848 and **2.62%** to /bin/sh.1995, respectively. Both assets saw healthy trading activity, with DOT’s quote volume at **~4.06 million USDT** and ADA’s at **~18.16 million USDT**.
Other notable movers included Uniswap (UNI) (+1.56%), Chainlink (LINK) (+1.53%), and Avalanche (AVAX) (+1.47%), each posting gains above 1% while maintaining solid liquidity. XRP, BNB, and the major pairs BTCUSDT and ETHUSDT rounded out the top‑10 list with more modest but positive changes, reflecting a broadly risk‑on sentiment across the ecosystem.
Volume analysis reveals that while BTC and ETH dominate absolute quote volume, several mid‑cap tokens are experiencing disproportionate inflows relative to their market caps. NEAR’s 4% rise, for instance, occurred on a quote volume that is roughly **1.5%** of ETH’s daily volume, suggesting concentrated buying interest possibly driven by recent ecosystem updates or developer activity. Similarly, DOT and ADA’s gains coincided with elevated on‑chain metrics reported by their respective communities, hinting at fundamental catalysts rather than purely speculative flows.
Overall, the data points to a market where the leading assets are stabilizing, while select altcoins are carving out short‑term momentum. Traders observing these patterns may consider monitoring news flows, network upgrades, and on‑chain indicators to gauge whether the current moves are part of a broader trend or isolated reactions. As always, staying informed and employing sound risk management remains essential in navigating the ever‑evolving crypto landscape.
#lit #crypto #trending #CoinGecko
28
"$BNB is getting futures, collateral, and trading pairs - but $AERO is only showing up on Earn, Buy Crypto, Convert, VIP Loan & Margin."
That’s not just a functional split - it’s a strategic signal.
While BNB is expanding into futures and TradFi assets, AERO is being added to non-trading tools.
The contrast is sharp, and it’s not accidental.
BNB has had multiple announcements in late July - futures launches, collateral additions, and new trading pairs.
AERO, on the other hand, has only two, both focused on Earn and Convert.
This isn’t a side note - it’s a shift in Binance’s approach.
Looks like Binance is quietly segmenting its ecosystem.
One coin is getting the tools for active trading, the other is being placed in more passive, utility-focused areas.
Is this the start of a new user-tier strategy - one that separates traders from long-term holders?
—
Not financial advice. DYOR.
📌 Announcements · #73 · #CryptoNews #CryptoSighted $BNB
"$BNB is getting futures, collateral, and trading pairs - but $AERO is only showing up on Earn, Buy Crypto, Convert, VIP Loan & Margin."
That’s not just a functional split - it’s a strategic signal.
While BNB is expanding into futures and TradFi assets, AERO is being added to non-trading tools.
The contrast is sharp, and it’s not accidental.
BNB has had multiple announcements in late July - futures launches, collateral additions, and new trading pairs.
AERO, on the other hand, has only two, both focused on Earn and Convert.
This isn’t a side note - it’s a shift in Binance’s approach.
Looks like Binance is quietly segmenting its ecosystem.
One coin is getting the tools for active trading, the other is being placed in more passive, utility-focused areas.
Is this the start of a new user-tier strategy - one that separates traders from long-term holders?
—
Not financial advice. DYOR.
📌 Announcements · #73 · #CryptoNews #CryptoSighted $BNB
That’s not just a functional split - it’s a strategic signal.
While BNB is expanding into futures and TradFi assets, AERO is being added to non-trading tools.
The contrast is sharp, and it’s not accidental.
BNB has had multiple announcements in late July - futures launches, collateral additions, and new trading pairs.
AERO, on the other hand, has only two, both focused on Earn and Convert.
This isn’t a side note - it’s a shift in Binance’s approach.
Looks like Binance is quietly segmenting its ecosystem.
One coin is getting the tools for active trading, the other is being placed in more passive, utility-focused areas.
Is this the start of a new user-tier strategy - one that separates traders from long-term holders?
—
Not financial advice. DYOR.
📌 Announcements · #73 · #CryptoNews #CryptoSighted $BNB

300

Article
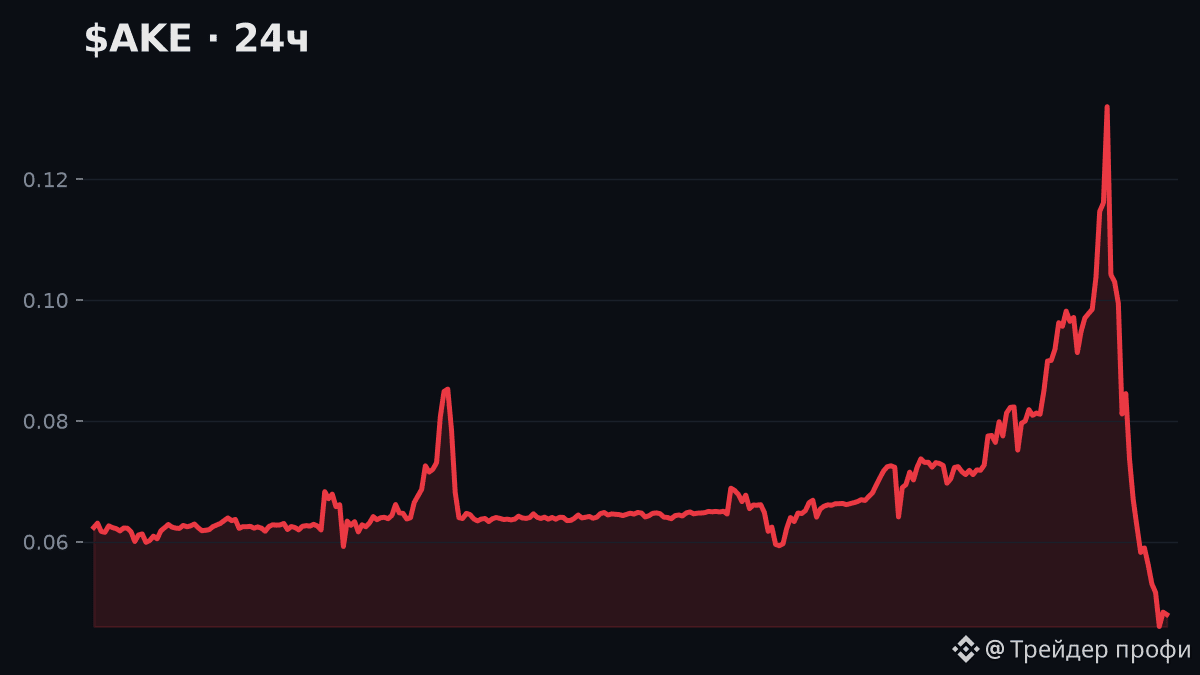
$AKE -22.5% in 24h — ended up the weakest in the top-100!📉 $AKE -22.5% in 24h — ended up the weakest in the top-100!
Day breakdown — short and to the point.
🧭 Summary: movement is GOING AGAINST the broader trend (7d/30d in the opposite direction) — it looks more like a short-term bounce/correction rather than a trend reversal.
🌍 Market context: out of 67 large-cap coins showing notable movement in the last 24h — 🔼 12 went up, 🔽 55 went down
$AKE -22.5% in 24h — ended up the weakest in the top-100!
📉 $AKE -22.5% in 24h — ended up the weakest in the top-100!
Day breakdown — short and to the point.
🧭 Summary: movement is GOING AGAINST the broader trend (7d/30d in the opposite direction) — it looks more like a short-term bounce/correction rather than a trend reversal.
🌍 Market context: out of 67 large-cap coins showing notable movement in the last 24h — 🔼 12 went up, 🔽 55 went down
Day breakdown — short and to the point.
🧭 Summary: movement is GOING AGAINST the broader trend (7d/30d in the opposite direction) — it looks more like a short-term bounce/correction rather than a trend reversal.
🌍 Market context: out of 67 large-cap coins showing notable movement in the last 24h — 🔼 12 went up, 🔽 55 went down
102
Log in to explore more content
Join global crypto users on Binance Square
⚡️ Get latest and useful information about crypto.
💬 Trusted by the world’s largest crypto exchange.
👍 Discover real insights from verified creators.
Email / Phone number
Trending Topics
1
#BinanceReopensWithdrawalsForMoreAssets
6,944 views
309 Discussing
2
#AppleReportsMixedResults
4,962 views
263 Discussing
3
#BinanceWithdrawalScamWarning
87,967 views
1,091 Discussing
4
#USMidtermElections
679,399 views
3,672 Discussing
5
#USOctoberNFP-AreRateCutsStillPossible
88,145 views
817 Discussing
6
#Verify1to1BinanceReserves
78,094 views
592 Discussing
7
#NEARVoteApprovesCutInMaxAnnualIssuanceTo1.6%
134 views
9 Discussing
8
#KOSPIDrops3.76%LedByChipHeavyweights
0 views
4 Discussing
9
#SouthKoreaFinanceMinistryDeniesOverseasPerpetualsTaxReport
0 views
1 Discussing
10
#BinanceRestores28FiatWithdrawals
222,075 views
1,270 Discussing