
户子说币
461 Posts

户子说币
Report
Block User
200块起家。
Open Trade
High-Frequency Trader
5.5 Years
36 Following
109 Followers
217 Liked
Posts
Portfolio
All
Quotes
·
--
I took a look, and $TRUMP went past 1.25.
Too bad it couldn't hold; now it's dropped back below again.
Which number do you pay more attention to?
I took a look, and $TRUMP went past 1.25.
Too bad it couldn't hold; now it's dropped back below again.
Which number do you pay more attention to?
Too bad it couldn't hold; now it's dropped back below again.
Which number do you pay more attention to?
25
·
--
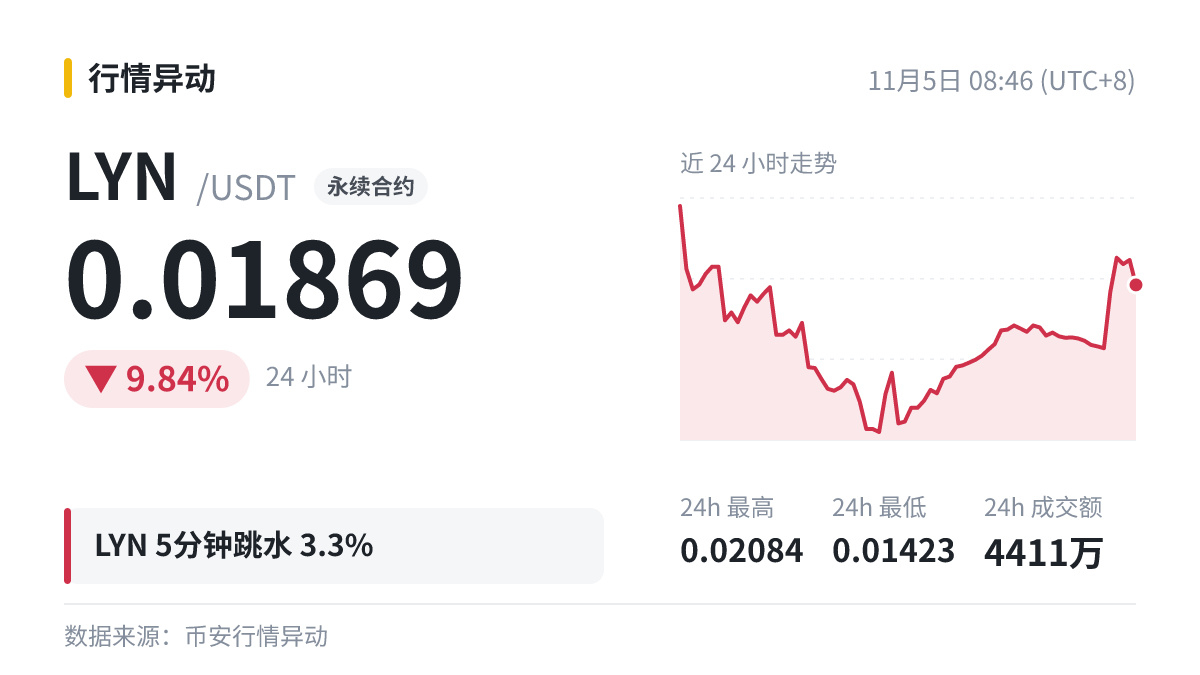
Unusual movement: $LYN 5 minutes -3.3%, at 0.01869.
The market has cooled, so I'll stay on the sidelines.
Unusual movement: $LYN 5 minutes -3.3%, at 0.01869.
The market has cooled, so I'll stay on the sidelines.
The market has cooled, so I'll stay on the sidelines.
65
·
--
🐋 A 4.68% plunge over $ELSA 15 minutes, with 24h trading volume of $94.53 million.
I usually check exchange net inflows and whale activity for another perspective beyond just looking at the candlestick chart.
After a drop, if the funding rate turns negative and becomes increasingly extreme, it means shorts are getting more crowded—so watch out for a rebound.
🐋 A 4.68% plunge over $ELSA 15 minutes, with 24h trading volume of $94.53 million.
I usually check exchange net inflows and whale activity for another perspective beyond just looking at the candlestick chart.
After a drop, if the funding rate turns negative and becomes increasingly extreme, it means shorts are getting more crowded—so watch out for a rebound.
I usually check exchange net inflows and whale activity for another perspective beyond just looking at the candlestick chart.
After a drop, if the funding rate turns negative and becomes increasingly extreme, it means shorts are getting more crowded—so watch out for a rebound.
1
·
--
$ELSA 1 hours +12.07%! Here we go, here we go—the candlestick chart is finally reacting!
Don’t gamble money you can’t afford to lose on this kind of volatility. How many times have you encountered price action like this? What usually happens next?
$ELSA 1 hours +12.07%! Here we go, here we go—the candlestick chart is finally reacting!
Don’t gamble money you can’t afford to lose on this kind of volatility. How many times have you encountered price action like this? What usually happens next?
Don’t gamble money you can’t afford to lose on this kind of volatility. How many times have you encountered price action like this? What usually happens next?
1
·
--
$WLD 5 minutes, it fell 1.93%.
The low for the day was 0.3617.
This kind of plunge isn't uncommon, so don't assume it's hit bottom.
Anyone else think so?
$WLD 5 minutes, it fell 1.93%.
The low for the day was 0.3617.
This kind of plunge isn't uncommon, so don't assume it's hit bottom.
Anyone else think so?
The low for the day was 0.3617.
This kind of plunge isn't uncommon, so don't assume it's hit bottom.
Anyone else think so?
12
·
--
$FET 1 hours, up +5.13%🚀, current price 0.1663!
Anyone know what news is behind this? The candlestick chart suddenly shot straight up.
If you know anything, drop a hint in the comments 👇
$FET 1 hours, up +5.13%🚀, current price 0.1663!
Anyone know what news is behind this? The candlestick chart suddenly shot straight up.
If you know anything, drop a hint in the comments 👇
Anyone know what news is behind this? The candlestick chart suddenly shot straight up.
If you know anything, drop a hint in the comments 👇
1
15
·
--
Just saw: 1000CAT hit a new 24-hour high.
Honestly, this happens every few days, and I usually don’t rush to act.
$1000CAT, up 11.38% in 24 hours. There’s always market action—don’t panic.
Just saw: 1000CAT hit a new 24-hour high.
Honestly, this happens every few days, and I usually don’t rush to act.
$1000CAT, up 11.38% in 24 hours. There’s always market action—don’t panic.
Honestly, this happens every few days, and I usually don’t rush to act.
$1000CAT, up 11.38% in 24 hours. There’s always market action—don’t panic.
2
·
--
Everyone's watching 1.7. $EVAA broke through, but it's now back at 1.6812, below that level again.
It's crossing back and forth, so it looks like both sides are still battling it out. Don't rush to conclusions.
We'll see how it goes. Stick to your own plan when buying and selling. Don't just watch the price movements—keep an eye on volume too.
Everyone's watching 1.7. $EVAA broke through, but it's now back at 1.6812, below that level again.
It's crossing back and forth, so it looks like both sides are still battling it out. Don't rush to conclusions.
We'll see how it goes. Stick to your own plan when buying and selling. Don't just watch the price movements—keep an eye on volume too.
It's crossing back and forth, so it looks like both sides are still battling it out. Don't rush to conclusions.
We'll see how it goes. Stick to your own plan when buying and selling. Don't just watch the price movements—keep an eye on volume too.
3
·
--
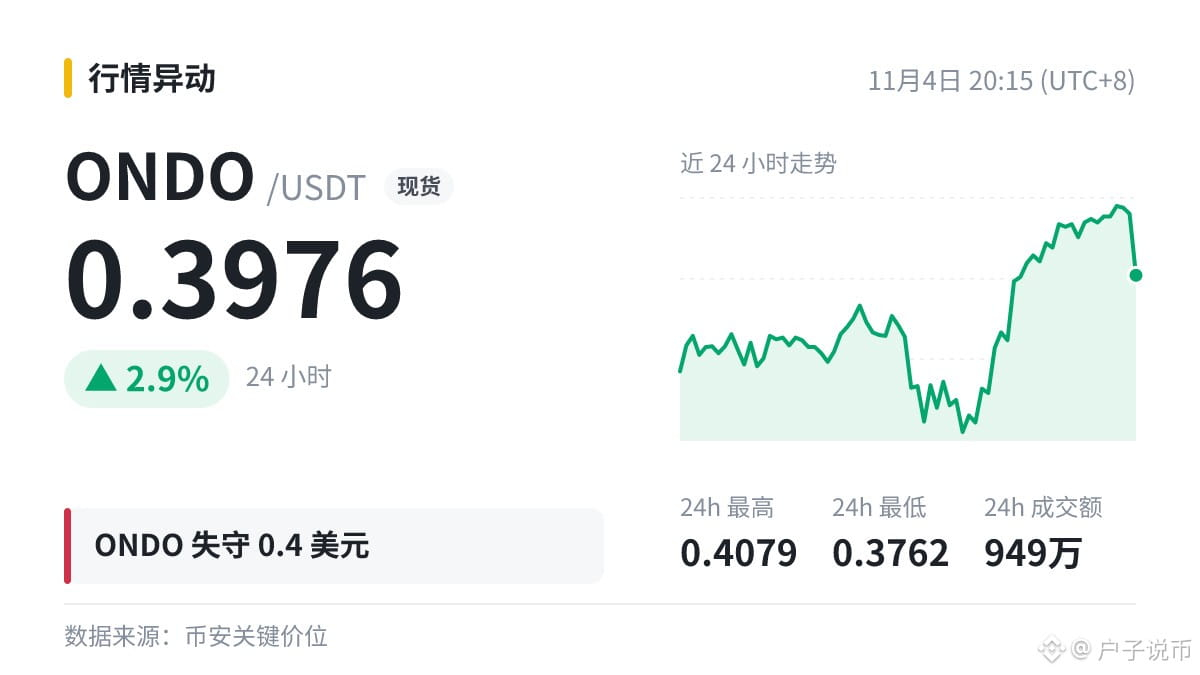
$ONDO fails to hold 0.4😰!
Once that level is breached, long positions’ stop-losses below it may be triggered one after another, and volatility could intensify.
How would you respond?
$ONDO fails to hold 0.4😰!
Once that level is breached, long positions’ stop-losses below it may be triggered one after another, and volatility could intensify.
How would you respond?
Once that level is breached, long positions’ stop-losses below it may be triggered one after another, and volatility could intensify.
How would you respond?
6
·
--
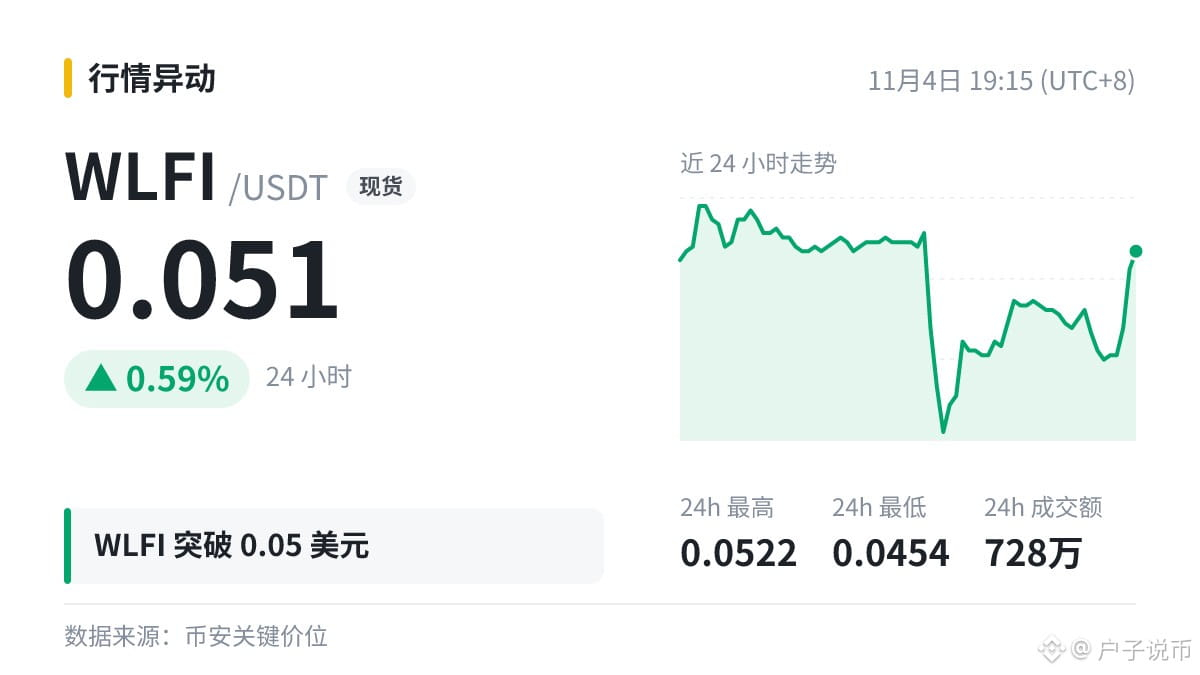
$WLFI broke through the 0.05 level.
Once the price moves above it, the next resistance to watch is the next whole number or the previous high.
Set the stop-loss beyond the key level, so you won't have to panic even if volatility increases.
#WLFI
$WLFI broke through the 0.05 level.
Once the price moves above it, the next resistance to watch is the next whole number or the previous high.
Set the stop-loss beyond the key level, so you won't have to panic even if volatility increases.
#WLFI
Once the price moves above it, the next resistance to watch is the next whole number or the previous high.
Set the stop-loss beyond the key level, so you won't have to panic even if volatility increases.
#WLFI
4
·
--
$LYN 5 minutes -3.86%🐻
A slight pullback, not panic-worthy for now.
Current price: 0.01552. Don’t average down to cover up a wrong call. Let’s see together what happens next.
$LYN 5 minutes -3.86%🐻
A slight pullback, not panic-worthy for now.
Current price: 0.01552. Don’t average down to cover up a wrong call. Let’s see together what happens next.
A slight pullback, not panic-worthy for now.
Current price: 0.01552. Don’t average down to cover up a wrong call. Let’s see together what happens next.
1
·
--
$NEAR , here's what's happening: NEAR's 4-hour MACD has a bullish crossover (below the zero line).
Don't keep watching the charts—focus more on your plan.
$NEAR , here's what's happening: NEAR's 4-hour MACD has a bullish crossover (below the zero line).
Don't keep watching the charts—focus more on your plan.
Don't keep watching the charts—focus more on your plan.
4
·
--
🔢 $EVAA 5 minutes -2.94%
Current price 1.6011, 24h trading volume $58.99 million
The trend looks pretty fierce, but markets are no strangers to rebounds after sharp drops. The key is whether leverage can hold up.
🔢 $EVAA 5 minutes -2.94%
Current price 1.6011, 24h trading volume $58.99 million
The trend looks pretty fierce, but markets are no strangers to rebounds after sharp drops. The key is whether leverage can hold up.
Current price 1.6011, 24h trading volume $58.99 million
The trend looks pretty fierce, but markets are no strangers to rebounds after sharp drops. The key is whether leverage can hold up.
·
--
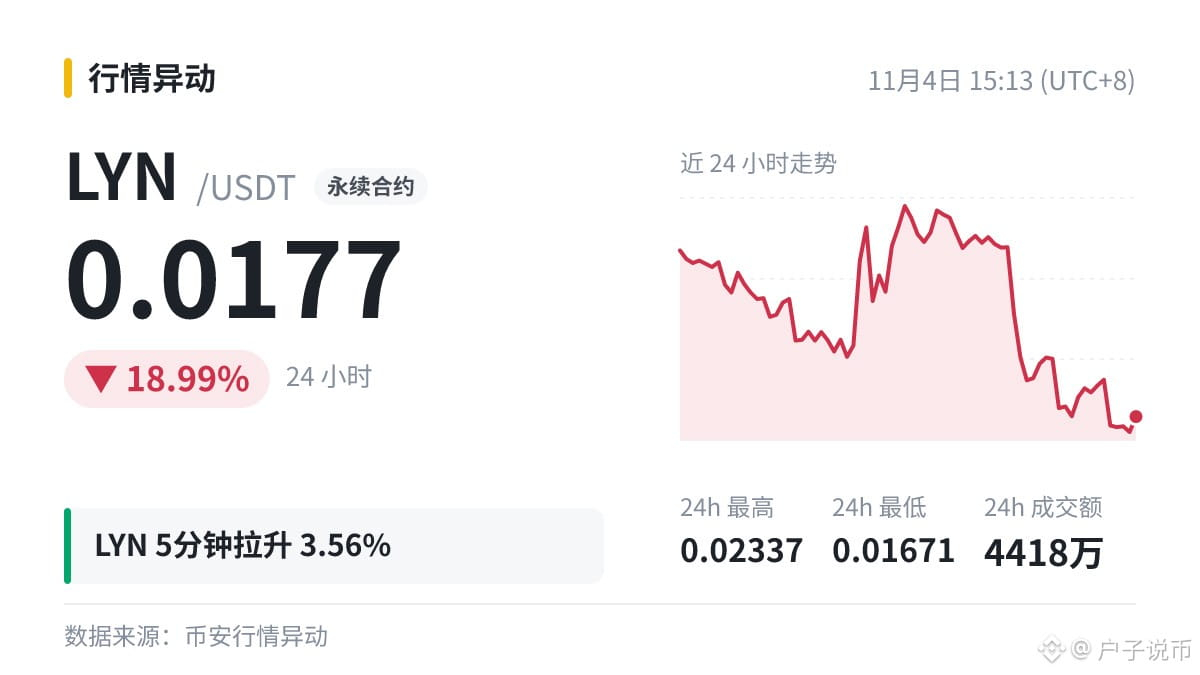
$LYN 5 minutes +3.56%⚡️
Steadily moving upward, and the structure looks fairly comfortable.
Current price: 0.0177. First, let’s see if it can hold steady; only then talk about further upside. What’s your strategy?
$LYN 5 minutes +3.56%⚡️
Steadily moving upward, and the structure looks fairly comfortable.
Current price: 0.0177. First, let’s see if it can hold steady; only then talk about further upside. What’s your strategy?
Steadily moving upward, and the structure looks fairly comfortable.
Current price: 0.0177. First, let’s see if it can hold steady; only then talk about further upside. What’s your strategy?
1
·
--
There's some movement, so let me mention it.
$ENA moved above 0.175, but it's now at 0.1745 and has slipped back down.
It's crossing back and forth, so the bulls and bears are still battling it out. No need to jump to conclusions. The signal has lit up, but I'm not rushing in—I'll see if the next candle follows through. Do you usually watch this number?
#ENA
There's some movement, so let me mention it.
$ENA moved above 0.175, but it's now at 0.1745 and has slipped back down.
It's crossing back and forth, so the bulls and bears are still battling it out. No need to jump to conclusions. The signal has lit up, but I'm not rushing in—I'll see if the next candle follows through. Do you usually watch this number?
#ENA
$ENA moved above 0.175, but it's now at 0.1745 and has slipped back down.
It's crossing back and forth, so the bulls and bears are still battling it out. No need to jump to conclusions. The signal has lit up, but I'm not rushing in—I'll see if the next candle follows through. Do you usually watch this number?
#ENA
7
·
--
Price Watch | $QNT Breaks Through the 190 Mark
Breaking above it isn’t hard; holding on is. Only a breakout that holds counts.
Price Watch | $QNT Breaks Through the 190 Mark
Breaking above it isn’t hard; holding on is. Only a breakout that holds counts.
Breaking above it isn’t hard; holding on is. Only a breakout that holds counts.
25
·
--
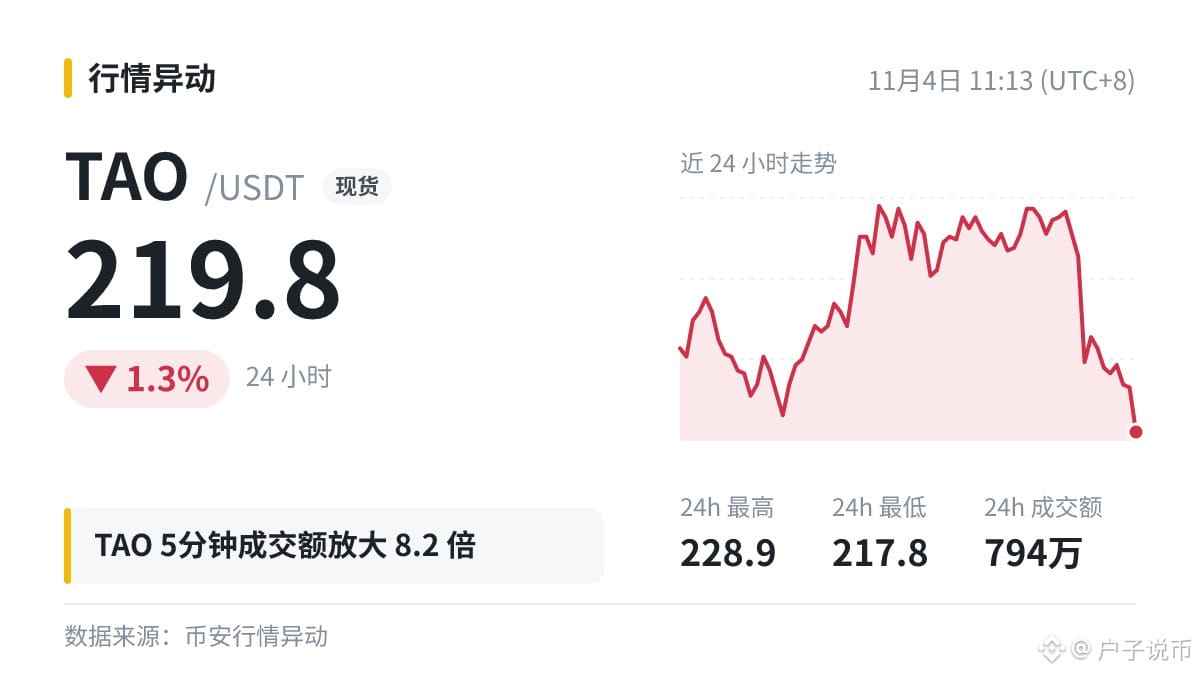
🧮 Volume surged 8.2x over $TAO 5 minutes, with $2.71 million in trading volume. Price: -0.2%; current price: 219.8.
A divergence between volume and price often indicates intense turnover, so watch for a directional move. Keep an eye on it—we’ll share any unusual activity promptly.
🧮 Volume surged 8.2x over $TAO 5 minutes, with $2.71 million in trading volume. Price: -0.2%; current price: 219.8.
A divergence between volume and price often indicates intense turnover, so watch for a directional move. Keep an eye on it—we’ll share any unusual activity promptly.
A divergence between volume and price often indicates intense turnover, so watch for a directional move. Keep an eye on it—we’ll share any unusual activity promptly.
26
·
--
⏰ Trading volume surged 4.4x over $BMT 1 hours
1-hour trading volume: $18.13 million; price rose 6.43% to the current price of 0.0306.
See the comments for opinions.
⏰ Trading volume surged 4.4x over $BMT 1 hours
1-hour trading volume: $18.13 million; price rose 6.43% to the current price of 0.0306.
See the comments for opinions.
1-hour trading volume: $18.13 million; price rose 6.43% to the current price of 0.0306.
See the comments for opinions.
36
·
--
Can it recover this time? This time, $LYN fell below 0.02.
It’s really hard to say. After breaking below a level, a rebound back to that point often runs into selling from people trying to break even. Just sharing a quick thought—please make up your own minds.
Can it recover this time? This time, $LYN fell below 0.02.
It’s really hard to say. After breaking below a level, a rebound back to that point often runs into selling from people trying to break even. Just sharing a quick thought—please make up your own minds.
It’s really hard to say. After breaking below a level, a rebound back to that point often runs into selling from people trying to break even. Just sharing a quick thought—please make up your own minds.
55
·
--
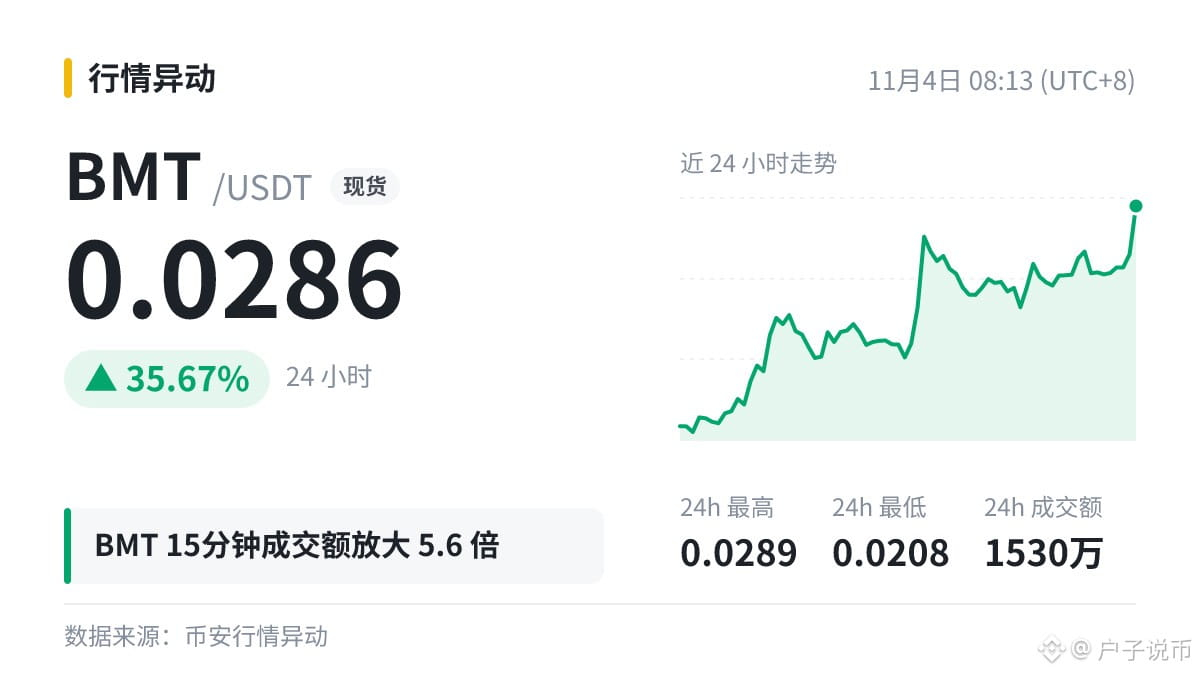
Volume Notes | $BMT
15-minute trading value: 2.43 million, 5.6 times the average; up 2.72%.
The above is only a market observation. Please make your own buying and selling decisions.
Volume Notes | $BMT
15-minute trading value: 2.43 million, 5.6 times the average; up 2.72%.
The above is only a market observation. Please make your own buying and selling decisions.
15-minute trading value: 2.43 million, 5.6 times the average; up 2.72%.
The above is only a market observation. Please make your own buying and selling decisions.
69
Log in to explore more content
Join global crypto users on Binance Square
⚡️ Get latest and useful information about crypto.
💬 Trusted by the world’s largest crypto exchange.
👍 Discover real insights from verified creators.
Email / Phone number
Trending Topics
BTCRebounds80K
79,880 views
799 Discussing
BITCOIN UPDATE I’M STILL BEARISH, AND HERE’S WHY! 🚨⚠️
As you all witnessed, BTC bounced back from the $75,700 area and touched $81K. First, the market trapped long traders, and then it trapped short traders.
I’m still bearish. First of all, as everyone knows, Democrats won today’s US midterm elections, and in my view, this outcome is bearish for the market.
The market can remain volatile in the short term and trap as many traders as it wants, but that doesn’t change the overall market outlook.
There are several important upcoming events, including US Non Farm Payrolls (November 6), US CPI Inflation (November 10), US PPI (November 13), US Retail Sales (November 17), FOMC Meeting Minutes (November 18), US PCE Inflation (November 25), Federal Reserve interest rate expectations, the US Dollar Index (DXY), Treasury Yields, Nasdaq performance, Bitcoin ETF flows, and ongoing( Iran ) Israel geopolitical developments. All of these could have a significant impact on Bitcoin and the overall crypto market.
But don’t get too carried away by Bitcoin’s recent movement. Technically speaking, there hasn’t been any major bullish move yet. Yesterday, BTC was trading between $80K and $82K, and even today, it’s still around the same range.
If you want to turn bullish, that’s entirely your choice.
In my previous post, I clearly explained that BTC had technical support in the $75K / $76K zone, and the price bounced from that support and made its way back towards $80K. But this wasn’t something I had failed to mention before. In fact, I repeatedly mentioned in my posts that BTC could move towards $80K, $81K, or even $82K.
Despite that, I’m still bearish.
And I don’t have just one reason to support my bearish outlook. I have several reasons, which I’ve already explained in my previous posts.
For now, I’ll continue to wait for BTC to drop below $74K, which I believe could happen very soon. In my view, such a correction is also necessary for the market.
Anyone looking for crypto guidance just let me know.
#BTCRebounds80K
Strategic Adviser
·31 Likes
·36.1k views
Binance98PercentReplenished
45,260 views
620 Discussing
USMidterms-WhatAreMarketsExpecting?
364,157 views
2,146 Discussing