

William Henry
19.6k Posts

William Henry
 Square Verified+
Report
Block User
Trader, Crypto Lover • LFG • 2025 Last Marketing. Forex X. @Wi_lliam_12 . X KITE-991244
Open Trade
Frequent Trader
2 Years
80 Following
45.1K+ Followers
65.0K+ Liked
Posts
Portfolio
All
Quotes
Live
·
--
Bullish
See translation
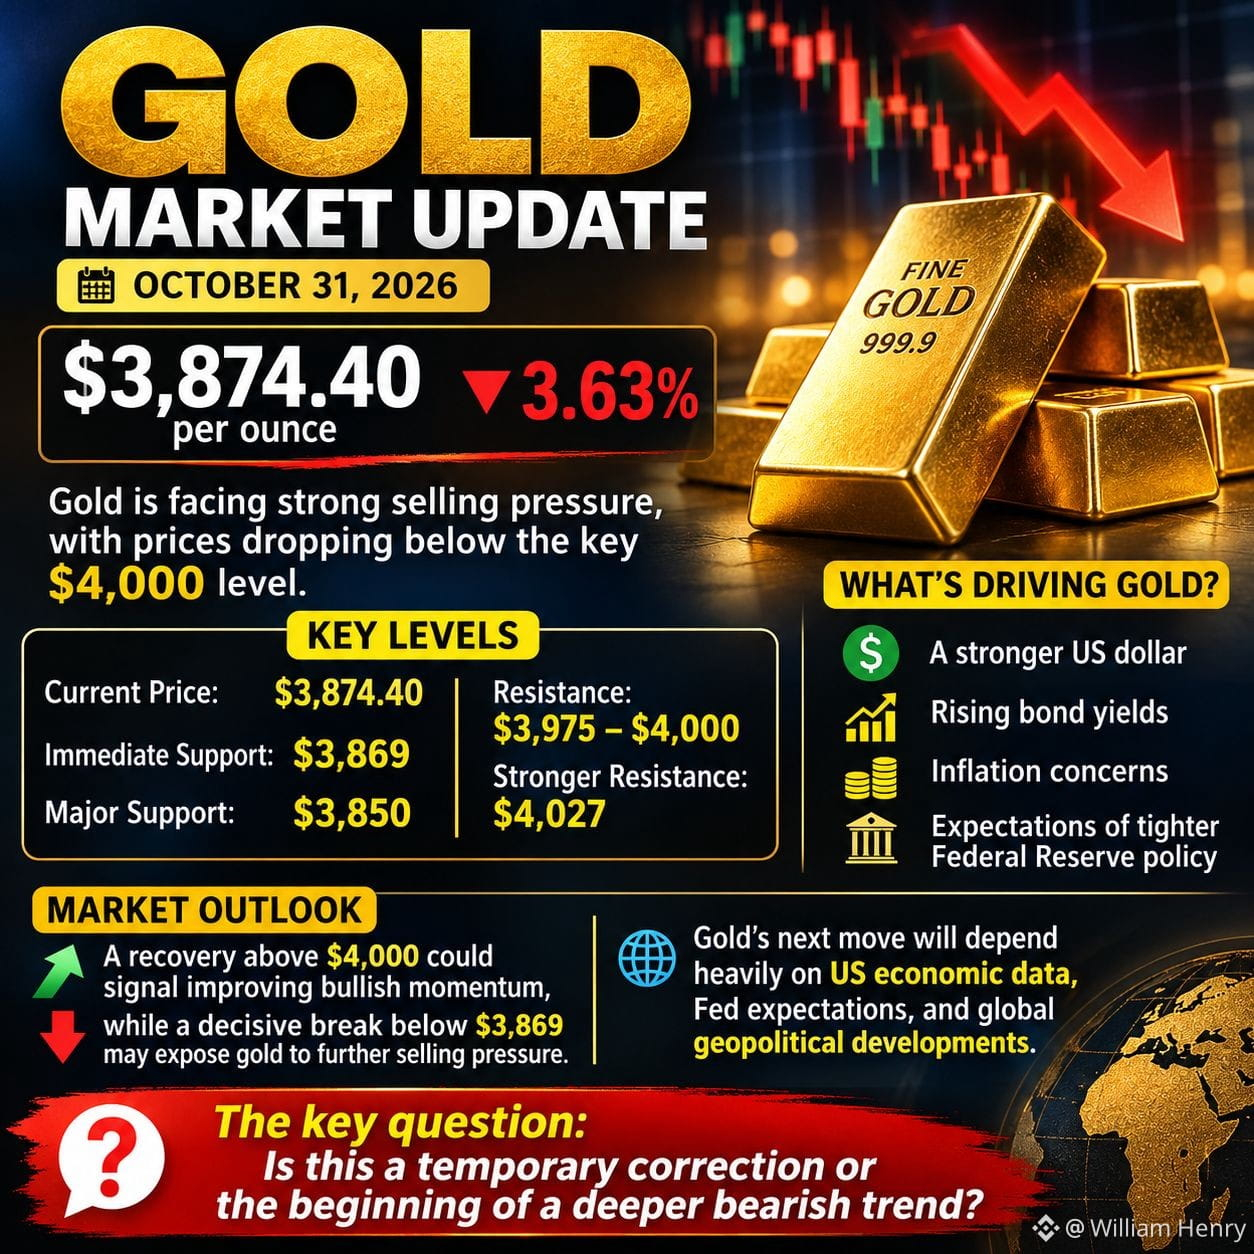
🟡 GOLD MARKET UPDATE | OCTOBER 31, 2026
Gold is facing strong selling pressure, with spot prices trading around $3,874.40 per ounce, down approximately 3.63% on the latest reported session.
The precious metal has dropped below the key psychological $4,000 level, raising concerns about further downside.
Key Levels:
- Current Price: $3,874.40
- Immediate Support: $3,869
- Major Support: $3,850
- Resistance: $3,975–$4,000
- Stronger Resistance: $4,027
What's Driving Gold?
A stronger US dollar, rising bond yields, inflation concerns, and expectations of tighter Federal Reserve policy are putting pressure on gold.
Market Outlook:
A recovery above $4,000 could signal improving bullish momentum, while a decisive break below $3,869 may expose gold to further selling pressure.
Gold's next move will depend heavily on US economic data, Fed expectations, and global geopolitical developments.
The key question: Is this a temporary correction or the beginning of a deeper bearish trend?
$XAUT
{future}(XAUTUSDT)
$CINF.US
{stock_us}(CINF.US)
$BTC
{future}(BTCUSDT)
🟡 GOLD MARKET UPDATE | OCTOBER 31, 2026
Gold is facing strong selling pressure, with spot prices trading around $3,874.40 per ounce, down approximately 3.63% on the latest reported session.
The precious metal has dropped below the key psychological $4,000 level, raising concerns about further downside.
Key Levels:
- Current Price: $3,874.40
- Immediate Support: $3,869
- Major Support: $3,850
- Resistance: $3,975–$4,000
- Stronger Resistance: $4,027
What's Driving Gold?
A stronger US dollar, rising bond yields, inflation concerns, and expectations of tighter Federal Reserve policy are putting pressure on gold.
Market Outlook:
A recovery above $4,000 could signal improving bullish momentum, while a decisive break below $3,869 may expose gold to further selling pressure.
Gold's next move will depend heavily on US economic data, Fed expectations, and global geopolitical developments.
The key question: Is this a temporary correction or the beginning of a deeper bearish trend?
$XAUT
$CINF.US
$BTC
Gold is facing strong selling pressure, with spot prices trading around $3,874.40 per ounce, down approximately 3.63% on the latest reported session.
The precious metal has dropped below the key psychological $4,000 level, raising concerns about further downside.
Key Levels:
- Current Price: $3,874.40
- Immediate Support: $3,869
- Major Support: $3,850
- Resistance: $3,975–$4,000
- Stronger Resistance: $4,027
What's Driving Gold?
A stronger US dollar, rising bond yields, inflation concerns, and expectations of tighter Federal Reserve policy are putting pressure on gold.
Market Outlook:
A recovery above $4,000 could signal improving bullish momentum, while a decisive break below $3,869 may expose gold to further selling pressure.
Gold's next move will depend heavily on US economic data, Fed expectations, and global geopolitical developments.
The key question: Is this a temporary correction or the beginning of a deeper bearish trend?
$XAUT
$CINF.US
$BTC
538
·
--
Bullish
See translation
$FIL – BEARISH SETUP
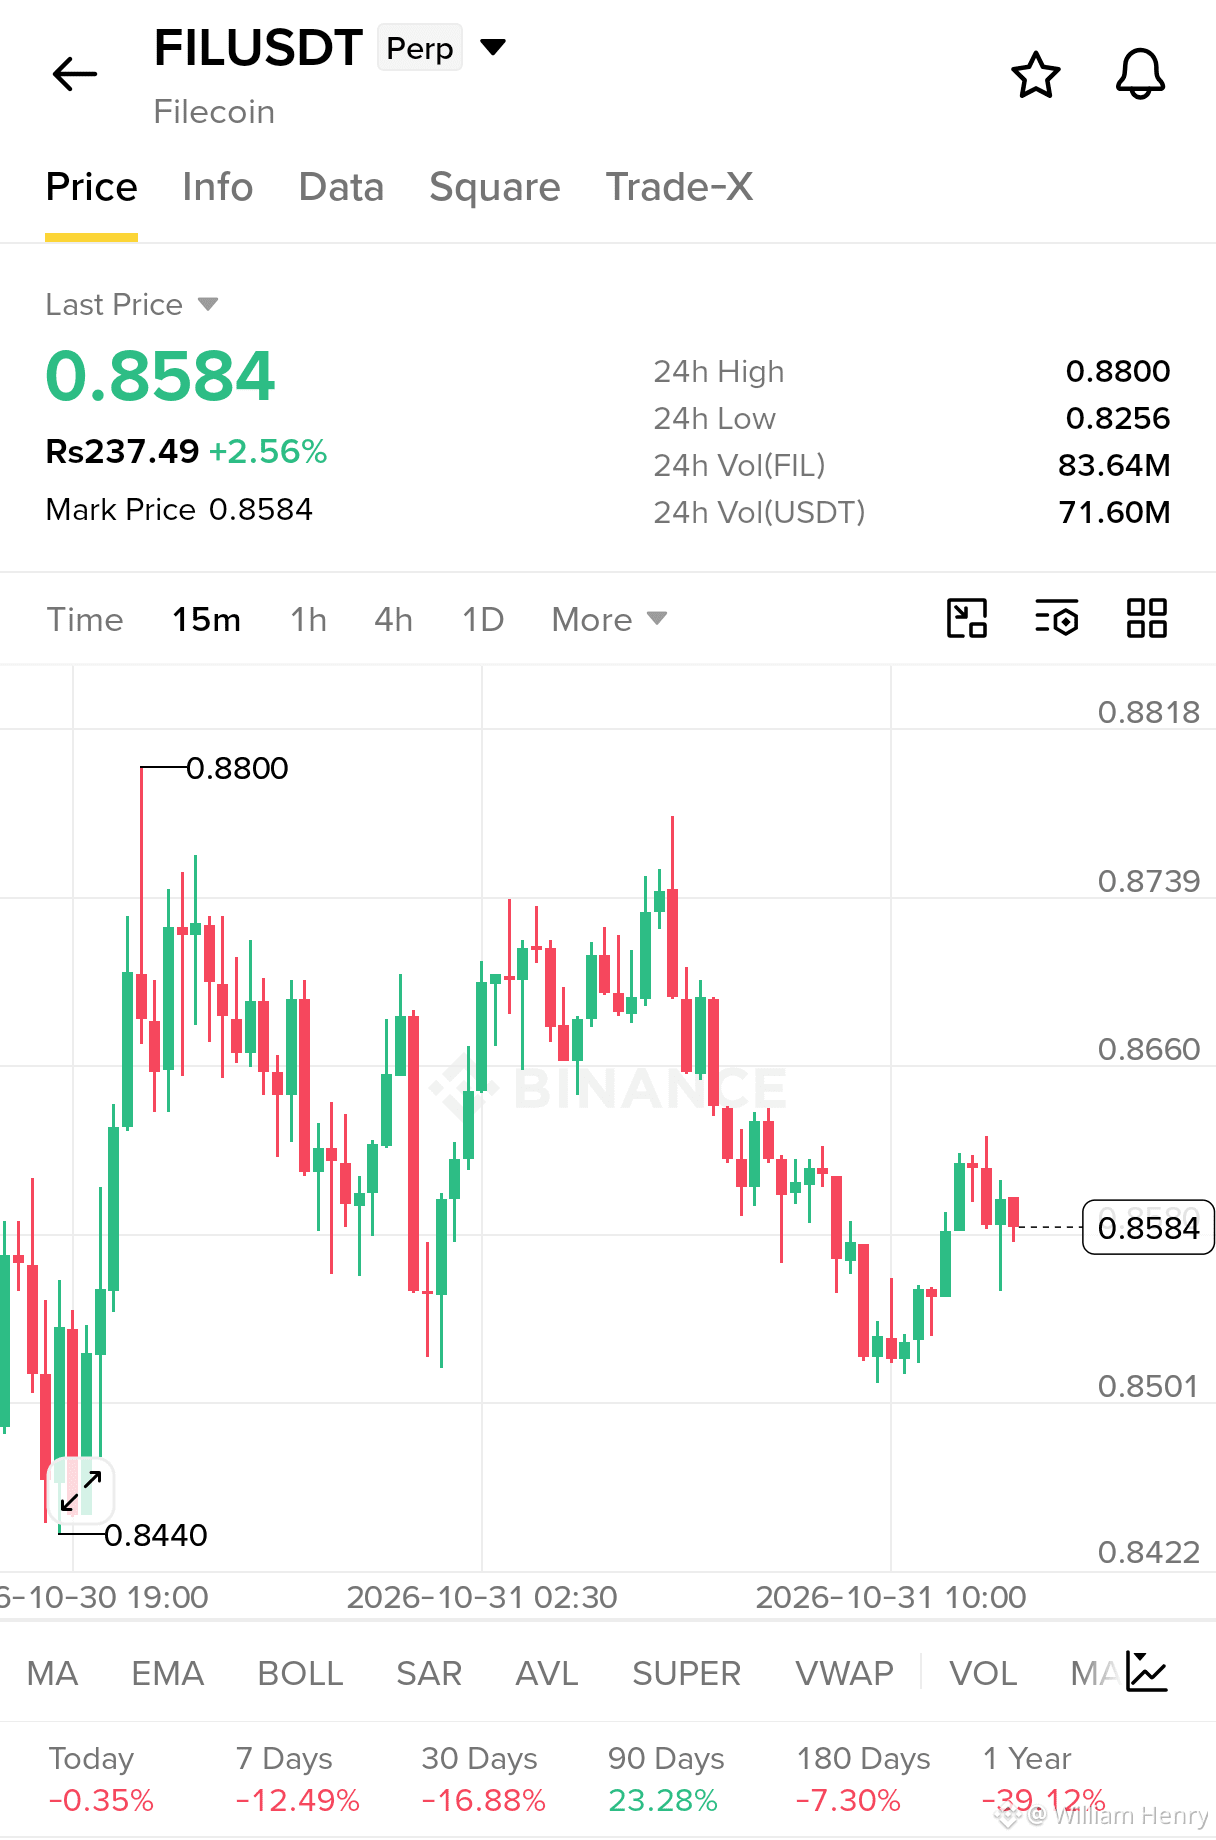
FIL is struggling to reclaim resistance! Price is currently trading at $0.8584 (+2.56%) after bouncing from the $0.8500 support area. The 15M chart shows lower highs and selling pressure near $0.8620.
Trade Setup: LONG
Entry Zone: $0.8590 – $0.8620
TP1: $0.8550 TP2: $0.8500 TP3: $0.8440
Stop Loss: $0.8665
Bullish invalidation: A strong 15M close above $0.8665 could weaken the bearish setup.
Watch the $0.8600 resistance closely. A rejection could trigger another move lower.
Let's go $FIL
{future}(FILUSDT)
$FIL – BEARISH SETUP
FIL is struggling to reclaim resistance! Price is currently trading at $0.8584 (+2.56%) after bouncing from the $0.8500 support area. The 15M chart shows lower highs and selling pressure near $0.8620.
Trade Setup: LONG
Entry Zone: $0.8590 – $0.8620
TP1: $0.8550 TP2: $0.8500 TP3: $0.8440
Stop Loss: $0.8665
Bullish invalidation: A strong 15M close above $0.8665 could weaken the bearish setup.
Watch the $0.8600 resistance closely. A rejection could trigger another move lower.
Let's go $FIL
FIL is struggling to reclaim resistance! Price is currently trading at $0.8584 (+2.56%) after bouncing from the $0.8500 support area. The 15M chart shows lower highs and selling pressure near $0.8620.
Trade Setup: LONG
Entry Zone: $0.8590 – $0.8620
TP1: $0.8550 TP2: $0.8500 TP3: $0.8440
Stop Loss: $0.8665
Bullish invalidation: A strong 15M close above $0.8665 could weaken the bearish setup.
Watch the $0.8600 resistance closely. A rejection could trigger another move lower.
Let's go $FIL
1
599
·
--
Bullish
See translation
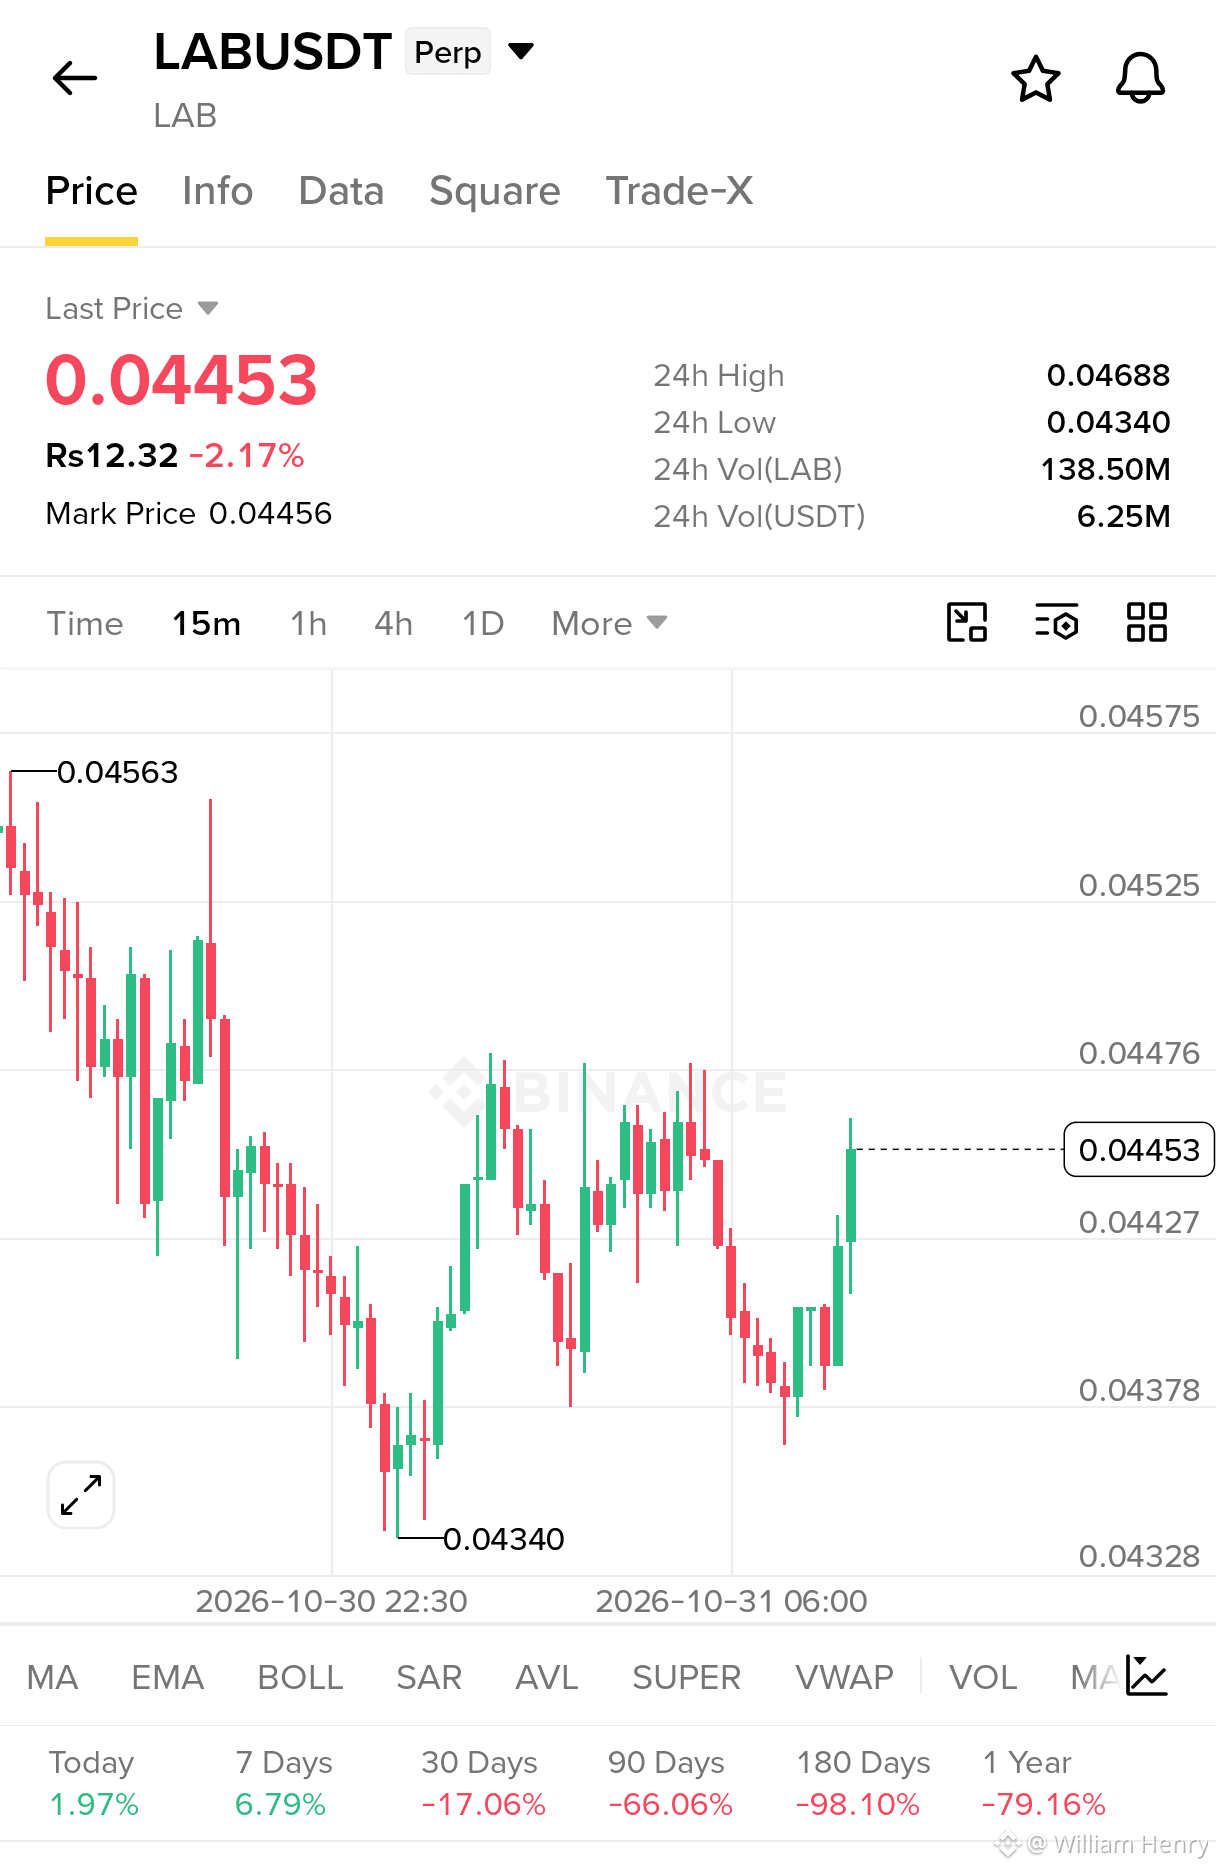
$LAB is showing fresh buying momentum on the 15M chart, bouncing from the $0.04340 low and pushing toward immediate resistance at $0.04476.
Trade Setup: LONG
Entry Zone: $0.04430 – $0.04455
TP1: $0.04476
TP2: $0.04500
TP3: $0.04525
Stop Loss: $0.04395
A breakout above $0.04476 could open the door for another upward move. Watch the confirmation before entering.
Let's go $LAB
{future}(LABUSDT)
$LAB is showing fresh buying momentum on the 15M chart, bouncing from the $0.04340 low and pushing toward immediate resistance at $0.04476.
Trade Setup: LONG
Entry Zone: $0.04430 – $0.04455
TP1: $0.04476
TP2: $0.04500
TP3: $0.04525
Stop Loss: $0.04395
A breakout above $0.04476 could open the door for another upward move. Watch the confirmation before entering.
Let's go $LAB
Trade Setup: LONG
Entry Zone: $0.04430 – $0.04455
TP1: $0.04476
TP2: $0.04500
TP3: $0.04525
Stop Loss: $0.04395
A breakout above $0.04476 could open the door for another upward move. Watch the confirmation before entering.
Let's go $LAB
1
608
·
--
Bullish
See translation
$SOPH — BULLISH BREAKOUT ALERT!
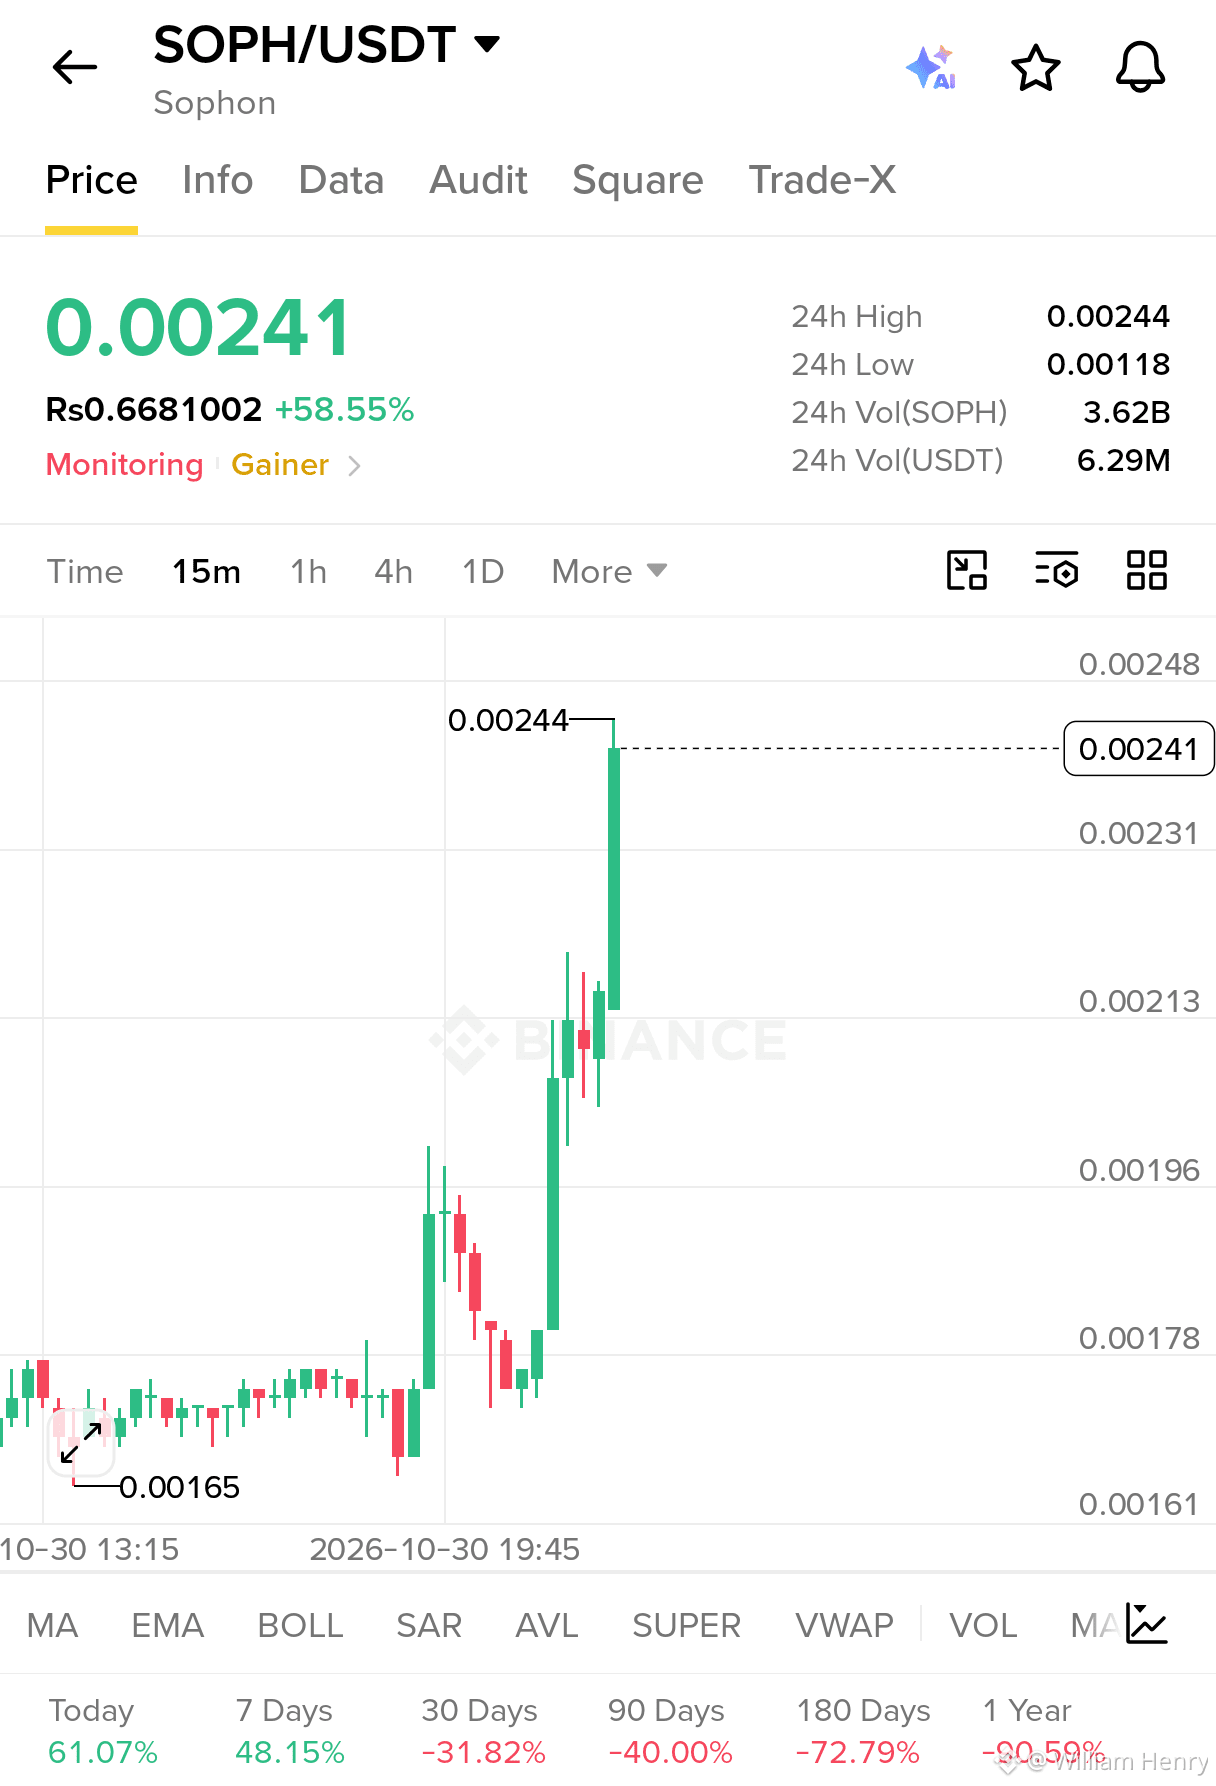
SOPH is surging +58.55%, trading at 0.00241 after a powerful 15M rally. Bulls are testing the 0.00244 resistance. A clean breakout could open the door for another move higher.
Trade Setup: LONG
Entry: 0.00230–0.00238 (retest)
TP1: 0.00250
TP2: 0.00258
TP3: 0.00270
SL: 0.00220
Watch for confirmation before entering. Don't chase the pump. Risk management first! 🔥
{future}(SOPHUSDT)
$SOPH — BULLISH BREAKOUT ALERT!
SOPH is surging +58.55%, trading at 0.00241 after a powerful 15M rally. Bulls are testing the 0.00244 resistance. A clean breakout could open the door for another move higher.
Trade Setup: LONG
Entry: 0.00230–0.00238 (retest)
TP1: 0.00250
TP2: 0.00258
TP3: 0.00270
SL: 0.00220
Watch for confirmation before entering. Don't chase the pump. Risk management first! 🔥
SOPH is surging +58.55%, trading at 0.00241 after a powerful 15M rally. Bulls are testing the 0.00244 resistance. A clean breakout could open the door for another move higher.
Trade Setup: LONG
Entry: 0.00230–0.00238 (retest)
TP1: 0.00250
TP2: 0.00258
TP3: 0.00270
SL: 0.00220
Watch for confirmation before entering. Don't chase the pump. Risk management first! 🔥
William Henry
·
--
Bearish$GTC SHORT — Bears Are Fighting Back!
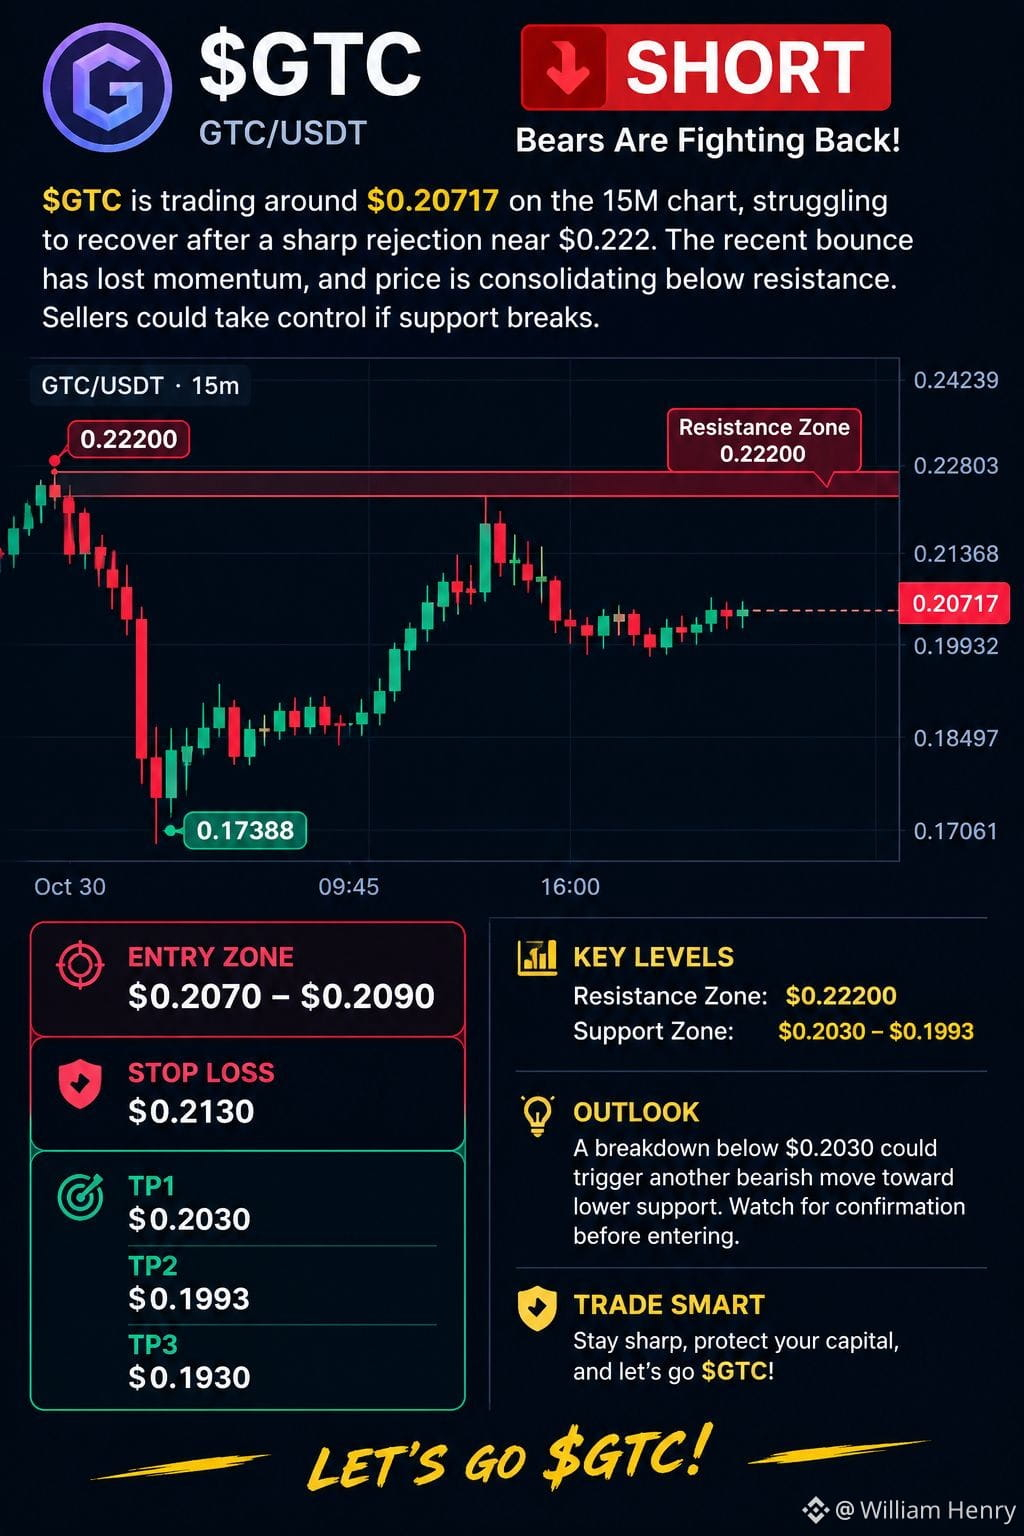
$GTC is trading around $0.20717 on the 15M chart, struggling to recover after a sharp rejection near $0.222. The recent bounce has lost momentum, and price is consolidating below resistance. Sellers could take control if support breaks.
Entry Zone: $0.2070–$0.2090
Stop Loss: $0.2130
TP1: $0.2030
TP2: $0.1993
TP3: $0.1930
A breakdown below $0.2030 could trigger another bearish move toward lower support. Watch for confirmation before entering.
Stay sharp, protect your capital, and let's go $GTC
$GTC is trading around $0.20717 on the 15M chart, struggling to recover after a sharp rejection near $0.222. The recent bounce has lost momentum, and price is consolidating below resistance. Sellers could take control if support breaks.
Entry Zone: $0.2070–$0.2090
Stop Loss: $0.2130
TP1: $0.2030
TP2: $0.1993
TP3: $0.1930
A breakdown below $0.2030 could trigger another bearish move toward lower support. Watch for confirmation before entering.
Stay sharp, protect your capital, and let's go $GTC
2
105
·
--
Bearish
See translation
MARKET ALERT: Bears Are Taking Control!
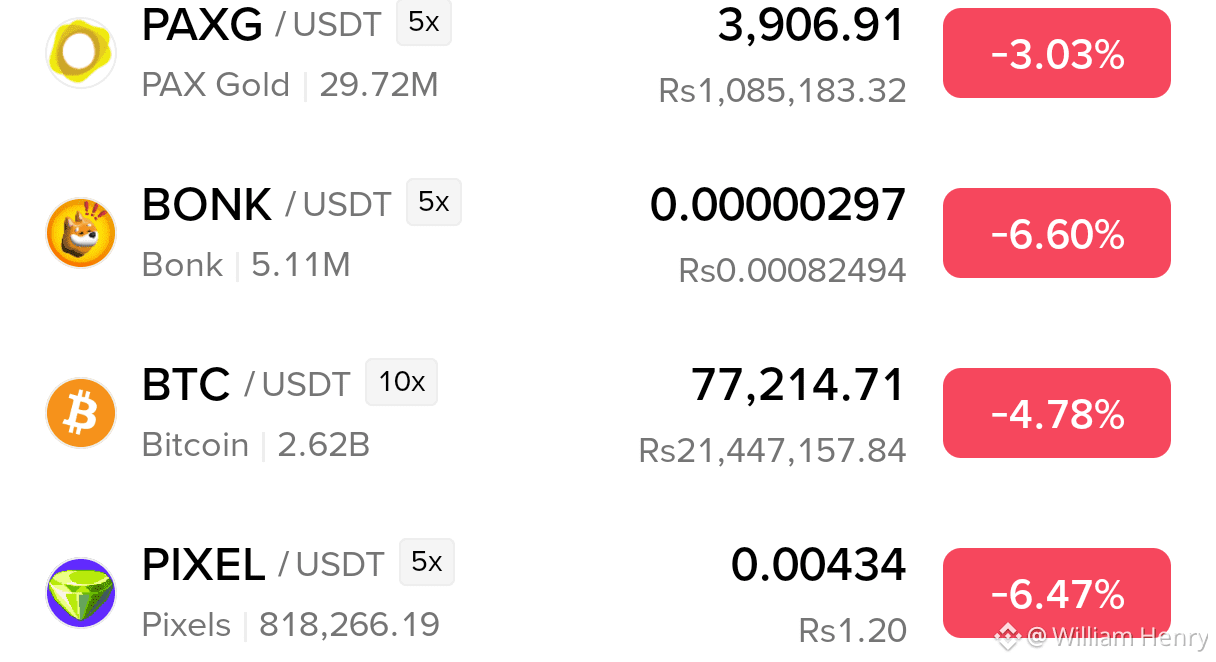
$PAXG Down 3.03% | Price: $3,906.91 | 5x
$BONK Down 6.60% | Price: $0.00000297 | 5x
$BTC Down 4.78% | Price: $77,214.71 | 10x
$PIXEL Down 6.47% | Price: $0.00434 | 5x
⚠️ Heavy selling pressure across the market! All four assets are trading in the red. Volatility is rising, so trade carefully and watch key support levels.
Stay alert. Let's go!
MARKET ALERT: Bears Are Taking Control!
$PAXG Down 3.03% | Price: $3,906.91 | 5x
$BONK Down 6.60% | Price: $0.00000297 | 5x
$BTC Down 4.78% | Price: $77,214.71 | 10x
$PIXEL Down 6.47% | Price: $0.00434 | 5x
⚠️ Heavy selling pressure across the market! All four assets are trading in the red. Volatility is rising, so trade carefully and watch key support levels.
Stay alert. Let's go!
$PAXG Down 3.03% | Price: $3,906.91 | 5x
$BONK Down 6.60% | Price: $0.00000297 | 5x
$BTC Down 4.78% | Price: $77,214.71 | 10x
$PIXEL Down 6.47% | Price: $0.00434 | 5x
⚠️ Heavy selling pressure across the market! All four assets are trading in the red. Volatility is rising, so trade carefully and watch key support levels.
Stay alert. Let's go!
William Henry
·
--
Bearish$SPCXB SHORT: Bears Are Still In Control!
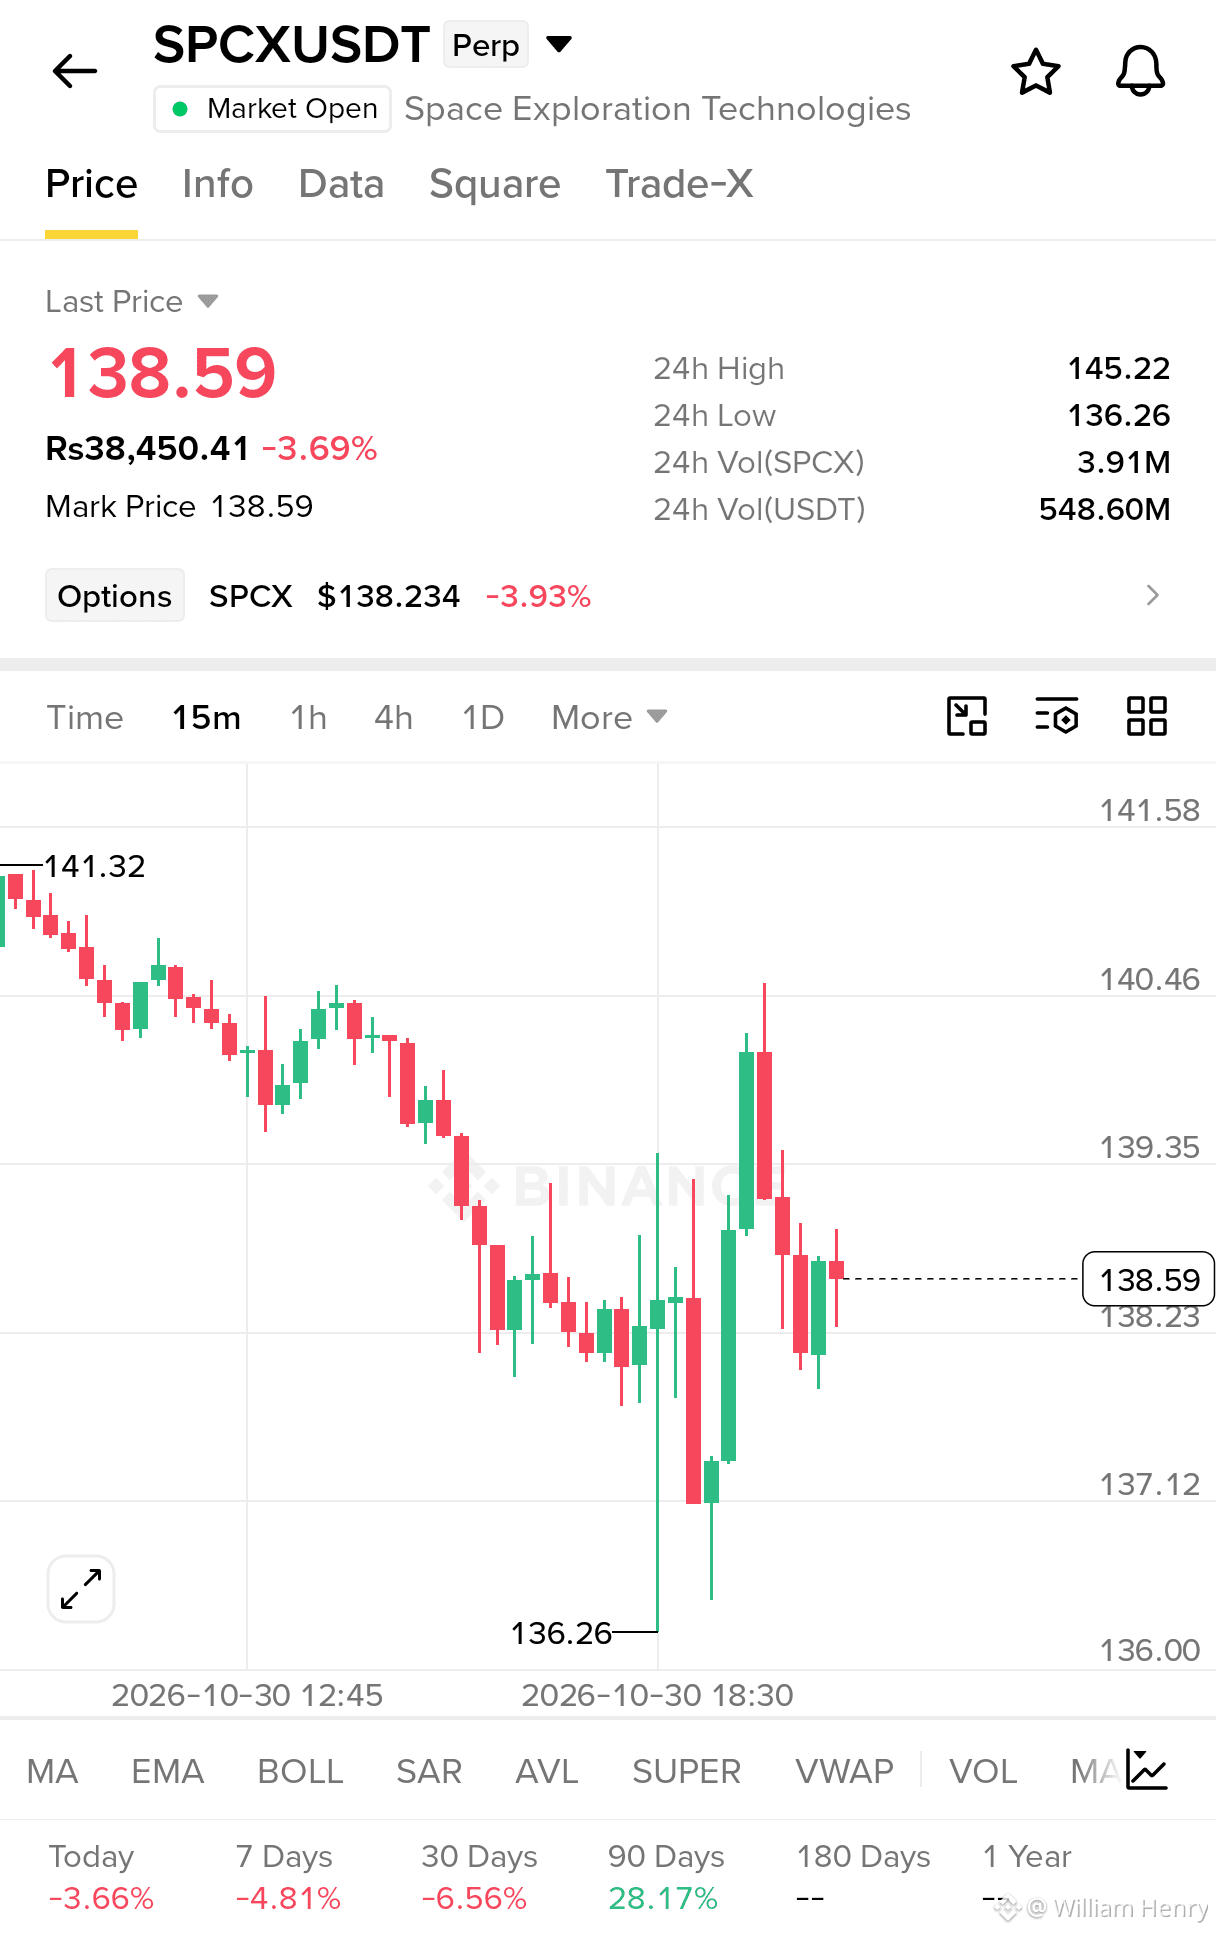
$SPCX is trading at 138.59, down 3.69%, with the 15M chart showing a clear bearish structure. Sellers remain active after rejecting the 140.00–140.46 resistance zone.
Trade Setup:
Direction: SHORT
Entry Zone: 138.55–138.90
Stop Loss: 139.45
TP1: 138.23
TP2: 137.12
TP3: 136.26
A breakdown below 138.23 could accelerate selling pressure toward the 137.12 and 136.26 support levels. Watch for a confirmed breakdown before entering.
Bears have the advantage.
$BTC
$SPCX is trading at 138.59, down 3.69%, with the 15M chart showing a clear bearish structure. Sellers remain active after rejecting the 140.00–140.46 resistance zone.
Trade Setup:
Direction: SHORT
Entry Zone: 138.55–138.90
Stop Loss: 139.45
TP1: 138.23
TP2: 137.12
TP3: 136.26
A breakdown below 138.23 could accelerate selling pressure toward the 137.12 and 136.26 support levels. Watch for a confirmed breakdown before entering.
Bears have the advantage.
$BTC
570
·
--
Bearish
See translation
$SPCXB SHORT: Bears Are Still In Control!
$SPCX is trading at 138.59, down 3.69%, with the 15M chart showing a clear bearish structure. Sellers remain active after rejecting the 140.00–140.46 resistance zone.
Trade Setup:
Direction: SHORT
Entry Zone: 138.55–138.90
Stop Loss: 139.45
TP1: 138.23
TP2: 137.12
TP3: 136.26
A breakdown below 138.23 could accelerate selling pressure toward the 137.12 and 136.26 support levels. Watch for a confirmed breakdown before entering.
Bears have the advantage.
{spot}(SPCXBUSDT)
$BTC
{future}(BTCUSDT)
$SPCXB SHORT: Bears Are Still In Control!
$SPCX is trading at 138.59, down 3.69%, with the 15M chart showing a clear bearish structure. Sellers remain active after rejecting the 140.00–140.46 resistance zone.
Trade Setup:
Direction: SHORT
Entry Zone: 138.55–138.90
Stop Loss: 139.45
TP1: 138.23
TP2: 137.12
TP3: 136.26
A breakdown below 138.23 could accelerate selling pressure toward the 137.12 and 136.26 support levels. Watch for a confirmed breakdown before entering.
Bears have the advantage.
$BTC
$SPCX is trading at 138.59, down 3.69%, with the 15M chart showing a clear bearish structure. Sellers remain active after rejecting the 140.00–140.46 resistance zone.
Trade Setup:
Direction: SHORT
Entry Zone: 138.55–138.90
Stop Loss: 139.45
TP1: 138.23
TP2: 137.12
TP3: 136.26
A breakdown below 138.23 could accelerate selling pressure toward the 137.12 and 136.26 support levels. Watch for a confirmed breakdown before entering.
Bears have the advantage.
$BTC
1
1
1.9k
·
--
Bullish
See translation
🚨 BINANCE IS READY FOR THE STORM!
With $6.34 BILLION reportedly available to absorb hack losses, Binance is sending a powerful message: SAFETY FIRST, TRUST ALWAYS.
Even in the toughest moments, confidence matters! 🔥
$BTC $ETH $BNB
🚨 BINANCE IS READY FOR THE STORM!
With $6.34 BILLION reportedly available to absorb hack losses, Binance is sending a powerful message: SAFETY FIRST, TRUST ALWAYS.
Even in the toughest moments, confidence matters! 🔥
$BTC $ETH $BNB
With $6.34 BILLION reportedly available to absorb hack losses, Binance is sending a powerful message: SAFETY FIRST, TRUST ALWAYS.
Even in the toughest moments, confidence matters! 🔥
$BTC $ETH $BNB

2
513
·
--
Bearish
See translation
$BTW SHORT — BEARS ARE IN FULL CONTROL!
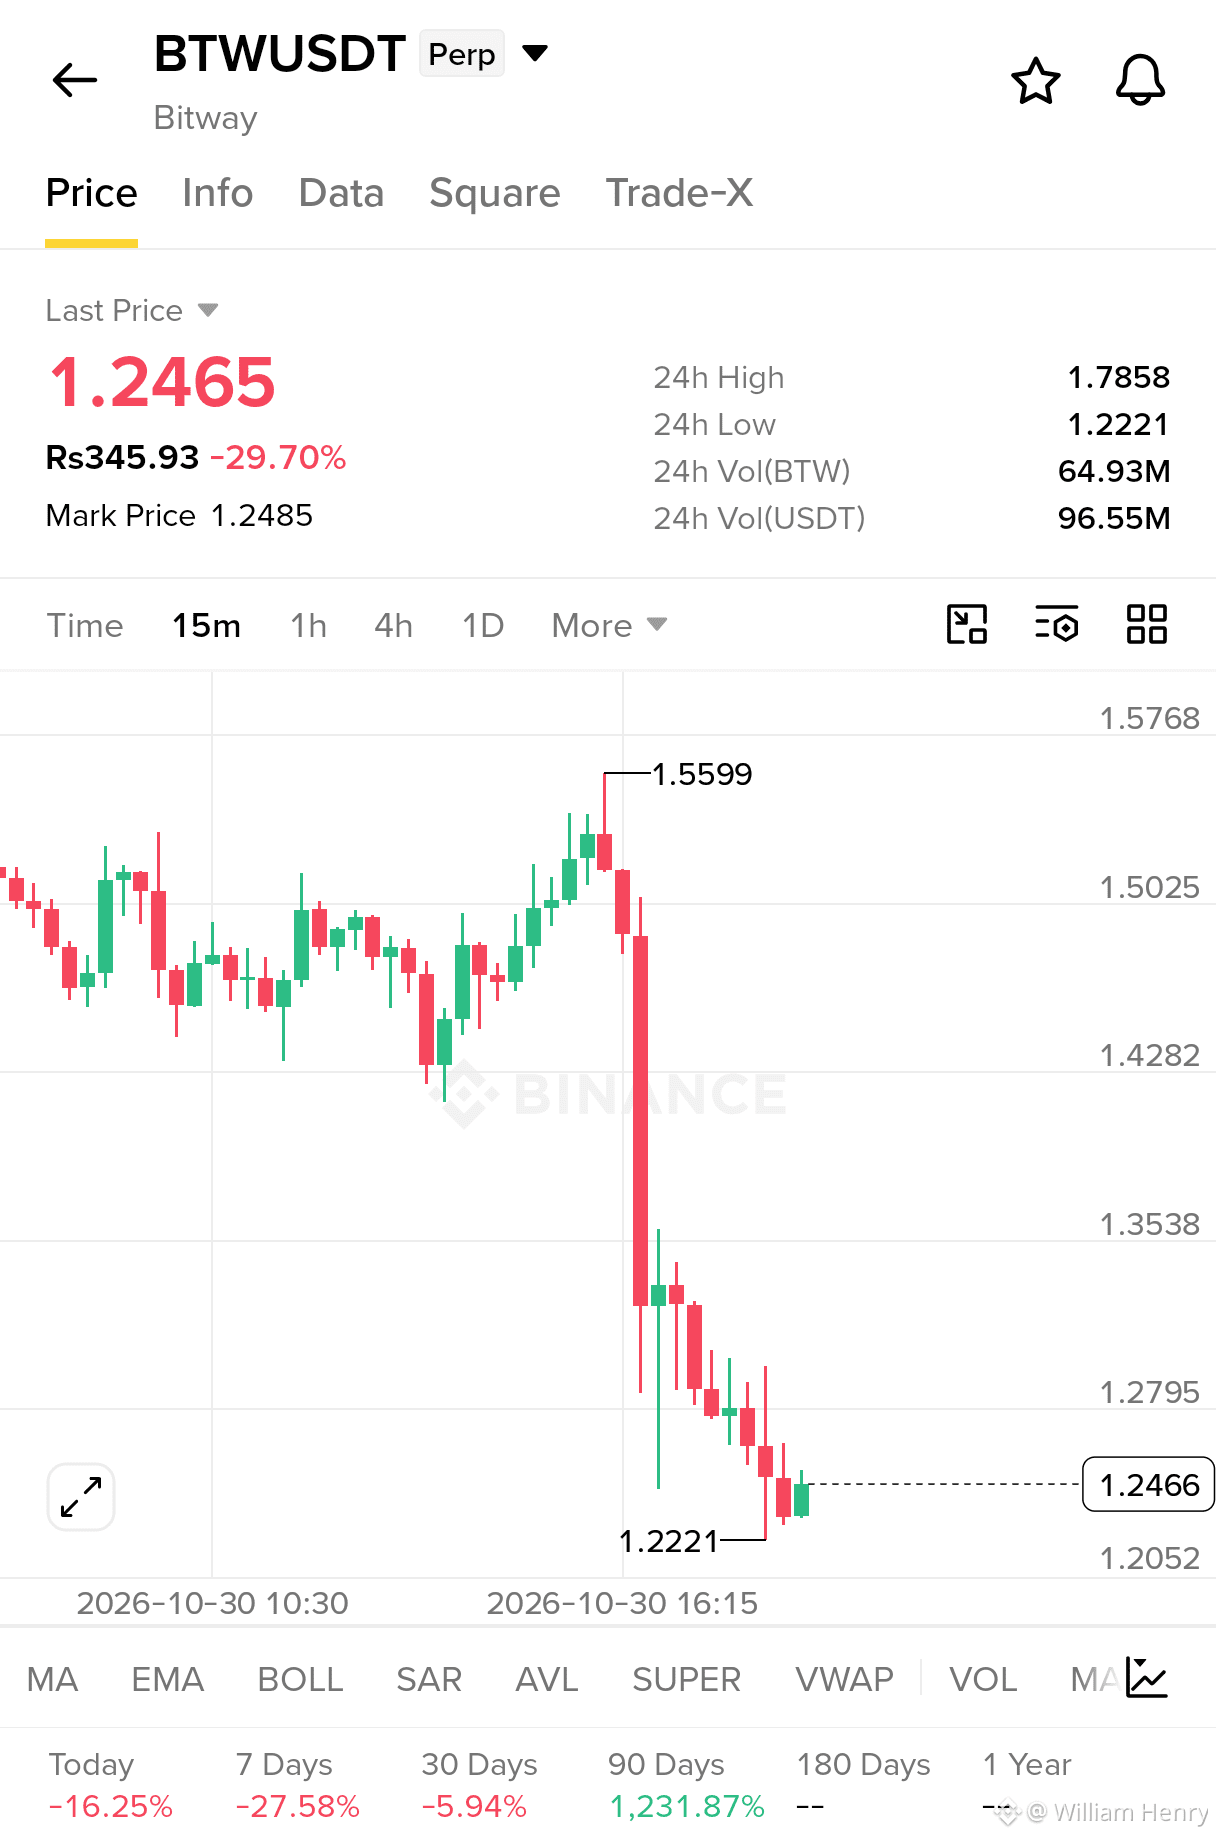
BTW is showing extreme bearish momentum on the 15M chart after a massive breakdown from the $1.55 region. Price is now trading around $1.2465, down nearly 30%, with sellers pushing toward the 24H low at $1.2221.
Trade Setup: SHORT
Current Price: $1.2465
Entry Zone: $1.2600–$1.2795
Stop Loss: $1.3538
TP1: $1.2221
TP2: $1.2052
* TP3: Trail profits if bearish momentum continues.
Market Outlook: The structure remains strongly bearish. A confirmed breakdown below $1.2221 could trigger another aggressive selling wave. Avoid chasing the move; wait for a suitable retest.
Bears are dominating this chart. Let's go $BTW
{future}(BTWUSDT)
$BTW SHORT — BEARS ARE IN FULL CONTROL!
BTW is showing extreme bearish momentum on the 15M chart after a massive breakdown from the $1.55 region. Price is now trading around $1.2465, down nearly 30%, with sellers pushing toward the 24H low at $1.2221.
Trade Setup: SHORT
Current Price: $1.2465
Entry Zone: $1.2600–$1.2795
Stop Loss: $1.3538
TP1: $1.2221
TP2: $1.2052
* TP3: Trail profits if bearish momentum continues.
Market Outlook: The structure remains strongly bearish. A confirmed breakdown below $1.2221 could trigger another aggressive selling wave. Avoid chasing the move; wait for a suitable retest.
Bears are dominating this chart. Let's go $BTW
BTW is showing extreme bearish momentum on the 15M chart after a massive breakdown from the $1.55 region. Price is now trading around $1.2465, down nearly 30%, with sellers pushing toward the 24H low at $1.2221.
Trade Setup: SHORT
Current Price: $1.2465
Entry Zone: $1.2600–$1.2795
Stop Loss: $1.3538
TP1: $1.2221
TP2: $1.2052
* TP3: Trail profits if bearish momentum continues.
Market Outlook: The structure remains strongly bearish. A confirmed breakdown below $1.2221 could trigger another aggressive selling wave. Avoid chasing the move; wait for a suitable retest.
Bears are dominating this chart. Let's go $BTW
1
1.2k
·
--
Bearish
See translation
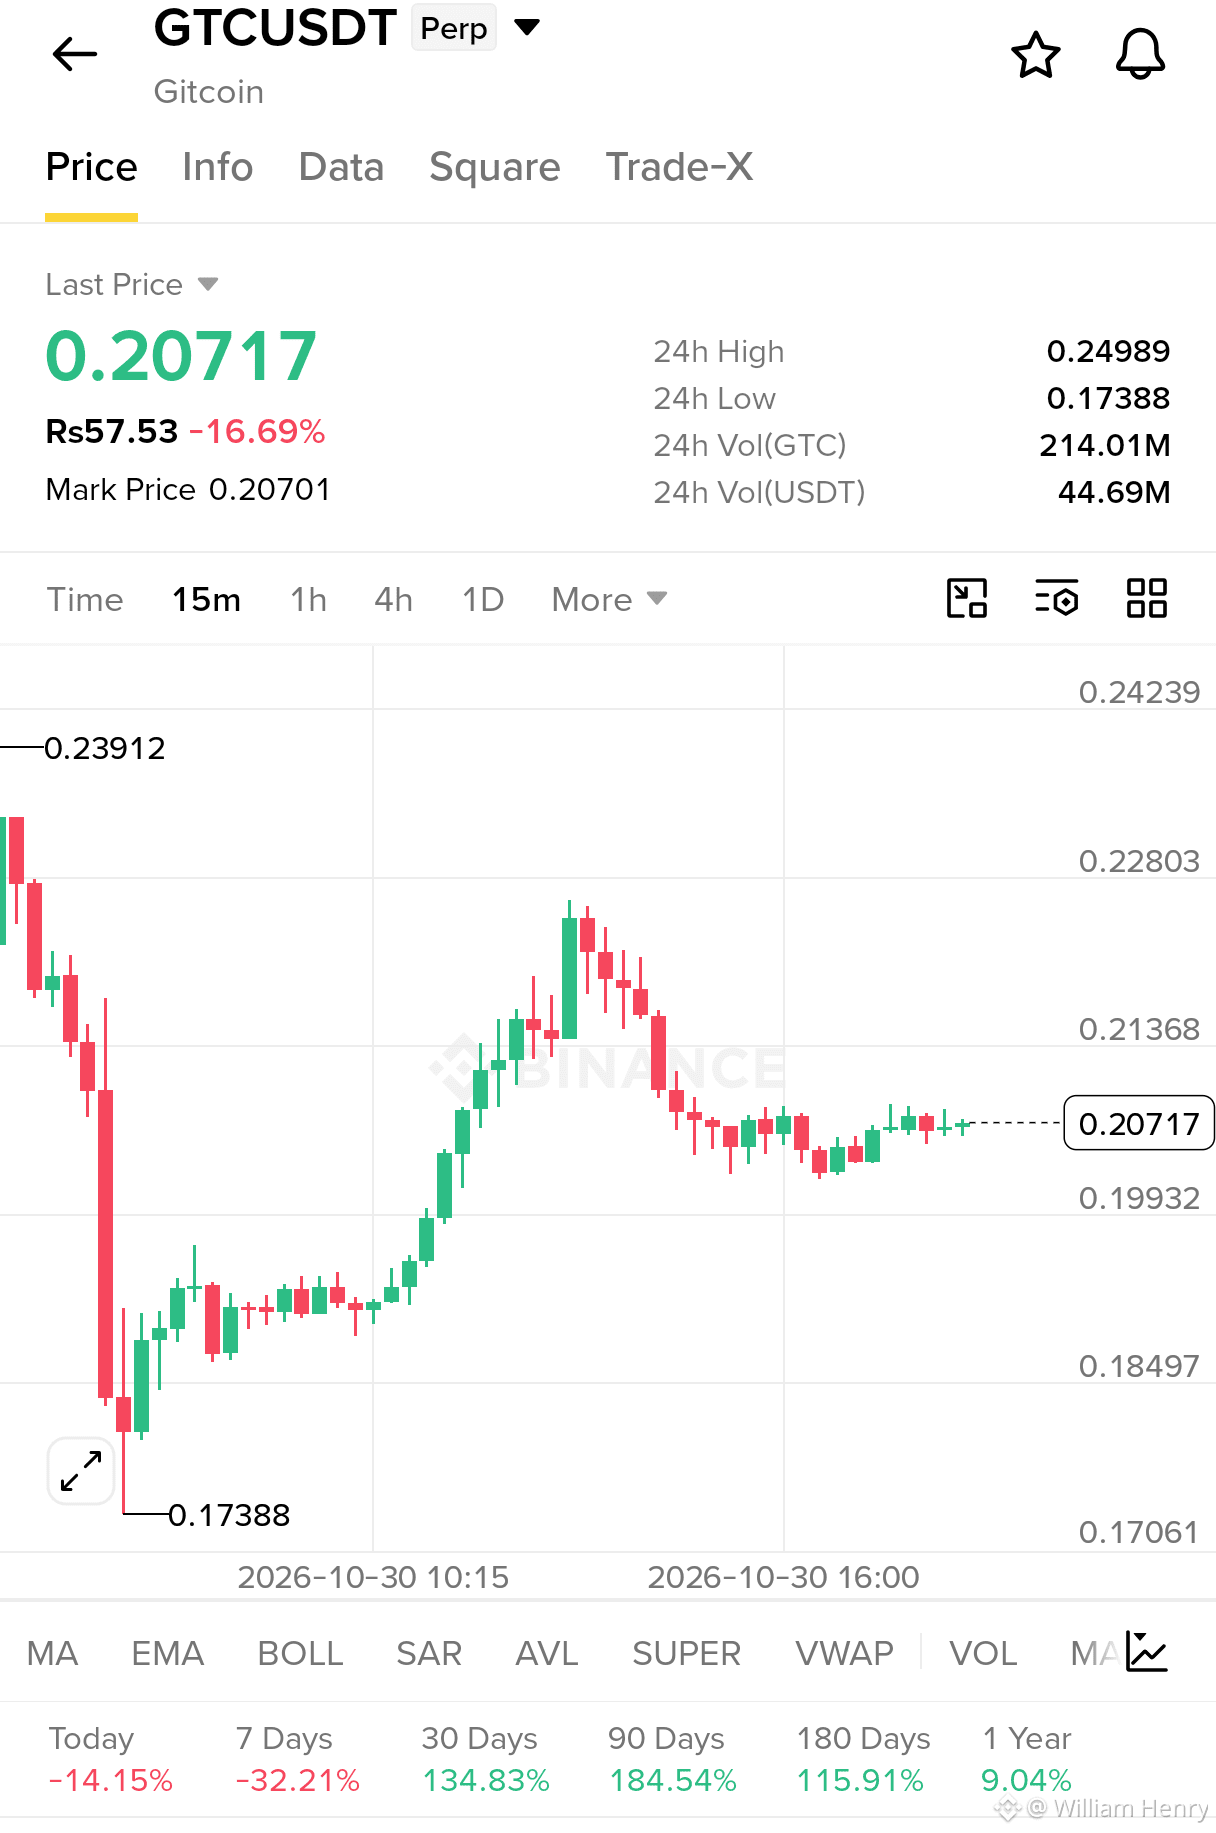
$GTC SHORT — Bears Are Fighting Back!
$GTC is trading around $0.20717 on the 15M chart, struggling to recover after a sharp rejection near $0.222. The recent bounce has lost momentum, and price is consolidating below resistance. Sellers could take control if support breaks.
Entry Zone: $0.2070–$0.2090
Stop Loss: $0.2130
TP1: $0.2030
TP2: $0.1993
TP3: $0.1930
A breakdown below $0.2030 could trigger another bearish move toward lower support. Watch for confirmation before entering.
Stay sharp, protect your capital, and let's go $GTC
{future}(GTCUSDT)
$GTC SHORT — Bears Are Fighting Back!
$GTC is trading around $0.20717 on the 15M chart, struggling to recover after a sharp rejection near $0.222. The recent bounce has lost momentum, and price is consolidating below resistance. Sellers could take control if support breaks.
Entry Zone: $0.2070–$0.2090
Stop Loss: $0.2130
TP1: $0.2030
TP2: $0.1993
TP3: $0.1930
A breakdown below $0.2030 could trigger another bearish move toward lower support. Watch for confirmation before entering.
Stay sharp, protect your capital, and let's go $GTC
$GTC is trading around $0.20717 on the 15M chart, struggling to recover after a sharp rejection near $0.222. The recent bounce has lost momentum, and price is consolidating below resistance. Sellers could take control if support breaks.
Entry Zone: $0.2070–$0.2090
Stop Loss: $0.2130
TP1: $0.2030
TP2: $0.1993
TP3: $0.1930
A breakdown below $0.2030 could trigger another bearish move toward lower support. Watch for confirmation before entering.
Stay sharp, protect your capital, and let's go $GTC
1
2
1.6k
·
--
Bullish
See translation
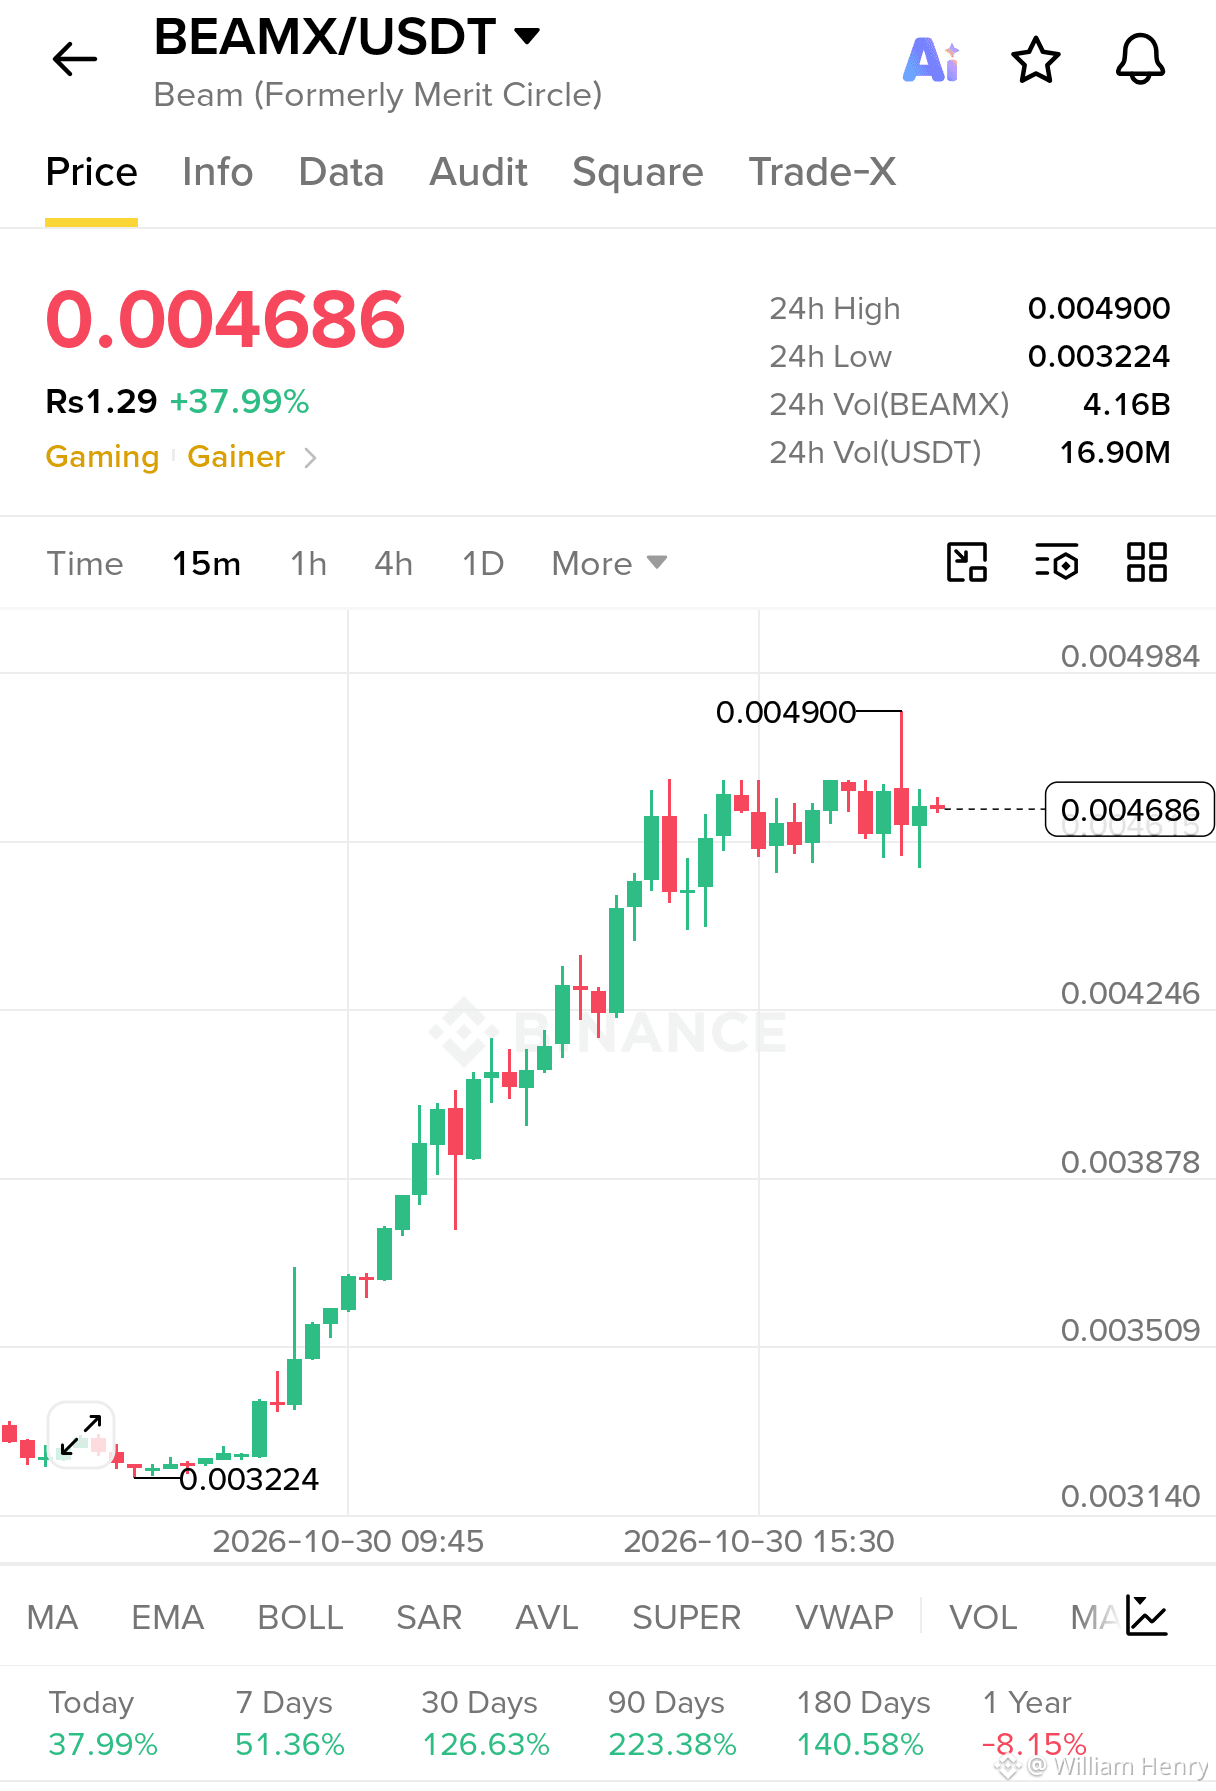
$BEAMX LONG — Bulls Are Exploding! Massive Momentum Ahead!
$BEAMX is trading around $0.004686, surging nearly 38% on the day! The 15M chart shows a powerful bullish rally from $0.003224, with price consolidating near the $0.004900 resistance. Buyers are still showing impressive strength.
Entry Zone: $0.00462–$0.00468
Stop Loss: $0.00448
TP1: $0.00490
TP2: $0.00510
TP3: $0.00535
A clean breakout above $0.004900 could unlock another explosive move. Watch for a strong close above resistance before entry.
Bulls are ready for another push! Let's go $BEAMX
{future}(BEAMXUSDT)
$BEAMX LONG — Bulls Are Exploding! Massive Momentum Ahead!
$BEAMX is trading around $0.004686, surging nearly 38% on the day! The 15M chart shows a powerful bullish rally from $0.003224, with price consolidating near the $0.004900 resistance. Buyers are still showing impressive strength.
Entry Zone: $0.00462–$0.00468
Stop Loss: $0.00448
TP1: $0.00490
TP2: $0.00510
TP3: $0.00535
A clean breakout above $0.004900 could unlock another explosive move. Watch for a strong close above resistance before entry.
Bulls are ready for another push! Let's go $BEAMX
$BEAMX is trading around $0.004686, surging nearly 38% on the day! The 15M chart shows a powerful bullish rally from $0.003224, with price consolidating near the $0.004900 resistance. Buyers are still showing impressive strength.
Entry Zone: $0.00462–$0.00468
Stop Loss: $0.00448
TP1: $0.00490
TP2: $0.00510
TP3: $0.00535
A clean breakout above $0.004900 could unlock another explosive move. Watch for a strong close above resistance before entry.
Bulls are ready for another push! Let's go $BEAMX
1
943
·
--
Bearish
See translation
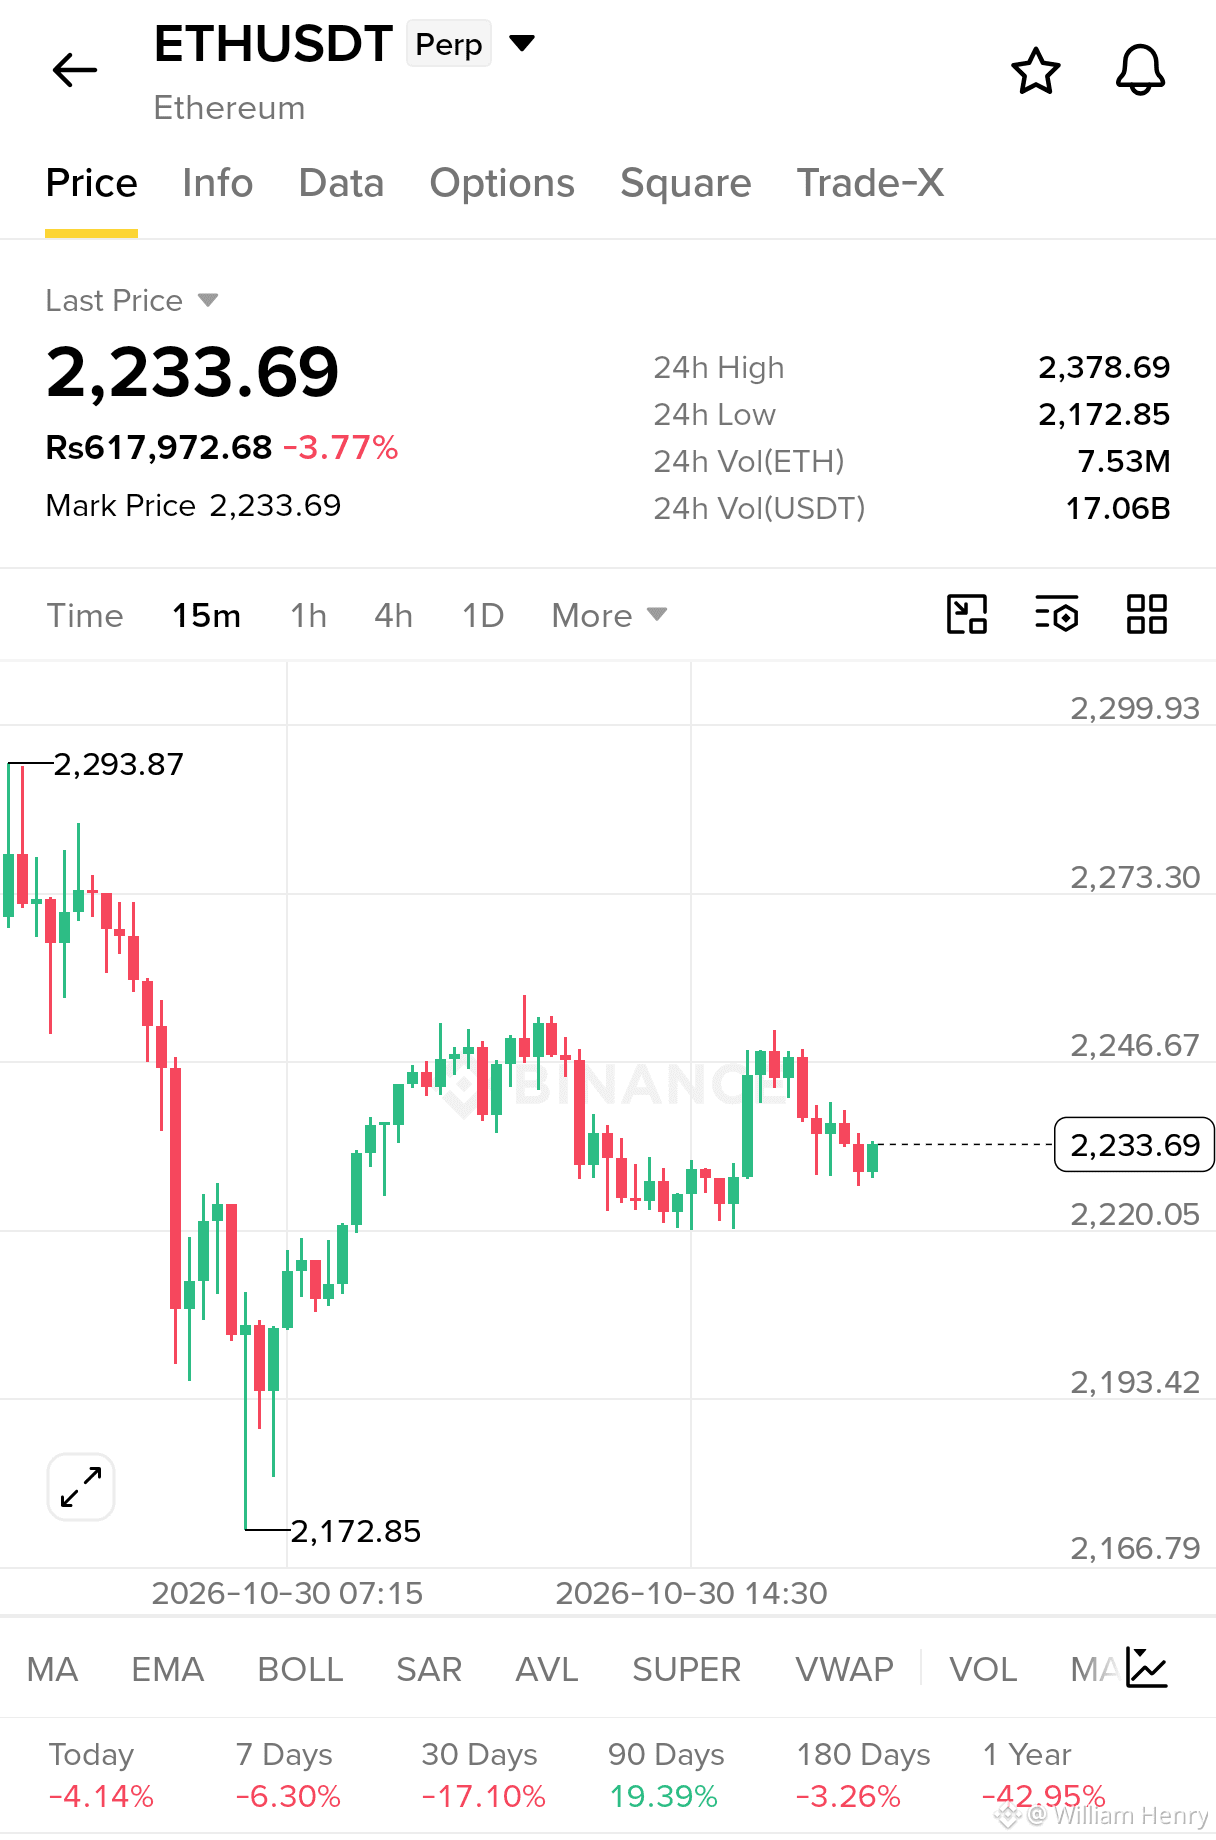
$ETH SHORT — Sellers Are Taking Control!
ETH is trading near $2,233.69 on the 15M chart, showing weakness after rejection from the $2,246 resistance zone. Bears are defending higher levels, while price struggles to regain bullish momentum.
Entry Zone: $2,233–$2,240
Stop Loss: $2,252
TP1: $2,220
TP2: $2,193
TP3: $2,173
A breakdown below $2,220 could accelerate selling pressure toward lower support levels. Watch for rejection before entering.
Stay disciplined and manage your risk. Let's go $ETH
{future}(ETHUSDT)
$ETH SHORT — Sellers Are Taking Control!
ETH is trading near $2,233.69 on the 15M chart, showing weakness after rejection from the $2,246 resistance zone. Bears are defending higher levels, while price struggles to regain bullish momentum.
Entry Zone: $2,233–$2,240
Stop Loss: $2,252
TP1: $2,220
TP2: $2,193
TP3: $2,173
A breakdown below $2,220 could accelerate selling pressure toward lower support levels. Watch for rejection before entering.
Stay disciplined and manage your risk. Let's go $ETH
ETH is trading near $2,233.69 on the 15M chart, showing weakness after rejection from the $2,246 resistance zone. Bears are defending higher levels, while price struggles to regain bullish momentum.
Entry Zone: $2,233–$2,240
Stop Loss: $2,252
TP1: $2,220
TP2: $2,193
TP3: $2,173
A breakdown below $2,220 could accelerate selling pressure toward lower support levels. Watch for rejection before entering.
Stay disciplined and manage your risk. Let's go $ETH
2
687
·
--
Bearish
See translation
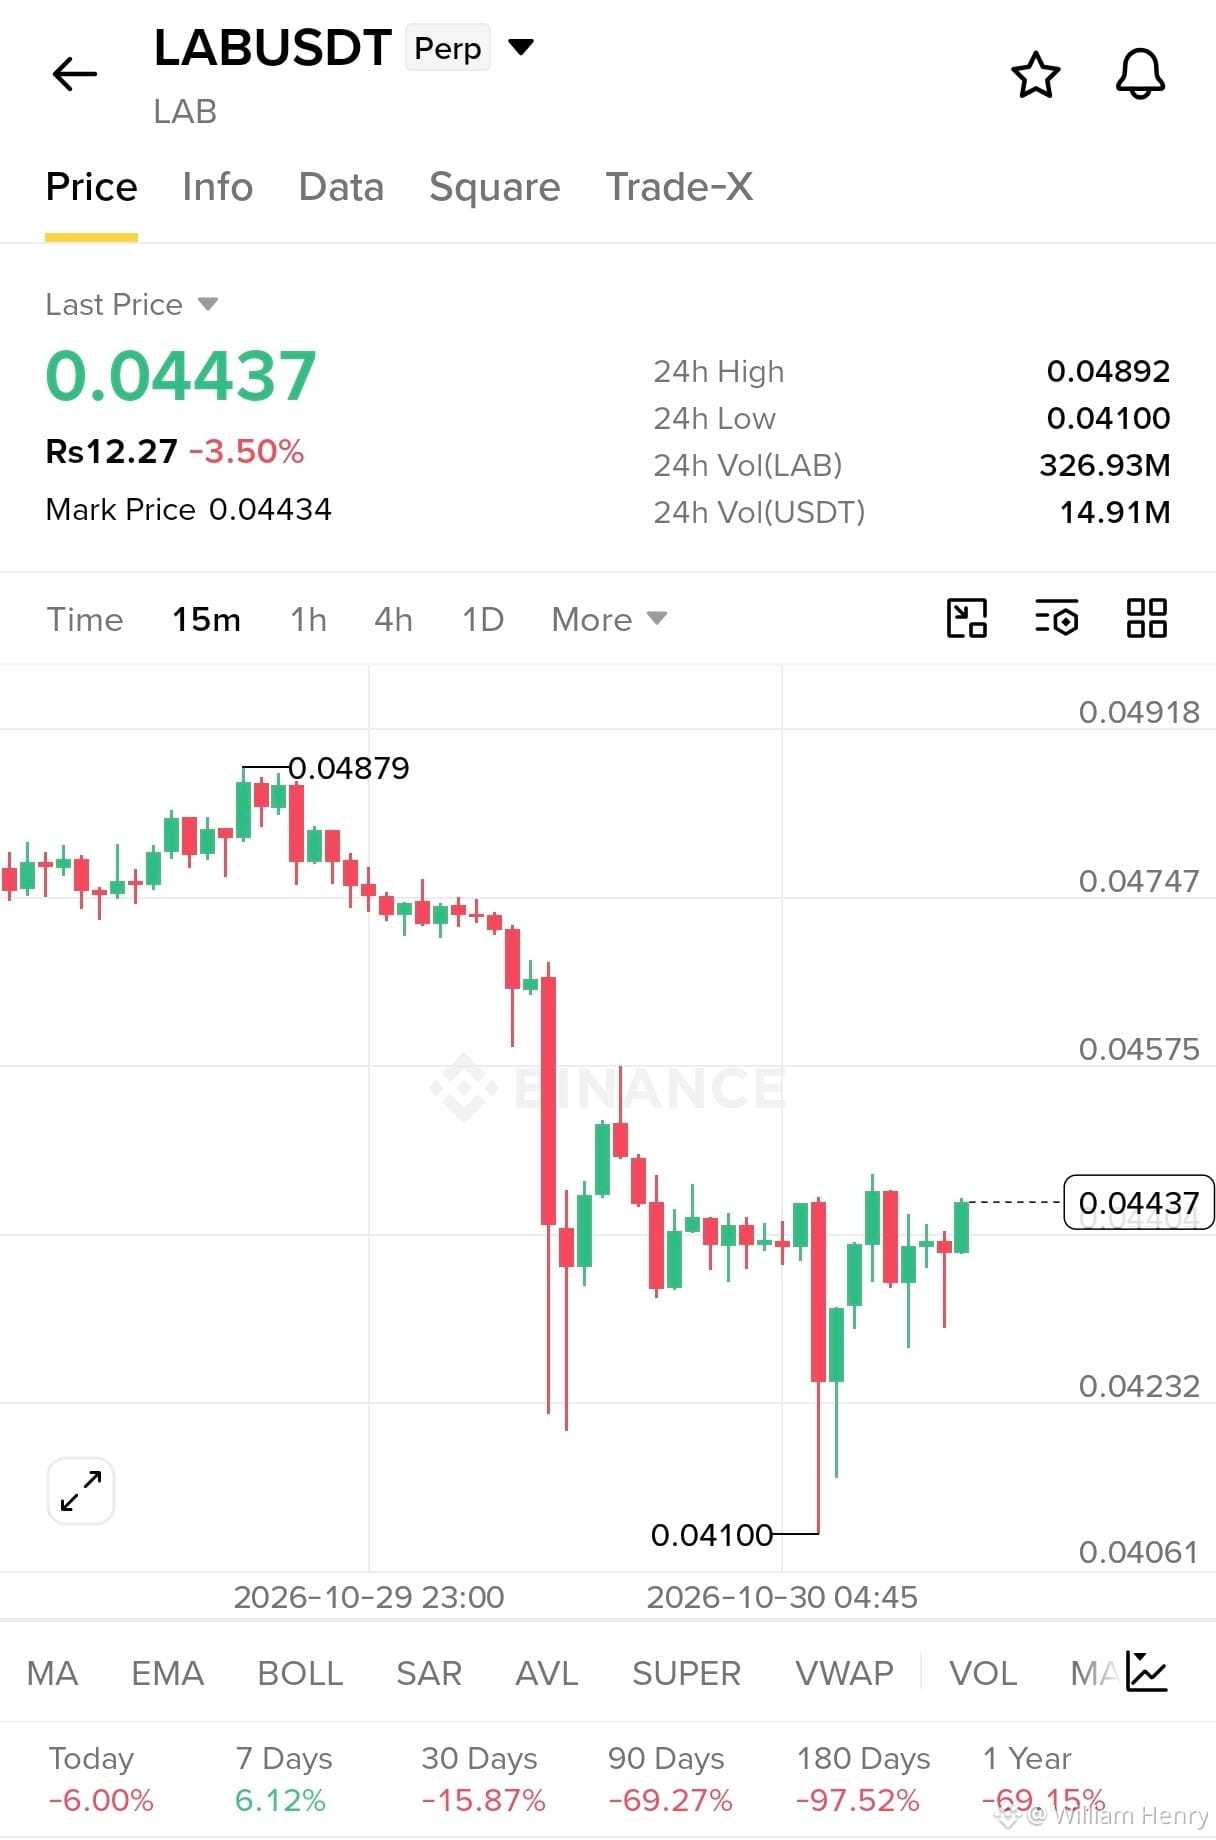
$LAB SHORT SIGNAL
Current Price: 0.04437
Direction: SHORT
Entry Zone: 0.04430 – 0.04470
Take Profit 1: 0.04380
Take Profit 2: 0.04320
Take Profit 3: 0.04180
Stop Loss: 0.04520
Resistance: 0.04480
Support: 0.04320
Market Analysis:
LAB is showing bearish momentum after a sharp breakdown from the 0.04879 high. The current recovery looks like consolidation rather than a confirmed trend reversal. Sellers may regain control if price fails to break above 0.04480.
Trade Confirmation:
Wait for rejection around 0.04430–0.04470 before entering short. A strong breakout above resistance invalidates this setup.
{future}(LABUSDT)
$LAB SHORT SIGNAL
Current Price: 0.04437
Direction: SHORT
Entry Zone: 0.04430 – 0.04470
Take Profit 1: 0.04380
Take Profit 2: 0.04320
Take Profit 3: 0.04180
Stop Loss: 0.04520
Resistance: 0.04480
Support: 0.04320
Market Analysis:
LAB is showing bearish momentum after a sharp breakdown from the 0.04879 high. The current recovery looks like consolidation rather than a confirmed trend reversal. Sellers may regain control if price fails to break above 0.04480.
Trade Confirmation:
Wait for rejection around 0.04430–0.04470 before entering short. A strong breakout above resistance invalidates this setup.
Current Price: 0.04437
Direction: SHORT
Entry Zone: 0.04430 – 0.04470
Take Profit 1: 0.04380
Take Profit 2: 0.04320
Take Profit 3: 0.04180
Stop Loss: 0.04520
Resistance: 0.04480
Support: 0.04320
Market Analysis:
LAB is showing bearish momentum after a sharp breakdown from the 0.04879 high. The current recovery looks like consolidation rather than a confirmed trend reversal. Sellers may regain control if price fails to break above 0.04480.
Trade Confirmation:
Wait for rejection around 0.04430–0.04470 before entering short. A strong breakout above resistance invalidates this setup.
1
1.3k
·
--
Bullish
See translation
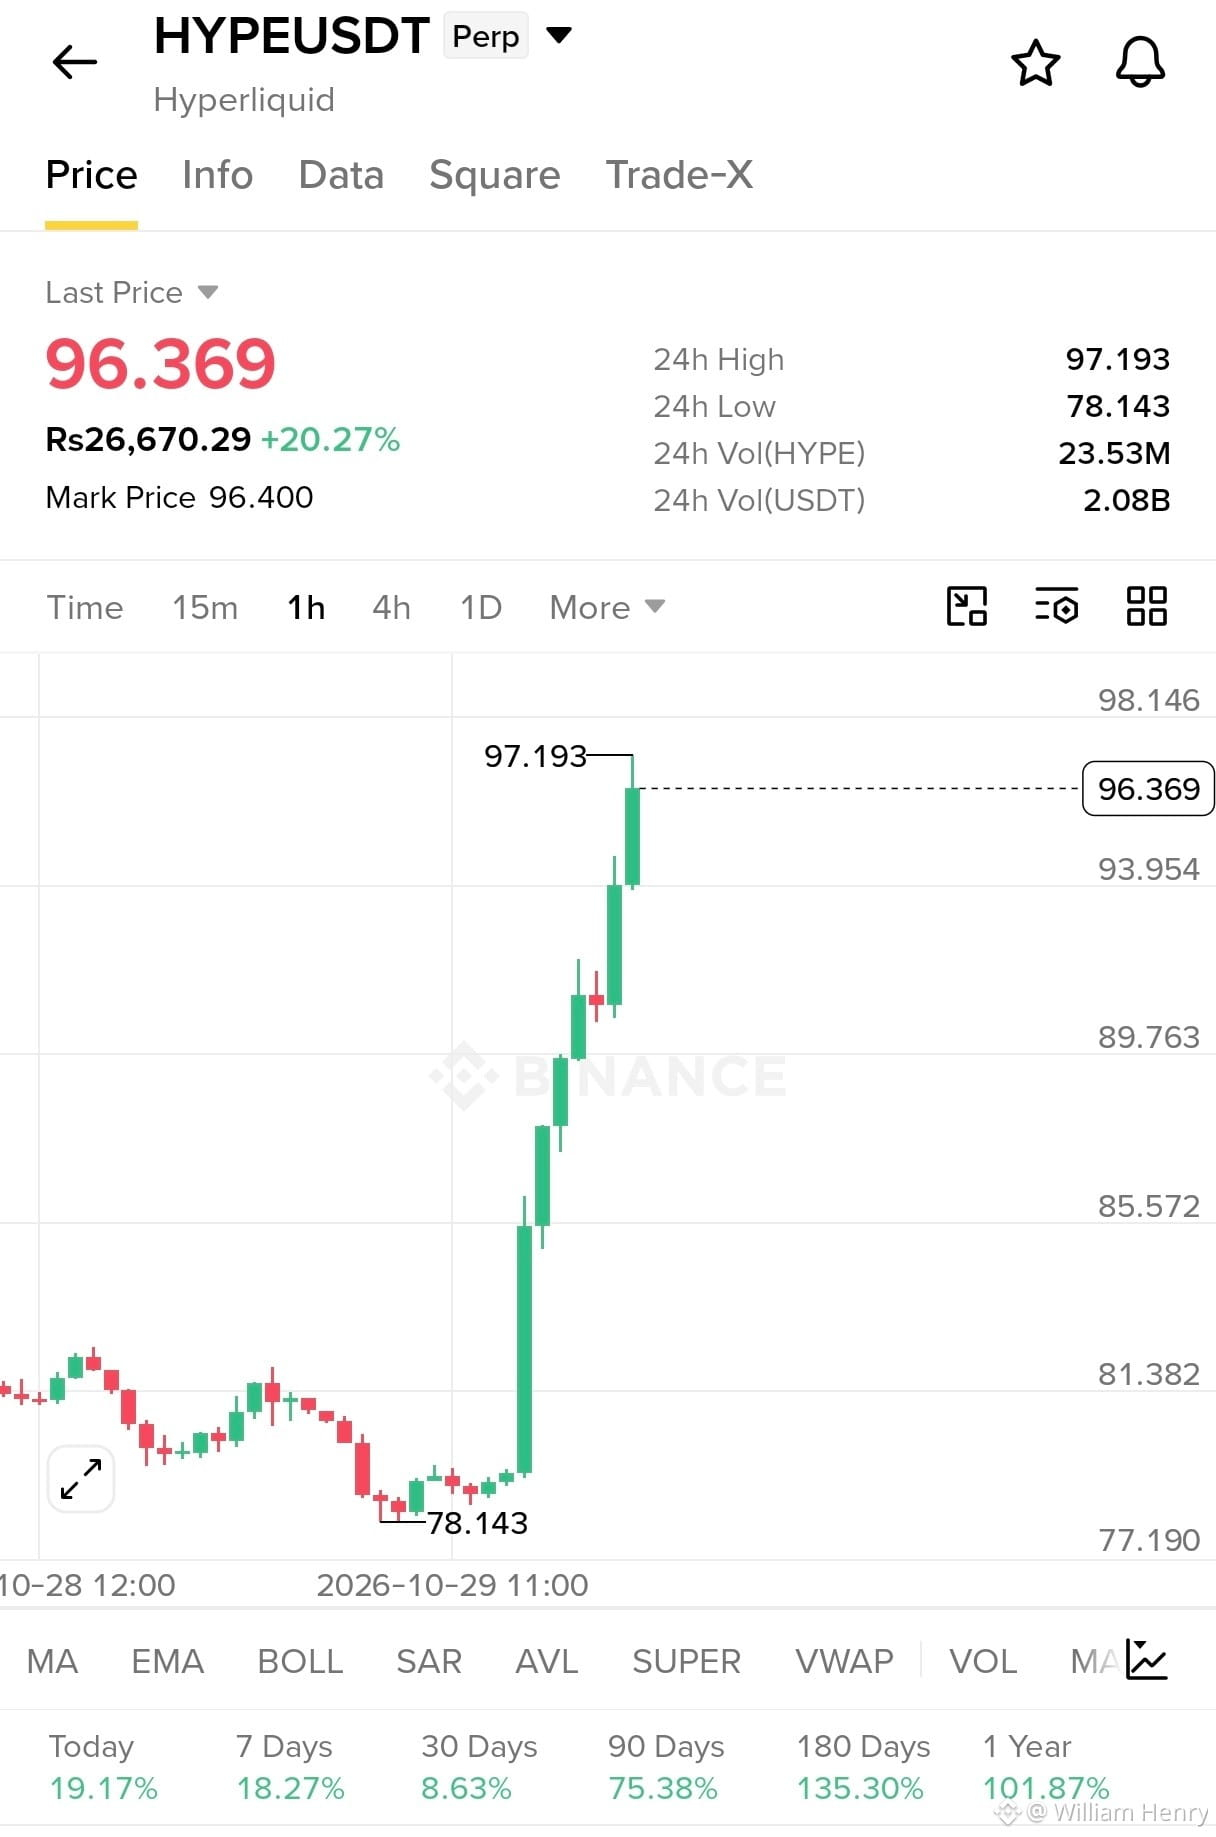
$HYPE USDT — STRONG BULLISH SETUP
HYPE is showing strong upward momentum, trading at $96.369, up 20.27% in 24 hours. Price is approaching resistance at $97.193, so confirmation is important before entering.
Direction: LONG
Entry: $94.500 – $96.000
TP1: $97.200
TP2: $98.500
TP3: $100.000
SL: $92.800
Current Price: $96.369
Resistance: $97.193
Support: $93.954
Wait for breakout confirmation before entry. If resistance holds, a pullback is possible. Use proper risk management and avoid excessive leverage.
HYPEUSDT — TRADE WITH DISCIPLINE
{future}(HYPEUSDT)
$HYPE USDT — STRONG BULLISH SETUP
HYPE is showing strong upward momentum, trading at $96.369, up 20.27% in 24 hours. Price is approaching resistance at $97.193, so confirmation is important before entering.
Direction: LONG
Entry: $94.500 – $96.000
TP1: $97.200
TP2: $98.500
TP3: $100.000
SL: $92.800
Current Price: $96.369
Resistance: $97.193
Support: $93.954
Wait for breakout confirmation before entry. If resistance holds, a pullback is possible. Use proper risk management and avoid excessive leverage.
HYPEUSDT — TRADE WITH DISCIPLINE
HYPE is showing strong upward momentum, trading at $96.369, up 20.27% in 24 hours. Price is approaching resistance at $97.193, so confirmation is important before entering.
Direction: LONG
Entry: $94.500 – $96.000
TP1: $97.200
TP2: $98.500
TP3: $100.000
SL: $92.800
Current Price: $96.369
Resistance: $97.193
Support: $93.954
Wait for breakout confirmation before entry. If resistance holds, a pullback is possible. Use proper risk management and avoid excessive leverage.
HYPEUSDT — TRADE WITH DISCIPLINE
471
·
--
Bullish
See translation
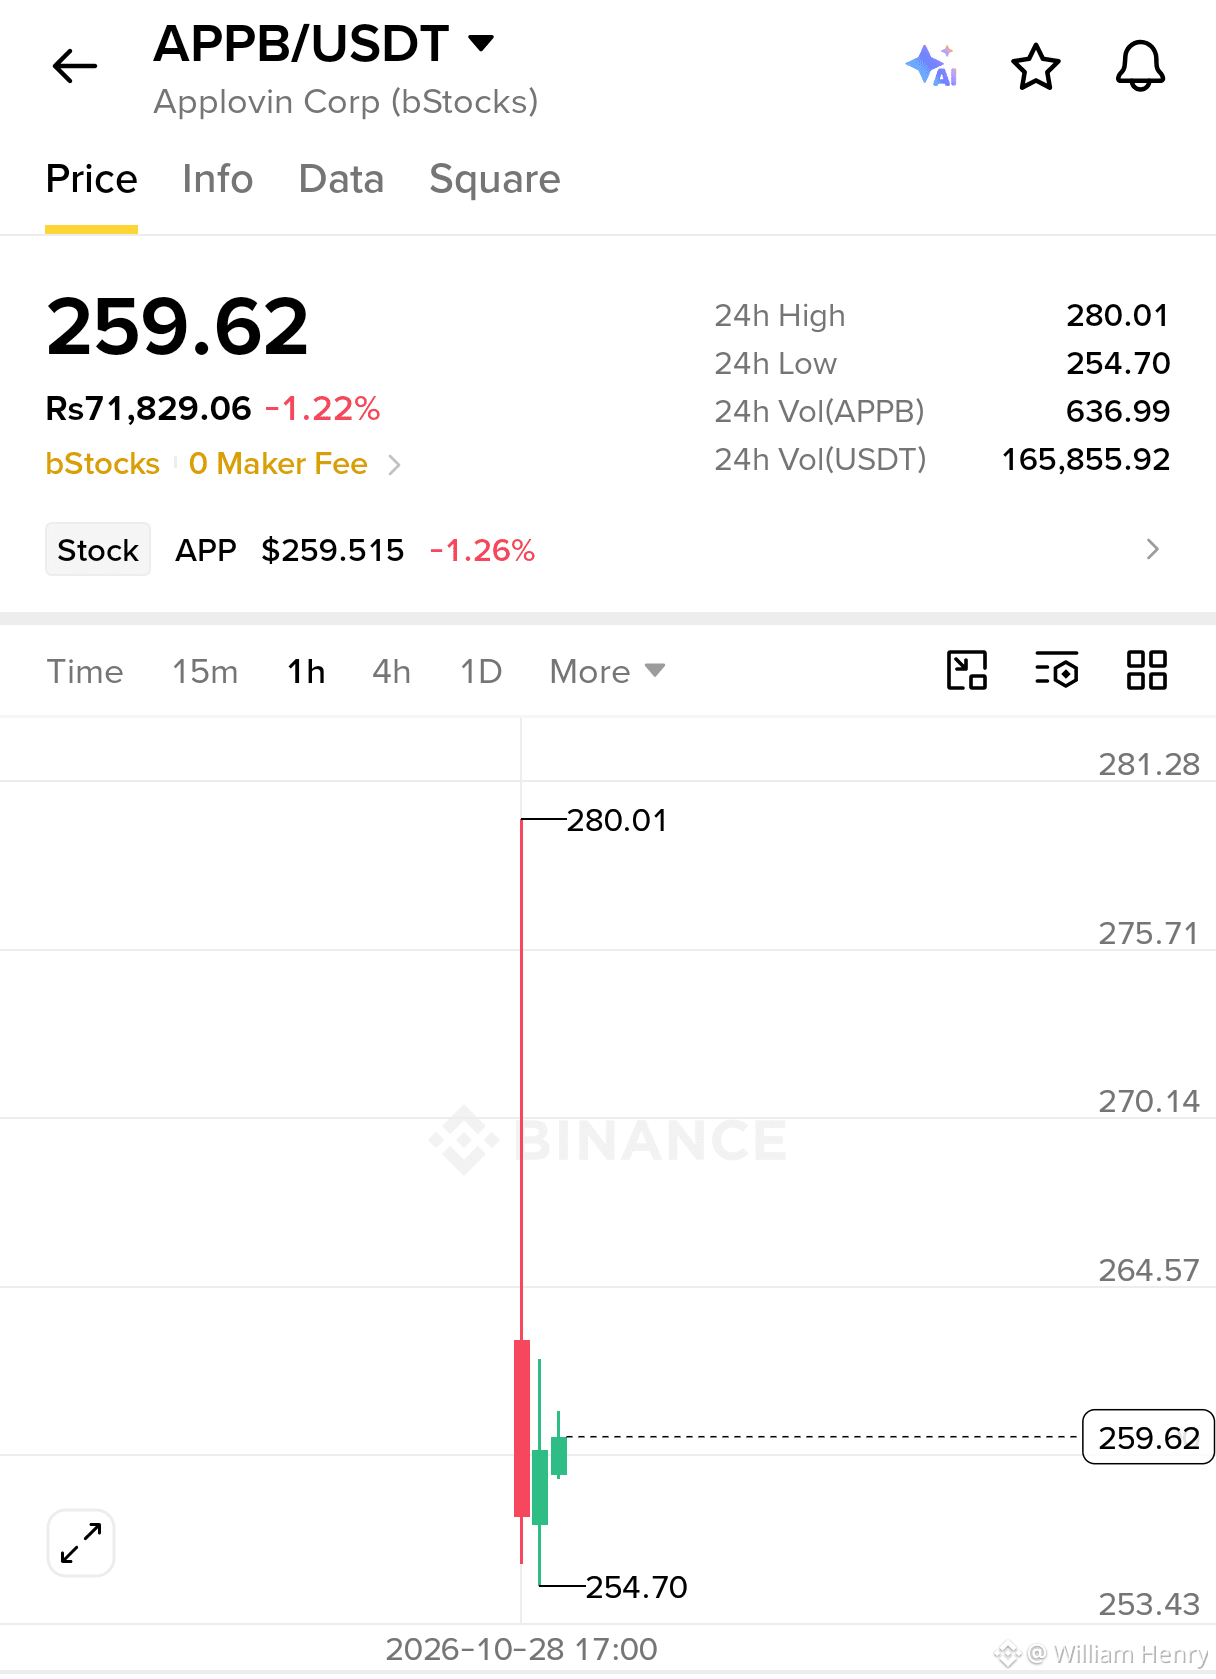
$APPB I'm watching this 1H setup closely. Price is sitting at $259.62 after bouncing from $254.70, showing buyers are trying to recover after a sharp rejection from $280.01.
Trade Setup
Entry: $259.50–$260.00
Stop Loss: $254.00
Targets:
Target 1: $264.57
Target 2: $270.14
Target 3: $275.71
Target 4: $280.01
Why it's possible
I'm watching the $254.70 support because buyers stepped in after the sell-off. Two green candles suggest a short-term recovery, but bulls still need to prove their strength.
A breakout above $264.57 could attract momentum buyers and push price toward $270.14. Reclaiming higher resistance levels could open a retest of $280.01, where sellers previously took control.
The 24-hour volume stands at 636.99 APPB, with price down 1.22%. I'd like to see stronger buying volume confirm the recovery. If $254.70 breaks, the bullish setup weakens, so I'm keeping risk management in focus.
Let's wait for confirmation and trade the setup, not the hype.
$APPB I'm watching this 1H setup closely. Price is sitting at $259.62 after bouncing from $254.70, showing buyers are trying to recover after a sharp rejection from $280.01.
Trade Setup
Entry: $259.50–$260.00
Stop Loss: $254.00
Targets:
Target 1: $264.57
Target 2: $270.14
Target 3: $275.71
Target 4: $280.01
Why it's possible
I'm watching the $254.70 support because buyers stepped in after the sell-off. Two green candles suggest a short-term recovery, but bulls still need to prove their strength.
A breakout above $264.57 could attract momentum buyers and push price toward $270.14. Reclaiming higher resistance levels could open a retest of $280.01, where sellers previously took control.
The 24-hour volume stands at 636.99 APPB, with price down 1.22%. I'd like to see stronger buying volume confirm the recovery. If $254.70 breaks, the bullish setup weakens, so I'm keeping risk management in focus.
Let's wait for confirmation and trade the setup, not the hype.
Trade Setup
Entry: $259.50–$260.00
Stop Loss: $254.00
Targets:
Target 1: $264.57
Target 2: $270.14
Target 3: $275.71
Target 4: $280.01
Why it's possible
I'm watching the $254.70 support because buyers stepped in after the sell-off. Two green candles suggest a short-term recovery, but bulls still need to prove their strength.
A breakout above $264.57 could attract momentum buyers and push price toward $270.14. Reclaiming higher resistance levels could open a retest of $280.01, where sellers previously took control.
The 24-hour volume stands at 636.99 APPB, with price down 1.22%. I'd like to see stronger buying volume confirm the recovery. If $254.70 breaks, the bullish setup weakens, so I'm keeping risk management in focus.
Let's wait for confirmation and trade the setup, not the hype.
1
2
322
See translation
🚨🇺🇸 THE DOLLAR’S NEXT POWER MOVE COULD COME FROM CRYPTO! 🔥
US Treasury Secretary Scott Bessent says crypto and stablecoins could strengthen the dollar’s global dominance.
💵 Over 90% of stablecoins are USD-backed, potentially driving more demand for US Treasuries.
🌍 Crypto isn’t just changing finance — it could reshape the future of dollar dominance! 🚀
$TRUMP
{future}(TRUMPUSDT)
🚨🇺🇸 THE DOLLAR’S NEXT POWER MOVE COULD COME FROM CRYPTO! 🔥
US Treasury Secretary Scott Bessent says crypto and stablecoins could strengthen the dollar’s global dominance.
💵 Over 90% of stablecoins are USD-backed, potentially driving more demand for US Treasuries.
🌍 Crypto isn’t just changing finance — it could reshape the future of dollar dominance! 🚀
$TRUMP
US Treasury Secretary Scott Bessent says crypto and stablecoins could strengthen the dollar’s global dominance.
💵 Over 90% of stablecoins are USD-backed, potentially driving more demand for US Treasuries.
🌍 Crypto isn’t just changing finance — it could reshape the future of dollar dominance! 🚀
$TRUMP

230
See translation
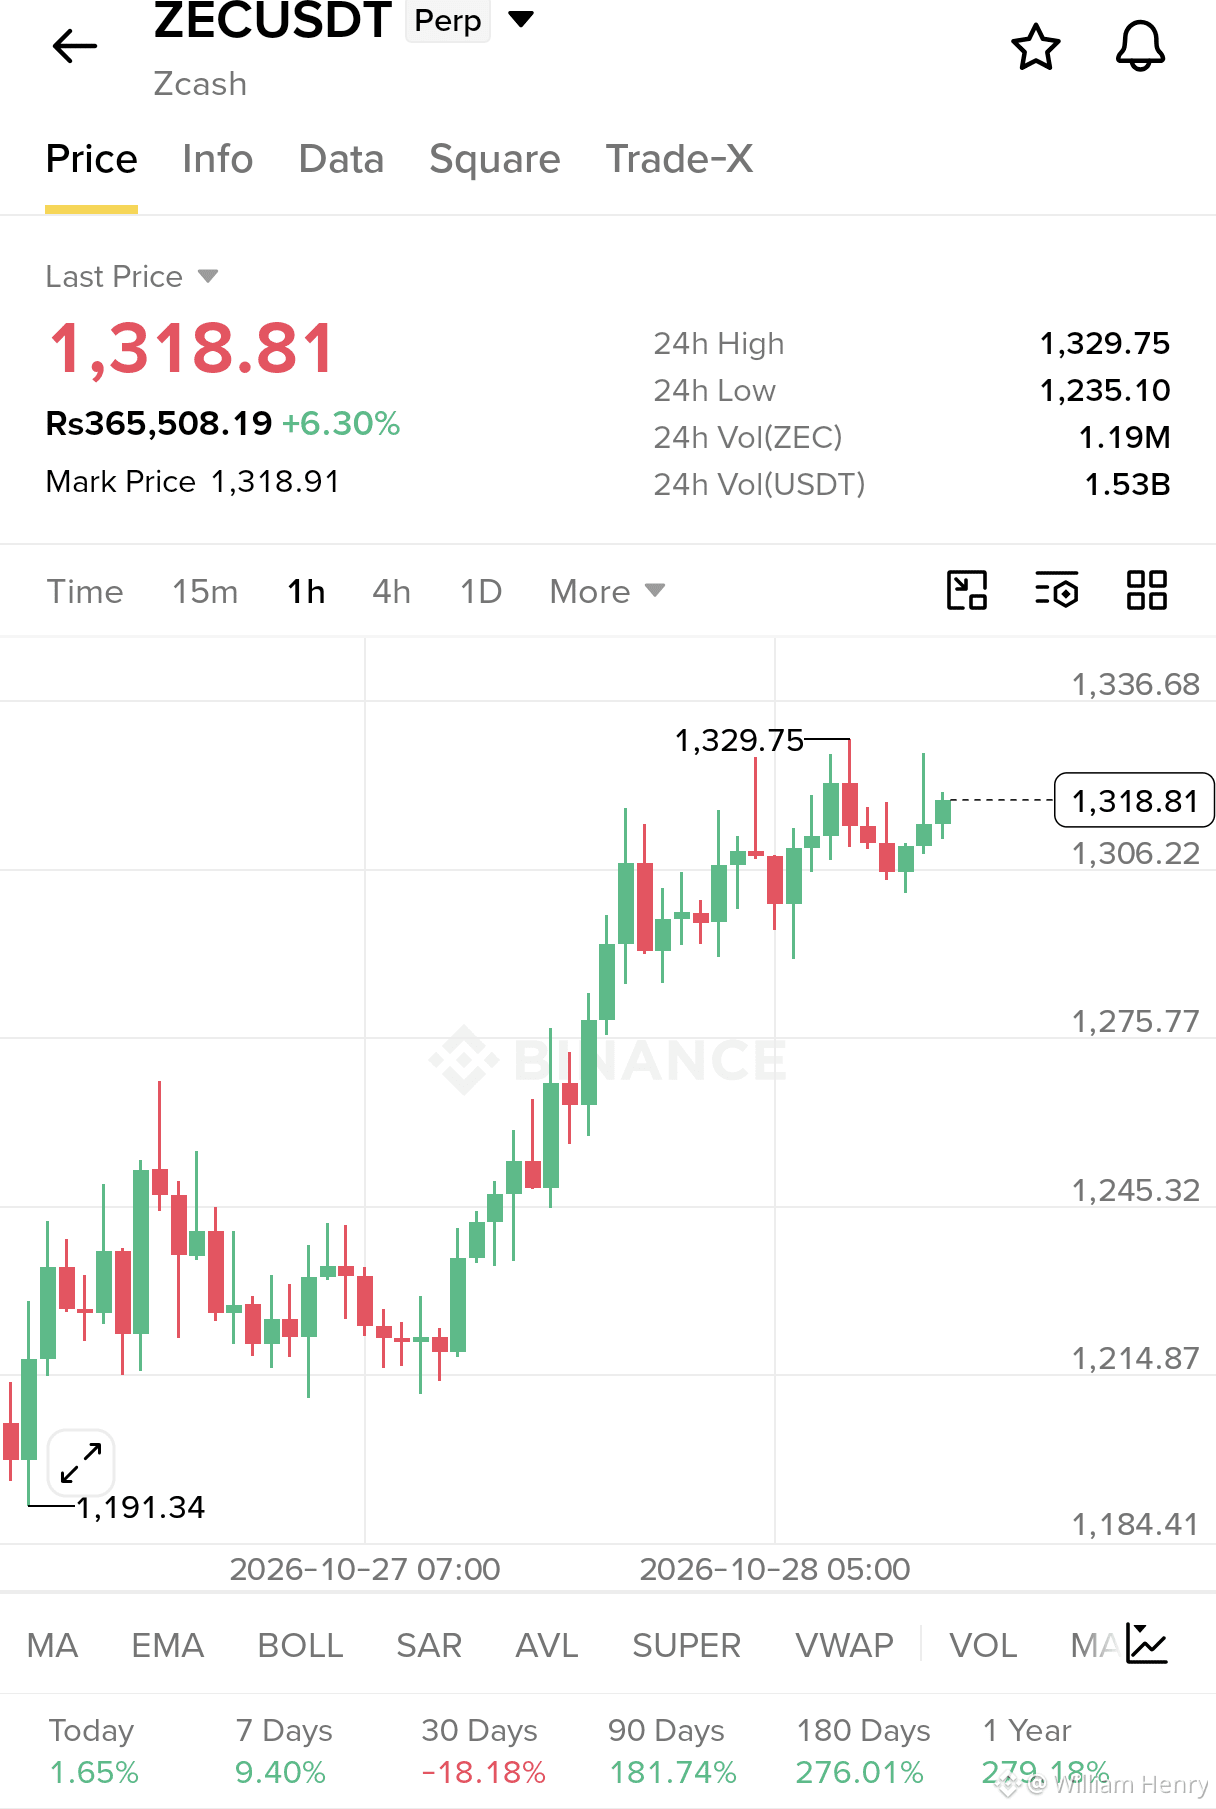
$ZEC 🔥 Bulls are pushing hard! Up 6.3% in 24 hours, Zcash is trading near $1,319 after a powerful rally from $1,191. 🚀
Now all eyes are on $1,330 resistance! A clean breakout could trigger another explosive move, while $1,300 remains a key support zone.
Will ZEC smash resistance and fly higher? 👀📈
{future}(ZECUSDT)
#CanMicrosoftDeliverOnAI
$ZEC 🔥 Bulls are pushing hard! Up 6.3% in 24 hours, Zcash is trading near $1,319 after a powerful rally from $1,191. 🚀
Now all eyes are on $1,330 resistance! A clean breakout could trigger another explosive move, while $1,300 remains a key support zone.
Will ZEC smash resistance and fly higher? 👀📈
#CanMicrosoftDeliverOnAI
Now all eyes are on $1,330 resistance! A clean breakout could trigger another explosive move, while $1,300 remains a key support zone.
Will ZEC smash resistance and fly higher? 👀📈
#CanMicrosoftDeliverOnAI
2
552
See translation
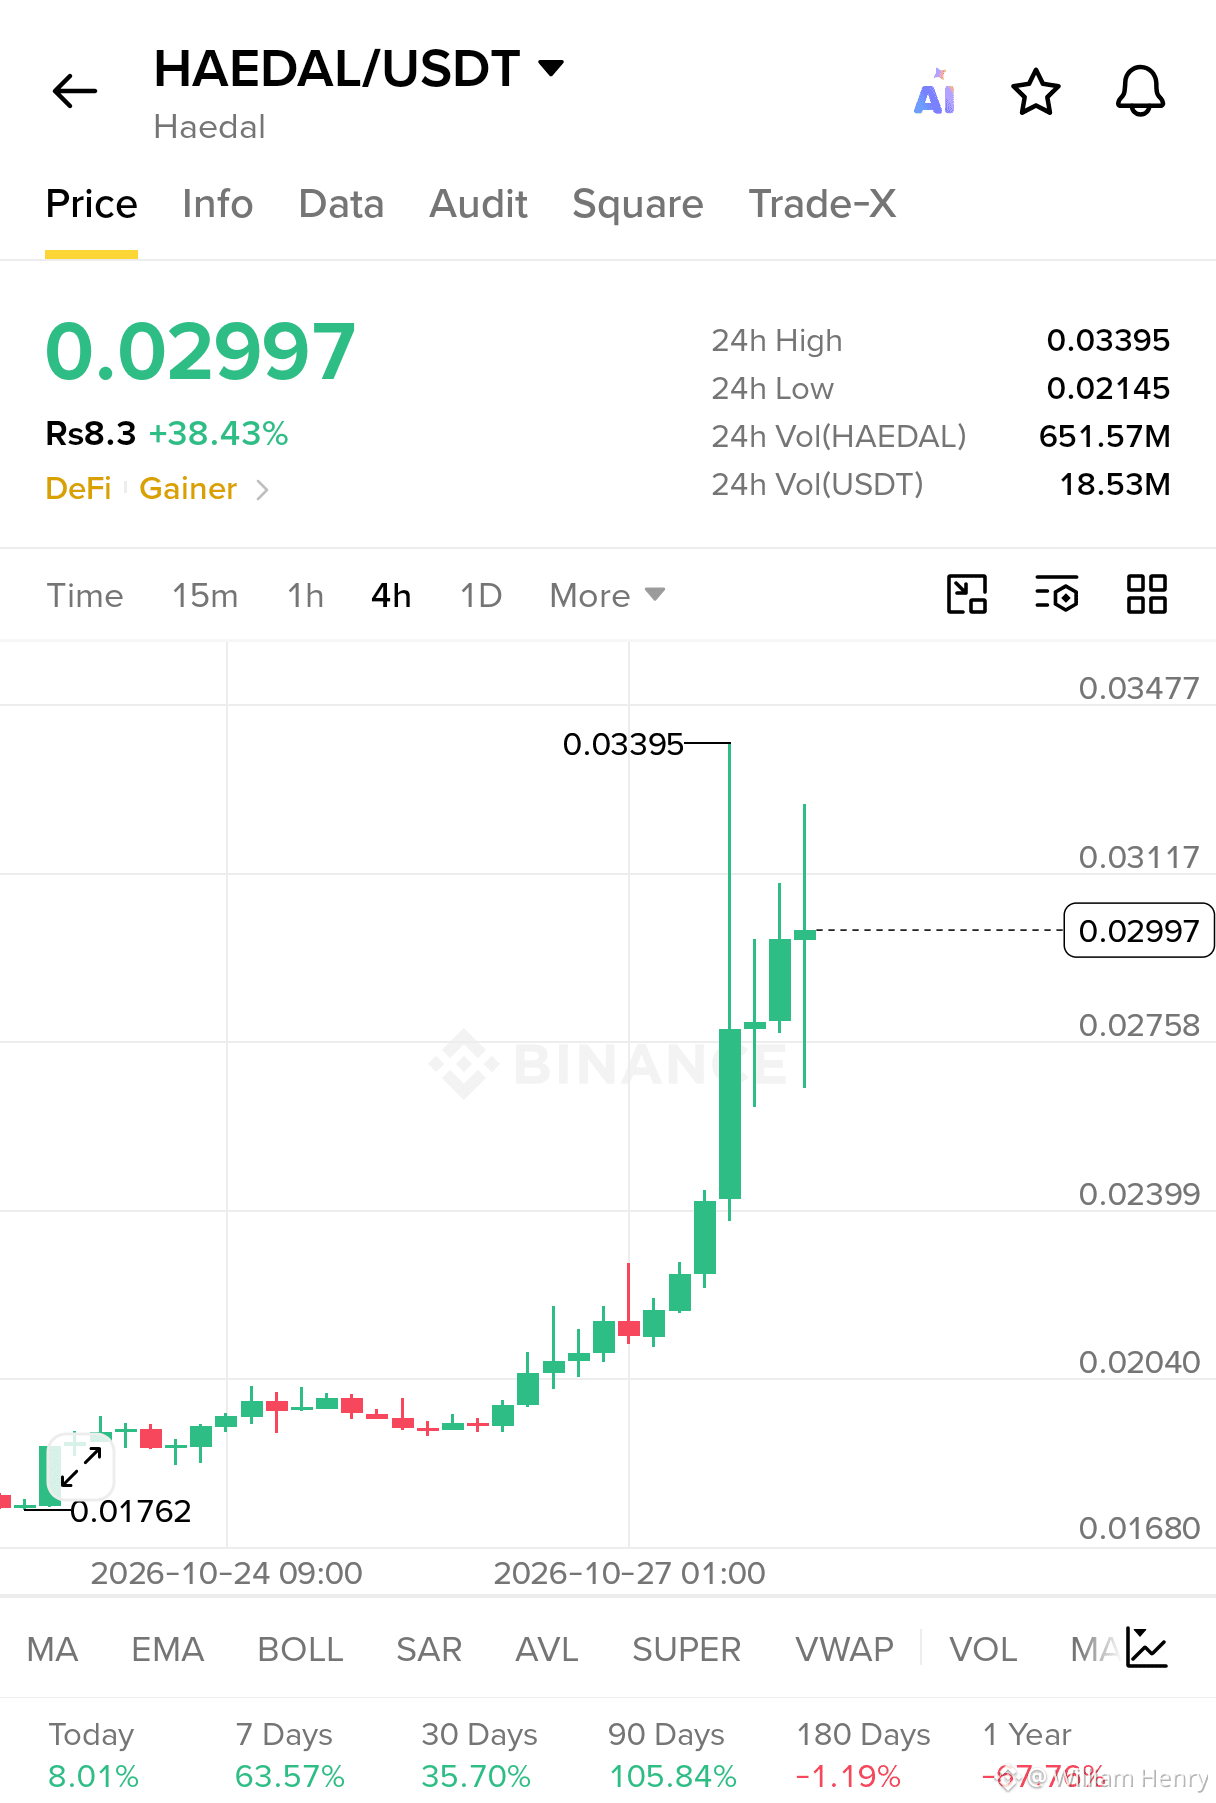
$HAEDAL is showing serious bullish momentum on the 4H chart. I'm watching this setup closely after a strong breakout from the $0.0200 region toward $0.03395. Price is now consolidating near $0.02997 after a sharp rally, with buyers still defending higher levels. The key is whether bulls can reclaim $0.03117 and challenge the recent high.
Trade Setup
Entry: $0.02850–$0.03000
Stop Loss: $0.02680
Targets:
Target 1: $0.03117
Target 2: $0.03395
Target 3: $0.03600
Target 4: $0.03800
Why it's possible
The 4H structure shows a strong upward move with consecutive bullish candles and expanding trading volume. This suggests aggressive buying, although the long upper wicks indicate potential selling pressure near resistance.
I'm watching for support to hold and a clean breakout above $0.03117. A failure to hold support could trigger a deeper pullback, so risk management matters.
Let's see if buyers can push $HAEDAL higher.
{future}(HAEDALUSDT)
#BitmineAdds10452ETH
$HAEDAL is showing serious bullish momentum on the 4H chart. I'm watching this setup closely after a strong breakout from the $0.0200 region toward $0.03395. Price is now consolidating near $0.02997 after a sharp rally, with buyers still defending higher levels. The key is whether bulls can reclaim $0.03117 and challenge the recent high.
Trade Setup
Entry: $0.02850–$0.03000
Stop Loss: $0.02680
Targets:
Target 1: $0.03117
Target 2: $0.03395
Target 3: $0.03600
Target 4: $0.03800
Why it's possible
The 4H structure shows a strong upward move with consecutive bullish candles and expanding trading volume. This suggests aggressive buying, although the long upper wicks indicate potential selling pressure near resistance.
I'm watching for support to hold and a clean breakout above $0.03117. A failure to hold support could trigger a deeper pullback, so risk management matters.
Let's see if buyers can push $HAEDAL higher.
#BitmineAdds10452ETH
Trade Setup
Entry: $0.02850–$0.03000
Stop Loss: $0.02680
Targets:
Target 1: $0.03117
Target 2: $0.03395
Target 3: $0.03600
Target 4: $0.03800
Why it's possible
The 4H structure shows a strong upward move with consecutive bullish candles and expanding trading volume. This suggests aggressive buying, although the long upper wicks indicate potential selling pressure near resistance.
I'm watching for support to hold and a clean breakout above $0.03117. A failure to hold support could trigger a deeper pullback, so risk management matters.
Let's see if buyers can push $HAEDAL higher.
#BitmineAdds10452ETH
783
See translation
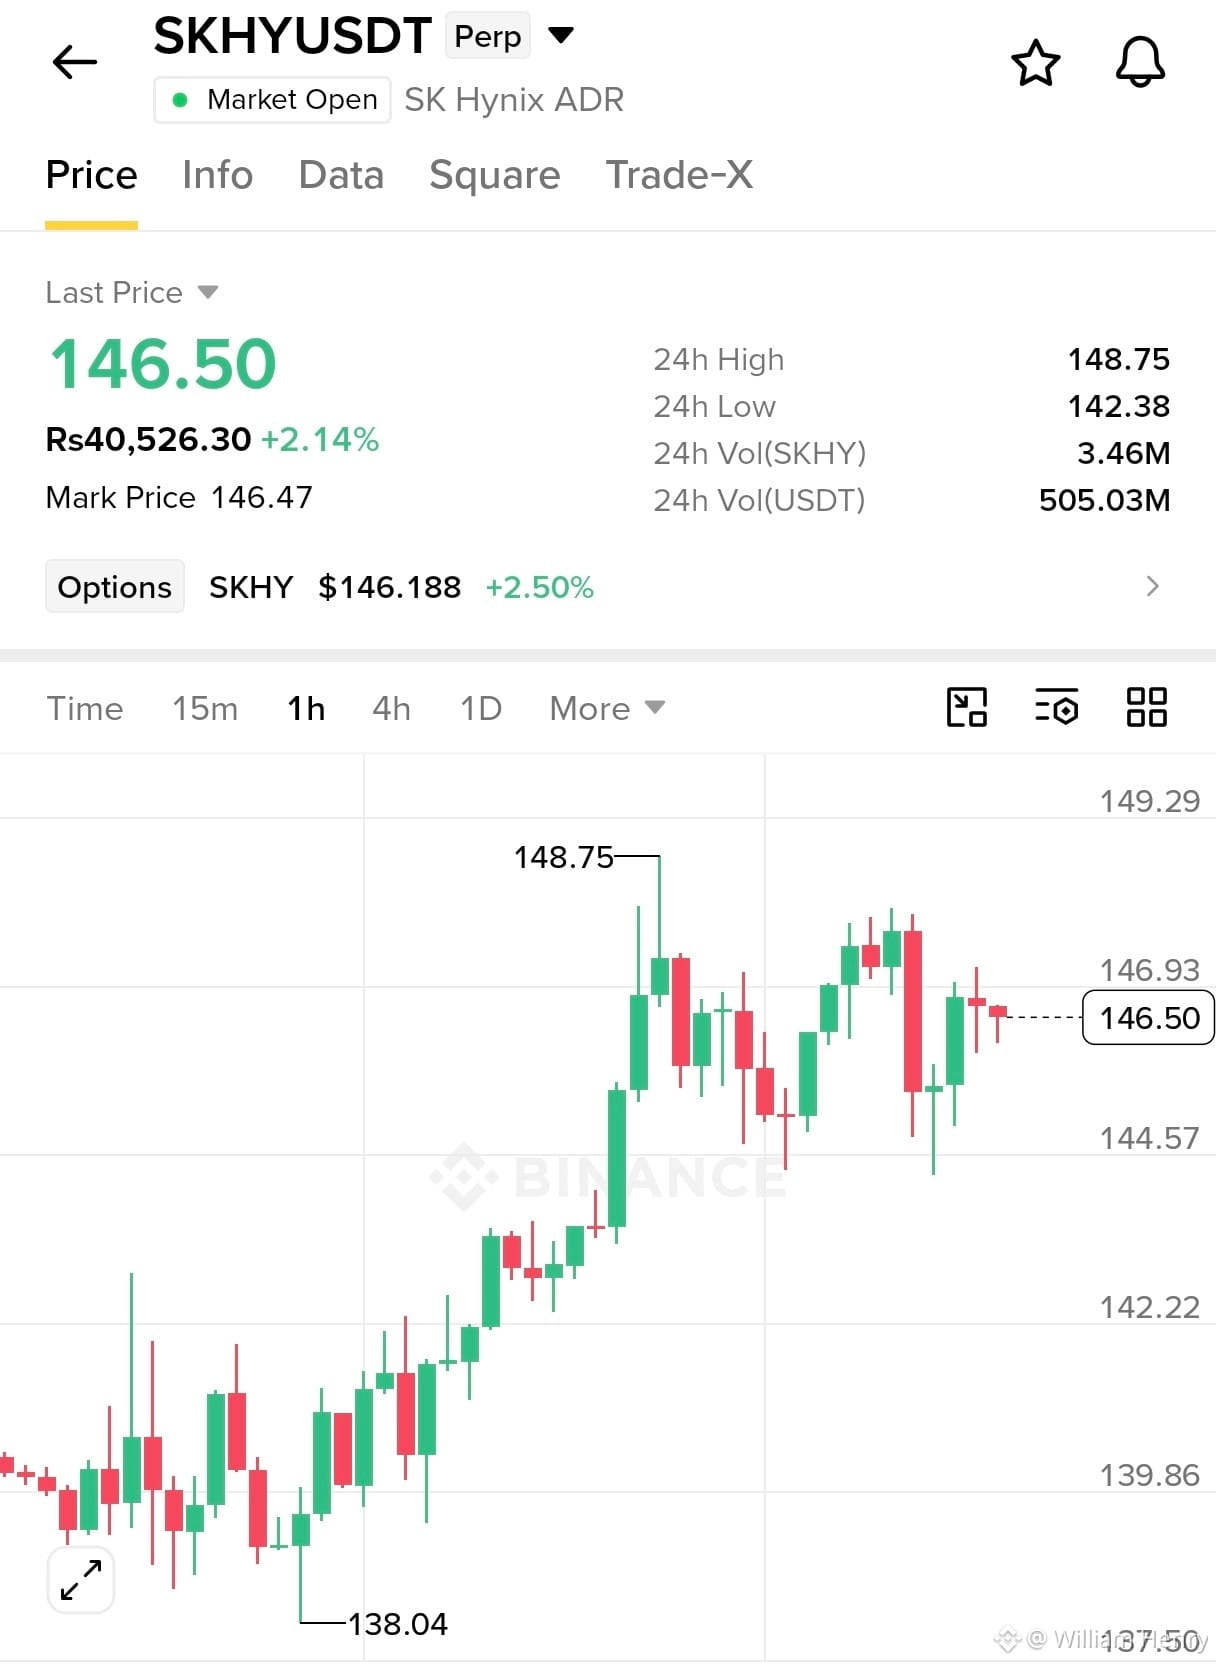
$SKHY is holding a bullish structure on the 1H chart, and I'm watching for another push toward $148.75. Price rallied strongly from $138.04 and is now consolidating around $146.50 after facing resistance near the recent high.
I'm looking for buyers to defend the $145.00–$144.50 support zone and build momentum for a fresh breakout. The setup remains constructive, but confirmation is important because repeated rejection near resistance could trigger another pullback.
Trade Setup
Entry: $146.20–$146.60
Stop Loss: $144.30
Targets:
Target 1: $147.00
Target 2: $147.80
Target 3: $148.75
Target 4: $150.00
Why it's possible
The 1H chart shows a strong upward move followed by consolidation. Buyers have recovered from the recent dip, suggesting demand remains present.
A clean break above $147.00 could open the way to retest $148.75, where breakout momentum may develop. However, resistance is still active, and volume confirmation is unavailable on this chart.
I'm keeping risk controlled and waiting for price to prove the move.
Let's go and trade now $SKHY
{future}(SKHYUSDT)
#CanMicrosoftDeliverOnAI
$SKHY is holding a bullish structure on the 1H chart, and I'm watching for another push toward $148.75. Price rallied strongly from $138.04 and is now consolidating around $146.50 after facing resistance near the recent high.
I'm looking for buyers to defend the $145.00–$144.50 support zone and build momentum for a fresh breakout. The setup remains constructive, but confirmation is important because repeated rejection near resistance could trigger another pullback.
Trade Setup
Entry: $146.20–$146.60
Stop Loss: $144.30
Targets:
Target 1: $147.00
Target 2: $147.80
Target 3: $148.75
Target 4: $150.00
Why it's possible
The 1H chart shows a strong upward move followed by consolidation. Buyers have recovered from the recent dip, suggesting demand remains present.
A clean break above $147.00 could open the way to retest $148.75, where breakout momentum may develop. However, resistance is still active, and volume confirmation is unavailable on this chart.
I'm keeping risk controlled and waiting for price to prove the move.
Let's go and trade now $SKHY
#CanMicrosoftDeliverOnAI
I'm looking for buyers to defend the $145.00–$144.50 support zone and build momentum for a fresh breakout. The setup remains constructive, but confirmation is important because repeated rejection near resistance could trigger another pullback.
Trade Setup
Entry: $146.20–$146.60
Stop Loss: $144.30
Targets:
Target 1: $147.00
Target 2: $147.80
Target 3: $148.75
Target 4: $150.00
Why it's possible
The 1H chart shows a strong upward move followed by consolidation. Buyers have recovered from the recent dip, suggesting demand remains present.
A clean break above $147.00 could open the way to retest $148.75, where breakout momentum may develop. However, resistance is still active, and volume confirmation is unavailable on this chart.
I'm keeping risk controlled and waiting for price to prove the move.
Let's go and trade now $SKHY
#CanMicrosoftDeliverOnAI
1
1
592
See translation
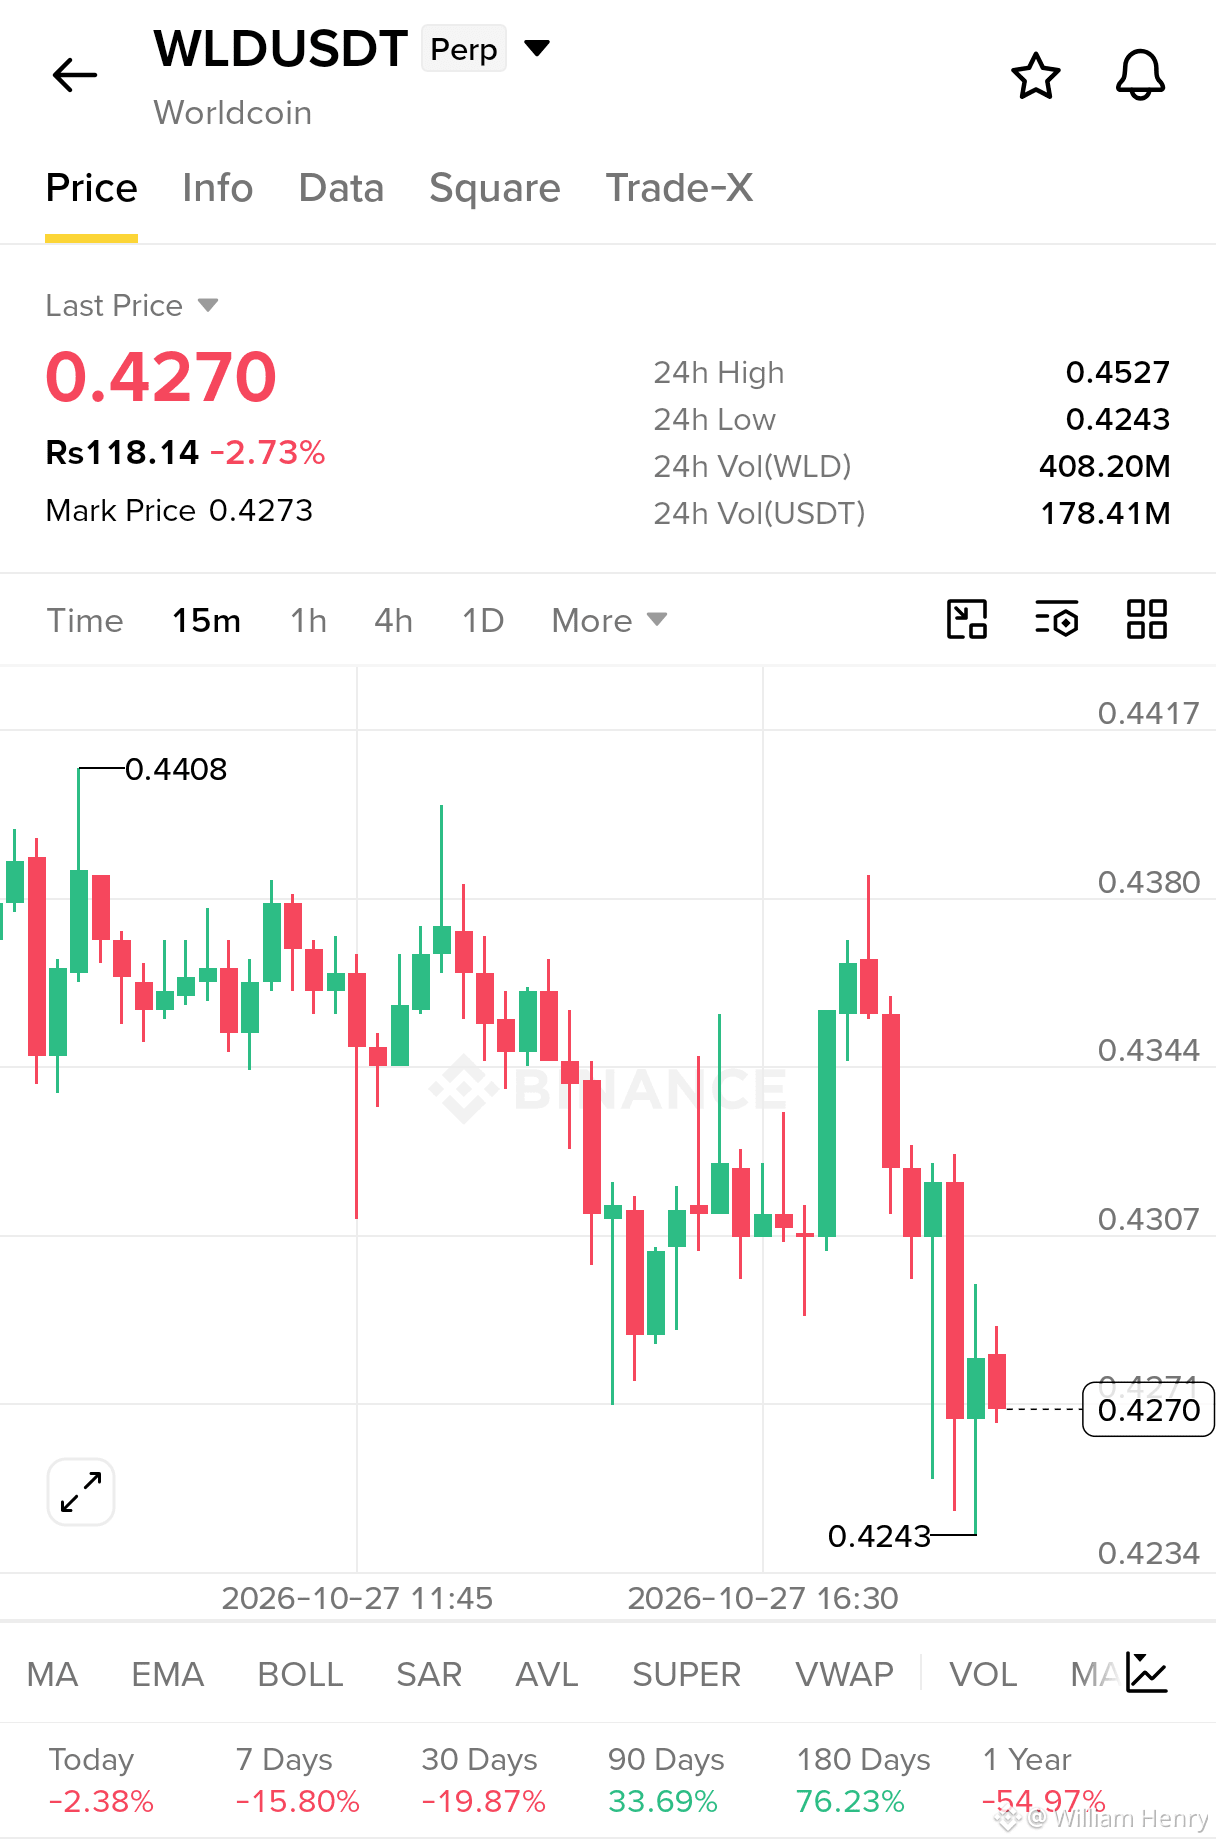
$WLD is approaching a critical turning point.
Price is trading near 0.4270 after a sharp rejection, with buyers trying to stabilize above the 0.4243 low.
EP: 0.4260 – 0.4275
TP1: 0.4300
TP2: 0.4330
TP3: 0.4360
SL: 0.4230
A strong recovery could bring fresh momentum, while another breakdown may extend the downside. Watch how price reacts around support.
Let's go $WLD
{future}(WLDUSDT)
#FOMCWatch
$WLD is approaching a critical turning point.
Price is trading near 0.4270 after a sharp rejection, with buyers trying to stabilize above the 0.4243 low.
EP: 0.4260 – 0.4275
TP1: 0.4300
TP2: 0.4330
TP3: 0.4360
SL: 0.4230
A strong recovery could bring fresh momentum, while another breakdown may extend the downside. Watch how price reacts around support.
Let's go $WLD
#FOMCWatch
Price is trading near 0.4270 after a sharp rejection, with buyers trying to stabilize above the 0.4243 low.
EP: 0.4260 – 0.4275
TP1: 0.4300
TP2: 0.4330
TP3: 0.4360
SL: 0.4230
A strong recovery could bring fresh momentum, while another breakdown may extend the downside. Watch how price reacts around support.
Let's go $WLD
#FOMCWatch
658
See translation
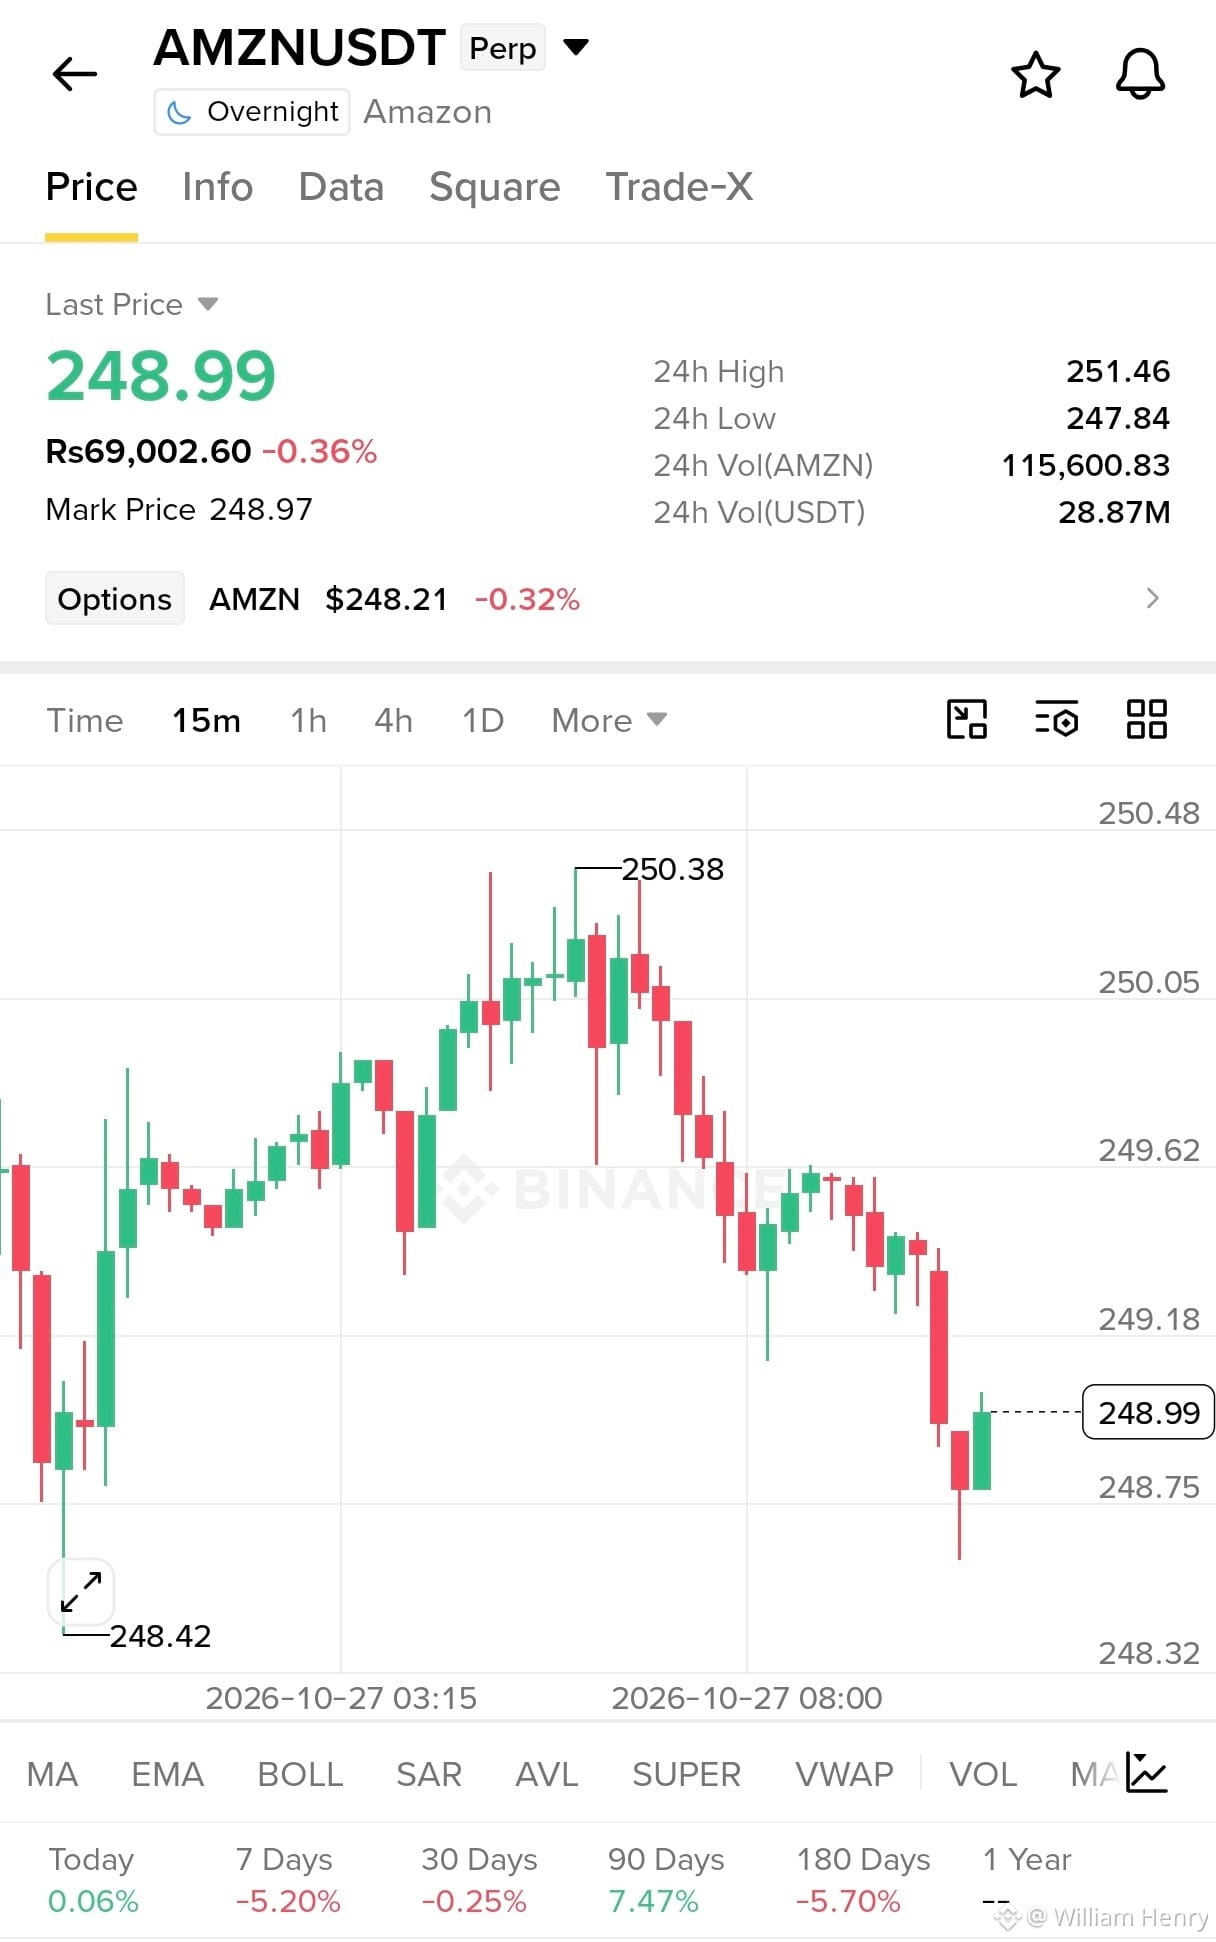
$AMZN is showing bearish pressure as sellers take control!
AMZNUSDT Perp is trading at 248.99, down 0.36%, after rejection from the 250.38 high. The 15m chart shows lower highs and a sharp sell-off, with a small bounce emerging near 248.75.
24H High: 251.46
24H Low: 247.84
24H Volume: 28.87M USDT
Mark Price: 248.97
Key Levels: Support at 248.75–247.84. Resistance at 249.62–250.05.
A break below support could trigger another leg down, while reclaiming 249.62 may spark a recovery. Watch the next candle closely — volatility is building!
Let's go $AMZN
{future}(AMZNUSDT)
$AMZN is showing bearish pressure as sellers take control!
AMZNUSDT Perp is trading at 248.99, down 0.36%, after rejection from the 250.38 high. The 15m chart shows lower highs and a sharp sell-off, with a small bounce emerging near 248.75.
24H High: 251.46
24H Low: 247.84
24H Volume: 28.87M USDT
Mark Price: 248.97
Key Levels: Support at 248.75–247.84. Resistance at 249.62–250.05.
A break below support could trigger another leg down, while reclaiming 249.62 may spark a recovery. Watch the next candle closely — volatility is building!
Let's go $AMZN
AMZNUSDT Perp is trading at 248.99, down 0.36%, after rejection from the 250.38 high. The 15m chart shows lower highs and a sharp sell-off, with a small bounce emerging near 248.75.
24H High: 251.46
24H Low: 247.84
24H Volume: 28.87M USDT
Mark Price: 248.97
Key Levels: Support at 248.75–247.84. Resistance at 249.62–250.05.
A break below support could trigger another leg down, while reclaiming 249.62 may spark a recovery. Watch the next candle closely — volatility is building!
Let's go $AMZN
2
359
Log in to explore more content
Join global crypto users on Binance Square
⚡️ Get latest and useful information about crypto.
💬 Trusted by the world’s largest crypto exchange.
👍 Discover real insights from verified creators.
Email / Phone number
Trending Topics
BinanceProcesses$4.65BWithdrawals
38,337 views
147 Discussing
Binance Processes $4.65 Billion in Withdrawals After Reopening, Net Outflow of $3.64 Billion Equals 2.1% of Its $171 Billion in Assets
Binance News
·51 Likes
·15.7k views
WithdrawalsBack: 15 networks live
9,224 views
139 Discussing
BrazilVirtualAssetLicenseDeadlineDrawsAbout40Firms
324 views
37 Discussing