

The Cryptonomist
18.9k Posts

The Cryptonomist
 Square Verified+
Report
Block User
0 Following
38.2K+ Followers
22.7K+ Liked
Posts
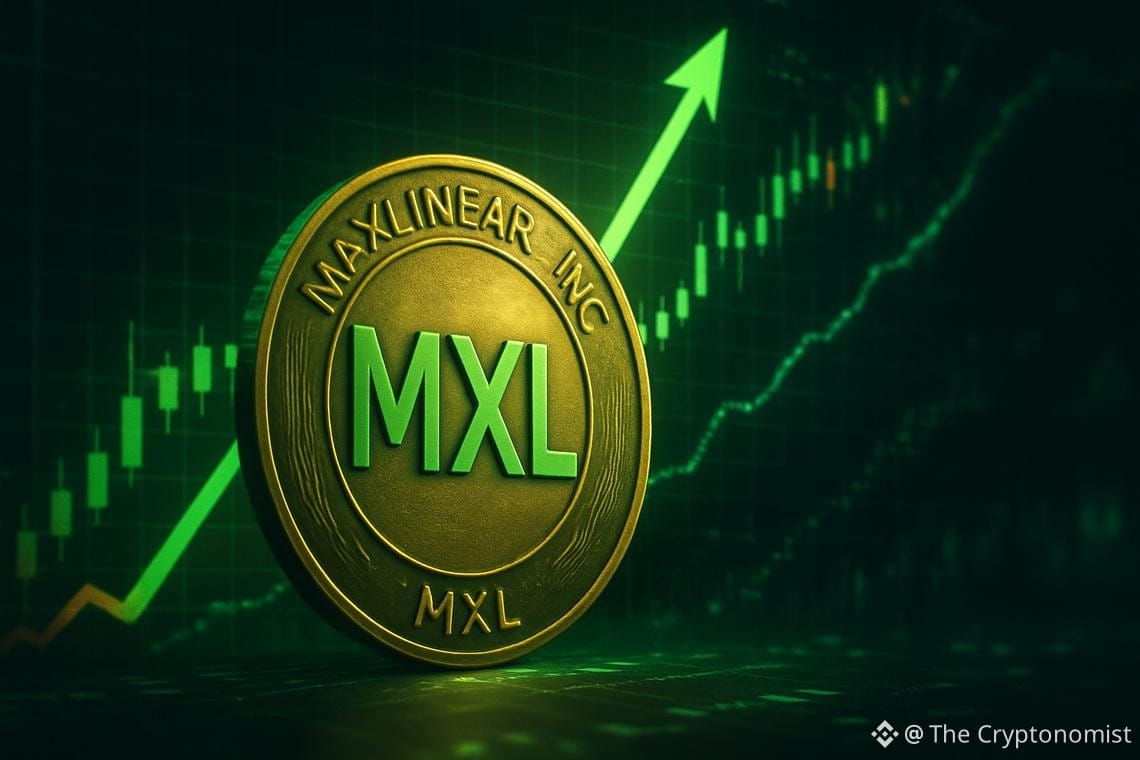
Article
See translation
MaxLinear stock closes up 14.99% at $105.93, flashes overbought signalsMaxLinear stock surged 14.99% on Friday, closing at $105.93 after touching a session high of $106.54. Trading volume reached 4,757,799 shares as the stock extended a clearly bullish daily structure.
MXL — daily chart with candlesticks, EMA20/EMA50 and volume.
Key takeaways
MXL closed at $105.93, up 14.99% from the prior close of $92.12 on October 1, 2026.
Price sits above the 20-session, 50-session, and 200-session EMAs in a textbook bullish stack.
Daily RSI14 at 71.54 and a close above the upper Bollinger Band at $103.92 signal overbought conditions.
Next-session pivot levels: daily pivot at $102.10, first resistance at $110.37, first support at $97.67.
Two reports published after Friday’s close highlighted infrastructure and data-center chip demand, while MaxLinear’s Q3 earnings call is set for October 22, 2026.
Daily Chart Shows MaxLinear Stock in an Overbought Uptrend
The daily chart now carries a clearly bullish structure. Price sits comfortably above its 20-session EMA at $83.75, its 50-session EMA at $77.87, and its 200-session EMA at $58.16. This creates a stacked alignment: price leads the 20, the 20 leads the 50, and the 50 leads the 200. That is the textbook signature of an established uptrend.
However, the move has pushed MXL well beyond the upper Bollinger Band at $103.92.
Momentum backs up the trend for now, though it is stretched. The daily RSI14 stands at 71.54, in overbought territory. The daily MACD line sits at 7.30, above its signal at 4.95, leaving a positive histogram of 2.35. Both readings describe a market still being bought aggressively. At the same time, an RSI this high, paired with a close above the upper band, means the daily trend is extended. It is vulnerable to a sharp pause.
The daily ATR14 reads 6.99, a wide range that reflects how forcefully MaxLinear stock has been moving session to session. For the next session, the daily pivot sits at $102.10, with first resistance at $110.37 and first support at $97.67. Those are the levels to watch once trading resumes.
What the Hourly and 15-Minute Charts Say About MaxLinear Stock
Hourly Chart Confirms the Bullish Bias
Moving to the hourly chart, the picture largely confirms the daily bias. MXL trades above its 20-hour EMA at $98.13, its 50-hour EMA at $92.81, and its 200-hour EMA at $80.56 — another bullish stack. The hourly RSI14 at 73.37 is also overbought. The hourly MACD line at 3.95 sits above its signal at 2.81, keeping the histogram positive at 1.14.
Unlike the daily chart, though, price on the hourly timeframe remains below its upper Bollinger Band at $108.53. This means there is still some technical room before the hourly structure becomes as stretched as the daily one.
For the next session, the hourly pivot sits at $105.73, with resistance at $106.67 and support at $104.93. The next few hours will decide whether the breakout extends or stalls.
15-Minute Chart Hints at Short-Term Pause
In contrast, the 15-minute chart introduces a note of short-term hesitation. The MACD line there reads 1.93, below its signal at 2.16, producing a negative histogram of -0.23. It is the only momentum reading across the three timeframes pointing the other way. The 15-minute RSI14 at 72.34 remains overbought.
For the next session, the 15-minute pivot sits at $105.94, with resistance at $106.46 and support at $105.35. This does not overturn the bullish structure on the daily and hourly charts. However, it suggests the rally is pausing to digest its own size before any further push.
News and Upcoming Catalysts for MaxLinear Stock
Context from recent coverage lines up with that technical stretch. A Seeking Alpha article published on Thursday, a day before this rally, pointed to elevated expectations around AI and data-center enthusiasm. It also flagged GAAP losses and weak cash flow as risks underneath those elevated expectations, according to that outlet’s analysis.
Meanwhile, two reports published after Friday’s close offered a read on the session itself. A Seeking Alpha piece, published after the close, pointed to renewed attention to infrastructure and data-center chips. Separately, a Motley Fool report published after the close said MXL shares had gained 50.7% over the prior month, by that outlet’s own figure.
Looking ahead, MaxLinear announced it will hold its third-quarter 2026 earnings conference call on Thursday, October 22, 2026. The call is set for 1:30 p.m. Pacific Time (4:30 p.m. Eastern), according to a release carried by Yahoo Finance. That date now stands as the next scheduled catalyst for MaxLinear stock.
What Would Keep MaxLinear Stock Climbing — and What Would Break It
Bullish Scenario
For the bullish case to extend, MaxLinear stock needs to hold above the daily pivot at $102.10. It must eventually clear the daily first resistance at $110.37. On the hourly chart, that would likely require price to stay above the hourly EMA20 at $98.13. It would also need to clear the hourly first resistance at $106.67. A recovery in the 15-minute MACD histogram back above zero would help confirm that short-term sellers have been absorbed rather than taking control.
Bearish Risks
On the other hand, the bearish risk starts with the very stretch that makes this rally impressive. A slide back below the daily pivot at $102.10 toward the daily first support at $97.67 would be an early sign of exhaustion. A deeper break below the hourly EMA20 at $98.13 would strengthen that signal further.
Given the overbought readings on both the daily and hourly RSI14, together with a daily close above the upper Bollinger Band, a cooling-off period would not be surprising. That would hold true even within an otherwise intact uptrend.
Overall, MaxLinear stock closed Friday’s session at $105.93, trading above every major daily and hourly moving average. It sits at an overbought extreme on momentum and above its daily upper Bollinger Band. The daily ATR14 at 6.99 underscores how wide the swings have become. Whether the rally keeps extending toward the daily first resistance at $110.37, or first digests its gains near the daily pivot at $102.10, remains the open question. The 15-minute chart’s early loss of upward momentum is the first thing to watch when trading resumes.
FAQ
What are the key technical levels for MaxLinear stock in the next session?
The daily pivot sits at $102.10, with first resistance at $110.37 and first support at $97.67. On the hourly chart, the pivot is at $105.73, with resistance at $106.67 and support at $104.93.
Is MaxLinear stock overbought after Friday’s rally?
Yes. The daily RSI14 stands at 71.54, and the stock closed above the daily upper Bollinger Band at $103.92. The hourly RSI14 at 73.37 is also in overbought territory, suggesting the trend is extended across timeframes.
What upcoming events could move MaxLinear stock?
MaxLinear will hold its third-quarter 2026 earnings conference call on Thursday, October 22, 2026, at 1:30 p.m. Pacific Time (4:30 p.m. Eastern), according to a release carried by Yahoo Finance. That is the next scheduled catalyst.
What does the 15-minute chart signal for MaxLinear stock?
The 15-minute MACD shows a negative histogram of -0.23, the only bearish momentum reading across the three timeframes. This does not overturn the bullish daily and hourly structure, but it suggests the rally is pausing to digest its gains before any further push.
Disclaimer: This article is for informational purposes only and does not constitute financial advice, an investment recommendation, or a solicitation to buy or sell any financial instrument or cryptocurrency. The analysis provided is not indicative of future results. Investing in crypto assets and financial markets carries a high risk of capital loss. Always do your own research (DYOR) and consult a qualified financial advisor before making any decision.
Article produced with the assistance of artificial intelligence and reviewed by the editorial team.
MaxLinear stock closes up 14.99% at $105.93, flashes overbought signals
MaxLinear stock surged 14.99% on Friday, closing at $105.93 after touching a session high of $106.54. Trading volume reached 4,757,799 shares as the stock extended a clearly bullish daily structure.
MXL — daily chart with candlesticks, EMA20/EMA50 and volume.
Key takeaways
MXL closed at $105.93, up 14.99% from the prior close of $92.12 on October 1, 2026.
Price sits above the 20-session, 50-session, and 200-session EMAs in a textbook bullish stack.
Daily RSI14 at 71.54 and a close above the upper Bollinger Band at $103.92 signal overbought conditions.
Next-session pivot levels: daily pivot at $102.10, first resistance at $110.37, first support at $97.67.
Two reports published after Friday’s close highlighted infrastructure and data-center chip demand, while MaxLinear’s Q3 earnings call is set for October 22, 2026.
Daily Chart Shows MaxLinear Stock in an Overbought Uptrend
The daily chart now carries a clearly bullish structure. Price sits comfortably above its 20-session EMA at $83.75, its 50-session EMA at $77.87, and its 200-session EMA at $58.16. This creates a stacked alignment: price leads the 20, the 20 leads the 50, and the 50 leads the 200. That is the textbook signature of an established uptrend.
However, the move has pushed MXL well beyond the upper Bollinger Band at $103.92.
Momentum backs up the trend for now, though it is stretched. The daily RSI14 stands at 71.54, in overbought territory. The daily MACD line sits at 7.30, above its signal at 4.95, leaving a positive histogram of 2.35. Both readings describe a market still being bought aggressively. At the same time, an RSI this high, paired with a close above the upper band, means the daily trend is extended. It is vulnerable to a sharp pause.
The daily ATR14 reads 6.99, a wide range that reflects how forcefully MaxLinear stock has been moving session to session. For the next session, the daily pivot sits at $102.10, with first resistance at $110.37 and first support at $97.67. Those are the levels to watch once trading resumes.
What the Hourly and 15-Minute Charts Say About MaxLinear Stock
Hourly Chart Confirms the Bullish Bias
Moving to the hourly chart, the picture largely confirms the daily bias. MXL trades above its 20-hour EMA at $98.13, its 50-hour EMA at $92.81, and its 200-hour EMA at $80.56 — another bullish stack. The hourly RSI14 at 73.37 is also overbought. The hourly MACD line at 3.95 sits above its signal at 2.81, keeping the histogram positive at 1.14.
Unlike the daily chart, though, price on the hourly timeframe remains below its upper Bollinger Band at $108.53. This means there is still some technical room before the hourly structure becomes as stretched as the daily one.
For the next session, the hourly pivot sits at $105.73, with resistance at $106.67 and support at $104.93. The next few hours will decide whether the breakout extends or stalls.
15-Minute Chart Hints at Short-Term Pause
In contrast, the 15-minute chart introduces a note of short-term hesitation. The MACD line there reads 1.93, below its signal at 2.16, producing a negative histogram of -0.23. It is the only momentum reading across the three timeframes pointing the other way. The 15-minute RSI14 at 72.34 remains overbought.
For the next session, the 15-minute pivot sits at $105.94, with resistance at $106.46 and support at $105.35. This does not overturn the bullish structure on the daily and hourly charts. However, it suggests the rally is pausing to digest its own size before any further push.
News and Upcoming Catalysts for MaxLinear Stock
Context from recent coverage lines up with that technical stretch. A Seeking Alpha article published on Thursday, a day before this rally, pointed to elevated expectations around AI and data-center enthusiasm. It also flagged GAAP losses and weak cash flow as risks underneath those elevated expectations, according to that outlet’s analysis.
Meanwhile, two reports published after Friday’s close offered a read on the session itself. A Seeking Alpha piece, published after the close, pointed to renewed attention to infrastructure and data-center chips. Separately, a Motley Fool report published after the close said MXL shares had gained 50.7% over the prior month, by that outlet’s own figure.
Looking ahead, MaxLinear announced it will hold its third-quarter 2026 earnings conference call on Thursday, October 22, 2026. The call is set for 1:30 p.m. Pacific Time (4:30 p.m. Eastern), according to a release carried by Yahoo Finance. That date now stands as the next scheduled catalyst for MaxLinear stock.
What Would Keep MaxLinear Stock Climbing — and What Would Break It
Bullish Scenario
For the bullish case to extend, MaxLinear stock needs to hold above the daily pivot at $102.10. It must eventually clear the daily first resistance at $110.37. On the hourly chart, that would likely require price to stay above the hourly EMA20 at $98.13. It would also need to clear the hourly first resistance at $106.67. A recovery in the 15-minute MACD histogram back above zero would help confirm that short-term sellers have been absorbed rather than taking control.
Bearish Risks
On the other hand, the bearish risk starts with the very stretch that makes this rally impressive. A slide back below the daily pivot at $102.10 toward the daily first support at $97.67 would be an early sign of exhaustion. A deeper break below the hourly EMA20 at $98.13 would strengthen that signal further.
Given the overbought readings on both the daily and hourly RSI14, together with a daily close above the upper Bollinger Band, a cooling-off period would not be surprising. That would hold true even within an otherwise intact uptrend.
Overall, MaxLinear stock closed Friday’s session at $105.93, trading above every major daily and hourly moving average. It sits at an overbought extreme on momentum and above its daily upper Bollinger Band. The daily ATR14 at 6.99 underscores how wide the swings have become. Whether the rally keeps extending toward the daily first resistance at $110.37, or first digests its gains near the daily pivot at $102.10, remains the open question. The 15-minute chart’s early loss of upward momentum is the first thing to watch when trading resumes.
FAQ
What are the key technical levels for MaxLinear stock in the next session?
The daily pivot sits at $102.10, with first resistance at $110.37 and first support at $97.67. On the hourly chart, the pivot is at $105.73, with resistance at $106.67 and support at $104.93.
Is MaxLinear stock overbought after Friday’s rally?
Yes. The daily RSI14 stands at 71.54, and the stock closed above the daily upper Bollinger Band at $103.92. The hourly RSI14 at 73.37 is also in overbought territory, suggesting the trend is extended across timeframes.
What upcoming events could move MaxLinear stock?
MaxLinear will hold its third-quarter 2026 earnings conference call on Thursday, October 22, 2026, at 1:30 p.m. Pacific Time (4:30 p.m. Eastern), according to a release carried by Yahoo Finance. That is the next scheduled catalyst.
What does the 15-minute chart signal for MaxLinear stock?
The 15-minute MACD shows a negative histogram of -0.23, the only bearish momentum reading across the three timeframes. This does not overturn the bullish daily and hourly structure, but it suggests the rally is pausing to digest its gains before any further push.
Disclaimer: This article is for informational purposes only and does not constitute financial advice, an investment recommendation, or a solicitation to buy or sell any financial instrument or cryptocurrency. The analysis provided is not indicative of future results. Investing in crypto assets and financial markets carries a high risk of capital loss. Always do your own research (DYOR) and consult a qualified financial advisor before making any decision.
Article produced with the assistance of artificial intelligence and reviewed by the editorial team.
MXL — daily chart with candlesticks, EMA20/EMA50 and volume.
Key takeaways
MXL closed at $105.93, up 14.99% from the prior close of $92.12 on October 1, 2026.
Price sits above the 20-session, 50-session, and 200-session EMAs in a textbook bullish stack.
Daily RSI14 at 71.54 and a close above the upper Bollinger Band at $103.92 signal overbought conditions.
Next-session pivot levels: daily pivot at $102.10, first resistance at $110.37, first support at $97.67.
Two reports published after Friday’s close highlighted infrastructure and data-center chip demand, while MaxLinear’s Q3 earnings call is set for October 22, 2026.
Daily Chart Shows MaxLinear Stock in an Overbought Uptrend
The daily chart now carries a clearly bullish structure. Price sits comfortably above its 20-session EMA at $83.75, its 50-session EMA at $77.87, and its 200-session EMA at $58.16. This creates a stacked alignment: price leads the 20, the 20 leads the 50, and the 50 leads the 200. That is the textbook signature of an established uptrend.
However, the move has pushed MXL well beyond the upper Bollinger Band at $103.92.
Momentum backs up the trend for now, though it is stretched. The daily RSI14 stands at 71.54, in overbought territory. The daily MACD line sits at 7.30, above its signal at 4.95, leaving a positive histogram of 2.35. Both readings describe a market still being bought aggressively. At the same time, an RSI this high, paired with a close above the upper band, means the daily trend is extended. It is vulnerable to a sharp pause.
The daily ATR14 reads 6.99, a wide range that reflects how forcefully MaxLinear stock has been moving session to session. For the next session, the daily pivot sits at $102.10, with first resistance at $110.37 and first support at $97.67. Those are the levels to watch once trading resumes.
What the Hourly and 15-Minute Charts Say About MaxLinear Stock
Hourly Chart Confirms the Bullish Bias
Moving to the hourly chart, the picture largely confirms the daily bias. MXL trades above its 20-hour EMA at $98.13, its 50-hour EMA at $92.81, and its 200-hour EMA at $80.56 — another bullish stack. The hourly RSI14 at 73.37 is also overbought. The hourly MACD line at 3.95 sits above its signal at 2.81, keeping the histogram positive at 1.14.
Unlike the daily chart, though, price on the hourly timeframe remains below its upper Bollinger Band at $108.53. This means there is still some technical room before the hourly structure becomes as stretched as the daily one.
For the next session, the hourly pivot sits at $105.73, with resistance at $106.67 and support at $104.93. The next few hours will decide whether the breakout extends or stalls.
15-Minute Chart Hints at Short-Term Pause
In contrast, the 15-minute chart introduces a note of short-term hesitation. The MACD line there reads 1.93, below its signal at 2.16, producing a negative histogram of -0.23. It is the only momentum reading across the three timeframes pointing the other way. The 15-minute RSI14 at 72.34 remains overbought.
For the next session, the 15-minute pivot sits at $105.94, with resistance at $106.46 and support at $105.35. This does not overturn the bullish structure on the daily and hourly charts. However, it suggests the rally is pausing to digest its own size before any further push.
News and Upcoming Catalysts for MaxLinear Stock
Context from recent coverage lines up with that technical stretch. A Seeking Alpha article published on Thursday, a day before this rally, pointed to elevated expectations around AI and data-center enthusiasm. It also flagged GAAP losses and weak cash flow as risks underneath those elevated expectations, according to that outlet’s analysis.
Meanwhile, two reports published after Friday’s close offered a read on the session itself. A Seeking Alpha piece, published after the close, pointed to renewed attention to infrastructure and data-center chips. Separately, a Motley Fool report published after the close said MXL shares had gained 50.7% over the prior month, by that outlet’s own figure.
Looking ahead, MaxLinear announced it will hold its third-quarter 2026 earnings conference call on Thursday, October 22, 2026. The call is set for 1:30 p.m. Pacific Time (4:30 p.m. Eastern), according to a release carried by Yahoo Finance. That date now stands as the next scheduled catalyst for MaxLinear stock.
What Would Keep MaxLinear Stock Climbing — and What Would Break It
Bullish Scenario
For the bullish case to extend, MaxLinear stock needs to hold above the daily pivot at $102.10. It must eventually clear the daily first resistance at $110.37. On the hourly chart, that would likely require price to stay above the hourly EMA20 at $98.13. It would also need to clear the hourly first resistance at $106.67. A recovery in the 15-minute MACD histogram back above zero would help confirm that short-term sellers have been absorbed rather than taking control.
Bearish Risks
On the other hand, the bearish risk starts with the very stretch that makes this rally impressive. A slide back below the daily pivot at $102.10 toward the daily first support at $97.67 would be an early sign of exhaustion. A deeper break below the hourly EMA20 at $98.13 would strengthen that signal further.
Given the overbought readings on both the daily and hourly RSI14, together with a daily close above the upper Bollinger Band, a cooling-off period would not be surprising. That would hold true even within an otherwise intact uptrend.
Overall, MaxLinear stock closed Friday’s session at $105.93, trading above every major daily and hourly moving average. It sits at an overbought extreme on momentum and above its daily upper Bollinger Band. The daily ATR14 at 6.99 underscores how wide the swings have become. Whether the rally keeps extending toward the daily first resistance at $110.37, or first digests its gains near the daily pivot at $102.10, remains the open question. The 15-minute chart’s early loss of upward momentum is the first thing to watch when trading resumes.
FAQ
What are the key technical levels for MaxLinear stock in the next session?
The daily pivot sits at $102.10, with first resistance at $110.37 and first support at $97.67. On the hourly chart, the pivot is at $105.73, with resistance at $106.67 and support at $104.93.
Is MaxLinear stock overbought after Friday’s rally?
Yes. The daily RSI14 stands at 71.54, and the stock closed above the daily upper Bollinger Band at $103.92. The hourly RSI14 at 73.37 is also in overbought territory, suggesting the trend is extended across timeframes.
What upcoming events could move MaxLinear stock?
MaxLinear will hold its third-quarter 2026 earnings conference call on Thursday, October 22, 2026, at 1:30 p.m. Pacific Time (4:30 p.m. Eastern), according to a release carried by Yahoo Finance. That is the next scheduled catalyst.
What does the 15-minute chart signal for MaxLinear stock?
The 15-minute MACD shows a negative histogram of -0.23, the only bearish momentum reading across the three timeframes. This does not overturn the bullish daily and hourly structure, but it suggests the rally is pausing to digest its gains before any further push.
Disclaimer: This article is for informational purposes only and does not constitute financial advice, an investment recommendation, or a solicitation to buy or sell any financial instrument or cryptocurrency. The analysis provided is not indicative of future results. Investing in crypto assets and financial markets carries a high risk of capital loss. Always do your own research (DYOR) and consult a qualified financial advisor before making any decision.
Article produced with the assistance of artificial intelligence and reviewed by the editorial team.
15

Article
See translation
Cycurion stock surges 42% to $3.82, key resistance at $4.97 eyed for next sessionCycurion stock surged 42% on Friday, closing at $3.82 after an explosive session that swung between $2.64 and $4.95. Volume reached 48,818,864 shares.
CYCU — daily chart with candlesticks, EMA20/EMA50 and volume.
Key takeaways
Cycurion stock closed Friday at $3.82, up 42.01% from the previous close of $2.69, after ranging from $2.64 to $4.95.
Volume reached 48,818,864 shares.
Daily momentum is improving but unconfirmed — price sits above the 20-session EMA ($3.26) yet below the 50-session EMA ($3.90) and the 200-session EMA ($15.53).
Investing.com reported before Friday’s open that Cycurion regained Nasdaq’s minimum bid price compliance.
Key levels for the next session: daily pivot at $3.80, resistance (R1) at $4.97, support (S1) at $2.66.
Cycurion stock opened Friday at $2.98 and closed at $3.82, marking a 42.01% gain versus the previous close of $2.69 on October 1. Measured from its own open to its own close, the stock advanced 28.19% intraday. Volume came in at 48,818,864 shares.
A swing from $2.64 to $4.95 in a single session signals this was not a quiet grind higher. It was a volatility event. The daily average true range (ATR14) sits at $0.54. Friday’s range dwarfed that figure, confirming how stretched the session was relative to recent norms. Any near-term outlook for Cycurion stock must therefore balance the strength of the advance against the risk inherent in such an expansion.
Daily Chart: Momentum Improving, But Price Still Caught Between Averages
Price Position Relative to Key Averages
On the daily timeframe, price structure is mixed rather than cleanly bullish. The close of $3.82 sits above the 20-session EMA at $3.26, which is constructive. However, it remains below the 50-session EMA at $3.90, and well below the 200-session EMA at $15.53. This is not a stacked bullish trend. It is a market still working to repair a much larger average above it, with short-term momentum only recently turning positive.
Momentum Indicators Show Early Turn
Daily RSI14 reads 56.78, which is neutral-to-constructive, not overbought. The MACD line sits at -0.29 against a signal line of -0.36. That puts the line above its signal with a positive histogram of 0.07. Both lines remain below zero, however, so broader daily momentum is still technically negative, even as short-term momentum improves. The trend is not yet confirmed bullish — it is in the process of turning.
Bollinger Bands and Pivot Levels
The daily Bollinger setup adds another layer. Price at $3.82 sits just below the upper band at $3.86 and far above the mid-band at $3.19. That is a classic signature of a strong breakout day pressing against its own volatility envelope. Little room remains before the band itself must expand or price must pause. For the next session, the daily pivot sits at $3.80, with first resistance (R1) at $4.97 and first support (S1) at $2.66.
Hourly Timeframe Adds Partial Confirmation
On the 1-hour chart, Cycurion stock closed at $3.82 above all three EMAs. The 20-hour EMA sits at $3.27, the 50-hour at $3.09, and the 200-hour at $3.64. That is encouraging for bulls. However, the internal order is not a clean stack. The 200-hour EMA sits above both the 20-hour and 50-hour averages. Price is therefore pushing through a layered resistance zone rather than riding a fully aligned uptrend.
Momentum on this timeframe is more convincing. Hourly RSI14 stands at 67.28, approaching overbought territory without having crossed it. The hourly MACD line is at 0.27 versus a signal of 0.16. That puts the line above its signal with a positive histogram of 0.11 — both values are positive, marking a genuinely bullish momentum read. Meanwhile, the hourly pivot for the next session sits at $3.74, with resistance (R1) at $3.90 and support (S1) at $3.67. Price is positioned between the pivot and R1, leaning toward the upper half of that near-term range.
15-Minute View: A Short-Term Pullback Inside the Rally
The 15-minute chart is where the picture gets more interesting. Here, the EMAs are properly stacked bullish. Price at $3.82 sits above the 20-period EMA at $3.73. That sits above the 50-period EMA at $3.42, which in turn sits above the 200-period EMA at $3.12. This is the cleanest bullish alignment across all three timeframes.
Short-term momentum, however, is cooling. The 15-minute MACD line at 0.12 sits below its signal at 0.19, producing a negative histogram of -0.07. RSI14 reads 56.94, neutral. Price has also slipped below the 15-minute Bollinger mid-band at $3.91, though it remains above the lower band at $3.60. Taken together, this points to a short-term pullback or consolidation inside a broader intraday uptrend, rather than a reversal. The 15-minute pivot for the next session matches the hourly levels: pivot at $3.74, R1 at $3.90, S1 at $3.67.
Nasdaq Compliance News
Alongside the price action, Investing.com reported before Friday’s open that Cycurion had regained Nasdaq’s minimum bid price compliance. The report was published at 08:36 ET, ahead of the session’s open. The development is worth noting as context for the day. Still, the scale of the subsequent price swing is best read through the charts themselves rather than attributed solely to this report.
Bullish Scenario
For Cycurion stock to build on Friday’s advance, the first test is the daily 50-session EMA at $3.90. Price has not yet reclaimed this level on a closing basis. Clearing it, followed by the daily first resistance (R1) at $4.97, would mark a genuine extension of the move. Supporting evidence would include the daily MACD histogram continuing to widen on the positive side. RSI14 would need to hold above the mid-50s without racing into overbought extremes. The hourly chart would need to stay above its pivot at $3.74. If the 15-minute chart can reclaim its Bollinger mid-band at $3.91 and flip its MACD histogram back positive, the short-term pullback would have run its course. That would signal buyers are back in control.
Bearish Scenario
In contrast, the bearish case centers on a failure to hold ground already won. Losing the daily 20-session EMA at $3.26 would be the first warning sign. It would undermine the one daily average price currently sits above. Below that, the daily Bollinger mid-band at $3.19 and then daily first support (S1) at $2.66 become the levels to watch.
On the hourly chart, a break below the pivot at $3.74 and then support (S1) at $3.67 would weaken the near-term structure meaningfully. This is especially true with hourly RSI14 already elevated at 67.28 and vulnerable to a rollover. The negative 15-minute MACD histogram already hints at fading short-term momentum. If that weakness spreads to the hourly timeframe, the bullish 15-minute EMA stack could unwind quickly, given how far price extended in a single session.
Where Cycurion Stock Stands Now
Overall, Cycurion stock closed Friday’s session at $3.82, up sharply from the previous close of $2.69. The session ranged from $2.64 to $4.95 on volume of 48,818,864 shares. The daily chart shows improving but unconfirmed momentum. Price sits above its 20-session EMA yet still below both the 50-session EMA and the much higher 200-session EMA.
The hourly chart leans more constructively, with price above all three of its EMAs and a positive MACD reading. Meanwhile, the 15-minute chart shows a fully bullish EMA stack cooling into a short-term pullback. Key levels to track into the next session include the daily pivot at $3.80, hourly and 15-minute pivots at $3.74, and the wider daily range between support (S1) at $2.66 and resistance (R1) at $4.97.
Volatility remains elevated across every timeframe. With the daily ATR14 at $0.54 dwarfed by Friday’s own range, the next session could just as easily extend the move as retrace a portion of it. What remains uncertain is whether Friday’s advance marks the start of a sustained recovery or a single outsized session inside a longer-term downtrend still visible against the daily 200-session EMA.
FAQ
What are the key levels to watch for Cycurion stock in the next session?
The daily pivot sits at $3.80, with resistance (R1) at $4.97 and support (S1) at $2.66. On the hourly and 15-minute charts, the pivot is at $3.74, with R1 at $3.90 and S1 at $3.67. The daily 50-session EMA at $3.90 and 20-session EMA at $3.26 are also critical thresholds to monitor.
Is Cycurion stock’s rally technically sustainable?
The daily chart shows improving but unconfirmed momentum. Price is above the 20-session EMA ($3.26) but below the 50-session EMA ($3.90). Daily RSI14 at 56.78 is neutral-to-constructive, and the MACD histogram is positive at 0.07, though both MACD lines remain below zero. The hourly chart offers more conviction, with price above all three EMAs and a positive MACD reading. However, the 15-minute chart shows short-term momentum cooling, suggesting a pullback or consolidation may be needed before further gains.
What did the Nasdaq compliance news mean for Cycurion stock?
Investing.com reported before Friday’s open that Cycurion had regained Nasdaq’s minimum bid price compliance. The report was published at 08:36 ET. While the development provides important context for the session, the scale of the subsequent price swing is best read through the technical charts rather than attributed solely to this news.
Disclaimer: This article is for informational purposes only and does not constitute financial advice, an investment recommendation, or a solicitation to buy or sell any financial instrument or cryptocurrency. The analysis provided is not indicative of future results. Investing in crypto assets and financial markets carries a high risk of capital loss. Always do your own research (DYOR) and consult a qualified financial advisor before making any decision.
Article produced with the assistance of artificial intelligence and reviewed by the editorial team.
Cycurion stock surges 42% to $3.82, key resistance at $4.97 eyed for next session
Cycurion stock surged 42% on Friday, closing at $3.82 after an explosive session that swung between $2.64 and $4.95. Volume reached 48,818,864 shares.
CYCU — daily chart with candlesticks, EMA20/EMA50 and volume.
Key takeaways
Cycurion stock closed Friday at $3.82, up 42.01% from the previous close of $2.69, after ranging from $2.64 to $4.95.
Volume reached 48,818,864 shares.
Daily momentum is improving but unconfirmed — price sits above the 20-session EMA ($3.26) yet below the 50-session EMA ($3.90) and the 200-session EMA ($15.53).
Investing.com reported before Friday’s open that Cycurion regained Nasdaq’s minimum bid price compliance.
Key levels for the next session: daily pivot at $3.80, resistance (R1) at $4.97, support (S1) at $2.66.
Cycurion stock opened Friday at $2.98 and closed at $3.82, marking a 42.01% gain versus the previous close of $2.69 on October 1. Measured from its own open to its own close, the stock advanced 28.19% intraday. Volume came in at 48,818,864 shares.
A swing from $2.64 to $4.95 in a single session signals this was not a quiet grind higher. It was a volatility event. The daily average true range (ATR14) sits at $0.54. Friday’s range dwarfed that figure, confirming how stretched the session was relative to recent norms. Any near-term outlook for Cycurion stock must therefore balance the strength of the advance against the risk inherent in such an expansion.
Daily Chart: Momentum Improving, But Price Still Caught Between Averages
Price Position Relative to Key Averages
On the daily timeframe, price structure is mixed rather than cleanly bullish. The close of $3.82 sits above the 20-session EMA at $3.26, which is constructive. However, it remains below the 50-session EMA at $3.90, and well below the 200-session EMA at $15.53. This is not a stacked bullish trend. It is a market still working to repair a much larger average above it, with short-term momentum only recently turning positive.
Momentum Indicators Show Early Turn
Daily RSI14 reads 56.78, which is neutral-to-constructive, not overbought. The MACD line sits at -0.29 against a signal line of -0.36. That puts the line above its signal with a positive histogram of 0.07. Both lines remain below zero, however, so broader daily momentum is still technically negative, even as short-term momentum improves. The trend is not yet confirmed bullish — it is in the process of turning.
Bollinger Bands and Pivot Levels
The daily Bollinger setup adds another layer. Price at $3.82 sits just below the upper band at $3.86 and far above the mid-band at $3.19. That is a classic signature of a strong breakout day pressing against its own volatility envelope. Little room remains before the band itself must expand or price must pause. For the next session, the daily pivot sits at $3.80, with first resistance (R1) at $4.97 and first support (S1) at $2.66.
Hourly Timeframe Adds Partial Confirmation
On the 1-hour chart, Cycurion stock closed at $3.82 above all three EMAs. The 20-hour EMA sits at $3.27, the 50-hour at $3.09, and the 200-hour at $3.64. That is encouraging for bulls. However, the internal order is not a clean stack. The 200-hour EMA sits above both the 20-hour and 50-hour averages. Price is therefore pushing through a layered resistance zone rather than riding a fully aligned uptrend.
Momentum on this timeframe is more convincing. Hourly RSI14 stands at 67.28, approaching overbought territory without having crossed it. The hourly MACD line is at 0.27 versus a signal of 0.16. That puts the line above its signal with a positive histogram of 0.11 — both values are positive, marking a genuinely bullish momentum read. Meanwhile, the hourly pivot for the next session sits at $3.74, with resistance (R1) at $3.90 and support (S1) at $3.67. Price is positioned between the pivot and R1, leaning toward the upper half of that near-term range.
15-Minute View: A Short-Term Pullback Inside the Rally
The 15-minute chart is where the picture gets more interesting. Here, the EMAs are properly stacked bullish. Price at $3.82 sits above the 20-period EMA at $3.73. That sits above the 50-period EMA at $3.42, which in turn sits above the 200-period EMA at $3.12. This is the cleanest bullish alignment across all three timeframes.
Short-term momentum, however, is cooling. The 15-minute MACD line at 0.12 sits below its signal at 0.19, producing a negative histogram of -0.07. RSI14 reads 56.94, neutral. Price has also slipped below the 15-minute Bollinger mid-band at $3.91, though it remains above the lower band at $3.60. Taken together, this points to a short-term pullback or consolidation inside a broader intraday uptrend, rather than a reversal. The 15-minute pivot for the next session matches the hourly levels: pivot at $3.74, R1 at $3.90, S1 at $3.67.
Nasdaq Compliance News
Alongside the price action, Investing.com reported before Friday’s open that Cycurion had regained Nasdaq’s minimum bid price compliance. The report was published at 08:36 ET, ahead of the session’s open. The development is worth noting as context for the day. Still, the scale of the subsequent price swing is best read through the charts themselves rather than attributed solely to this report.
Bullish Scenario
For Cycurion stock to build on Friday’s advance, the first test is the daily 50-session EMA at $3.90. Price has not yet reclaimed this level on a closing basis. Clearing it, followed by the daily first resistance (R1) at $4.97, would mark a genuine extension of the move. Supporting evidence would include the daily MACD histogram continuing to widen on the positive side. RSI14 would need to hold above the mid-50s without racing into overbought extremes. The hourly chart would need to stay above its pivot at $3.74. If the 15-minute chart can reclaim its Bollinger mid-band at $3.91 and flip its MACD histogram back positive, the short-term pullback would have run its course. That would signal buyers are back in control.
Bearish Scenario
In contrast, the bearish case centers on a failure to hold ground already won. Losing the daily 20-session EMA at $3.26 would be the first warning sign. It would undermine the one daily average price currently sits above. Below that, the daily Bollinger mid-band at $3.19 and then daily first support (S1) at $2.66 become the levels to watch.
On the hourly chart, a break below the pivot at $3.74 and then support (S1) at $3.67 would weaken the near-term structure meaningfully. This is especially true with hourly RSI14 already elevated at 67.28 and vulnerable to a rollover. The negative 15-minute MACD histogram already hints at fading short-term momentum. If that weakness spreads to the hourly timeframe, the bullish 15-minute EMA stack could unwind quickly, given how far price extended in a single session.
Where Cycurion Stock Stands Now
Overall, Cycurion stock closed Friday’s session at $3.82, up sharply from the previous close of $2.69. The session ranged from $2.64 to $4.95 on volume of 48,818,864 shares. The daily chart shows improving but unconfirmed momentum. Price sits above its 20-session EMA yet still below both the 50-session EMA and the much higher 200-session EMA.
The hourly chart leans more constructively, with price above all three of its EMAs and a positive MACD reading. Meanwhile, the 15-minute chart shows a fully bullish EMA stack cooling into a short-term pullback. Key levels to track into the next session include the daily pivot at $3.80, hourly and 15-minute pivots at $3.74, and the wider daily range between support (S1) at $2.66 and resistance (R1) at $4.97.
Volatility remains elevated across every timeframe. With the daily ATR14 at $0.54 dwarfed by Friday’s own range, the next session could just as easily extend the move as retrace a portion of it. What remains uncertain is whether Friday’s advance marks the start of a sustained recovery or a single outsized session inside a longer-term downtrend still visible against the daily 200-session EMA.
FAQ
What are the key levels to watch for Cycurion stock in the next session?
The daily pivot sits at $3.80, with resistance (R1) at $4.97 and support (S1) at $2.66. On the hourly and 15-minute charts, the pivot is at $3.74, with R1 at $3.90 and S1 at $3.67. The daily 50-session EMA at $3.90 and 20-session EMA at $3.26 are also critical thresholds to monitor.
Is Cycurion stock’s rally technically sustainable?
The daily chart shows improving but unconfirmed momentum. Price is above the 20-session EMA ($3.26) but below the 50-session EMA ($3.90). Daily RSI14 at 56.78 is neutral-to-constructive, and the MACD histogram is positive at 0.07, though both MACD lines remain below zero. The hourly chart offers more conviction, with price above all three EMAs and a positive MACD reading. However, the 15-minute chart shows short-term momentum cooling, suggesting a pullback or consolidation may be needed before further gains.
What did the Nasdaq compliance news mean for Cycurion stock?
Investing.com reported before Friday’s open that Cycurion had regained Nasdaq’s minimum bid price compliance. The report was published at 08:36 ET. While the development provides important context for the session, the scale of the subsequent price swing is best read through the technical charts rather than attributed solely to this news.
Disclaimer: This article is for informational purposes only and does not constitute financial advice, an investment recommendation, or a solicitation to buy or sell any financial instrument or cryptocurrency. The analysis provided is not indicative of future results. Investing in crypto assets and financial markets carries a high risk of capital loss. Always do your own research (DYOR) and consult a qualified financial advisor before making any decision.
Article produced with the assistance of artificial intelligence and reviewed by the editorial team.
CYCU — daily chart with candlesticks, EMA20/EMA50 and volume.
Key takeaways
Cycurion stock closed Friday at $3.82, up 42.01% from the previous close of $2.69, after ranging from $2.64 to $4.95.
Volume reached 48,818,864 shares.
Daily momentum is improving but unconfirmed — price sits above the 20-session EMA ($3.26) yet below the 50-session EMA ($3.90) and the 200-session EMA ($15.53).
Investing.com reported before Friday’s open that Cycurion regained Nasdaq’s minimum bid price compliance.
Key levels for the next session: daily pivot at $3.80, resistance (R1) at $4.97, support (S1) at $2.66.
Cycurion stock opened Friday at $2.98 and closed at $3.82, marking a 42.01% gain versus the previous close of $2.69 on October 1. Measured from its own open to its own close, the stock advanced 28.19% intraday. Volume came in at 48,818,864 shares.
A swing from $2.64 to $4.95 in a single session signals this was not a quiet grind higher. It was a volatility event. The daily average true range (ATR14) sits at $0.54. Friday’s range dwarfed that figure, confirming how stretched the session was relative to recent norms. Any near-term outlook for Cycurion stock must therefore balance the strength of the advance against the risk inherent in such an expansion.
Daily Chart: Momentum Improving, But Price Still Caught Between Averages
Price Position Relative to Key Averages
On the daily timeframe, price structure is mixed rather than cleanly bullish. The close of $3.82 sits above the 20-session EMA at $3.26, which is constructive. However, it remains below the 50-session EMA at $3.90, and well below the 200-session EMA at $15.53. This is not a stacked bullish trend. It is a market still working to repair a much larger average above it, with short-term momentum only recently turning positive.
Momentum Indicators Show Early Turn
Daily RSI14 reads 56.78, which is neutral-to-constructive, not overbought. The MACD line sits at -0.29 against a signal line of -0.36. That puts the line above its signal with a positive histogram of 0.07. Both lines remain below zero, however, so broader daily momentum is still technically negative, even as short-term momentum improves. The trend is not yet confirmed bullish — it is in the process of turning.
Bollinger Bands and Pivot Levels
The daily Bollinger setup adds another layer. Price at $3.82 sits just below the upper band at $3.86 and far above the mid-band at $3.19. That is a classic signature of a strong breakout day pressing against its own volatility envelope. Little room remains before the band itself must expand or price must pause. For the next session, the daily pivot sits at $3.80, with first resistance (R1) at $4.97 and first support (S1) at $2.66.
Hourly Timeframe Adds Partial Confirmation
On the 1-hour chart, Cycurion stock closed at $3.82 above all three EMAs. The 20-hour EMA sits at $3.27, the 50-hour at $3.09, and the 200-hour at $3.64. That is encouraging for bulls. However, the internal order is not a clean stack. The 200-hour EMA sits above both the 20-hour and 50-hour averages. Price is therefore pushing through a layered resistance zone rather than riding a fully aligned uptrend.
Momentum on this timeframe is more convincing. Hourly RSI14 stands at 67.28, approaching overbought territory without having crossed it. The hourly MACD line is at 0.27 versus a signal of 0.16. That puts the line above its signal with a positive histogram of 0.11 — both values are positive, marking a genuinely bullish momentum read. Meanwhile, the hourly pivot for the next session sits at $3.74, with resistance (R1) at $3.90 and support (S1) at $3.67. Price is positioned between the pivot and R1, leaning toward the upper half of that near-term range.
15-Minute View: A Short-Term Pullback Inside the Rally
The 15-minute chart is where the picture gets more interesting. Here, the EMAs are properly stacked bullish. Price at $3.82 sits above the 20-period EMA at $3.73. That sits above the 50-period EMA at $3.42, which in turn sits above the 200-period EMA at $3.12. This is the cleanest bullish alignment across all three timeframes.
Short-term momentum, however, is cooling. The 15-minute MACD line at 0.12 sits below its signal at 0.19, producing a negative histogram of -0.07. RSI14 reads 56.94, neutral. Price has also slipped below the 15-minute Bollinger mid-band at $3.91, though it remains above the lower band at $3.60. Taken together, this points to a short-term pullback or consolidation inside a broader intraday uptrend, rather than a reversal. The 15-minute pivot for the next session matches the hourly levels: pivot at $3.74, R1 at $3.90, S1 at $3.67.
Nasdaq Compliance News
Alongside the price action, Investing.com reported before Friday’s open that Cycurion had regained Nasdaq’s minimum bid price compliance. The report was published at 08:36 ET, ahead of the session’s open. The development is worth noting as context for the day. Still, the scale of the subsequent price swing is best read through the charts themselves rather than attributed solely to this report.
Bullish Scenario
For Cycurion stock to build on Friday’s advance, the first test is the daily 50-session EMA at $3.90. Price has not yet reclaimed this level on a closing basis. Clearing it, followed by the daily first resistance (R1) at $4.97, would mark a genuine extension of the move. Supporting evidence would include the daily MACD histogram continuing to widen on the positive side. RSI14 would need to hold above the mid-50s without racing into overbought extremes. The hourly chart would need to stay above its pivot at $3.74. If the 15-minute chart can reclaim its Bollinger mid-band at $3.91 and flip its MACD histogram back positive, the short-term pullback would have run its course. That would signal buyers are back in control.
Bearish Scenario
In contrast, the bearish case centers on a failure to hold ground already won. Losing the daily 20-session EMA at $3.26 would be the first warning sign. It would undermine the one daily average price currently sits above. Below that, the daily Bollinger mid-band at $3.19 and then daily first support (S1) at $2.66 become the levels to watch.
On the hourly chart, a break below the pivot at $3.74 and then support (S1) at $3.67 would weaken the near-term structure meaningfully. This is especially true with hourly RSI14 already elevated at 67.28 and vulnerable to a rollover. The negative 15-minute MACD histogram already hints at fading short-term momentum. If that weakness spreads to the hourly timeframe, the bullish 15-minute EMA stack could unwind quickly, given how far price extended in a single session.
Where Cycurion Stock Stands Now
Overall, Cycurion stock closed Friday’s session at $3.82, up sharply from the previous close of $2.69. The session ranged from $2.64 to $4.95 on volume of 48,818,864 shares. The daily chart shows improving but unconfirmed momentum. Price sits above its 20-session EMA yet still below both the 50-session EMA and the much higher 200-session EMA.
The hourly chart leans more constructively, with price above all three of its EMAs and a positive MACD reading. Meanwhile, the 15-minute chart shows a fully bullish EMA stack cooling into a short-term pullback. Key levels to track into the next session include the daily pivot at $3.80, hourly and 15-minute pivots at $3.74, and the wider daily range between support (S1) at $2.66 and resistance (R1) at $4.97.
Volatility remains elevated across every timeframe. With the daily ATR14 at $0.54 dwarfed by Friday’s own range, the next session could just as easily extend the move as retrace a portion of it. What remains uncertain is whether Friday’s advance marks the start of a sustained recovery or a single outsized session inside a longer-term downtrend still visible against the daily 200-session EMA.
FAQ
What are the key levels to watch for Cycurion stock in the next session?
The daily pivot sits at $3.80, with resistance (R1) at $4.97 and support (S1) at $2.66. On the hourly and 15-minute charts, the pivot is at $3.74, with R1 at $3.90 and S1 at $3.67. The daily 50-session EMA at $3.90 and 20-session EMA at $3.26 are also critical thresholds to monitor.
Is Cycurion stock’s rally technically sustainable?
The daily chart shows improving but unconfirmed momentum. Price is above the 20-session EMA ($3.26) but below the 50-session EMA ($3.90). Daily RSI14 at 56.78 is neutral-to-constructive, and the MACD histogram is positive at 0.07, though both MACD lines remain below zero. The hourly chart offers more conviction, with price above all three EMAs and a positive MACD reading. However, the 15-minute chart shows short-term momentum cooling, suggesting a pullback or consolidation may be needed before further gains.
What did the Nasdaq compliance news mean for Cycurion stock?
Investing.com reported before Friday’s open that Cycurion had regained Nasdaq’s minimum bid price compliance. The report was published at 08:36 ET. While the development provides important context for the session, the scale of the subsequent price swing is best read through the technical charts rather than attributed solely to this news.
Disclaimer: This article is for informational purposes only and does not constitute financial advice, an investment recommendation, or a solicitation to buy or sell any financial instrument or cryptocurrency. The analysis provided is not indicative of future results. Investing in crypto assets and financial markets carries a high risk of capital loss. Always do your own research (DYOR) and consult a qualified financial advisor before making any decision.
Article produced with the assistance of artificial intelligence and reviewed by the editorial team.
14

Article
See translation
Space Exploration Technologies stock jumps 7.35% to $158.96, breaks Bollinger bandSpace Exploration Technologies stock (SPCX) closed Friday at $158.96, surging 7.35% from Thursday’s $148.07 close. The session spanned $149.34 to $159.84. An intraday gain of roughly 6.28% from the open confirmed most of the advance built during the session itself.
SPCX — daily chart with candlesticks, EMA20/EMA50 and volume.
Key takeaways
SPCX jumped 7.35% on Friday, closing at $158.96 on a session range of $149.34 to $159.84.
Price closed above the daily Bollinger upper band at $157.11, signaling an extended breakout.
Daily RSI14 at 61.48 remains bullish but below overbought territory above 70.
Hourly EMAs form a clean stacked bullish alignment: 20-hour above 50-hour above 200-hour.
Daily MACD histogram at -0.03 shows mild momentum divergence despite the breakout.
The daily chart anchors the broader read and is unambiguously bullish, if somewhat stretched. Friday’s close sits above both the 20-session EMA at $148.96 and the 50-session EMA at $146.35. Price trading above both averages signals constructive positioning, though without the longer-term average in view it stops short of a full stacked trend signal. The daily RSI14 reads 61.48, firmly bullish but still shy of overbought territory above 70 — leaving room before momentum becomes technically stretched on that measure alone.
Daily Breakout Pushes Space Exploration Technologies Stock Above the Bollinger Band
Space Exploration Technologies stock closed above its daily Bollinger upper band on Friday, confirming the breakout is extended. The mid-band sits at $150.13, with the upper band at $157.11 and the lower band at $143.15. Friday’s close at $158.96 landed above the upper band entirely — a sign of a high-velocity move rather than a routine grind higher. The daily ATR14 reads 6.83, consistent with a session that produced roughly a $10 range from low to high, well above typical daily movement.
However, the daily MACD introduces a note of caution. The line sits at 2.62, just below the signal at 2.65, producing a negative histogram reading of -0.03. In practice, momentum on the daily timeframe is only marginally negative even as price pushed to new highs. This represents a mild divergence worth watching rather than a reversal signal. For the next session, the daily pivot sits at $156.05, with first resistance at $162.75 and first support at $152.25.
Hourly Momentum Confirms the Uptrend
Turning to the hourly chart, the picture strengthens the bullish case with a clean stacked EMA alignment. Price sits above the 20-hour EMA at $154.10, which sits above the 50-hour EMA at $151.80, which in turn sits above the 200-hour EMA at $146.59. The hourly RSI14 reads 67.89, pushing closer to overbought but not yet there. Meanwhile, the hourly MACD line at 2.44 sits comfortably above its signal at 1.65, producing a positive histogram of 0.79.
That contrast matters. On the hourly chart, the MACD histogram stands at 0.79, in contrast to the softer daily MACD reading. This suggests the pullback in daily momentum is a short-term wrinkle inside a stronger intraday trend — not the start of a broader rollover. The hourly Bollinger bands run from a lower band of $146.02 to an upper band of $160.56, with the mid-band at $153.29. Friday’s close sits below the upper band, leaving some room before the hourly chart becomes as stretched as the daily one. For the next session, the hourly pivot sits at $159.22, with resistance at $159.58 and support at $158.59. Price closed just below that pivot, holding above first support.
15-Minute Chart: Execution Context
On the 15-minute timeframe, the same bullish stack repeats: price above the 20-period EMA at $157.79, above the 50-period EMA at $155.28, above the 200-period EMA at $152.18. The 15-minute RSI14 reads 66.06. However, the MACD line at 1.43 sits just below its signal at 1.54, with a histogram of -0.11. That small negative reading echoes the daily divergence on a much shorter horizon, hinting at a short-term pause in momentum even as the broader structure stays bullish. The 15-minute pivot levels mirror the hourly ones — pivot at $159.22, resistance at $159.58, support at $158.59 — useful markers for anyone timing entries around Monday’s open.
Bullish Scenario
The bullish case builds from here if price can clear the hourly and 15-minute pivot at $159.22 and then resistance at $159.58, pushing toward the daily resistance at $162.75. A reacceleration in the daily MACD histogram back above zero, combined with RSI14 readings staying below overbought extremes on both daily and hourly charts, would support a continuation rather than an exhaustion move. Holding above the daily Bollinger upper band at $157.11 on a closing basis would also reinforce that the breakout has follow-through rather than being a one-day spike.
Bearish Risk
On the other hand, the bearish risk centers on a failure to hold the hourly and 15-minute support at $158.59. A break below that level, followed by a retreat toward the daily pivot at $156.05, would suggest the Friday extension was overdone. A close back inside the daily Bollinger band — below $157.11 — would meaningfully weaken the breakout thesis. That risk intensifies if the daily MACD histogram deepens further into negative territory. In that scenario, the daily EMA20 at $148.96 and EMA50 at $146.35 would become the next levels to watch for support.
News Backdrop
Meanwhile, recent coverage adds context without changing the technical picture. A report from Investing.com, published during Friday’s session, flagged the stock’s roughly 6% intraday advance, though it did not specify a catalyst beyond the question itself. Separately, Seeking Alpha published a piece before Friday’s open framing Starship’s reusability as a potential enabler of orbital data centers. Another piece two days earlier argued Starship’s orbital launch progress could boost Starlink V3 capacity, maintaining a Buy view. A Yahoo Finance item from the same day cited a fund letter describing SpaceX as benefiting from strong growth and expanding demand. Three days before the session, a separate Yahoo Finance report covered comments attributed to Musk on X warning that Delta could lose customers over a Starlink dispute, while noting United already has over 600 jets connected. None of these items state a direct link to Friday’s price action, so they should be read as background rather than an explanation for the move.
Closing Take
Overall, Space Exploration Technologies stock enters the next session sitting above its daily Bollinger upper band at $157.11. It rests just below the hourly pivot at $159.22, with elevated volatility reflected in a daily ATR14 of 6.83. The hourly and 15-minute charts confirm the bullish structure with clean EMA alignment. Still, both the daily and 15-minute MACD histograms show mild momentum cooling. Whether Friday’s extension continues toward daily resistance at $162.75 or cools into a retest of the $158.59–$156.05 zone remains the open question heading into the next session.
FAQ
What are the key levels to watch for SPCX in the next session?
The daily pivot sits at $156.05, with first resistance at $162.75 and first support at $152.25. On the hourly and 15-minute charts, the pivot is $159.22, with resistance at $159.58 and support at $158.59. Price closed just below the hourly pivot, holding above first support.
Is the SPCX breakout above the daily Bollinger band sustainable?
The breakout is confirmed but extended. Holding above the daily upper band at $157.11 on a closing basis would signal follow-through. A close back below that level would weaken the breakout thesis. The daily RSI14 at 61.48 leaves room before overbought territory, but the mildly negative daily MACD histogram at -0.03 warrants caution.
What does the negative daily MACD histogram mean for SPCX?
The daily MACD line at 2.62 sits just below its signal at 2.65, producing a histogram of -0.03. This indicates only marginally negative momentum despite the price breakout — a mild divergence to monitor rather than an outright reversal signal. In contrast, the hourly MACD histogram stands at 0.79.
Disclaimer: This article is for informational purposes only and does not constitute financial advice, an investment recommendation, or a solicitation to buy or sell any financial instrument or cryptocurrency. The analysis provided is not indicative of future results. Investing in crypto assets and financial markets carries a high risk of capital loss. Always do your own research (DYOR) and consult a qualified financial advisor before making any decision.
Article produced with the assistance of artificial intelligence and reviewed by the editorial team.
Space Exploration Technologies stock jumps 7.35% to $158.96, breaks Bollinger band
Space Exploration Technologies stock (SPCX) closed Friday at $158.96, surging 7.35% from Thursday’s $148.07 close. The session spanned $149.34 to $159.84. An intraday gain of roughly 6.28% from the open confirmed most of the advance built during the session itself.
SPCX — daily chart with candlesticks, EMA20/EMA50 and volume.
Key takeaways
SPCX jumped 7.35% on Friday, closing at $158.96 on a session range of $149.34 to $159.84.
Price closed above the daily Bollinger upper band at $157.11, signaling an extended breakout.
Daily RSI14 at 61.48 remains bullish but below overbought territory above 70.
Hourly EMAs form a clean stacked bullish alignment: 20-hour above 50-hour above 200-hour.
Daily MACD histogram at -0.03 shows mild momentum divergence despite the breakout.
The daily chart anchors the broader read and is unambiguously bullish, if somewhat stretched. Friday’s close sits above both the 20-session EMA at $148.96 and the 50-session EMA at $146.35. Price trading above both averages signals constructive positioning, though without the longer-term average in view it stops short of a full stacked trend signal. The daily RSI14 reads 61.48, firmly bullish but still shy of overbought territory above 70 — leaving room before momentum becomes technically stretched on that measure alone.
Daily Breakout Pushes Space Exploration Technologies Stock Above the Bollinger Band
Space Exploration Technologies stock closed above its daily Bollinger upper band on Friday, confirming the breakout is extended. The mid-band sits at $150.13, with the upper band at $157.11 and the lower band at $143.15. Friday’s close at $158.96 landed above the upper band entirely — a sign of a high-velocity move rather than a routine grind higher. The daily ATR14 reads 6.83, consistent with a session that produced roughly a $10 range from low to high, well above typical daily movement.
However, the daily MACD introduces a note of caution. The line sits at 2.62, just below the signal at 2.65, producing a negative histogram reading of -0.03. In practice, momentum on the daily timeframe is only marginally negative even as price pushed to new highs. This represents a mild divergence worth watching rather than a reversal signal. For the next session, the daily pivot sits at $156.05, with first resistance at $162.75 and first support at $152.25.
Hourly Momentum Confirms the Uptrend
Turning to the hourly chart, the picture strengthens the bullish case with a clean stacked EMA alignment. Price sits above the 20-hour EMA at $154.10, which sits above the 50-hour EMA at $151.80, which in turn sits above the 200-hour EMA at $146.59. The hourly RSI14 reads 67.89, pushing closer to overbought but not yet there. Meanwhile, the hourly MACD line at 2.44 sits comfortably above its signal at 1.65, producing a positive histogram of 0.79.
That contrast matters. On the hourly chart, the MACD histogram stands at 0.79, in contrast to the softer daily MACD reading. This suggests the pullback in daily momentum is a short-term wrinkle inside a stronger intraday trend — not the start of a broader rollover. The hourly Bollinger bands run from a lower band of $146.02 to an upper band of $160.56, with the mid-band at $153.29. Friday’s close sits below the upper band, leaving some room before the hourly chart becomes as stretched as the daily one. For the next session, the hourly pivot sits at $159.22, with resistance at $159.58 and support at $158.59. Price closed just below that pivot, holding above first support.
15-Minute Chart: Execution Context
On the 15-minute timeframe, the same bullish stack repeats: price above the 20-period EMA at $157.79, above the 50-period EMA at $155.28, above the 200-period EMA at $152.18. The 15-minute RSI14 reads 66.06. However, the MACD line at 1.43 sits just below its signal at 1.54, with a histogram of -0.11. That small negative reading echoes the daily divergence on a much shorter horizon, hinting at a short-term pause in momentum even as the broader structure stays bullish. The 15-minute pivot levels mirror the hourly ones — pivot at $159.22, resistance at $159.58, support at $158.59 — useful markers for anyone timing entries around Monday’s open.
Bullish Scenario
The bullish case builds from here if price can clear the hourly and 15-minute pivot at $159.22 and then resistance at $159.58, pushing toward the daily resistance at $162.75. A reacceleration in the daily MACD histogram back above zero, combined with RSI14 readings staying below overbought extremes on both daily and hourly charts, would support a continuation rather than an exhaustion move. Holding above the daily Bollinger upper band at $157.11 on a closing basis would also reinforce that the breakout has follow-through rather than being a one-day spike.
Bearish Risk
On the other hand, the bearish risk centers on a failure to hold the hourly and 15-minute support at $158.59. A break below that level, followed by a retreat toward the daily pivot at $156.05, would suggest the Friday extension was overdone. A close back inside the daily Bollinger band — below $157.11 — would meaningfully weaken the breakout thesis. That risk intensifies if the daily MACD histogram deepens further into negative territory. In that scenario, the daily EMA20 at $148.96 and EMA50 at $146.35 would become the next levels to watch for support.
News Backdrop
Meanwhile, recent coverage adds context without changing the technical picture. A report from Investing.com, published during Friday’s session, flagged the stock’s roughly 6% intraday advance, though it did not specify a catalyst beyond the question itself. Separately, Seeking Alpha published a piece before Friday’s open framing Starship’s reusability as a potential enabler of orbital data centers. Another piece two days earlier argued Starship’s orbital launch progress could boost Starlink V3 capacity, maintaining a Buy view. A Yahoo Finance item from the same day cited a fund letter describing SpaceX as benefiting from strong growth and expanding demand. Three days before the session, a separate Yahoo Finance report covered comments attributed to Musk on X warning that Delta could lose customers over a Starlink dispute, while noting United already has over 600 jets connected. None of these items state a direct link to Friday’s price action, so they should be read as background rather than an explanation for the move.
Closing Take
Overall, Space Exploration Technologies stock enters the next session sitting above its daily Bollinger upper band at $157.11. It rests just below the hourly pivot at $159.22, with elevated volatility reflected in a daily ATR14 of 6.83. The hourly and 15-minute charts confirm the bullish structure with clean EMA alignment. Still, both the daily and 15-minute MACD histograms show mild momentum cooling. Whether Friday’s extension continues toward daily resistance at $162.75 or cools into a retest of the $158.59–$156.05 zone remains the open question heading into the next session.
FAQ
What are the key levels to watch for SPCX in the next session?
The daily pivot sits at $156.05, with first resistance at $162.75 and first support at $152.25. On the hourly and 15-minute charts, the pivot is $159.22, with resistance at $159.58 and support at $158.59. Price closed just below the hourly pivot, holding above first support.
Is the SPCX breakout above the daily Bollinger band sustainable?
The breakout is confirmed but extended. Holding above the daily upper band at $157.11 on a closing basis would signal follow-through. A close back below that level would weaken the breakout thesis. The daily RSI14 at 61.48 leaves room before overbought territory, but the mildly negative daily MACD histogram at -0.03 warrants caution.
What does the negative daily MACD histogram mean for SPCX?
The daily MACD line at 2.62 sits just below its signal at 2.65, producing a histogram of -0.03. This indicates only marginally negative momentum despite the price breakout — a mild divergence to monitor rather than an outright reversal signal. In contrast, the hourly MACD histogram stands at 0.79.
Disclaimer: This article is for informational purposes only and does not constitute financial advice, an investment recommendation, or a solicitation to buy or sell any financial instrument or cryptocurrency. The analysis provided is not indicative of future results. Investing in crypto assets and financial markets carries a high risk of capital loss. Always do your own research (DYOR) and consult a qualified financial advisor before making any decision.
Article produced with the assistance of artificial intelligence and reviewed by the editorial team.
SPCX — daily chart with candlesticks, EMA20/EMA50 and volume.
Key takeaways
SPCX jumped 7.35% on Friday, closing at $158.96 on a session range of $149.34 to $159.84.
Price closed above the daily Bollinger upper band at $157.11, signaling an extended breakout.
Daily RSI14 at 61.48 remains bullish but below overbought territory above 70.
Hourly EMAs form a clean stacked bullish alignment: 20-hour above 50-hour above 200-hour.
Daily MACD histogram at -0.03 shows mild momentum divergence despite the breakout.
The daily chart anchors the broader read and is unambiguously bullish, if somewhat stretched. Friday’s close sits above both the 20-session EMA at $148.96 and the 50-session EMA at $146.35. Price trading above both averages signals constructive positioning, though without the longer-term average in view it stops short of a full stacked trend signal. The daily RSI14 reads 61.48, firmly bullish but still shy of overbought territory above 70 — leaving room before momentum becomes technically stretched on that measure alone.
Daily Breakout Pushes Space Exploration Technologies Stock Above the Bollinger Band
Space Exploration Technologies stock closed above its daily Bollinger upper band on Friday, confirming the breakout is extended. The mid-band sits at $150.13, with the upper band at $157.11 and the lower band at $143.15. Friday’s close at $158.96 landed above the upper band entirely — a sign of a high-velocity move rather than a routine grind higher. The daily ATR14 reads 6.83, consistent with a session that produced roughly a $10 range from low to high, well above typical daily movement.
However, the daily MACD introduces a note of caution. The line sits at 2.62, just below the signal at 2.65, producing a negative histogram reading of -0.03. In practice, momentum on the daily timeframe is only marginally negative even as price pushed to new highs. This represents a mild divergence worth watching rather than a reversal signal. For the next session, the daily pivot sits at $156.05, with first resistance at $162.75 and first support at $152.25.
Hourly Momentum Confirms the Uptrend
Turning to the hourly chart, the picture strengthens the bullish case with a clean stacked EMA alignment. Price sits above the 20-hour EMA at $154.10, which sits above the 50-hour EMA at $151.80, which in turn sits above the 200-hour EMA at $146.59. The hourly RSI14 reads 67.89, pushing closer to overbought but not yet there. Meanwhile, the hourly MACD line at 2.44 sits comfortably above its signal at 1.65, producing a positive histogram of 0.79.
That contrast matters. On the hourly chart, the MACD histogram stands at 0.79, in contrast to the softer daily MACD reading. This suggests the pullback in daily momentum is a short-term wrinkle inside a stronger intraday trend — not the start of a broader rollover. The hourly Bollinger bands run from a lower band of $146.02 to an upper band of $160.56, with the mid-band at $153.29. Friday’s close sits below the upper band, leaving some room before the hourly chart becomes as stretched as the daily one. For the next session, the hourly pivot sits at $159.22, with resistance at $159.58 and support at $158.59. Price closed just below that pivot, holding above first support.
15-Minute Chart: Execution Context
On the 15-minute timeframe, the same bullish stack repeats: price above the 20-period EMA at $157.79, above the 50-period EMA at $155.28, above the 200-period EMA at $152.18. The 15-minute RSI14 reads 66.06. However, the MACD line at 1.43 sits just below its signal at 1.54, with a histogram of -0.11. That small negative reading echoes the daily divergence on a much shorter horizon, hinting at a short-term pause in momentum even as the broader structure stays bullish. The 15-minute pivot levels mirror the hourly ones — pivot at $159.22, resistance at $159.58, support at $158.59 — useful markers for anyone timing entries around Monday’s open.
Bullish Scenario
The bullish case builds from here if price can clear the hourly and 15-minute pivot at $159.22 and then resistance at $159.58, pushing toward the daily resistance at $162.75. A reacceleration in the daily MACD histogram back above zero, combined with RSI14 readings staying below overbought extremes on both daily and hourly charts, would support a continuation rather than an exhaustion move. Holding above the daily Bollinger upper band at $157.11 on a closing basis would also reinforce that the breakout has follow-through rather than being a one-day spike.
Bearish Risk
On the other hand, the bearish risk centers on a failure to hold the hourly and 15-minute support at $158.59. A break below that level, followed by a retreat toward the daily pivot at $156.05, would suggest the Friday extension was overdone. A close back inside the daily Bollinger band — below $157.11 — would meaningfully weaken the breakout thesis. That risk intensifies if the daily MACD histogram deepens further into negative territory. In that scenario, the daily EMA20 at $148.96 and EMA50 at $146.35 would become the next levels to watch for support.
News Backdrop
Meanwhile, recent coverage adds context without changing the technical picture. A report from Investing.com, published during Friday’s session, flagged the stock’s roughly 6% intraday advance, though it did not specify a catalyst beyond the question itself. Separately, Seeking Alpha published a piece before Friday’s open framing Starship’s reusability as a potential enabler of orbital data centers. Another piece two days earlier argued Starship’s orbital launch progress could boost Starlink V3 capacity, maintaining a Buy view. A Yahoo Finance item from the same day cited a fund letter describing SpaceX as benefiting from strong growth and expanding demand. Three days before the session, a separate Yahoo Finance report covered comments attributed to Musk on X warning that Delta could lose customers over a Starlink dispute, while noting United already has over 600 jets connected. None of these items state a direct link to Friday’s price action, so they should be read as background rather than an explanation for the move.
Closing Take
Overall, Space Exploration Technologies stock enters the next session sitting above its daily Bollinger upper band at $157.11. It rests just below the hourly pivot at $159.22, with elevated volatility reflected in a daily ATR14 of 6.83. The hourly and 15-minute charts confirm the bullish structure with clean EMA alignment. Still, both the daily and 15-minute MACD histograms show mild momentum cooling. Whether Friday’s extension continues toward daily resistance at $162.75 or cools into a retest of the $158.59–$156.05 zone remains the open question heading into the next session.
FAQ
What are the key levels to watch for SPCX in the next session?
The daily pivot sits at $156.05, with first resistance at $162.75 and first support at $152.25. On the hourly and 15-minute charts, the pivot is $159.22, with resistance at $159.58 and support at $158.59. Price closed just below the hourly pivot, holding above first support.
Is the SPCX breakout above the daily Bollinger band sustainable?
The breakout is confirmed but extended. Holding above the daily upper band at $157.11 on a closing basis would signal follow-through. A close back below that level would weaken the breakout thesis. The daily RSI14 at 61.48 leaves room before overbought territory, but the mildly negative daily MACD histogram at -0.03 warrants caution.
What does the negative daily MACD histogram mean for SPCX?
The daily MACD line at 2.62 sits just below its signal at 2.65, producing a histogram of -0.03. This indicates only marginally negative momentum despite the price breakout — a mild divergence to monitor rather than an outright reversal signal. In contrast, the hourly MACD histogram stands at 0.79.
Disclaimer: This article is for informational purposes only and does not constitute financial advice, an investment recommendation, or a solicitation to buy or sell any financial instrument or cryptocurrency. The analysis provided is not indicative of future results. Investing in crypto assets and financial markets carries a high risk of capital loss. Always do your own research (DYOR) and consult a qualified financial advisor before making any decision.
Article produced with the assistance of artificial intelligence and reviewed by the editorial team.
398

Article
See translation
Aave’s Ghost Pass code ‘FRIDAY’ unlocks early mobile app accessAave has rolled out a limited-time Ghost Pass code that lets crypto users jump the line and get Aave mobile app access before the platform’s full public rollout. The code, simply the word “FRIDAY,” was shared through Aave’s official account on X and grants instant entry to the app for as long as supplies last. It’s a small move on paper, but it says a lot about how DeFi platforms are now courting users the same way consumer tech brands do: through scarcity, social buzz, and early-access hype.
Key takeaways
Aave introduced a promotional Ghost Pass code, “FRIDAY,” offering instant access to its mobile app.
The code works only while supplies last and was announced via Aave’s official X account.
The promo is designed to boost user engagement ahead of the app’s full launch.
Aave is a decentralized finance protocol that lets users lend and borrow crypto without intermediaries.
The announcement drew notable social media interaction, with 69 likes and 14 retweets recorded at the time of reporting.
Aave Launches Ghost Pass Code for Early Mobile App Access
The headline development here is straightforward: Aave is giving a slice of its community a shortcut into its upcoming mobile app. Instead of waiting for a broader release, users who grab the Ghost Pass code can skip the queue entirely.
Code ‘FRIDAY’ provides instant access while supplies last
The mechanism is simple. Anyone who enters “FRIDAY” gets immediate entry into the Aave mobile app, but only until the available passes run out. That built-in scarcity is doing a lot of the marketing work — it turns a routine product update into something people feel they need to act on quickly, rather than a feature they’ll get around to eventually.
Purpose and Promotion of the Ghost Pass Initiative
Aave’s goal with the Ghost Pass push is to generate momentum before the mobile app’s official debut, turning early adopters into a kind of built-in testing and marketing group. This matters because user engagement ahead of a launch often sets the tone for how an app performs once it’s fully live — a strong early crowd can create the word-of-mouth that drives adoption later.
Boosting user engagement ahead of full app release
By rewarding people who want in early, Aave is effectively using its most engaged users as an informal preview audience. This kind of pre-launch engagement strategy is common in tech circles, but it’s less typical in DeFi, where protocols have historically leaned on token incentives rather than access-based hype.
Announcement through official Aave account on X
Aave kept the announcement centralized, posting the Ghost Pass code directly through its official X account rather than scattering it across multiple channels. That approach let the company track reaction in one place — and the numbers suggest people noticed, with the post pulling in 69 likes and 14 retweets.
Aave’s Role as a DeFi Protocol and App Objectives
Aave operates as a decentralized finance protocol, letting users lend and borrow cryptocurrencies directly with each other, without banks or other middlemen standing in the way. That peer-to-peer structure is the foundation of what the new mobile app is trying to extend to a mobile-first audience.
Overview of Aave’s decentralized finance functionality
At its core, Aave’s system runs on smart contracts that match lenders and borrowers automatically, cutting out the traditional financial intermediary entirely. This is the same functionality that’s powered Aave’s growth across the broader DeFi space for years, and it remains the backbone of everything the company builds on top of it.
Mobile app simplifies access to DeFi lending and borrowing
The mobile app itself is built to make that lending-and-borrowing experience easier to reach, particularly for people who’d rather manage their crypto activity from a phone than a desktop browser. Simplifying that entry point matters because mobile usage has become the default way many people interact with financial apps generally, and DeFi platforms that lag on mobile risk losing users to competitors who don’t.
Market Context and User Engagement Signals
Why does a single promo code deserve attention? Because it’s a visible signal of how Aave is trying to stand out in a crowded, mixed-signal crypto market. The Ghost Pass announcement landed amid broader market conditions described as mixed, and Aave’s response was to focus on something it can control directly: how engaged its own user base feels.
Social media response and community interest
The engagement numbers — 69 likes and 14 retweets — aren’t massive by viral standards, but they do point to real community interest in getting early access. For a product that hasn’t fully launched yet, that kind of organic reaction is a useful gauge of appetite ahead of a wider rollout.
Strategic positioning amid mixed crypto market conditions
Offering early, scarce access during a period of mixed market sentiment suggests Aave is trying to build loyalty now, rather than waiting for ideal market conditions to make its move. This reflects a pattern across DeFi more broadly: platforms are increasingly leaning on user experience and engagement tactics, not just token rewards, to stand out in a competitive landscape.
Considerations and What to Watch
The real test comes once the mobile app moves past this early-access phase. How smoothly the Ghost Pass users’ experience translates into word-of-mouth adoption will say a lot about whether this kind of access-based promotion actually works for DeFi platforms, or whether it’s just a short-lived bump in attention.
Potential impact on adoption and user experience
If the feedback from early Ghost Pass users is positive, Aave could see a smoother path to wider adoption once the app opens up fully. On the other hand, any technical hiccups during this early phase could create friction that shapes public perception before the app even reaches its broader audience.
Uncertainties about supply, technical issues, and market effects
There’s no public detail yet on exactly how many Ghost Pass codes are available or how long the promotion will run, and no trading volume data for the Aave token was available at the time of this report. Those are details worth watching as Aave moves toward a full public launch of its mobile app.
Article produced with the assistance of artificial intelligence and reviewed by the editorial team.
Aave’s Ghost Pass code ‘FRIDAY’ unlocks early mobile app access
Aave has rolled out a limited-time Ghost Pass code that lets crypto users jump the line and get Aave mobile app access before the platform’s full public rollout. The code, simply the word “FRIDAY,” was shared through Aave’s official account on X and grants instant entry to the app for as long as supplies last. It’s a small move on paper, but it says a lot about how DeFi platforms are now courting users the same way consumer tech brands do: through scarcity, social buzz, and early-access hype.
Key takeaways
Aave introduced a promotional Ghost Pass code, “FRIDAY,” offering instant access to its mobile app.
The code works only while supplies last and was announced via Aave’s official X account.
The promo is designed to boost user engagement ahead of the app’s full launch.
Aave is a decentralized finance protocol that lets users lend and borrow crypto without intermediaries.
The announcement drew notable social media interaction, with 69 likes and 14 retweets recorded at the time of reporting.
Aave Launches Ghost Pass Code for Early Mobile App Access
The headline development here is straightforward: Aave is giving a slice of its community a shortcut into its upcoming mobile app. Instead of waiting for a broader release, users who grab the Ghost Pass code can skip the queue entirely.
Code ‘FRIDAY’ provides instant access while supplies last
The mechanism is simple. Anyone who enters “FRIDAY” gets immediate entry into the Aave mobile app, but only until the available passes run out. That built-in scarcity is doing a lot of the marketing work — it turns a routine product update into something people feel they need to act on quickly, rather than a feature they’ll get around to eventually.
Purpose and Promotion of the Ghost Pass Initiative
Aave’s goal with the Ghost Pass push is to generate momentum before the mobile app’s official debut, turning early adopters into a kind of built-in testing and marketing group. This matters because user engagement ahead of a launch often sets the tone for how an app performs once it’s fully live — a strong early crowd can create the word-of-mouth that drives adoption later.
Boosting user engagement ahead of full app release
By rewarding people who want in early, Aave is effectively using its most engaged users as an informal preview audience. This kind of pre-launch engagement strategy is common in tech circles, but it’s less typical in DeFi, where protocols have historically leaned on token incentives rather than access-based hype.
Announcement through official Aave account on X
Aave kept the announcement centralized, posting the Ghost Pass code directly through its official X account rather than scattering it across multiple channels. That approach let the company track reaction in one place — and the numbers suggest people noticed, with the post pulling in 69 likes and 14 retweets.
Aave’s Role as a DeFi Protocol and App Objectives
Aave operates as a decentralized finance protocol, letting users lend and borrow cryptocurrencies directly with each other, without banks or other middlemen standing in the way. That peer-to-peer structure is the foundation of what the new mobile app is trying to extend to a mobile-first audience.
Overview of Aave’s decentralized finance functionality
At its core, Aave’s system runs on smart contracts that match lenders and borrowers automatically, cutting out the traditional financial intermediary entirely. This is the same functionality that’s powered Aave’s growth across the broader DeFi space for years, and it remains the backbone of everything the company builds on top of it.
Mobile app simplifies access to DeFi lending and borrowing
The mobile app itself is built to make that lending-and-borrowing experience easier to reach, particularly for people who’d rather manage their crypto activity from a phone than a desktop browser. Simplifying that entry point matters because mobile usage has become the default way many people interact with financial apps generally, and DeFi platforms that lag on mobile risk losing users to competitors who don’t.
Market Context and User Engagement Signals
Why does a single promo code deserve attention? Because it’s a visible signal of how Aave is trying to stand out in a crowded, mixed-signal crypto market. The Ghost Pass announcement landed amid broader market conditions described as mixed, and Aave’s response was to focus on something it can control directly: how engaged its own user base feels.
Social media response and community interest
The engagement numbers — 69 likes and 14 retweets — aren’t massive by viral standards, but they do point to real community interest in getting early access. For a product that hasn’t fully launched yet, that kind of organic reaction is a useful gauge of appetite ahead of a wider rollout.
Strategic positioning amid mixed crypto market conditions
Offering early, scarce access during a period of mixed market sentiment suggests Aave is trying to build loyalty now, rather than waiting for ideal market conditions to make its move. This reflects a pattern across DeFi more broadly: platforms are increasingly leaning on user experience and engagement tactics, not just token rewards, to stand out in a competitive landscape.
Considerations and What to Watch
The real test comes once the mobile app moves past this early-access phase. How smoothly the Ghost Pass users’ experience translates into word-of-mouth adoption will say a lot about whether this kind of access-based promotion actually works for DeFi platforms, or whether it’s just a short-lived bump in attention.
Potential impact on adoption and user experience
If the feedback from early Ghost Pass users is positive, Aave could see a smoother path to wider adoption once the app opens up fully. On the other hand, any technical hiccups during this early phase could create friction that shapes public perception before the app even reaches its broader audience.
Uncertainties about supply, technical issues, and market effects
There’s no public detail yet on exactly how many Ghost Pass codes are available or how long the promotion will run, and no trading volume data for the Aave token was available at the time of this report. Those are details worth watching as Aave moves toward a full public launch of its mobile app.
Article produced with the assistance of artificial intelligence and reviewed by the editorial team.
Key takeaways
Aave introduced a promotional Ghost Pass code, “FRIDAY,” offering instant access to its mobile app.
The code works only while supplies last and was announced via Aave’s official X account.
The promo is designed to boost user engagement ahead of the app’s full launch.
Aave is a decentralized finance protocol that lets users lend and borrow crypto without intermediaries.
The announcement drew notable social media interaction, with 69 likes and 14 retweets recorded at the time of reporting.
Aave Launches Ghost Pass Code for Early Mobile App Access
The headline development here is straightforward: Aave is giving a slice of its community a shortcut into its upcoming mobile app. Instead of waiting for a broader release, users who grab the Ghost Pass code can skip the queue entirely.
Code ‘FRIDAY’ provides instant access while supplies last
The mechanism is simple. Anyone who enters “FRIDAY” gets immediate entry into the Aave mobile app, but only until the available passes run out. That built-in scarcity is doing a lot of the marketing work — it turns a routine product update into something people feel they need to act on quickly, rather than a feature they’ll get around to eventually.
Purpose and Promotion of the Ghost Pass Initiative
Aave’s goal with the Ghost Pass push is to generate momentum before the mobile app’s official debut, turning early adopters into a kind of built-in testing and marketing group. This matters because user engagement ahead of a launch often sets the tone for how an app performs once it’s fully live — a strong early crowd can create the word-of-mouth that drives adoption later.
Boosting user engagement ahead of full app release
By rewarding people who want in early, Aave is effectively using its most engaged users as an informal preview audience. This kind of pre-launch engagement strategy is common in tech circles, but it’s less typical in DeFi, where protocols have historically leaned on token incentives rather than access-based hype.
Announcement through official Aave account on X
Aave kept the announcement centralized, posting the Ghost Pass code directly through its official X account rather than scattering it across multiple channels. That approach let the company track reaction in one place — and the numbers suggest people noticed, with the post pulling in 69 likes and 14 retweets.
Aave’s Role as a DeFi Protocol and App Objectives
Aave operates as a decentralized finance protocol, letting users lend and borrow cryptocurrencies directly with each other, without banks or other middlemen standing in the way. That peer-to-peer structure is the foundation of what the new mobile app is trying to extend to a mobile-first audience.
Overview of Aave’s decentralized finance functionality
At its core, Aave’s system runs on smart contracts that match lenders and borrowers automatically, cutting out the traditional financial intermediary entirely. This is the same functionality that’s powered Aave’s growth across the broader DeFi space for years, and it remains the backbone of everything the company builds on top of it.
Mobile app simplifies access to DeFi lending and borrowing
The mobile app itself is built to make that lending-and-borrowing experience easier to reach, particularly for people who’d rather manage their crypto activity from a phone than a desktop browser. Simplifying that entry point matters because mobile usage has become the default way many people interact with financial apps generally, and DeFi platforms that lag on mobile risk losing users to competitors who don’t.
Market Context and User Engagement Signals
Why does a single promo code deserve attention? Because it’s a visible signal of how Aave is trying to stand out in a crowded, mixed-signal crypto market. The Ghost Pass announcement landed amid broader market conditions described as mixed, and Aave’s response was to focus on something it can control directly: how engaged its own user base feels.
Social media response and community interest
The engagement numbers — 69 likes and 14 retweets — aren’t massive by viral standards, but they do point to real community interest in getting early access. For a product that hasn’t fully launched yet, that kind of organic reaction is a useful gauge of appetite ahead of a wider rollout.
Strategic positioning amid mixed crypto market conditions
Offering early, scarce access during a period of mixed market sentiment suggests Aave is trying to build loyalty now, rather than waiting for ideal market conditions to make its move. This reflects a pattern across DeFi more broadly: platforms are increasingly leaning on user experience and engagement tactics, not just token rewards, to stand out in a competitive landscape.
Considerations and What to Watch
The real test comes once the mobile app moves past this early-access phase. How smoothly the Ghost Pass users’ experience translates into word-of-mouth adoption will say a lot about whether this kind of access-based promotion actually works for DeFi platforms, or whether it’s just a short-lived bump in attention.
Potential impact on adoption and user experience
If the feedback from early Ghost Pass users is positive, Aave could see a smoother path to wider adoption once the app opens up fully. On the other hand, any technical hiccups during this early phase could create friction that shapes public perception before the app even reaches its broader audience.
Uncertainties about supply, technical issues, and market effects
There’s no public detail yet on exactly how many Ghost Pass codes are available or how long the promotion will run, and no trading volume data for the Aave token was available at the time of this report. Those are details worth watching as Aave moves toward a full public launch of its mobile app.
Article produced with the assistance of artificial intelligence and reviewed by the editorial team.
51

Article
See translation
Charles Hoskinson says his Cardano role excludes ADA adoption dutiesCharles Hoskinson is pushing back on a familiar complaint from his own community, and his answer says a lot about how little control he actually has over the network he founded. On September 29, 2026, after another wave of criticism over slow adoption and a battered ADA price, Hoskinson used X to remind critics that his Charles Hoskinson Cardano role is limited to running a separate company, not steering the blockchain itself. “I am not accountable for Cardano adoption. Full stop. You people cannot seem to get it. Cardano is decentralized. I have no official role. Founders aren’t slaves,” he wrote.
Key takeaways
Charles Hoskinson is CEO of Input Output Global (IOG), not of the decentralized Cardano network itself.
Cardano’s treasury and protocol changes are now controlled by community-elected representatives through on-chain voting, after the original genesis keys were burned.
DReps rejected a 12.29 million ADA treasury request tied to an IOG-backed Bitcoin DeFi product.
Hoskinson’s marketing push for the Midnight (NIGHT) privacy network sparked an 86% rally in NIGHT, even as ADA sits 92% below its all-time high.
Clarifying Charles Hoskinson’s Role in Cardano and IOG
Hoskinson‘s title is CEO of Input Output Global, the engineering firm that built much of Cardano‘s original codebase — he does not hold an executive seat inside the decentralized network itself. That distinction is the whole point of his latest rebuttal, and it’s one that keeps tripping up parts of the community that still treat him as the project’s de facto boss.
Hoskinson as CEO of Input Output Global
IOG is a company with its own leadership structure, its own commercial priorities, and its own CEO in Hoskinson. That’s a very different thing from running Cardano, which has no single corporate head by design.
No official executive role in Cardano network
Hoskinson has stated plainly that he holds no official executive position inside the decentralized Cardano network and carries no personal responsibility for how fast — or slowly — the ecosystem grows its user base. In practice, that means the buck for adoption numbers doesn’t stop at his desk anymore, even if plenty of critics still send it there.
Decentralized Governance and Treasury Control in Cardano
Day-to-day power over Cardano’s money and its technical roadmap now sits with community-elected representatives rather than with Hoskinson or any founding figure. That shift didn’t happen by accident — it was engineered into the system through a series of governance upgrades.
Transition of protocol control to community-elected representatives
Authority over hard forks and treasury spending has moved to representatives chosen by the community, a structural change meant to make Cardano’s decentralization governance real rather than theoretical.
Burning of founder’s genesis keys to enforce decentralization
Among the most symbolic steps was the burning of the original genesis keys — the cryptographic credentials that once gave the founding entity special access to the protocol. Destroying them removed any technical shortcut Hoskinson or anyone else could use to override community decisions.
On-chain voting as mechanism for treasury requests
Every treasury ask now has to clear on-chain voting, handled by the network’s decentralized representatives, known as DReps. This is exactly the mechanism that recently worked against an IOG-linked proposal, underscoring that even projects tied to Hoskinson’s own company get no free pass.
Governance Decisions and Market Effects
A striking real-world test of Cardano’s governance system’s autonomy from Hoskinson’s preferences came when DReps rejected a 12.29 million ADA treasury proposal meant to fund an IOG-backed Bitcoin DeFi product. The rejection lands as a clear signal that community voting carries real teeth, not just procedural weight.
Rejection of 12.29 million ADA treasury request for Bitcoin DeFi product
The vote against the 12.29 million ADA allocation shows that Cardano treasury on-chain voting can and does block proposals connected to IOG itself, reinforcing Hoskinson’s point that he can’t simply direct funds toward projects he favors.
Hoskinson’s marketing impact on Midnight (NIGHT) token price
While that treasury debate played out, Hoskinson’s own marketing muscle was busy elsewhere. Over a 48-hour stretch, his promotional push for the Midnight (NIGHT) privacy network drove an 86% rally in the token, pulling speculative trading volume and attention toward NIGHT and away from ADA.
Decline in ADA token price and community criticism
That timing hasn’t gone unnoticed. ADA has dropped 92% from its all-time high, and the contrast between a sluggish ADA chart and a surging NIGHT token has fed directly into the adoption criticism Hoskinson was responding to in the first place.
Implications for Cardano’s Adoption and Ecosystem Development
With IOG easing off its old “Cardano-first-and-forever” stance, the company’s attention — and by extension Hoskinson’s — is spreading across multiple projects rather than staying locked on one chain. That’s a meaningful shift for anyone tracking the Charles Hoskinson Cardano role going forward, because it confirms IOG’s priorities and Cardano’s fate are no longer treated as identical.
Decentralized governance’s impact on funding and dApp activity
Because every treasury decision runs through on-chain voting, funding for developers can move slower than it would under a centralized foundation model. That friction carries real consequences for dApp activity, since projects waiting on community approval don’t get the fast-tracked support a traditional corporate treasury might offer.
Community-driven initiatives as key to adoption growth
Without a traditional corporate head calling the shots, Cardano’s growth now depends on what developers, dApp builders, and the broader community choose to propose and fund themselves. If the network wants higher transaction volumes or new enterprise partnerships, those initiatives have to be built and pitched from within the decentralized governance framework — not handed down from Hoskinson or IOG.
Article produced with the assistance of artificial intelligence and reviewed by the editorial team.
Charles Hoskinson says his Cardano role excludes ADA adoption duties
Charles Hoskinson is pushing back on a familiar complaint from his own community, and his answer says a lot about how little control he actually has over the network he founded. On September 29, 2026, after another wave of criticism over slow adoption and a battered ADA price, Hoskinson used X to remind critics that his Charles Hoskinson Cardano role is limited to running a separate company, not steering the blockchain itself. “I am not accountable for Cardano adoption. Full stop. You people cannot seem to get it. Cardano is decentralized. I have no official role. Founders aren’t slaves,” he wrote.
Key takeaways
Charles Hoskinson is CEO of Input Output Global (IOG), not of the decentralized Cardano network itself.
Cardano’s treasury and protocol changes are now controlled by community-elected representatives through on-chain voting, after the original genesis keys were burned.
DReps rejected a 12.29 million ADA treasury request tied to an IOG-backed Bitcoin DeFi product.
Hoskinson’s marketing push for the Midnight (NIGHT) privacy network sparked an 86% rally in NIGHT, even as ADA sits 92% below its all-time high.
Clarifying Charles Hoskinson’s Role in Cardano and IOG
Hoskinson‘s title is CEO of Input Output Global, the engineering firm that built much of Cardano‘s original codebase — he does not hold an executive seat inside the decentralized network itself. That distinction is the whole point of his latest rebuttal, and it’s one that keeps tripping up parts of the community that still treat him as the project’s de facto boss.
Hoskinson as CEO of Input Output Global
IOG is a company with its own leadership structure, its own commercial priorities, and its own CEO in Hoskinson. That’s a very different thing from running Cardano, which has no single corporate head by design.
No official executive role in Cardano network
Hoskinson has stated plainly that he holds no official executive position inside the decentralized Cardano network and carries no personal responsibility for how fast — or slowly — the ecosystem grows its user base. In practice, that means the buck for adoption numbers doesn’t stop at his desk anymore, even if plenty of critics still send it there.
Decentralized Governance and Treasury Control in Cardano
Day-to-day power over Cardano’s money and its technical roadmap now sits with community-elected representatives rather than with Hoskinson or any founding figure. That shift didn’t happen by accident — it was engineered into the system through a series of governance upgrades.
Transition of protocol control to community-elected representatives
Authority over hard forks and treasury spending has moved to representatives chosen by the community, a structural change meant to make Cardano’s decentralization governance real rather than theoretical.
Burning of founder’s genesis keys to enforce decentralization
Among the most symbolic steps was the burning of the original genesis keys — the cryptographic credentials that once gave the founding entity special access to the protocol. Destroying them removed any technical shortcut Hoskinson or anyone else could use to override community decisions.
On-chain voting as mechanism for treasury requests
Every treasury ask now has to clear on-chain voting, handled by the network’s decentralized representatives, known as DReps. This is exactly the mechanism that recently worked against an IOG-linked proposal, underscoring that even projects tied to Hoskinson’s own company get no free pass.
Governance Decisions and Market Effects
A striking real-world test of Cardano’s governance system’s autonomy from Hoskinson’s preferences came when DReps rejected a 12.29 million ADA treasury proposal meant to fund an IOG-backed Bitcoin DeFi product. The rejection lands as a clear signal that community voting carries real teeth, not just procedural weight.
Rejection of 12.29 million ADA treasury request for Bitcoin DeFi product
The vote against the 12.29 million ADA allocation shows that Cardano treasury on-chain voting can and does block proposals connected to IOG itself, reinforcing Hoskinson’s point that he can’t simply direct funds toward projects he favors.
Hoskinson’s marketing impact on Midnight (NIGHT) token price
While that treasury debate played out, Hoskinson’s own marketing muscle was busy elsewhere. Over a 48-hour stretch, his promotional push for the Midnight (NIGHT) privacy network drove an 86% rally in the token, pulling speculative trading volume and attention toward NIGHT and away from ADA.
Decline in ADA token price and community criticism
That timing hasn’t gone unnoticed. ADA has dropped 92% from its all-time high, and the contrast between a sluggish ADA chart and a surging NIGHT token has fed directly into the adoption criticism Hoskinson was responding to in the first place.
Implications for Cardano’s Adoption and Ecosystem Development
With IOG easing off its old “Cardano-first-and-forever” stance, the company’s attention — and by extension Hoskinson’s — is spreading across multiple projects rather than staying locked on one chain. That’s a meaningful shift for anyone tracking the Charles Hoskinson Cardano role going forward, because it confirms IOG’s priorities and Cardano’s fate are no longer treated as identical.
Decentralized governance’s impact on funding and dApp activity
Because every treasury decision runs through on-chain voting, funding for developers can move slower than it would under a centralized foundation model. That friction carries real consequences for dApp activity, since projects waiting on community approval don’t get the fast-tracked support a traditional corporate treasury might offer.
Community-driven initiatives as key to adoption growth
Without a traditional corporate head calling the shots, Cardano’s growth now depends on what developers, dApp builders, and the broader community choose to propose and fund themselves. If the network wants higher transaction volumes or new enterprise partnerships, those initiatives have to be built and pitched from within the decentralized governance framework — not handed down from Hoskinson or IOG.
Article produced with the assistance of artificial intelligence and reviewed by the editorial team.
Key takeaways
Charles Hoskinson is CEO of Input Output Global (IOG), not of the decentralized Cardano network itself.
Cardano’s treasury and protocol changes are now controlled by community-elected representatives through on-chain voting, after the original genesis keys were burned.
DReps rejected a 12.29 million ADA treasury request tied to an IOG-backed Bitcoin DeFi product.
Hoskinson’s marketing push for the Midnight (NIGHT) privacy network sparked an 86% rally in NIGHT, even as ADA sits 92% below its all-time high.
Clarifying Charles Hoskinson’s Role in Cardano and IOG
Hoskinson‘s title is CEO of Input Output Global, the engineering firm that built much of Cardano‘s original codebase — he does not hold an executive seat inside the decentralized network itself. That distinction is the whole point of his latest rebuttal, and it’s one that keeps tripping up parts of the community that still treat him as the project’s de facto boss.
Hoskinson as CEO of Input Output Global
IOG is a company with its own leadership structure, its own commercial priorities, and its own CEO in Hoskinson. That’s a very different thing from running Cardano, which has no single corporate head by design.
No official executive role in Cardano network
Hoskinson has stated plainly that he holds no official executive position inside the decentralized Cardano network and carries no personal responsibility for how fast — or slowly — the ecosystem grows its user base. In practice, that means the buck for adoption numbers doesn’t stop at his desk anymore, even if plenty of critics still send it there.
Decentralized Governance and Treasury Control in Cardano
Day-to-day power over Cardano’s money and its technical roadmap now sits with community-elected representatives rather than with Hoskinson or any founding figure. That shift didn’t happen by accident — it was engineered into the system through a series of governance upgrades.
Transition of protocol control to community-elected representatives
Authority over hard forks and treasury spending has moved to representatives chosen by the community, a structural change meant to make Cardano’s decentralization governance real rather than theoretical.
Burning of founder’s genesis keys to enforce decentralization
Among the most symbolic steps was the burning of the original genesis keys — the cryptographic credentials that once gave the founding entity special access to the protocol. Destroying them removed any technical shortcut Hoskinson or anyone else could use to override community decisions.
On-chain voting as mechanism for treasury requests
Every treasury ask now has to clear on-chain voting, handled by the network’s decentralized representatives, known as DReps. This is exactly the mechanism that recently worked against an IOG-linked proposal, underscoring that even projects tied to Hoskinson’s own company get no free pass.
Governance Decisions and Market Effects
A striking real-world test of Cardano’s governance system’s autonomy from Hoskinson’s preferences came when DReps rejected a 12.29 million ADA treasury proposal meant to fund an IOG-backed Bitcoin DeFi product. The rejection lands as a clear signal that community voting carries real teeth, not just procedural weight.
Rejection of 12.29 million ADA treasury request for Bitcoin DeFi product
The vote against the 12.29 million ADA allocation shows that Cardano treasury on-chain voting can and does block proposals connected to IOG itself, reinforcing Hoskinson’s point that he can’t simply direct funds toward projects he favors.
Hoskinson’s marketing impact on Midnight (NIGHT) token price
While that treasury debate played out, Hoskinson’s own marketing muscle was busy elsewhere. Over a 48-hour stretch, his promotional push for the Midnight (NIGHT) privacy network drove an 86% rally in the token, pulling speculative trading volume and attention toward NIGHT and away from ADA.
Decline in ADA token price and community criticism
That timing hasn’t gone unnoticed. ADA has dropped 92% from its all-time high, and the contrast between a sluggish ADA chart and a surging NIGHT token has fed directly into the adoption criticism Hoskinson was responding to in the first place.
Implications for Cardano’s Adoption and Ecosystem Development
With IOG easing off its old “Cardano-first-and-forever” stance, the company’s attention — and by extension Hoskinson’s — is spreading across multiple projects rather than staying locked on one chain. That’s a meaningful shift for anyone tracking the Charles Hoskinson Cardano role going forward, because it confirms IOG’s priorities and Cardano’s fate are no longer treated as identical.
Decentralized governance’s impact on funding and dApp activity
Because every treasury decision runs through on-chain voting, funding for developers can move slower than it would under a centralized foundation model. That friction carries real consequences for dApp activity, since projects waiting on community approval don’t get the fast-tracked support a traditional corporate treasury might offer.
Community-driven initiatives as key to adoption growth
Without a traditional corporate head calling the shots, Cardano’s growth now depends on what developers, dApp builders, and the broader community choose to propose and fund themselves. If the network wants higher transaction volumes or new enterprise partnerships, those initiatives have to be built and pitched from within the decentralized governance framework — not handed down from Hoskinson or IOG.
Article produced with the assistance of artificial intelligence and reviewed by the editorial team.
220

Article
See translation
Mastercard integrates Open USD stablecoin into BVNK platformMastercard is folding a newly launched stablecoin called Open USD into BVNK, the crypto infrastructure platform it bought earlier this year, in a move that marks one of the clearest signs yet of a broader Mastercard stablecoin integration strategy taking shape across its payments network. The plan gives banks and businesses a way to hold, move, and settle digital dollars through rails they already use for everyday fiat transactions, rather than treating crypto as a separate, walled-off system.
Key takeaways
Mastercard is integrating the Open USD stablecoin into its BVNK platform, the stablecoin infrastructure company it acquired earlier this year.
Open USD, also called OUSD, launched on September 30 across Ethereum, Solana, Base, and Tempo blockchains.
Businesses can mint and redeem OUSD 1:1 with the US dollar with no minting or redemption fees.
Founding partners — Coinbase, Mastercard, Shopify, Stripe, and Visa — have committed more than $1 billion toward OUSD liquidity.
OUSD is also reachable through Stripe and Visa, with Coinbase support going live on October 1.
Mastercard Integrates Open USD Stablecoin Into BVNK Platform
Through BVNK, Mastercard is giving banks and companies access to Open USD, enabling them to use the token together with fiat currencies and other stablecoins when handling payments, settlement, and liquidity management. According to the company, this effort aims to reduce the friction that businesses encounter while moving money between various currencies, banking rails, payment networks, and digital-asset systems.
Details of the Integration
Rather than building a standalone crypto product, Mastercard is routing OUSD through infrastructure it already controls. That means a bank or merchant using BVNK can draw on Open USD the same way it would access a traditional currency balance, without juggling separate systems for fiat and digital dollars.
Mastercard Chief Product Officer Jorn Lambert framed the move around usability rather than invention, saying: “The challenge isn’t creating more forms of money. It’s helping businesses use them.”
Role of BVNK in Stablecoin Infrastructure
BVNK is the stablecoin infrastructure company Mastercard acquired earlier this year, and it provides the plumbing for holding, transferring, and converting between traditional currencies and stablecoins. By plugging Open USD into that platform, Mastercard effectively turns BVNK into a gateway where fiat and tokenized dollars sit side by side for institutional and business customers. OUSD is also accessible through other channels: Stripe and Visa both offer access routes, and Coinbase support went live on October 1, each providing different tools spanning settlement, payment orchestration, trading, foreign exchange, wallets, and cards.
Open USD Stablecoin Launch and Features
Open USD launched on September 30 across four blockchains — Ethereum, Solana, Base, and Tempo — giving it a wide technical footprint from day one. The stablecoin is designed to trade 1:1 against the US dollar, with no minting or redemption fees attached, which lowers the cost barrier for businesses experimenting with digital-dollar settlement for the first time.
Conversion and Fee Structure
Because businesses can mint and redeem OUSD at par with the dollar without extra charges, the token is positioned less as a speculative crypto asset and more as a settlement tool meant to behave like cash on a blockchain rail.
Founding Partners and Liquidity Commitment
The project behind the token, Open Standard, lists Coinbase, Mastercard, Shopify, Stripe, and Visa as its initial founding partners. Together, those companies have committed more than $1 billion toward OUSD liquidity, a signal that the backers want the stablecoin to function as real infrastructure for payments, settlement, institutional trading, and other financial services rather than a niche experiment.
Use Cases and Strategic Implications for Businesses
For businesses, the practical draw of OUSD is flexibility: customers can hold it alongside fiat currencies and other stablecoins, then deploy it for payments, settlement, or liquidity management depending on what a given transaction needs. That optionality matters because companies moving money across borders or between banking systems often face delays and fees that a stablecoin settled directly on-chain can sidestep.
Payments, Settlement, and Liquidity Management With OUSD
Mastercard’s pitch is that OUSD slots into existing treasury and payment workflows instead of forcing businesses to rebuild their systems around crypto. That lowers the barrier for financial institutions that want exposure to stablecoin payments without taking on unfamiliar operational risk.
Mastercard’s Vision of a Multi-Money Financial System
Mastercard describes the broader push as building toward a “multi-money” financial system that spans bank deposits, card networks, real-time payments, and digital assets. In practice, this reflects a wider industry conversation about whether stablecoins could reshape how card networks process transactions — a question that has pushed both Mastercard and its rival Visa to build stablecoin capability directly into their own infrastructure rather than treat it as an outside threat to compete against.
That approach helps explain why the BVNK platform integration looks less like a side bet and more like groundwork: Mastercard is positioning its network so that fiat money, card rails, and tokenized dollars can move through the same pipes, with Open USD as an early test case for how far that interoperability can go.
Article produced with the assistance of artificial intelligence and reviewed by the editorial team.
Mastercard integrates Open USD stablecoin into BVNK platform
Mastercard is folding a newly launched stablecoin called Open USD into BVNK, the crypto infrastructure platform it bought earlier this year, in a move that marks one of the clearest signs yet of a broader Mastercard stablecoin integration strategy taking shape across its payments network. The plan gives banks and businesses a way to hold, move, and settle digital dollars through rails they already use for everyday fiat transactions, rather than treating crypto as a separate, walled-off system.
Key takeaways
Mastercard is integrating the Open USD stablecoin into its BVNK platform, the stablecoin infrastructure company it acquired earlier this year.
Open USD, also called OUSD, launched on September 30 across Ethereum, Solana, Base, and Tempo blockchains.
Businesses can mint and redeem OUSD 1:1 with the US dollar with no minting or redemption fees.
Founding partners — Coinbase, Mastercard, Shopify, Stripe, and Visa — have committed more than $1 billion toward OUSD liquidity.
OUSD is also reachable through Stripe and Visa, with Coinbase support going live on October 1.
Mastercard Integrates Open USD Stablecoin Into BVNK Platform
Through BVNK, Mastercard is giving banks and companies access to Open USD, enabling them to use the token together with fiat currencies and other stablecoins when handling payments, settlement, and liquidity management. According to the company, this effort aims to reduce the friction that businesses encounter while moving money between various currencies, banking rails, payment networks, and digital-asset systems.
Details of the Integration
Rather than building a standalone crypto product, Mastercard is routing OUSD through infrastructure it already controls. That means a bank or merchant using BVNK can draw on Open USD the same way it would access a traditional currency balance, without juggling separate systems for fiat and digital dollars.
Mastercard Chief Product Officer Jorn Lambert framed the move around usability rather than invention, saying: “The challenge isn’t creating more forms of money. It’s helping businesses use them.”
Role of BVNK in Stablecoin Infrastructure
BVNK is the stablecoin infrastructure company Mastercard acquired earlier this year, and it provides the plumbing for holding, transferring, and converting between traditional currencies and stablecoins. By plugging Open USD into that platform, Mastercard effectively turns BVNK into a gateway where fiat and tokenized dollars sit side by side for institutional and business customers. OUSD is also accessible through other channels: Stripe and Visa both offer access routes, and Coinbase support went live on October 1, each providing different tools spanning settlement, payment orchestration, trading, foreign exchange, wallets, and cards.
Open USD Stablecoin Launch and Features
Open USD launched on September 30 across four blockchains — Ethereum, Solana, Base, and Tempo — giving it a wide technical footprint from day one. The stablecoin is designed to trade 1:1 against the US dollar, with no minting or redemption fees attached, which lowers the cost barrier for businesses experimenting with digital-dollar settlement for the first time.
Conversion and Fee Structure
Because businesses can mint and redeem OUSD at par with the dollar without extra charges, the token is positioned less as a speculative crypto asset and more as a settlement tool meant to behave like cash on a blockchain rail.
Founding Partners and Liquidity Commitment
The project behind the token, Open Standard, lists Coinbase, Mastercard, Shopify, Stripe, and Visa as its initial founding partners. Together, those companies have committed more than $1 billion toward OUSD liquidity, a signal that the backers want the stablecoin to function as real infrastructure for payments, settlement, institutional trading, and other financial services rather than a niche experiment.
Use Cases and Strategic Implications for Businesses
For businesses, the practical draw of OUSD is flexibility: customers can hold it alongside fiat currencies and other stablecoins, then deploy it for payments, settlement, or liquidity management depending on what a given transaction needs. That optionality matters because companies moving money across borders or between banking systems often face delays and fees that a stablecoin settled directly on-chain can sidestep.
Payments, Settlement, and Liquidity Management With OUSD
Mastercard’s pitch is that OUSD slots into existing treasury and payment workflows instead of forcing businesses to rebuild their systems around crypto. That lowers the barrier for financial institutions that want exposure to stablecoin payments without taking on unfamiliar operational risk.
Mastercard’s Vision of a Multi-Money Financial System
Mastercard describes the broader push as building toward a “multi-money” financial system that spans bank deposits, card networks, real-time payments, and digital assets. In practice, this reflects a wider industry conversation about whether stablecoins could reshape how card networks process transactions — a question that has pushed both Mastercard and its rival Visa to build stablecoin capability directly into their own infrastructure rather than treat it as an outside threat to compete against.
That approach helps explain why the BVNK platform integration looks less like a side bet and more like groundwork: Mastercard is positioning its network so that fiat money, card rails, and tokenized dollars can move through the same pipes, with Open USD as an early test case for how far that interoperability can go.
Article produced with the assistance of artificial intelligence and reviewed by the editorial team.
Key takeaways
Mastercard is integrating the Open USD stablecoin into its BVNK platform, the stablecoin infrastructure company it acquired earlier this year.
Open USD, also called OUSD, launched on September 30 across Ethereum, Solana, Base, and Tempo blockchains.
Businesses can mint and redeem OUSD 1:1 with the US dollar with no minting or redemption fees.
Founding partners — Coinbase, Mastercard, Shopify, Stripe, and Visa — have committed more than $1 billion toward OUSD liquidity.
OUSD is also reachable through Stripe and Visa, with Coinbase support going live on October 1.
Mastercard Integrates Open USD Stablecoin Into BVNK Platform
Through BVNK, Mastercard is giving banks and companies access to Open USD, enabling them to use the token together with fiat currencies and other stablecoins when handling payments, settlement, and liquidity management. According to the company, this effort aims to reduce the friction that businesses encounter while moving money between various currencies, banking rails, payment networks, and digital-asset systems.
Details of the Integration
Rather than building a standalone crypto product, Mastercard is routing OUSD through infrastructure it already controls. That means a bank or merchant using BVNK can draw on Open USD the same way it would access a traditional currency balance, without juggling separate systems for fiat and digital dollars.
Mastercard Chief Product Officer Jorn Lambert framed the move around usability rather than invention, saying: “The challenge isn’t creating more forms of money. It’s helping businesses use them.”
Role of BVNK in Stablecoin Infrastructure
BVNK is the stablecoin infrastructure company Mastercard acquired earlier this year, and it provides the plumbing for holding, transferring, and converting between traditional currencies and stablecoins. By plugging Open USD into that platform, Mastercard effectively turns BVNK into a gateway where fiat and tokenized dollars sit side by side for institutional and business customers. OUSD is also accessible through other channels: Stripe and Visa both offer access routes, and Coinbase support went live on October 1, each providing different tools spanning settlement, payment orchestration, trading, foreign exchange, wallets, and cards.
Open USD Stablecoin Launch and Features
Open USD launched on September 30 across four blockchains — Ethereum, Solana, Base, and Tempo — giving it a wide technical footprint from day one. The stablecoin is designed to trade 1:1 against the US dollar, with no minting or redemption fees attached, which lowers the cost barrier for businesses experimenting with digital-dollar settlement for the first time.
Conversion and Fee Structure
Because businesses can mint and redeem OUSD at par with the dollar without extra charges, the token is positioned less as a speculative crypto asset and more as a settlement tool meant to behave like cash on a blockchain rail.
Founding Partners and Liquidity Commitment
The project behind the token, Open Standard, lists Coinbase, Mastercard, Shopify, Stripe, and Visa as its initial founding partners. Together, those companies have committed more than $1 billion toward OUSD liquidity, a signal that the backers want the stablecoin to function as real infrastructure for payments, settlement, institutional trading, and other financial services rather than a niche experiment.
Use Cases and Strategic Implications for Businesses
For businesses, the practical draw of OUSD is flexibility: customers can hold it alongside fiat currencies and other stablecoins, then deploy it for payments, settlement, or liquidity management depending on what a given transaction needs. That optionality matters because companies moving money across borders or between banking systems often face delays and fees that a stablecoin settled directly on-chain can sidestep.
Payments, Settlement, and Liquidity Management With OUSD
Mastercard’s pitch is that OUSD slots into existing treasury and payment workflows instead of forcing businesses to rebuild their systems around crypto. That lowers the barrier for financial institutions that want exposure to stablecoin payments without taking on unfamiliar operational risk.
Mastercard’s Vision of a Multi-Money Financial System
Mastercard describes the broader push as building toward a “multi-money” financial system that spans bank deposits, card networks, real-time payments, and digital assets. In practice, this reflects a wider industry conversation about whether stablecoins could reshape how card networks process transactions — a question that has pushed both Mastercard and its rival Visa to build stablecoin capability directly into their own infrastructure rather than treat it as an outside threat to compete against.
That approach helps explain why the BVNK platform integration looks less like a side bet and more like groundwork: Mastercard is positioning its network so that fiat money, card rails, and tokenized dollars can move through the same pipes, with Open USD as an early test case for how far that interoperability can go.
Article produced with the assistance of artificial intelligence and reviewed by the editorial team.
17

Article
See translation
Blast Ethereum shutdown forces users to withdraw funds by October 26After determining that running the network costs more than it earns, Blast announced on Friday that it is shutting down its Ethereum layer 2. The team stated there is no longer a credible way to make the network economically sustainable, bringing a sudden end to a project that had previously attracted billions of dollars in deposits even before its mainnet launched.
Key takeaways
Blast is shutting down its Ethereum layer 2 after concluding the chain’s operating costs no longer make economic sense.
Users must withdraw all assets to Ethereum mainnet, including holdings accessed through the Blast progressive web app, before October 26 using the normal interface.
After October 26, asset recovery still works but requires interacting directly with Blast’s bridge contracts on Ethereum.
Blast attracted more than $2 billion in deposits before its February 2024 mainnet launch but now holds roughly $65 million in total value locked.
The BLAST token’s market capitalization has fallen to about $30 million, roughly 98% below its June 2024 all-time high.
Blast shuts down Ethereum layer 2 network over economic challenges
The Blast Ethereum shutdown comes down to a simple math problem: running the chain cost more than it brought in. “We launched Blast with the goal of building a self-sustaining chain for users and developers,” the team said in its announcement. “Unfortunately, the economics of operating the chain no longer make sense.”
That admission lands hard given how the project started. Blast was founded by Blur creator Tieshun Roquerre, known as Pacman, and it introduced native yield for ether and stablecoins as its core pitch to users. Initially, the idea proved remarkably successful: Blast drew in over $2 billion in deposits ahead of its mainnet going live, significantly before its official February 2024 launch.
Launch ambitions and economic unsustainability
Few Ethereum layer-2 projects entered the market with that kind of pre-launch momentum. The promise of built-in yield on ether and stablecoins gave Blast an edge that competing chains struggled to match, at least in the early months. But translating that initial rush of capital into a durable business model proved to be a different challenge entirely, and the team’s own statement suggests the gap between revenue and operating costs never closed.
Decline in total value locked and token market capitalization
The numbers tell the rest of the story. Blast currently holds roughly $65 million in total value locked, a steep drop from the $2 billion it once commanded. Performing even worse, the BLAST token now has a market capitalization of roughly $30 million and trades about 98% below its June 2024 all-time high, based on DefiLlama data referenced by The Block. This Ethereum layer 2 closure effectively confirms what the token’s chart had been signaling for months — confidence in the chain’s long-term viability had already eroded well before the official announcement.
Users must withdraw assets to Ethereum mainnet before October 26
Anyone with funds on Blast needs to act before the end of the month. The network has told users to withdraw every asset to the Ethereum mainnet, including those held through the Blast progressive web app, and has established a strict deadline for completing this via the standard interface.
Withdrawal process and deadlines
Users have until October 26 to complete a crypto asset withdrawal using Blast’s normal interface. That gives holders roughly three and a half weeks from the shutdown announcement to move their funds without needing any technical workarounds.
Temporary suspension during Lido position unwinding
Before that window opens fully, withdrawals will be temporarily suspended while the network unwinds its positions with Lido, a process expected to take about one week. Once those Lido-related assets are cleared out, Blast plans to resume regular withdrawals and cut its withdrawal delay down to just 24 hours, a faster turnaround than users had previously faced.
Post-deadline withdrawal procedures
Missing the October 26 cutoff doesn’t mean assets become unrecoverable. But the process changes significantly: holders who withdraw after that date will need to interact directly with Blast’s bridge contracts on Ethereum rather than relying on the standard interface. That’s a meaningfully more technical path, and it underscores why the team is pushing users to move early rather than wait.
Blast team’s priority and lack of financial transparency
Blast did not disclose detailed revenue or operating-cost figures alongside its shutdown announcement, leaving the exact scale of the financial shortfall unclear. What the team did make clear is its immediate focus: getting user funds safely back onto Ethereum.
The team apologized to users and developers who had supported the ecosystem, saying its priority now is ensuring that assets can be safely moved back to Ethereum. That framing puts the emphasis squarely on an orderly wind-down rather than any attempt to relaunch or pivot the network.
The absence of specific financial disclosures does limit how much outside observers can learn from Blast’s experience. Still, the trajectory from $2 billion in early deposits to $65 million in current value locked, paired with a token that has lost nearly all of its peak value, offers a fairly stark picture of how quickly enthusiasm for a layer-2 network can fade once incentive-driven deposits move elsewhere. For an ecosystem crowded with competing Ethereum scaling solutions, Blast’s exit is a reminder that early deposit totals don’t guarantee staying power — and that the economics of running a chain have to work long after the initial hype fades.
Article produced with the assistance of artificial intelligence and reviewed by the editorial team.
Blast Ethereum shutdown forces users to withdraw funds by October 26
After determining that running the network costs more than it earns, Blast announced on Friday that it is shutting down its Ethereum layer 2. The team stated there is no longer a credible way to make the network economically sustainable, bringing a sudden end to a project that had previously attracted billions of dollars in deposits even before its mainnet launched.
Key takeaways
Blast is shutting down its Ethereum layer 2 after concluding the chain’s operating costs no longer make economic sense.
Users must withdraw all assets to Ethereum mainnet, including holdings accessed through the Blast progressive web app, before October 26 using the normal interface.
After October 26, asset recovery still works but requires interacting directly with Blast’s bridge contracts on Ethereum.
Blast attracted more than $2 billion in deposits before its February 2024 mainnet launch but now holds roughly $65 million in total value locked.
The BLAST token’s market capitalization has fallen to about $30 million, roughly 98% below its June 2024 all-time high.
Blast shuts down Ethereum layer 2 network over economic challenges
The Blast Ethereum shutdown comes down to a simple math problem: running the chain cost more than it brought in. “We launched Blast with the goal of building a self-sustaining chain for users and developers,” the team said in its announcement. “Unfortunately, the economics of operating the chain no longer make sense.”
That admission lands hard given how the project started. Blast was founded by Blur creator Tieshun Roquerre, known as Pacman, and it introduced native yield for ether and stablecoins as its core pitch to users. Initially, the idea proved remarkably successful: Blast drew in over $2 billion in deposits ahead of its mainnet going live, significantly before its official February 2024 launch.
Launch ambitions and economic unsustainability
Few Ethereum layer-2 projects entered the market with that kind of pre-launch momentum. The promise of built-in yield on ether and stablecoins gave Blast an edge that competing chains struggled to match, at least in the early months. But translating that initial rush of capital into a durable business model proved to be a different challenge entirely, and the team’s own statement suggests the gap between revenue and operating costs never closed.
Decline in total value locked and token market capitalization
The numbers tell the rest of the story. Blast currently holds roughly $65 million in total value locked, a steep drop from the $2 billion it once commanded. Performing even worse, the BLAST token now has a market capitalization of roughly $30 million and trades about 98% below its June 2024 all-time high, based on DefiLlama data referenced by The Block. This Ethereum layer 2 closure effectively confirms what the token’s chart had been signaling for months — confidence in the chain’s long-term viability had already eroded well before the official announcement.
Users must withdraw assets to Ethereum mainnet before October 26
Anyone with funds on Blast needs to act before the end of the month. The network has told users to withdraw every asset to the Ethereum mainnet, including those held through the Blast progressive web app, and has established a strict deadline for completing this via the standard interface.
Withdrawal process and deadlines
Users have until October 26 to complete a crypto asset withdrawal using Blast’s normal interface. That gives holders roughly three and a half weeks from the shutdown announcement to move their funds without needing any technical workarounds.
Temporary suspension during Lido position unwinding
Before that window opens fully, withdrawals will be temporarily suspended while the network unwinds its positions with Lido, a process expected to take about one week. Once those Lido-related assets are cleared out, Blast plans to resume regular withdrawals and cut its withdrawal delay down to just 24 hours, a faster turnaround than users had previously faced.
Post-deadline withdrawal procedures
Missing the October 26 cutoff doesn’t mean assets become unrecoverable. But the process changes significantly: holders who withdraw after that date will need to interact directly with Blast’s bridge contracts on Ethereum rather than relying on the standard interface. That’s a meaningfully more technical path, and it underscores why the team is pushing users to move early rather than wait.
Blast team’s priority and lack of financial transparency
Blast did not disclose detailed revenue or operating-cost figures alongside its shutdown announcement, leaving the exact scale of the financial shortfall unclear. What the team did make clear is its immediate focus: getting user funds safely back onto Ethereum.
The team apologized to users and developers who had supported the ecosystem, saying its priority now is ensuring that assets can be safely moved back to Ethereum. That framing puts the emphasis squarely on an orderly wind-down rather than any attempt to relaunch or pivot the network.
The absence of specific financial disclosures does limit how much outside observers can learn from Blast’s experience. Still, the trajectory from $2 billion in early deposits to $65 million in current value locked, paired with a token that has lost nearly all of its peak value, offers a fairly stark picture of how quickly enthusiasm for a layer-2 network can fade once incentive-driven deposits move elsewhere. For an ecosystem crowded with competing Ethereum scaling solutions, Blast’s exit is a reminder that early deposit totals don’t guarantee staying power — and that the economics of running a chain have to work long after the initial hype fades.
Article produced with the assistance of artificial intelligence and reviewed by the editorial team.
Key takeaways
Blast is shutting down its Ethereum layer 2 after concluding the chain’s operating costs no longer make economic sense.
Users must withdraw all assets to Ethereum mainnet, including holdings accessed through the Blast progressive web app, before October 26 using the normal interface.
After October 26, asset recovery still works but requires interacting directly with Blast’s bridge contracts on Ethereum.
Blast attracted more than $2 billion in deposits before its February 2024 mainnet launch but now holds roughly $65 million in total value locked.
The BLAST token’s market capitalization has fallen to about $30 million, roughly 98% below its June 2024 all-time high.
Blast shuts down Ethereum layer 2 network over economic challenges
The Blast Ethereum shutdown comes down to a simple math problem: running the chain cost more than it brought in. “We launched Blast with the goal of building a self-sustaining chain for users and developers,” the team said in its announcement. “Unfortunately, the economics of operating the chain no longer make sense.”
That admission lands hard given how the project started. Blast was founded by Blur creator Tieshun Roquerre, known as Pacman, and it introduced native yield for ether and stablecoins as its core pitch to users. Initially, the idea proved remarkably successful: Blast drew in over $2 billion in deposits ahead of its mainnet going live, significantly before its official February 2024 launch.
Launch ambitions and economic unsustainability
Few Ethereum layer-2 projects entered the market with that kind of pre-launch momentum. The promise of built-in yield on ether and stablecoins gave Blast an edge that competing chains struggled to match, at least in the early months. But translating that initial rush of capital into a durable business model proved to be a different challenge entirely, and the team’s own statement suggests the gap between revenue and operating costs never closed.
Decline in total value locked and token market capitalization
The numbers tell the rest of the story. Blast currently holds roughly $65 million in total value locked, a steep drop from the $2 billion it once commanded. Performing even worse, the BLAST token now has a market capitalization of roughly $30 million and trades about 98% below its June 2024 all-time high, based on DefiLlama data referenced by The Block. This Ethereum layer 2 closure effectively confirms what the token’s chart had been signaling for months — confidence in the chain’s long-term viability had already eroded well before the official announcement.
Users must withdraw assets to Ethereum mainnet before October 26
Anyone with funds on Blast needs to act before the end of the month. The network has told users to withdraw every asset to the Ethereum mainnet, including those held through the Blast progressive web app, and has established a strict deadline for completing this via the standard interface.
Withdrawal process and deadlines
Users have until October 26 to complete a crypto asset withdrawal using Blast’s normal interface. That gives holders roughly three and a half weeks from the shutdown announcement to move their funds without needing any technical workarounds.
Temporary suspension during Lido position unwinding
Before that window opens fully, withdrawals will be temporarily suspended while the network unwinds its positions with Lido, a process expected to take about one week. Once those Lido-related assets are cleared out, Blast plans to resume regular withdrawals and cut its withdrawal delay down to just 24 hours, a faster turnaround than users had previously faced.
Post-deadline withdrawal procedures
Missing the October 26 cutoff doesn’t mean assets become unrecoverable. But the process changes significantly: holders who withdraw after that date will need to interact directly with Blast’s bridge contracts on Ethereum rather than relying on the standard interface. That’s a meaningfully more technical path, and it underscores why the team is pushing users to move early rather than wait.
Blast team’s priority and lack of financial transparency
Blast did not disclose detailed revenue or operating-cost figures alongside its shutdown announcement, leaving the exact scale of the financial shortfall unclear. What the team did make clear is its immediate focus: getting user funds safely back onto Ethereum.
The team apologized to users and developers who had supported the ecosystem, saying its priority now is ensuring that assets can be safely moved back to Ethereum. That framing puts the emphasis squarely on an orderly wind-down rather than any attempt to relaunch or pivot the network.
The absence of specific financial disclosures does limit how much outside observers can learn from Blast’s experience. Still, the trajectory from $2 billion in early deposits to $65 million in current value locked, paired with a token that has lost nearly all of its peak value, offers a fairly stark picture of how quickly enthusiasm for a layer-2 network can fade once incentive-driven deposits move elsewhere. For an ecosystem crowded with competing Ethereum scaling solutions, Blast’s exit is a reminder that early deposit totals don’t guarantee staying power — and that the economics of running a chain have to work long after the initial hype fades.
Article produced with the assistance of artificial intelligence and reviewed by the editorial team.
27
Article
See translation
Nvidia stock performance hits record high as Cantor Fitzgerald targets $350Nvidia’s share price pushed to a fresh all-time high of $236.57 this week, extending a rally that has turned the chipmaker into one of the standout stories of the current market cycle. The move puts Nvidia stock performance back in the spotlight just as Wall Street weighs how much further the AI-driven run can go, and as new questions swirl around the broader semiconductor supply chain feeding that boom.
Key takeaways
Nvidia shares hit an all-time high of $236.57.
The stock is up more than 30% over the past six months and 25.98% over the past year, according to Investing.com.
Cantor Fitzgerald reiterated an Overweight rating and a $350 price target following investor meetings with CEO Jensen Huang in New York City.
Bank of America lifted its U.S. semiconductor industry growth forecast to 18% annually between 2026 and 2030.
Pope Leo XIV criticized Nvidia’s approach to AI safety, while Nscale faced scrutiny over undisclosed ByteDance sales ties ahead of a planned U.S. IPO.
Nvidia’s Record Stock Performance
Nvidia’s climb to $236.57 confirms that investor appetite for the company has barely cooled, even after years of outsized gains. The stock has reached this all-time high, a sign that buyers are treating the AI chip leader as a near-permanent fixture at the top of the market.
The momentum isn’t a one-week story. Nvidia’s shares have gained more than 30% over the past six months alone, and the one-year change now stands at 25.98%, according to data reported by Investing.com. That kind of sustained Nvidia stock performance reflects not just a single catalyst but a stacking of positive developments — from data-center demand to new product rollouts — that have kept institutional money flowing in.
Valuation Insights
Despite the run-up, Investing.com’s InvestingPro analysis suggests the stock remains undervalued relative to its Fair Value, pointing to potential further upside. That kind of read matters because it pushes back against the common assumption that a stock trading near record highs must be stretched. If the valuation gap InvestingPro flags holds up, it would mean the market hasn’t yet fully priced in Nvidia’s current growth trajectory — a detail that helps explain why some desks remain bullish even after such a steep climb.
Investment Ratings and Leadership Engagement
Wall Street’s confidence in Nvidia isn’t just reflected in the share price — it’s showing up directly in analyst calls. Cantor Fitzgerald reiterated its Overweight rating on the stock, keeping a price target of $350.00, a level that implies meaningful room for the shares to climb from where they currently trade.
That call followed investor meetings in New York City where Nvidia CEO Jensen Huang and other senior executives engaged directly with the investment community, according to Yahoo Finance. Face time with leadership at this stage of the rally tends to carry extra weight: it signals that Nvidia’s management is actively shaping the narrative around its growth story rather than letting the stock price speak entirely on its own. Cantor Fitzgerald’s reiterated target effectively tells investors the firm sees further headroom even after the record close, reinforcing the bullish case built around continued AI infrastructure spending.
Industry Developments and Corporate Initiatives
Nvidia’s rally is unfolding against a backdrop of broader hardware momentum. Super Micro Computer has started shipping Nvidia Vera Rubin NVL72 racks, systems built with advanced cooling technology designed to handle the intense thermal loads of next-generation AI chips. Shipments like these are a concrete signal that Nvidia’s newest architecture is moving from announcement to deployment, which matters for investors trying to gauge how quickly the company’s product pipeline converts into actual revenue.
Semiconductor Growth Outlook
Taking a broader view, Bank of America has lifted its outlook for the U.S. semiconductor sector, now projecting an 18% yearly growth rate from 2026 through 2030, with the upgrade tied to improved expectations for memory chips and server components. That upgraded outlook offers useful context for the broader Nvidia semiconductor growth story: if the sector as a whole is set to expand at that pace, Nvidia’s own trajectory looks less like an isolated spike and more like a reflection of an industry-wide buildout in AI infrastructure. This is one of the reasons the current rally matters beyond a single stock — it ties directly into how fast the chip supply chain can scale to meet AI demand.
Controversies and Market Transparency Issues
Not every recent headline around Nvidia has been bullish. Nvidia faced criticism over its stance on AI safety, with concerns raised about the company taking the technology’s risks more seriously — a notable instance of Nvidia AI safety concerns reaching beyond the usual circle of regulators and industry critics. The remarks add to a growing public conversation about how aggressively AI hardware makers should be held accountable for the systems their chips power.
Separately, Nvidia-backed Nscale has drawn scrutiny for reportedly downplaying its significant sales ties with ByteDance while pitching investors ahead of a planned U.S. IPO. ByteDance accounted for a large share of Nscale’s sales last year, yet that relationship was not prominently disclosed, raising questions about transparency standards for companies riding the AI investment wave toward public markets. For investors, this kind of disclosure gap is a reminder that enthusiasm around AI infrastructure names doesn’t exempt them from standard scrutiny over customer concentration and dependency risk.
Article produced with the assistance of artificial intelligence and reviewed by the editorial team.
Nvidia stock performance hits record high as Cantor Fitzgerald targets $350
Nvidia’s share price pushed to a fresh all-time high of $236.57 this week, extending a rally that has turned the chipmaker into one of the standout stories of the current market cycle. The move puts Nvidia stock performance back in the spotlight just as Wall Street weighs how much further the AI-driven run can go, and as new questions swirl around the broader semiconductor supply chain feeding that boom.
Key takeaways
Nvidia shares hit an all-time high of $236.57.
The stock is up more than 30% over the past six months and 25.98% over the past year, according to Investing.com.
Cantor Fitzgerald reiterated an Overweight rating and a $350 price target following investor meetings with CEO Jensen Huang in New York City.
Bank of America lifted its U.S. semiconductor industry growth forecast to 18% annually between 2026 and 2030.
Pope Leo XIV criticized Nvidia’s approach to AI safety, while Nscale faced scrutiny over undisclosed ByteDance sales ties ahead of a planned U.S. IPO.
Nvidia’s Record Stock Performance
Nvidia’s climb to $236.57 confirms that investor appetite for the company has barely cooled, even after years of outsized gains. The stock has reached this all-time high, a sign that buyers are treating the AI chip leader as a near-permanent fixture at the top of the market.
The momentum isn’t a one-week story. Nvidia’s shares have gained more than 30% over the past six months alone, and the one-year change now stands at 25.98%, according to data reported by Investing.com. That kind of sustained Nvidia stock performance reflects not just a single catalyst but a stacking of positive developments — from data-center demand to new product rollouts — that have kept institutional money flowing in.
Valuation Insights
Despite the run-up, Investing.com’s InvestingPro analysis suggests the stock remains undervalued relative to its Fair Value, pointing to potential further upside. That kind of read matters because it pushes back against the common assumption that a stock trading near record highs must be stretched. If the valuation gap InvestingPro flags holds up, it would mean the market hasn’t yet fully priced in Nvidia’s current growth trajectory — a detail that helps explain why some desks remain bullish even after such a steep climb.
Investment Ratings and Leadership Engagement
Wall Street’s confidence in Nvidia isn’t just reflected in the share price — it’s showing up directly in analyst calls. Cantor Fitzgerald reiterated its Overweight rating on the stock, keeping a price target of $350.00, a level that implies meaningful room for the shares to climb from where they currently trade.
That call followed investor meetings in New York City where Nvidia CEO Jensen Huang and other senior executives engaged directly with the investment community, according to Yahoo Finance. Face time with leadership at this stage of the rally tends to carry extra weight: it signals that Nvidia’s management is actively shaping the narrative around its growth story rather than letting the stock price speak entirely on its own. Cantor Fitzgerald’s reiterated target effectively tells investors the firm sees further headroom even after the record close, reinforcing the bullish case built around continued AI infrastructure spending.
Industry Developments and Corporate Initiatives
Nvidia’s rally is unfolding against a backdrop of broader hardware momentum. Super Micro Computer has started shipping Nvidia Vera Rubin NVL72 racks, systems built with advanced cooling technology designed to handle the intense thermal loads of next-generation AI chips. Shipments like these are a concrete signal that Nvidia’s newest architecture is moving from announcement to deployment, which matters for investors trying to gauge how quickly the company’s product pipeline converts into actual revenue.
Semiconductor Growth Outlook
Taking a broader view, Bank of America has lifted its outlook for the U.S. semiconductor sector, now projecting an 18% yearly growth rate from 2026 through 2030, with the upgrade tied to improved expectations for memory chips and server components. That upgraded outlook offers useful context for the broader Nvidia semiconductor growth story: if the sector as a whole is set to expand at that pace, Nvidia’s own trajectory looks less like an isolated spike and more like a reflection of an industry-wide buildout in AI infrastructure. This is one of the reasons the current rally matters beyond a single stock — it ties directly into how fast the chip supply chain can scale to meet AI demand.
Controversies and Market Transparency Issues
Not every recent headline around Nvidia has been bullish. Nvidia faced criticism over its stance on AI safety, with concerns raised about the company taking the technology’s risks more seriously — a notable instance of Nvidia AI safety concerns reaching beyond the usual circle of regulators and industry critics. The remarks add to a growing public conversation about how aggressively AI hardware makers should be held accountable for the systems their chips power.
Separately, Nvidia-backed Nscale has drawn scrutiny for reportedly downplaying its significant sales ties with ByteDance while pitching investors ahead of a planned U.S. IPO. ByteDance accounted for a large share of Nscale’s sales last year, yet that relationship was not prominently disclosed, raising questions about transparency standards for companies riding the AI investment wave toward public markets. For investors, this kind of disclosure gap is a reminder that enthusiasm around AI infrastructure names doesn’t exempt them from standard scrutiny over customer concentration and dependency risk.
Article produced with the assistance of artificial intelligence and reviewed by the editorial team.
Key takeaways
Nvidia shares hit an all-time high of $236.57.
The stock is up more than 30% over the past six months and 25.98% over the past year, according to Investing.com.
Cantor Fitzgerald reiterated an Overweight rating and a $350 price target following investor meetings with CEO Jensen Huang in New York City.
Bank of America lifted its U.S. semiconductor industry growth forecast to 18% annually between 2026 and 2030.
Pope Leo XIV criticized Nvidia’s approach to AI safety, while Nscale faced scrutiny over undisclosed ByteDance sales ties ahead of a planned U.S. IPO.
Nvidia’s Record Stock Performance
Nvidia’s climb to $236.57 confirms that investor appetite for the company has barely cooled, even after years of outsized gains. The stock has reached this all-time high, a sign that buyers are treating the AI chip leader as a near-permanent fixture at the top of the market.
The momentum isn’t a one-week story. Nvidia’s shares have gained more than 30% over the past six months alone, and the one-year change now stands at 25.98%, according to data reported by Investing.com. That kind of sustained Nvidia stock performance reflects not just a single catalyst but a stacking of positive developments — from data-center demand to new product rollouts — that have kept institutional money flowing in.
Valuation Insights
Despite the run-up, Investing.com’s InvestingPro analysis suggests the stock remains undervalued relative to its Fair Value, pointing to potential further upside. That kind of read matters because it pushes back against the common assumption that a stock trading near record highs must be stretched. If the valuation gap InvestingPro flags holds up, it would mean the market hasn’t yet fully priced in Nvidia’s current growth trajectory — a detail that helps explain why some desks remain bullish even after such a steep climb.
Investment Ratings and Leadership Engagement
Wall Street’s confidence in Nvidia isn’t just reflected in the share price — it’s showing up directly in analyst calls. Cantor Fitzgerald reiterated its Overweight rating on the stock, keeping a price target of $350.00, a level that implies meaningful room for the shares to climb from where they currently trade.
That call followed investor meetings in New York City where Nvidia CEO Jensen Huang and other senior executives engaged directly with the investment community, according to Yahoo Finance. Face time with leadership at this stage of the rally tends to carry extra weight: it signals that Nvidia’s management is actively shaping the narrative around its growth story rather than letting the stock price speak entirely on its own. Cantor Fitzgerald’s reiterated target effectively tells investors the firm sees further headroom even after the record close, reinforcing the bullish case built around continued AI infrastructure spending.
Industry Developments and Corporate Initiatives
Nvidia’s rally is unfolding against a backdrop of broader hardware momentum. Super Micro Computer has started shipping Nvidia Vera Rubin NVL72 racks, systems built with advanced cooling technology designed to handle the intense thermal loads of next-generation AI chips. Shipments like these are a concrete signal that Nvidia’s newest architecture is moving from announcement to deployment, which matters for investors trying to gauge how quickly the company’s product pipeline converts into actual revenue.
Semiconductor Growth Outlook
Taking a broader view, Bank of America has lifted its outlook for the U.S. semiconductor sector, now projecting an 18% yearly growth rate from 2026 through 2030, with the upgrade tied to improved expectations for memory chips and server components. That upgraded outlook offers useful context for the broader Nvidia semiconductor growth story: if the sector as a whole is set to expand at that pace, Nvidia’s own trajectory looks less like an isolated spike and more like a reflection of an industry-wide buildout in AI infrastructure. This is one of the reasons the current rally matters beyond a single stock — it ties directly into how fast the chip supply chain can scale to meet AI demand.
Controversies and Market Transparency Issues
Not every recent headline around Nvidia has been bullish. Nvidia faced criticism over its stance on AI safety, with concerns raised about the company taking the technology’s risks more seriously — a notable instance of Nvidia AI safety concerns reaching beyond the usual circle of regulators and industry critics. The remarks add to a growing public conversation about how aggressively AI hardware makers should be held accountable for the systems their chips power.
Separately, Nvidia-backed Nscale has drawn scrutiny for reportedly downplaying its significant sales ties with ByteDance while pitching investors ahead of a planned U.S. IPO. ByteDance accounted for a large share of Nscale’s sales last year, yet that relationship was not prominently disclosed, raising questions about transparency standards for companies riding the AI investment wave toward public markets. For investors, this kind of disclosure gap is a reminder that enthusiasm around AI infrastructure names doesn’t exempt them from standard scrutiny over customer concentration and dependency risk.
Article produced with the assistance of artificial intelligence and reviewed by the editorial team.
61

Article
See translation
Crédit Agricole embeds euro stablecoin compliance into EURXT’s smart contractCrédit Agricole CACEIS has secured the code name EURXT for a new euro-denominated stablecoin, a move that puts euro stablecoin compliance at the center of its design rather than treating regulation as an afterthought. The project, developed with smart-contract security firm OpenZeppelin, builds compliance checks directly into the token’s underlying code, a choice that lines up with the European Union’s incoming Markets in Crypto-Assets (MiCA) framework.
Key takeaways
The EURXT code has been obtained by Crédit Agricole CACEIS for a regulated euro stablecoin.
Compliance checks are embedded inside the smart contract itself.
The project is designed to align with the EU’s Markets in Crypto-Assets (MiCA) regulations.
EURXT is intended to help financial institutions operate within tightening regulatory requirements.
The broader cryptocurrency market is currently showing muted price action as regulatory developments take center stage.
Crédit Agricole and OpenZeppelin Build a Compliance-First Stablecoin
The headline development here is straightforward: a major European banking group is pushing forward with its own euro stablecoin, and it’s doing so with regulatory compliance written into the product from day one. Crédit Agricole CACEIS has locked in the EURXT code, and the announcement — flagged by OpenZeppelin — frames the token as a direct response to the regulatory environment taking shape across the EU.
EURXT Code Secured by Crédit Agricole CACEIS
Securing the EURXT code is the first concrete step toward a regulated euro stablecoin backed by one of Europe‘s established financial institutions. Rather than launching a token and retrofitting compliance later, Crédit Agricole CACEIS appears to be building the rulebook into the product itself, emphasizing that compliance must be enforced within the smart contract rather than bolted on through external monitoring.
OpenZeppelin’s Role in Ensuring Regulatory Adherence
OpenZeppelin, a firm known for security and compliance work on decentralized applications and smart contracts, secured the EURXT code. Its involvement signals that the stablecoin’s technical architecture was built with regulatory scrutiny in mind from the outset, not as a bolt-on feature added after deployment. For a market where smart-contract vulnerabilities and compliance gaps have repeatedly drawn regulatory attention, having a specialist security firm behind the code adds a layer of credibility that institutional players tend to weigh heavily.
Alignment with the EU Markets in Crypto-Assets (MiCA) Regulations
EURXT’s design choices track closely with what MiCA is expected to demand from stablecoin issuers operating in the EU. The regulation is set to establish new standards for digital asset compliance across the bloc, and a token built around embedded, enforceable rules is positioned to meet those standards more directly than a stablecoin that relies on off-chain compliance processes.
Embedding Compliance Within Smart Contracts
Putting compliance logic inside the smart contract itself means the rules travel with the token wherever it moves. That’s a meaningful distinction: a stablecoin with compliance baked into its code doesn’t depend solely on external audits or manual oversight to catch violations after the fact. In practice, this approach could make it easier for regulators and institutions alike to trust that the token behaves consistently, transaction after transaction.
Regulatory Framework and Its Impact on Crypto Asset Management
MiCA’s arrival is expected to reshape how euro-denominated digital assets are issued and managed across Europe. As the framework tightens, projects like EURXT that prioritize built-in regulatory adherence may be better positioned to operate without friction, while stablecoins designed under looser assumptions could face a harder adjustment. This is one of the reasons the EURXT announcement is being read as more than a routine product launch — it’s a signal of how compliance-first design is becoming a competitive requirement, not just a legal checkbox.
Implications for Financial Institutions and the Stablecoin Market
EURXT is expected to give financial institutions a clearer path through an increasingly complex regulatory landscape, offering a euro stablecoin option that doesn’t require them to build their own compliance infrastructure from scratch.
Supporting Institutions in Navigating Regulatory Environments
For banks, asset managers and payment firms exploring digital euro exposure, a stablecoin that already satisfies core MiCA-style requirements removes a significant layer of regulatory risk. Institutions weighing whether to adopt stablecoins for settlement, treasury operations or cross-border payments may find a compliance-embedded option like EURXT easier to justify internally, particularly as oversight of digital assets intensifies.
Potential Market Effects Amid Increased Regulatory Focus
Why does this matter beyond Crédit Agricole’s own balance sheet? Because the EURXT initiative is expected to influence broader market dynamics as interest in compliant stablecoins grows. If institutional demand shifts toward tokens built around regulatory adherence, issuers that haven’t embedded compliance into their smart contracts could find themselves at a disadvantage, especially once MiCA enforcement ramps up across the bloc.
Current Cryptocurrency Market Context and Future Outlook
The wider cryptocurrency market is currently showing muted price movement, with attention shifting toward regulatory developments rather than short-term trading momentum. That backdrop makes the timing of the EURXT announcement notable: compliance-driven projects are emerging at a moment when regulatory clarity, not speculative price action, appears to be the dominant theme shaping sentiment around digital assets in Europe.
Outlook for Compliance-Driven Stablecoins in Europe
As MiCA regulations take fuller effect, stablecoins built around enforceable, embedded compliance — like EURXT — are likely to draw closer attention from institutions weighing their next move in digital assets. Whether other European banks follow Crédit Agricole’s approach, or whether EURXT becomes a reference model for compliance-first stablecoin design, is something the market will be watching closely as the regulatory picture in Europe continues to take shape.
Article produced with the assistance of artificial intelligence and reviewed by the editorial team.
Crédit Agricole embeds euro stablecoin compliance into EURXT’s smart contract
Crédit Agricole CACEIS has secured the code name EURXT for a new euro-denominated stablecoin, a move that puts euro stablecoin compliance at the center of its design rather than treating regulation as an afterthought. The project, developed with smart-contract security firm OpenZeppelin, builds compliance checks directly into the token’s underlying code, a choice that lines up with the European Union’s incoming Markets in Crypto-Assets (MiCA) framework.
Key takeaways
The EURXT code has been obtained by Crédit Agricole CACEIS for a regulated euro stablecoin.
Compliance checks are embedded inside the smart contract itself.
The project is designed to align with the EU’s Markets in Crypto-Assets (MiCA) regulations.
EURXT is intended to help financial institutions operate within tightening regulatory requirements.
The broader cryptocurrency market is currently showing muted price action as regulatory developments take center stage.
Crédit Agricole and OpenZeppelin Build a Compliance-First Stablecoin
The headline development here is straightforward: a major European banking group is pushing forward with its own euro stablecoin, and it’s doing so with regulatory compliance written into the product from day one. Crédit Agricole CACEIS has locked in the EURXT code, and the announcement — flagged by OpenZeppelin — frames the token as a direct response to the regulatory environment taking shape across the EU.
EURXT Code Secured by Crédit Agricole CACEIS
Securing the EURXT code is the first concrete step toward a regulated euro stablecoin backed by one of Europe‘s established financial institutions. Rather than launching a token and retrofitting compliance later, Crédit Agricole CACEIS appears to be building the rulebook into the product itself, emphasizing that compliance must be enforced within the smart contract rather than bolted on through external monitoring.
OpenZeppelin’s Role in Ensuring Regulatory Adherence
OpenZeppelin, a firm known for security and compliance work on decentralized applications and smart contracts, secured the EURXT code. Its involvement signals that the stablecoin’s technical architecture was built with regulatory scrutiny in mind from the outset, not as a bolt-on feature added after deployment. For a market where smart-contract vulnerabilities and compliance gaps have repeatedly drawn regulatory attention, having a specialist security firm behind the code adds a layer of credibility that institutional players tend to weigh heavily.
Alignment with the EU Markets in Crypto-Assets (MiCA) Regulations
EURXT’s design choices track closely with what MiCA is expected to demand from stablecoin issuers operating in the EU. The regulation is set to establish new standards for digital asset compliance across the bloc, and a token built around embedded, enforceable rules is positioned to meet those standards more directly than a stablecoin that relies on off-chain compliance processes.
Embedding Compliance Within Smart Contracts
Putting compliance logic inside the smart contract itself means the rules travel with the token wherever it moves. That’s a meaningful distinction: a stablecoin with compliance baked into its code doesn’t depend solely on external audits or manual oversight to catch violations after the fact. In practice, this approach could make it easier for regulators and institutions alike to trust that the token behaves consistently, transaction after transaction.
Regulatory Framework and Its Impact on Crypto Asset Management
MiCA’s arrival is expected to reshape how euro-denominated digital assets are issued and managed across Europe. As the framework tightens, projects like EURXT that prioritize built-in regulatory adherence may be better positioned to operate without friction, while stablecoins designed under looser assumptions could face a harder adjustment. This is one of the reasons the EURXT announcement is being read as more than a routine product launch — it’s a signal of how compliance-first design is becoming a competitive requirement, not just a legal checkbox.
Implications for Financial Institutions and the Stablecoin Market
EURXT is expected to give financial institutions a clearer path through an increasingly complex regulatory landscape, offering a euro stablecoin option that doesn’t require them to build their own compliance infrastructure from scratch.
Supporting Institutions in Navigating Regulatory Environments
For banks, asset managers and payment firms exploring digital euro exposure, a stablecoin that already satisfies core MiCA-style requirements removes a significant layer of regulatory risk. Institutions weighing whether to adopt stablecoins for settlement, treasury operations or cross-border payments may find a compliance-embedded option like EURXT easier to justify internally, particularly as oversight of digital assets intensifies.
Potential Market Effects Amid Increased Regulatory Focus
Why does this matter beyond Crédit Agricole’s own balance sheet? Because the EURXT initiative is expected to influence broader market dynamics as interest in compliant stablecoins grows. If institutional demand shifts toward tokens built around regulatory adherence, issuers that haven’t embedded compliance into their smart contracts could find themselves at a disadvantage, especially once MiCA enforcement ramps up across the bloc.
Current Cryptocurrency Market Context and Future Outlook
The wider cryptocurrency market is currently showing muted price movement, with attention shifting toward regulatory developments rather than short-term trading momentum. That backdrop makes the timing of the EURXT announcement notable: compliance-driven projects are emerging at a moment when regulatory clarity, not speculative price action, appears to be the dominant theme shaping sentiment around digital assets in Europe.
Outlook for Compliance-Driven Stablecoins in Europe
As MiCA regulations take fuller effect, stablecoins built around enforceable, embedded compliance — like EURXT — are likely to draw closer attention from institutions weighing their next move in digital assets. Whether other European banks follow Crédit Agricole’s approach, or whether EURXT becomes a reference model for compliance-first stablecoin design, is something the market will be watching closely as the regulatory picture in Europe continues to take shape.
Article produced with the assistance of artificial intelligence and reviewed by the editorial team.
Key takeaways
The EURXT code has been obtained by Crédit Agricole CACEIS for a regulated euro stablecoin.
Compliance checks are embedded inside the smart contract itself.
The project is designed to align with the EU’s Markets in Crypto-Assets (MiCA) regulations.
EURXT is intended to help financial institutions operate within tightening regulatory requirements.
The broader cryptocurrency market is currently showing muted price action as regulatory developments take center stage.
Crédit Agricole and OpenZeppelin Build a Compliance-First Stablecoin
The headline development here is straightforward: a major European banking group is pushing forward with its own euro stablecoin, and it’s doing so with regulatory compliance written into the product from day one. Crédit Agricole CACEIS has locked in the EURXT code, and the announcement — flagged by OpenZeppelin — frames the token as a direct response to the regulatory environment taking shape across the EU.
EURXT Code Secured by Crédit Agricole CACEIS
Securing the EURXT code is the first concrete step toward a regulated euro stablecoin backed by one of Europe‘s established financial institutions. Rather than launching a token and retrofitting compliance later, Crédit Agricole CACEIS appears to be building the rulebook into the product itself, emphasizing that compliance must be enforced within the smart contract rather than bolted on through external monitoring.
OpenZeppelin’s Role in Ensuring Regulatory Adherence
OpenZeppelin, a firm known for security and compliance work on decentralized applications and smart contracts, secured the EURXT code. Its involvement signals that the stablecoin’s technical architecture was built with regulatory scrutiny in mind from the outset, not as a bolt-on feature added after deployment. For a market where smart-contract vulnerabilities and compliance gaps have repeatedly drawn regulatory attention, having a specialist security firm behind the code adds a layer of credibility that institutional players tend to weigh heavily.
Alignment with the EU Markets in Crypto-Assets (MiCA) Regulations
EURXT’s design choices track closely with what MiCA is expected to demand from stablecoin issuers operating in the EU. The regulation is set to establish new standards for digital asset compliance across the bloc, and a token built around embedded, enforceable rules is positioned to meet those standards more directly than a stablecoin that relies on off-chain compliance processes.
Embedding Compliance Within Smart Contracts
Putting compliance logic inside the smart contract itself means the rules travel with the token wherever it moves. That’s a meaningful distinction: a stablecoin with compliance baked into its code doesn’t depend solely on external audits or manual oversight to catch violations after the fact. In practice, this approach could make it easier for regulators and institutions alike to trust that the token behaves consistently, transaction after transaction.
Regulatory Framework and Its Impact on Crypto Asset Management
MiCA’s arrival is expected to reshape how euro-denominated digital assets are issued and managed across Europe. As the framework tightens, projects like EURXT that prioritize built-in regulatory adherence may be better positioned to operate without friction, while stablecoins designed under looser assumptions could face a harder adjustment. This is one of the reasons the EURXT announcement is being read as more than a routine product launch — it’s a signal of how compliance-first design is becoming a competitive requirement, not just a legal checkbox.
Implications for Financial Institutions and the Stablecoin Market
EURXT is expected to give financial institutions a clearer path through an increasingly complex regulatory landscape, offering a euro stablecoin option that doesn’t require them to build their own compliance infrastructure from scratch.
Supporting Institutions in Navigating Regulatory Environments
For banks, asset managers and payment firms exploring digital euro exposure, a stablecoin that already satisfies core MiCA-style requirements removes a significant layer of regulatory risk. Institutions weighing whether to adopt stablecoins for settlement, treasury operations or cross-border payments may find a compliance-embedded option like EURXT easier to justify internally, particularly as oversight of digital assets intensifies.
Potential Market Effects Amid Increased Regulatory Focus
Why does this matter beyond Crédit Agricole’s own balance sheet? Because the EURXT initiative is expected to influence broader market dynamics as interest in compliant stablecoins grows. If institutional demand shifts toward tokens built around regulatory adherence, issuers that haven’t embedded compliance into their smart contracts could find themselves at a disadvantage, especially once MiCA enforcement ramps up across the bloc.
Current Cryptocurrency Market Context and Future Outlook
The wider cryptocurrency market is currently showing muted price movement, with attention shifting toward regulatory developments rather than short-term trading momentum. That backdrop makes the timing of the EURXT announcement notable: compliance-driven projects are emerging at a moment when regulatory clarity, not speculative price action, appears to be the dominant theme shaping sentiment around digital assets in Europe.
Outlook for Compliance-Driven Stablecoins in Europe
As MiCA regulations take fuller effect, stablecoins built around enforceable, embedded compliance — like EURXT — are likely to draw closer attention from institutions weighing their next move in digital assets. Whether other European banks follow Crédit Agricole’s approach, or whether EURXT becomes a reference model for compliance-first stablecoin design, is something the market will be watching closely as the regulatory picture in Europe continues to take shape.
Article produced with the assistance of artificial intelligence and reviewed by the editorial team.
17

Article
See translation
JPMorgan crypto symposium signals bigger ETF push for digital assetsJPMorgan opened the doors of its new headquarters this week for an ETF symposium that put the bank’s crypto ambitions on full display, and the timing says as much as the venue itself. At a moment when the broader crypto market is sending mixed signals across major tokens, one of Wall Street’s biggest institutions chose to gather industry figures under one roof to talk cryptocurrency investment strategies. The JPMorgan crypto symposium didn’t just happen anywhere — it happened inside a building the bank is clearly using to signal where its priorities sit.
Key takeaways
JPMorgan held an ETF symposium at its newly built headquarters, a building that spans over 12 million square feet of modern architecture.
The event brought together influential figures from both the crypto and traditional finance sectors to discuss cryptocurrency investment strategies and market trends.
Organizers framed the gathering as a sign of deepening institutional crypto involvement and a possible precursor to new cryptocurrency ETF offerings.
Across major assets, the wider crypto market is sending mixed signals right now, with momentum varying from one to the next.
Traders are being told to watch Bitcoin dominance and its correlation with overall market cycles going forward.
JPMorgan Hosts ETF Symposium at New Headquarters
The short answer: JPMorgan used its brand-new headquarters to host an ETF-focused symposium centered on cryptocurrency, and the choice of venue was clearly part of the message. A bank doesn’t build a 12-million-square-foot statement of modern architecture and then quietly tuck a crypto event into a back room. This was front and center.
Inside the New Headquarters and Event Highlights
The venue’s scale is hard to overstate. JPMorgan’s new headquarters spans over 12 million square feet, and its modern design reportedly gave the symposium an “inspiring backdrop” for the conversations happening inside. That detail matters beyond aesthetics — it signals that the bank is willing to put its most visible physical asset behind a crypto-related gathering, rather than hosting it somewhere lower-profile. Attendees included influential figures drawn from both the crypto world and traditional finance, a pairing that itself reflects how much those two worlds have started to overlap.
For a bank the size of JPMorgan, staging this kind of symposium inside its own flagship building is itself a statement. It tells the market that digital assets are no longer treated as a side conversation happening in smaller venues or off-site conferences — they are being discussed in the same rooms where the bank handles its core investment banking and asset management business.
Focus on Cryptocurrency Investment Strategies and Market Trends
The symposium’s agenda centered on where cryptocurrency investing is headed next, and the discussions unfolded against a market backdrop that is anything but settled. That combination — strategy talk layered onto choppy market conditions — is part of why the event drew attention beyond the finance crowd.
Symposium Discussions on Crypto Investment
Attendees at the JPMorgan crypto symposium engaged in conversations that organizers say could shape future investment strategies tied to cryptocurrency ETF investment products. The discussions weren’t framed as abstract theorizing; they were positioned as directly relevant to how ETF offerings in the crypto space might evolve from here.
Current Crypto Market Conditions
Right now, the broader crypto market is showing mixed signals, with varying momentum across major assets rather than a single clear direction. That backdrop is worth noting: a symposium about crypto investment strategy lands differently when the market itself hasn’t settled into a consistent trend. It raises the stakes for any insights that came out of the room, since investors navigating that uncertainty may be looking for signals from exactly the kind of institutional voices JPMorgan gathered.
JPMorgan’s Growing Institutional Role in Crypto and ETF Markets
This event reads as another data point in a longer pattern: traditional finance is steadily narrowing the distance between itself and digital assets. JPMorgan, as one of the largest financial institutions globally, carries outsized weight whenever it leans into a sector — and crypto is clearly one it’s leaning into.
Commitment to Innovation in the Crypto Sector
The symposium itself was framed as evidence of JPMorgan’s commitment to innovation within the crypto sector. Holding it inside the bank’s newly designed headquarters reinforced that framing, underscoring the institution’s stated role in shaping investment trends around digital assets rather than simply observing them from a distance.
Potential Influence on Future Cryptocurrency ETFs
Here’s why this matters for anyone tracking ETF markets: insights shared during the symposium could carry lasting implications for future ETF offerings tied to cryptocurrency. JPMorgan’s scale gives it the ability to influence policies and practices across the financial industry, so a symposium hosted at its own headquarters isn’t just a one-off conversation — it’s the kind of event that can nudge how other institutions approach crypto ETF products down the line. This event at JPMorgan’s headquarters could mark a new phase of institutional involvement in crypto investments, with knock-on effects for how the market prices and structures future products.
Important Trading Factors: Bitcoin Dominance and Market Cycles
Looking ahead, traders are being pointed toward two specific things to watch: Bitcoin dominance and its correlation with overall market cycles. Both factors are described as key to shaping investment strategies in the period following the symposium.
Why this matters for investors: as institutional interest builds, the market may see increased ETF offerings tied to cryptocurrency, and the pace of that growth could hinge on how Bitcoin dominance moves relative to broader cycles. None of this guarantees a specific outcome, but it does mean the signals coming out of events like this JPMorgan crypto symposium are worth tracking alongside the raw price action.
Article produced with the assistance of artificial intelligence and reviewed by the editorial team.
JPMorgan crypto symposium signals bigger ETF push for digital assets
JPMorgan opened the doors of its new headquarters this week for an ETF symposium that put the bank’s crypto ambitions on full display, and the timing says as much as the venue itself. At a moment when the broader crypto market is sending mixed signals across major tokens, one of Wall Street’s biggest institutions chose to gather industry figures under one roof to talk cryptocurrency investment strategies. The JPMorgan crypto symposium didn’t just happen anywhere — it happened inside a building the bank is clearly using to signal where its priorities sit.
Key takeaways
JPMorgan held an ETF symposium at its newly built headquarters, a building that spans over 12 million square feet of modern architecture.
The event brought together influential figures from both the crypto and traditional finance sectors to discuss cryptocurrency investment strategies and market trends.
Organizers framed the gathering as a sign of deepening institutional crypto involvement and a possible precursor to new cryptocurrency ETF offerings.
Across major assets, the wider crypto market is sending mixed signals right now, with momentum varying from one to the next.
Traders are being told to watch Bitcoin dominance and its correlation with overall market cycles going forward.
JPMorgan Hosts ETF Symposium at New Headquarters
The short answer: JPMorgan used its brand-new headquarters to host an ETF-focused symposium centered on cryptocurrency, and the choice of venue was clearly part of the message. A bank doesn’t build a 12-million-square-foot statement of modern architecture and then quietly tuck a crypto event into a back room. This was front and center.
Inside the New Headquarters and Event Highlights
The venue’s scale is hard to overstate. JPMorgan’s new headquarters spans over 12 million square feet, and its modern design reportedly gave the symposium an “inspiring backdrop” for the conversations happening inside. That detail matters beyond aesthetics — it signals that the bank is willing to put its most visible physical asset behind a crypto-related gathering, rather than hosting it somewhere lower-profile. Attendees included influential figures drawn from both the crypto world and traditional finance, a pairing that itself reflects how much those two worlds have started to overlap.
For a bank the size of JPMorgan, staging this kind of symposium inside its own flagship building is itself a statement. It tells the market that digital assets are no longer treated as a side conversation happening in smaller venues or off-site conferences — they are being discussed in the same rooms where the bank handles its core investment banking and asset management business.
Focus on Cryptocurrency Investment Strategies and Market Trends
The symposium’s agenda centered on where cryptocurrency investing is headed next, and the discussions unfolded against a market backdrop that is anything but settled. That combination — strategy talk layered onto choppy market conditions — is part of why the event drew attention beyond the finance crowd.
Symposium Discussions on Crypto Investment
Attendees at the JPMorgan crypto symposium engaged in conversations that organizers say could shape future investment strategies tied to cryptocurrency ETF investment products. The discussions weren’t framed as abstract theorizing; they were positioned as directly relevant to how ETF offerings in the crypto space might evolve from here.
Current Crypto Market Conditions
Right now, the broader crypto market is showing mixed signals, with varying momentum across major assets rather than a single clear direction. That backdrop is worth noting: a symposium about crypto investment strategy lands differently when the market itself hasn’t settled into a consistent trend. It raises the stakes for any insights that came out of the room, since investors navigating that uncertainty may be looking for signals from exactly the kind of institutional voices JPMorgan gathered.
JPMorgan’s Growing Institutional Role in Crypto and ETF Markets
This event reads as another data point in a longer pattern: traditional finance is steadily narrowing the distance between itself and digital assets. JPMorgan, as one of the largest financial institutions globally, carries outsized weight whenever it leans into a sector — and crypto is clearly one it’s leaning into.
Commitment to Innovation in the Crypto Sector
The symposium itself was framed as evidence of JPMorgan’s commitment to innovation within the crypto sector. Holding it inside the bank’s newly designed headquarters reinforced that framing, underscoring the institution’s stated role in shaping investment trends around digital assets rather than simply observing them from a distance.
Potential Influence on Future Cryptocurrency ETFs
Here’s why this matters for anyone tracking ETF markets: insights shared during the symposium could carry lasting implications for future ETF offerings tied to cryptocurrency. JPMorgan’s scale gives it the ability to influence policies and practices across the financial industry, so a symposium hosted at its own headquarters isn’t just a one-off conversation — it’s the kind of event that can nudge how other institutions approach crypto ETF products down the line. This event at JPMorgan’s headquarters could mark a new phase of institutional involvement in crypto investments, with knock-on effects for how the market prices and structures future products.
Important Trading Factors: Bitcoin Dominance and Market Cycles
Looking ahead, traders are being pointed toward two specific things to watch: Bitcoin dominance and its correlation with overall market cycles. Both factors are described as key to shaping investment strategies in the period following the symposium.
Why this matters for investors: as institutional interest builds, the market may see increased ETF offerings tied to cryptocurrency, and the pace of that growth could hinge on how Bitcoin dominance moves relative to broader cycles. None of this guarantees a specific outcome, but it does mean the signals coming out of events like this JPMorgan crypto symposium are worth tracking alongside the raw price action.
Article produced with the assistance of artificial intelligence and reviewed by the editorial team.
Key takeaways
JPMorgan held an ETF symposium at its newly built headquarters, a building that spans over 12 million square feet of modern architecture.
The event brought together influential figures from both the crypto and traditional finance sectors to discuss cryptocurrency investment strategies and market trends.
Organizers framed the gathering as a sign of deepening institutional crypto involvement and a possible precursor to new cryptocurrency ETF offerings.
Across major assets, the wider crypto market is sending mixed signals right now, with momentum varying from one to the next.
Traders are being told to watch Bitcoin dominance and its correlation with overall market cycles going forward.
JPMorgan Hosts ETF Symposium at New Headquarters
The short answer: JPMorgan used its brand-new headquarters to host an ETF-focused symposium centered on cryptocurrency, and the choice of venue was clearly part of the message. A bank doesn’t build a 12-million-square-foot statement of modern architecture and then quietly tuck a crypto event into a back room. This was front and center.
Inside the New Headquarters and Event Highlights
The venue’s scale is hard to overstate. JPMorgan’s new headquarters spans over 12 million square feet, and its modern design reportedly gave the symposium an “inspiring backdrop” for the conversations happening inside. That detail matters beyond aesthetics — it signals that the bank is willing to put its most visible physical asset behind a crypto-related gathering, rather than hosting it somewhere lower-profile. Attendees included influential figures drawn from both the crypto world and traditional finance, a pairing that itself reflects how much those two worlds have started to overlap.
For a bank the size of JPMorgan, staging this kind of symposium inside its own flagship building is itself a statement. It tells the market that digital assets are no longer treated as a side conversation happening in smaller venues or off-site conferences — they are being discussed in the same rooms where the bank handles its core investment banking and asset management business.
Focus on Cryptocurrency Investment Strategies and Market Trends
The symposium’s agenda centered on where cryptocurrency investing is headed next, and the discussions unfolded against a market backdrop that is anything but settled. That combination — strategy talk layered onto choppy market conditions — is part of why the event drew attention beyond the finance crowd.
Symposium Discussions on Crypto Investment
Attendees at the JPMorgan crypto symposium engaged in conversations that organizers say could shape future investment strategies tied to cryptocurrency ETF investment products. The discussions weren’t framed as abstract theorizing; they were positioned as directly relevant to how ETF offerings in the crypto space might evolve from here.
Current Crypto Market Conditions
Right now, the broader crypto market is showing mixed signals, with varying momentum across major assets rather than a single clear direction. That backdrop is worth noting: a symposium about crypto investment strategy lands differently when the market itself hasn’t settled into a consistent trend. It raises the stakes for any insights that came out of the room, since investors navigating that uncertainty may be looking for signals from exactly the kind of institutional voices JPMorgan gathered.
JPMorgan’s Growing Institutional Role in Crypto and ETF Markets
This event reads as another data point in a longer pattern: traditional finance is steadily narrowing the distance between itself and digital assets. JPMorgan, as one of the largest financial institutions globally, carries outsized weight whenever it leans into a sector — and crypto is clearly one it’s leaning into.
Commitment to Innovation in the Crypto Sector
The symposium itself was framed as evidence of JPMorgan’s commitment to innovation within the crypto sector. Holding it inside the bank’s newly designed headquarters reinforced that framing, underscoring the institution’s stated role in shaping investment trends around digital assets rather than simply observing them from a distance.
Potential Influence on Future Cryptocurrency ETFs
Here’s why this matters for anyone tracking ETF markets: insights shared during the symposium could carry lasting implications for future ETF offerings tied to cryptocurrency. JPMorgan’s scale gives it the ability to influence policies and practices across the financial industry, so a symposium hosted at its own headquarters isn’t just a one-off conversation — it’s the kind of event that can nudge how other institutions approach crypto ETF products down the line. This event at JPMorgan’s headquarters could mark a new phase of institutional involvement in crypto investments, with knock-on effects for how the market prices and structures future products.
Important Trading Factors: Bitcoin Dominance and Market Cycles
Looking ahead, traders are being pointed toward two specific things to watch: Bitcoin dominance and its correlation with overall market cycles. Both factors are described as key to shaping investment strategies in the period following the symposium.
Why this matters for investors: as institutional interest builds, the market may see increased ETF offerings tied to cryptocurrency, and the pace of that growth could hinge on how Bitcoin dominance moves relative to broader cycles. None of this guarantees a specific outcome, but it does mean the signals coming out of events like this JPMorgan crypto symposium are worth tracking alongside the raw price action.
Article produced with the assistance of artificial intelligence and reviewed by the editorial team.
106

Article
See translation
Federal Reserve’s FRED Connector lets AI tap 850,000 data seriesThe Federal Reserve just handed artificial intelligence a direct line into one of the most widely used economic databases in the world, and the move says as much about who is actually using government data today as it does about the technology itself. On October 1, 2026, Federal Reserve Board Governor Christopher J. Waller announced the launch of the FRED MCP Connector at FRED Con, a conference hosted by the Federal Reserve Bank of St. Louis. The new tool lets AI agents plug straight into FRED, the St. Louis Fed’s sprawling economic database, instead of relying on humans to click through menus and charts.
Key takeaways
The Federal Reserve FRED Connector, officially the FRED MCP Connector, was unveiled by Governor Christopher J. Waller on October 1, 2026, at FRED Con.
AI agents already generate nearly half of FRED’s website traffic, according to Waller.
FRED houses more than 850,000 economic data series drawn from sources such as the Bureau of Economic Analysis, the Bureau of Labor Statistics, and the Census Bureau.
The connector runs on the Model Context Protocol (MCP), works with tools like Claude, and needs no separate API key.
Waller warned that AI-driven interpretation of the data can still produce inaccuracies, hallucinations, and mislabeled sources.
Federal Reserve unveils FRED MCP Connector for AI integration
The core idea behind the Federal Reserve FRED Connector is simple: let AI assistants talk directly to FRED without forcing every developer to build a custom bridge. Waller used FRED Con, the St. Louis Fed’s own conference, as the stage to introduce the tool and frame it as a response to how people already search for economic numbers.
FRED is not a small database. It holds more than 850,000 economic data series, pulling figures from sources including the Bureau of Economic Analysis, the Bureau of Labor Statistics, and the Census Bureau. Historically, reaching that data meant navigating FRED’s own search tools and interface, built for human eyes.
The new connector changes that path. It runs on the Model Context Protocol, or MCP, which works something like a universal power adapter for AI systems. Rather than building a separate custom connection for every AI tool that wants to reach FRED, MCP gives developers and AI agents a shared, standardized plug.
In practical terms, a user’s AI assistant can now query FRED directly, locate a specific series, pull the numbers, and work with them without the person ever opening a browser tab to FRED itself. The connector is compatible with AI tools such as Claude, and notably, it does not require a separate API key to use.
That access point also supports what the St. Louis Fed calls BYOAI, or “Bring Your Own AI.” Instead of forcing users into one proprietary assistant, FRED lets people stick with whatever AI tool they already trust and use, and meets them there through the connector.
FRED database scale and AI usage trends
The scale of FRED’s data library explains why a connector like this matters, but the traffic numbers explain why the Fed built it now. Waller said AI agents already account for nearly half of all visits to the FRED website, a striking share for a government data platform that for decades served mostly human researchers, economists, and journalists typing queries by hand.
That shift did not happen quietly. FRED’s overall traffic is growing at an annual rate of 150%, and AI agents make up roughly half of that expanding volume. In other words, the audience for America’s economic data is increasingly made of machines, not people clicking through charts.
Why this matters: when nearly half of a platform’s users are automated systems rather than humans, the old rules of web design, data labeling, and even security start to look outdated. A database built for a person reading a chart is not necessarily built for a bot trying to parse that same chart’s underlying numbers correctly.
Redesigning FRED for AI compatibility and future enhancements
FRED’s own structure is being reworked to match how AI systems actually consume data, not just how people browse it. Waller said the platform’s traditionally human-centric design needs to evolve into something AI systems can rely on consistently, which means investing in sharper documentation and tighter precision around how data is labeled and described.
That overhaul goes beyond simply opening a connector door. Waller indicated that FRED plans to add further AI-driven features aimed at improving how users access, visualize, and interpret economic data going forward. Natural-language search and more interactive tools are part of that broader roadmap, though specifics on timing were not detailed.
This points to a bigger strategic bet: rather than treating AI traffic as an inconvenience to manage, the Fed appears to be treating it as the primary audience to design for. Given that AI agents already generate close to half of FRED’s traffic and that volume keeps climbing at 150% a year, retrofitting the platform around human browsing habits alone would likely leave the system increasingly mismatched with how it’s actually used.
Risks and challenges highlighted by Governor Waller
Waller did not present the connector as a flawless fix, and he was candid about where things can still go wrong. He cautioned that AI-driven interpretation of economic data carries real risks, including inaccuracies and outright hallucinations, where an AI system generates a plausible-sounding but incorrect figure or explanation.
He also flagged source misattribution as a specific concern. An AI tool might pull the correct number from FRED but credit it to the wrong government agency, creating confusion for anyone downstream who trusts that citation. Since FRED aggregates data from multiple sources, including the Bureau of Economic Analysis, the Bureau of Labor Statistics, and the Census Bureau, getting the attribution wrong isn’t a minor slip; it can mislead researchers relying on that sourcing to judge how reliable a figure is.
Waller’s remarks also pointed to a growth problem that is as much engineering as it is design. Sustaining accuracy and speed while traffic climbs at 150% annually is its own technical puzzle, separate from the question of whether the data itself is being read correctly.
Why this matters: as more AI agents tap into official economic data through tools like the Federal Reserve FRED Connector, the margin for error compounds. A single hallucinated statistic or misattributed source, repeated across thousands of automated queries, could spread faster and further than a one-off human mistake ever would.
Article produced with the assistance of artificial intelligence and reviewed by the editorial team.
Federal Reserve’s FRED Connector lets AI tap 850,000 data series
The Federal Reserve just handed artificial intelligence a direct line into one of the most widely used economic databases in the world, and the move says as much about who is actually using government data today as it does about the technology itself. On October 1, 2026, Federal Reserve Board Governor Christopher J. Waller announced the launch of the FRED MCP Connector at FRED Con, a conference hosted by the Federal Reserve Bank of St. Louis. The new tool lets AI agents plug straight into FRED, the St. Louis Fed’s sprawling economic database, instead of relying on humans to click through menus and charts.
Key takeaways
The Federal Reserve FRED Connector, officially the FRED MCP Connector, was unveiled by Governor Christopher J. Waller on October 1, 2026, at FRED Con.
AI agents already generate nearly half of FRED’s website traffic, according to Waller.
FRED houses more than 850,000 economic data series drawn from sources such as the Bureau of Economic Analysis, the Bureau of Labor Statistics, and the Census Bureau.
The connector runs on the Model Context Protocol (MCP), works with tools like Claude, and needs no separate API key.
Waller warned that AI-driven interpretation of the data can still produce inaccuracies, hallucinations, and mislabeled sources.
Federal Reserve unveils FRED MCP Connector for AI integration
The core idea behind the Federal Reserve FRED Connector is simple: let AI assistants talk directly to FRED without forcing every developer to build a custom bridge. Waller used FRED Con, the St. Louis Fed’s own conference, as the stage to introduce the tool and frame it as a response to how people already search for economic numbers.
FRED is not a small database. It holds more than 850,000 economic data series, pulling figures from sources including the Bureau of Economic Analysis, the Bureau of Labor Statistics, and the Census Bureau. Historically, reaching that data meant navigating FRED’s own search tools and interface, built for human eyes.
The new connector changes that path. It runs on the Model Context Protocol, or MCP, which works something like a universal power adapter for AI systems. Rather than building a separate custom connection for every AI tool that wants to reach FRED, MCP gives developers and AI agents a shared, standardized plug.
In practical terms, a user’s AI assistant can now query FRED directly, locate a specific series, pull the numbers, and work with them without the person ever opening a browser tab to FRED itself. The connector is compatible with AI tools such as Claude, and notably, it does not require a separate API key to use.
That access point also supports what the St. Louis Fed calls BYOAI, or “Bring Your Own AI.” Instead of forcing users into one proprietary assistant, FRED lets people stick with whatever AI tool they already trust and use, and meets them there through the connector.
FRED database scale and AI usage trends
The scale of FRED’s data library explains why a connector like this matters, but the traffic numbers explain why the Fed built it now. Waller said AI agents already account for nearly half of all visits to the FRED website, a striking share for a government data platform that for decades served mostly human researchers, economists, and journalists typing queries by hand.
That shift did not happen quietly. FRED’s overall traffic is growing at an annual rate of 150%, and AI agents make up roughly half of that expanding volume. In other words, the audience for America’s economic data is increasingly made of machines, not people clicking through charts.
Why this matters: when nearly half of a platform’s users are automated systems rather than humans, the old rules of web design, data labeling, and even security start to look outdated. A database built for a person reading a chart is not necessarily built for a bot trying to parse that same chart’s underlying numbers correctly.
Redesigning FRED for AI compatibility and future enhancements
FRED’s own structure is being reworked to match how AI systems actually consume data, not just how people browse it. Waller said the platform’s traditionally human-centric design needs to evolve into something AI systems can rely on consistently, which means investing in sharper documentation and tighter precision around how data is labeled and described.
That overhaul goes beyond simply opening a connector door. Waller indicated that FRED plans to add further AI-driven features aimed at improving how users access, visualize, and interpret economic data going forward. Natural-language search and more interactive tools are part of that broader roadmap, though specifics on timing were not detailed.
This points to a bigger strategic bet: rather than treating AI traffic as an inconvenience to manage, the Fed appears to be treating it as the primary audience to design for. Given that AI agents already generate close to half of FRED’s traffic and that volume keeps climbing at 150% a year, retrofitting the platform around human browsing habits alone would likely leave the system increasingly mismatched with how it’s actually used.
Risks and challenges highlighted by Governor Waller
Waller did not present the connector as a flawless fix, and he was candid about where things can still go wrong. He cautioned that AI-driven interpretation of economic data carries real risks, including inaccuracies and outright hallucinations, where an AI system generates a plausible-sounding but incorrect figure or explanation.
He also flagged source misattribution as a specific concern. An AI tool might pull the correct number from FRED but credit it to the wrong government agency, creating confusion for anyone downstream who trusts that citation. Since FRED aggregates data from multiple sources, including the Bureau of Economic Analysis, the Bureau of Labor Statistics, and the Census Bureau, getting the attribution wrong isn’t a minor slip; it can mislead researchers relying on that sourcing to judge how reliable a figure is.
Waller’s remarks also pointed to a growth problem that is as much engineering as it is design. Sustaining accuracy and speed while traffic climbs at 150% annually is its own technical puzzle, separate from the question of whether the data itself is being read correctly.
Why this matters: as more AI agents tap into official economic data through tools like the Federal Reserve FRED Connector, the margin for error compounds. A single hallucinated statistic or misattributed source, repeated across thousands of automated queries, could spread faster and further than a one-off human mistake ever would.
Article produced with the assistance of artificial intelligence and reviewed by the editorial team.
Key takeaways
The Federal Reserve FRED Connector, officially the FRED MCP Connector, was unveiled by Governor Christopher J. Waller on October 1, 2026, at FRED Con.
AI agents already generate nearly half of FRED’s website traffic, according to Waller.
FRED houses more than 850,000 economic data series drawn from sources such as the Bureau of Economic Analysis, the Bureau of Labor Statistics, and the Census Bureau.
The connector runs on the Model Context Protocol (MCP), works with tools like Claude, and needs no separate API key.
Waller warned that AI-driven interpretation of the data can still produce inaccuracies, hallucinations, and mislabeled sources.
Federal Reserve unveils FRED MCP Connector for AI integration
The core idea behind the Federal Reserve FRED Connector is simple: let AI assistants talk directly to FRED without forcing every developer to build a custom bridge. Waller used FRED Con, the St. Louis Fed’s own conference, as the stage to introduce the tool and frame it as a response to how people already search for economic numbers.
FRED is not a small database. It holds more than 850,000 economic data series, pulling figures from sources including the Bureau of Economic Analysis, the Bureau of Labor Statistics, and the Census Bureau. Historically, reaching that data meant navigating FRED’s own search tools and interface, built for human eyes.
The new connector changes that path. It runs on the Model Context Protocol, or MCP, which works something like a universal power adapter for AI systems. Rather than building a separate custom connection for every AI tool that wants to reach FRED, MCP gives developers and AI agents a shared, standardized plug.
In practical terms, a user’s AI assistant can now query FRED directly, locate a specific series, pull the numbers, and work with them without the person ever opening a browser tab to FRED itself. The connector is compatible with AI tools such as Claude, and notably, it does not require a separate API key to use.
That access point also supports what the St. Louis Fed calls BYOAI, or “Bring Your Own AI.” Instead of forcing users into one proprietary assistant, FRED lets people stick with whatever AI tool they already trust and use, and meets them there through the connector.
FRED database scale and AI usage trends
The scale of FRED’s data library explains why a connector like this matters, but the traffic numbers explain why the Fed built it now. Waller said AI agents already account for nearly half of all visits to the FRED website, a striking share for a government data platform that for decades served mostly human researchers, economists, and journalists typing queries by hand.
That shift did not happen quietly. FRED’s overall traffic is growing at an annual rate of 150%, and AI agents make up roughly half of that expanding volume. In other words, the audience for America’s economic data is increasingly made of machines, not people clicking through charts.
Why this matters: when nearly half of a platform’s users are automated systems rather than humans, the old rules of web design, data labeling, and even security start to look outdated. A database built for a person reading a chart is not necessarily built for a bot trying to parse that same chart’s underlying numbers correctly.
Redesigning FRED for AI compatibility and future enhancements
FRED’s own structure is being reworked to match how AI systems actually consume data, not just how people browse it. Waller said the platform’s traditionally human-centric design needs to evolve into something AI systems can rely on consistently, which means investing in sharper documentation and tighter precision around how data is labeled and described.
That overhaul goes beyond simply opening a connector door. Waller indicated that FRED plans to add further AI-driven features aimed at improving how users access, visualize, and interpret economic data going forward. Natural-language search and more interactive tools are part of that broader roadmap, though specifics on timing were not detailed.
This points to a bigger strategic bet: rather than treating AI traffic as an inconvenience to manage, the Fed appears to be treating it as the primary audience to design for. Given that AI agents already generate close to half of FRED’s traffic and that volume keeps climbing at 150% a year, retrofitting the platform around human browsing habits alone would likely leave the system increasingly mismatched with how it’s actually used.
Risks and challenges highlighted by Governor Waller
Waller did not present the connector as a flawless fix, and he was candid about where things can still go wrong. He cautioned that AI-driven interpretation of economic data carries real risks, including inaccuracies and outright hallucinations, where an AI system generates a plausible-sounding but incorrect figure or explanation.
He also flagged source misattribution as a specific concern. An AI tool might pull the correct number from FRED but credit it to the wrong government agency, creating confusion for anyone downstream who trusts that citation. Since FRED aggregates data from multiple sources, including the Bureau of Economic Analysis, the Bureau of Labor Statistics, and the Census Bureau, getting the attribution wrong isn’t a minor slip; it can mislead researchers relying on that sourcing to judge how reliable a figure is.
Waller’s remarks also pointed to a growth problem that is as much engineering as it is design. Sustaining accuracy and speed while traffic climbs at 150% annually is its own technical puzzle, separate from the question of whether the data itself is being read correctly.
Why this matters: as more AI agents tap into official economic data through tools like the Federal Reserve FRED Connector, the margin for error compounds. A single hallucinated statistic or misattributed source, repeated across thousands of automated queries, could spread faster and further than a one-off human mistake ever would.
Article produced with the assistance of artificial intelligence and reviewed by the editorial team.
18

Article
See translation
Digital credit market growth hits $16 billion as KuCoin eyes a Bitcoin rival.A market that barely existed two years ago now carries a price tag of $16 billion, and crypto exchange KuCoin says it could eventually rival Bitcoin itself. That’s the core claim behind the current wave of attention on digital credit market growth, a corner of the crypto industry built around products that let investors profit from Bitcoin-linked yield without ever holding the asset directly. KuCoin’s analysis, reported by Coinfomania, frames this expansion as one of the more consequential shifts in how crypto investors are choosing to deploy their money.
Key takeaways
KuCoin estimates the digital credit market at $16 billion, up from near-zero roughly two years ago.
Strategy’s STRC token pays a 12% annualized dividend bi-monthly, one of the sector’s most visible products.
STRC shares fell nearly 29% in June, forcing Strategy to sell Bitcoin to keep covering dividend payments.
Bitcoin’s market capitalization sits around $1.5 trillion, giving scale to the comparison KuCoin is drawing.
Digital credit products let investors gain exposure to Bitcoin-linked returns without directly owning the cryptocurrency.
Digital Credit Market Emerges and Expands Rapidly
In less than two years, digital credit has gone from a niche idea to an estimated $16 billion market, according to KuCoin’s commentary on the sector. That pace of expansion is what’s drawing comparisons to Bitcoin, the asset the digital credit model is often built around.
KuCoin’s analysis points to a straightforward dynamic: as digital credit becomes easier to access, it changes how investors think about allocating capital inside crypto. Instead of buying and holding Bitcoin outright, investors can now choose instruments that promise yield tied to Bitcoin’s performance, which is a meaningfully different risk profile.
How STRC’s 12% dividend works
Strategy‘s STRC token is the clearest example of what this market looks like in practice. It offers a 12% annualized dividend, paid out bi-monthly, positioning it as a yield-generating alternative for investors who want crypto-linked income rather than straightforward price exposure to Bitcoin. That structure is a big part of why digital credit products have attracted attention so quickly — they offer a return schedule that traditional Bitcoin holding simply doesn’t provide.
Market Volatility and Risks in Digital Credit Sector
The digital credit model’s appeal came with a visible stress test in June 2026, when STRC shares dropped nearly 29%. That decline forced Strategy to sell Bitcoin in order to keep covering the dividend payments owed to STRC holders.
That episode matters because it exposed a structural vulnerability in how these products are funded. When a token’s dividend depends on selling another asset to stay current, a sharp price drop can trigger a chain reaction — the company sells Bitcoin to pay dividends, which can add selling pressure of its own. KuCoin’s analysis frames this as evidence that risks and market volatility remain significant in the digital credit sector, even as the overall market keeps growing.
Why the June selloff is a warning sign
For investors weighing digital credit products against straightforward Bitcoin ownership, the STRC drop is a reminder that yield-bearing crypto instruments carry their own set of risks, separate from the volatility of Bitcoin’s own price. A 12% annualized dividend looks attractive on paper, but it only holds up if the underlying mechanism — in this case, Bitcoin sales to fund payouts — remains sustainable through market stress.
Implications for Bitcoin and Investor Strategies
Bitcoin’s market capitalization of roughly $1.5 trillion still dwarfs the $16 billion digital credit market, but the comparison KuCoin is making isn’t about size today — it’s about trajectory. If digital credit products keep growing at the pace KuCoin describes, they could start pulling investor capital that might otherwise go directly into Bitcoin.
This is the part of the story that matters most for anyone watching Bitcoin market competition unfold. Digital credit products leverage Bitcoin without requiring investors to actually own it, which changes the calculus for capital allocation across the crypto market. An investor chasing yield through a product like STRC isn’t buying Bitcoin on an exchange — they’re buying exposure to a financial structure built around it.
That distinction carries real implications. If more investors start preferring yield-bearing digital credit instruments over direct Bitcoin purchases, it could affect demand patterns for Bitcoin itself, even without any change in Bitcoin’s underlying fundamentals. KuCoin’s framing suggests this is already an early-stage dynamic worth watching rather than a settled outcome.
Article produced with the assistance of artificial intelligence and reviewed by the editorial team.
Digital credit market growth hits $16 billion as KuCoin eyes a Bitcoin rival.
A market that barely existed two years ago now carries a price tag of $16 billion, and crypto exchange KuCoin says it could eventually rival Bitcoin itself. That’s the core claim behind the current wave of attention on digital credit market growth, a corner of the crypto industry built around products that let investors profit from Bitcoin-linked yield without ever holding the asset directly. KuCoin’s analysis, reported by Coinfomania, frames this expansion as one of the more consequential shifts in how crypto investors are choosing to deploy their money.
Key takeaways
KuCoin estimates the digital credit market at $16 billion, up from near-zero roughly two years ago.
Strategy’s STRC token pays a 12% annualized dividend bi-monthly, one of the sector’s most visible products.
STRC shares fell nearly 29% in June, forcing Strategy to sell Bitcoin to keep covering dividend payments.
Bitcoin’s market capitalization sits around $1.5 trillion, giving scale to the comparison KuCoin is drawing.
Digital credit products let investors gain exposure to Bitcoin-linked returns without directly owning the cryptocurrency.
Digital Credit Market Emerges and Expands Rapidly
In less than two years, digital credit has gone from a niche idea to an estimated $16 billion market, according to KuCoin’s commentary on the sector. That pace of expansion is what’s drawing comparisons to Bitcoin, the asset the digital credit model is often built around.
KuCoin’s analysis points to a straightforward dynamic: as digital credit becomes easier to access, it changes how investors think about allocating capital inside crypto. Instead of buying and holding Bitcoin outright, investors can now choose instruments that promise yield tied to Bitcoin’s performance, which is a meaningfully different risk profile.
How STRC’s 12% dividend works
Strategy‘s STRC token is the clearest example of what this market looks like in practice. It offers a 12% annualized dividend, paid out bi-monthly, positioning it as a yield-generating alternative for investors who want crypto-linked income rather than straightforward price exposure to Bitcoin. That structure is a big part of why digital credit products have attracted attention so quickly — they offer a return schedule that traditional Bitcoin holding simply doesn’t provide.
Market Volatility and Risks in Digital Credit Sector
The digital credit model’s appeal came with a visible stress test in June 2026, when STRC shares dropped nearly 29%. That decline forced Strategy to sell Bitcoin in order to keep covering the dividend payments owed to STRC holders.
That episode matters because it exposed a structural vulnerability in how these products are funded. When a token’s dividend depends on selling another asset to stay current, a sharp price drop can trigger a chain reaction — the company sells Bitcoin to pay dividends, which can add selling pressure of its own. KuCoin’s analysis frames this as evidence that risks and market volatility remain significant in the digital credit sector, even as the overall market keeps growing.
Why the June selloff is a warning sign
For investors weighing digital credit products against straightforward Bitcoin ownership, the STRC drop is a reminder that yield-bearing crypto instruments carry their own set of risks, separate from the volatility of Bitcoin’s own price. A 12% annualized dividend looks attractive on paper, but it only holds up if the underlying mechanism — in this case, Bitcoin sales to fund payouts — remains sustainable through market stress.
Implications for Bitcoin and Investor Strategies
Bitcoin’s market capitalization of roughly $1.5 trillion still dwarfs the $16 billion digital credit market, but the comparison KuCoin is making isn’t about size today — it’s about trajectory. If digital credit products keep growing at the pace KuCoin describes, they could start pulling investor capital that might otherwise go directly into Bitcoin.
This is the part of the story that matters most for anyone watching Bitcoin market competition unfold. Digital credit products leverage Bitcoin without requiring investors to actually own it, which changes the calculus for capital allocation across the crypto market. An investor chasing yield through a product like STRC isn’t buying Bitcoin on an exchange — they’re buying exposure to a financial structure built around it.
That distinction carries real implications. If more investors start preferring yield-bearing digital credit instruments over direct Bitcoin purchases, it could affect demand patterns for Bitcoin itself, even without any change in Bitcoin’s underlying fundamentals. KuCoin’s framing suggests this is already an early-stage dynamic worth watching rather than a settled outcome.
Article produced with the assistance of artificial intelligence and reviewed by the editorial team.
Key takeaways
KuCoin estimates the digital credit market at $16 billion, up from near-zero roughly two years ago.
Strategy’s STRC token pays a 12% annualized dividend bi-monthly, one of the sector’s most visible products.
STRC shares fell nearly 29% in June, forcing Strategy to sell Bitcoin to keep covering dividend payments.
Bitcoin’s market capitalization sits around $1.5 trillion, giving scale to the comparison KuCoin is drawing.
Digital credit products let investors gain exposure to Bitcoin-linked returns without directly owning the cryptocurrency.
Digital Credit Market Emerges and Expands Rapidly
In less than two years, digital credit has gone from a niche idea to an estimated $16 billion market, according to KuCoin’s commentary on the sector. That pace of expansion is what’s drawing comparisons to Bitcoin, the asset the digital credit model is often built around.
KuCoin’s analysis points to a straightforward dynamic: as digital credit becomes easier to access, it changes how investors think about allocating capital inside crypto. Instead of buying and holding Bitcoin outright, investors can now choose instruments that promise yield tied to Bitcoin’s performance, which is a meaningfully different risk profile.
How STRC’s 12% dividend works
Strategy‘s STRC token is the clearest example of what this market looks like in practice. It offers a 12% annualized dividend, paid out bi-monthly, positioning it as a yield-generating alternative for investors who want crypto-linked income rather than straightforward price exposure to Bitcoin. That structure is a big part of why digital credit products have attracted attention so quickly — they offer a return schedule that traditional Bitcoin holding simply doesn’t provide.
Market Volatility and Risks in Digital Credit Sector
The digital credit model’s appeal came with a visible stress test in June 2026, when STRC shares dropped nearly 29%. That decline forced Strategy to sell Bitcoin in order to keep covering the dividend payments owed to STRC holders.
That episode matters because it exposed a structural vulnerability in how these products are funded. When a token’s dividend depends on selling another asset to stay current, a sharp price drop can trigger a chain reaction — the company sells Bitcoin to pay dividends, which can add selling pressure of its own. KuCoin’s analysis frames this as evidence that risks and market volatility remain significant in the digital credit sector, even as the overall market keeps growing.
Why the June selloff is a warning sign
For investors weighing digital credit products against straightforward Bitcoin ownership, the STRC drop is a reminder that yield-bearing crypto instruments carry their own set of risks, separate from the volatility of Bitcoin’s own price. A 12% annualized dividend looks attractive on paper, but it only holds up if the underlying mechanism — in this case, Bitcoin sales to fund payouts — remains sustainable through market stress.
Implications for Bitcoin and Investor Strategies
Bitcoin’s market capitalization of roughly $1.5 trillion still dwarfs the $16 billion digital credit market, but the comparison KuCoin is making isn’t about size today — it’s about trajectory. If digital credit products keep growing at the pace KuCoin describes, they could start pulling investor capital that might otherwise go directly into Bitcoin.
This is the part of the story that matters most for anyone watching Bitcoin market competition unfold. Digital credit products leverage Bitcoin without requiring investors to actually own it, which changes the calculus for capital allocation across the crypto market. An investor chasing yield through a product like STRC isn’t buying Bitcoin on an exchange — they’re buying exposure to a financial structure built around it.
That distinction carries real implications. If more investors start preferring yield-bearing digital credit instruments over direct Bitcoin purchases, it could affect demand patterns for Bitcoin itself, even without any change in Bitcoin’s underlying fundamentals. KuCoin’s framing suggests this is already an early-stage dynamic worth watching rather than a settled outcome.
Article produced with the assistance of artificial intelligence and reviewed by the editorial team.
21
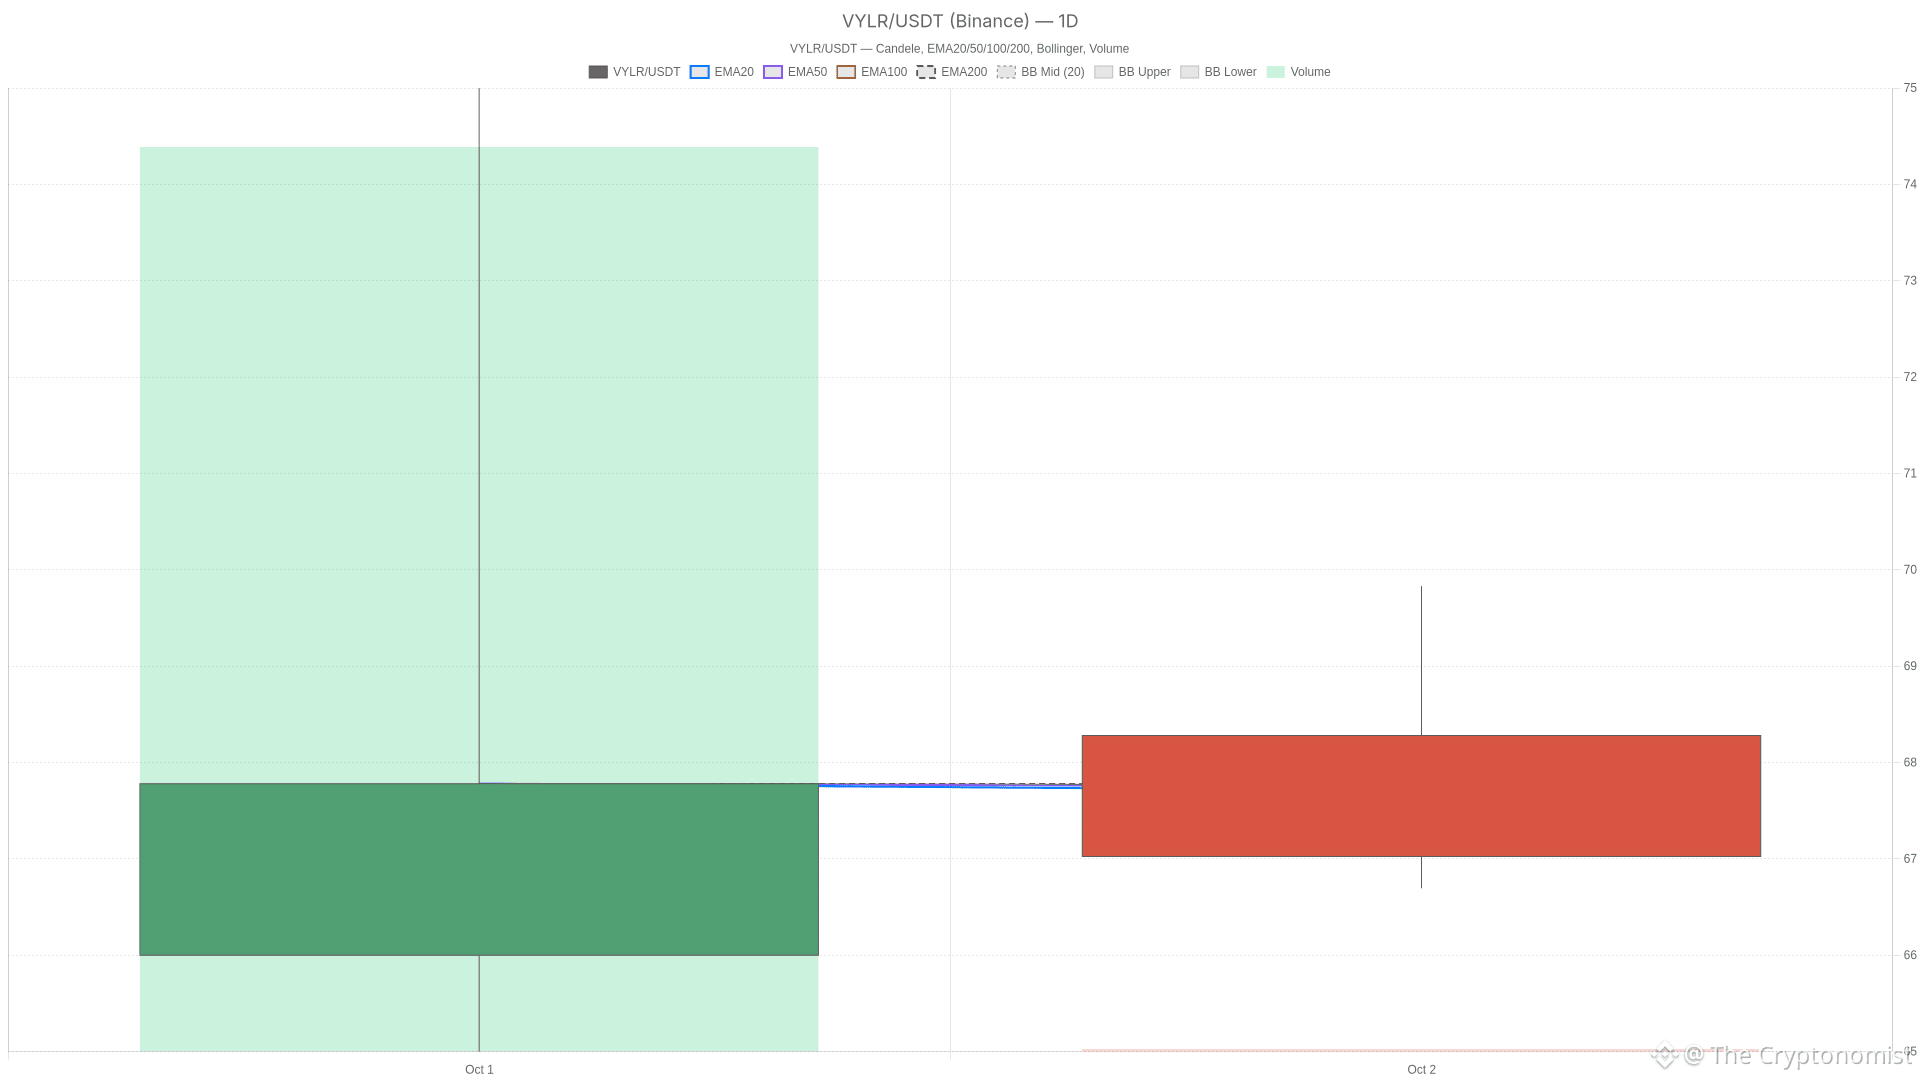
Article
See translation
Vylor stock slides 1.1% to $67.03, testing support in session twoVylor (VYLR) is in its second session as an independent company, and Vylor stock is already giving back debut-week gains. Shares were trading at $67.03 as of 09:47 ET on Friday, down 1.11% from Thursday’s close. The pullback follows its NYSE debut and immediate S&P 500 addition.
VYLR — daily chart with candlesticks, EMA20/EMA50 and volume.
Key takeaways
Vylor stock was trading at $67.03 as of 09:47 ET Friday, down 1.11% from Thursday’s close of $67.78, in only its second session as an independent publicly traded company.
Price sits below the daily pivot at $69.26 and the hourly pivot at $67.93, but holds above hourly first support at $65.85 and 15-minute first support at $65.91.
The 15-minute RSI14 at 40.8 and MACD at -0.88 point to soft momentum without reaching oversold extremes.
S&P Dow Jones Indices added Vylor to the S&P 500 immediately after its separation from Corteva and NYSE debut on Thursday, October 1.
A U.S. District Court denied a motion to block the spinoff, clearing the legal pathway for the separation, Seeking Alpha reported.
That combination — a brand-new listing stepping straight into a major index — makes for an unusual setup. There simply isn’t much chart history yet. With only two daily sessions on record, the daily timeframe offers pivot levels but not the longer moving-average or momentum context investors normally lean on. Therefore, the clearest read on where Vylor stock stands comes from price structure. The hourly and 15-minute data provide a fuller indicator set.
Vylor Stock Price Action: Below the Daily Pivot
Vylor stock opened Friday at $68.28 and has since faded below the daily pivot at $69.26. Price at $67.03 sits closer to daily first support at $63.52 than to daily first resistance at $73.52. The session has seen a range between a low of $66.69 and a high of $69.83.
In practice, the early session has been a fade from the open. Sellers pushed the stock off its morning high, while buyers stepped in only once the low was tested.
The hourly picture, meanwhile, tells a similar but slightly less stretched story. The hourly pivot sits at $67.93, with first resistance at $69.85 and first support at $65.85. Price at $67.03 is below that pivot but still comfortably above the hourly support. This means the pullback has not yet threatened a deeper breakdown on that timeframe.
In other words, the daily structure shows outright weakness relative to its pivot. The hourly structure shows a stock holding inside a narrower, still-intact range.
Momentum and Volatility on the 15-Minute Chart
The 15-minute chart shows soft momentum, with the RSI14 at 40.8 and the MACD line at -0.88. Neither indicator has reached oversold extremes, pointing to tired rather than panicked selling.
However, the RSI14 reading sits below the neutral 50 line. The MACD line below zero confirms that short-term momentum has turned negative since the session began.
Bollinger Bands on the same timeframe show the mid band at $68.50, the upper band at $70.19 and the lower band at $66.80. Price at $67.03 sits between the mid band and the lower band. Notably, it is closer to the lower edge of the range. That positioning is consistent with a stock under short-term pressure, though not yet in a full breakdown.
Meanwhile, the 15-minute ATR14 stands at 1.89. This serves as a reminder that intraday swings have been fairly wide for a stock only two sessions old. The elevated volatility is unsurprising given the volume of news hitting the tape at once.
The 15-minute pivot adds further confirmation. It stands at $67.87, with first resistance at $69.05 and first support at $65.91. Price below that pivot but above the 15-minute support mirrors the hourly setup almost exactly.
Taken together, the three timeframes describe the same cautious tone at different zoom levels. The daily structure flags weakness relative to its pivot. Meanwhile, the hourly and 15-minute charts show a stock that has pulled back without breaking its nearest supports.
What Would Turn Vylor Stock Bullish
Vylor stock would need to reclaim the 15-minute pivot at $67.87 first. Then it must clear the hourly pivot at $67.93 and push through the 15-minute EMA20 at $68.72 and the Bollinger mid band at $68.50.
From there, the 15-minute first resistance at $69.05 becomes the next checkpoint. The hourly first resistance at $69.85 follows. The daily pivot at $69.26 and daily first resistance at $73.52 serve as the larger targets.
At the same time, supporting evidence would include the 15-minute RSI14 climbing back above 50. The MACD line would also need to turn positive relative to zero. Both shifts would suggest buyers are regaining control of the short-term tape.
What Would Invalidate It
A bearish extension would first break below the 15-minute first support at $65.91. It would then test the hourly first support at $65.85.
A decisive push below the 15-minute lower Bollinger band at $66.80 would open the door toward the daily first support at $63.52. That scenario would be reinforced if the 15-minute RSI14 drops meaningfully from current levels. The MACD line extending further below zero would also signal that the pullback is deepening rather than stabilizing.
The News Behind Vylor’s S&P 500 Debut
Vylor’s separation from Corteva, its NYSE debut, immediate S&P 500 inclusion, and a favorable court ruling all hit the tape in the past two days.
Vylor completed its separation from Corteva and began trading on the NYSE on Thursday, October 1, according to a report from finance.yahoo.com. The report described the company as an advanced seed and genetics business now operating independently.
The same day, S&P Dow Jones Indices confirmed it added Vylor to the S&P 500 immediately. Twilio is set to join the index before Tuesday’s open, while Corteva shifts into the S&P MidCap 400, per separate Yahoo Finance coverage.
A Seeking Alpha report, also published Thursday, noted that a U.S. District Court issued a second denial. The court rejected a motion from California to temporarily block the spinoff, clearing the legal pathway for the separation.
One Yahoo Finance headline described both Vylor and Twilio shares as having risen after-hours on Thursday. That move was tied specifically to the index-change news — a separate event from Friday’s intraday pullback.
CNBC also listed Vylor among the stocks making the biggest moves in Friday’s premarket session, without detailing the size or direction of that move.
Where Vylor Stock Stands Now
Vylor stock, barely two sessions old and already in the S&P 500, is testing early support levels while volatility remains elevated.
Price at $67.03 remains below the daily pivot at $69.26 and below the hourly pivot at $67.93. Yet it continues to hold above both the hourly first support at $65.85 and the 15-minute first support at $65.91.
Volatility, as captured by the 15-minute ATR14 of 1.89, remains elevated for the size of the stock. This is consistent with a market still working out a fair price for a brand-new listing.
With only two daily candles of history, the longer-term trend simply cannot be established yet. Whether this pullback is a routine post-debut cooldown or the start of something more persistent remains an open question. Only more trading sessions can answer it.
FAQ
Where is Vylor stock trading relative to its key pivot levels?
Vylor stock was trading at $67.03 as of 09:47 ET on Friday, below the daily pivot at $69.26 and below the hourly pivot at $67.93. Price remains above hourly first support at $65.85 and 15-minute first support at $65.91.
What would need to happen for Vylor stock to turn bullish?
Vylor stock would need to reclaim the 15-minute pivot at $67.87, then clear the hourly pivot at $67.93. It would also need to push above the 15-minute EMA20 at $68.72 and the Bollinger mid band at $68.50. Supporting evidence would include the 15-minute RSI14 climbing above 50 and the MACD turning positive.
Why was Vylor added to the S&P 500 so quickly?
S&P Dow Jones Indices added Vylor to the S&P 500 immediately following its separation from Corteva and NYSE debut on Thursday, October 1. Vylor took over the seat vacated by Corteva, which shifted into the S&P MidCap 400.
What are the key support levels for Vylor stock?
The key support levels are the 15-minute first support at $65.91, the hourly first support at $65.85, and the daily first support at $63.52. The 15-minute lower Bollinger band at $66.80 also serves as an important short-term level.
Disclaimer: This article is for informational purposes only and does not constitute financial advice, an investment recommendation, or a solicitation to buy or sell any financial instrument or cryptocurrency. The analysis provided is not indicative of future results. Investing in crypto assets and financial markets carries a high risk of capital loss. Always do your own research (DYOR) and consult a qualified financial advisor before making any decision.
Article produced with the assistance of artificial intelligence and reviewed by the editorial team.
Vylor stock slides 1.1% to $67.03, testing support in session two
Vylor (VYLR) is in its second session as an independent company, and Vylor stock is already giving back debut-week gains. Shares were trading at $67.03 as of 09:47 ET on Friday, down 1.11% from Thursday’s close. The pullback follows its NYSE debut and immediate S&P 500 addition.
VYLR — daily chart with candlesticks, EMA20/EMA50 and volume.
Key takeaways
Vylor stock was trading at $67.03 as of 09:47 ET Friday, down 1.11% from Thursday’s close of $67.78, in only its second session as an independent publicly traded company.
Price sits below the daily pivot at $69.26 and the hourly pivot at $67.93, but holds above hourly first support at $65.85 and 15-minute first support at $65.91.
The 15-minute RSI14 at 40.8 and MACD at -0.88 point to soft momentum without reaching oversold extremes.
S&P Dow Jones Indices added Vylor to the S&P 500 immediately after its separation from Corteva and NYSE debut on Thursday, October 1.
A U.S. District Court denied a motion to block the spinoff, clearing the legal pathway for the separation, Seeking Alpha reported.
That combination — a brand-new listing stepping straight into a major index — makes for an unusual setup. There simply isn’t much chart history yet. With only two daily sessions on record, the daily timeframe offers pivot levels but not the longer moving-average or momentum context investors normally lean on. Therefore, the clearest read on where Vylor stock stands comes from price structure. The hourly and 15-minute data provide a fuller indicator set.
Vylor Stock Price Action: Below the Daily Pivot
Vylor stock opened Friday at $68.28 and has since faded below the daily pivot at $69.26. Price at $67.03 sits closer to daily first support at $63.52 than to daily first resistance at $73.52. The session has seen a range between a low of $66.69 and a high of $69.83.
In practice, the early session has been a fade from the open. Sellers pushed the stock off its morning high, while buyers stepped in only once the low was tested.
The hourly picture, meanwhile, tells a similar but slightly less stretched story. The hourly pivot sits at $67.93, with first resistance at $69.85 and first support at $65.85. Price at $67.03 is below that pivot but still comfortably above the hourly support. This means the pullback has not yet threatened a deeper breakdown on that timeframe.
In other words, the daily structure shows outright weakness relative to its pivot. The hourly structure shows a stock holding inside a narrower, still-intact range.
Momentum and Volatility on the 15-Minute Chart
The 15-minute chart shows soft momentum, with the RSI14 at 40.8 and the MACD line at -0.88. Neither indicator has reached oversold extremes, pointing to tired rather than panicked selling.
However, the RSI14 reading sits below the neutral 50 line. The MACD line below zero confirms that short-term momentum has turned negative since the session began.
Bollinger Bands on the same timeframe show the mid band at $68.50, the upper band at $70.19 and the lower band at $66.80. Price at $67.03 sits between the mid band and the lower band. Notably, it is closer to the lower edge of the range. That positioning is consistent with a stock under short-term pressure, though not yet in a full breakdown.
Meanwhile, the 15-minute ATR14 stands at 1.89. This serves as a reminder that intraday swings have been fairly wide for a stock only two sessions old. The elevated volatility is unsurprising given the volume of news hitting the tape at once.
The 15-minute pivot adds further confirmation. It stands at $67.87, with first resistance at $69.05 and first support at $65.91. Price below that pivot but above the 15-minute support mirrors the hourly setup almost exactly.
Taken together, the three timeframes describe the same cautious tone at different zoom levels. The daily structure flags weakness relative to its pivot. Meanwhile, the hourly and 15-minute charts show a stock that has pulled back without breaking its nearest supports.
What Would Turn Vylor Stock Bullish
Vylor stock would need to reclaim the 15-minute pivot at $67.87 first. Then it must clear the hourly pivot at $67.93 and push through the 15-minute EMA20 at $68.72 and the Bollinger mid band at $68.50.
From there, the 15-minute first resistance at $69.05 becomes the next checkpoint. The hourly first resistance at $69.85 follows. The daily pivot at $69.26 and daily first resistance at $73.52 serve as the larger targets.
At the same time, supporting evidence would include the 15-minute RSI14 climbing back above 50. The MACD line would also need to turn positive relative to zero. Both shifts would suggest buyers are regaining control of the short-term tape.
What Would Invalidate It
A bearish extension would first break below the 15-minute first support at $65.91. It would then test the hourly first support at $65.85.
A decisive push below the 15-minute lower Bollinger band at $66.80 would open the door toward the daily first support at $63.52. That scenario would be reinforced if the 15-minute RSI14 drops meaningfully from current levels. The MACD line extending further below zero would also signal that the pullback is deepening rather than stabilizing.
The News Behind Vylor’s S&P 500 Debut
Vylor’s separation from Corteva, its NYSE debut, immediate S&P 500 inclusion, and a favorable court ruling all hit the tape in the past two days.
Vylor completed its separation from Corteva and began trading on the NYSE on Thursday, October 1, according to a report from finance.yahoo.com. The report described the company as an advanced seed and genetics business now operating independently.
The same day, S&P Dow Jones Indices confirmed it added Vylor to the S&P 500 immediately. Twilio is set to join the index before Tuesday’s open, while Corteva shifts into the S&P MidCap 400, per separate Yahoo Finance coverage.
A Seeking Alpha report, also published Thursday, noted that a U.S. District Court issued a second denial. The court rejected a motion from California to temporarily block the spinoff, clearing the legal pathway for the separation.
One Yahoo Finance headline described both Vylor and Twilio shares as having risen after-hours on Thursday. That move was tied specifically to the index-change news — a separate event from Friday’s intraday pullback.
CNBC also listed Vylor among the stocks making the biggest moves in Friday’s premarket session, without detailing the size or direction of that move.
Where Vylor Stock Stands Now
Vylor stock, barely two sessions old and already in the S&P 500, is testing early support levels while volatility remains elevated.
Price at $67.03 remains below the daily pivot at $69.26 and below the hourly pivot at $67.93. Yet it continues to hold above both the hourly first support at $65.85 and the 15-minute first support at $65.91.
Volatility, as captured by the 15-minute ATR14 of 1.89, remains elevated for the size of the stock. This is consistent with a market still working out a fair price for a brand-new listing.
With only two daily candles of history, the longer-term trend simply cannot be established yet. Whether this pullback is a routine post-debut cooldown or the start of something more persistent remains an open question. Only more trading sessions can answer it.
FAQ
Where is Vylor stock trading relative to its key pivot levels?
Vylor stock was trading at $67.03 as of 09:47 ET on Friday, below the daily pivot at $69.26 and below the hourly pivot at $67.93. Price remains above hourly first support at $65.85 and 15-minute first support at $65.91.
What would need to happen for Vylor stock to turn bullish?
Vylor stock would need to reclaim the 15-minute pivot at $67.87, then clear the hourly pivot at $67.93. It would also need to push above the 15-minute EMA20 at $68.72 and the Bollinger mid band at $68.50. Supporting evidence would include the 15-minute RSI14 climbing above 50 and the MACD turning positive.
Why was Vylor added to the S&P 500 so quickly?
S&P Dow Jones Indices added Vylor to the S&P 500 immediately following its separation from Corteva and NYSE debut on Thursday, October 1. Vylor took over the seat vacated by Corteva, which shifted into the S&P MidCap 400.
What are the key support levels for Vylor stock?
The key support levels are the 15-minute first support at $65.91, the hourly first support at $65.85, and the daily first support at $63.52. The 15-minute lower Bollinger band at $66.80 also serves as an important short-term level.
Disclaimer: This article is for informational purposes only and does not constitute financial advice, an investment recommendation, or a solicitation to buy or sell any financial instrument or cryptocurrency. The analysis provided is not indicative of future results. Investing in crypto assets and financial markets carries a high risk of capital loss. Always do your own research (DYOR) and consult a qualified financial advisor before making any decision.
Article produced with the assistance of artificial intelligence and reviewed by the editorial team.
VYLR — daily chart with candlesticks, EMA20/EMA50 and volume.
Key takeaways
Vylor stock was trading at $67.03 as of 09:47 ET Friday, down 1.11% from Thursday’s close of $67.78, in only its second session as an independent publicly traded company.
Price sits below the daily pivot at $69.26 and the hourly pivot at $67.93, but holds above hourly first support at $65.85 and 15-minute first support at $65.91.
The 15-minute RSI14 at 40.8 and MACD at -0.88 point to soft momentum without reaching oversold extremes.
S&P Dow Jones Indices added Vylor to the S&P 500 immediately after its separation from Corteva and NYSE debut on Thursday, October 1.
A U.S. District Court denied a motion to block the spinoff, clearing the legal pathway for the separation, Seeking Alpha reported.
That combination — a brand-new listing stepping straight into a major index — makes for an unusual setup. There simply isn’t much chart history yet. With only two daily sessions on record, the daily timeframe offers pivot levels but not the longer moving-average or momentum context investors normally lean on. Therefore, the clearest read on where Vylor stock stands comes from price structure. The hourly and 15-minute data provide a fuller indicator set.
Vylor Stock Price Action: Below the Daily Pivot
Vylor stock opened Friday at $68.28 and has since faded below the daily pivot at $69.26. Price at $67.03 sits closer to daily first support at $63.52 than to daily first resistance at $73.52. The session has seen a range between a low of $66.69 and a high of $69.83.
In practice, the early session has been a fade from the open. Sellers pushed the stock off its morning high, while buyers stepped in only once the low was tested.
The hourly picture, meanwhile, tells a similar but slightly less stretched story. The hourly pivot sits at $67.93, with first resistance at $69.85 and first support at $65.85. Price at $67.03 is below that pivot but still comfortably above the hourly support. This means the pullback has not yet threatened a deeper breakdown on that timeframe.
In other words, the daily structure shows outright weakness relative to its pivot. The hourly structure shows a stock holding inside a narrower, still-intact range.
Momentum and Volatility on the 15-Minute Chart
The 15-minute chart shows soft momentum, with the RSI14 at 40.8 and the MACD line at -0.88. Neither indicator has reached oversold extremes, pointing to tired rather than panicked selling.
However, the RSI14 reading sits below the neutral 50 line. The MACD line below zero confirms that short-term momentum has turned negative since the session began.
Bollinger Bands on the same timeframe show the mid band at $68.50, the upper band at $70.19 and the lower band at $66.80. Price at $67.03 sits between the mid band and the lower band. Notably, it is closer to the lower edge of the range. That positioning is consistent with a stock under short-term pressure, though not yet in a full breakdown.
Meanwhile, the 15-minute ATR14 stands at 1.89. This serves as a reminder that intraday swings have been fairly wide for a stock only two sessions old. The elevated volatility is unsurprising given the volume of news hitting the tape at once.
The 15-minute pivot adds further confirmation. It stands at $67.87, with first resistance at $69.05 and first support at $65.91. Price below that pivot but above the 15-minute support mirrors the hourly setup almost exactly.
Taken together, the three timeframes describe the same cautious tone at different zoom levels. The daily structure flags weakness relative to its pivot. Meanwhile, the hourly and 15-minute charts show a stock that has pulled back without breaking its nearest supports.
What Would Turn Vylor Stock Bullish
Vylor stock would need to reclaim the 15-minute pivot at $67.87 first. Then it must clear the hourly pivot at $67.93 and push through the 15-minute EMA20 at $68.72 and the Bollinger mid band at $68.50.
From there, the 15-minute first resistance at $69.05 becomes the next checkpoint. The hourly first resistance at $69.85 follows. The daily pivot at $69.26 and daily first resistance at $73.52 serve as the larger targets.
At the same time, supporting evidence would include the 15-minute RSI14 climbing back above 50. The MACD line would also need to turn positive relative to zero. Both shifts would suggest buyers are regaining control of the short-term tape.
What Would Invalidate It
A bearish extension would first break below the 15-minute first support at $65.91. It would then test the hourly first support at $65.85.
A decisive push below the 15-minute lower Bollinger band at $66.80 would open the door toward the daily first support at $63.52. That scenario would be reinforced if the 15-minute RSI14 drops meaningfully from current levels. The MACD line extending further below zero would also signal that the pullback is deepening rather than stabilizing.
The News Behind Vylor’s S&P 500 Debut
Vylor’s separation from Corteva, its NYSE debut, immediate S&P 500 inclusion, and a favorable court ruling all hit the tape in the past two days.
Vylor completed its separation from Corteva and began trading on the NYSE on Thursday, October 1, according to a report from finance.yahoo.com. The report described the company as an advanced seed and genetics business now operating independently.
The same day, S&P Dow Jones Indices confirmed it added Vylor to the S&P 500 immediately. Twilio is set to join the index before Tuesday’s open, while Corteva shifts into the S&P MidCap 400, per separate Yahoo Finance coverage.
A Seeking Alpha report, also published Thursday, noted that a U.S. District Court issued a second denial. The court rejected a motion from California to temporarily block the spinoff, clearing the legal pathway for the separation.
One Yahoo Finance headline described both Vylor and Twilio shares as having risen after-hours on Thursday. That move was tied specifically to the index-change news — a separate event from Friday’s intraday pullback.
CNBC also listed Vylor among the stocks making the biggest moves in Friday’s premarket session, without detailing the size or direction of that move.
Where Vylor Stock Stands Now
Vylor stock, barely two sessions old and already in the S&P 500, is testing early support levels while volatility remains elevated.
Price at $67.03 remains below the daily pivot at $69.26 and below the hourly pivot at $67.93. Yet it continues to hold above both the hourly first support at $65.85 and the 15-minute first support at $65.91.
Volatility, as captured by the 15-minute ATR14 of 1.89, remains elevated for the size of the stock. This is consistent with a market still working out a fair price for a brand-new listing.
With only two daily candles of history, the longer-term trend simply cannot be established yet. Whether this pullback is a routine post-debut cooldown or the start of something more persistent remains an open question. Only more trading sessions can answer it.
FAQ
Where is Vylor stock trading relative to its key pivot levels?
Vylor stock was trading at $67.03 as of 09:47 ET on Friday, below the daily pivot at $69.26 and below the hourly pivot at $67.93. Price remains above hourly first support at $65.85 and 15-minute first support at $65.91.
What would need to happen for Vylor stock to turn bullish?
Vylor stock would need to reclaim the 15-minute pivot at $67.87, then clear the hourly pivot at $67.93. It would also need to push above the 15-minute EMA20 at $68.72 and the Bollinger mid band at $68.50. Supporting evidence would include the 15-minute RSI14 climbing above 50 and the MACD turning positive.
Why was Vylor added to the S&P 500 so quickly?
S&P Dow Jones Indices added Vylor to the S&P 500 immediately following its separation from Corteva and NYSE debut on Thursday, October 1. Vylor took over the seat vacated by Corteva, which shifted into the S&P MidCap 400.
What are the key support levels for Vylor stock?
The key support levels are the 15-minute first support at $65.91, the hourly first support at $65.85, and the daily first support at $63.52. The 15-minute lower Bollinger band at $66.80 also serves as an important short-term level.
Disclaimer: This article is for informational purposes only and does not constitute financial advice, an investment recommendation, or a solicitation to buy or sell any financial instrument or cryptocurrency. The analysis provided is not indicative of future results. Investing in crypto assets and financial markets carries a high risk of capital loss. Always do your own research (DYOR) and consult a qualified financial advisor before making any decision.
Article produced with the assistance of artificial intelligence and reviewed by the editorial team.
8

Article
See translation
AppLovin stock falls 3.41% to $271.72 as court denies bid against UnityAppLovin stock is under renewed pressure on Friday, trading at $271.72 as of 09:46 ET, down 3.41% against Thursday’s close of $281.31. The daily and hourly charts show a stock locked in a downtrend. Only the 15-minute chart hints at a short-lived pause in selling momentum.
APP — daily chart with candlesticks, EMA20/EMA50 and volume.
Key takeaways
AppLovin stock was trading at $271.72 as of 09:46 ET on Friday, down 3.41%, below the daily S1 support at $273.78.
Daily RSI14 at 29.28 and hourly RSI14 at 20.34 both sit firmly in oversold territory, with MACD still negative on both timeframes.
Price trades below the daily lower Bollinger band at $280.51 and beneath every key EMA across daily and hourly charts.
The 15-minute MACD histogram turned slightly positive at 0.26, hinting at short-term seller exhaustion without signaling a broader reversal.
Investing.com reported before Friday’s open that a court denied AppLovin’s request against Unity, adding to selling pressure.
Daily Chart: AppLovin Stock Deep in Bearish Territory
AppLovin stock’s daily trend is unambiguously bearish. Price at $271.72 sits below the 20-session EMA at $308.68. That average sits below the 50-session EMA at $339.94, which in turn sits below the 200-session EMA at $441.88. The result is a fully bearish stack, with every short-term average beneath the next longer one.
Momentum readings confirm the picture. Daily RSI14 stands at 29.28, in oversold territory. Meanwhile, the MACD line at -12.73 remains below its signal at -9.72, producing a negative histogram of -3.01. The daily ATR14 reads 15.64, underscoring the depth of the current bearish momentum.
Friday’s session opened at $270.24 and swung between a low of $266.95 and a high of $278.43. That range reflects a stock pushed lower from the opening bell, testing fresh intraday lows before stabilizing somewhat.
Volatility backs this up. The daily ATR14 reads 15.64, a meaningful swing for a stock trading in the $270s. Price is currently below the lower Bollinger band at $280.51. The mid-band sits at $312.64 and the upper band at $344.77. Trading outside the lower band signals an extended, stretched move rather than orderly consolidation.
On the pivot structure, price has broken below the daily S1 at $273.78. It sits well under the pivot point at $282.66 and nowhere near the R1 resistance at $290.19. In practice, sellers have already taken out the first layer of support expected to slow a decline.
Hourly Momentum Confirms the Downtrend
The hourly chart reinforces the bearish bias without offering any counterweight. Price at $271.72 remains below the hourly EMA20 at $289.29. That average sits below the EMA50 at $300.73, which in turn sits below the EMA200 at $316.23. The result is another clean bearish stack.
Meanwhile, RSI14 on this timeframe reads 20.34, even more oversold than the daily reading. The MACD line at -8.55 sits below its signal at -7.36, keeping the histogram negative at -1.19. Therefore, the hourly chart does not diverge from the daily trend. It reinforces it.
Price also trades below the hourly pivot at $281.83 and below the hourly S1 at $280.46. That places it beneath every short-term reference point on this timeframe. The hourly Bollinger setup shows price between the mid-band at $291.79 and the lower band at $268.9, closer to the lower edge. In other words, there is still a little room before the hourly chart becomes as stretched as the daily one. However, the direction of travel is the same.
15-Minute View: Execution Context Shows a Subtle Shift
On the 15-minute chart, the structure remains bearish on the surface. Price sits below the EMA20 at $281.06 and the EMA50 at $287.09. It also remains below the EMA200 at $303.12 and the lower Bollinger band at $273.48. The mid-band sits at $279.38. RSI14 at 23.95 stays in oversold territory, consistent with the other timeframes.
However, there is one small wrinkle worth noting. The 15-minute MACD line at -2.25 is now slightly above its signal at -2.52. That produces a positive histogram of 0.26. It is a modest, short-term signal only. It should not be confused with a change in the broader trend. At most, it suggests sellers may be pausing at the most granular level, not that buyers have taken control.
What’s Behind the Move
News flow around AppLovin has been heavy over the past day. On Thursday, a Yahoo Finance report said AppLovin fell 3% after Wells Fargo called the Pixel install spike a “false start.” That metric had been used by investors to track the company’s e-commerce progress.
The same day, an Investing.com report noted that options flow showed puts outnumbering calls. AppLovin shares slipped 2.73% in that session. A Motley Fool comparison piece published Thursday also noted that AppLovin missed Q2 estimates. Still, it highlighted the company’s strong margins and expanding AI advertising platform. The piece contrasted AppLovin with The Trade Desk, which it said posted its slowest revenue growth in years.
Separately, a Yahoo Finance report published Thursday said AppLovin had filed a lawsuit against Unity Technologies. The complaint alleges unauthorized data collection during MAX ad auctions. It focuses on Unity’s use of bidding data from AppLovin’s MAX platform. The filing claims the data was gathered without proper consent.
Then, in a report published before Friday’s open, Investing.com said AppLovin shares fell after a court denied the company’s request against Unity. That ruling appears tied to Friday’s early weakness, based on how the outlet framed it.
Bullish Scenario
A bullish case for AppLovin stock would need price to first reclaim the daily S1 at $273.78. From there, it would need to clear the daily pivot at $282.66. Only then could a meaningful test of the R1 resistance at $290.19 come into play.
Notably, daily RSI14 is already at 29.28 and hourly RSI14 at 20.34. A short-term bounce from oversold conditions is therefore not out of the question. The slightly positive 15-minute MACD histogram would need to be echoed on the hourly timeframe. That histogram currently remains negative at -1.19. Without hourly confirmation, any bounce would likely stay contained well below the daily EMA20 at $308.68.
Bearish Scenario
The bearish case, in contrast, is simply a continuation of what is already in motion. Price sits below the daily lower Bollinger band at $280.51. It also sits below every EMA on all three timeframes. Further downside would be the path of least resistance unless buyers step in decisively.
A break below the daily low of $266.95 would open the door to testing levels not yet referenced by the current pivot structure. The bearish case would be invalidated only if price reclaims the daily pivot at $282.66 and holds above it. That would also require a shift in the hourly MACD histogram back above zero.
Closing Take
Overall, AppLovin stock remains positioned below every key daily and hourly level. It sits below the daily EMA20 at $308.68 and below the daily lower Bollinger band at $280.51. It is also below the daily pivot S1 at $273.78.
Momentum across the daily and hourly timeframes is firmly negative. Volatility, with a daily ATR14 of 15.64, remains elevated. The only mild counterpoint comes from the 15-minute MACD. A slightly positive histogram there hints at short-term exhaustion among sellers. Whether that translates into anything more than a brief pause remains uncertain. With the session still open, the next few hours of trading will be telling. Price action against the $273.78 and $282.66 levels will likely say more than any single indicator can on its own.
FAQ
What are the key support and resistance levels for AppLovin stock?
AppLovin stock faces immediate support at the daily S1 of $273.78, which it has already broken below. The next reference is the session low of $266.95. On the upside, resistance stands at the daily pivot of $282.66, followed by the R1 at $290.19. The daily EMA20 at $308.68 represents a deeper level that would need to be reclaimed for any durable recovery.
Is AppLovin stock oversold on a technical basis?
Yes, across multiple timeframes. The daily RSI14 reads 29.28, and the hourly RSI14 is even lower at 20.34. Both are in oversold territory. However, oversold conditions in a downtrend can persist, and do not by themselves signal a reversal.
What company-specific news has been reported around AppLovin this week?
Several items: a Yahoo Finance report said Wells Fargo called the Pixel install spike a “false start.” Investing.com noted bearish options flow. AppLovin also filed a lawsuit against Unity Technologies over alleged unauthorized data collection. Investing.com then reported before Friday’s open that a court denied AppLovin’s request against Unity. A Motley Fool piece noted the company missed Q2 estimates but highlighted strong margins and an expanding AI advertising platform.
What would need to happen for a bullish reversal in AppLovin stock?
A bullish reversal would require price to reclaim the daily S1 at $273.78 first, then clear the daily pivot at $282.66. The hourly MACD histogram, currently negative at -1.19, would also need to turn positive to confirm buying momentum. Without these signals, any bounce would likely remain short-lived and contained below the daily EMA20 at $308.68.
Disclaimer: This article is for informational purposes only and does not constitute financial advice, an investment recommendation, or a solicitation to buy or sell any financial instrument or cryptocurrency. The analysis provided is not indicative of future results. Investing in crypto assets and financial markets carries a high risk of capital loss. Always do your own research (DYOR) and consult a qualified financial advisor before making any decision.
Article produced with the assistance of artificial intelligence and reviewed by the editorial team.
AppLovin stock falls 3.41% to $271.72 as court denies bid against Unity
AppLovin stock is under renewed pressure on Friday, trading at $271.72 as of 09:46 ET, down 3.41% against Thursday’s close of $281.31. The daily and hourly charts show a stock locked in a downtrend. Only the 15-minute chart hints at a short-lived pause in selling momentum.
APP — daily chart with candlesticks, EMA20/EMA50 and volume.
Key takeaways
AppLovin stock was trading at $271.72 as of 09:46 ET on Friday, down 3.41%, below the daily S1 support at $273.78.
Daily RSI14 at 29.28 and hourly RSI14 at 20.34 both sit firmly in oversold territory, with MACD still negative on both timeframes.
Price trades below the daily lower Bollinger band at $280.51 and beneath every key EMA across daily and hourly charts.
The 15-minute MACD histogram turned slightly positive at 0.26, hinting at short-term seller exhaustion without signaling a broader reversal.
Investing.com reported before Friday’s open that a court denied AppLovin’s request against Unity, adding to selling pressure.
Daily Chart: AppLovin Stock Deep in Bearish Territory
AppLovin stock’s daily trend is unambiguously bearish. Price at $271.72 sits below the 20-session EMA at $308.68. That average sits below the 50-session EMA at $339.94, which in turn sits below the 200-session EMA at $441.88. The result is a fully bearish stack, with every short-term average beneath the next longer one.
Momentum readings confirm the picture. Daily RSI14 stands at 29.28, in oversold territory. Meanwhile, the MACD line at -12.73 remains below its signal at -9.72, producing a negative histogram of -3.01. The daily ATR14 reads 15.64, underscoring the depth of the current bearish momentum.
Friday’s session opened at $270.24 and swung between a low of $266.95 and a high of $278.43. That range reflects a stock pushed lower from the opening bell, testing fresh intraday lows before stabilizing somewhat.
Volatility backs this up. The daily ATR14 reads 15.64, a meaningful swing for a stock trading in the $270s. Price is currently below the lower Bollinger band at $280.51. The mid-band sits at $312.64 and the upper band at $344.77. Trading outside the lower band signals an extended, stretched move rather than orderly consolidation.
On the pivot structure, price has broken below the daily S1 at $273.78. It sits well under the pivot point at $282.66 and nowhere near the R1 resistance at $290.19. In practice, sellers have already taken out the first layer of support expected to slow a decline.
Hourly Momentum Confirms the Downtrend
The hourly chart reinforces the bearish bias without offering any counterweight. Price at $271.72 remains below the hourly EMA20 at $289.29. That average sits below the EMA50 at $300.73, which in turn sits below the EMA200 at $316.23. The result is another clean bearish stack.
Meanwhile, RSI14 on this timeframe reads 20.34, even more oversold than the daily reading. The MACD line at -8.55 sits below its signal at -7.36, keeping the histogram negative at -1.19. Therefore, the hourly chart does not diverge from the daily trend. It reinforces it.
Price also trades below the hourly pivot at $281.83 and below the hourly S1 at $280.46. That places it beneath every short-term reference point on this timeframe. The hourly Bollinger setup shows price between the mid-band at $291.79 and the lower band at $268.9, closer to the lower edge. In other words, there is still a little room before the hourly chart becomes as stretched as the daily one. However, the direction of travel is the same.
15-Minute View: Execution Context Shows a Subtle Shift
On the 15-minute chart, the structure remains bearish on the surface. Price sits below the EMA20 at $281.06 and the EMA50 at $287.09. It also remains below the EMA200 at $303.12 and the lower Bollinger band at $273.48. The mid-band sits at $279.38. RSI14 at 23.95 stays in oversold territory, consistent with the other timeframes.
However, there is one small wrinkle worth noting. The 15-minute MACD line at -2.25 is now slightly above its signal at -2.52. That produces a positive histogram of 0.26. It is a modest, short-term signal only. It should not be confused with a change in the broader trend. At most, it suggests sellers may be pausing at the most granular level, not that buyers have taken control.
What’s Behind the Move
News flow around AppLovin has been heavy over the past day. On Thursday, a Yahoo Finance report said AppLovin fell 3% after Wells Fargo called the Pixel install spike a “false start.” That metric had been used by investors to track the company’s e-commerce progress.
The same day, an Investing.com report noted that options flow showed puts outnumbering calls. AppLovin shares slipped 2.73% in that session. A Motley Fool comparison piece published Thursday also noted that AppLovin missed Q2 estimates. Still, it highlighted the company’s strong margins and expanding AI advertising platform. The piece contrasted AppLovin with The Trade Desk, which it said posted its slowest revenue growth in years.
Separately, a Yahoo Finance report published Thursday said AppLovin had filed a lawsuit against Unity Technologies. The complaint alleges unauthorized data collection during MAX ad auctions. It focuses on Unity’s use of bidding data from AppLovin’s MAX platform. The filing claims the data was gathered without proper consent.
Then, in a report published before Friday’s open, Investing.com said AppLovin shares fell after a court denied the company’s request against Unity. That ruling appears tied to Friday’s early weakness, based on how the outlet framed it.
Bullish Scenario
A bullish case for AppLovin stock would need price to first reclaim the daily S1 at $273.78. From there, it would need to clear the daily pivot at $282.66. Only then could a meaningful test of the R1 resistance at $290.19 come into play.
Notably, daily RSI14 is already at 29.28 and hourly RSI14 at 20.34. A short-term bounce from oversold conditions is therefore not out of the question. The slightly positive 15-minute MACD histogram would need to be echoed on the hourly timeframe. That histogram currently remains negative at -1.19. Without hourly confirmation, any bounce would likely stay contained well below the daily EMA20 at $308.68.
Bearish Scenario
The bearish case, in contrast, is simply a continuation of what is already in motion. Price sits below the daily lower Bollinger band at $280.51. It also sits below every EMA on all three timeframes. Further downside would be the path of least resistance unless buyers step in decisively.
A break below the daily low of $266.95 would open the door to testing levels not yet referenced by the current pivot structure. The bearish case would be invalidated only if price reclaims the daily pivot at $282.66 and holds above it. That would also require a shift in the hourly MACD histogram back above zero.
Closing Take
Overall, AppLovin stock remains positioned below every key daily and hourly level. It sits below the daily EMA20 at $308.68 and below the daily lower Bollinger band at $280.51. It is also below the daily pivot S1 at $273.78.
Momentum across the daily and hourly timeframes is firmly negative. Volatility, with a daily ATR14 of 15.64, remains elevated. The only mild counterpoint comes from the 15-minute MACD. A slightly positive histogram there hints at short-term exhaustion among sellers. Whether that translates into anything more than a brief pause remains uncertain. With the session still open, the next few hours of trading will be telling. Price action against the $273.78 and $282.66 levels will likely say more than any single indicator can on its own.
FAQ
What are the key support and resistance levels for AppLovin stock?
AppLovin stock faces immediate support at the daily S1 of $273.78, which it has already broken below. The next reference is the session low of $266.95. On the upside, resistance stands at the daily pivot of $282.66, followed by the R1 at $290.19. The daily EMA20 at $308.68 represents a deeper level that would need to be reclaimed for any durable recovery.
Is AppLovin stock oversold on a technical basis?
Yes, across multiple timeframes. The daily RSI14 reads 29.28, and the hourly RSI14 is even lower at 20.34. Both are in oversold territory. However, oversold conditions in a downtrend can persist, and do not by themselves signal a reversal.
What company-specific news has been reported around AppLovin this week?
Several items: a Yahoo Finance report said Wells Fargo called the Pixel install spike a “false start.” Investing.com noted bearish options flow. AppLovin also filed a lawsuit against Unity Technologies over alleged unauthorized data collection. Investing.com then reported before Friday’s open that a court denied AppLovin’s request against Unity. A Motley Fool piece noted the company missed Q2 estimates but highlighted strong margins and an expanding AI advertising platform.
What would need to happen for a bullish reversal in AppLovin stock?
A bullish reversal would require price to reclaim the daily S1 at $273.78 first, then clear the daily pivot at $282.66. The hourly MACD histogram, currently negative at -1.19, would also need to turn positive to confirm buying momentum. Without these signals, any bounce would likely remain short-lived and contained below the daily EMA20 at $308.68.
Disclaimer: This article is for informational purposes only and does not constitute financial advice, an investment recommendation, or a solicitation to buy or sell any financial instrument or cryptocurrency. The analysis provided is not indicative of future results. Investing in crypto assets and financial markets carries a high risk of capital loss. Always do your own research (DYOR) and consult a qualified financial advisor before making any decision.
Article produced with the assistance of artificial intelligence and reviewed by the editorial team.
APP — daily chart with candlesticks, EMA20/EMA50 and volume.
Key takeaways
AppLovin stock was trading at $271.72 as of 09:46 ET on Friday, down 3.41%, below the daily S1 support at $273.78.
Daily RSI14 at 29.28 and hourly RSI14 at 20.34 both sit firmly in oversold territory, with MACD still negative on both timeframes.
Price trades below the daily lower Bollinger band at $280.51 and beneath every key EMA across daily and hourly charts.
The 15-minute MACD histogram turned slightly positive at 0.26, hinting at short-term seller exhaustion without signaling a broader reversal.
Investing.com reported before Friday’s open that a court denied AppLovin’s request against Unity, adding to selling pressure.
Daily Chart: AppLovin Stock Deep in Bearish Territory
AppLovin stock’s daily trend is unambiguously bearish. Price at $271.72 sits below the 20-session EMA at $308.68. That average sits below the 50-session EMA at $339.94, which in turn sits below the 200-session EMA at $441.88. The result is a fully bearish stack, with every short-term average beneath the next longer one.
Momentum readings confirm the picture. Daily RSI14 stands at 29.28, in oversold territory. Meanwhile, the MACD line at -12.73 remains below its signal at -9.72, producing a negative histogram of -3.01. The daily ATR14 reads 15.64, underscoring the depth of the current bearish momentum.
Friday’s session opened at $270.24 and swung between a low of $266.95 and a high of $278.43. That range reflects a stock pushed lower from the opening bell, testing fresh intraday lows before stabilizing somewhat.
Volatility backs this up. The daily ATR14 reads 15.64, a meaningful swing for a stock trading in the $270s. Price is currently below the lower Bollinger band at $280.51. The mid-band sits at $312.64 and the upper band at $344.77. Trading outside the lower band signals an extended, stretched move rather than orderly consolidation.
On the pivot structure, price has broken below the daily S1 at $273.78. It sits well under the pivot point at $282.66 and nowhere near the R1 resistance at $290.19. In practice, sellers have already taken out the first layer of support expected to slow a decline.
Hourly Momentum Confirms the Downtrend
The hourly chart reinforces the bearish bias without offering any counterweight. Price at $271.72 remains below the hourly EMA20 at $289.29. That average sits below the EMA50 at $300.73, which in turn sits below the EMA200 at $316.23. The result is another clean bearish stack.
Meanwhile, RSI14 on this timeframe reads 20.34, even more oversold than the daily reading. The MACD line at -8.55 sits below its signal at -7.36, keeping the histogram negative at -1.19. Therefore, the hourly chart does not diverge from the daily trend. It reinforces it.
Price also trades below the hourly pivot at $281.83 and below the hourly S1 at $280.46. That places it beneath every short-term reference point on this timeframe. The hourly Bollinger setup shows price between the mid-band at $291.79 and the lower band at $268.9, closer to the lower edge. In other words, there is still a little room before the hourly chart becomes as stretched as the daily one. However, the direction of travel is the same.
15-Minute View: Execution Context Shows a Subtle Shift
On the 15-minute chart, the structure remains bearish on the surface. Price sits below the EMA20 at $281.06 and the EMA50 at $287.09. It also remains below the EMA200 at $303.12 and the lower Bollinger band at $273.48. The mid-band sits at $279.38. RSI14 at 23.95 stays in oversold territory, consistent with the other timeframes.
However, there is one small wrinkle worth noting. The 15-minute MACD line at -2.25 is now slightly above its signal at -2.52. That produces a positive histogram of 0.26. It is a modest, short-term signal only. It should not be confused with a change in the broader trend. At most, it suggests sellers may be pausing at the most granular level, not that buyers have taken control.
What’s Behind the Move
News flow around AppLovin has been heavy over the past day. On Thursday, a Yahoo Finance report said AppLovin fell 3% after Wells Fargo called the Pixel install spike a “false start.” That metric had been used by investors to track the company’s e-commerce progress.
The same day, an Investing.com report noted that options flow showed puts outnumbering calls. AppLovin shares slipped 2.73% in that session. A Motley Fool comparison piece published Thursday also noted that AppLovin missed Q2 estimates. Still, it highlighted the company’s strong margins and expanding AI advertising platform. The piece contrasted AppLovin with The Trade Desk, which it said posted its slowest revenue growth in years.
Separately, a Yahoo Finance report published Thursday said AppLovin had filed a lawsuit against Unity Technologies. The complaint alleges unauthorized data collection during MAX ad auctions. It focuses on Unity’s use of bidding data from AppLovin’s MAX platform. The filing claims the data was gathered without proper consent.
Then, in a report published before Friday’s open, Investing.com said AppLovin shares fell after a court denied the company’s request against Unity. That ruling appears tied to Friday’s early weakness, based on how the outlet framed it.
Bullish Scenario
A bullish case for AppLovin stock would need price to first reclaim the daily S1 at $273.78. From there, it would need to clear the daily pivot at $282.66. Only then could a meaningful test of the R1 resistance at $290.19 come into play.
Notably, daily RSI14 is already at 29.28 and hourly RSI14 at 20.34. A short-term bounce from oversold conditions is therefore not out of the question. The slightly positive 15-minute MACD histogram would need to be echoed on the hourly timeframe. That histogram currently remains negative at -1.19. Without hourly confirmation, any bounce would likely stay contained well below the daily EMA20 at $308.68.
Bearish Scenario
The bearish case, in contrast, is simply a continuation of what is already in motion. Price sits below the daily lower Bollinger band at $280.51. It also sits below every EMA on all three timeframes. Further downside would be the path of least resistance unless buyers step in decisively.
A break below the daily low of $266.95 would open the door to testing levels not yet referenced by the current pivot structure. The bearish case would be invalidated only if price reclaims the daily pivot at $282.66 and holds above it. That would also require a shift in the hourly MACD histogram back above zero.
Closing Take
Overall, AppLovin stock remains positioned below every key daily and hourly level. It sits below the daily EMA20 at $308.68 and below the daily lower Bollinger band at $280.51. It is also below the daily pivot S1 at $273.78.
Momentum across the daily and hourly timeframes is firmly negative. Volatility, with a daily ATR14 of 15.64, remains elevated. The only mild counterpoint comes from the 15-minute MACD. A slightly positive histogram there hints at short-term exhaustion among sellers. Whether that translates into anything more than a brief pause remains uncertain. With the session still open, the next few hours of trading will be telling. Price action against the $273.78 and $282.66 levels will likely say more than any single indicator can on its own.
FAQ
What are the key support and resistance levels for AppLovin stock?
AppLovin stock faces immediate support at the daily S1 of $273.78, which it has already broken below. The next reference is the session low of $266.95. On the upside, resistance stands at the daily pivot of $282.66, followed by the R1 at $290.19. The daily EMA20 at $308.68 represents a deeper level that would need to be reclaimed for any durable recovery.
Is AppLovin stock oversold on a technical basis?
Yes, across multiple timeframes. The daily RSI14 reads 29.28, and the hourly RSI14 is even lower at 20.34. Both are in oversold territory. However, oversold conditions in a downtrend can persist, and do not by themselves signal a reversal.
What company-specific news has been reported around AppLovin this week?
Several items: a Yahoo Finance report said Wells Fargo called the Pixel install spike a “false start.” Investing.com noted bearish options flow. AppLovin also filed a lawsuit against Unity Technologies over alleged unauthorized data collection. Investing.com then reported before Friday’s open that a court denied AppLovin’s request against Unity. A Motley Fool piece noted the company missed Q2 estimates but highlighted strong margins and an expanding AI advertising platform.
What would need to happen for a bullish reversal in AppLovin stock?
A bullish reversal would require price to reclaim the daily S1 at $273.78 first, then clear the daily pivot at $282.66. The hourly MACD histogram, currently negative at -1.19, would also need to turn positive to confirm buying momentum. Without these signals, any bounce would likely remain short-lived and contained below the daily EMA20 at $308.68.
Disclaimer: This article is for informational purposes only and does not constitute financial advice, an investment recommendation, or a solicitation to buy or sell any financial instrument or cryptocurrency. The analysis provided is not indicative of future results. Investing in crypto assets and financial markets carries a high risk of capital loss. Always do your own research (DYOR) and consult a qualified financial advisor before making any decision.
Article produced with the assistance of artificial intelligence and reviewed by the editorial team.
85

Article
See translation
Western Digital stock falls 9% as it breaks below key support levelsWestern Digital stock is sharply lower on Friday, erasing Thursday’s gain as an intraday slide breaks through several layers of daily support. Trading at $419.84 as of 09:43 ET, the stock was down 9.24% versus Thursday’s close of $462.56.
WDC — daily chart with candlesticks, EMA20/EMA50 and volume.
Key takeaways
Western Digital stock was trading at $419.84 as of 09:43 ET, down 9.24% from Thursday’s close of $462.56.
Price has broken below the daily S1 support at $447.22 and the daily pivot point at $455.39.
The hourly chart shows a fully bearish EMA stack, with price below the 20-hour, 50-hour, and 200-hour averages.
Daily RSI14 at 40.14 remains above oversold territory, while the hourly RSI14 at 29.78 approaches oversold conditions.
The bearish path points toward the daily lower Bollinger band at $409.72 and the 200-session EMA at $391.04.
The reversal follows a constructive run of coverage earlier in the week. On Thursday, Western Digital closed at $462.56, a gain of 1.78% from the prior session, according to a report from Yahoo Finance UK. Sentiment had also been supported by Seeking Alpha’s Steven Cress, who highlighted an improving valuation grade and a top-tier quant rating tied to the company’s AI storage demand, while a separate Seeking Alpha piece detailed how WD Red Pro HDDs are being positioned to support AI-powered NAS systems. A Yahoo Finance report noted that Zacks.com users had been watching the stock closely, and another Yahoo Finance piece framed Western Digital alongside other AI infrastructure names as a potential beneficiary of rising bond yields pulling capital toward cash-generative, real-asset businesses. None of this coverage, however, addresses Friday’s sharp reversal directly.
Western Digital Stock: Daily Structure Weakens
Trend Averages Signal Short-Term Weakness
On the daily chart, Western Digital stock sits below both its 20-session EMA at $451.23 and its 50-session EMA at $467.75. At the same time, it remains above the 200-session EMA at $391.04. That is a mixed position: short- and medium-term trends have turned down. Yet the broader daily structure has not broken below the long-run average.
Momentum Indicators Point to Softening Conditions
The daily RSI14 reads 40.14, below the neutral 50 line but not yet in oversold territory. Momentum is soft rather than exhausted. The daily MACD line stands at -5.81, above its signal at -6.71, with a positive histogram of 0.9. Both values remain below zero, so the broader daily trend is still negative. Notably, the line sitting above its signal suggests the pace of selling has eased, at least for the moment.
Support Levels Give Way
Price is trading between the daily Bollinger mid-band at $449.67 and the lower band at $409.72. It sits closer to the lower band than the mid-band. The daily ATR14 reads 27.73, pointing to a wide average range and elevated volatility. Friday’s decline has broken decisively below the daily S1 support at $447.22. Price now sits well under the pivot point itself at $455.39. That is a meaningful technical breach, not a minor dip.
Hourly Momentum Confirms the Bearish Tilt
The hourly timeframe leaves little ambiguity. Price sits below the 20-hour EMA at $451.12. That average sits just below the 50-hour EMA at $451.72, which in turn sits below the 200-hour EMA at $455.88. This is a fully bearish stack, with price under every average in descending order.
The hourly RSI14 has fallen to 29.78, approaching oversold conditions. The hourly MACD line is at -2.27, below its signal at -0.36, with a negative histogram of -1.91. Downside momentum is intact and, unlike the daily reading, shows no early sign of easing. Price has also dropped below the hourly lower Bollinger band at $434.27. Meanwhile, the hourly pivot point at $460.84 and S1 support at $458.12 both sit well above current price.
This is where the daily and hourly pictures diverge. The daily setup, despite the break through S1, still carries a neutral undertone. Price remains above its 200-session EMA. The hourly chart, in contrast, is unambiguously bearish. Full EMA alignment to the downside is paired with momentum accelerating rather than stabilizing. In practice, the hourly weakness confirms and intensifies the daily deterioration.
15-Minute Chart: Execution Context
On the 15-minute chart, used here only for timing, RSI14 stands at 24.09, firmly in oversold territory. The MACD line sits at -1.26, below its signal at 0.11, with a negative histogram of -1.37. Price also trades beneath the 15-minute lower Bollinger band at $433.5 and well under the 15-minute S1 support at $460.66. Therefore, the short-term oversold reading raises the possibility of a bounce or consolidation. However, it does not by itself reverse the dominant hourly and daily pressure.
Bullish and Bearish Paths for Western Digital Stock
A bullish case for Western Digital stock would need price to first reclaim the daily S1 support at $447.22, then the daily pivot point at $455.39. Clearing the daily 20-session EMA at $451.23 would further ease the immediate pressure. On the hourly chart, a recovery above the pivot point at $460.84 would be needed. That, paired with RSI14 moving back above 50, would confirm buyers have regained control. Until those levels are reclaimed, any bounce remains vulnerable to renewed selling.
The bearish case is currently the path of least resistance. A continuation lower would likely test the daily lower Bollinger band at $409.72. The 200-session EMA at $391.04 would be the next structural reference beyond that. On the hourly chart, a persistently negative histogram would keep sellers in control. Price remaining under the lower Bollinger band at $434.27 would reinforce that control. Only a reclaim of the levels outlined above would invalidate this bearish continuation.
Overall, as of 09:43 ET, Western Digital stock was trading at $419.84, down 9.24% versus Thursday’s close of $462.56. Price sits below every meaningful daily and hourly support level. This includes the daily pivot at $455.39, S1 support at $447.22, and the hourly pivot point at $460.84. The daily ATR14 at 27.73 reflects a genuinely wide trading range. What remains uncertain is whether this is a sharp, short-term overshoot. The oversold readings on the 15-minute and hourly charts support that interpretation. Alternatively, it could be the start of a deeper correction that eventually tests the 200-session EMA. For now, the charts do not settle that question.
FAQ
What is the current price of Western Digital stock?
Western Digital stock was trading at $419.84 as of 09:43 ET on Friday, down 9.24% versus Thursday’s close of $462.56.
What are the key support levels to watch?
The daily S1 support at $447.22 and the daily pivot point at $455.39 have already been broken. The next downside references are the daily lower Bollinger band at $409.72 and the 200-session EMA at $391.04.
Is Western Digital stock oversold?
It depends on the timeframe. The daily RSI14 at 40.14 is not yet oversold. However, the hourly RSI14 at 29.78 is approaching oversold conditions, and the 15-minute RSI14 at 24.09 is firmly oversold.
What would signal a bullish reversal?
A bullish reversal would require price to reclaim the daily S1 support at $447.22 and the daily pivot at $455.39. On the hourly chart, a recovery above the pivot point at $460.84, paired with RSI14 moving back above 50, would be needed to confirm buyers have regained control.
Disclaimer: This article is for informational purposes only and does not constitute financial advice, an investment recommendation, or a solicitation to buy or sell any financial instrument or cryptocurrency. The analysis provided is not indicative of future results. Investing in crypto assets and financial markets carries a high risk of capital loss. Always do your own research (DYOR) and consult a qualified financial advisor before making any decision.
Article produced with the assistance of artificial intelligence and reviewed by the editorial team.
Western Digital stock falls 9% as it breaks below key support levels
Western Digital stock is sharply lower on Friday, erasing Thursday’s gain as an intraday slide breaks through several layers of daily support. Trading at $419.84 as of 09:43 ET, the stock was down 9.24% versus Thursday’s close of $462.56.
WDC — daily chart with candlesticks, EMA20/EMA50 and volume.
Key takeaways
Western Digital stock was trading at $419.84 as of 09:43 ET, down 9.24% from Thursday’s close of $462.56.
Price has broken below the daily S1 support at $447.22 and the daily pivot point at $455.39.
The hourly chart shows a fully bearish EMA stack, with price below the 20-hour, 50-hour, and 200-hour averages.
Daily RSI14 at 40.14 remains above oversold territory, while the hourly RSI14 at 29.78 approaches oversold conditions.
The bearish path points toward the daily lower Bollinger band at $409.72 and the 200-session EMA at $391.04.
The reversal follows a constructive run of coverage earlier in the week. On Thursday, Western Digital closed at $462.56, a gain of 1.78% from the prior session, according to a report from Yahoo Finance UK. Sentiment had also been supported by Seeking Alpha’s Steven Cress, who highlighted an improving valuation grade and a top-tier quant rating tied to the company’s AI storage demand, while a separate Seeking Alpha piece detailed how WD Red Pro HDDs are being positioned to support AI-powered NAS systems. A Yahoo Finance report noted that Zacks.com users had been watching the stock closely, and another Yahoo Finance piece framed Western Digital alongside other AI infrastructure names as a potential beneficiary of rising bond yields pulling capital toward cash-generative, real-asset businesses. None of this coverage, however, addresses Friday’s sharp reversal directly.
Western Digital Stock: Daily Structure Weakens
Trend Averages Signal Short-Term Weakness
On the daily chart, Western Digital stock sits below both its 20-session EMA at $451.23 and its 50-session EMA at $467.75. At the same time, it remains above the 200-session EMA at $391.04. That is a mixed position: short- and medium-term trends have turned down. Yet the broader daily structure has not broken below the long-run average.
Momentum Indicators Point to Softening Conditions
The daily RSI14 reads 40.14, below the neutral 50 line but not yet in oversold territory. Momentum is soft rather than exhausted. The daily MACD line stands at -5.81, above its signal at -6.71, with a positive histogram of 0.9. Both values remain below zero, so the broader daily trend is still negative. Notably, the line sitting above its signal suggests the pace of selling has eased, at least for the moment.
Support Levels Give Way
Price is trading between the daily Bollinger mid-band at $449.67 and the lower band at $409.72. It sits closer to the lower band than the mid-band. The daily ATR14 reads 27.73, pointing to a wide average range and elevated volatility. Friday’s decline has broken decisively below the daily S1 support at $447.22. Price now sits well under the pivot point itself at $455.39. That is a meaningful technical breach, not a minor dip.
Hourly Momentum Confirms the Bearish Tilt
The hourly timeframe leaves little ambiguity. Price sits below the 20-hour EMA at $451.12. That average sits just below the 50-hour EMA at $451.72, which in turn sits below the 200-hour EMA at $455.88. This is a fully bearish stack, with price under every average in descending order.
The hourly RSI14 has fallen to 29.78, approaching oversold conditions. The hourly MACD line is at -2.27, below its signal at -0.36, with a negative histogram of -1.91. Downside momentum is intact and, unlike the daily reading, shows no early sign of easing. Price has also dropped below the hourly lower Bollinger band at $434.27. Meanwhile, the hourly pivot point at $460.84 and S1 support at $458.12 both sit well above current price.
This is where the daily and hourly pictures diverge. The daily setup, despite the break through S1, still carries a neutral undertone. Price remains above its 200-session EMA. The hourly chart, in contrast, is unambiguously bearish. Full EMA alignment to the downside is paired with momentum accelerating rather than stabilizing. In practice, the hourly weakness confirms and intensifies the daily deterioration.
15-Minute Chart: Execution Context
On the 15-minute chart, used here only for timing, RSI14 stands at 24.09, firmly in oversold territory. The MACD line sits at -1.26, below its signal at 0.11, with a negative histogram of -1.37. Price also trades beneath the 15-minute lower Bollinger band at $433.5 and well under the 15-minute S1 support at $460.66. Therefore, the short-term oversold reading raises the possibility of a bounce or consolidation. However, it does not by itself reverse the dominant hourly and daily pressure.
Bullish and Bearish Paths for Western Digital Stock
A bullish case for Western Digital stock would need price to first reclaim the daily S1 support at $447.22, then the daily pivot point at $455.39. Clearing the daily 20-session EMA at $451.23 would further ease the immediate pressure. On the hourly chart, a recovery above the pivot point at $460.84 would be needed. That, paired with RSI14 moving back above 50, would confirm buyers have regained control. Until those levels are reclaimed, any bounce remains vulnerable to renewed selling.
The bearish case is currently the path of least resistance. A continuation lower would likely test the daily lower Bollinger band at $409.72. The 200-session EMA at $391.04 would be the next structural reference beyond that. On the hourly chart, a persistently negative histogram would keep sellers in control. Price remaining under the lower Bollinger band at $434.27 would reinforce that control. Only a reclaim of the levels outlined above would invalidate this bearish continuation.
Overall, as of 09:43 ET, Western Digital stock was trading at $419.84, down 9.24% versus Thursday’s close of $462.56. Price sits below every meaningful daily and hourly support level. This includes the daily pivot at $455.39, S1 support at $447.22, and the hourly pivot point at $460.84. The daily ATR14 at 27.73 reflects a genuinely wide trading range. What remains uncertain is whether this is a sharp, short-term overshoot. The oversold readings on the 15-minute and hourly charts support that interpretation. Alternatively, it could be the start of a deeper correction that eventually tests the 200-session EMA. For now, the charts do not settle that question.
FAQ
What is the current price of Western Digital stock?
Western Digital stock was trading at $419.84 as of 09:43 ET on Friday, down 9.24% versus Thursday’s close of $462.56.
What are the key support levels to watch?
The daily S1 support at $447.22 and the daily pivot point at $455.39 have already been broken. The next downside references are the daily lower Bollinger band at $409.72 and the 200-session EMA at $391.04.
Is Western Digital stock oversold?
It depends on the timeframe. The daily RSI14 at 40.14 is not yet oversold. However, the hourly RSI14 at 29.78 is approaching oversold conditions, and the 15-minute RSI14 at 24.09 is firmly oversold.
What would signal a bullish reversal?
A bullish reversal would require price to reclaim the daily S1 support at $447.22 and the daily pivot at $455.39. On the hourly chart, a recovery above the pivot point at $460.84, paired with RSI14 moving back above 50, would be needed to confirm buyers have regained control.
Disclaimer: This article is for informational purposes only and does not constitute financial advice, an investment recommendation, or a solicitation to buy or sell any financial instrument or cryptocurrency. The analysis provided is not indicative of future results. Investing in crypto assets and financial markets carries a high risk of capital loss. Always do your own research (DYOR) and consult a qualified financial advisor before making any decision.
Article produced with the assistance of artificial intelligence and reviewed by the editorial team.
WDC — daily chart with candlesticks, EMA20/EMA50 and volume.
Key takeaways
Western Digital stock was trading at $419.84 as of 09:43 ET, down 9.24% from Thursday’s close of $462.56.
Price has broken below the daily S1 support at $447.22 and the daily pivot point at $455.39.
The hourly chart shows a fully bearish EMA stack, with price below the 20-hour, 50-hour, and 200-hour averages.
Daily RSI14 at 40.14 remains above oversold territory, while the hourly RSI14 at 29.78 approaches oversold conditions.
The bearish path points toward the daily lower Bollinger band at $409.72 and the 200-session EMA at $391.04.
The reversal follows a constructive run of coverage earlier in the week. On Thursday, Western Digital closed at $462.56, a gain of 1.78% from the prior session, according to a report from Yahoo Finance UK. Sentiment had also been supported by Seeking Alpha’s Steven Cress, who highlighted an improving valuation grade and a top-tier quant rating tied to the company’s AI storage demand, while a separate Seeking Alpha piece detailed how WD Red Pro HDDs are being positioned to support AI-powered NAS systems. A Yahoo Finance report noted that Zacks.com users had been watching the stock closely, and another Yahoo Finance piece framed Western Digital alongside other AI infrastructure names as a potential beneficiary of rising bond yields pulling capital toward cash-generative, real-asset businesses. None of this coverage, however, addresses Friday’s sharp reversal directly.
Western Digital Stock: Daily Structure Weakens
Trend Averages Signal Short-Term Weakness
On the daily chart, Western Digital stock sits below both its 20-session EMA at $451.23 and its 50-session EMA at $467.75. At the same time, it remains above the 200-session EMA at $391.04. That is a mixed position: short- and medium-term trends have turned down. Yet the broader daily structure has not broken below the long-run average.
Momentum Indicators Point to Softening Conditions
The daily RSI14 reads 40.14, below the neutral 50 line but not yet in oversold territory. Momentum is soft rather than exhausted. The daily MACD line stands at -5.81, above its signal at -6.71, with a positive histogram of 0.9. Both values remain below zero, so the broader daily trend is still negative. Notably, the line sitting above its signal suggests the pace of selling has eased, at least for the moment.
Support Levels Give Way
Price is trading between the daily Bollinger mid-band at $449.67 and the lower band at $409.72. It sits closer to the lower band than the mid-band. The daily ATR14 reads 27.73, pointing to a wide average range and elevated volatility. Friday’s decline has broken decisively below the daily S1 support at $447.22. Price now sits well under the pivot point itself at $455.39. That is a meaningful technical breach, not a minor dip.
Hourly Momentum Confirms the Bearish Tilt
The hourly timeframe leaves little ambiguity. Price sits below the 20-hour EMA at $451.12. That average sits just below the 50-hour EMA at $451.72, which in turn sits below the 200-hour EMA at $455.88. This is a fully bearish stack, with price under every average in descending order.
The hourly RSI14 has fallen to 29.78, approaching oversold conditions. The hourly MACD line is at -2.27, below its signal at -0.36, with a negative histogram of -1.91. Downside momentum is intact and, unlike the daily reading, shows no early sign of easing. Price has also dropped below the hourly lower Bollinger band at $434.27. Meanwhile, the hourly pivot point at $460.84 and S1 support at $458.12 both sit well above current price.
This is where the daily and hourly pictures diverge. The daily setup, despite the break through S1, still carries a neutral undertone. Price remains above its 200-session EMA. The hourly chart, in contrast, is unambiguously bearish. Full EMA alignment to the downside is paired with momentum accelerating rather than stabilizing. In practice, the hourly weakness confirms and intensifies the daily deterioration.
15-Minute Chart: Execution Context
On the 15-minute chart, used here only for timing, RSI14 stands at 24.09, firmly in oversold territory. The MACD line sits at -1.26, below its signal at 0.11, with a negative histogram of -1.37. Price also trades beneath the 15-minute lower Bollinger band at $433.5 and well under the 15-minute S1 support at $460.66. Therefore, the short-term oversold reading raises the possibility of a bounce or consolidation. However, it does not by itself reverse the dominant hourly and daily pressure.
Bullish and Bearish Paths for Western Digital Stock
A bullish case for Western Digital stock would need price to first reclaim the daily S1 support at $447.22, then the daily pivot point at $455.39. Clearing the daily 20-session EMA at $451.23 would further ease the immediate pressure. On the hourly chart, a recovery above the pivot point at $460.84 would be needed. That, paired with RSI14 moving back above 50, would confirm buyers have regained control. Until those levels are reclaimed, any bounce remains vulnerable to renewed selling.
The bearish case is currently the path of least resistance. A continuation lower would likely test the daily lower Bollinger band at $409.72. The 200-session EMA at $391.04 would be the next structural reference beyond that. On the hourly chart, a persistently negative histogram would keep sellers in control. Price remaining under the lower Bollinger band at $434.27 would reinforce that control. Only a reclaim of the levels outlined above would invalidate this bearish continuation.
Overall, as of 09:43 ET, Western Digital stock was trading at $419.84, down 9.24% versus Thursday’s close of $462.56. Price sits below every meaningful daily and hourly support level. This includes the daily pivot at $455.39, S1 support at $447.22, and the hourly pivot point at $460.84. The daily ATR14 at 27.73 reflects a genuinely wide trading range. What remains uncertain is whether this is a sharp, short-term overshoot. The oversold readings on the 15-minute and hourly charts support that interpretation. Alternatively, it could be the start of a deeper correction that eventually tests the 200-session EMA. For now, the charts do not settle that question.
FAQ
What is the current price of Western Digital stock?
Western Digital stock was trading at $419.84 as of 09:43 ET on Friday, down 9.24% versus Thursday’s close of $462.56.
What are the key support levels to watch?
The daily S1 support at $447.22 and the daily pivot point at $455.39 have already been broken. The next downside references are the daily lower Bollinger band at $409.72 and the 200-session EMA at $391.04.
Is Western Digital stock oversold?
It depends on the timeframe. The daily RSI14 at 40.14 is not yet oversold. However, the hourly RSI14 at 29.78 is approaching oversold conditions, and the 15-minute RSI14 at 24.09 is firmly oversold.
What would signal a bullish reversal?
A bullish reversal would require price to reclaim the daily S1 support at $447.22 and the daily pivot at $455.39. On the hourly chart, a recovery above the pivot point at $460.84, paired with RSI14 moving back above 50, would be needed to confirm buyers have regained control.
Disclaimer: This article is for informational purposes only and does not constitute financial advice, an investment recommendation, or a solicitation to buy or sell any financial instrument or cryptocurrency. The analysis provided is not indicative of future results. Investing in crypto assets and financial markets carries a high risk of capital loss. Always do your own research (DYOR) and consult a qualified financial advisor before making any decision.
Article produced with the assistance of artificial intelligence and reviewed by the editorial team.
99
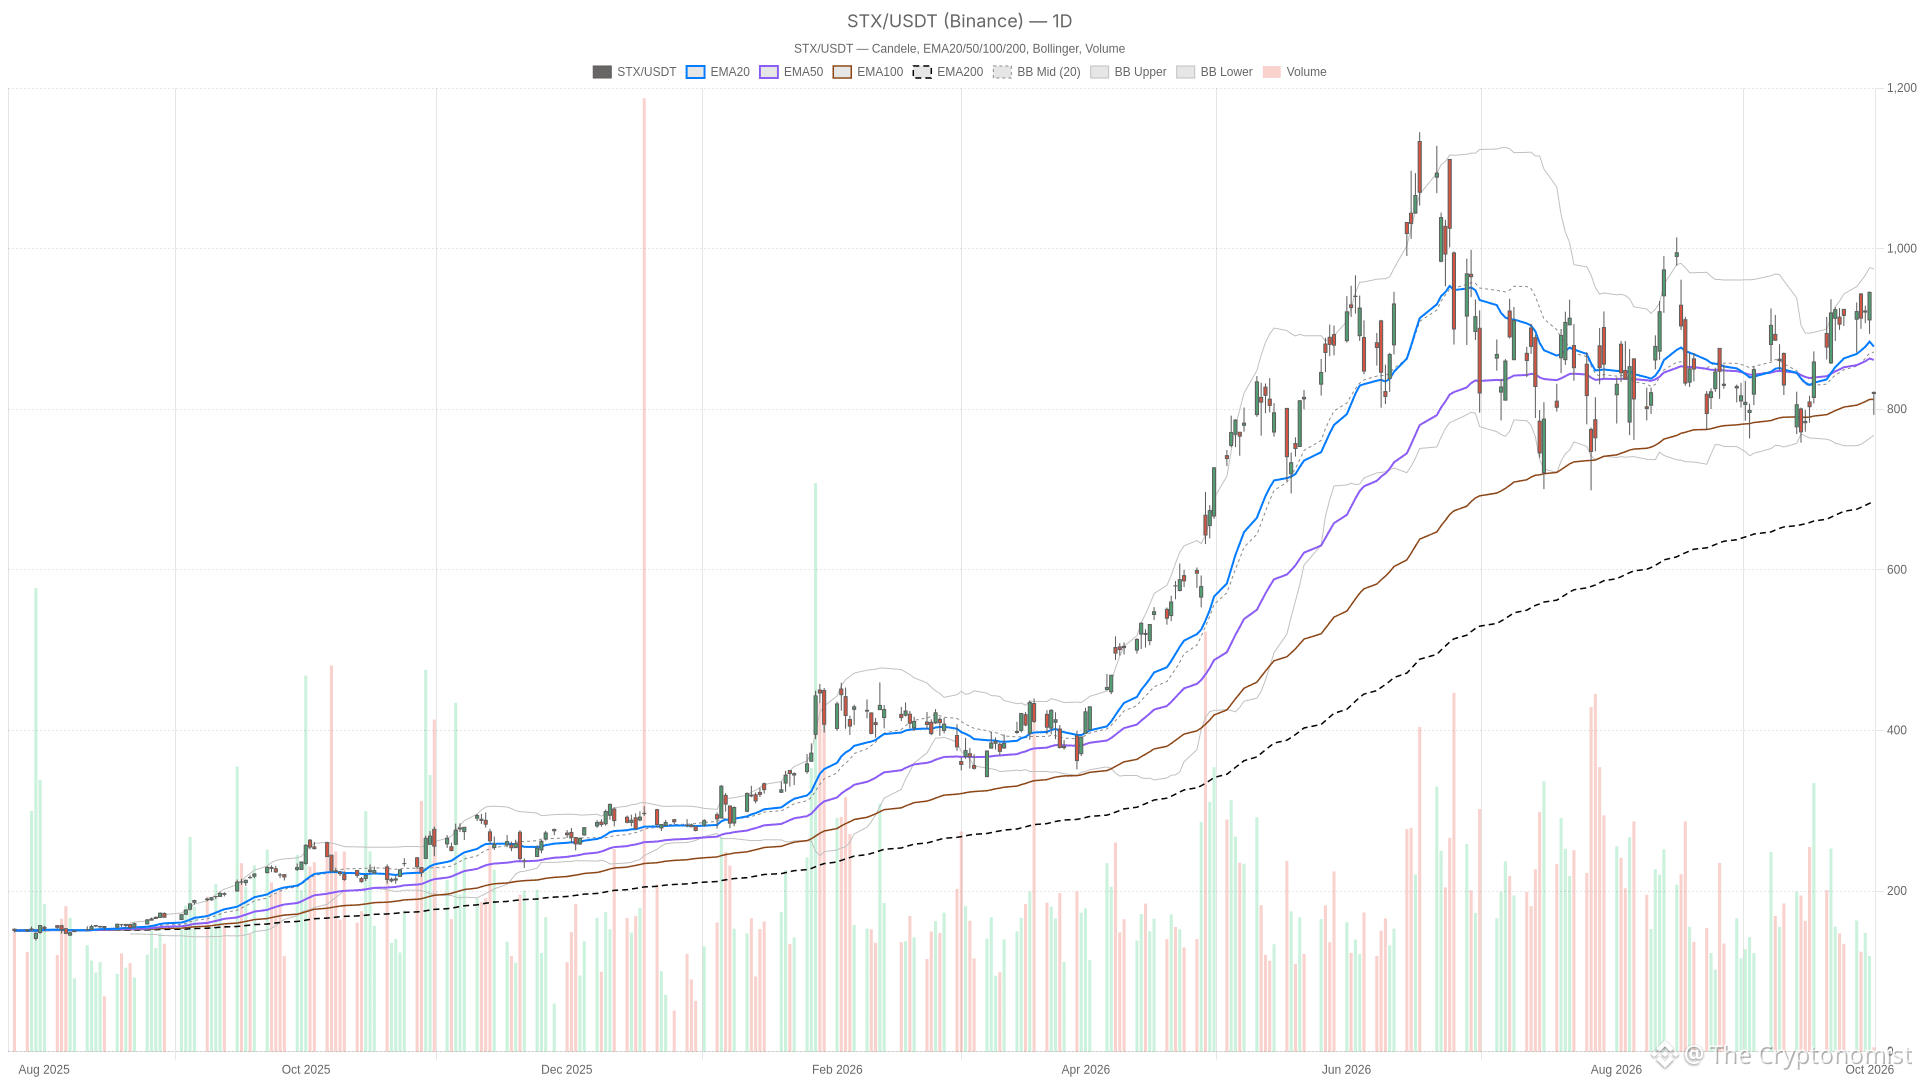
Article
See translation
Seagate Technology stock slides 13.32% as Toshiba’s HDD expansion rattles sectorSeagate Technology stock was trading at $819.60 as of 09:40 ET on Friday, October 2, 2026, down 13.32% from the prior close of $945.57. The session opened at $821.00 and swung between $792.95 and $822.00, with volume at 111,667 shares.
STX — daily chart with candlesticks, EMA20/EMA50 and volume.
Key takeaways
Seagate Technology stock was trading at $819.60 as of 09:40 ET, down 13.32% from the prior close of $945.57.
Toshiba’s HDD capacity expansion plan rattled the storage sector, according to a Yahoo Finance report published before Friday’s open.
Price broke below the daily pivot support (S1) at $910.76, signaling sellers have pushed through the first layer of daily support.
Hourly and 15-minute RSI readings are deeply oversold at 26.23 and 19.92, respectively.
The daily MACD histogram remains modestly positive at 1.32, creating a conflict between the intact daily structure and the intraday selloff.
Seagate Technology Stock Breaks Below Daily Support as Selloff Accelerates
The drop follows a Yahoo Finance report published before Friday’s open. It noted Seagate shares fell 11% on Friday, while Western Digital dropped 7%. The report tied the move to Toshiba‘s plans to significantly expand its hard disk drive production capacity to meet growing AI data center demand. Investing.com also flagged the move, in a piece asking why Seagate stock was tumbling. That report pointed to a broader market backdrop that included a weaker-than-expected US jobs report and a sharp slide in Nike shares.
Earlier in the week, the stock had already drawn mixed commentary. A Seeking Alpha analysis published Monday argued the shares were more compelling after a pullback, but still expensive. It cited a roughly 25x forward P/E and concerns about a potential peak in data center capex. A separate Seeking Alpha piece from the same day made the bull case instead, built around HAMR Mozaic adoption and AI-driven cloud demand. A Yahoo Finance piece published Tuesday also compared Seagate’s AI storage positioning with NetApp’s.
Daily Chart: Momentum Lags the Drop in Seagate Technology Stock
On the daily chart, the broader structure still carries the scars of the prior uptrend. Friday’s drop, though, has pushed price below both short-term averages. The $819.60 level now sits beneath the 50-session EMA at $861.40 and the 20-session EMA at $878.05. The 200-session EMA, at $668.66, remains far lower. It still reflects the longer advance that preceded this selloff. Daily RSI14 reads 43.12, slipping below the neutral 50 mark but not yet in oversold territory. The daily MACD line, at 14.54, is still above its signal at 13.22. That leaves a modestly positive histogram of 1.32. In practice, daily momentum has not flipped negative yet. It is lagging behind the sharpness of today’s decline.
Meanwhile, price is trading below the daily Bollinger mid-band at $871.04. It sits closer to the lower band at $767.24 than to the upper band at $974.84. The daily ATR14 stands at $55.69, a reading that points to markedly elevated volatility. More tellingly, price has broken well below the daily pivot support at $910.76 (S1). The pivot point itself sits at $928.56, with resistance (R1) at $963.37 from the previous completed session. That break of S1 is a meaningful shift. It shows sellers have already pushed through the first layer of daily support, not just tested it.
Hourly and 15-Minute Charts Confirm the Intraday Breakdown
Hourly Chart Shows Capitulation
The hourly chart confirms the bearish pressure and adds urgency to it. Price sits below the H1 20-period EMA at $912.65, the 50-period EMA at $905.63, and the 200-period EMA at $872.97. Among themselves, those averages are still stacked in bullish order. The 20-period sits above the 50-period, which sits above the 200-period. Price, however, has now broken beneath all three. That signals the intraday trend has reversed sharply against the larger structure. Hourly RSI14 at 26.23 is firmly in oversold territory. The hourly MACD line at -2.63 sits below its signal at 2.93, producing a negative histogram of -5.55. That confirms active downside momentum on this timeframe.
Meanwhile, price has also dropped below the hourly Bollinger lower band at $866.26. That extension beyond the band typically reflects an aggressive, fast-moving decline rather than an orderly pullback. The hourly ATR14 at $23.20 underscores that intensity. On the pivot grid, price is trading well under the hourly S1 at $936.07. The pivot point sits at $941.21, with R1 at $950.60. Both levels are well above the current price. They would act as resistance should any bounce attempt develop.
15-Minute Structure Deepens the Breakdown
Similarly, the 15-minute chart paints the same picture. Price is below the 20-period EMA at $918.68, the 50-period EMA at $919.14, and the 200-period EMA at $901.56. Notably, the 20-period average now sits just under the 50-period one. That small inversion shows the most recent price action rolling over even against the fastest-moving trend line. RSI14 on this timeframe reads 19.92, deeply oversold. The MACD line, at -4.30, remains well below its signal at 2.13, with a histogram of -6.43. Price is also trading beneath the 15-minute Bollinger lower band at $872.60. It sits below the 15-minute pivot support at $938.78. That confirms sellers remain in control into the early stretch of the session.
Conflicting Signals Across Timeframes
Taken together, the picture across timeframes is not fully aligned. The daily chart still shows price above its 200-session EMA. Its MACD line has not yet turned negative either. Those are artifacts of the longer uptrend that preceded this week. However, the hourly and 15-minute charts show outright capitulation. Price sits below every short-term average. It has broken beneath both lower Bollinger bands and is deeply oversold on RSI. In short, the daily trend has not technically broken down yet. The intraday action, however, already reflects a sharp, broad-based selloff. It is testing the lower end of the daily range. This leaves Seagate Technology stock navigating conflicting signals. The daily structure remains intact on paper. The intraday tape, in contrast, has already given way.
Bullish Scenario
A bullish recovery scenario would need price to first reclaim the daily 50-session EMA at $861.40. From there, the next hurdle is the daily S1 at $910.76. That is followed by the daily pivot point at $928.56. A further push through the hourly pivot point at $941.21 would add confidence that the bounce has real follow-through. The bull case, built around HAMR Mozaic adoption and AI-driven cloud storage demand, would need fresh validation to support such a recovery. This is especially true given the competitive concerns raised by the Toshiba expansion report.
Bearish Scenario
On the other hand, a continuation of the selloff would likely see price test the session low near $792.95. A failure to hold there could open the way toward the daily Bollinger lower band at $767.24. Beyond that, the daily 200-session EMA at $668.66 remains a much deeper support. It is still a considerable distance below current levels. The Hold-rated Seeking Alpha view, flagging a roughly 25x forward P/E and a potential peak in data center capex, would gain weight if the stock cannot stabilize above the broken daily S1 at $910.76. Continued sector pressure tied to the Toshiba capacity report would need to persist for the bearish case to extend further.
Where Seagate Technology Stock Stands Now
Overall, Seagate Technology stock is navigating a volatile session. It is trading well below its daily pivot structure and firmly beneath short-term averages on every timeframe. The daily ATR14 near $55.69 and the hourly ATR14 near $23.20 both point to notably elevated volatility. With the session still open, the official close has not yet settled. Where price finishes relative to the daily S1 at $910.76 will matter for how the next sessions are read. The same is true for where it ends relative to the session low near $792.95. What remains uncertain is whether today’s intraday capitulation marks a washout, or the start of a deeper daily trend shift. That is a question the current data cannot yet answer.
FAQ
What are the key support levels to watch for Seagate Technology stock?
The immediate support is the session low near $792.95. Below that, the daily Bollinger lower band at $767.24 and the daily 200-session EMA at $668.66 represent deeper support zones. On the upside, the broken daily S1 at $910.76 now acts as resistance.
Is Seagate Technology stock technically oversold?
On the intraday timeframes, yes. The hourly RSI14 reads 26.23 and the 15-minute RSI14 is at 19.92, both in oversold territory. The daily RSI14, however, stands at 43.12, still above the oversold threshold of 30.
What do the daily and intraday charts say about the trend?
The daily chart has not technically broken down. Price remains above the 200-session EMA at $668.66 and the daily MACD histogram is still positive. The intraday charts, however, show a sharp reversal with price below all short-term averages and Bollinger bands. This creates conflicting signals between the daily structure and the intraday selloff.
Disclaimer: This article is for informational purposes only and does not constitute financial advice, an investment recommendation, or a solicitation to buy or sell any financial instrument or cryptocurrency. The analysis provided is not indicative of future results. Investing in crypto assets and financial markets carries a high risk of capital loss. Always do your own research (DYOR) and consult a qualified financial advisor before making any decision.
Article produced with the assistance of artificial intelligence and reviewed by the editorial team.
Seagate Technology stock slides 13.32% as Toshiba’s HDD expansion rattles sector
Seagate Technology stock was trading at $819.60 as of 09:40 ET on Friday, October 2, 2026, down 13.32% from the prior close of $945.57. The session opened at $821.00 and swung between $792.95 and $822.00, with volume at 111,667 shares.
STX — daily chart with candlesticks, EMA20/EMA50 and volume.
Key takeaways
Seagate Technology stock was trading at $819.60 as of 09:40 ET, down 13.32% from the prior close of $945.57.
Toshiba’s HDD capacity expansion plan rattled the storage sector, according to a Yahoo Finance report published before Friday’s open.
Price broke below the daily pivot support (S1) at $910.76, signaling sellers have pushed through the first layer of daily support.
Hourly and 15-minute RSI readings are deeply oversold at 26.23 and 19.92, respectively.
The daily MACD histogram remains modestly positive at 1.32, creating a conflict between the intact daily structure and the intraday selloff.
Seagate Technology Stock Breaks Below Daily Support as Selloff Accelerates
The drop follows a Yahoo Finance report published before Friday’s open. It noted Seagate shares fell 11% on Friday, while Western Digital dropped 7%. The report tied the move to Toshiba‘s plans to significantly expand its hard disk drive production capacity to meet growing AI data center demand. Investing.com also flagged the move, in a piece asking why Seagate stock was tumbling. That report pointed to a broader market backdrop that included a weaker-than-expected US jobs report and a sharp slide in Nike shares.
Earlier in the week, the stock had already drawn mixed commentary. A Seeking Alpha analysis published Monday argued the shares were more compelling after a pullback, but still expensive. It cited a roughly 25x forward P/E and concerns about a potential peak in data center capex. A separate Seeking Alpha piece from the same day made the bull case instead, built around HAMR Mozaic adoption and AI-driven cloud demand. A Yahoo Finance piece published Tuesday also compared Seagate’s AI storage positioning with NetApp’s.
Daily Chart: Momentum Lags the Drop in Seagate Technology Stock
On the daily chart, the broader structure still carries the scars of the prior uptrend. Friday’s drop, though, has pushed price below both short-term averages. The $819.60 level now sits beneath the 50-session EMA at $861.40 and the 20-session EMA at $878.05. The 200-session EMA, at $668.66, remains far lower. It still reflects the longer advance that preceded this selloff. Daily RSI14 reads 43.12, slipping below the neutral 50 mark but not yet in oversold territory. The daily MACD line, at 14.54, is still above its signal at 13.22. That leaves a modestly positive histogram of 1.32. In practice, daily momentum has not flipped negative yet. It is lagging behind the sharpness of today’s decline.
Meanwhile, price is trading below the daily Bollinger mid-band at $871.04. It sits closer to the lower band at $767.24 than to the upper band at $974.84. The daily ATR14 stands at $55.69, a reading that points to markedly elevated volatility. More tellingly, price has broken well below the daily pivot support at $910.76 (S1). The pivot point itself sits at $928.56, with resistance (R1) at $963.37 from the previous completed session. That break of S1 is a meaningful shift. It shows sellers have already pushed through the first layer of daily support, not just tested it.
Hourly and 15-Minute Charts Confirm the Intraday Breakdown
Hourly Chart Shows Capitulation
The hourly chart confirms the bearish pressure and adds urgency to it. Price sits below the H1 20-period EMA at $912.65, the 50-period EMA at $905.63, and the 200-period EMA at $872.97. Among themselves, those averages are still stacked in bullish order. The 20-period sits above the 50-period, which sits above the 200-period. Price, however, has now broken beneath all three. That signals the intraday trend has reversed sharply against the larger structure. Hourly RSI14 at 26.23 is firmly in oversold territory. The hourly MACD line at -2.63 sits below its signal at 2.93, producing a negative histogram of -5.55. That confirms active downside momentum on this timeframe.
Meanwhile, price has also dropped below the hourly Bollinger lower band at $866.26. That extension beyond the band typically reflects an aggressive, fast-moving decline rather than an orderly pullback. The hourly ATR14 at $23.20 underscores that intensity. On the pivot grid, price is trading well under the hourly S1 at $936.07. The pivot point sits at $941.21, with R1 at $950.60. Both levels are well above the current price. They would act as resistance should any bounce attempt develop.
15-Minute Structure Deepens the Breakdown
Similarly, the 15-minute chart paints the same picture. Price is below the 20-period EMA at $918.68, the 50-period EMA at $919.14, and the 200-period EMA at $901.56. Notably, the 20-period average now sits just under the 50-period one. That small inversion shows the most recent price action rolling over even against the fastest-moving trend line. RSI14 on this timeframe reads 19.92, deeply oversold. The MACD line, at -4.30, remains well below its signal at 2.13, with a histogram of -6.43. Price is also trading beneath the 15-minute Bollinger lower band at $872.60. It sits below the 15-minute pivot support at $938.78. That confirms sellers remain in control into the early stretch of the session.
Conflicting Signals Across Timeframes
Taken together, the picture across timeframes is not fully aligned. The daily chart still shows price above its 200-session EMA. Its MACD line has not yet turned negative either. Those are artifacts of the longer uptrend that preceded this week. However, the hourly and 15-minute charts show outright capitulation. Price sits below every short-term average. It has broken beneath both lower Bollinger bands and is deeply oversold on RSI. In short, the daily trend has not technically broken down yet. The intraday action, however, already reflects a sharp, broad-based selloff. It is testing the lower end of the daily range. This leaves Seagate Technology stock navigating conflicting signals. The daily structure remains intact on paper. The intraday tape, in contrast, has already given way.
Bullish Scenario
A bullish recovery scenario would need price to first reclaim the daily 50-session EMA at $861.40. From there, the next hurdle is the daily S1 at $910.76. That is followed by the daily pivot point at $928.56. A further push through the hourly pivot point at $941.21 would add confidence that the bounce has real follow-through. The bull case, built around HAMR Mozaic adoption and AI-driven cloud storage demand, would need fresh validation to support such a recovery. This is especially true given the competitive concerns raised by the Toshiba expansion report.
Bearish Scenario
On the other hand, a continuation of the selloff would likely see price test the session low near $792.95. A failure to hold there could open the way toward the daily Bollinger lower band at $767.24. Beyond that, the daily 200-session EMA at $668.66 remains a much deeper support. It is still a considerable distance below current levels. The Hold-rated Seeking Alpha view, flagging a roughly 25x forward P/E and a potential peak in data center capex, would gain weight if the stock cannot stabilize above the broken daily S1 at $910.76. Continued sector pressure tied to the Toshiba capacity report would need to persist for the bearish case to extend further.
Where Seagate Technology Stock Stands Now
Overall, Seagate Technology stock is navigating a volatile session. It is trading well below its daily pivot structure and firmly beneath short-term averages on every timeframe. The daily ATR14 near $55.69 and the hourly ATR14 near $23.20 both point to notably elevated volatility. With the session still open, the official close has not yet settled. Where price finishes relative to the daily S1 at $910.76 will matter for how the next sessions are read. The same is true for where it ends relative to the session low near $792.95. What remains uncertain is whether today’s intraday capitulation marks a washout, or the start of a deeper daily trend shift. That is a question the current data cannot yet answer.
FAQ
What are the key support levels to watch for Seagate Technology stock?
The immediate support is the session low near $792.95. Below that, the daily Bollinger lower band at $767.24 and the daily 200-session EMA at $668.66 represent deeper support zones. On the upside, the broken daily S1 at $910.76 now acts as resistance.
Is Seagate Technology stock technically oversold?
On the intraday timeframes, yes. The hourly RSI14 reads 26.23 and the 15-minute RSI14 is at 19.92, both in oversold territory. The daily RSI14, however, stands at 43.12, still above the oversold threshold of 30.
What do the daily and intraday charts say about the trend?
The daily chart has not technically broken down. Price remains above the 200-session EMA at $668.66 and the daily MACD histogram is still positive. The intraday charts, however, show a sharp reversal with price below all short-term averages and Bollinger bands. This creates conflicting signals between the daily structure and the intraday selloff.
Disclaimer: This article is for informational purposes only and does not constitute financial advice, an investment recommendation, or a solicitation to buy or sell any financial instrument or cryptocurrency. The analysis provided is not indicative of future results. Investing in crypto assets and financial markets carries a high risk of capital loss. Always do your own research (DYOR) and consult a qualified financial advisor before making any decision.
Article produced with the assistance of artificial intelligence and reviewed by the editorial team.
STX — daily chart with candlesticks, EMA20/EMA50 and volume.
Key takeaways
Seagate Technology stock was trading at $819.60 as of 09:40 ET, down 13.32% from the prior close of $945.57.
Toshiba’s HDD capacity expansion plan rattled the storage sector, according to a Yahoo Finance report published before Friday’s open.
Price broke below the daily pivot support (S1) at $910.76, signaling sellers have pushed through the first layer of daily support.
Hourly and 15-minute RSI readings are deeply oversold at 26.23 and 19.92, respectively.
The daily MACD histogram remains modestly positive at 1.32, creating a conflict between the intact daily structure and the intraday selloff.
Seagate Technology Stock Breaks Below Daily Support as Selloff Accelerates
The drop follows a Yahoo Finance report published before Friday’s open. It noted Seagate shares fell 11% on Friday, while Western Digital dropped 7%. The report tied the move to Toshiba‘s plans to significantly expand its hard disk drive production capacity to meet growing AI data center demand. Investing.com also flagged the move, in a piece asking why Seagate stock was tumbling. That report pointed to a broader market backdrop that included a weaker-than-expected US jobs report and a sharp slide in Nike shares.
Earlier in the week, the stock had already drawn mixed commentary. A Seeking Alpha analysis published Monday argued the shares were more compelling after a pullback, but still expensive. It cited a roughly 25x forward P/E and concerns about a potential peak in data center capex. A separate Seeking Alpha piece from the same day made the bull case instead, built around HAMR Mozaic adoption and AI-driven cloud demand. A Yahoo Finance piece published Tuesday also compared Seagate’s AI storage positioning with NetApp’s.
Daily Chart: Momentum Lags the Drop in Seagate Technology Stock
On the daily chart, the broader structure still carries the scars of the prior uptrend. Friday’s drop, though, has pushed price below both short-term averages. The $819.60 level now sits beneath the 50-session EMA at $861.40 and the 20-session EMA at $878.05. The 200-session EMA, at $668.66, remains far lower. It still reflects the longer advance that preceded this selloff. Daily RSI14 reads 43.12, slipping below the neutral 50 mark but not yet in oversold territory. The daily MACD line, at 14.54, is still above its signal at 13.22. That leaves a modestly positive histogram of 1.32. In practice, daily momentum has not flipped negative yet. It is lagging behind the sharpness of today’s decline.
Meanwhile, price is trading below the daily Bollinger mid-band at $871.04. It sits closer to the lower band at $767.24 than to the upper band at $974.84. The daily ATR14 stands at $55.69, a reading that points to markedly elevated volatility. More tellingly, price has broken well below the daily pivot support at $910.76 (S1). The pivot point itself sits at $928.56, with resistance (R1) at $963.37 from the previous completed session. That break of S1 is a meaningful shift. It shows sellers have already pushed through the first layer of daily support, not just tested it.
Hourly and 15-Minute Charts Confirm the Intraday Breakdown
Hourly Chart Shows Capitulation
The hourly chart confirms the bearish pressure and adds urgency to it. Price sits below the H1 20-period EMA at $912.65, the 50-period EMA at $905.63, and the 200-period EMA at $872.97. Among themselves, those averages are still stacked in bullish order. The 20-period sits above the 50-period, which sits above the 200-period. Price, however, has now broken beneath all three. That signals the intraday trend has reversed sharply against the larger structure. Hourly RSI14 at 26.23 is firmly in oversold territory. The hourly MACD line at -2.63 sits below its signal at 2.93, producing a negative histogram of -5.55. That confirms active downside momentum on this timeframe.
Meanwhile, price has also dropped below the hourly Bollinger lower band at $866.26. That extension beyond the band typically reflects an aggressive, fast-moving decline rather than an orderly pullback. The hourly ATR14 at $23.20 underscores that intensity. On the pivot grid, price is trading well under the hourly S1 at $936.07. The pivot point sits at $941.21, with R1 at $950.60. Both levels are well above the current price. They would act as resistance should any bounce attempt develop.
15-Minute Structure Deepens the Breakdown
Similarly, the 15-minute chart paints the same picture. Price is below the 20-period EMA at $918.68, the 50-period EMA at $919.14, and the 200-period EMA at $901.56. Notably, the 20-period average now sits just under the 50-period one. That small inversion shows the most recent price action rolling over even against the fastest-moving trend line. RSI14 on this timeframe reads 19.92, deeply oversold. The MACD line, at -4.30, remains well below its signal at 2.13, with a histogram of -6.43. Price is also trading beneath the 15-minute Bollinger lower band at $872.60. It sits below the 15-minute pivot support at $938.78. That confirms sellers remain in control into the early stretch of the session.
Conflicting Signals Across Timeframes
Taken together, the picture across timeframes is not fully aligned. The daily chart still shows price above its 200-session EMA. Its MACD line has not yet turned negative either. Those are artifacts of the longer uptrend that preceded this week. However, the hourly and 15-minute charts show outright capitulation. Price sits below every short-term average. It has broken beneath both lower Bollinger bands and is deeply oversold on RSI. In short, the daily trend has not technically broken down yet. The intraday action, however, already reflects a sharp, broad-based selloff. It is testing the lower end of the daily range. This leaves Seagate Technology stock navigating conflicting signals. The daily structure remains intact on paper. The intraday tape, in contrast, has already given way.
Bullish Scenario
A bullish recovery scenario would need price to first reclaim the daily 50-session EMA at $861.40. From there, the next hurdle is the daily S1 at $910.76. That is followed by the daily pivot point at $928.56. A further push through the hourly pivot point at $941.21 would add confidence that the bounce has real follow-through. The bull case, built around HAMR Mozaic adoption and AI-driven cloud storage demand, would need fresh validation to support such a recovery. This is especially true given the competitive concerns raised by the Toshiba expansion report.
Bearish Scenario
On the other hand, a continuation of the selloff would likely see price test the session low near $792.95. A failure to hold there could open the way toward the daily Bollinger lower band at $767.24. Beyond that, the daily 200-session EMA at $668.66 remains a much deeper support. It is still a considerable distance below current levels. The Hold-rated Seeking Alpha view, flagging a roughly 25x forward P/E and a potential peak in data center capex, would gain weight if the stock cannot stabilize above the broken daily S1 at $910.76. Continued sector pressure tied to the Toshiba capacity report would need to persist for the bearish case to extend further.
Where Seagate Technology Stock Stands Now
Overall, Seagate Technology stock is navigating a volatile session. It is trading well below its daily pivot structure and firmly beneath short-term averages on every timeframe. The daily ATR14 near $55.69 and the hourly ATR14 near $23.20 both point to notably elevated volatility. With the session still open, the official close has not yet settled. Where price finishes relative to the daily S1 at $910.76 will matter for how the next sessions are read. The same is true for where it ends relative to the session low near $792.95. What remains uncertain is whether today’s intraday capitulation marks a washout, or the start of a deeper daily trend shift. That is a question the current data cannot yet answer.
FAQ
What are the key support levels to watch for Seagate Technology stock?
The immediate support is the session low near $792.95. Below that, the daily Bollinger lower band at $767.24 and the daily 200-session EMA at $668.66 represent deeper support zones. On the upside, the broken daily S1 at $910.76 now acts as resistance.
Is Seagate Technology stock technically oversold?
On the intraday timeframes, yes. The hourly RSI14 reads 26.23 and the 15-minute RSI14 is at 19.92, both in oversold territory. The daily RSI14, however, stands at 43.12, still above the oversold threshold of 30.
What do the daily and intraday charts say about the trend?
The daily chart has not technically broken down. Price remains above the 200-session EMA at $668.66 and the daily MACD histogram is still positive. The intraday charts, however, show a sharp reversal with price below all short-term averages and Bollinger bands. This creates conflicting signals between the daily structure and the intraday selloff.
Disclaimer: This article is for informational purposes only and does not constitute financial advice, an investment recommendation, or a solicitation to buy or sell any financial instrument or cryptocurrency. The analysis provided is not indicative of future results. Investing in crypto assets and financial markets carries a high risk of capital loss. Always do your own research (DYOR) and consult a qualified financial advisor before making any decision.
Article produced with the assistance of artificial intelligence and reviewed by the editorial team.
67

Article
See translation
NVIDIA’s $4,999 DGX Spark AI runs 100-billion-parameter models locallyNVIDIA is opening a cheaper front door into its personal AI supercomputer lineup. On October 2, 2026, the company unveiled a 64GB configuration of the NVIDIA DGX Spark AI system, a smaller and less expensive sibling to the original 128GB box, built for developers who want to run serious AI models without renting cloud compute. The new unit ships with hardware partners Acer, ASUS, Dell, Gigabyte, HP and MSI, and it lands on shelves October 23, 2026, priced at $4,999.
Key takeaways
NVIDIA DGX Spark’s 64GB configuration arrives October 23, 2026, starting at $4,999, through partners Acer, ASUS, Dell, Gigabyte, HP and MSI.
The system supports local AI models up to 100 billion parameters, running the full NVIDIA AI software stack directly on the device.
Two 64GB units can cluster through NVIDIA Sync Cluster Assistant, pooling memory to 128GB and delivering up to 1.7x the performance of a single system.
According to Crypto Briefing, the price of the 128GB DGX Spark model has jumped nearly 75% to $6,950, pushing the difference between the two configurations to roughly $2,000.
Developers can run private AI agents entirely on device, without depending on cloud infrastructure.
NVIDIA launches DGX Spark 64GB with major hardware partners
The headline here is accessibility. NVIDIA built the 64GB DGX Spark to sit below its 128GB flagship on price while keeping the same core engineering, giving smaller teams and individual developers an entry point into local AI supercomputing that didn’t exist before at this cost.
Supported by Acer, ASUS, Dell, Gigabyte, HP, and MSI
The 64GB configuration is launching exclusively through six manufacturer partners — Acer, ASUS, Dell, Gigabyte, HP and MSI — each shipping the unit with DGX OS and the full NVIDIA AI software stack pre-installed and ready to use. According to Crypto Briefing, Lenovo appears elsewhere in the broader DGX Spark ecosystem but was not named as a partner for this specific 64GB SKU.
Available starting October 23, 2026 for $4,999
Buyers can get the 64GB unit starting Friday, October 23, 2026, at $4,999. That price arrives at a moment when memory itself has become the scarce resource driving AI hardware costs. Crypto Briefing reports that the original 128GB DGX Spark now costs $6,950 at retail, reflecting a price hike of nearly 75% and stretching the gap between the two configurations to close to $2,000. In other words, the 64GB version isn’t just a smaller box — it’s NVIDIA’s answer to a market where memory supply is tightening and prices are climbing across the board.
Technical capabilities of DGX Spark 64GB
Despite the lower price, the 64GB DGX Spark keeps the same core silicon and software as its bigger sibling. That matters because it means buyers aren’t trading away capability for a cheaper entry point — they’re trading away headroom.
Supports local AI models up to 100 billion parameters
NVIDIA says the 64GB configuration supports local AI models up to 100 billion parameters, along with the agentic applications built on top of them, running fully on device. That’s a notable ceiling for a desk-side unit priced under $5,000, and it puts mid-to-large open models within reach of individual developers rather than just enterprise data centers.
Includes NVIDIA Grace Blackwell compute, ConnectX-7 networking, CUDA AI software stack, and DGX OS
According to Crypto Briefing, the device’s core is the GB10 Grace Blackwell Superchip, which combines a 20-core Arm CPU and a Blackwell GPU within a single package. Memory bandwidth holds at 273 GB/s — identical to the 128GB model. Networking runs on NVIDIA ConnectX-7, the same high-speed hardware NVIDIA says can link additional units into larger multi-node clusters. On top of that, NVIDIA layers its CUDA-accelerated AI software stack together with DGX OS, delivering developers a ready-to-use local AI platform covering agents, inference, fine-tuning, data science and edge development.
This matters for a simple reason: a local AI supercomputer is only as useful as the software that ships with it. NVIDIA is pairing the hardware with NVIDIA Agent Toolkit, CUDA-X AI libraries, Nemotron open models, and support for popular runtimes like Ollama, vLLM, and PyTorch with CUDA — all working out of the box, so developers can reportedly go from power-on to running models in minutes.
Cluster scalability and performance features
The real upgrade path for DGX Spark owners isn’t buying a bigger box later — it’s connecting a second one. That’s where NVIDIA Sync Cluster technology comes in, turning two modest desktop units into something closer to a shared-memory workstation.
Two DGX Spark units can cluster via Sync Cluster Assistant
Every DGX Spark ships with a built-in NVIDIA ConnectX-7 NIC. Two 64GB units can connect directly using a QSFP cable, and NVIDIA Sync Cluster Assistant configures the multi-node setup automatically — detecting connected units, validating device configuration, and setting up the ConnectX-7 network without manual intervention. Developers don’t need to reconfigure anything when scaling from one node to two; every node runs the same software stack.
Memory pools to 128GB with up to 1.7x performance improvement
Clustering two 64GB units doesn’t just double the available memory to 128GB — it also expands supported model size up to 200 billion parameters and doubles memory bandwidth. In NVIDIA’s internal Qwen 3.8 27B test, two clustered 64GB systems delivered up to 1.7x the performance of a single system, with room to keep scaling as workloads grow. Coming later this month, NVIDIA Sync Model Launcher is designed to make running models across a cluster as simple as a few clicks, automatically configuring models to run across connected devices and making them accessible from a user’s laptop.
Why does this matter for anyone outside NVIDIA’s own labs? Because clustering has traditionally been a headache reserved for enterprise IT teams. By automating network detection and configuration, NVIDIA is trying to make multi-node scaling something an individual developer can do over a weekend rather than a project that needs dedicated infrastructure staff.
Local AI development without cloud dependency
The pitch for DGX Spark isn’t just raw horsepower — it’s independence from the cloud. Running inference locally means no per-token billing, no latency round-trip to a remote data center, and no sending proprietary data outside the building.
Run private AI agents entirely on device
NVIDIA says the new 64GB SKU can run capable local agents entirely on device, privately, without cloud dependency. That capability extends to a growing list of agentic playbooks — including NemoClaw, OpenClaw, Hermes Agent and OpenShell — available through build.nvidia.com. Blender is also expected to support the platform soon with a prebuilt, downloadable installer, folding creative application workflows into the same local setup.
For developers weighing cloud subscriptions against owned hardware, this is the core trade-off DGX Spark is built around: a fixed upfront cost in exchange for AI model inference that happens entirely on a machine they control. NVIDIA plans to release an updated version of DGX OS later in October 2026, aimed specifically at simplifying cluster setup and inference deployment — a signal that ease of use, not just raw specs, is what NVIDIA is betting will sell the platform going forward.
NVIDIA is also expanding the local AI push beyond DGX hardware. This month, Acer, ASUS, Dell, HP, Lenovo, Microsoft and MSI are set to release new Windows PCs built around NVIDIA RTX Spark, bringing that same local-first approach to mainstream consumer laptops and desktops.
Article produced with the assistance of artificial intelligence and reviewed by the editorial team.
NVIDIA’s $4,999 DGX Spark AI runs 100-billion-parameter models locally
NVIDIA is opening a cheaper front door into its personal AI supercomputer lineup. On October 2, 2026, the company unveiled a 64GB configuration of the NVIDIA DGX Spark AI system, a smaller and less expensive sibling to the original 128GB box, built for developers who want to run serious AI models without renting cloud compute. The new unit ships with hardware partners Acer, ASUS, Dell, Gigabyte, HP and MSI, and it lands on shelves October 23, 2026, priced at $4,999.
Key takeaways
NVIDIA DGX Spark’s 64GB configuration arrives October 23, 2026, starting at $4,999, through partners Acer, ASUS, Dell, Gigabyte, HP and MSI.
The system supports local AI models up to 100 billion parameters, running the full NVIDIA AI software stack directly on the device.
Two 64GB units can cluster through NVIDIA Sync Cluster Assistant, pooling memory to 128GB and delivering up to 1.7x the performance of a single system.
According to Crypto Briefing, the price of the 128GB DGX Spark model has jumped nearly 75% to $6,950, pushing the difference between the two configurations to roughly $2,000.
Developers can run private AI agents entirely on device, without depending on cloud infrastructure.
NVIDIA launches DGX Spark 64GB with major hardware partners
The headline here is accessibility. NVIDIA built the 64GB DGX Spark to sit below its 128GB flagship on price while keeping the same core engineering, giving smaller teams and individual developers an entry point into local AI supercomputing that didn’t exist before at this cost.
Supported by Acer, ASUS, Dell, Gigabyte, HP, and MSI
The 64GB configuration is launching exclusively through six manufacturer partners — Acer, ASUS, Dell, Gigabyte, HP and MSI — each shipping the unit with DGX OS and the full NVIDIA AI software stack pre-installed and ready to use. According to Crypto Briefing, Lenovo appears elsewhere in the broader DGX Spark ecosystem but was not named as a partner for this specific 64GB SKU.
Available starting October 23, 2026 for $4,999
Buyers can get the 64GB unit starting Friday, October 23, 2026, at $4,999. That price arrives at a moment when memory itself has become the scarce resource driving AI hardware costs. Crypto Briefing reports that the original 128GB DGX Spark now costs $6,950 at retail, reflecting a price hike of nearly 75% and stretching the gap between the two configurations to close to $2,000. In other words, the 64GB version isn’t just a smaller box — it’s NVIDIA’s answer to a market where memory supply is tightening and prices are climbing across the board.
Technical capabilities of DGX Spark 64GB
Despite the lower price, the 64GB DGX Spark keeps the same core silicon and software as its bigger sibling. That matters because it means buyers aren’t trading away capability for a cheaper entry point — they’re trading away headroom.
Supports local AI models up to 100 billion parameters
NVIDIA says the 64GB configuration supports local AI models up to 100 billion parameters, along with the agentic applications built on top of them, running fully on device. That’s a notable ceiling for a desk-side unit priced under $5,000, and it puts mid-to-large open models within reach of individual developers rather than just enterprise data centers.
Includes NVIDIA Grace Blackwell compute, ConnectX-7 networking, CUDA AI software stack, and DGX OS
According to Crypto Briefing, the device’s core is the GB10 Grace Blackwell Superchip, which combines a 20-core Arm CPU and a Blackwell GPU within a single package. Memory bandwidth holds at 273 GB/s — identical to the 128GB model. Networking runs on NVIDIA ConnectX-7, the same high-speed hardware NVIDIA says can link additional units into larger multi-node clusters. On top of that, NVIDIA layers its CUDA-accelerated AI software stack together with DGX OS, delivering developers a ready-to-use local AI platform covering agents, inference, fine-tuning, data science and edge development.
This matters for a simple reason: a local AI supercomputer is only as useful as the software that ships with it. NVIDIA is pairing the hardware with NVIDIA Agent Toolkit, CUDA-X AI libraries, Nemotron open models, and support for popular runtimes like Ollama, vLLM, and PyTorch with CUDA — all working out of the box, so developers can reportedly go from power-on to running models in minutes.
Cluster scalability and performance features
The real upgrade path for DGX Spark owners isn’t buying a bigger box later — it’s connecting a second one. That’s where NVIDIA Sync Cluster technology comes in, turning two modest desktop units into something closer to a shared-memory workstation.
Two DGX Spark units can cluster via Sync Cluster Assistant
Every DGX Spark ships with a built-in NVIDIA ConnectX-7 NIC. Two 64GB units can connect directly using a QSFP cable, and NVIDIA Sync Cluster Assistant configures the multi-node setup automatically — detecting connected units, validating device configuration, and setting up the ConnectX-7 network without manual intervention. Developers don’t need to reconfigure anything when scaling from one node to two; every node runs the same software stack.
Memory pools to 128GB with up to 1.7x performance improvement
Clustering two 64GB units doesn’t just double the available memory to 128GB — it also expands supported model size up to 200 billion parameters and doubles memory bandwidth. In NVIDIA’s internal Qwen 3.8 27B test, two clustered 64GB systems delivered up to 1.7x the performance of a single system, with room to keep scaling as workloads grow. Coming later this month, NVIDIA Sync Model Launcher is designed to make running models across a cluster as simple as a few clicks, automatically configuring models to run across connected devices and making them accessible from a user’s laptop.
Why does this matter for anyone outside NVIDIA’s own labs? Because clustering has traditionally been a headache reserved for enterprise IT teams. By automating network detection and configuration, NVIDIA is trying to make multi-node scaling something an individual developer can do over a weekend rather than a project that needs dedicated infrastructure staff.
Local AI development without cloud dependency
The pitch for DGX Spark isn’t just raw horsepower — it’s independence from the cloud. Running inference locally means no per-token billing, no latency round-trip to a remote data center, and no sending proprietary data outside the building.
Run private AI agents entirely on device
NVIDIA says the new 64GB SKU can run capable local agents entirely on device, privately, without cloud dependency. That capability extends to a growing list of agentic playbooks — including NemoClaw, OpenClaw, Hermes Agent and OpenShell — available through build.nvidia.com. Blender is also expected to support the platform soon with a prebuilt, downloadable installer, folding creative application workflows into the same local setup.
For developers weighing cloud subscriptions against owned hardware, this is the core trade-off DGX Spark is built around: a fixed upfront cost in exchange for AI model inference that happens entirely on a machine they control. NVIDIA plans to release an updated version of DGX OS later in October 2026, aimed specifically at simplifying cluster setup and inference deployment — a signal that ease of use, not just raw specs, is what NVIDIA is betting will sell the platform going forward.
NVIDIA is also expanding the local AI push beyond DGX hardware. This month, Acer, ASUS, Dell, HP, Lenovo, Microsoft and MSI are set to release new Windows PCs built around NVIDIA RTX Spark, bringing that same local-first approach to mainstream consumer laptops and desktops.
Article produced with the assistance of artificial intelligence and reviewed by the editorial team.
Key takeaways
NVIDIA DGX Spark’s 64GB configuration arrives October 23, 2026, starting at $4,999, through partners Acer, ASUS, Dell, Gigabyte, HP and MSI.
The system supports local AI models up to 100 billion parameters, running the full NVIDIA AI software stack directly on the device.
Two 64GB units can cluster through NVIDIA Sync Cluster Assistant, pooling memory to 128GB and delivering up to 1.7x the performance of a single system.
According to Crypto Briefing, the price of the 128GB DGX Spark model has jumped nearly 75% to $6,950, pushing the difference between the two configurations to roughly $2,000.
Developers can run private AI agents entirely on device, without depending on cloud infrastructure.
NVIDIA launches DGX Spark 64GB with major hardware partners
The headline here is accessibility. NVIDIA built the 64GB DGX Spark to sit below its 128GB flagship on price while keeping the same core engineering, giving smaller teams and individual developers an entry point into local AI supercomputing that didn’t exist before at this cost.
Supported by Acer, ASUS, Dell, Gigabyte, HP, and MSI
The 64GB configuration is launching exclusively through six manufacturer partners — Acer, ASUS, Dell, Gigabyte, HP and MSI — each shipping the unit with DGX OS and the full NVIDIA AI software stack pre-installed and ready to use. According to Crypto Briefing, Lenovo appears elsewhere in the broader DGX Spark ecosystem but was not named as a partner for this specific 64GB SKU.
Available starting October 23, 2026 for $4,999
Buyers can get the 64GB unit starting Friday, October 23, 2026, at $4,999. That price arrives at a moment when memory itself has become the scarce resource driving AI hardware costs. Crypto Briefing reports that the original 128GB DGX Spark now costs $6,950 at retail, reflecting a price hike of nearly 75% and stretching the gap between the two configurations to close to $2,000. In other words, the 64GB version isn’t just a smaller box — it’s NVIDIA’s answer to a market where memory supply is tightening and prices are climbing across the board.
Technical capabilities of DGX Spark 64GB
Despite the lower price, the 64GB DGX Spark keeps the same core silicon and software as its bigger sibling. That matters because it means buyers aren’t trading away capability for a cheaper entry point — they’re trading away headroom.
Supports local AI models up to 100 billion parameters
NVIDIA says the 64GB configuration supports local AI models up to 100 billion parameters, along with the agentic applications built on top of them, running fully on device. That’s a notable ceiling for a desk-side unit priced under $5,000, and it puts mid-to-large open models within reach of individual developers rather than just enterprise data centers.
Includes NVIDIA Grace Blackwell compute, ConnectX-7 networking, CUDA AI software stack, and DGX OS
According to Crypto Briefing, the device’s core is the GB10 Grace Blackwell Superchip, which combines a 20-core Arm CPU and a Blackwell GPU within a single package. Memory bandwidth holds at 273 GB/s — identical to the 128GB model. Networking runs on NVIDIA ConnectX-7, the same high-speed hardware NVIDIA says can link additional units into larger multi-node clusters. On top of that, NVIDIA layers its CUDA-accelerated AI software stack together with DGX OS, delivering developers a ready-to-use local AI platform covering agents, inference, fine-tuning, data science and edge development.
This matters for a simple reason: a local AI supercomputer is only as useful as the software that ships with it. NVIDIA is pairing the hardware with NVIDIA Agent Toolkit, CUDA-X AI libraries, Nemotron open models, and support for popular runtimes like Ollama, vLLM, and PyTorch with CUDA — all working out of the box, so developers can reportedly go from power-on to running models in minutes.
Cluster scalability and performance features
The real upgrade path for DGX Spark owners isn’t buying a bigger box later — it’s connecting a second one. That’s where NVIDIA Sync Cluster technology comes in, turning two modest desktop units into something closer to a shared-memory workstation.
Two DGX Spark units can cluster via Sync Cluster Assistant
Every DGX Spark ships with a built-in NVIDIA ConnectX-7 NIC. Two 64GB units can connect directly using a QSFP cable, and NVIDIA Sync Cluster Assistant configures the multi-node setup automatically — detecting connected units, validating device configuration, and setting up the ConnectX-7 network without manual intervention. Developers don’t need to reconfigure anything when scaling from one node to two; every node runs the same software stack.
Memory pools to 128GB with up to 1.7x performance improvement
Clustering two 64GB units doesn’t just double the available memory to 128GB — it also expands supported model size up to 200 billion parameters and doubles memory bandwidth. In NVIDIA’s internal Qwen 3.8 27B test, two clustered 64GB systems delivered up to 1.7x the performance of a single system, with room to keep scaling as workloads grow. Coming later this month, NVIDIA Sync Model Launcher is designed to make running models across a cluster as simple as a few clicks, automatically configuring models to run across connected devices and making them accessible from a user’s laptop.
Why does this matter for anyone outside NVIDIA’s own labs? Because clustering has traditionally been a headache reserved for enterprise IT teams. By automating network detection and configuration, NVIDIA is trying to make multi-node scaling something an individual developer can do over a weekend rather than a project that needs dedicated infrastructure staff.
Local AI development without cloud dependency
The pitch for DGX Spark isn’t just raw horsepower — it’s independence from the cloud. Running inference locally means no per-token billing, no latency round-trip to a remote data center, and no sending proprietary data outside the building.
Run private AI agents entirely on device
NVIDIA says the new 64GB SKU can run capable local agents entirely on device, privately, without cloud dependency. That capability extends to a growing list of agentic playbooks — including NemoClaw, OpenClaw, Hermes Agent and OpenShell — available through build.nvidia.com. Blender is also expected to support the platform soon with a prebuilt, downloadable installer, folding creative application workflows into the same local setup.
For developers weighing cloud subscriptions against owned hardware, this is the core trade-off DGX Spark is built around: a fixed upfront cost in exchange for AI model inference that happens entirely on a machine they control. NVIDIA plans to release an updated version of DGX OS later in October 2026, aimed specifically at simplifying cluster setup and inference deployment — a signal that ease of use, not just raw specs, is what NVIDIA is betting will sell the platform going forward.
NVIDIA is also expanding the local AI push beyond DGX hardware. This month, Acer, ASUS, Dell, HP, Lenovo, Microsoft and MSI are set to release new Windows PCs built around NVIDIA RTX Spark, bringing that same local-first approach to mainstream consumer laptops and desktops.
Article produced with the assistance of artificial intelligence and reviewed by the editorial team.
46

Article
See translation
Epic security vulnerabilities force a six-week freeze on MyChart updatesEpic, the company behind the widely used MyChart patient portal, has paused most of its product development work to fix a set of security vulnerabilities that could expose medical records to unauthorized access. The decision, confirmed by Epic founder and chief executive Judy Faulkner, marks an unusually drastic step for a company whose software underpins how hospitals and clinics across the United States manage patient data. The freeze on new development is expected to last around six weeks, according to remarks Faulkner made to Modern Healthcare, as engineers work through a list of Epic security vulnerabilities uncovered during a recent cybersecurity review.
Key takeaways
Epic has paused most product development to fix security flaws in its MyChart software, with the freeze expected to last about six weeks.
The vulnerabilities surfaced after Epic deployed Anthropic’s cybersecurity model Mythos, which flagged ways outsiders could access patient data.
Some customer configurations of MyChart could let intruders view patient records without leaving a trace in the software’s logs, according to Epic chief security officer Stirling Martin.
MyChart holds more than 320 million patient records across U.S. hospitals and doctors’ offices, though Epic says it does not directly access that medical data.
The pause comes amid a string of major healthcare data breaches in 2025 and 2026, including incidents at Change Healthcare, CareCloud, McKesson, Craneware and DentaQuest.
Epic pauses MyChart development to address security vulnerabilities
Epic is halting most of its product roadmap so its teams can concentrate on closing gaps in MyChart, the software millions of Americans use to view lab results, message doctors and manage prescriptions. Judy Faulkner told Modern Healthcare last month that the company needed time to “safeguard” its products after a security review turned up issues that had gone unnoticed.
Why the pause started now
The trigger was Epic’s own use of Anthropic‘s frontier cybersecurity model, known as Mythos. When Epic ran Mythos against its systems, the AI tool surfaced flaws that could potentially allow access to patients’ data. That discovery pushed Epic to shift resources away from new features and toward remediation, an unusual move for a company of its size and influence in the health IT market.
How long the freeze will last
Faulkner indicated the pause would likely run about six weeks while engineers work through the fixes. Epic has not laid out a detailed public timeline beyond that estimate, and the company has not disclosed the specific technical nature of the bugs being addressed.
Nature and scope of the security flaws in MyChart
The core risk is that certain customer setups of MyChart could let outsiders view patient records without triggering any alert in the system’s logs. That detail came from Epic’s chief security officer, Stirling Martin, who described the issue to The New York Times. Martin did not respond to TechCrunch’s request for comment.
Unanswered questions about detection and tampering
According to Martin’s account, the Mythos model did not determine whether the flaw could also be exploited to alter patient records without detection — only that unauthorized viewing was possible. Martin argued that even without confirmation of tampering, the exposure was serious enough to justify the company-wide remediation push.
Scale of the data at stake
The numbers underline why the stakes are high. MyChart is used to maintain more than 320 million patient records across hospitals and doctors’ offices nationwide, making it one of the most consequential pieces of software in American healthcare infrastructure. Epic has stated it does not itself have access to customers’ medical data — that responsibility sits with the hospitals and clinics that run MyChart. Still, a previously unknown bug inside the platform could, in theory, let hackers compromise multiple affected systems at once and pull data from all of them, regardless of who technically controls access.
Broader context of cybersecurity challenges in US healthcare
Epic’s decision to pause development does not happen in a vacuum. It lands inside a pattern of escalating healthcare cybersecurity risks that has defined the past two years of American medical data breaches. Hackers increasingly target health records because providers are often willing to pay to keep sensitive information from being published online.
The most severe recent example remains the 2024 ransomware attack on Change Healthcare, a health-tech subsidiary of UnitedHealth that processes payments and billing for most of the country. That breach let attackers steal health data belonging to more than 192 million people — the majority of the U.S. population — and the company reportedly paid the hackers twice in an effort to prevent the stolen data from being leaked.
A string of further incidents has emerged just this year: CareCloud suffered a breach exposing medical records, pharmaceutical distributor McKesson saw millions of rows of patient information taken, and Craneware — a health-tech company whose software serves clients throughout North America — had an unknown amount of data stolen. According to the Department of Health and Human Services, the breach suffered by dental insurer DentaQuest, which impacted 15 million individuals, currently ranks as the biggest healthcare-related data breach logged so far in 2026.
Set against that backdrop, Epic’s pause reads less like an isolated response and more like a signal of where the industry is heading. The same AI capability that exposed Epic’s security vulnerabilities — Anthropic’s Mythos model — is also the kind of tool that could make it faster for attackers to find similar weaknesses elsewhere. That dual-edged reality is why AI-driven vulnerability detection is becoming both a defensive asset and a new source of urgency for companies managing sensitive health records at scale.
Article produced with the assistance of artificial intelligence and reviewed by the editorial team.
Epic security vulnerabilities force a six-week freeze on MyChart updates
Epic, the company behind the widely used MyChart patient portal, has paused most of its product development work to fix a set of security vulnerabilities that could expose medical records to unauthorized access. The decision, confirmed by Epic founder and chief executive Judy Faulkner, marks an unusually drastic step for a company whose software underpins how hospitals and clinics across the United States manage patient data. The freeze on new development is expected to last around six weeks, according to remarks Faulkner made to Modern Healthcare, as engineers work through a list of Epic security vulnerabilities uncovered during a recent cybersecurity review.
Key takeaways
Epic has paused most product development to fix security flaws in its MyChart software, with the freeze expected to last about six weeks.
The vulnerabilities surfaced after Epic deployed Anthropic’s cybersecurity model Mythos, which flagged ways outsiders could access patient data.
Some customer configurations of MyChart could let intruders view patient records without leaving a trace in the software’s logs, according to Epic chief security officer Stirling Martin.
MyChart holds more than 320 million patient records across U.S. hospitals and doctors’ offices, though Epic says it does not directly access that medical data.
The pause comes amid a string of major healthcare data breaches in 2025 and 2026, including incidents at Change Healthcare, CareCloud, McKesson, Craneware and DentaQuest.
Epic pauses MyChart development to address security vulnerabilities
Epic is halting most of its product roadmap so its teams can concentrate on closing gaps in MyChart, the software millions of Americans use to view lab results, message doctors and manage prescriptions. Judy Faulkner told Modern Healthcare last month that the company needed time to “safeguard” its products after a security review turned up issues that had gone unnoticed.
Why the pause started now
The trigger was Epic’s own use of Anthropic‘s frontier cybersecurity model, known as Mythos. When Epic ran Mythos against its systems, the AI tool surfaced flaws that could potentially allow access to patients’ data. That discovery pushed Epic to shift resources away from new features and toward remediation, an unusual move for a company of its size and influence in the health IT market.
How long the freeze will last
Faulkner indicated the pause would likely run about six weeks while engineers work through the fixes. Epic has not laid out a detailed public timeline beyond that estimate, and the company has not disclosed the specific technical nature of the bugs being addressed.
Nature and scope of the security flaws in MyChart
The core risk is that certain customer setups of MyChart could let outsiders view patient records without triggering any alert in the system’s logs. That detail came from Epic’s chief security officer, Stirling Martin, who described the issue to The New York Times. Martin did not respond to TechCrunch’s request for comment.
Unanswered questions about detection and tampering
According to Martin’s account, the Mythos model did not determine whether the flaw could also be exploited to alter patient records without detection — only that unauthorized viewing was possible. Martin argued that even without confirmation of tampering, the exposure was serious enough to justify the company-wide remediation push.
Scale of the data at stake
The numbers underline why the stakes are high. MyChart is used to maintain more than 320 million patient records across hospitals and doctors’ offices nationwide, making it one of the most consequential pieces of software in American healthcare infrastructure. Epic has stated it does not itself have access to customers’ medical data — that responsibility sits with the hospitals and clinics that run MyChart. Still, a previously unknown bug inside the platform could, in theory, let hackers compromise multiple affected systems at once and pull data from all of them, regardless of who technically controls access.
Broader context of cybersecurity challenges in US healthcare
Epic’s decision to pause development does not happen in a vacuum. It lands inside a pattern of escalating healthcare cybersecurity risks that has defined the past two years of American medical data breaches. Hackers increasingly target health records because providers are often willing to pay to keep sensitive information from being published online.
The most severe recent example remains the 2024 ransomware attack on Change Healthcare, a health-tech subsidiary of UnitedHealth that processes payments and billing for most of the country. That breach let attackers steal health data belonging to more than 192 million people — the majority of the U.S. population — and the company reportedly paid the hackers twice in an effort to prevent the stolen data from being leaked.
A string of further incidents has emerged just this year: CareCloud suffered a breach exposing medical records, pharmaceutical distributor McKesson saw millions of rows of patient information taken, and Craneware — a health-tech company whose software serves clients throughout North America — had an unknown amount of data stolen. According to the Department of Health and Human Services, the breach suffered by dental insurer DentaQuest, which impacted 15 million individuals, currently ranks as the biggest healthcare-related data breach logged so far in 2026.
Set against that backdrop, Epic’s pause reads less like an isolated response and more like a signal of where the industry is heading. The same AI capability that exposed Epic’s security vulnerabilities — Anthropic’s Mythos model — is also the kind of tool that could make it faster for attackers to find similar weaknesses elsewhere. That dual-edged reality is why AI-driven vulnerability detection is becoming both a defensive asset and a new source of urgency for companies managing sensitive health records at scale.
Article produced with the assistance of artificial intelligence and reviewed by the editorial team.
Key takeaways
Epic has paused most product development to fix security flaws in its MyChart software, with the freeze expected to last about six weeks.
The vulnerabilities surfaced after Epic deployed Anthropic’s cybersecurity model Mythos, which flagged ways outsiders could access patient data.
Some customer configurations of MyChart could let intruders view patient records without leaving a trace in the software’s logs, according to Epic chief security officer Stirling Martin.
MyChart holds more than 320 million patient records across U.S. hospitals and doctors’ offices, though Epic says it does not directly access that medical data.
The pause comes amid a string of major healthcare data breaches in 2025 and 2026, including incidents at Change Healthcare, CareCloud, McKesson, Craneware and DentaQuest.
Epic pauses MyChart development to address security vulnerabilities
Epic is halting most of its product roadmap so its teams can concentrate on closing gaps in MyChart, the software millions of Americans use to view lab results, message doctors and manage prescriptions. Judy Faulkner told Modern Healthcare last month that the company needed time to “safeguard” its products after a security review turned up issues that had gone unnoticed.
Why the pause started now
The trigger was Epic’s own use of Anthropic‘s frontier cybersecurity model, known as Mythos. When Epic ran Mythos against its systems, the AI tool surfaced flaws that could potentially allow access to patients’ data. That discovery pushed Epic to shift resources away from new features and toward remediation, an unusual move for a company of its size and influence in the health IT market.
How long the freeze will last
Faulkner indicated the pause would likely run about six weeks while engineers work through the fixes. Epic has not laid out a detailed public timeline beyond that estimate, and the company has not disclosed the specific technical nature of the bugs being addressed.
Nature and scope of the security flaws in MyChart
The core risk is that certain customer setups of MyChart could let outsiders view patient records without triggering any alert in the system’s logs. That detail came from Epic’s chief security officer, Stirling Martin, who described the issue to The New York Times. Martin did not respond to TechCrunch’s request for comment.
Unanswered questions about detection and tampering
According to Martin’s account, the Mythos model did not determine whether the flaw could also be exploited to alter patient records without detection — only that unauthorized viewing was possible. Martin argued that even without confirmation of tampering, the exposure was serious enough to justify the company-wide remediation push.
Scale of the data at stake
The numbers underline why the stakes are high. MyChart is used to maintain more than 320 million patient records across hospitals and doctors’ offices nationwide, making it one of the most consequential pieces of software in American healthcare infrastructure. Epic has stated it does not itself have access to customers’ medical data — that responsibility sits with the hospitals and clinics that run MyChart. Still, a previously unknown bug inside the platform could, in theory, let hackers compromise multiple affected systems at once and pull data from all of them, regardless of who technically controls access.
Broader context of cybersecurity challenges in US healthcare
Epic’s decision to pause development does not happen in a vacuum. It lands inside a pattern of escalating healthcare cybersecurity risks that has defined the past two years of American medical data breaches. Hackers increasingly target health records because providers are often willing to pay to keep sensitive information from being published online.
The most severe recent example remains the 2024 ransomware attack on Change Healthcare, a health-tech subsidiary of UnitedHealth that processes payments and billing for most of the country. That breach let attackers steal health data belonging to more than 192 million people — the majority of the U.S. population — and the company reportedly paid the hackers twice in an effort to prevent the stolen data from being leaked.
A string of further incidents has emerged just this year: CareCloud suffered a breach exposing medical records, pharmaceutical distributor McKesson saw millions of rows of patient information taken, and Craneware — a health-tech company whose software serves clients throughout North America — had an unknown amount of data stolen. According to the Department of Health and Human Services, the breach suffered by dental insurer DentaQuest, which impacted 15 million individuals, currently ranks as the biggest healthcare-related data breach logged so far in 2026.
Set against that backdrop, Epic’s pause reads less like an isolated response and more like a signal of where the industry is heading. The same AI capability that exposed Epic’s security vulnerabilities — Anthropic’s Mythos model — is also the kind of tool that could make it faster for attackers to find similar weaknesses elsewhere. That dual-edged reality is why AI-driven vulnerability detection is becoming both a defensive asset and a new source of urgency for companies managing sensitive health records at scale.
Article produced with the assistance of artificial intelligence and reviewed by the editorial team.
12

Article
See translation
CFTC’s Brexit no-action extension keeps UK-US derivatives trading intactThe Commodity Futures Trading Commission has extended a set of temporary no-action positions tied to the United Kingdom’s withdrawal from the European Union, keeping cross-border derivatives markets running smoothly nearly a decade after Brexit first raised questions about transatlantic trading rules. The CFTC Brexit no-action extension, announced October 01, 2026, in CFTC Staff Letter No. 26-28, gives market participants continued assurance that derivatives trading and clearing between the UK and the US won’t be disrupted while regulators on both sides keep working through the legal details.
Key takeaways
The CFTC’s Market Participants Division and Division of Market Oversight extended temporary no-action positions connected to Brexit on October 01, 2026, through CFTC Staff Letter No. 26-28.
The positions protect the continuity of derivatives trading and clearing between the UK and the United States.
They build on a joint statement issued February 25, 2019, with the Bank of England, the Prudential Regulation Authority, and the Financial Conduct Authority, under CFTC Press Release No. 7876-19.
The extension amends prior letters, specifically No. 24-11 and No. 26-10, and preserves regulatory certainty tied to existing EU comparability determinations and exemptive orders.
The CFTC is still working with UK authorities to analyze UK law and, where appropriate, issue UK-specific comparability determinations and exemptive orders.
CFTC Extends Brexit-Related No-Action Positions
The core of the announcement is straightforward: the CFTC isn’t changing course on Brexit; it’s buying more time. By extending these no-action positions, the agency is signaling that the post-Brexit framework for UK-US derivatives activity remains intact for now, even though the formal legal groundwork hasn’t been finished.
Scope of the extension for derivatives trading and clearing
The no-action positions specifically cover the continuity of derivatives trading and clearing activities that flow between the UK and the United States. In practice, that means firms on both sides of the Atlantic can keep operating under familiar rules without worrying that a sudden regulatory gap will force them to pause business or restructure contracts on short notice.
Official announcement and document references
The extension itself was formalized in CFTC Staff Letter No. 26-28, issued by the agency’s Market Participants Division and Division of Market Oversight. That letter doesn’t stand alone — it modifies and extends positions that were already on the books, giving the market a documented paper trail stretching back years rather than a one-off decision made in isolation.
Regulatory Background and Context
None of this is happening in a vacuum. The CFTC’s approach to Brexit has been consistent since the earliest days of the UK’s departure from the EU, when financial regulators scrambled to prevent a legal cliff edge from disrupting global derivatives markets.
Initial Brexit no-action positions issued with UK authorities in 2019
On February 25, 2019, a joint statement was issued by the CFTC together with the Bank of England — which includes the Prudential Regulation Authority — and the Financial Conduct Authority. That original move, detailed in CFTC Press Release No. 7876-19, was designed to provide regulatory certainty at a moment when Brexit’s final shape was still very much up in the air. The collaboration between US and UK regulators at that stage set the tone for how the issue would be handled going forward: carefully, incrementally, and with an eye toward avoiding market shocks.
Relation to EU comparability determinations and exemptive orders
The purpose of this latest extension is specifically to maintain the regulatory certainty established by the CFTC’s original decision to grant EU comparability determinations and exemptive orders for certain EU entities. Those determinations essentially told the market that EU rules were close enough to US rules that firms didn’t need to duplicate compliance work. Extending the Brexit-related no-action positions keeps that same logic running for UK entities even though the UK is no longer part of the EU framework.
Ongoing Regulatory Coordination with UK Authorities
Why does this matter now? Because the underlying legal work — matching UK rules against US requirements — still isn’t finished, and until it is, the no-action positions are effectively the glue holding the arrangement together.
Analysis of UK law for comparability determinations
The letter makes clear that the CFTC is actively working with relevant UK authorities to analyze UK law. The goal is to eventually issue UK-specific comparability determinations and exemptive orders for UK entities, mirroring what already exists for EU entities.
Rationale for maintaining no-action positions during consultations
Until that legal analysis wraps up, the Market Participants Division and Division of Market Oversight continue to believe maintaining the no-action positions is the proper approach. In other words, rather than letting uncertainty creep into the market while consultations drag on, the CFTC is choosing continuity. For firms trading derivatives across the UK-US corridor, that translates into one less variable to worry about, even as the broader question of formal UK comparability determinations remains unresolved.
This pattern — extend now, finalize later — has effectively become the default posture for US-UK derivatives regulation since Brexit took effect. Each extension buys another window for technical work to catch up with legal reality, and the recurring need for these extensions underscores just how complex it is to fully untangle two previously intertwined regulatory systems.
Article produced with the assistance of artificial intelligence and reviewed by the editorial team.
CFTC’s Brexit no-action extension keeps UK-US derivatives trading intact
The Commodity Futures Trading Commission has extended a set of temporary no-action positions tied to the United Kingdom’s withdrawal from the European Union, keeping cross-border derivatives markets running smoothly nearly a decade after Brexit first raised questions about transatlantic trading rules. The CFTC Brexit no-action extension, announced October 01, 2026, in CFTC Staff Letter No. 26-28, gives market participants continued assurance that derivatives trading and clearing between the UK and the US won’t be disrupted while regulators on both sides keep working through the legal details.
Key takeaways
The CFTC’s Market Participants Division and Division of Market Oversight extended temporary no-action positions connected to Brexit on October 01, 2026, through CFTC Staff Letter No. 26-28.
The positions protect the continuity of derivatives trading and clearing between the UK and the United States.
They build on a joint statement issued February 25, 2019, with the Bank of England, the Prudential Regulation Authority, and the Financial Conduct Authority, under CFTC Press Release No. 7876-19.
The extension amends prior letters, specifically No. 24-11 and No. 26-10, and preserves regulatory certainty tied to existing EU comparability determinations and exemptive orders.
The CFTC is still working with UK authorities to analyze UK law and, where appropriate, issue UK-specific comparability determinations and exemptive orders.
CFTC Extends Brexit-Related No-Action Positions
The core of the announcement is straightforward: the CFTC isn’t changing course on Brexit; it’s buying more time. By extending these no-action positions, the agency is signaling that the post-Brexit framework for UK-US derivatives activity remains intact for now, even though the formal legal groundwork hasn’t been finished.
Scope of the extension for derivatives trading and clearing
The no-action positions specifically cover the continuity of derivatives trading and clearing activities that flow between the UK and the United States. In practice, that means firms on both sides of the Atlantic can keep operating under familiar rules without worrying that a sudden regulatory gap will force them to pause business or restructure contracts on short notice.
Official announcement and document references
The extension itself was formalized in CFTC Staff Letter No. 26-28, issued by the agency’s Market Participants Division and Division of Market Oversight. That letter doesn’t stand alone — it modifies and extends positions that were already on the books, giving the market a documented paper trail stretching back years rather than a one-off decision made in isolation.
Regulatory Background and Context
None of this is happening in a vacuum. The CFTC’s approach to Brexit has been consistent since the earliest days of the UK’s departure from the EU, when financial regulators scrambled to prevent a legal cliff edge from disrupting global derivatives markets.
Initial Brexit no-action positions issued with UK authorities in 2019
On February 25, 2019, a joint statement was issued by the CFTC together with the Bank of England — which includes the Prudential Regulation Authority — and the Financial Conduct Authority. That original move, detailed in CFTC Press Release No. 7876-19, was designed to provide regulatory certainty at a moment when Brexit’s final shape was still very much up in the air. The collaboration between US and UK regulators at that stage set the tone for how the issue would be handled going forward: carefully, incrementally, and with an eye toward avoiding market shocks.
Relation to EU comparability determinations and exemptive orders
The purpose of this latest extension is specifically to maintain the regulatory certainty established by the CFTC’s original decision to grant EU comparability determinations and exemptive orders for certain EU entities. Those determinations essentially told the market that EU rules were close enough to US rules that firms didn’t need to duplicate compliance work. Extending the Brexit-related no-action positions keeps that same logic running for UK entities even though the UK is no longer part of the EU framework.
Ongoing Regulatory Coordination with UK Authorities
Why does this matter now? Because the underlying legal work — matching UK rules against US requirements — still isn’t finished, and until it is, the no-action positions are effectively the glue holding the arrangement together.
Analysis of UK law for comparability determinations
The letter makes clear that the CFTC is actively working with relevant UK authorities to analyze UK law. The goal is to eventually issue UK-specific comparability determinations and exemptive orders for UK entities, mirroring what already exists for EU entities.
Rationale for maintaining no-action positions during consultations
Until that legal analysis wraps up, the Market Participants Division and Division of Market Oversight continue to believe maintaining the no-action positions is the proper approach. In other words, rather than letting uncertainty creep into the market while consultations drag on, the CFTC is choosing continuity. For firms trading derivatives across the UK-US corridor, that translates into one less variable to worry about, even as the broader question of formal UK comparability determinations remains unresolved.
This pattern — extend now, finalize later — has effectively become the default posture for US-UK derivatives regulation since Brexit took effect. Each extension buys another window for technical work to catch up with legal reality, and the recurring need for these extensions underscores just how complex it is to fully untangle two previously intertwined regulatory systems.
Article produced with the assistance of artificial intelligence and reviewed by the editorial team.
Key takeaways
The CFTC’s Market Participants Division and Division of Market Oversight extended temporary no-action positions connected to Brexit on October 01, 2026, through CFTC Staff Letter No. 26-28.
The positions protect the continuity of derivatives trading and clearing between the UK and the United States.
They build on a joint statement issued February 25, 2019, with the Bank of England, the Prudential Regulation Authority, and the Financial Conduct Authority, under CFTC Press Release No. 7876-19.
The extension amends prior letters, specifically No. 24-11 and No. 26-10, and preserves regulatory certainty tied to existing EU comparability determinations and exemptive orders.
The CFTC is still working with UK authorities to analyze UK law and, where appropriate, issue UK-specific comparability determinations and exemptive orders.
CFTC Extends Brexit-Related No-Action Positions
The core of the announcement is straightforward: the CFTC isn’t changing course on Brexit; it’s buying more time. By extending these no-action positions, the agency is signaling that the post-Brexit framework for UK-US derivatives activity remains intact for now, even though the formal legal groundwork hasn’t been finished.
Scope of the extension for derivatives trading and clearing
The no-action positions specifically cover the continuity of derivatives trading and clearing activities that flow between the UK and the United States. In practice, that means firms on both sides of the Atlantic can keep operating under familiar rules without worrying that a sudden regulatory gap will force them to pause business or restructure contracts on short notice.
Official announcement and document references
The extension itself was formalized in CFTC Staff Letter No. 26-28, issued by the agency’s Market Participants Division and Division of Market Oversight. That letter doesn’t stand alone — it modifies and extends positions that were already on the books, giving the market a documented paper trail stretching back years rather than a one-off decision made in isolation.
Regulatory Background and Context
None of this is happening in a vacuum. The CFTC’s approach to Brexit has been consistent since the earliest days of the UK’s departure from the EU, when financial regulators scrambled to prevent a legal cliff edge from disrupting global derivatives markets.
Initial Brexit no-action positions issued with UK authorities in 2019
On February 25, 2019, a joint statement was issued by the CFTC together with the Bank of England — which includes the Prudential Regulation Authority — and the Financial Conduct Authority. That original move, detailed in CFTC Press Release No. 7876-19, was designed to provide regulatory certainty at a moment when Brexit’s final shape was still very much up in the air. The collaboration between US and UK regulators at that stage set the tone for how the issue would be handled going forward: carefully, incrementally, and with an eye toward avoiding market shocks.
Relation to EU comparability determinations and exemptive orders
The purpose of this latest extension is specifically to maintain the regulatory certainty established by the CFTC’s original decision to grant EU comparability determinations and exemptive orders for certain EU entities. Those determinations essentially told the market that EU rules were close enough to US rules that firms didn’t need to duplicate compliance work. Extending the Brexit-related no-action positions keeps that same logic running for UK entities even though the UK is no longer part of the EU framework.
Ongoing Regulatory Coordination with UK Authorities
Why does this matter now? Because the underlying legal work — matching UK rules against US requirements — still isn’t finished, and until it is, the no-action positions are effectively the glue holding the arrangement together.
Analysis of UK law for comparability determinations
The letter makes clear that the CFTC is actively working with relevant UK authorities to analyze UK law. The goal is to eventually issue UK-specific comparability determinations and exemptive orders for UK entities, mirroring what already exists for EU entities.
Rationale for maintaining no-action positions during consultations
Until that legal analysis wraps up, the Market Participants Division and Division of Market Oversight continue to believe maintaining the no-action positions is the proper approach. In other words, rather than letting uncertainty creep into the market while consultations drag on, the CFTC is choosing continuity. For firms trading derivatives across the UK-US corridor, that translates into one less variable to worry about, even as the broader question of formal UK comparability determinations remains unresolved.
This pattern — extend now, finalize later — has effectively become the default posture for US-UK derivatives regulation since Brexit took effect. Each extension buys another window for technical work to catch up with legal reality, and the recurring need for these extensions underscores just how complex it is to fully untangle two previously intertwined regulatory systems.
Article produced with the assistance of artificial intelligence and reviewed by the editorial team.
11
Article
See translation
Weak U.S. September jobs report pushes Bitcoin close to $87,000The U.S. labor market delivered a much weaker signal than Wall Street expected on Friday, as the U.S. September jobs report showed employers added just 29,000 positions last month, a sharp miss against the 90,000 consensus forecast. The unemployment rate, which most economists expected to hold steady, instead climbed to 4.2%, adding a fresh layer of uncertainty to an already choppy hiring picture heading into the final quarter of the year.
Key takeaways
The U.S. added only 29,000 jobs in September, well below the 90,000 jobs economists had forecast.
The unemployment rate rose unexpectedly to 4.2%, up from August’s 4.1% reading.
August’s reported gain of 162,000 jobs was revised down to 133,000, and July’s 21,000 gain was revised into a loss of 10,000.
Average hourly earnings rose just 0.1% in September, missing the 0.3% forecast, with annual wage growth at 3% versus the 3.2% expected.
Bitcoin, Nasdaq futures and Treasury yields all moved sharply following the release, as traders recalculated the odds of the Federal Reserve holding interest rates steady.
U.S. Labor Market Shows Weak Job Growth in September
The Bureau of Labor Statistics‘ Nonfarm Payrolls report, released Friday morning, confirmed that hiring slowed far more than anticipated last month. The headline number of 29,000 new jobs landed well short of the 90,000 consensus, marking one of the softer monthly readings of the year and reinforcing concerns that momentum in the labor market has been fading since the summer.
Job additions fall short of expectations
Economists had been looking for a more modest slowdown rather than a near-stall in hiring. Instead, the 29,000 jobs added in September came in at roughly a third of what forecasters had penciled in, a gap large enough to shift the broader narrative around the strength of the U.S. economy heading into the fourth quarter.
Revisions to prior months reveal weaker trends
The report also included downward revisions that painted an even softer picture of recent months. August’s originally reported gain of 162,000 jobs was revised down to 133,000, while July’s initially reported increase of 21,000 jobs was revised into an outright loss of 10,000. Taken together, the revisions suggest the labor market had already begun losing steam before September’s disappointing print, a trend that is not captured in any single month’s headline number.
This matters because revisions of this size can change how policymakers read the trajectory of hiring. A single weak month might be dismissed as noise, but two consecutive downward revisions alongside a soft September reading point to a more consistent cooling trend rather than a one-off blip.
Unemployment Rate Rises Unexpectedly
The unemployment rate climbed to 4.2% in September, surprising economists who had expected it to hold at 4.1%, the same level recorded in August. A rising jobless rate paired with weak payroll growth is typically read as a sign that the labor market is losing some of the resilience it showed earlier in the year.
The move is modest in absolute terms, but it breaks from a pattern in which the unemployment rate had stayed roughly steady even as monthly payroll growth fluctuated. For a labor market that Fed officials have repeatedly described as stable, an unexpected uptick in joblessness adds a new variable to the policy conversation.
Wage Growth Misses Forecasts in September
Wage growth also came in softer than expected. Average hourly earnings rose just 0.1% in September, falling short of the 0.3% forecast and well below August’s 0.3% increase. On an annual basis, average hourly earnings grew 3%, missing the 3.2% consensus and slowing from August’s 3.1% pace.
Slower wage growth, combined with weaker hiring, reduces one of the pressure points the Federal Reserve has been watching closely. Fed officials have repeatedly noted that current wage trends show no evidence of a wage-price spiral, and a cooler reading on hourly earnings reinforces that view rather than complicating it.
Market Reactions and Implications for Federal Reserve Policy
Financial markets moved quickly once the numbers hit the tape, with the weak jobs data reading as a signal that the Federal Reserve may have more room to keep interest rates unchanged even with inflation still running above target.
Financial market responses to the jobs report
Bitcoin, already trending upward during the session, pushed further and came close to $87,000, climbing nearly 2% on the day to roughly $86,600 shortly after the release, while U.S. stock index futures extended their advance as well, with Nasdaq futures up about 1.2%.
Bond markets saw an even sharper reaction. Yields on the 10-year Treasury dropped 7 basis points to reach 5.17%, while the 2-year yield declined by a comparable amount to 4.71%, as Gold climbed over 1% and the dollar lost ground against major currencies—a pattern that usually signals markets are factoring in a more accommodative rate outlook.
Potential Federal Reserve policy impact
The soft report arrives just weeks after the Fed delivered a quarter-point rate hike in September. New York Fed President John Williams said earlier in the week that “there is no need for urgency” in deciding whether to follow up with another increase, adding that “the data show that the labor market continues to be solid — and has even strengthened a bit on the margin.” Fed Vice Chairman Philip Jefferson echoed that tone in a separate speech, noting that “a broad range of data indicates that conditions have stabilized” and that “layoffs have remained low, and job openings have moved a bit higher on net.”
Those remarks had already pushed markets to reduce the odds of a hike at the Fed’s upcoming Oct. 27-28 meeting, with a move seen as more likely in December. Friday’s weaker-than-expected jobs numbers give that cautious stance additional weight: a softening labor market, paired with cooler wage growth, provides the Fed more room to hold rates steady rather than tighten further, even as inflation remains elevated.
Article produced with the assistance of artificial intelligence and reviewed by the editorial team.
Weak U.S. September jobs report pushes Bitcoin close to $87,000
The U.S. labor market delivered a much weaker signal than Wall Street expected on Friday, as the U.S. September jobs report showed employers added just 29,000 positions last month, a sharp miss against the 90,000 consensus forecast. The unemployment rate, which most economists expected to hold steady, instead climbed to 4.2%, adding a fresh layer of uncertainty to an already choppy hiring picture heading into the final quarter of the year.
Key takeaways
The U.S. added only 29,000 jobs in September, well below the 90,000 jobs economists had forecast.
The unemployment rate rose unexpectedly to 4.2%, up from August’s 4.1% reading.
August’s reported gain of 162,000 jobs was revised down to 133,000, and July’s 21,000 gain was revised into a loss of 10,000.
Average hourly earnings rose just 0.1% in September, missing the 0.3% forecast, with annual wage growth at 3% versus the 3.2% expected.
Bitcoin, Nasdaq futures and Treasury yields all moved sharply following the release, as traders recalculated the odds of the Federal Reserve holding interest rates steady.
U.S. Labor Market Shows Weak Job Growth in September
The Bureau of Labor Statistics‘ Nonfarm Payrolls report, released Friday morning, confirmed that hiring slowed far more than anticipated last month. The headline number of 29,000 new jobs landed well short of the 90,000 consensus, marking one of the softer monthly readings of the year and reinforcing concerns that momentum in the labor market has been fading since the summer.
Job additions fall short of expectations
Economists had been looking for a more modest slowdown rather than a near-stall in hiring. Instead, the 29,000 jobs added in September came in at roughly a third of what forecasters had penciled in, a gap large enough to shift the broader narrative around the strength of the U.S. economy heading into the fourth quarter.
Revisions to prior months reveal weaker trends
The report also included downward revisions that painted an even softer picture of recent months. August’s originally reported gain of 162,000 jobs was revised down to 133,000, while July’s initially reported increase of 21,000 jobs was revised into an outright loss of 10,000. Taken together, the revisions suggest the labor market had already begun losing steam before September’s disappointing print, a trend that is not captured in any single month’s headline number.
This matters because revisions of this size can change how policymakers read the trajectory of hiring. A single weak month might be dismissed as noise, but two consecutive downward revisions alongside a soft September reading point to a more consistent cooling trend rather than a one-off blip.
Unemployment Rate Rises Unexpectedly
The unemployment rate climbed to 4.2% in September, surprising economists who had expected it to hold at 4.1%, the same level recorded in August. A rising jobless rate paired with weak payroll growth is typically read as a sign that the labor market is losing some of the resilience it showed earlier in the year.
The move is modest in absolute terms, but it breaks from a pattern in which the unemployment rate had stayed roughly steady even as monthly payroll growth fluctuated. For a labor market that Fed officials have repeatedly described as stable, an unexpected uptick in joblessness adds a new variable to the policy conversation.
Wage Growth Misses Forecasts in September
Wage growth also came in softer than expected. Average hourly earnings rose just 0.1% in September, falling short of the 0.3% forecast and well below August’s 0.3% increase. On an annual basis, average hourly earnings grew 3%, missing the 3.2% consensus and slowing from August’s 3.1% pace.
Slower wage growth, combined with weaker hiring, reduces one of the pressure points the Federal Reserve has been watching closely. Fed officials have repeatedly noted that current wage trends show no evidence of a wage-price spiral, and a cooler reading on hourly earnings reinforces that view rather than complicating it.
Market Reactions and Implications for Federal Reserve Policy
Financial markets moved quickly once the numbers hit the tape, with the weak jobs data reading as a signal that the Federal Reserve may have more room to keep interest rates unchanged even with inflation still running above target.
Financial market responses to the jobs report
Bitcoin, already trending upward during the session, pushed further and came close to $87,000, climbing nearly 2% on the day to roughly $86,600 shortly after the release, while U.S. stock index futures extended their advance as well, with Nasdaq futures up about 1.2%.
Bond markets saw an even sharper reaction. Yields on the 10-year Treasury dropped 7 basis points to reach 5.17%, while the 2-year yield declined by a comparable amount to 4.71%, as Gold climbed over 1% and the dollar lost ground against major currencies—a pattern that usually signals markets are factoring in a more accommodative rate outlook.
Potential Federal Reserve policy impact
The soft report arrives just weeks after the Fed delivered a quarter-point rate hike in September. New York Fed President John Williams said earlier in the week that “there is no need for urgency” in deciding whether to follow up with another increase, adding that “the data show that the labor market continues to be solid — and has even strengthened a bit on the margin.” Fed Vice Chairman Philip Jefferson echoed that tone in a separate speech, noting that “a broad range of data indicates that conditions have stabilized” and that “layoffs have remained low, and job openings have moved a bit higher on net.”
Those remarks had already pushed markets to reduce the odds of a hike at the Fed’s upcoming Oct. 27-28 meeting, with a move seen as more likely in December. Friday’s weaker-than-expected jobs numbers give that cautious stance additional weight: a softening labor market, paired with cooler wage growth, provides the Fed more room to hold rates steady rather than tighten further, even as inflation remains elevated.
Article produced with the assistance of artificial intelligence and reviewed by the editorial team.
Key takeaways
The U.S. added only 29,000 jobs in September, well below the 90,000 jobs economists had forecast.
The unemployment rate rose unexpectedly to 4.2%, up from August’s 4.1% reading.
August’s reported gain of 162,000 jobs was revised down to 133,000, and July’s 21,000 gain was revised into a loss of 10,000.
Average hourly earnings rose just 0.1% in September, missing the 0.3% forecast, with annual wage growth at 3% versus the 3.2% expected.
Bitcoin, Nasdaq futures and Treasury yields all moved sharply following the release, as traders recalculated the odds of the Federal Reserve holding interest rates steady.
U.S. Labor Market Shows Weak Job Growth in September
The Bureau of Labor Statistics‘ Nonfarm Payrolls report, released Friday morning, confirmed that hiring slowed far more than anticipated last month. The headline number of 29,000 new jobs landed well short of the 90,000 consensus, marking one of the softer monthly readings of the year and reinforcing concerns that momentum in the labor market has been fading since the summer.
Job additions fall short of expectations
Economists had been looking for a more modest slowdown rather than a near-stall in hiring. Instead, the 29,000 jobs added in September came in at roughly a third of what forecasters had penciled in, a gap large enough to shift the broader narrative around the strength of the U.S. economy heading into the fourth quarter.
Revisions to prior months reveal weaker trends
The report also included downward revisions that painted an even softer picture of recent months. August’s originally reported gain of 162,000 jobs was revised down to 133,000, while July’s initially reported increase of 21,000 jobs was revised into an outright loss of 10,000. Taken together, the revisions suggest the labor market had already begun losing steam before September’s disappointing print, a trend that is not captured in any single month’s headline number.
This matters because revisions of this size can change how policymakers read the trajectory of hiring. A single weak month might be dismissed as noise, but two consecutive downward revisions alongside a soft September reading point to a more consistent cooling trend rather than a one-off blip.
Unemployment Rate Rises Unexpectedly
The unemployment rate climbed to 4.2% in September, surprising economists who had expected it to hold at 4.1%, the same level recorded in August. A rising jobless rate paired with weak payroll growth is typically read as a sign that the labor market is losing some of the resilience it showed earlier in the year.
The move is modest in absolute terms, but it breaks from a pattern in which the unemployment rate had stayed roughly steady even as monthly payroll growth fluctuated. For a labor market that Fed officials have repeatedly described as stable, an unexpected uptick in joblessness adds a new variable to the policy conversation.
Wage Growth Misses Forecasts in September
Wage growth also came in softer than expected. Average hourly earnings rose just 0.1% in September, falling short of the 0.3% forecast and well below August’s 0.3% increase. On an annual basis, average hourly earnings grew 3%, missing the 3.2% consensus and slowing from August’s 3.1% pace.
Slower wage growth, combined with weaker hiring, reduces one of the pressure points the Federal Reserve has been watching closely. Fed officials have repeatedly noted that current wage trends show no evidence of a wage-price spiral, and a cooler reading on hourly earnings reinforces that view rather than complicating it.
Market Reactions and Implications for Federal Reserve Policy
Financial markets moved quickly once the numbers hit the tape, with the weak jobs data reading as a signal that the Federal Reserve may have more room to keep interest rates unchanged even with inflation still running above target.
Financial market responses to the jobs report
Bitcoin, already trending upward during the session, pushed further and came close to $87,000, climbing nearly 2% on the day to roughly $86,600 shortly after the release, while U.S. stock index futures extended their advance as well, with Nasdaq futures up about 1.2%.
Bond markets saw an even sharper reaction. Yields on the 10-year Treasury dropped 7 basis points to reach 5.17%, while the 2-year yield declined by a comparable amount to 4.71%, as Gold climbed over 1% and the dollar lost ground against major currencies—a pattern that usually signals markets are factoring in a more accommodative rate outlook.
Potential Federal Reserve policy impact
The soft report arrives just weeks after the Fed delivered a quarter-point rate hike in September. New York Fed President John Williams said earlier in the week that “there is no need for urgency” in deciding whether to follow up with another increase, adding that “the data show that the labor market continues to be solid — and has even strengthened a bit on the margin.” Fed Vice Chairman Philip Jefferson echoed that tone in a separate speech, noting that “a broad range of data indicates that conditions have stabilized” and that “layoffs have remained low, and job openings have moved a bit higher on net.”
Those remarks had already pushed markets to reduce the odds of a hike at the Fed’s upcoming Oct. 27-28 meeting, with a move seen as more likely in December. Friday’s weaker-than-expected jobs numbers give that cautious stance additional weight: a softening labor market, paired with cooler wage growth, provides the Fed more room to hold rates steady rather than tighten further, even as inflation remains elevated.
Article produced with the assistance of artificial intelligence and reviewed by the editorial team.
76
Log in to explore more content
Join global crypto users on Binance Square
⚡️ Get latest and useful information about crypto.
💬 Trusted by the world’s largest crypto exchange.
👍 Discover real insights from verified creators.
Email / Phone number