
thesolidoke
190 Posts

thesolidoke
Report
Block User
Real tests of crypto trading bots. Real money, real fees, wins AND losses. No hype, no signals. #TradingBots #AlgoTrading #BTC | NFA
62 Following
26 Followers
62 Liked
Posts
·
--
See translation
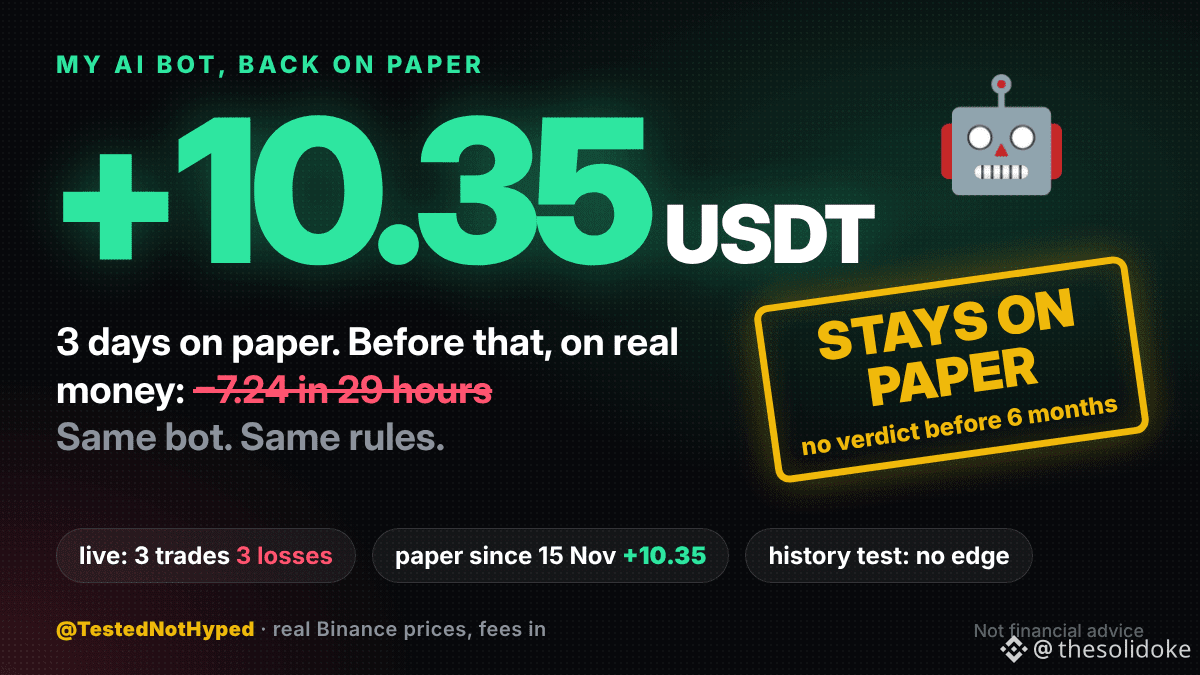
My AI bot lost 7.24 USDT in 29 hours on real money. Since I moved it back to paper 3 days ago, it's +10.35.
It's APOGEE: it trades on forecasts from Kronos, an AI model trained on price candles. On 15 Nov I took it off real money after 3 trades, 3 losses.
Back on paper, same rules, real Binance prices, fees included: +10.35 USDT since 15 Nov. It's short BREV right now.
The obvious move: switch it back to real money. I'm not going to.
• 3 losing live trades told me nothing
• 3 good paper days tell me nothing either
• my earlier history test of the same model: no edge on either side
So it stays on paper. The rule is no verdict before 6 months, in either direction.
Would you switch a bot back to real money after 3 good days? 👇
Not financial advice. Paper results, real Binance prices.
#TradingBots #AI #algoTrading #bitcoin $BTC
My AI bot lost 7.24 USDT in 29 hours on real money. Since I moved it back to paper 3 days ago, it's +10.35.
It's APOGEE: it trades on forecasts from Kronos, an AI model trained on price candles. On 15 Nov I took it off real money after 3 trades, 3 losses.
Back on paper, same rules, real Binance prices, fees included: +10.35 USDT since 15 Nov. It's short BREV right now.
The obvious move: switch it back to real money. I'm not going to.
• 3 losing live trades told me nothing
• 3 good paper days tell me nothing either
• my earlier history test of the same model: no edge on either side
So it stays on paper. The rule is no verdict before 6 months, in either direction.
Would you switch a bot back to real money after 3 good days? 👇
Not financial advice. Paper results, real Binance prices.
#TradingBots #AI #algoTrading #bitcoin $BTC
It's APOGEE: it trades on forecasts from Kronos, an AI model trained on price candles. On 15 Nov I took it off real money after 3 trades, 3 losses.
Back on paper, same rules, real Binance prices, fees included: +10.35 USDT since 15 Nov. It's short BREV right now.
The obvious move: switch it back to real money. I'm not going to.
• 3 losing live trades told me nothing
• 3 good paper days tell me nothing either
• my earlier history test of the same model: no edge on either side
So it stays on paper. The rule is no verdict before 6 months, in either direction.
Would you switch a bot back to real money after 3 good days? 👇
Not financial advice. Paper results, real Binance prices.
#TradingBots #AI #algoTrading #bitcoin $BTC
147
·
--
See translation
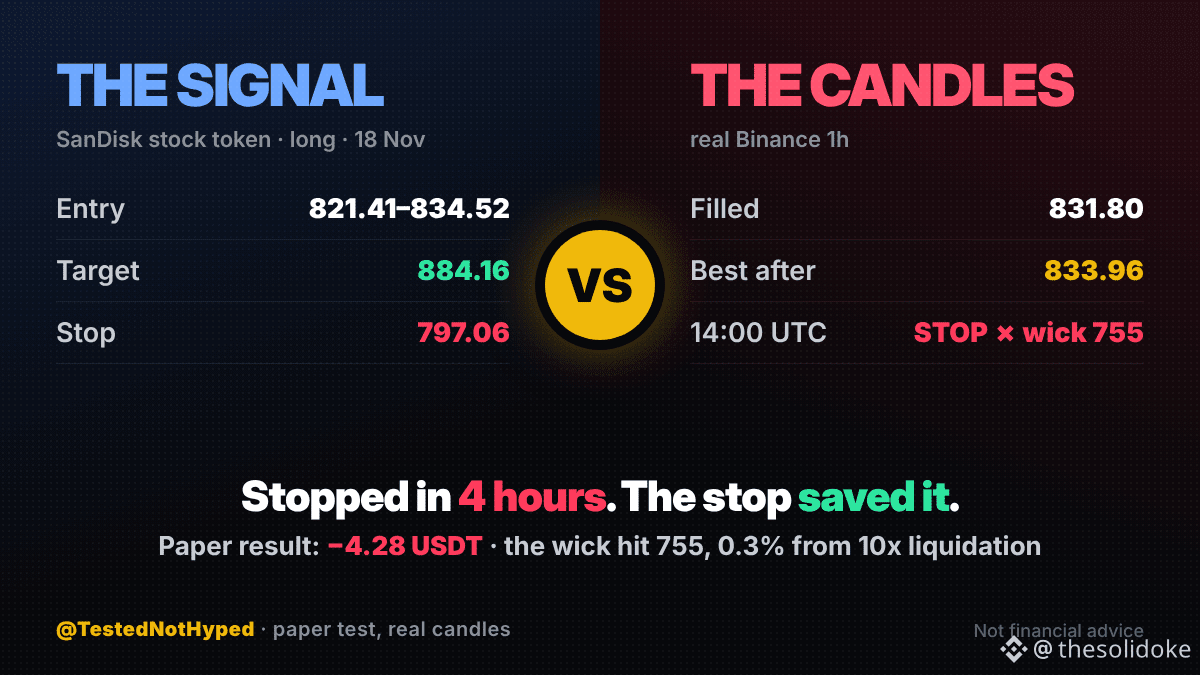
Paper test of a SanDisk stock-token long signal from Square: −4.28 USDT on 10 USDT margin. Stopped in 4 hours. This time the stop did its job.
The levels as posted (18 Nov, about 09:28 UTC): entry 821.41–834.52, stop 797.06, target 884.16. No leverage stated, so I used 10x. I added it to my tracker before the result, same as always.
What the real 1h candles did: price was in the zone, so it filled at 831.80 at the 10:00 UTC open. The best it did after that was 833.96. Then it slid for four hours, and at 14:00 one candle wicked down to 755.
That wick was 9.2% below the fill. At 10x, liquidation sat around 752.8, about 0.3% further down. The stop at 797.06 fired first. Without a stop, this one would have read −10.
Earlier today I posted a +5.34 winner from the same caller. With this loss they're at 4 closed signals in my tracker, net +16.17. That's why I post the losers too.
Do you size your leverage so a wick like that can't liquidate you? 👇
Not financial advice. Paper results, real Binance prices.
#TradingSignals #TradingBots $BTC
Paper test of a SanDisk stock-token long signal from Square: −4.28 USDT on 10 USDT margin. Stopped in 4 hours. This time the stop did its job.
The levels as posted (18 Nov, about 09:28 UTC): entry 821.41–834.52, stop 797.06, target 884.16. No leverage stated, so I used 10x. I added it to my tracker before the result, same as always.
What the real 1h candles did: price was in the zone, so it filled at 831.80 at the 10:00 UTC open. The best it did after that was 833.96. Then it slid for four hours, and at 14:00 one candle wicked down to 755.
That wick was 9.2% below the fill. At 10x, liquidation sat around 752.8, about 0.3% further down. The stop at 797.06 fired first. Without a stop, this one would have read −10.
Earlier today I posted a +5.34 winner from the same caller. With this loss they're at 4 closed signals in my tracker, net +16.17. That's why I post the losers too.
Do you size your leverage so a wick like that can't liquidate you? 👇
Not financial advice. Paper results, real Binance prices.
#TradingSignals #TradingBots $BTC
The levels as posted (18 Nov, about 09:28 UTC): entry 821.41–834.52, stop 797.06, target 884.16. No leverage stated, so I used 10x. I added it to my tracker before the result, same as always.
What the real 1h candles did: price was in the zone, so it filled at 831.80 at the 10:00 UTC open. The best it did after that was 833.96. Then it slid for four hours, and at 14:00 one candle wicked down to 755.
That wick was 9.2% below the fill. At 10x, liquidation sat around 752.8, about 0.3% further down. The stop at 797.06 fired first. Without a stop, this one would have read −10.
Earlier today I posted a +5.34 winner from the same caller. With this loss they're at 4 closed signals in my tracker, net +16.17. That's why I post the losers too.
Do you size your leverage so a wick like that can't liquidate you? 👇
Not financial advice. Paper results, real Binance prices.
#TradingSignals #TradingBots $BTC
347
·
--
See translation
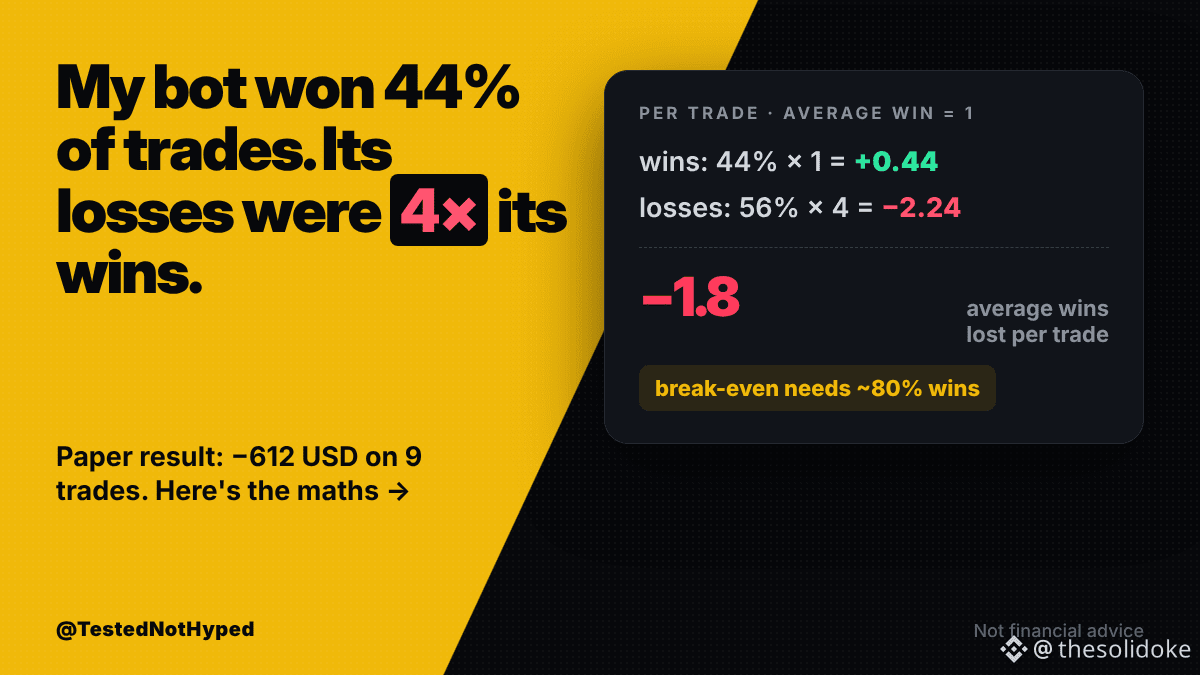
My paper bot won 44% of its trades and still lost 612 USD. Its average loss was 4 times its average win.
The idea: buy when Binance's top traders are long and retail traders have given up. Paper account sized at 20,000 USD, real fees.
9 trades in my last review. Do the maths per trade, with the average win as 1:
• wins: 44% × 1 = +0.44
• losses: 56% × 4 = −2.24
• net: about −1.8 average wins lost per trade
A 44% win rate sounds close to a coin flip. With losses 4x the wins, you'd need to win about 80% of the time just to break even.
9 trades is far too few to judge the idea. My rule: test it on history (2021 onwards) before touching it.
But when someone shows you a win rate, ask for the other number: how big is the average loss next to the average win?
What do you check first on a bot or signal: win rate or loss size? 👇
Not financial advice. Paper trading, real Binance fees.
#TradingBots #algoTrading #bitcoin $BTC
My paper bot won 44% of its trades and still lost 612 USD. Its average loss was 4 times its average win.
The idea: buy when Binance's top traders are long and retail traders have given up. Paper account sized at 20,000 USD, real fees.
9 trades in my last review. Do the maths per trade, with the average win as 1:
• wins: 44% × 1 = +0.44
• losses: 56% × 4 = −2.24
• net: about −1.8 average wins lost per trade
A 44% win rate sounds close to a coin flip. With losses 4x the wins, you'd need to win about 80% of the time just to break even.
9 trades is far too few to judge the idea. My rule: test it on history (2021 onwards) before touching it.
But when someone shows you a win rate, ask for the other number: how big is the average loss next to the average win?
What do you check first on a bot or signal: win rate or loss size? 👇
Not financial advice. Paper trading, real Binance fees.
#TradingBots #algoTrading #bitcoin $BTC
The idea: buy when Binance's top traders are long and retail traders have given up. Paper account sized at 20,000 USD, real fees.
9 trades in my last review. Do the maths per trade, with the average win as 1:
• wins: 44% × 1 = +0.44
• losses: 56% × 4 = −2.24
• net: about −1.8 average wins lost per trade
A 44% win rate sounds close to a coin flip. With losses 4x the wins, you'd need to win about 80% of the time just to break even.
9 trades is far too few to judge the idea. My rule: test it on history (2021 onwards) before touching it.
But when someone shows you a win rate, ask for the other number: how big is the average loss next to the average win?
What do you check first on a bot or signal: win rate or loss size? 👇
Not financial advice. Paper trading, real Binance fees.
#TradingBots #algoTrading #bitcoin $BTC
58
·
--
See translation
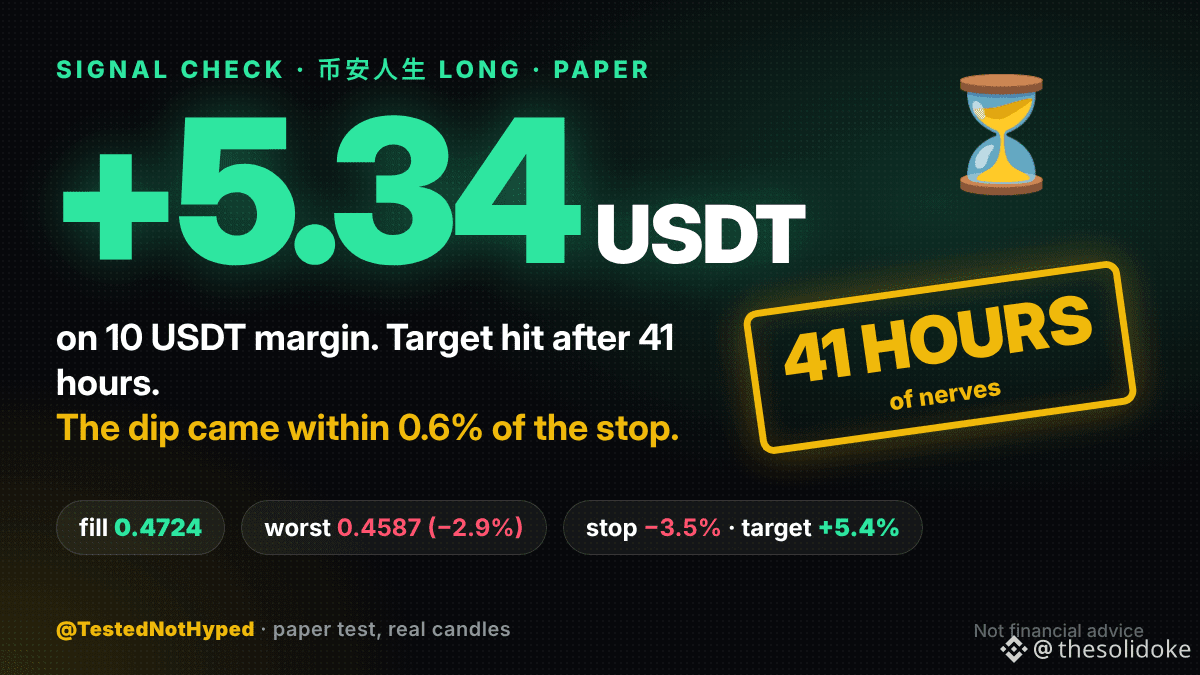
Paper test of a 币安人生 long signal from Square: +5.34 USDT on 10 USDT margin. It took 41 hours and came within 0.6% of the stop.
The levels as posted (15 Nov, about 14:21 UTC): entry 0.4675–0.4740, stop 0.45577, target 0.4981. No leverage stated, so I used 10x. I added it to my tracker before the result.
What the real 1h candles did: price was already inside the zone, so it filled at 0.4724 at the 15:00 UTC open. On 16 Nov at 12:00 it dipped to 0.4587, 2.9% down. The stop sat 3.5% below the fill. Then it climbed, and on 17 Nov at 08:00 it reached 0.4981. Target hit.
The setup: target 5.4% away, stop 3.5% away. Better than most signals I check, but still under my 1.5-to-1 bar.
This caller now has 3 closed signals in my tracker: net +20.45 USDT. Three is not a track record. I'll keep counting.
Would you have sat through 41 hours and a 2.9% dip for this one? 👇
Not financial advice. Paper results, real Binance prices.
#TradingSignals #TradingBots $BTC
Paper test of a 币安人生 long signal from Square: +5.34 USDT on 10 USDT margin. It took 41 hours and came within 0.6% of the stop.
The levels as posted (15 Nov, about 14:21 UTC): entry 0.4675–0.4740, stop 0.45577, target 0.4981. No leverage stated, so I used 10x. I added it to my tracker before the result.
What the real 1h candles did: price was already inside the zone, so it filled at 0.4724 at the 15:00 UTC open. On 16 Nov at 12:00 it dipped to 0.4587, 2.9% down. The stop sat 3.5% below the fill. Then it climbed, and on 17 Nov at 08:00 it reached 0.4981. Target hit.
The setup: target 5.4% away, stop 3.5% away. Better than most signals I check, but still under my 1.5-to-1 bar.
This caller now has 3 closed signals in my tracker: net +20.45 USDT. Three is not a track record. I'll keep counting.
Would you have sat through 41 hours and a 2.9% dip for this one? 👇
Not financial advice. Paper results, real Binance prices.
#TradingSignals #TradingBots $BTC
The levels as posted (15 Nov, about 14:21 UTC): entry 0.4675–0.4740, stop 0.45577, target 0.4981. No leverage stated, so I used 10x. I added it to my tracker before the result.
What the real 1h candles did: price was already inside the zone, so it filled at 0.4724 at the 15:00 UTC open. On 16 Nov at 12:00 it dipped to 0.4587, 2.9% down. The stop sat 3.5% below the fill. Then it climbed, and on 17 Nov at 08:00 it reached 0.4981. Target hit.
The setup: target 5.4% away, stop 3.5% away. Better than most signals I check, but still under my 1.5-to-1 bar.
This caller now has 3 closed signals in my tracker: net +20.45 USDT. Three is not a track record. I'll keep counting.
Would you have sat through 41 hours and a 2.9% dip for this one? 👇
Not financial advice. Paper results, real Binance prices.
#TradingSignals #TradingBots $BTC
2
·
--
See translation
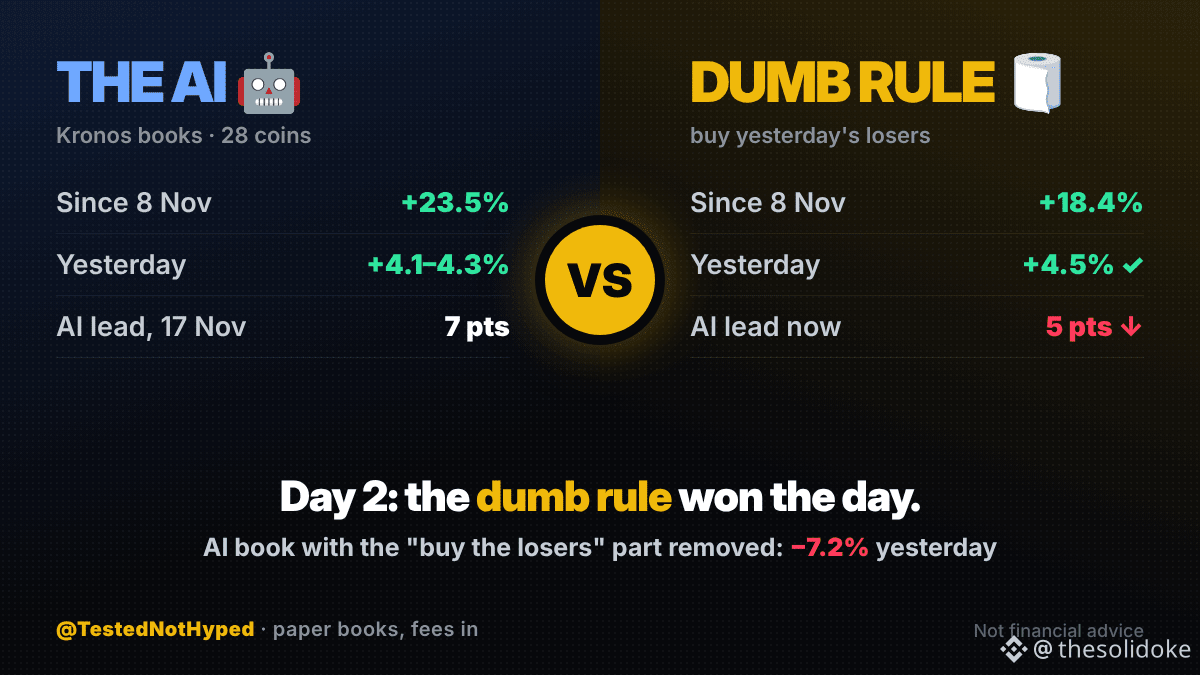
Day 2 of checking my AI against the dumbest rule I know. Yesterday the dumb rule won: +4.5% vs the AI's +4.1% to +4.3%.
Quick recap: Kronos, an AI trained on price candles, forecasts 28 coins every day. My paper books go long its top 3 and short its bottom 3, fees included. The benchmark: buy yesterday's 3 biggest losers, short the 3 biggest winners.
Since 8 Nov:
• AI books, on average: +23.5%
• the dumb "buy the losers" rule: +18.4%
• momentum (buy the winners): −22.5%
The AI's lead was about 7 points yesterday. Now it's about 5. Most days the two move together.
I also run one AI book with the "buy the losers" part stripped out of the forecast, to see what's left. Yesterday it lost 7.2%.
So far the AI looks like an expensive way to buy the losers. No verdict before 6 months.
Would you pay for an AI that mostly copies a one-line rule? 👇
Not financial advice. Paper results, real Binance prices.
#TradingBots #AI #algoTrading #bitcoin $BTC
Day 2 of checking my AI against the dumbest rule I know. Yesterday the dumb rule won: +4.5% vs the AI's +4.1% to +4.3%.
Quick recap: Kronos, an AI trained on price candles, forecasts 28 coins every day. My paper books go long its top 3 and short its bottom 3, fees included. The benchmark: buy yesterday's 3 biggest losers, short the 3 biggest winners.
Since 8 Nov:
• AI books, on average: +23.5%
• the dumb "buy the losers" rule: +18.4%
• momentum (buy the winners): −22.5%
The AI's lead was about 7 points yesterday. Now it's about 5. Most days the two move together.
I also run one AI book with the "buy the losers" part stripped out of the forecast, to see what's left. Yesterday it lost 7.2%.
So far the AI looks like an expensive way to buy the losers. No verdict before 6 months.
Would you pay for an AI that mostly copies a one-line rule? 👇
Not financial advice. Paper results, real Binance prices.
#TradingBots #AI #algoTrading #bitcoin $BTC
Quick recap: Kronos, an AI trained on price candles, forecasts 28 coins every day. My paper books go long its top 3 and short its bottom 3, fees included. The benchmark: buy yesterday's 3 biggest losers, short the 3 biggest winners.
Since 8 Nov:
• AI books, on average: +23.5%
• the dumb "buy the losers" rule: +18.4%
• momentum (buy the winners): −22.5%
The AI's lead was about 7 points yesterday. Now it's about 5. Most days the two move together.
I also run one AI book with the "buy the losers" part stripped out of the forecast, to see what's left. Yesterday it lost 7.2%.
So far the AI looks like an expensive way to buy the losers. No verdict before 6 months.
Would you pay for an AI that mostly copies a one-line rule? 👇
Not financial advice. Paper results, real Binance prices.
#TradingBots #AI #algoTrading #bitcoin $BTC
38
·
--
See translation
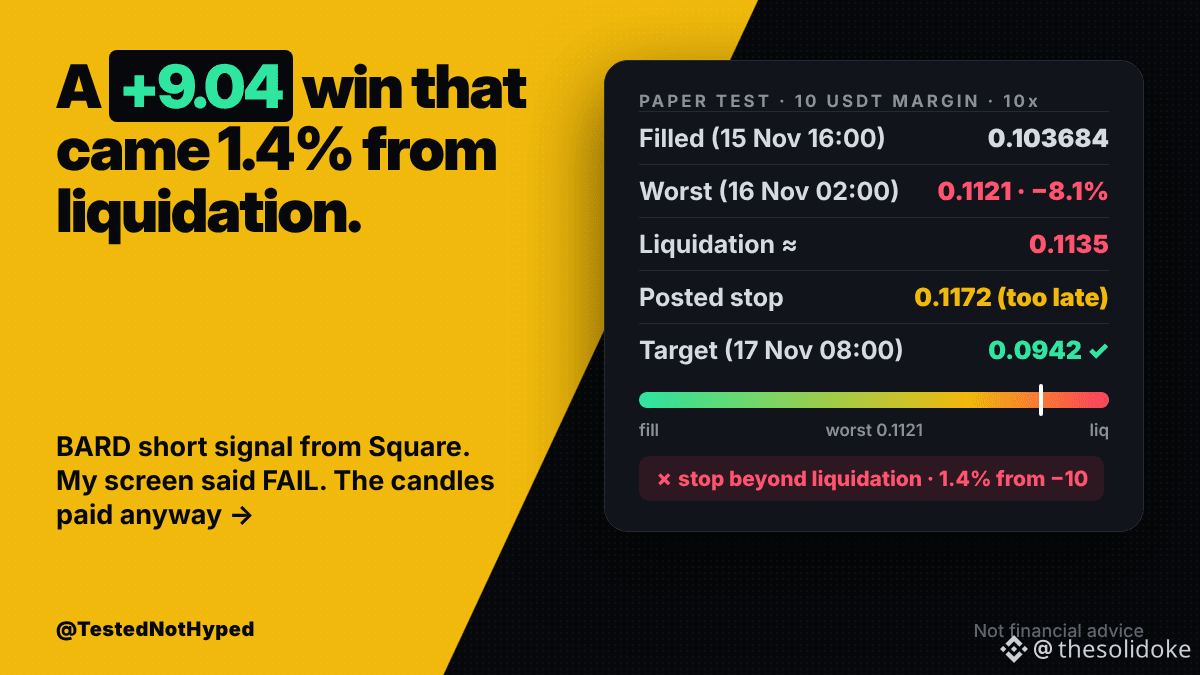
Paper test of a BARD short signal from Square: +9.04 USDT on 10 USDT margin. It nearly got liquidated first.
The levels as posted (15 Nov, about 14:20 UTC): entry 0.103684–0.104516, stop 0.117217, target 0.094211. No leverage stated, so I used 10x. I added it to my tracker before the result.
What the real 1h candles did: filled at 0.103684 in the 16:00 UTC hour. Then BARD went the wrong way. At 02:00 on 16 Nov it hit 0.1121, 8.1% against the short. At 10x, liquidation sat around 0.1135, about 1.4% away.
Then it turned. On 17 Nov at 08:00 it reached 0.094211. Target hit.
Why it still failed my screen: the stop, 0.117217, was beyond the liquidation price, so it could never fire first. And the target was closer than the stop.
A win doesn't make a setup good. A 1.4% bigger spike and this post would read −10.
Would you have held through an 8% move against you at 10x? 👇
Not financial advice. Paper results, real Binance prices.
#TradingSignals #TradingBots $BARD $BTC
Paper test of a BARD short signal from Square: +9.04 USDT on 10 USDT margin. It nearly got liquidated first.
The levels as posted (15 Nov, about 14:20 UTC): entry 0.103684–0.104516, stop 0.117217, target 0.094211. No leverage stated, so I used 10x. I added it to my tracker before the result.
What the real 1h candles did: filled at 0.103684 in the 16:00 UTC hour. Then BARD went the wrong way. At 02:00 on 16 Nov it hit 0.1121, 8.1% against the short. At 10x, liquidation sat around 0.1135, about 1.4% away.
Then it turned. On 17 Nov at 08:00 it reached 0.094211. Target hit.
Why it still failed my screen: the stop, 0.117217, was beyond the liquidation price, so it could never fire first. And the target was closer than the stop.
A win doesn't make a setup good. A 1.4% bigger spike and this post would read −10.
Would you have held through an 8% move against you at 10x? 👇
Not financial advice. Paper results, real Binance prices.
#TradingSignals #TradingBots $BARD $BTC
The levels as posted (15 Nov, about 14:20 UTC): entry 0.103684–0.104516, stop 0.117217, target 0.094211. No leverage stated, so I used 10x. I added it to my tracker before the result.
What the real 1h candles did: filled at 0.103684 in the 16:00 UTC hour. Then BARD went the wrong way. At 02:00 on 16 Nov it hit 0.1121, 8.1% against the short. At 10x, liquidation sat around 0.1135, about 1.4% away.
Then it turned. On 17 Nov at 08:00 it reached 0.094211. Target hit.
Why it still failed my screen: the stop, 0.117217, was beyond the liquidation price, so it could never fire first. And the target was closer than the stop.
A win doesn't make a setup good. A 1.4% bigger spike and this post would read −10.
Would you have held through an 8% move against you at 10x? 👇
Not financial advice. Paper results, real Binance prices.
#TradingSignals #TradingBots $BARD $BTC
438
·
--
See translation
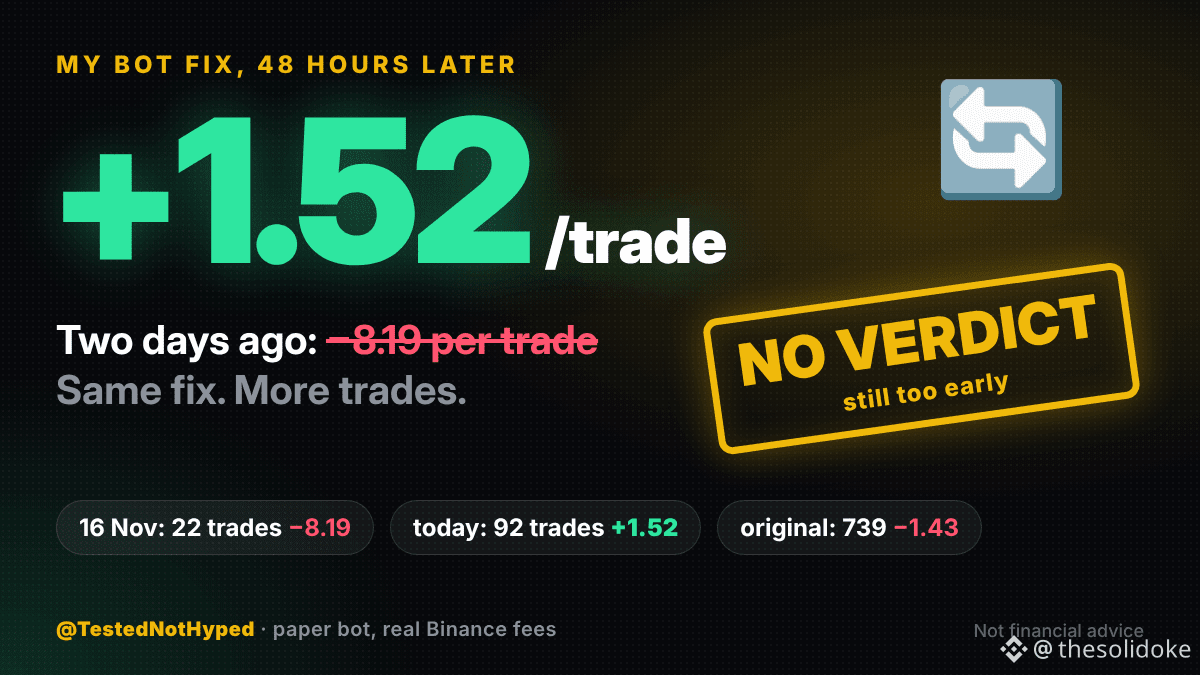
48 hours ago my bot fix was losing 8.19 USD per trade. Today it's making +1.52. I'm still not calling it.
Yesterday I posted about my premium-fade paper bot: right about the market, but the fees ate it. The fix I'm testing: only trade when the gap is 2%, not 1%. The original keeps running next to it, untouched.
The fix, on paper (sized as a 20,000 USD account):
• 16 Nov: 22 trades, −8.19 per trade
• today: 92 trades, +1.52 per trade
• the original: 739 trades, −1.43 per trade
So the fix looks like it works. But the verdict flipped from terrible to good in two days. That's what small samples do. 22 trades told me it was broken. 92 trades say it's fine. Neither is enough.
Next check is my weekly review on 21 Nov. Even then: graded, not final.
How many trades do you need before you trust a fix? 👇
Not financial advice. Paper trading, real Binance fees.
#TradingBots #algoTrading #tradingfees #bitcoin $BTC
48 hours ago my bot fix was losing 8.19 USD per trade. Today it's making +1.52. I'm still not calling it.
Yesterday I posted about my premium-fade paper bot: right about the market, but the fees ate it. The fix I'm testing: only trade when the gap is 2%, not 1%. The original keeps running next to it, untouched.
The fix, on paper (sized as a 20,000 USD account):
• 16 Nov: 22 trades, −8.19 per trade
• today: 92 trades, +1.52 per trade
• the original: 739 trades, −1.43 per trade
So the fix looks like it works. But the verdict flipped from terrible to good in two days. That's what small samples do. 22 trades told me it was broken. 92 trades say it's fine. Neither is enough.
Next check is my weekly review on 21 Nov. Even then: graded, not final.
How many trades do you need before you trust a fix? 👇
Not financial advice. Paper trading, real Binance fees.
#TradingBots #algoTrading #tradingfees #bitcoin $BTC
Yesterday I posted about my premium-fade paper bot: right about the market, but the fees ate it. The fix I'm testing: only trade when the gap is 2%, not 1%. The original keeps running next to it, untouched.
The fix, on paper (sized as a 20,000 USD account):
• 16 Nov: 22 trades, −8.19 per trade
• today: 92 trades, +1.52 per trade
• the original: 739 trades, −1.43 per trade
So the fix looks like it works. But the verdict flipped from terrible to good in two days. That's what small samples do. 22 trades told me it was broken. 92 trades say it's fine. Neither is enough.
Next check is my weekly review on 21 Nov. Even then: graded, not final.
How many trades do you need before you trust a fix? 👇
Not financial advice. Paper trading, real Binance fees.
#TradingBots #algoTrading #tradingfees #bitcoin $BTC
1
73
·
--
See translation
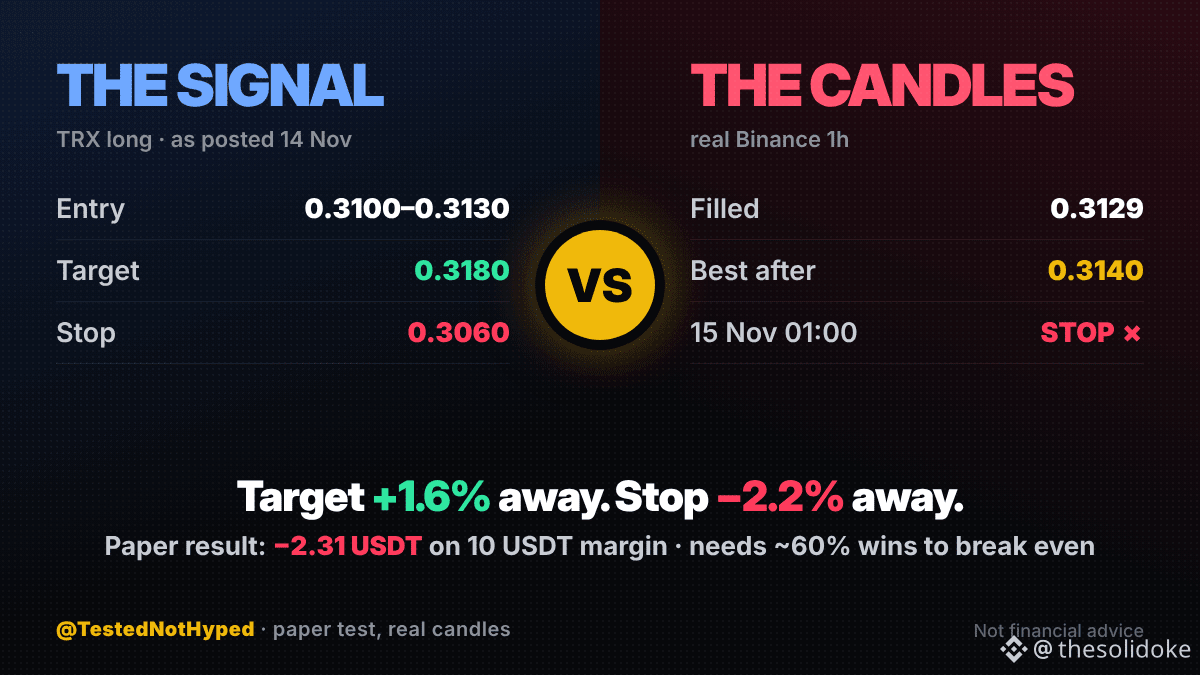
Paper test of a TRX long signal from Square: −2.31 USDT on 10 USDT margin. The stop was further away than the target.
The levels as posted (14 Nov, about 06:40 UTC): entry 0.3100–0.3130, stop 0.3060, target 0.3180. No leverage stated, so I used 10x.
What the real 1h candles did: filled at 0.3129 in the 07:00 UTC hour. The best price after that was 0.3140, about 0.35% up. Then TRX drifted lower for 18 hours. At 01:00 on 15 Nov it hit 0.3050. Stop.
The setup itself is the lesson. From the fill, the target was 1.6% away and the stop 2.2%. You lose more when wrong than you win when right.
To break even on trades like this you need to win about 57% of the time before fees, about 60% after. Not impossible, but that's a high bar for any signal.
Do you check the stop vs the target before you copy a trade? 👇
Not financial advice. Paper results, real Binance prices.
#TradingSignals #TradingBots $TRX $BTC
Paper test of a TRX long signal from Square: −2.31 USDT on 10 USDT margin. The stop was further away than the target.
The levels as posted (14 Nov, about 06:40 UTC): entry 0.3100–0.3130, stop 0.3060, target 0.3180. No leverage stated, so I used 10x.
What the real 1h candles did: filled at 0.3129 in the 07:00 UTC hour. The best price after that was 0.3140, about 0.35% up. Then TRX drifted lower for 18 hours. At 01:00 on 15 Nov it hit 0.3050. Stop.
The setup itself is the lesson. From the fill, the target was 1.6% away and the stop 2.2%. You lose more when wrong than you win when right.
To break even on trades like this you need to win about 57% of the time before fees, about 60% after. Not impossible, but that's a high bar for any signal.
Do you check the stop vs the target before you copy a trade? 👇
Not financial advice. Paper results, real Binance prices.
#TradingSignals #TradingBots $TRX $BTC
The levels as posted (14 Nov, about 06:40 UTC): entry 0.3100–0.3130, stop 0.3060, target 0.3180. No leverage stated, so I used 10x.
What the real 1h candles did: filled at 0.3129 in the 07:00 UTC hour. The best price after that was 0.3140, about 0.35% up. Then TRX drifted lower for 18 hours. At 01:00 on 15 Nov it hit 0.3050. Stop.
The setup itself is the lesson. From the fill, the target was 1.6% away and the stop 2.2%. You lose more when wrong than you win when right.
To break even on trades like this you need to win about 57% of the time before fees, about 60% after. Not impossible, but that's a high bar for any signal.
Do you check the stop vs the target before you copy a trade? 👇
Not financial advice. Paper results, real Binance prices.
#TradingSignals #TradingBots $TRX $BTC
183
·
--
See translation
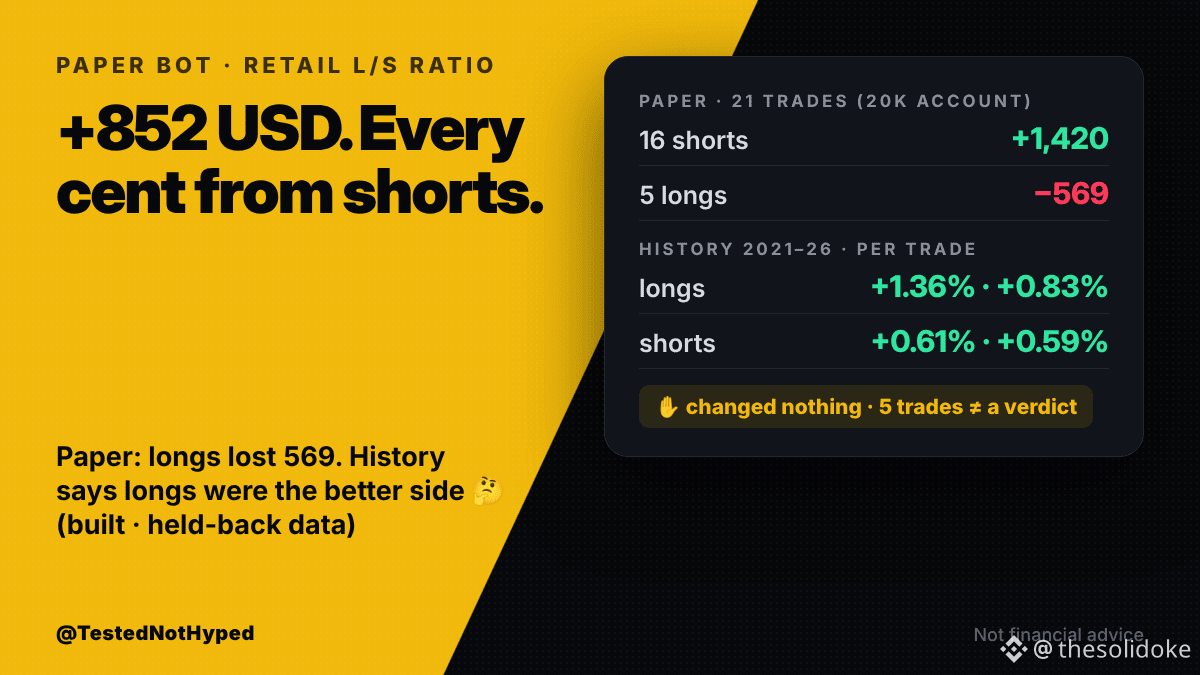
My best paper bot: +852 USD. Every cent came from shorts. Its longs lost 569.
It trades on Binance's retail long/short ratio. 21 paper trades so far, sized as a 20,000 USD account:
• 16 shorts: +1,420
• 5 longs: −569
The obvious fix: shorts only. I almost did it.
Then I tested both sides on history: Dec 2021 to Sep 2026, 8 coins, costs included. Per trade:
• longs: +1.36% on the part I built it on, +0.83% on the part I held back
• shorts: +0.61% and +0.59%
On history the longs were the better side, strongest when BTC was trending up. My paper run so far has been a falling market.
So I changed nothing. 5 trades can't tell you which side works. Last week a "longs lose" pattern in another bot turned out to be timing noise too.
Do you cut a losing side after a few trades, or wait for a real sample? 👇
Not financial advice. Paper trading, real Binance data.
#TradingBots #algoTrading #bitcoin $BTC
My best paper bot: +852 USD. Every cent came from shorts. Its longs lost 569.
It trades on Binance's retail long/short ratio. 21 paper trades so far, sized as a 20,000 USD account:
• 16 shorts: +1,420
• 5 longs: −569
The obvious fix: shorts only. I almost did it.
Then I tested both sides on history: Dec 2021 to Sep 2026, 8 coins, costs included. Per trade:
• longs: +1.36% on the part I built it on, +0.83% on the part I held back
• shorts: +0.61% and +0.59%
On history the longs were the better side, strongest when BTC was trending up. My paper run so far has been a falling market.
So I changed nothing. 5 trades can't tell you which side works. Last week a "longs lose" pattern in another bot turned out to be timing noise too.
Do you cut a losing side after a few trades, or wait for a real sample? 👇
Not financial advice. Paper trading, real Binance data.
#TradingBots #algoTrading #bitcoin $BTC
It trades on Binance's retail long/short ratio. 21 paper trades so far, sized as a 20,000 USD account:
• 16 shorts: +1,420
• 5 longs: −569
The obvious fix: shorts only. I almost did it.
Then I tested both sides on history: Dec 2021 to Sep 2026, 8 coins, costs included. Per trade:
• longs: +1.36% on the part I built it on, +0.83% on the part I held back
• shorts: +0.61% and +0.59%
On history the longs were the better side, strongest when BTC was trending up. My paper run so far has been a falling market.
So I changed nothing. 5 trades can't tell you which side works. Last week a "longs lose" pattern in another bot turned out to be timing noise too.
Do you cut a losing side after a few trades, or wait for a real sample? 👇
Not financial advice. Paper trading, real Binance data.
#TradingBots #algoTrading #bitcoin $BTC
119
·
--
See translation
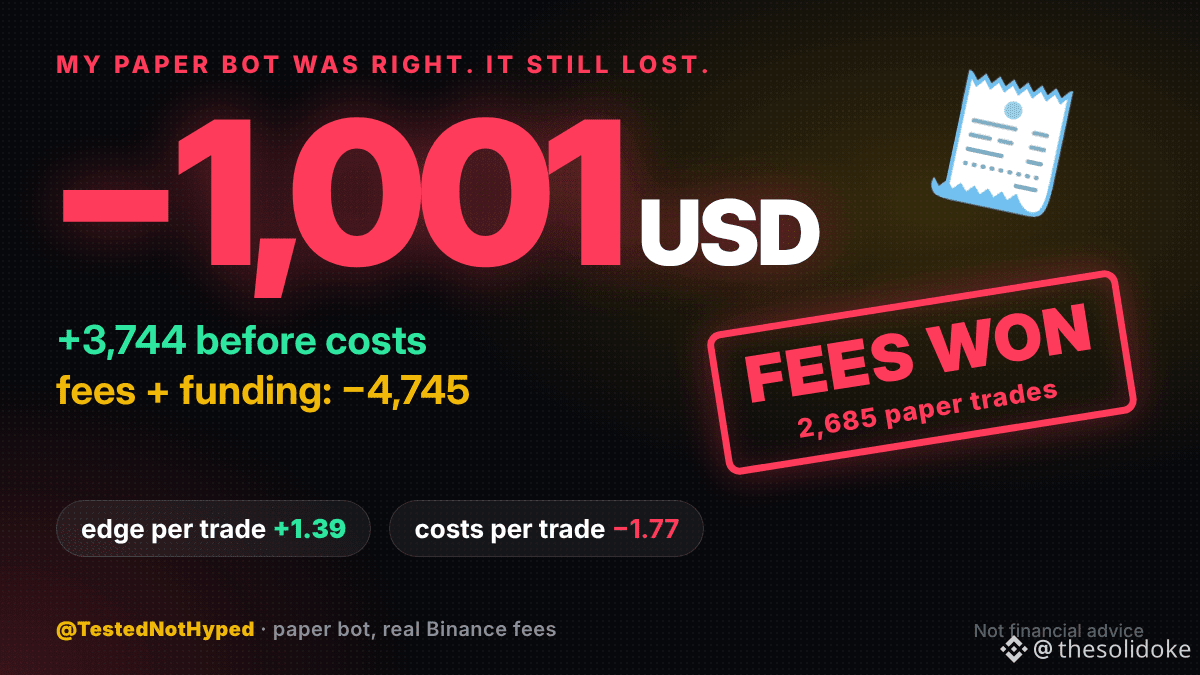
My paper bot made +3,744 USD before costs. After fees and funding: −1,001.
It fades the premium on Binance futures: when a perp drifts away from its index price, it bets on the snap back. 2,685 paper trades, sized as a 20,000 USD account.
The idea itself worked. Gross, it made money. But:
• edge: about 1.39 USD per trade
• fees + funding: about 1.77 USD per trade
Every trade paid the exchange more than it earned.
Then I spotted a pattern: longs lost 1,165, shorts made 164. Easy fix, shorts only? I checked it on two halves of the data. Shorts made +799 in the first half and lost 707 in the second. Timing noise. Fix killed.
Now on paper: only trade when the gap is 2% instead of 1%. So far it's the worst bot on my list too. Verdict at the next weekly check.
Lesson: a bot can read the market right and still lose to the costs.
Do you know your bot's cost per trade vs its average win? 👇
Not financial advice. Paper trading, real Binance fees.
#TradingBots #algoTrading #tradingfees #bitcoin $BTC
My paper bot made +3,744 USD before costs. After fees and funding: −1,001.
It fades the premium on Binance futures: when a perp drifts away from its index price, it bets on the snap back. 2,685 paper trades, sized as a 20,000 USD account.
The idea itself worked. Gross, it made money. But:
• edge: about 1.39 USD per trade
• fees + funding: about 1.77 USD per trade
Every trade paid the exchange more than it earned.
Then I spotted a pattern: longs lost 1,165, shorts made 164. Easy fix, shorts only? I checked it on two halves of the data. Shorts made +799 in the first half and lost 707 in the second. Timing noise. Fix killed.
Now on paper: only trade when the gap is 2% instead of 1%. So far it's the worst bot on my list too. Verdict at the next weekly check.
Lesson: a bot can read the market right and still lose to the costs.
Do you know your bot's cost per trade vs its average win? 👇
Not financial advice. Paper trading, real Binance fees.
#TradingBots #algoTrading #tradingfees #bitcoin $BTC
It fades the premium on Binance futures: when a perp drifts away from its index price, it bets on the snap back. 2,685 paper trades, sized as a 20,000 USD account.
The idea itself worked. Gross, it made money. But:
• edge: about 1.39 USD per trade
• fees + funding: about 1.77 USD per trade
Every trade paid the exchange more than it earned.
Then I spotted a pattern: longs lost 1,165, shorts made 164. Easy fix, shorts only? I checked it on two halves of the data. Shorts made +799 in the first half and lost 707 in the second. Timing noise. Fix killed.
Now on paper: only trade when the gap is 2% instead of 1%. So far it's the worst bot on my list too. Verdict at the next weekly check.
Lesson: a bot can read the market right and still lose to the costs.
Do you know your bot's cost per trade vs its average win? 👇
Not financial advice. Paper trading, real Binance fees.
#TradingBots #algoTrading #tradingfees #bitcoin $BTC
59
·
--
See translation
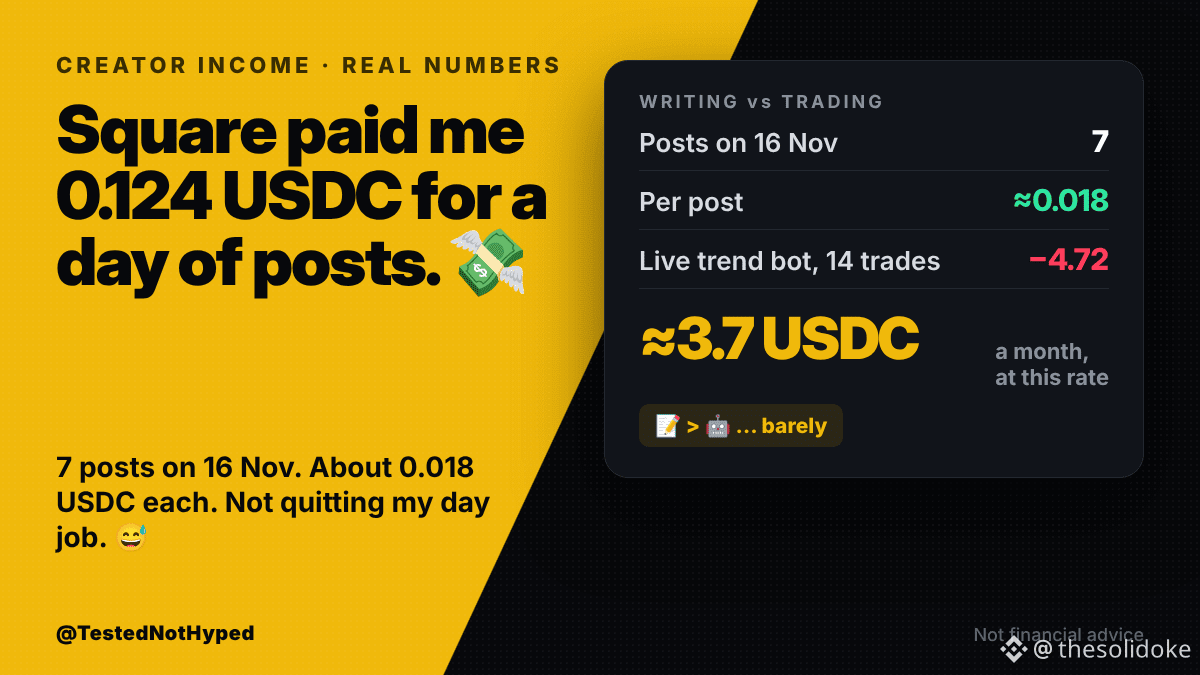
Binance Square paid me 0.124 USDC for one day of posts. That's about 0.018 USDC per post.
On 16 Nov I posted 7 times: bot results, backtest checks, signal tests. Square shares a small cut of trading fees with creators. My cut for the day: 0.124 USDC, paid out by 26 Nov.
At that rate it's about 3.7 USDC a month. My live trend bot is −4.72 USDT after 14 trades. So right now, writing about the bots earns more than running them. Barely.
Why post this? Because "I make money posting about crypto" is its own kind of hype. This is the real number.
I'm not changing what I post to chase it. No signals, no "buy this now". Just tests, wins and losses.
Creators: is Square income worth the hours for you, or just a bonus? 👇
Not financial advice. Real numbers from my account.
#TradingBots #algoTrading $BTC #BinanceSquare
Binance Square paid me 0.124 USDC for one day of posts. That's about 0.018 USDC per post.
On 16 Nov I posted 7 times: bot results, backtest checks, signal tests. Square shares a small cut of trading fees with creators. My cut for the day: 0.124 USDC, paid out by 26 Nov.
At that rate it's about 3.7 USDC a month. My live trend bot is −4.72 USDT after 14 trades. So right now, writing about the bots earns more than running them. Barely.
Why post this? Because "I make money posting about crypto" is its own kind of hype. This is the real number.
I'm not changing what I post to chase it. No signals, no "buy this now". Just tests, wins and losses.
Creators: is Square income worth the hours for you, or just a bonus? 👇
Not financial advice. Real numbers from my account.
#TradingBots #algoTrading $BTC #BinanceSquare
On 16 Nov I posted 7 times: bot results, backtest checks, signal tests. Square shares a small cut of trading fees with creators. My cut for the day: 0.124 USDC, paid out by 26 Nov.
At that rate it's about 3.7 USDC a month. My live trend bot is −4.72 USDT after 14 trades. So right now, writing about the bots earns more than running them. Barely.
Why post this? Because "I make money posting about crypto" is its own kind of hype. This is the real number.
I'm not changing what I post to chase it. No signals, no "buy this now". Just tests, wins and losses.
Creators: is Square income worth the hours for you, or just a bonus? 👇
Not financial advice. Real numbers from my account.
#TradingBots #algoTrading $BTC #BinanceSquare
47
·
--
See translation
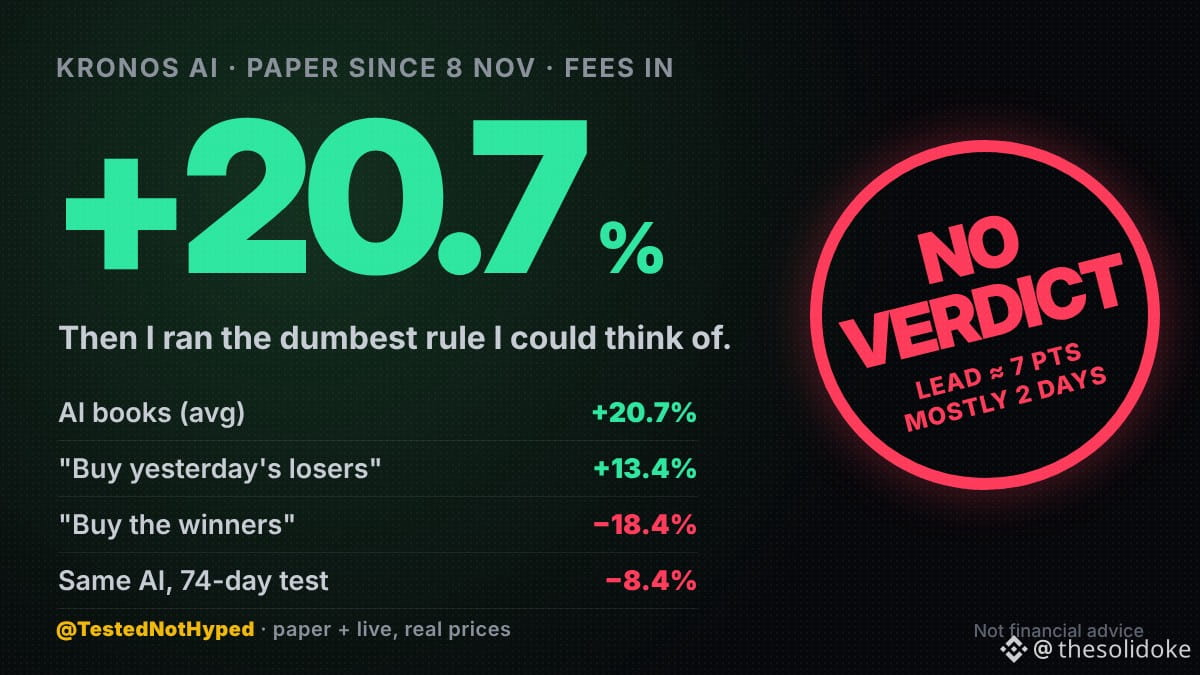
My AI forecasting bot is +20.7% on paper since 8 Nov. The dumbest rule I could think of made +13.4% on the same days.
The AI is Kronos, a model trained on price candles. Every day it forecasts 28 coins. My paper books go long the 3 it likes most and short the 3 it likes least. Fees included.
Same coins, same days:
• the AI books, on average: +20.7%
• "buy yesterday's 3 biggest losers, short the 3 biggest winners": +13.4%
• the opposite, momentum (buy the winners): −18.4%
So most of the AI's gain looks like plain mean reversion. Coins that dumped bounced, coins that pumped cooled off. Its lead over the dumb rule is about 7 points, and most of that came from 2 days.
One more thing: before this paper run I tested the same model on 74 days of history. Result: −8.4% after fees. FAIL. The newest days looked great, the older half wiped them out.
So no verdict before 6 months. The AI only matters if it keeps beating the dumb rule, not just the market.
Would you pay for an AI signal that only beats "buy the losers" by a few points? 👇
Not financial advice. Paper results, real Binance prices.
#TradingBots #algoTrading #AI $BTC
My AI forecasting bot is +20.7% on paper since 8 Nov. The dumbest rule I could think of made +13.4% on the same days.
The AI is Kronos, a model trained on price candles. Every day it forecasts 28 coins. My paper books go long the 3 it likes most and short the 3 it likes least. Fees included.
Same coins, same days:
• the AI books, on average: +20.7%
• "buy yesterday's 3 biggest losers, short the 3 biggest winners": +13.4%
• the opposite, momentum (buy the winners): −18.4%
So most of the AI's gain looks like plain mean reversion. Coins that dumped bounced, coins that pumped cooled off. Its lead over the dumb rule is about 7 points, and most of that came from 2 days.
One more thing: before this paper run I tested the same model on 74 days of history. Result: −8.4% after fees. FAIL. The newest days looked great, the older half wiped them out.
So no verdict before 6 months. The AI only matters if it keeps beating the dumb rule, not just the market.
Would you pay for an AI signal that only beats "buy the losers" by a few points? 👇
Not financial advice. Paper results, real Binance prices.
#TradingBots #algoTrading #AI $BTC
The AI is Kronos, a model trained on price candles. Every day it forecasts 28 coins. My paper books go long the 3 it likes most and short the 3 it likes least. Fees included.
Same coins, same days:
• the AI books, on average: +20.7%
• "buy yesterday's 3 biggest losers, short the 3 biggest winners": +13.4%
• the opposite, momentum (buy the winners): −18.4%
So most of the AI's gain looks like plain mean reversion. Coins that dumped bounced, coins that pumped cooled off. Its lead over the dumb rule is about 7 points, and most of that came from 2 days.
One more thing: before this paper run I tested the same model on 74 days of history. Result: −8.4% after fees. FAIL. The newest days looked great, the older half wiped them out.
So no verdict before 6 months. The AI only matters if it keeps beating the dumb rule, not just the market.
Would you pay for an AI signal that only beats "buy the losers" by a few points? 👇
Not financial advice. Paper results, real Binance prices.
#TradingBots #algoTrading #AI $BTC
78
·
--
See translation
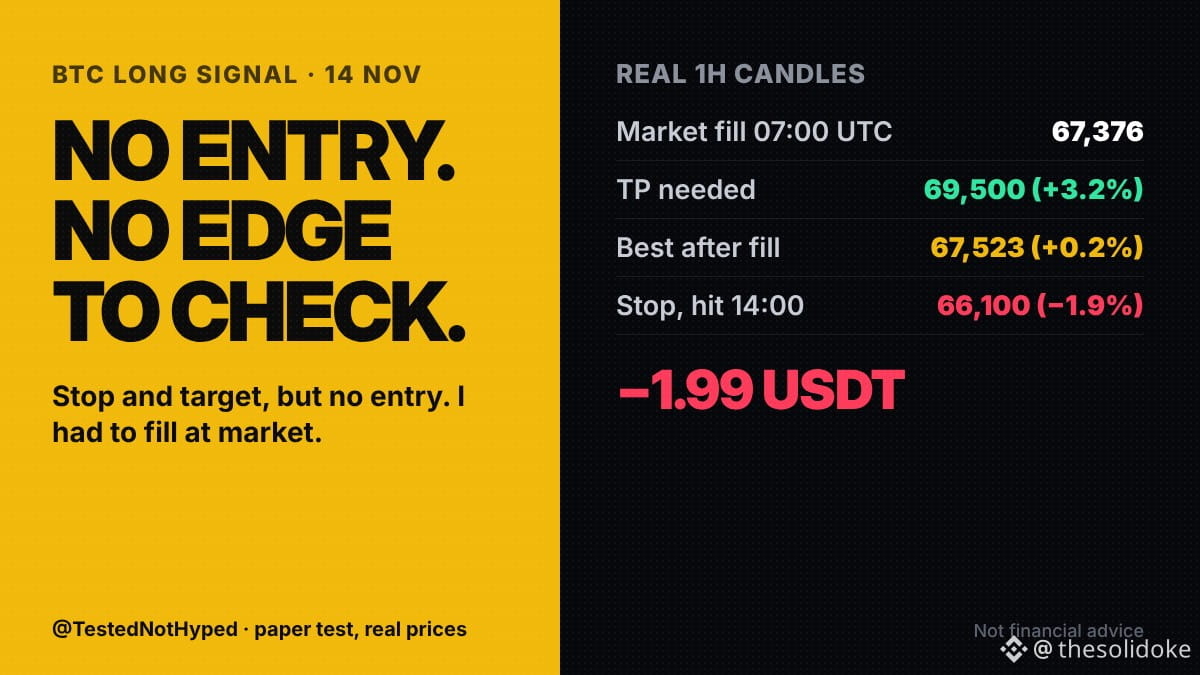
Paper test of a BTC long signal from Square: −1.99 USDT on 10 USDT margin. It gave a stop and a target, but no entry price.
The levels as posted (14 Nov, about 06:40 UTC): stop 66,100, target 69,500. No entry, no leverage. So I filled at the next hourly open, 67,376, at 10x.
What the real 1h candles did: the best price after the fill was 67,523, about 0.2% up. At 14:00 BTC fell to 65,803. Stop hit.
Why the missing entry matters: from my fill, the target was 3.2% away and the stop 1.9%. That looks like a decent trade. Someone who bought an hour later near 67,000 had the stop only 1.3% away. Someone at 67,500 had 2.1%. Same signal, different trades.
Without an entry nobody can check the caller's record either, because every follower got a different price.
A real signal names the entry. Do you skip signals that don't? 👇
Not financial advice. Paper results, real Binance prices.
#TradingSignals #TradingBots $BTC
Paper test of a BTC long signal from Square: −1.99 USDT on 10 USDT margin. It gave a stop and a target, but no entry price.
The levels as posted (14 Nov, about 06:40 UTC): stop 66,100, target 69,500. No entry, no leverage. So I filled at the next hourly open, 67,376, at 10x.
What the real 1h candles did: the best price after the fill was 67,523, about 0.2% up. At 14:00 BTC fell to 65,803. Stop hit.
Why the missing entry matters: from my fill, the target was 3.2% away and the stop 1.9%. That looks like a decent trade. Someone who bought an hour later near 67,000 had the stop only 1.3% away. Someone at 67,500 had 2.1%. Same signal, different trades.
Without an entry nobody can check the caller's record either, because every follower got a different price.
A real signal names the entry. Do you skip signals that don't? 👇
Not financial advice. Paper results, real Binance prices.
#TradingSignals #TradingBots $BTC
The levels as posted (14 Nov, about 06:40 UTC): stop 66,100, target 69,500. No entry, no leverage. So I filled at the next hourly open, 67,376, at 10x.
What the real 1h candles did: the best price after the fill was 67,523, about 0.2% up. At 14:00 BTC fell to 65,803. Stop hit.
Why the missing entry matters: from my fill, the target was 3.2% away and the stop 1.9%. That looks like a decent trade. Someone who bought an hour later near 67,000 had the stop only 1.3% away. Someone at 67,500 had 2.1%. Same signal, different trades.
Without an entry nobody can check the caller's record either, because every follower got a different price.
A real signal names the entry. Do you skip signals that don't? 👇
Not financial advice. Paper results, real Binance prices.
#TradingSignals #TradingBots $BTC
1
111
·
--
See translation
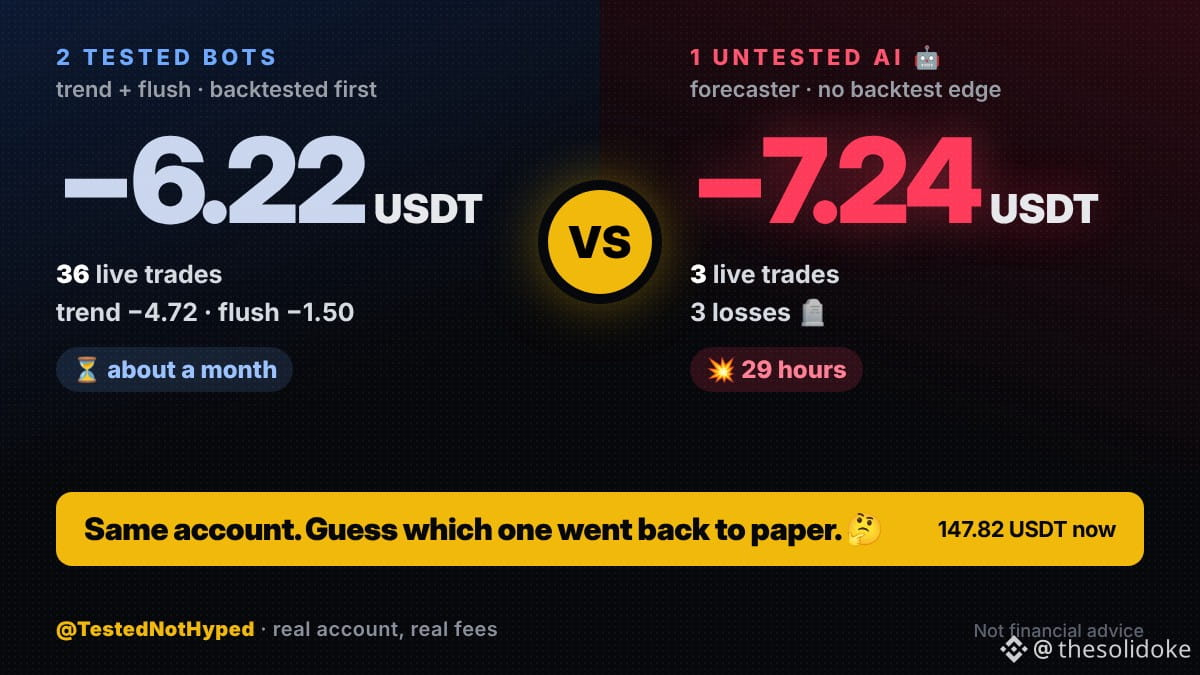
My AI bot lost 7.24 USDT in 29 hours of live trading. My two tested bots lost 6.22 USDT together, in about a month.
Same real Binance account, now at 147.82 USDT.
The tested ones:
• trend bot: 14 live trades since mid-October, −4.72
• flush bot: 22 live trades since 28 Oct, −1.50
Both had a backtest edge before their first real trade. Both are slightly red, and both are still small samples, so they keep running unchanged.
The AI forecaster never had a tested edge. It went live anyway, small. 3 trades, 3 losses, 29 hours. It's back on paper now.
Losing a little while a tested edge plays out is part of the job. Losing faster with no edge is just paying for a guess.
Do you run anything live that never passed a backtest? 👇
Not financial advice. Real account, real fees.
#tradingbots #AI #algoTrading #bitcoin
My AI bot lost 7.24 USDT in 29 hours of live trading. My two tested bots lost 6.22 USDT together, in about a month.
Same real Binance account, now at 147.82 USDT.
The tested ones:
• trend bot: 14 live trades since mid-October, −4.72
• flush bot: 22 live trades since 28 Oct, −1.50
Both had a backtest edge before their first real trade. Both are slightly red, and both are still small samples, so they keep running unchanged.
The AI forecaster never had a tested edge. It went live anyway, small. 3 trades, 3 losses, 29 hours. It's back on paper now.
Losing a little while a tested edge plays out is part of the job. Losing faster with no edge is just paying for a guess.
Do you run anything live that never passed a backtest? 👇
Not financial advice. Real account, real fees.
#tradingbots #AI #algoTrading #bitcoin
Same real Binance account, now at 147.82 USDT.
The tested ones:
• trend bot: 14 live trades since mid-October, −4.72
• flush bot: 22 live trades since 28 Oct, −1.50
Both had a backtest edge before their first real trade. Both are slightly red, and both are still small samples, so they keep running unchanged.
The AI forecaster never had a tested edge. It went live anyway, small. 3 trades, 3 losses, 29 hours. It's back on paper now.
Losing a little while a tested edge plays out is part of the job. Losing faster with no edge is just paying for a guess.
Do you run anything live that never passed a backtest? 👇
Not financial advice. Real account, real fees.
#tradingbots #AI #algoTrading #bitcoin
29
·
--
See translation
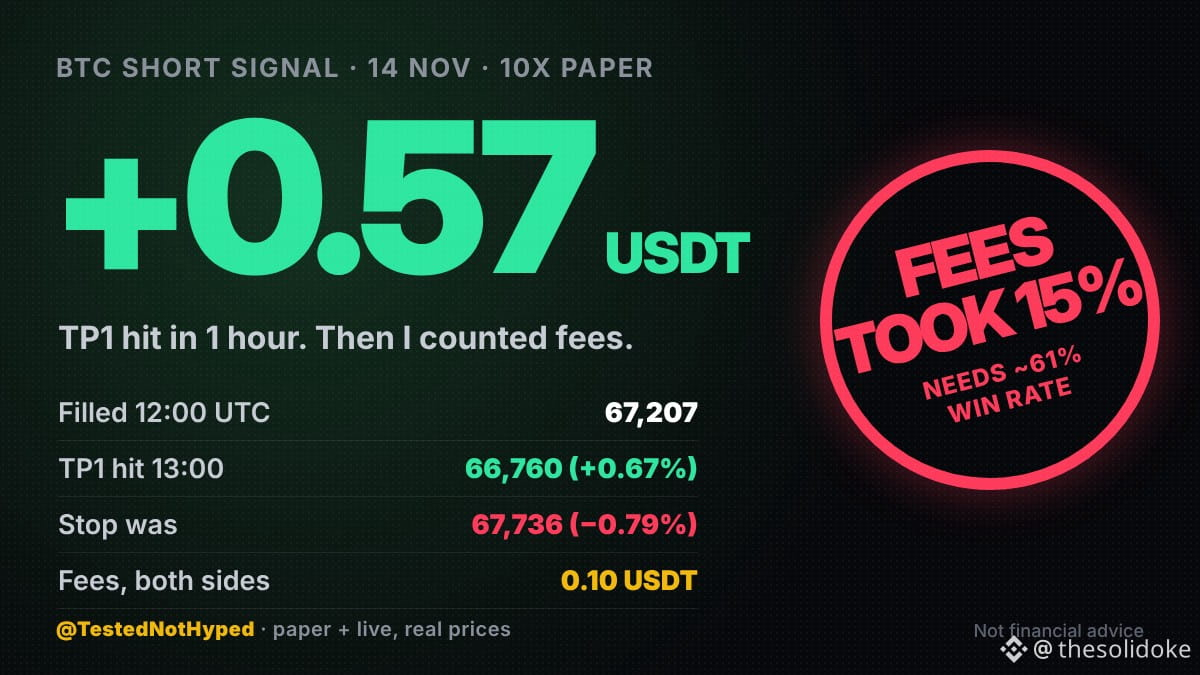
Paper test of a BTC short signal from Square: +0.57 USDT on 10 USDT margin. TP1 hit one hour after the fill. Fees took 15% of it.
The levels as posted (14 Nov, about 11:57 UTC, a 5-minute setup): entry 67,207–67,248, stop 67,736, TP1 66,760. No leverage stated, so I used 10x.
What the real 1h candles did: filled at 67,207 in the 12:00 UTC hour. At 13:00 BTC dropped to 66,543. TP1.
The catch is the size of the move. TP1 was 0.67% away, the stop 0.79%. At 0.05% fee per side, fees ate 0.10 of a 0.67 USDT win, about 15%.
My screen marked it a FAIL: the reward was smaller than the risk. To break even on setups like this you need to win about 54% of the time before fees, about 61% after.
Tight scalps can work. But the smaller the target, the bigger the share fees take, and the higher the win rate you need.
Do you count fees when you judge a scalp signal? 👇
Not financial advice. Paper results, real Binance prices.
#TradingSignals #TradingBots $BTC
Paper test of a BTC short signal from Square: +0.57 USDT on 10 USDT margin. TP1 hit one hour after the fill. Fees took 15% of it.
The levels as posted (14 Nov, about 11:57 UTC, a 5-minute setup): entry 67,207–67,248, stop 67,736, TP1 66,760. No leverage stated, so I used 10x.
What the real 1h candles did: filled at 67,207 in the 12:00 UTC hour. At 13:00 BTC dropped to 66,543. TP1.
The catch is the size of the move. TP1 was 0.67% away, the stop 0.79%. At 0.05% fee per side, fees ate 0.10 of a 0.67 USDT win, about 15%.
My screen marked it a FAIL: the reward was smaller than the risk. To break even on setups like this you need to win about 54% of the time before fees, about 61% after.
Tight scalps can work. But the smaller the target, the bigger the share fees take, and the higher the win rate you need.
Do you count fees when you judge a scalp signal? 👇
Not financial advice. Paper results, real Binance prices.
#TradingSignals #TradingBots $BTC
The levels as posted (14 Nov, about 11:57 UTC, a 5-minute setup): entry 67,207–67,248, stop 67,736, TP1 66,760. No leverage stated, so I used 10x.
What the real 1h candles did: filled at 67,207 in the 12:00 UTC hour. At 13:00 BTC dropped to 66,543. TP1.
The catch is the size of the move. TP1 was 0.67% away, the stop 0.79%. At 0.05% fee per side, fees ate 0.10 of a 0.67 USDT win, about 15%.
My screen marked it a FAIL: the reward was smaller than the risk. To break even on setups like this you need to win about 54% of the time before fees, about 61% after.
Tight scalps can work. But the smaller the target, the bigger the share fees take, and the higher the win rate you need.
Do you count fees when you judge a scalp signal? 👇
Not financial advice. Paper results, real Binance prices.
#TradingSignals #TradingBots $BTC
155
·
--
See translation
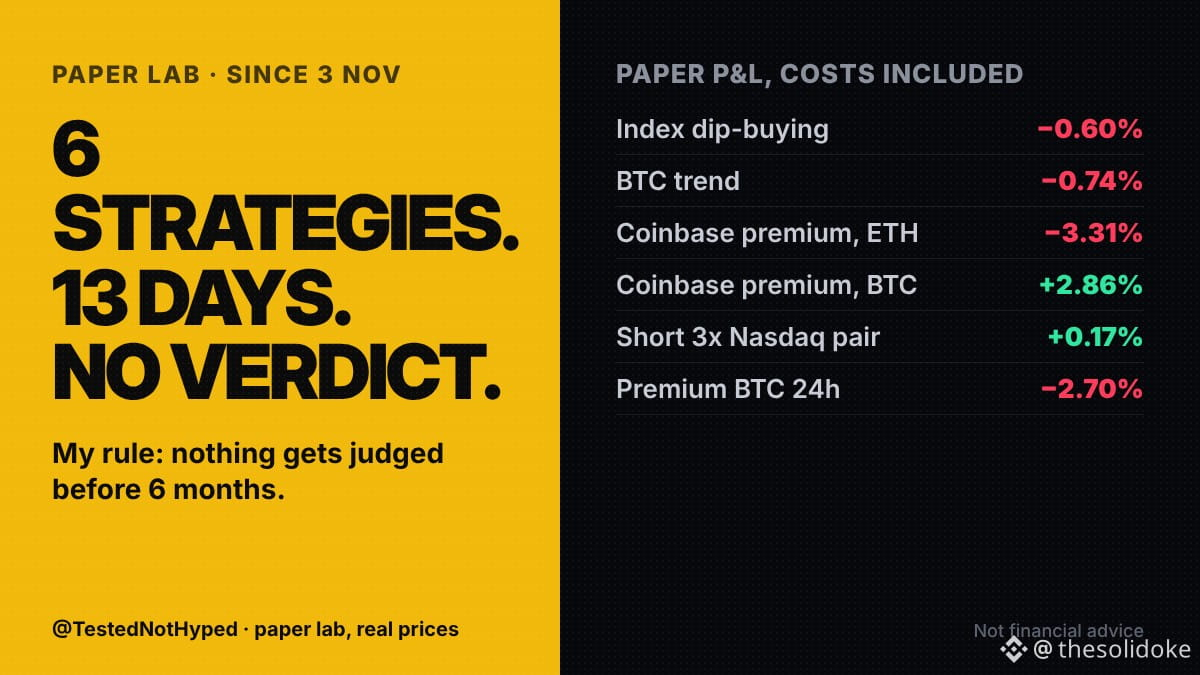
6 paper strategies, about 2 weeks, results between −3.31% and +2.86%. Not one verdict yet.
Since 3–4 Nov I've been running six ideas on paper, costs included:
• buying dips in US indices when fear is high: −0.60%
• a simple BTC trend rule: −0.74%
• trading the Coinbase premium on ETH: −3.31%
• the same idea on BTC: +2.86%
• shorting both 3x Nasdaq ETFs at once (they decay in choppy markets): +0.17%
• a 24h version of the Coinbase premium on BTC: −2.70%
Each one looked good in a backtest before I started. Two weeks in, none of them clearly works or clearly fails.
That's normal. Some have traded only once or twice. The ETH one has the most trades (6), and it's the worst so far.
My rule: no verdict on any paper strategy before 6 months. They all keep running unchanged until May 2027, and I post the numbers either way.
How long do you give a strategy before you decide? 👇
Not financial advice. Paper results, real prices, costs included.
#TradingBots #algoTrading #bitcoin $BTC
6 paper strategies, about 2 weeks, results between −3.31% and +2.86%. Not one verdict yet.
Since 3–4 Nov I've been running six ideas on paper, costs included:
• buying dips in US indices when fear is high: −0.60%
• a simple BTC trend rule: −0.74%
• trading the Coinbase premium on ETH: −3.31%
• the same idea on BTC: +2.86%
• shorting both 3x Nasdaq ETFs at once (they decay in choppy markets): +0.17%
• a 24h version of the Coinbase premium on BTC: −2.70%
Each one looked good in a backtest before I started. Two weeks in, none of them clearly works or clearly fails.
That's normal. Some have traded only once or twice. The ETH one has the most trades (6), and it's the worst so far.
My rule: no verdict on any paper strategy before 6 months. They all keep running unchanged until May 2027, and I post the numbers either way.
How long do you give a strategy before you decide? 👇
Not financial advice. Paper results, real prices, costs included.
#TradingBots #algoTrading #bitcoin $BTC
Since 3–4 Nov I've been running six ideas on paper, costs included:
• buying dips in US indices when fear is high: −0.60%
• a simple BTC trend rule: −0.74%
• trading the Coinbase premium on ETH: −3.31%
• the same idea on BTC: +2.86%
• shorting both 3x Nasdaq ETFs at once (they decay in choppy markets): +0.17%
• a 24h version of the Coinbase premium on BTC: −2.70%
Each one looked good in a backtest before I started. Two weeks in, none of them clearly works or clearly fails.
That's normal. Some have traded only once or twice. The ETH one has the most trades (6), and it's the worst so far.
My rule: no verdict on any paper strategy before 6 months. They all keep running unchanged until May 2027, and I post the numbers either way.
How long do you give a strategy before you decide? 👇
Not financial advice. Paper results, real prices, costs included.
#TradingBots #algoTrading #bitcoin $BTC
187
·
--
See translation
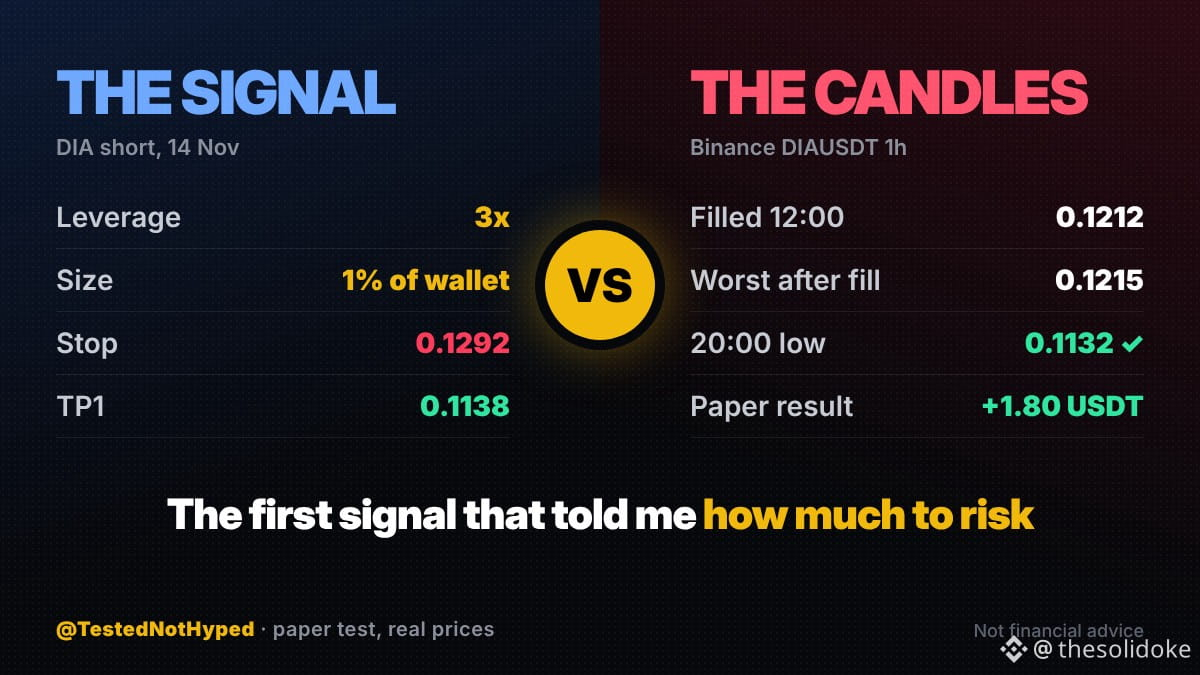
Paper test of a DIA short signal from Square: +1.80 USDT on 10 USDT margin. TP1 hit 8 hours after the fill.
What made this one different: it said how much to risk. 3x leverage, 1% of the wallet. Most callers in my test leave that out, so I default to 10x.
The levels as posted (14 Nov, about 11:41 UTC): entry 0.1200–0.1220, stop 0.1292, TP1 0.1138.
What the real 1h candles did: filled at 0.1212 in the 12:00 UTC hour. The worst price after that was 0.1215, nowhere near the stop. At 20:00 it fell to 0.1132. TP1.
My screen still marked it a FAIL: from the fill, TP1 was about 6.1% away and the stop about 6.6%, so the reward was a bit smaller than the risk. It won anyway, and at 3x the stop sat far from liquidation.
Wins and losses come and go. Sizing is the part a follower controls. At 1% of the wallet and 3x, hitting the stop would have cost about 0.2% of the account.
Should every signal say how much of the account to put on it? 👇
Not financial advice. Paper results, real Binance prices.
#TradingSignals #FuturesTrading #TradingBots $DIA $BTC
Paper test of a DIA short signal from Square: +1.80 USDT on 10 USDT margin. TP1 hit 8 hours after the fill.
What made this one different: it said how much to risk. 3x leverage, 1% of the wallet. Most callers in my test leave that out, so I default to 10x.
The levels as posted (14 Nov, about 11:41 UTC): entry 0.1200–0.1220, stop 0.1292, TP1 0.1138.
What the real 1h candles did: filled at 0.1212 in the 12:00 UTC hour. The worst price after that was 0.1215, nowhere near the stop. At 20:00 it fell to 0.1132. TP1.
My screen still marked it a FAIL: from the fill, TP1 was about 6.1% away and the stop about 6.6%, so the reward was a bit smaller than the risk. It won anyway, and at 3x the stop sat far from liquidation.
Wins and losses come and go. Sizing is the part a follower controls. At 1% of the wallet and 3x, hitting the stop would have cost about 0.2% of the account.
Should every signal say how much of the account to put on it? 👇
Not financial advice. Paper results, real Binance prices.
#TradingSignals #FuturesTrading #TradingBots $DIA $BTC
What made this one different: it said how much to risk. 3x leverage, 1% of the wallet. Most callers in my test leave that out, so I default to 10x.
The levels as posted (14 Nov, about 11:41 UTC): entry 0.1200–0.1220, stop 0.1292, TP1 0.1138.
What the real 1h candles did: filled at 0.1212 in the 12:00 UTC hour. The worst price after that was 0.1215, nowhere near the stop. At 20:00 it fell to 0.1132. TP1.
My screen still marked it a FAIL: from the fill, TP1 was about 6.1% away and the stop about 6.6%, so the reward was a bit smaller than the risk. It won anyway, and at 3x the stop sat far from liquidation.
Wins and losses come and go. Sizing is the part a follower controls. At 1% of the wallet and 3x, hitting the stop would have cost about 0.2% of the account.
Should every signal say how much of the account to put on it? 👇
Not financial advice. Paper results, real Binance prices.
#TradingSignals #FuturesTrading #TradingBots $DIA $BTC
2
214
·
--
See translation
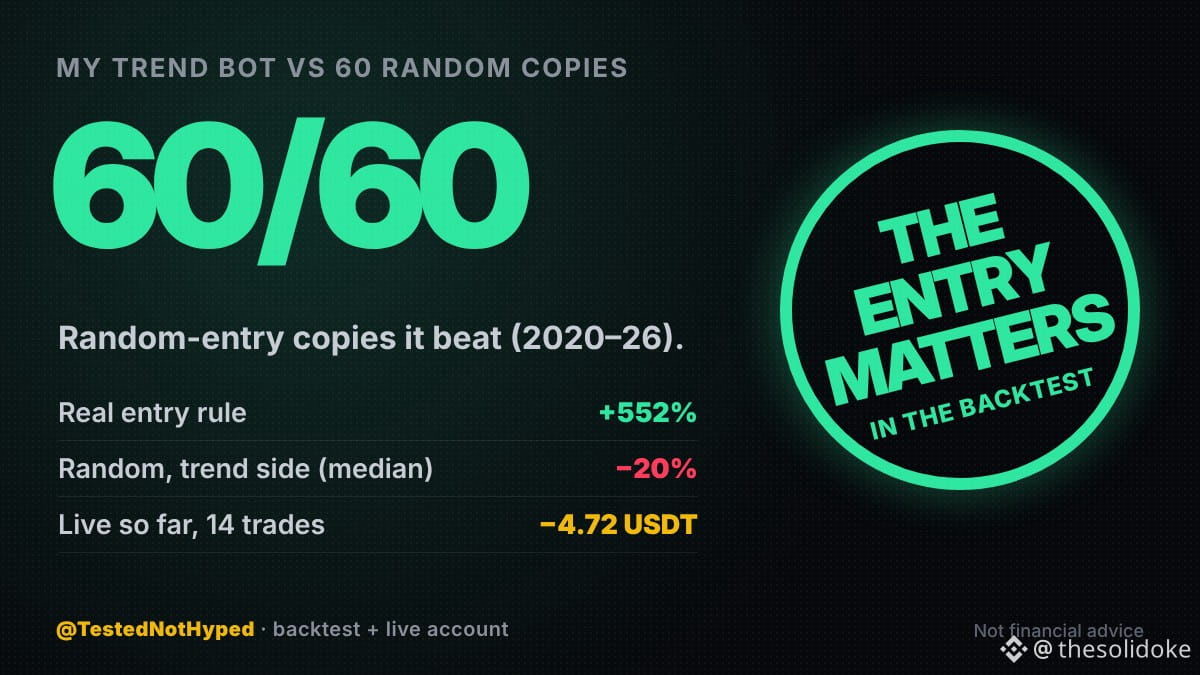
My trend bot is −4.72 USDT after 14 live trades. Broken, or just early? Here's the test I use to tell.
Take the bot's exact exits and position sizing. Replace only the entry with random dates, at the same rate the real bot trades. Run it 60 times on 2020–2026 data.
Results:
• random entries on the trend side: median −20%, 50 of 60 hit my −40% kill switch
• random entries in any direction: median −32%, 59 of 60 killed
• the real entry rule: +552%
It beat all 60. So the edge sits in the entry signal, not in the exits or the sizing.
What it doesn't prove: that the next 14 trades make money. My one-year simulation of this bot at 1.5% risk has a median of +35%, and about 1 year in 8 still ends in a loss.
So −4.72 after 14 trades is inside normal. The bot stays on, unchanged, and every Sunday I check each live trade against the backtest.
Have you ever tested your strategy against random entries? 👇
Not financial advice. Backtest plus real account.
#TradingBots #algoTrading #bitcoin $BTC
My trend bot is −4.72 USDT after 14 live trades. Broken, or just early? Here's the test I use to tell.
Take the bot's exact exits and position sizing. Replace only the entry with random dates, at the same rate the real bot trades. Run it 60 times on 2020–2026 data.
Results:
• random entries on the trend side: median −20%, 50 of 60 hit my −40% kill switch
• random entries in any direction: median −32%, 59 of 60 killed
• the real entry rule: +552%
It beat all 60. So the edge sits in the entry signal, not in the exits or the sizing.
What it doesn't prove: that the next 14 trades make money. My one-year simulation of this bot at 1.5% risk has a median of +35%, and about 1 year in 8 still ends in a loss.
So −4.72 after 14 trades is inside normal. The bot stays on, unchanged, and every Sunday I check each live trade against the backtest.
Have you ever tested your strategy against random entries? 👇
Not financial advice. Backtest plus real account.
#TradingBots #algoTrading #bitcoin $BTC
Take the bot's exact exits and position sizing. Replace only the entry with random dates, at the same rate the real bot trades. Run it 60 times on 2020–2026 data.
Results:
• random entries on the trend side: median −20%, 50 of 60 hit my −40% kill switch
• random entries in any direction: median −32%, 59 of 60 killed
• the real entry rule: +552%
It beat all 60. So the edge sits in the entry signal, not in the exits or the sizing.
What it doesn't prove: that the next 14 trades make money. My one-year simulation of this bot at 1.5% risk has a median of +35%, and about 1 year in 8 still ends in a loss.
So −4.72 after 14 trades is inside normal. The bot stays on, unchanged, and every Sunday I check each live trade against the backtest.
Have you ever tested your strategy against random entries? 👇
Not financial advice. Backtest plus real account.
#TradingBots #algoTrading #bitcoin $BTC
72
·
--
See translation
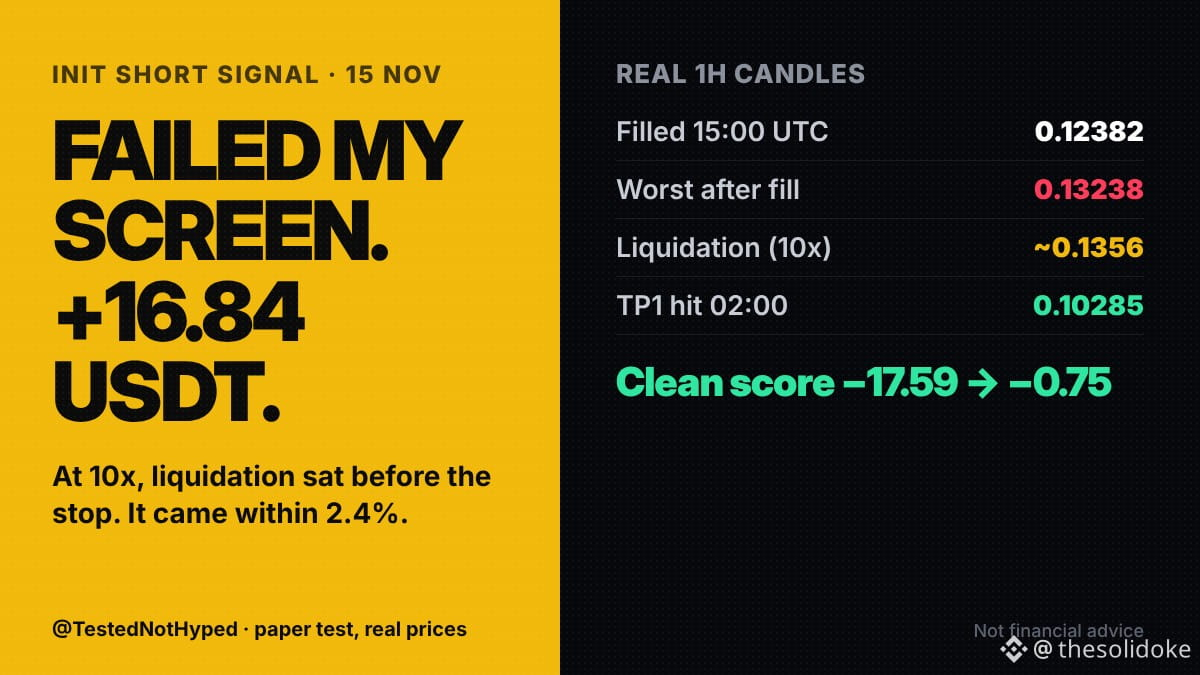
Paper test of an INIT short signal from Square: +16.84 USDT on 10 USDT margin. My biggest paper win so far, from a signal my "makes sense" screen failed.
The levels as posted (15 Nov, about 14:01 UTC): entry 0.12382–0.13185, stop 0.14048, TP1 0.10285. No leverage stated, so I used 10x. I added it to my tracker before the result.
Why it failed my screen: at 10x the position liquidates about 9.5% against the entry, near 0.1356. The posted stop, 0.14048, sat beyond that. The stop could never fire first.
What the real 1h candles did: filled at 0.12382 in the 15:00 UTC hour. That same hour INIT spiked to 0.13238, about 2.4% from liquidation. Then it fell. At 02:00 it hit 0.10285. TP1.
One trade moved my clean score from −17.59 to −0.75 USDT (10 closed, 4 wins). That's exactly why I don't judge anything on a handful of trades. A 2.4% bigger spike and this post would read about −10.
Would you take a trade where liquidation comes before the stop? 👇
Not financial advice. Paper results, real Binance prices.
#TradingSignals #FuturesTrading #TradingBots $INIT $BTC
Paper test of an INIT short signal from Square: +16.84 USDT on 10 USDT margin. My biggest paper win so far, from a signal my "makes sense" screen failed.
The levels as posted (15 Nov, about 14:01 UTC): entry 0.12382–0.13185, stop 0.14048, TP1 0.10285. No leverage stated, so I used 10x. I added it to my tracker before the result.
Why it failed my screen: at 10x the position liquidates about 9.5% against the entry, near 0.1356. The posted stop, 0.14048, sat beyond that. The stop could never fire first.
What the real 1h candles did: filled at 0.12382 in the 15:00 UTC hour. That same hour INIT spiked to 0.13238, about 2.4% from liquidation. Then it fell. At 02:00 it hit 0.10285. TP1.
One trade moved my clean score from −17.59 to −0.75 USDT (10 closed, 4 wins). That's exactly why I don't judge anything on a handful of trades. A 2.4% bigger spike and this post would read about −10.
Would you take a trade where liquidation comes before the stop? 👇
Not financial advice. Paper results, real Binance prices.
#TradingSignals #FuturesTrading #TradingBots $INIT $BTC
The levels as posted (15 Nov, about 14:01 UTC): entry 0.12382–0.13185, stop 0.14048, TP1 0.10285. No leverage stated, so I used 10x. I added it to my tracker before the result.
Why it failed my screen: at 10x the position liquidates about 9.5% against the entry, near 0.1356. The posted stop, 0.14048, sat beyond that. The stop could never fire first.
What the real 1h candles did: filled at 0.12382 in the 15:00 UTC hour. That same hour INIT spiked to 0.13238, about 2.4% from liquidation. Then it fell. At 02:00 it hit 0.10285. TP1.
One trade moved my clean score from −17.59 to −0.75 USDT (10 closed, 4 wins). That's exactly why I don't judge anything on a handful of trades. A 2.4% bigger spike and this post would read about −10.
Would you take a trade where liquidation comes before the stop? 👇
Not financial advice. Paper results, real Binance prices.
#TradingSignals #FuturesTrading #TradingBots $INIT $BTC
3
2
1.1k
·
--
See translation
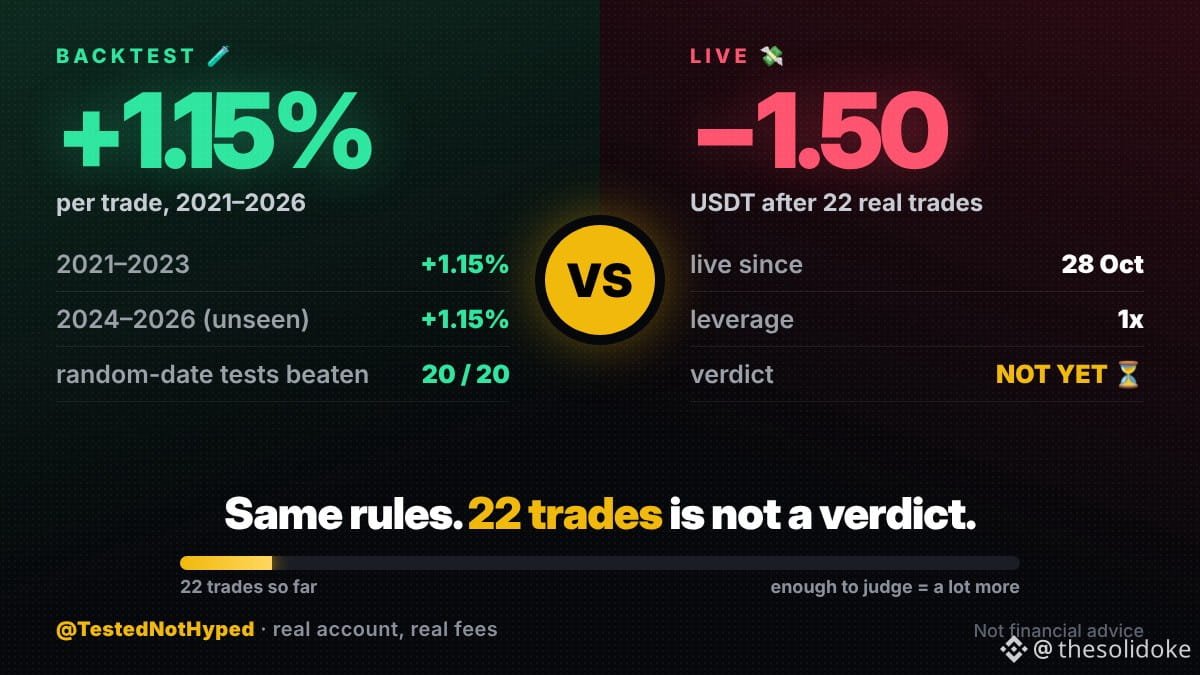
My flush bot has made 22 live trades since 28 Oct. Total: −1.50 USDT. Its backtest says +1.15% per trade.
What it does: when SOL, XRP, LINK, DOGE, BNB or ADA drops more than 5% in 24 hours AND open interest drops more than 8%, it buys. 24 hours later it sells. No leverage. The idea: forced sellers get flushed out, and price tends to bounce.
The backtest: +1.15% per trade on 2021–2023, and the same +1.15% on 2024–2026, data it never saw while I built it. It also beat 20 out of 20 tests on random dates.
Live it's slightly red. Same rules, real fees.
Is the bot broken? 22 trades can't tell me. A strategy that makes about 1% a trade on average still has plenty of losing trades, and a few bad bounces in a falling market decide a small sample.
So it keeps running, small, unchanged. I'll judge it on the full live record, not on the first 22.
How many live trades before you'd trust a backtest, or kill it? 👇
Not financial advice. Real account, real fees.
#TradingBots #algoTrading #bitcoin $BTC .
My flush bot has made 22 live trades since 28 Oct. Total: −1.50 USDT. Its backtest says +1.15% per trade.
What it does: when SOL, XRP, LINK, DOGE, BNB or ADA drops more than 5% in 24 hours AND open interest drops more than 8%, it buys. 24 hours later it sells. No leverage. The idea: forced sellers get flushed out, and price tends to bounce.
The backtest: +1.15% per trade on 2021–2023, and the same +1.15% on 2024–2026, data it never saw while I built it. It also beat 20 out of 20 tests on random dates.
Live it's slightly red. Same rules, real fees.
Is the bot broken? 22 trades can't tell me. A strategy that makes about 1% a trade on average still has plenty of losing trades, and a few bad bounces in a falling market decide a small sample.
So it keeps running, small, unchanged. I'll judge it on the full live record, not on the first 22.
How many live trades before you'd trust a backtest, or kill it? 👇
Not financial advice. Real account, real fees.
#TradingBots #algoTrading #bitcoin $BTC .
What it does: when SOL, XRP, LINK, DOGE, BNB or ADA drops more than 5% in 24 hours AND open interest drops more than 8%, it buys. 24 hours later it sells. No leverage. The idea: forced sellers get flushed out, and price tends to bounce.
The backtest: +1.15% per trade on 2021–2023, and the same +1.15% on 2024–2026, data it never saw while I built it. It also beat 20 out of 20 tests on random dates.
Live it's slightly red. Same rules, real fees.
Is the bot broken? 22 trades can't tell me. A strategy that makes about 1% a trade on average still has plenty of losing trades, and a few bad bounces in a falling market decide a small sample.
So it keeps running, small, unchanged. I'll judge it on the full live record, not on the first 22.
How many live trades before you'd trust a backtest, or kill it? 👇
Not financial advice. Real account, real fees.
#TradingBots #algoTrading #bitcoin $BTC .
156
Log in to explore more content
Join global crypto users on Binance Square
⚡️ Get latest and useful information about crypto.
💬 Trusted by the world’s largest crypto exchange.
👍 Discover real insights from verified creators.
Email / Phone number
Trending Topics
BTCRemainsUnderPressureAfterHawkishFOMCMinutes
14,561 views
224 Discussing
FOMC Minutes | Fed Minutes Show Almost All Officials Expect More Rate Hikes, With Some Open to a Larger December Move
Binance News
·32 Likes
·48.5k views
AnthropicToDebutAfter$83IPOPricing
5,169 views
26 Discussing
NvidiaBoardReportedlySplitOverHuang’sReturn
219 views
26 Discussing